| | |
| UNITED STATES
SECURITIES AND EXCHANGE COMMISSION |
| | |
| CERTIFIED SHAREHOLDER REPORT OF REGISTERED
MANAGEMENT INVESTMENT COMPANIES
|
| | |
| Investment Company Act file number: | (811-03061) |
| | |
| Exact name of registrant as specified in charter: | Putnam Global Natural Resources Fund |
| | |
| Address of principal executive offices: | One Post Office Square, Boston, Massachusetts 02109 |
| | |
| Name and address of agent for service: | Robert T. Burns, Vice President
One Post Office Square
Boston, Massachusetts 02109 |
| | |
| Copy to: | John W. Gerstmayr, Esq.
Ropes & Gray LLP
800 Boylston Street
Boston, Massachusetts 02199-3600 |
| | |
| Registrant’s telephone number, including area code: | (617) 292-1000 |
| | |
| Date of fiscal year end: | August 31, 2012 |
| | |
| Date of reporting period: | September 1, 2011 — August 31, 2012 |
| | |
|
Item 1. Report to Stockholders: | |
| | |
| The following is a copy of the report transmitted to stockholders pursuant to Rule 30e-1 under the Investment Company Act of 1940: | |
Putnam
Global Natural
Resources Fund
Annual report
8 | 31 | 12
| | | |
| Message from the Trustees | 1 | | |
| | |
| About the fund | 2 | | |
| | |
| Performance snapshot | 4 | | |
| | |
| Interview with your fund’s portfolio managers | 5 | | |
| | |
| Your fund’s performance | 11 | | |
| | |
| Your fund’s expenses | 14 | | |
| | |
| Terms and definitions | 16 | | |
| | |
| Other information for shareholders | 17 | | |
| | |
| Trustee approval of management contract | 18 | | |
| | |
| Financial statements | 23 | | |
| | |
| Federal tax information | 46 | | |
| | |
| About the Trustees | 47 | | |
| | |
| Officers | 49 | | |
| | |
Consider these risks before investing: International investing involves certain risks, such as currency fluctuations, economic instability, and political developments. Additional risks may be associated with emerging-market securities, including illiquidity and volatility. The fund’s policy of concentrating on a limited group of industries and the fund’s non-diversified status, which means the fund may invest in fewer issuers, can increase the fund’s vulnerability to common economic forces and may result in greater losses and volatility. The use of derivatives involves additional risks, such as the potential inability to terminate or sell derivatives positions and the potential failure of the other party to the instrument to meet its obligations. Growth stocks may be more susceptible to earnings disappointments, and value stocks may fail to rebound. These risks are generally greater for small and midsize companies. The use of short selling may result in losses if the securities appreciate in value. The prices of stocks in the fund’s portfolio may fall or fail to rise over extended periods of time for a variety of reasons, including both general financial market conditions and factors related to a specific issuer or industry.
Message from the Trustees
Dear Fellow Shareholder:
Markets worldwide have exhibited resiliency in recent months, despite the challenges of a global economic slowdown and tepid growth here in the United States. Since early summer, stock and bond investors have increasingly moved into riskier assets. Still, the market rebound has been punctuated by periods of volatility.
Persistently high U.S. unemployment, Europe’s tenacious credit troubles, and a manufacturing slowdown in China all have created a climate of uncertainty — an environment that, we believe, will remain for some time. The hope is that, after election day, Washington lawmakers will act swiftly to resolve pressing challenges, such as the impending “fiscal cliff” set to occur on January 1, 2013, that will trigger automatic tax increases and government spending cuts.
A long-term view and balanced investment approach become ever more important in this type of market environment, as does reliance on a financial advisor, who can help you navigate your way toward your financial goals.
We would like to take this opportunity to announce the arrival of two new Trustees, Liaquat Ahamed and Katinka Domotorffy, CFA, to your fund’s Board of Trustees. Mr. Ahamed, who in 2010 won the Pulitzer Prize for History with his book, Lords of Finance: The Bankers Who Broke the World, also serves on the Board of Aspen Insurance and the Board of the Rohatyn Group, an emerging-market fund complex that manages money for institutional investors. Ms. Domotorffy, who until year-end 2011 was a Partner, Chief Investment Officer, and Global Head of Quantitative Investment Strategies at Goldman Sachs Asset Management, currently serves as a member of the Anne Ray Charitable Trust’s Investment Committee, Margaret A. Cargill Philanthropies, and director for Reach Out and Read of Greater New York, an organization dedicated to promoting early childhood literacy.
We would also like to extend a welcome to new shareholders of the fund and to thank all of our investors for your continued confidence in Putnam.

About the fund
Investing in the natural resources sector for over 30 years
From the oil crisis of the 1970s to the more recent commodities boom, the balance of geopolitical stability, technological development, and economic growth has shaped natural resources markets.
For more than 30 years, Putnam Global Natural Resources Fund has sought to capitalize on that ever-changing balance by investing in stocks of companies that can profit from the global demand for natural resources.
The fund’s diversification sets it apart in two respects: First, its view of natural resources industries includes energy, metals and mining, paper, chemical, and natural resource equipment and infrastructure companies; and second, it has a global scope. Stock prices in the natural resources sector rise and fall with supply and demand imbalances, so this strategy helps offset that volatility while enabling the fund’s managers to pursue a wider field of opportunities.
From chemicals, construction, and railroads to forest products and packaging, the portfolio managers consider stocks in a wide array of areas, with support from a team of analysts. Among the promising stocks the managers have targeted recently are those of fertilizer, seed, and agrochemical companies. These companies may offer strong growth potential as world population has increased, wealth has grown in emerging markets, and demand for high-protein food has risen along with a greater need for fertilizer that can make land and crops more productive.
Another benefit for investors is the fund’s flexible strategy, which allows the fund to own growth- or value-style stocks, as it seeks to deliver competitive returns no matter which style is in favor.
Sector investing at Putnam
In recent decades, innovation and business growth have propelled stocks in different industries to market-leading performance. Finding these stocks, many of which are in international markets, requires rigorous research and in-depth knowledge of global markets.
Putnam’s sector funds invest in nine sectors worldwide and offer active management, risk controls, and the expertise of dedicated sector analysts. The funds’ managers invest with flexibility and precision, using fundamental research to hand select stocks for the portfolios.
All sectors in one fund:
Putnam Global Sector Fund
A portfolio of individual Putnam Global Sector Funds that provides exposure to all sectors of the MSCI World Index.
Individual sector funds:
Global Consumer Fund
Retail, hotels, restaurants, media, food and beverages
Global Energy Fund
Oil and gas, energy equipment and services
Global Financials Fund
Commercial banks, insurance, diversified financial services, mortgage finance
Global Health Care Fund
Pharmaceuticals, biotechnology, health-care services
Global Industrials Fund
Airlines, railroads, trucking, aerospace and defense, construction, commercial services
Global Natural Resources Fund
Metals, chemicals, oil and gas, forest products
Global Technology Fund
Software, computers, Internet services
Global Telecommunications Fund
Diversified and wireless telecommunications services
Global Utilities Fund
Electric, gas, and water utilities
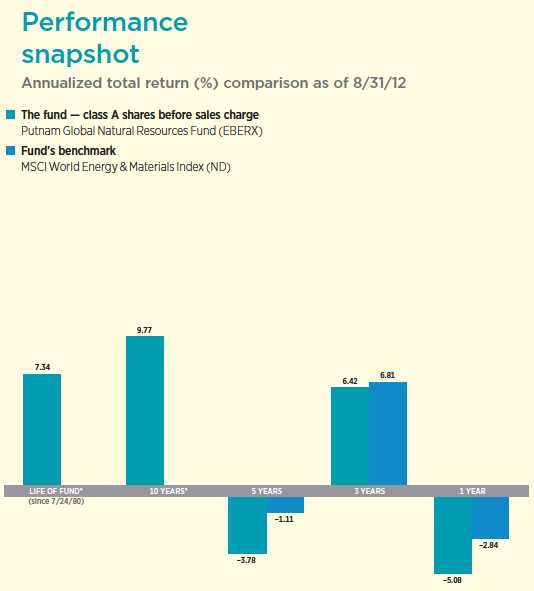
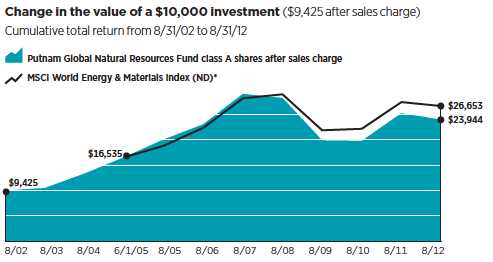
Current performance may be lower or higher than the quoted past performance, which cannot guarantee future results. Share price, principal value, and return will fluctuate, and you may have a gain or a loss when you sell your shares. Performance of class A shares assumes reinvestment of distributions and does not account for taxes. Fund returns in the bar chart do not reflect a sales charge of 5.75%; had they, returns would have been lower. See pages 5 and 11–13 for additional performance information. For a portion of the periods, the fund had expense limitations, without which returns would have been lower. A short-term trading fee of 1% may apply to redemptions or exchanges from certain funds within the time period specified in the fund’s prospectus. To obtain the most recent month-end performance, visit putnam.com.
* The fund’s benchmark, the MSCI World Energy & Materials Index (ND), was introduced on 6/1/05, which post-dates the inception of the fund’s class A shares.
4
Interview with your fund’s portfolio managers

The past 12 months were marked by volatility and global economic uncertainty. How did Putnam Global Natural Resources Fund perform in this environment?
Chris: In what was a challenging environment for the natural resources sector, the fund underperformed its benchmark for the period. We underestimated the impact of the global economic slowdown, particularly within metals and mining stocks. The combination of the European sovereign debt crisis and the slowdown in emerging-market economies, particularly China, led to serious concerns regarding future earnings and cash flows. China’s economic deceleration, in particular, was much more pronounced than originally anticipated. Performance also was held back by stocks leveraged to the weaker natural gas industry.
Did you make any strategic shifts in the portfolio as a result of these macroeconomic developments?
Chris: After I joined the fund in early April of this year, we adjusted the portfolio to a more defensive positioning. Specifically, the portfolio became underweight in metals and mining, and slightly overweight in chemicals and agriculture. Within metals and mining, the slackening demand from China, particularly for metallurgical coal used in the production of steel, negatively affected
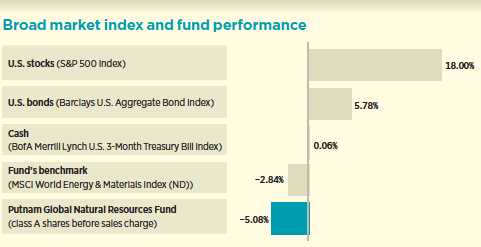
This comparison shows your fund’s performance in the context of broad market indexes for the 12 months ended 8/31/12. See pages 4 and 11–13 for additional fund performance information. Index descriptions can be found on page 16.
5
the fund’s performance. The incremental demand growth globally is still largely driven by China, and it increasingly appears that the broad-based secular tailwind for the metals and mining space is over for now. More than ever, we are now seeking stock-specific stories that exhibit non-macro-specific catalysts — pricing power, industry-structure change, or balance sheet improvements.
What was performance like on the energy side of the portfolio?
Steve: The period was marked by significant volatility. Just consider the extreme changes in Brent crude oil prices: On the period’s first day, crude traded at $114.29 per barrel. During the period, the price rose to above $126, and then fell below $90 per barrel. On the period’s final day, the per-barrel price had risen to $114.57.
In our opinion, this volatility was driven by two primary forces: the eurozone’s sovereign debt crisis and concerns about potential supply disruptions in the Middle East, particularly the Iranian oil embargo in the early part of 2012. North American natural gas prices also continued to suffer because of oversupply, but they were helped somewhat by more power plants using gas to generate electricity as opposed to oil during this past summer.
Which holdings helped performance?
Chris: An overweight position in LyondellBasell, a Dutch multinational company and the world’s third-largest independent chemical company, helped. LyondellBasell benefited from a decline in U.S. natural gas and ethane prices during the period. The company uses ethane [a natural gas liquid] as a feedstock to produce petrochemicals, namely ethylene, which is the basic building block for the entire petrochemical chain, from plastic bottles to trash bags to shrinkwrap. LyondellBasell has the flexibility to use either crude oil or natural gas as the feedstock for ethylene production. The company benefited when crude oil prices increased during the period as it was able to switch to natural gas as a feedstock.
Country allocations are shown as a percentage of the fund’s net assets. Summary information may differ from the portfolio schedule included in the financial statements due to the inclusion of derivative securities and the exclusion of as-of trades, if any. Weightings will vary over time.
6
LyondellBasell’s cost advantage relative to global competitors has continued to widen, and it manages its assets well and generates a great deal of cash. In the fall of 2011, the company’s stock sold off on macroeconomic concerns and then rebounded as macroeconomic conditions improved, especially in the United States, which accounts for about 40% of the company’s business. LyondellBasell has a good combination of the types of stories we look for: value creation through balance sheet actions coupled with a fundamental change in industry structure that benefits the company.
Another contributor was Lanxess AG, an overweight position for the fund. Based in Germany, Lanxess is a maker of synthetic rubber. The company benefited from increased demand, driven by more stringent safety and fuel efficiency standards, for synthetic rubber automotive tires. The company is also well-managed and enjoys pricing power as a result of changes in industry structure [more ethane-based cracking capacity relative to naptha-based cracking capacity]. The stock appreciated during the period as a result.
Steve: On the energy side, the biggest contributor to the fund’s relative performance came from Cobalt International Energy, an out-of-benchmark position. Cobalt is a U.S.-based exploration and production company with recently discovered deepwater assets off the west coast of Africa and in the Gulf of Mexico. The stock is a good example of a principal theme in the energy portion of the portfolio: investing in companies that can create value by adding resources to their asset base. In Cobalt’s case, while the company does not have any current oil or gas production, we
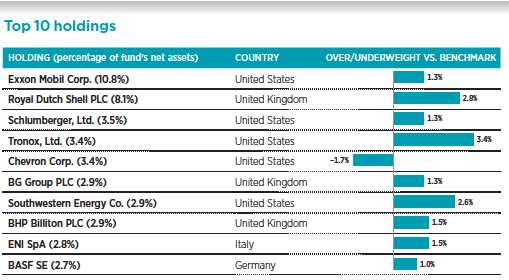
This table shows the fund’s top 10 holdings by percentage of the fund’s net assets as of 8/31/12. Short-term holdings are excluded. Holdings will vary over time.
7
bought a position based on our belief that even if the company experienced industry-wide average drilling success rates, it would create significant value, and that there was an upside to the stock. That thesis was rewarded late last year when Cobalt made a major oil discovery off the coast of Angola.
An overweight position in Tullow Oil also helped fund performance. Based in the United Kingdom, Tullow is an oil exploration and production company with major development programs offshore of Angola and onshore in Uganda. Early in the period, Tullow made a potentially major oil discovery in the Caribbean Sea off the coast of French Guyana. In addition, we believe a major hurdle to the company’s exploration program in Uganda was removed in January when final government approval for the program was granted, serving as a further catalyst in the stock’s advance.
What holdings detracted from performance during the period?
Chris: Tronox, an out-of-benchmark holding, was the top detractor. The company is a maker of a titanium ore derivative, known as TI02, which is used as a building block for paints and other coatings. In the final three months of the period, the titanium ore industry underwent a significant inventory correction. Fundamentally, we still have a strong conviction in Tronox. We believe the company will benefit from their vertically integrated position in both “upstream” and “downstream” areas of the industry — that is, not only does Tronox mine the titanium ore, but it also manufactures the finished product, TI02. In our view, competitors in this space lack the ability to capture margin throughout the value chain. We also believe the cash flow profile, in light of an already healthy balance sheet, provides value-creation opportunities for shareholders.
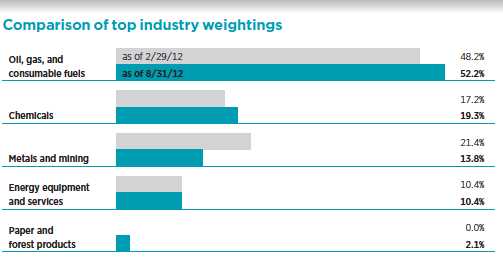
This chart shows how the fund’s top weightings have changed over the past six months. Weightings are shown as a percentage of net assets. Current period summary information may differ from the portfolio schedule included in the financial statements due to the inclusion of derivative securities, the exclusion of as-of trades, if any, and the use of different classifications of securities for presentation purposes. Holdings will vary over time.
8
An overweight position in Rio Tinto, the U.K.-based global mining company, also significantly detracted. Rio Tinto’s stock was hurt by the economic slowdown in China, which depressed iron ore prices dramatically worldwide.
Steve: Not holding a position in BP, the U.K.-based oil and gas company, was a significant detractor on the energy side. Our lack of conviction in BP caused us to miss the upside progress that this large benchmark component made during the period, exceeding analysts’ earnings estimates and increasing its quarterly dividend. The stock also performed well as some of the legal issues that surrounded the tragic April 2010 accident in the Gulf of Mexico were resolved.
An overweight position in Newfield Exploration disappointed. We believed Newfield could benefit from the addition of new resources. The company had put together a sizable position in Utah’s Uinta Basin, and we acquired the stock thinking that it was not widely appreciated by the market and that its wells there would beat production expectations. That thesis was off the mark. The company had to revise its production guidance, the stock price was negatively affected, and we no longer hold it in the portfolio.
How did the fund use derivatives during the period?
Chris: We used currency forward contracts to hedge portions of the portfolio’s foreign currency exposures. Currency forward contracts allow us to pursue strategies that can help protect the fund from adverse movement in exchange rates.
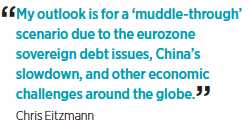
What is your outlook?
Chris: My outlook for the economy is for a “muddle-through” scenario due to the eurozone sovereign debt issues, China’s slowdown, and other economic challenges around the globe. The U.S. economy, however, appears to be improving somewhat. In my opinion, the housing market has bottomed and is rebounding, and will contribute to a tailwind for the U.S. economy. I believe China’s economic activity has been far worse than the reported numbers have revealed. I do believe the Chinese are implementing steps to ensure continued growth, and I would expect Chinese economic activity to improve modestly. Europe, I believe, continues to be challenged and the muddle-through scenario aptly applies there. I don’t see it getting dramatically worse, but I also do not see a quick rebound in economic activity in Europe, either.
Steve: We seem to be right where we were one year ago. The European sovereign debt troubles are weighing on global energy demand as are supply issues linked to the Iranian situation. And oil prices are right in the middle. We still have some significant unresolved issues. As for the fund itself, I hope we can be slightly more aggressive in the way we manage it — looking to shift to a more defensive position when energy prices rise and to become more aggressive when energy prices fall.
Thank you, Chris and Steve, for your time and insights today.
The views expressed in this report are exclusively those of Putnam Management and are subject to change. They are not meant as investment advice.
Please note that the holdings discussed in this report may not have been held by the fund for the entire period. Portfolio composition is subject to review in accordance with the fund’s investment strategy and may vary in the future. Current and future portfolio holdings are subject to risk.
9
Portfolio Manager Steven W. Curbow has an M.B.A. from The University of Chicago Booth School of Business and a B.S. from the University of Southern California. Steven joined Putnam in 2008 and has been in the investment industry since 1996.
Portfolio Manager Christopher J. Eitzmann has an M.B.A. from the Tuck School of Business at Dartmouth College and an A.B. from Harvard University. Christopher joined Putnam in 2012 and has been in the investment industry since 2003.
IN THE NEWS
In a bid to protect Spain and Italy from financial collapse, the European Central Bank (ECB) made a bold move in early September to buy unlimited amounts of short-term bonds from those eurozone countries that need the most assistance. The program is designed to effectively spread the risk for the responsibility of sharing repayment of the nations’ debt. The move is meant to provide countries like Spain and Italy with sufficient time to reduce their debt and restore their economies. Financial markets worldwide reacted positively to the news because it may reduce the likelihood that the 17-nation euro currency union will dismantle, which could have significant economic ramifications.
10
Your fund’s performance
This section shows your fund’s performance, price, and distribution information for periods ended August 31, 2012, the end of its most recent fiscal year. In accordance with regulatory requirements for mutual funds, we also include performance as of the most recent calendar quarter-end and expense information taken from the fund’s current prospectus. Performance should always be considered in light of a fund’s investment strategy. Data represent past performance. Past performance does not guarantee future results. More recent returns may be less or more than those shown. Investment return and principal value will fluctuate, and you may have a gain or a loss when you sell your shares. Performance information does not reflect any deduction for taxes a shareholder may owe on fund distributions or on the redemption of fund shares. For the most recent month-end performance, please visit the Individual Investors section at putnam.com or call Putnam at 1-800-225-1581. Class R and class Y shares are not available to all investors. See the Terms and Definitions section in this report for definitions of the share classes offered by your fund.
Fund performance Total return for periods ended 8/31/12
| | | | | | | | | | |
| | Class A | Class B | Class C | Class M | Class R | Class Y |
| (inception dates) | (7/24/80) | (2/1/94) | (7/26/99) | (7/3/95) | (12/1/03) | (10/4/05) |
|
| | Before | After | | | | | Before | After | Net | Net |
| | sales | sales | Before | After | Before | After | sales | sales | asset | asset |
| | charge | charge | CDSC | CDSC | CDSC | CDSC | charge | charge | value | value |
|
| Annual average | | | | | | | | | | |
| (life of fund) | 7.34% | 7.14% | 6.47% | 6.47% | 6.54% | 6.54% | 6.74% | 6.62% | 7.08% | 7.40% |
|
| 10 years | 154.05 | 139.44 | 135.71 | 135.71 | 135.60 | 135.60 | 141.59 | 133.21 | 148.08 | 158.63 |
| Annual average | 9.77 | 9.12 | 8.95 | 8.95 | 8.95 | 8.95 | 9.22 | 8.84 | 9.51 | 9.97 |
|
| 5 years | –17.54 | –22.29 | –20.59 | –21.63 | –20.62 | –20.62 | –19.57 | –22.38 | –18.52 | –16.48 |
| Annual average | –3.78 | –4.92 | –4.51 | –4.76 | –4.51 | –4.51 | –4.26 | –4.94 | –4.01 | –3.54 |
|
| 3 years | 20.53 | 13.59 | 17.89 | 14.89 | 17.82 | 17.82 | 18.76 | 14.62 | 19.68 | 21.48 |
| Annual average | 6.42 | 4.34 | 5.64 | 4.74 | 5.62 | 5.62 | 5.90 | 4.65 | 6.17 | 6.70 |
|
| 1 year | –5.08 | –10.54 | –5.78 | –10.38 | –5.81 | –6.73 | –5.53 | –8.85 | –5.28 | –4.85 |
|
Current performance may be lower or higher than the quoted past performance, which cannot guarantee future results. After-sales-charge returns for class A and M shares reflect the deduction of the maximum 5.75% and 3.50% sales charge, respectively, levied at the time of purchase. Class B share returns after contingent deferred sales charge (CDSC) reflect the applicable CDSC, which is 5% in the first year, declining over time to 1% in the sixth year, and is eliminated thereafter. Class C share returns after CDSC reflect a 1% CDSC for the first year that is eliminated thereafter. Class R and Y shares have no initial sales charge or CDSC. Performance for class B, C, M, R, and Y shares before their inception is derived from the historical performance of class A shares, adjusted for the applicable sales charge (or CDSC) and the higher operating expenses for such shares, except for class Y shares, for which 12b-1 fees are not applicable.
For a portion of the periods, the fund had expense limitations, without which returns would have been lower.
Class B share performance does not reflect conversion to class A shares.
A short-term trading fee of 1% may apply to redemptions or exchanges from certain funds within the time period specified in the fund’s prospectus.
11
Comparative index returns For periods ended 8/31/12
| |
| | MSCI World Energy & Materials Index (ND) |
|
| Annual average (life of fund) | —* |
|
| 10 years | —* |
| Annual average | —* |
|
| 5 years | –5.42% |
| Annual average | –1.11 |
|
| 3 years | 21.84 |
| Annual average | 6.81 |
|
| 1 year | –2.84 |
|
Index results should be compared with fund performance before sales charge, before CDSC, or at net asset value.
* The fund’s benchmark, the MSCI World Energy & Materials Index (ND), was introduced on 6/1/05, which post-dates the inception of the fund’s class A shares.
* The fund’s benchmark, the MSCI World Energy & Materials Index (ND), was introduced on 6/1/05, which post-dates the inception of the fund’s class A shares.
Past performance does not indicate future results. At the end of the same time period, a $10,000 investment in the fund’s class B and class C shares would have been valued at $23,571 and $23,560, respectively, and no contingent deferred sales charges would apply. A $10,000 investment in the fund’s class M shares ($9,650 after sales charge) would have been valued at $23,321. A $10,000 investment in the fund’s class R and class Y shares would have been valued at $24,808 and $25,863, respectively.
12
Fund price and distribution information For the 12-month period ended 8/31/12
| | | | | | | | |
| Distributions | Class A | Class B | Class C | Class M | Class R | Class Y |
|
| Number | 1 | 1 | 1 | 1 | 1 | 1 |
|
| Income | $0.560 | $0.399 | $0.401 | $0.458 | $0.511 | $0.618 |
|
| Capital gains | — | — | — | — | — | — |
|
| Total | $0.560 | $0.399 | $0.401 | $0.458 | $0.511 | $0.618 |
|
| | Before | After | Net | Net | Before | After | Net | Net |
| | sales | sales | asset | asset | sales | sales | asset | asset |
| Share value | charge | charge | value | value | charge | charge | value | value |
|
| 8/31/11 | $20.81 | $22.08 | $18.58 | $18.98 | $19.77 | $20.49 | $20.41 | $20.96 |
|
| 8/31/12 | 19.18 | 20.35 | 17.10 | 17.47 | 18.21 | 18.87 | 18.81 | 19.31 |
|
The classification of distributions, if any, is an estimate. Before-sales-charge share value and current dividend rate for class A and M shares, if applicable, do not take into account any sales charge levied at the time of purchase. After-sales-charge share value, current dividend rate, and current 30-day SEC yield, if applicable, are calculated assuming that the maximum sales charge (5.75% for class A shares and 3.50% for class M shares) was levied at the time of purchase. Final distribution information will appear on your year-end tax forms.
Fund performance as of most recent calendar quarter
Total return for periods ended 9/30/12
| | | | | | | | | | |
| | Class A | Class B | Class C | Class M | Class R | Class Y |
| (inception dates) | (7/24/80) | (2/1/94) | (7/26/99) | (7/3/95) | (12/1/03) | (10/4/05) |
|
| | Before | After | | | | | Before | After | Net | Net |
| | sales | sales | Before | After | Before | After | sales | sales | asset | asset |
| | charge | charge | CDSC | CDSC | CDSC | CDSC | charge | charge | value | value |
|
| Annual average | | | | | | | | | | |
| (life of fund) | 7.44% | 7.24% | 6.57% | 6.57% | 6.63% | 6.63% | 6.83% | 6.72% | 7.17% | 7.50% |
|
| 10 years | 186.41 | 169.92 | 165.56 | 165.56 | 165.64 | 165.64 | 172.26 | 162.68 | 179.68 | 191.65 |
| Annual average | 11.10 | 10.44 | 10.26 | 10.26 | 10.26 | 10.26 | 10.53 | 10.14 | 10.83 | 11.30 |
|
| 5 years | –21.31 | –25.83 | –24.22 | –25.21 | –24.23 | –24.23 | –23.24 | –25.94 | –22.26 | –20.27 |
| Annual average | –4.68 | –5.80 | –5.40 | –5.64 | –5.40 | –5.40 | –5.15 | –5.83 | –4.91 | –4.43 |
|
| 3 years | 17.04 | 10.29 | 14.39 | 11.39 | 14.39 | 14.39 | 15.34 | 11.31 | 16.18 | 17.97 |
| Annual average | 5.38 | 3.32 | 4.58 | 3.66 | 4.58 | 4.58 | 4.87 | 3.64 | 5.13 | 5.66 |
|
| 1 year | 20.39 | 13.45 | 19.47 | 14.47 | 19.46 | 18.46 | 19.79 | 15.57 | 20.12 | 20.73 |
|
13
Your fund’s expenses
As a mutual fund investor, you pay ongoing expenses, such as management fees, distribution fees (12b-1 fees), and other expenses. Using the following information, you can estimate how these expenses affect your investment and compare them with the expenses of other funds. You may also pay one-time transaction expenses, including sales charges (loads) and redemption fees, which are not shown in this section and would have resulted in higher total expenses. For more information, see your fund’s prospectus or talk to your financial representative.
Expense ratios
| | | | | | |
| | Class A | Class B | Class C | Class M | Class R | Class Y |
|
| Total annual operating expenses for the fiscal year | | | | | | |
| ended 8/31/11 | 1.26% | 2.01% | 2.01% | 1.76% | 1.51% | 1.01% |
|
| Annualized expense ratio for the six-month period | | | | | | |
| ended 8/31/12* | 1.27% | 2.02% | 2.02% | 1.77% | 1.52% | 1.02% |
|
Fiscal-year expense information in this table is taken from the most recent prospectus, is subject to change, and may differ from that shown for the annualized expense ratio and in the financial highlights of this report. Expenses are shown as a percentage of average net assets.
* For the fund’s most recent fiscal half year; may differ from expense ratios based on one-year data in the financial highlights.
Expenses per $1,000
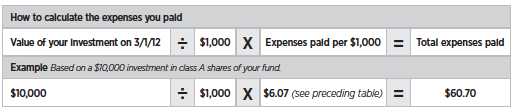
The following table shows the expenses you would have paid on a $1,000 investment in the fund from March 1, 2012, to August 31, 2012. It also shows how much a $1,000 investment would be worth at the close of the period, assuming actual returns and expenses.
| | | | | | |
| | Class A | Class B | Class C | Class M | Class R | Class Y |
|
| Expenses paid per $1,000*† | $6.07 | $9.64 | $9.64 | $8.45 | $7.26 | $4.88 |
|
| Ending value (after expenses) | $902.20 | $899.00 | $898.70 | $900.20 | $901.30 | $903.60 |
|
* Expenses for each share class are calculated using the fund’s annualized expense ratio for each class, which represents the ongoing expenses as a percentage of average net assets for the six months ended 8/31/12. The expense ratio may differ for each share class.
† Expenses are calculated by multiplying the expense ratio by the average account value for the period; then multiplying the result by the number of days in the period; and then dividing that result by the number of days in the year.
14
Estimate the expenses you paid
To estimate the ongoing expenses you paid for the six months ended August 31, 2012, use the following calculation method. To find the value of your investment on March 1, 2012, call Putnam at 1-800-225-1581.
Compare expenses using the SEC’s method
The Securities and Exchange Commission (SEC) has established guidelines to help investors assess fund expenses. Per these guidelines, the following table shows your fund’s expenses based on a $1,000 investment, assuming a hypothetical 5% annualized return. You can use this information to compare the ongoing expenses (but not transaction expenses or total costs) of investing in the fund with those of other funds. All mutual fund shareholder reports will provide this information to help you make this comparison. Please note that you cannot use this information to estimate your actual ending account balance and expenses paid during the period.
| | | | | | |
| | Class A | Class B | Class C | Class M | Class R | Class Y |
|
| Expenses paid per $1,000*† | $6.44 | $10.23 | $10.23 | $8.97 | $7.71 | $5.18 |
|
| Ending value (after expenses) | $1,018.75 | $1,014.98 | $1,014.98 | $1,016.24 | $1,017.50 | $1,020.01 |
|
* Expenses for each share class are calculated using the fund’s annualized expense ratio for each class, which represents the ongoing expenses as a percentage of average net assets for the six months ended 8/31/12. The expense ratio may differ for each share class.
† Expenses are calculated by multiplying the expense ratio by the average account value for the period; then multiplying the result by the number of days in the period; and then dividing that result by the number of days in the year.
15
Terms and definitions
Important terms
Total return shows how the value of the fund’s shares changed over time, assuming you held the shares through the entire period and reinvested all distributions in the fund.
Before sales charge, or net asset value, is the price, or value, of one share of a mutual fund, without a sales charge. Before-sales-charge figures fluctuate with market conditions, and are calculated by dividing the net assets of each class of shares by the number of outstanding shares in the class.
After sales charge is the price of a mutual fund share plus the maximum sales charge levied at the time of purchase. After-sales-charge performance figures shown here assume the 5.75% maximum sales charge for class A shares and 3.50% for class M shares.
Contingent deferred sales charge (CDSC) is generally a charge applied at the time of the redemption of class B or C shares and assumes redemption at the end of the period. Your fund’s class B CDSC declines over time from a 5% maximum during the first year to 1% during the sixth year. After the sixth year, the CDSC no longer applies. The CDSC for class C shares is 1% for one year after purchase.
Share classes
Class A shares are generally subject to an initial sales charge and no CDSC (except on certain redemptions of shares bought without an initial sales charge).
Class B shares are not subject to an initial sales charge. They may be subject to a CDSC.
Class C shares are not subject to an initial sales charge and are subject to a CDSC only if the shares are redeemed during the first year.
Class M shares have a lower initial sales charge and a higher 12b-1 fee than class A shares and no CDSC (except on certain redemptions of shares bought without an initial sales charge).
Class R shares are not subject to an initial sales charge or CDSC and are available only to certain defined contribution plans.
Class Y shares are not subject to an initial sales charge or CDSC, and carry no 12b-1 fee. They are generally only available to corporate and institutional clients and clients in other approved programs.
Comparative indexes
Barclays U.S. Aggregate Bond Index is an unmanaged index of U.S. investment-grade fixed-income securities.
BofA (Bank of America) Merrill Lynch U.S. 3-Month Treasury Bill Index is an unmanaged index that seeks to measure the performance of U.S. Treasury bills available in the marketplace.
MSCI World Energy & Materials Index (ND) is a free float-adjusted market capitalization weighted index that is designed to measure the equity market performance of developed markets in the energy and materials sector.
S&P 500 Index is an unmanaged index of common stock performance.
Indexes assume reinvestment of all distributions and do not account for fees. Securities and performance of a fund and an index will differ. You cannot invest directly in an index.
16
Other information for shareholders
Important notice regarding Putnam’s privacy policy
In order to conduct business with our shareholders, we must obtain certain personal information such as account holders’ names, addresses, Social Security numbers, and dates of birth. Using this information, we are able to maintain accurate records of accounts and transactions.
It is our policy to protect the confidentiality of our shareholder information, whether or not a shareholder currently owns shares of our funds. In particular, it is our policy not to sell information about you or your accounts to outside marketing firms. We have safeguards in place designed to prevent unauthorized access to our computer systems and procedures to protect personal information from unauthorized use.
Under certain circumstances, we must share account information with outside vendors who provide services to us, such as mailings and proxy solicitations. In these cases, the service providers enter into confidentiality agreements with us, and we provide only the information necessary to process transactions and perform other services related to your account. Finally, it is our policy to share account information with your financial representative, if you’ve listed one on your Putnam account.
Proxy voting
Putnam is committed to managing our mutual funds in the best interests of our shareholders. The Putnam funds’ proxy voting guidelines and procedures, as well as information regarding how your fund voted proxies relating to portfolio securities during the 12-month period ended June 30, 2012, are available in the Individual Investors section at putnam.com, and on the Securities and Exchange Commission (SEC) website, www.sec.gov. If you have questions about finding forms on the SEC’s website, you may call the SEC at 1-800-SEC-0330. You may also obtain the Putnam funds’ proxy voting guidelines and procedures at no charge by calling Putnam’s Shareholder Services at 1-800-225-1581.
Fund portfolio holdings
The fund will file a complete schedule of its portfolio holdings with the SEC for the first and third quarters of each fiscal year on Form N-Q. Shareholders may obtain the fund’s Forms N-Q on the SEC’s website at www.sec.gov. In addition, the fund’s Forms N-Q may be reviewed and copied at the SEC’s Public Reference Room in Washington, D.C. You may call the SEC at 1-800-SEC-0330 for information about the SEC’s website or the operation of the Public Reference Room.
Trustee and employee fund ownership
Putnam employees and members of the Board of Trustees place their faith, confidence, and, most importantly, investment dollars in Putnam mutual funds. As of August 31, 2012, Putnam employees had approximately $339,000,000 and the Trustees had approximately $80,000,000 invested in Putnam mutual funds. These amounts include investments by the Trustees’ and employees’ immediate family members as well as investments through retirement and deferred compensation plans.
17
Trustee approval of management contract
General conclusions
The Board of Trustees of the Putnam funds oversees the management of each fund and, as required by law, determines annually whether to approve the continuance of your fund’s management contract with Putnam Investment Management (“Putnam Management”), the sub-management contract with respect to your fund between Putnam Management and its affiliate, Putnam Investments Limited (“PIL”), and the sub-advisory contract among Putnam Management, PIL, and anotheraffiliate, The Putnam Advisory Company (“PAC”).
The Board of Trustees, with the assistance of its Contract Committee, requests and evaluates all information it deems reasonably necessary under the circumstances in connection with its annual contract review. The Contract Committee consists solely of Trustees who are not “interested persons” (as this term is defined in the Investment Company Act of 1940, as amended (the “1940 Act”)) of the Putnam funds (“Independent Trustees”).
At the outset of the review process, members of the Board’s independent staff and independent legal counsel met with representatives of Putnam Management to review the annual contract review materials furnished to the Contract Committee during the course of the previous year’s review and to discuss possible changes in these materials that might be necessary or desirable for the coming year. Following these discussions and in consultation with the Contract Committee, the Independent Trustees’ independent legal counsel requested that Putnam Management furnish specified information, together with any additional information that Putnam Management considered relevant, to the Contract Committee. Over the course of several months ending in June 2012, the Contract Committee met on a number of occasions with representatives of Putnam Management, and separately in executive session, to consider the information that Putnam Management provided. Throughout this process, the Contract Committee was assisted by the members of the Board’s independent staff and by independent legal counsel for the Putnam funds and the Independent Trustees.
In May 2012, the Contract Committee met in executive session with the other Independent Trustees to discuss the Contract Committee’s preliminary recommendations with respect to the continuance of the contracts. At the Trustees’ June 22, 2012 meeting, the Contract Committee met in executive session with the other Independent Trustees to review a summary of the key financial data that the Contract Committee considered in the course of its review. The Contract Committee then presented its written report, which summarized the key factors that the Committee had considered and set forth its final recommendations. The Contract Committee then recommended, and the Independent Trustees approved, the continuance of your fund’s management, sub-management and sub-advisory contracts, effective July 1, 2012. (Because PIL and PAC are affiliates of Putnam Management and Putnam Management remains fully responsible for all services provided by PIL and PAC, the Trustees have not evaluated PIL or PAC as separate entities, and all subsequent references to Putnam Management below should be deemed to include reference to PIL and PAC as necessary or appropriate in the context.)
The Independent Trustees’ approval was based on the following conclusions:
• That the fee schedule in effect for your fund represented reasonable compensation in light of the nature and quality of the services being provided to the fund, the fees paid by competitive funds, and the costs incurred by Putnam Management in providing services, and
18
• That the fee schedule represented an appropriate sharing between fund shareholders and Putnam Management of such economies of scale as may exist in the management of the fund at current asset levels.
These conclusions were based on a comprehensive consideration of all information provided to the Trustees and were not the result of any single factor. Some of the factors that figured particularly in the Trustees’ deliberations and how the Trustees considered these factors are described below, although individual Trustees may have evaluated the information presented differently, giving different weights to various factors. It is also important to recognize that the management arrangements for your fund and the other Putnam funds are the result of many years of review and discussion between the Independent Trustees and Putnam Management, that some aspects of the arrangements may receive greater scrutiny in some years than others, and that the Trustees’ conclusions may be based, in part, on their consideration of fee arrangements in previous years.
Management fee schedules and total expenses
The Trustees reviewed the management fee schedules in effect for all Putnam funds, including fee levels and breakpoints. In reviewing management fees, the Trustees generally focus their attention on material changes in circumstances — for example, changes in assets under management, changes in a fund’s investment style, changes in Putnam Management’s operating costs, or changes in competitive practices in the mutual fund industry — that suggest that consideration of fee changes might be warranted. The Trustees concluded that the circumstances did not warrant changes to the management fee structure of your fund.
Most of the open-end Putnam funds, including your fund, have relatively new management contracts, which introduced fee schedules that reflect more competitive fee levels for many funds, complex-wide breakpoints for the open-end funds, and performance fees for some funds. These new management contracts have been in effect for two years — since January or, for a few funds, February 2010. The Trustees approved the new management contracts on July 10, 2009, and fund shareholders subsequently approved the contracts by overwhelming majorities of the shares voted.
Under its management contract, your fund has the benefit of breakpoints in its management fee that provide shareholders with significant economies of scale in the form of reduced fee levels as assets under management in the Putnam family of funds increase. The Contract Committee observed that the complex-wide breakpoints of the open-end funds had only been in place for two years, and the Trustees will continue to examine the operation of this new breakpoint structure in future years in light of further experience.
As in the past, the Trustees also focused on the competitiveness of each fund’s total expense ratio. In order to ensure that expenses of the Putnam funds continue to meet evolving competitive standards, the Trustees and Putnam Management agreed in 2009 to implement certain expense limitations. These expense limitations serve in particular to maintain competitive expense levels for funds with large numbers of small shareholder accounts and funds with relatively small net assets. Most funds, including your fund, had sufficiently low expenses that these expense limitations did not apply. The expense limitations were: (i) a contractual expense limitation applicable to all retail open-end funds of 37.5 basis points (effective March 1, 2012, this expense limitation was reduced to 32 basis points) on investor servicing fees and expenses and (ii) a contractual expense limitation applicable to all open-end funds of 20 basis points on so-called “other expenses” (i.e., all expenses exclusive of management fees, investor servicing fees, distribution fees, investment-related expenses, interest, taxes, brokerage commissions, extraordinary expenses and acquired fund
19
fees and expenses). Putnam Management’s support for these expense limitations, including its agreement to reduce the expense limitation applicable to the open-end funds’ investor servicing fees and expenses as noted above, was an important factor in the Trustees’ decision to approve the continuance of your fund’s management, sub-management and sub-advisory contracts.
The Trustees reviewed comparative fee and expense information for a custom group of competitive funds selected by Lipper Inc. This comparative information included your fund’s percentile ranking for effective management fees and total expenses (excluding any applicable 12b-1 fee), which provides a general indication of your fund’s relative standing. In the custom peer group, your fund ranked in the 1st quintile in effective management fees (determined for your fund and the other funds in the custom peer group based on fund asset size and the applicable contractual management fee schedule) and in the 2nd quintile in total expenses (excluding any applicable 12b-1 fees) as of December 31, 2011 (the first quintile representing the least expensive funds and the fifth quintile the most expensive funds). The fee and expense data reported by Lipper as of December 31, 2011 reflected the most recent fiscal year-end data available in Lipper’s database at that time.
In connection with their review of the management fees and total expenses of the Putnam funds, the Trustees also reviewed the costs of the services provided and the profits realized by Putnam Management and its affiliates from their contractual relationships with the funds. This information included trends in revenues, expenses and profitability of Putnam Management and its affiliates relating to the investment management, investor servicing and distribution services provided to the funds. In this regard, the Trustees also reviewed an analysis of Putnam Management’s revenues, expenses and profitability, allocated on a fund-by-fund basis, with respect to the funds’ management, distribution, and investor servicing contracts. For each fund, the analysis presented information about revenues, expenses and profitability for each of the agreements separately and for the agreements taken together on a combined basis. The Trustees concluded that, at current asset levels, the fee schedules in place represented reasonable compensation for the services being provided and represented an appropriate sharing of such economies of scale as may exist in the management of the funds at that time.
The information examined by the Trustees as part of their annual contract review for the Putnam funds has included for many years information regarding fees charged by Putnam Management and its affiliates to institutional clients such as defined benefit pension plans, college endowments, and the like. This information included comparisons of those fees with fees charged to the funds, as well as an assessment of the differences in the services provided to these different types of clients. The Trustees observed that the differences in fee rates between institutional clients and mutual funds are by no means uniform when examined by individual asset sectors, suggesting that differences in the pricing of investment management services to these types of clients may reflect historical competitive forces operating in separate markets. The Trustees considered the fact that in many cases fee rates across different asset classes are higher on average for mutual funds than for institutional clients, as well as the differences between the services that Putnam Management provides to the Putnam funds and those that it provides to its institutional clients. The Trustees did not rely on these comparisons to any significant extent in concluding that the management fees paid by your fund are reasonable.
Investment performance
The quality of the investment process provided by Putnam Management represented a major factor in the Trustees’ evaluation of the quality
20
of services provided by Putnam Management under your fund’s management contract. The Trustees were assisted in their review of the Putnam funds’ investment process and performance by the work of the investment oversight committees of the Trustees, which meet on a regular basis with the funds’ portfolio teams and with the Chief Investment Officer and other members of Putnam Management’s Investment Division throughout the year. The Trustees concluded that Putnam Management generally provides a high-quality investment process — based on the experience and skills of the individuals assigned to the management of fund portfolios, the resources made available to them, and in general Putnam Management’s ability to attract and retain high-quality personnel — but also recognized that this does not guarantee favorable investment results for every fund in every time period.
The Trustees considered the investment performance of each fund over multiple time periods and considered information comparing each fund’s performance with various benchmarks and, where applicable, with the performance of competitive funds or targeted annualized return. They noted that since 2009, when Putnam Management began implementing major changes to strengthen its investment personnel and processes, there has been a steady improvement in the number of Putnam funds showing above-median three-year performance results. They also noted the disappointing investment performance of some funds for periods ended December 31, 2011 and considered information provided by Putnam Management regarding the factors contributing to the underperformance and actions being taken to improve the performance of these particular funds. The Trustees indicated their intention to continue to monitor performance trends to assess the effectiveness of these efforts and to evaluate whether additional actions to address areas of underperformance are warranted.
In the case of your fund, the Trusteesconsidered information about the total return of your fund, and your fund’s performance relative to its internal benchmark over the one-, three-and five-year periods ended December 31, 2011. Putnam Global Natural Resources Fund’s class A shares’ return net of fees and expenses was negative and trailed the return of its internal benchmark over the one- and five-year periods, and was positive and exceeded the return of its internal benchmark over the three-year period. (When considering performance information, shareholders should be mindful that past performance is not a guarantee of future results.)
The Trustees also considered a number of other changes that Putnam Management had made in recent years in efforts to support and improve fund performance generally. These changes included Putnam Management’s efforts to increase accountability and to reduce complexity in the portfolio management process for the Putnam equity funds by moving generally from a portfolio management team structure to a decision-making process that vests full authority and responsibility with individual portfolio managers and by affirming its commitment to a fundamental-driven approach to investing. The Trustees noted that Putnam Management had also worked to strengthen its fundamental research capabilities by adding new investment personnel to the large-cap equities research team and by bringing U.S. and international research under common leadership. In addition, the Trustees recognized that Putnam Management has adjusted the compensation structure for portfolio managers and research analysts so that only those who achieve top-quartile returns over a rolling three-year basis are eligible for full bonuses.
Brokerage and soft-dollar allocations; investor servicing
The Trustees considered various potential benefits that Putnam Management may receive
21
in connection with the services it provides under the management contract with your fund. These include benefits related to brokerage allocation and the use of soft dollars, whereby a portion of the commissions paid by a fund for brokerage may be used to acquire research services that are expected to be useful to Putnam Management in managing the assets of the fund and of other clients. Subject to policies established by the Trustees, soft-dollar credits acquired through these means are used primarily to acquire research services that supplement Putnam Management’s internal research efforts. However, the Trustees noted that a portion of available soft-dollar credits continues to be allocated to the payment of fund expenses. The Trustees indicated their continued intent to monitor regulatory developments in this area with the assistance of their Brokerage Committee and also indicated their continued intent to monitor the potential benefits associated with fund brokerage and soft-dollar allocations and trends in industry practices to ensure that the principle of seeking best price and execution remains paramount in the portfolio trading process.
Putnam Management may also receive benefits from payments that the funds make to Putnam Management’s affiliates for investor or distribution services. In conjunction with the annual review of your fund’s management, sub-management and sub-advisory contracts, the Trustees reviewed your fund’s investor servicing agreement with Putnam Investor Services, Inc. (“PSERV”) and its distributor’s contracts and distribution plans with Putnam Retail Management Limited Partnership (“PRM”), both of which are affiliates of Putnam Management. The Trustees concluded that the fees payable by the funds to PSERV and PRM, as applicable, for such services are reasonable in relation to the nature and quality of such services.
22
Financial statements
These sections of the report, as well as the accompanying Notes, preceded by the Report of Independent Registered Public Accounting Firm, constitute the fund’s financial statements.
The fund’s portfolio lists all the fund’s investments and their values as of the last day of the reporting period. Holdings are organized by asset type and industry sector, country, or state to show areas of concentration and diversification.
Statement of assets and liabilities shows how the fund’s net assets and share price are determined. All investment and non-investment assets are added together. Any unpaid expenses and other liabilities are subtracted from this total. The result is divided by the number of shares to determine the net asset value per share, which is calculated separately for each class of shares. (For funds with preferred shares, the amount subtracted from total assets includes the liquidation preference of preferred shares.)
Statement of operations shows the fund’s net investment gain or loss. This is done by first adding up all the fund’s earnings — from dividends and interest income — and subtracting its operating expenses to determine net investment income (or loss). Then, any net gain or loss the fund realized on the sales of its holdings — as well as any unrealized gains or losses over the period — is added to or subtracted from the net investment result to determine the fund’s net gain or loss for the fiscal year.
Statement of changes in net assets shows how the fund’s net assets were affected by the fund’s net investment gain or loss, by distributions to shareholders, and by changes in the number of the fund’s shares. It lists distributions and their sources (net investment income or realized capital gains) over the current reporting period and the most recent fiscal year-end. The distributions listed here may not match the sources listed in the Statement of operations because the distributions are determined on a tax basis and may be paid in a different period from the one in which they were earned.
Financial highlights provide an overview of the fund’s investment results, per-share distributions, expense ratios, net investment income ratios, and portfolio turnover in one summary table, reflecting the five most recent reporting periods. In a semiannual report, the highlights table also includes the current reporting period.
23
Report of Independent Registered Public Accounting Firm
The Board of Trustees and Shareholders
Putnam Global Natural Resources Fund:
We have audited the accompanying statement of assets and liabilities of Putnam Global Natural Resources Fund (the fund), including the fund’s portfolio, as of August 31, 2012, and the related statement of operations for the year then ended, the statements of changes in net assets for each of the years in the two-year period then ended and the financial highlights for each of the years in the five-year period then ended. These financial statements and financial highlights are the responsibility of the fund’s management. Our responsibility is to express an opinion on these financial statements and financial highlights based on our audits.
We conducted our audits in accordance with the standards of the Public Company Accounting Oversight Board (United States). Those standards require that we plan and perform the audit to obtain reasonable assurance about whether the financial statements and financial highlights are free of material misstatement. An audit includes examining, on a test basis, evidence supporting the amounts and disclosures in the financial statements. Our procedures included confirmation of securities owned as of August 31, 2012 by correspondence with the custodian and brokers or by other appropriate auditing procedures. An audit also includes assessing the accounting principles used and significant estimates made by management, as well as evaluating the overall financial statement presentation. We believe that our audits provide a reasonable basis for our opinion.
In our opinion, the financial statements and financial highlights referred to above present fairly, in all material respects, the financial position of Putnam Global Natural Resources Fund as of August 31, 2012, the results of its operations for the year then ended, the changes in net assets for each of the years in the two-year period then ended and the financial highlights for each of the years in the five-year period then ended, in conformity with U.S. generally accepted accounting principles.

Boston, Massachusetts
October 9, 2012
24
The fund’s portfolio 8/31/12
| | |
| COMMON STOCKS (97.6%)* | Shares | Value |
|
| Chemicals (19.3%) | | |
| Air Products & Chemicals, Inc. | 54,200 | $4,475,836 |
|
| Albemarle Corp. | 44,000 | 2,408,120 |
|
| Arkema (France) | 4,401 | 374,522 |
|
| BASF SE (Germany) | 112,128 | 8,701,971 |
|
| Celanese Corp. Ser. A | 50,200 | 1,920,652 |
|
| E.I. du Pont de Nemours & Co. | 73,976 | 3,680,306 |
|
| Eastman Chemical Co. | 44,300 | 2,448,018 |
|
| Georgia Gulf Corp. | 35,900 | 1,423,076 |
|
| Lanxess AG (Germany) | 53,516 | 4,054,410 |
|
| LyondellBasell Industries NV Class A (Netherlands) | 91,517 | 4,469,690 |
|
| Monsanto Co. | 81,169 | 7,070,632 |
|
| Mosaic Co. (The) | 84,200 | 4,876,022 |
|
| Potash Corp. of Saskatchewan, Inc. (Canada) | 139 | 5,691 |
|
| PPG Industries, Inc. | 12,364 | 1,360,287 |
|
| Praxair, Inc. | 19,800 | 2,088,900 |
|
| Solvay SA (Belgium) | 15,046 | 1,687,819 |
|
| Tronox, Ltd. Class A | 421,855 | 10,879,640 |
|
| | | 61,925,592 |
| Energy equipment and services (10.4%) | | |
| Cameron International Corp. † | 94,700 | 5,181,037 |
|
| Halliburton Co. | 178,300 | 5,841,108 |
|
| National Oilwell Varco, Inc. | 30,500 | 2,403,400 |
|
| Petroleum Geo-Services ASA (Norway) | 151,639 | 2,305,561 |
|
| Schlumberger, Ltd. | 154,509 | 11,183,361 |
|
| Seadrill, Ltd. (Norway) | 101,581 | 4,176,104 |
|
| Technip SA (France) | 20,734 | 2,177,425 |
|
| | | 33,267,996 |
| Metals and mining (13.8%) | | |
| Allegheny Technologies, Inc. | 104,100 | 3,085,524 |
|
| BHP Billiton PLC (United Kingdom) | 315,615 | 9,177,257 |
|
| First Quantum Minerals, Ltd. (Canada) | 155,400 | 2,993,706 |
|
| Goldcorp, Inc. (Canada) | 159,400 | 6,544,172 |
|
| Kinross Gold Corp. (Canada) | 686,000 | 6,096,231 |
|
| Rio Tinto PLC (United Kingdom) | 152,948 | 6,690,506 |
|
| ThyssenKrupp AG (Germany) | 107,220 | 2,133,345 |
|
| Walter Energy, Inc. | 24,600 | 804,420 |
|
| Xstrata PLC (United Kingdom) | 445,678 | 6,714,460 |
|
| | | 44,239,621 |
| Oil, gas, and consumable fuels (52.0%) | | |
| Anadarko Petroleum Corp. | 86,700 | 6,005,709 |
|
| BG Group PLC (United Kingdom) | 455,928 | 9,299,469 |
|
| Cabot Oil & Gas Corp. | 115,600 | 4,786,996 |
|
| Cairn Energy PLC (United Kingdom) | 882,543 | 4,017,377 |
|
| Canadian Natural Resources, Ltd. (Canada) | 134,200 | 4,082,838 |
|
| Chevron Corp. | 95,800 | 10,744,928 |
|
| Cobalt International Energy, Inc. † | 114,479 | 2,599,818 |
|
| Energen Corp. | 47,000 | 2,399,350 |
|
25
| | |
| COMMON STOCKS (97.6%)* cont. | Shares | Value |
|
| Oil, gas, and consumable fuels cont. | | |
| ENI SpA (Italy) | 412,685 | $9,124,418 |
|
| EOG Resources, Inc. | 44,200 | 4,786,860 |
|
| EXCO Resources, Inc. | 259,500 | 1,777,575 |
|
| Exxon Mobil Corp. | 397,438 | 34,696,339 |
|
| Hess Corp. | 48,500 | 2,450,705 |
|
| Kodiak Oil & Gas Corp. † | 150,200 | 1,342,788 |
|
| Linn Energy, LLC (Units) | 36,306 | 1,443,527 |
|
| Marathon Oil Corp. | 258,300 | 7,185,906 |
|
| Noble Energy, Inc. | 78,800 | 6,926,520 |
|
| Royal Dutch Shell PLC Class A | | |
| (London Exchange) (United Kingdom) | 420,804 | 14,733,419 |
|
| Royal Dutch Shell PLC Class A | | |
| (Amsterdam Exchange) (United Kingdom) | 322,773 | 11,274,774 |
|
| Southwestern Energy Co. † | 296,700 | 9,236,271 |
|
| Suncor Energy, Inc. (Canada) | 264,000 | 8,251,423 |
|
| Swift Energy Co. † | 66,900 | 1,303,881 |
|
| Total SA (France) | 74,678 | 3,721,229 |
|
| Tullow Oil PLC (United Kingdom) | 207,967 | 4,504,814 |
|
| | | 166,696,934 |
| Paper and forest products (2.1%) | | |
| International Paper Co. | 87,000 | 3,006,720 |
|
| MeadWestvaco Corp. | 128,100 | 3,684,156 |
|
| | | 6,690,876 |
| | | |
| Total common stocks (cost $314,861,901) | | $312,821,019 |
| |
| |
| SHORT-TERM INVESTMENTS (2.2%)* | Principal amount/shares | Value |
|
| Putnam Money Market Liquidity Fund 0.13% e | 6,486,362 | $6,486,362 |
|
| SSgA Prime Money Market Fund 0.12% P | 189,736 | 189,736 |
|
| U.S. Treasury Bills with effective yields ranging from | | |
| 0.177% to 0.192%, March 7, 2013 ## | $374,000 | 373,752 |
|
| U.S. Treasury Bills with an effective yield of 0.164%, | | |
| July 25, 2013 ## | 76,000 | 75,896 |
|
| Total short-term investments (cost $7,125,616) | | $7,125,746 |
| |
| |
| TOTAL INVESTMENTS | | |
|
| Total investments (cost $321,987,517) | | $319,946,765 |
Unless noted otherwise, the notes to the fund’s portfolio are for the close of the fund’s reporting period, which ran from September 1, 2011 through August 31, 2012 (the reporting period). Within the following notes to the portfolio, references to “ASC 820” represent Accounting Standards Codification ASC 820 Fair Value Measurements and Disclosures.
* Percentages indicated are based on net assets of $320,669,414.
† Non-income-producing security.
## This security, in part or in entirety, was pledged and segregated with the custodian for collateral on certain derivative contracts at the close of the reporting period.
e See Note 6 to the financial statements regarding investments in Putnam Money Market Liquidity Fund. The rate quoted in the security description is the annualized 7-day yield of the fund at the close of the reporting period.
26
P Security purchased with cash or security received, that was pledged to the fund for collateral on certain derivatives contracts. The rate quoted in the security description is the annualized 7-day yield of the fund at the close of the reporting period (Note 1).
At the close of the reporting period, the fund maintained liquid assets totaling $739,948 to cover certain derivatives contracts.
|
| DIVERSIFICATION BY COUNTRY* |
|
Distribution of investments by country of risk at the close of the reporting period, excluding collateral received, if any (as a percentage of Portfolio Value):
| | | | |
| United States | 57.1% | | Norway | 2.0% |
| |
|
| United Kingdom | 20.8 | | France | 2.0 |
| |
|
| Canada | 8.7 | | Netherlands | 1.4 |
| |
|
| Germany | 4.7 | | Belgium | 0.5 |
| |
|
| Italy | 2.8 | | Total | 100.0% |
| | |
* Methodology differs from that used for purposes of complying with the fund’s policy regarding investments in securities of foreign issuers, as discussed further in the fund’s prospectus.
FORWARD CURRENCY CONTRACTS at 8/31/12 (aggregate face value $163,013,184)
| | | | | | |
| | | | | | Unrealized |
| | Contract | Delivery | | Aggregate | appreciation/ |
| Counterparty | Currency | type | date | Value | face value | (depreciation) |
|
| Bank of America, N.A. | | | | | |
|
| Australian Dollar | Sell | 9/20/12 | $3,523,093 | $3,581,348 | $58,255 |
|
| British Pound | Sell | 9/20/12 | 1,227,816 | 1,206,967 | (20,849) |
|
| Euro | Buy | 9/20/12 | 511,876 | 501,512 | 10,364 |
|
| Swiss Franc | Buy | 9/20/12 | 2,395,755 | 2,341,491 | 54,264 |
|
| Barclays Bank PLC | | | | | |
|
| Australian Dollar | Buy | 9/20/12 | 5,998,068 | 6,092,089 | (94,021) |
|
| British Pound | Sell | 9/20/12 | 6,437,736 | 6,332,961 | (104,775) |
|
| Canadian Dollar | Buy | 9/20/12 | 2,700,200 | 2,628,747 | 71,453 |
|
| Euro | Buy | 9/20/12 | 7,092,421 | 6,943,976 | 148,445 |
|
| Japanese Yen | Buy | 9/20/12 | 1,065,896 | 1,049,982 | 15,914 |
|
| Swiss Franc | Buy | 9/20/12 | 1,032,918 | 1,010,309 | 22,609 |
|
| Citibank, N.A. | | | | | |
|
| Australian Dollar | Sell | 9/20/12 | 904,399 | 917,926 | 13,527 |
|
| British Pound | Buy | 9/20/12 | 1,896,104 | 1,863,537 | 32,567 |
|
| Canadian Dollar | Buy | 9/20/12 | 2,135,131 | 2,100,422 | 34,709 |
|
| Euro | Buy | 9/20/12 | 218,890 | 214,348 | 4,542 |
|
| Swiss Franc | Buy | 9/20/12 | 1,378,133 | 1,354,224 | 23,909 |
|
| Credit Suisse AG | | | | | |
|
| Australian Dollar | Buy | 9/20/12 | 1,080,719 | 1,098,042 | (17,323) |
|
| British Pound | Sell | 9/20/12 | 10,040,048 | 9,878,905 | (161,143) |
|
| Canadian Dollar | Buy | 9/20/12 | 238,420 | 234,702 | 3,718 |
|
| Euro | Sell | 9/20/12 | 1,287,175 | 1,259,559 | (27,616) |
|
| Japanese Yen | Buy | 9/20/12 | 18,864,815 | 18,894,295 | (29,480) |
|
| Norwegian Krone | Sell | 9/20/12 | 730,544 | 720,967 | (9,577) |
|
| Deutsche Bank AG | | | | | |
|
| Australian Dollar | Sell | 9/20/12 | 2,831,123 | 2,871,618 | 40,495 |
|
| Canadian Dollar | Buy | 9/20/12 | 1,661,638 | 1,634,284 | 27,354 |
|
27
FORWARD CURRENCY CONTRACTS at 8/31/12 (aggregate face value $163,013,184) cont.
| | | | | | |
| | | | | | Unrealized |
| | Contract | Delivery | | Aggregate | appreciation/ |
| Counterparty | Currency | type | date | Value | face value | (depreciation) |
|
| Deutsche Bank AG cont. | | | | |
|
| Euro | Sell | 9/20/12 | $1,755,902 | $1,720,442 | $(35,460) |
|
| Swedish Krona | Buy | 9/20/12 | 1,316,574 | 1,288,060 | 28,514 |
|
| Goldman Sachs International | | | |
|
| Australian Dollar | Buy | 9/20/12 | 2,833,083 | 2,877,039 | (43,956) |
|
| British Pound | Buy | 9/20/12 | 720,685 | 708,241 | 12,444 |
|
| Euro | Buy | 9/20/12 | 367,711 | 357,873 | 9,838 |
|
| Japanese Yen | Sell | 9/20/12 | 477,202 | 477,758 | 556 |
|
| Norwegian Krone | Sell | 9/20/12 | 1,443,223 | 1,390,295 | (52,928) |
|
| HSBC Bank USA, National Association | | |
|
| Australian Dollar | Buy | 9/20/12 | 11,649,583 | 11,825,588 | (176,005) |
|
| British Pound | Sell | 9/20/12 | 2,095,845 | 2,062,592 | (33,253) |
|
| Norwegian Krone | Sell | 9/20/12 | 335,377 | 323,013 | (12,364) |
|
| JPMorgan Chase Bank, N.A. | | | |
|
| Australian Dollar | Buy | 9/20/12 | 1,671,168 | 1,697,599 | (26,431) |
|
| British Pound | Buy | 9/20/12 | 2,247,476 | 2,208,951 | 38,525 |
|
| Canadian Dollar | Buy | 9/20/12 | 884,010 | 869,873 | 14,137 |
|
| Euro | Sell | 9/20/12 | 8,846,940 | 8,664,128 | (182,812) |
|
| Japanese Yen | Buy | 9/20/12 | 439,074 | 438,747 | 327 |
|
| Swiss Franc | Buy | 9/20/12 | 1,886,367 | 1,845,295 | 41,072 |
|
| Royal Bank of Scotland PLC (The) | | | |
|
| Australian Dollar | Buy | 9/20/12 | 2,168,144 | 2,199,997 | (31,853) |
|
| British Pound | Buy | 9/20/12 | 5,097,507 | 5,010,948 | 86,559 |
|
| Canadian Dollar | Sell | 9/20/12 | 656,948 | 646,185 | (10,763) |
|
| Euro | Sell | 9/20/12 | 4,085,574 | 4,002,790 | (82,784) |
|
| Japanese Yen | Sell | 9/20/12 | 160,782 | 160,953 | 171 |
|
| Swiss Franc | Sell | 9/20/12 | 845,067 | 826,138 | (18,929) |
|
| State Street Bank and Trust Co. | | | |
|
| Australian Dollar | Buy | 9/20/12 | 1,028,308 | 1,042,947 | (14,639) |
|
| Canadian Dollar | Buy | 9/20/12 | 2,272,342 | 2,234,510 | 37,832 |
|
| Euro | Buy | 9/20/12 | 3,771,580 | 3,706,259 | 65,321 |
|
| Israeli Shekel | Buy | 9/20/12 | 901,504 | 898,702 | 2,802 |
|
| UBS AG | | | | |
|
| Australian Dollar | Buy | 9/20/12 | 1,579,243 | 1,601,873 | (22,630) |
|
| British Pound | Sell | 9/20/12 | 1,235,119 | 1,214,031 | (21,088) |
|
| Canadian Dollar | Buy | 9/20/12 | 4,609,790 | 4,534,215 | 75,575 |
|
| Euro | Buy | 9/20/12 | 5,289,848 | 5,180,686 | 109,162 |
|
| Norwegian Krone | Buy | 9/20/12 | 825,844 | 795,053 | 30,791 |
|
| Westpac Banking Corp. | | | | |
|
| Australian Dollar | Sell | 9/20/12 | 1,339,060 | 1,359,933 | 20,873 |
|
| British Pound | Sell | 9/20/12 | 3,071,524 | 3,018,594 | (52,930) |
|
| Canadian Dollar | Buy | 9/20/12 | 1,388,129 | 1,365,761 | 22,368 |
|
| Euro | Buy | 9/20/12 | 3,126,105 | 3,061,570 | 64,535 |
|
| Japanese Yen | Sell | 9/20/12 | 6,654,149 | 6,664,334 | 10,185 |
|
| Total | | | | | $(49,897) |
28
ASC 820 establishes a three-level hierarchy for disclosure of fair value measurements. The valuation hierarchy is based upon the transparency of inputs to the valuation of the fund’s investments. The three levels are defined as follows:
Level 1: Valuations based on quoted prices for identical securities in active markets.
Level 2: Valuations based on quoted prices in markets that are not active or for which all significant inputs are observable, either directly or indirectly.
Level 3: Valuations based on inputs that are unobservable and significant to the fair value measurement.
The following is a summary of the inputs used to value the fund’s net assets as of the close of the reporting period:
| | | |
| | | Valuation inputs | |
|
| Investments in securities: | Level 1 | Level 2 | Level 3 |
|
| Common stocks: | | | |
|
| Energy | $134,630,340 | $65,334,590 | $— |
|
| Materials | 73,321,799 | 39,534,290 | — |
|
| Total common stocks | 207,952,139 | 104,868,880 | — |
| | | | |
| Short-term investments | 6,676,098 | 449,648 | — |
|
| Totals by level | $214,628,237 | $105,318,528 | $— |
| | | | |
| | | Valuation inputs | |
|
| Other financial instruments: | Level 1 | Level 2 | Level 3 |
|
| Forward currency contracts | $— | $(49,897) | $— |
|
| Totals by level | $— | $(49,897) | $— |
The accompanying notes are an integral part of these financial statements.
29
Statement of assets and liabilities 8/31/12
| |
| ASSETS | |
|
| Investment in securities, at value (Note 1): | |
| Unaffiliated issuers (identified cost $315,501,155) | $313,460,403 |
| Affiliated issuers (identified cost $6,486,362) (Notes 1 and 6) | 6,486,362 |
|
| Dividends, interest and other receivables | 1,241,625 |
|
| Receivable for shares of the fund sold | 106,241 |
|
| Receivable for investments sold | 1,280,392 |
|
| Unrealized appreciation on forward currency contracts (Note 1) | 1,233,712 |
|
| Total assets | 323,808,735 |
| |
| LIABILITIES | |
|
| Payable for investments purchased | 574,850 |
|
| Payable for shares of the fund repurchased | 423,807 |
|
| Payable for compensation of Manager (Note 2) | 173,792 |
|
| Payable for investor servicing fees (Note 2) | 142,740 |
|
| Payable for custodian fees (Note 2) | 13,777 |
|
| Payable for Trustee compensation and expenses (Note 2) | 98,305 |
|
| Payable for administrative services (Note 2) | 705 |
|
| Payable for distribution fees (Note 2) | 149,888 |
|
| Unrealized depreciation on forward currency contracts (Note 1) | 1,283,609 |
|
| Collateral on certain derivative contracts, at value (Note 1) | 189,736 |
|
| Other accrued expenses | 88,112 |
|
| Total liabilities | 3,139,321 |
| | |
| Net assets | $320,669,414 |
|
| |
| REPRESENTED BY | |
|
| Paid-in capital (Unlimited shares authorized) (Notes 1, 4 and 8) | $418,288,643 |
|
| Undistributed net investment income (Note 1) | 2,465,974 |
|
| Accumulated net realized loss on investments and foreign currency transactions (Note 1) | (97,991,373) |
|
| Net unrealized depreciation of investments and assets and liabilities in foreign currencies | (2,093,830) |
|
| Total — Representing net assets applicable to capital shares outstanding | $320,669,414 |
(Continued on next page)
30
Statement of assets and liabilities (Continued)
| |
| COMPUTATION OF NET ASSET VALUE AND OFFERING PRICE | |
|
| Net asset value and redemption price per class A share | |
| ($262,969,403 divided by 13,711,415 shares) | $19.18 |
|
| Offering price per class A share (100/94.25 of $19.18)* | $20.35 |
|
| Net asset value and offering price per class B share ($15,560,596 divided by 910,025 shares)** | $17.10 |
|
| Net asset value and offering price per class C share ($13,564,054 divided by 776,306 shares)** | $17.47 |
|
| Net asset value and redemption price per class M share ($4,998,929 divided by 274,516 shares) | $18.21 |
|
| Offering price per class M share (100/96.50 of $18.21)* | $18.87 |
|
| Net asset value, offering price and redemption price per class R share | |
| ($13,837,727 divided by 735,849 shares) | $18.81 |
|
| Net asset value, offering price and redemption price per class Y share | |
| ($9,738,705 divided by 504,358 shares) | $19.31 |
|
* On single retail sales of less than $50,000. On sales of $50,000 or more the offering price is reduced.
** Redemption price per share is equal to net asset value less any applicable contingent deferred sales charge.
The accompanying notes are an integral part of these financial statements.
31
Statement of operations Year ended 8/31/12
| |
| INVESTMENT INCOME | |
|
| Dividends (net of foreign tax of $586,863) | $8,539,358 |
|
| Interest (including interest income of $3,890 from investments in affiliated issuers) (Note 6) | 5,495 |
|
| Securities lending (Note 1) | 68 |
|
| Total investment income | 8,544,921 |
| |
| EXPENSES | |
|
| Compensation of Manager (Note 2) | 2,215,764 |
|
| Investor servicing fees (Note 2) | 1,141,748 |
|
| Custodian fees (Note 2) | 39,727 |
|
| Trustee compensation and expenses (Note 2) | 29,910 |
|
| Administrative services (Note 2) | 10,977 |
|
| Distribution fees — Class A (Note 2) | 712,658 |
|
| Distribution fees — Class B (Note 2) | 177,114 |
|
| Distribution fees — Class C (Note 2) | 147,311 |
|
| Distribution fees — Class M (Note 2) | 41,820 |
|
| Distribution fees — Class R (Note 2) | 76,045 |
|
| Other | 174,839 |
|
| Total expenses | 4,767,913 |
| | |
| Expense reduction (Note 2) | (52,238) |
|
| Net expenses | 4,715,675 |
| | |
| Net investment income | 3,829,246 |
|
| |
| Net realized loss on investments (Notes 1 and 3) | (26,475,715) |
|
| Net realized loss on foreign currency transactions (Note 1) | (2,068,552) |
|
| Net unrealized appreciation of assets and liabilities in foreign currencies during the year | 896,532 |
|
| Net unrealized appreciation of investments during the year | 3,018,646 |
|
| Net loss on investments | (24,629,089) |
| | |
| Net decrease in net assets resulting from operations | $(20,799,843) |
|
The accompanying notes are an integral part of these financial statements.
32
Statement of changes in net assets
| | |
| INCREASE (DECREASE) IN NET ASSETS | Year ended 8/31/12 | Year ended 8/31/11 |
|
| Operations: | | |
| Net investment income | $3,829,246 | $2,540,457 |
|
| Net realized gain (loss) on investments | | |
| and foreign currency transactions | (28,544,267) | 88,233,327 |
|
| Net unrealized appreciation of investments and assets | | |
| and liabilities in foreign currencies | 3,915,178 | 3,568,424 |
|
| Net increase (decrease) in net assets resulting | | |
| from operations | (20,799,843) | 94,342,208 |
|
| Distributions to shareholders (Note 1): | | |
| From ordinary income | | |
| Net investment income | | |
|
| Class A | (8,268,152) | (6,537,764) |
|
| Class B | (421,959) | (334,168) |
|
| Class C | (334,299) | (240,868) |
|
| Class M | (141,190) | (100,316) |
|
| Class R | (410,298) | (256,967) |
|
| Class Y | (333,579) | (230,734) |
|
| Increase in capital from settlement payments (Note 8) | — | 60,325 |
|
| Redemption fees (Note 1) | 72,188 | 42,416 |
|
| Decrease from capital share transactions (Note 4) | (43,804,045) | (36,413,175) |
|
| Total increase (decrease) in net assets | (74,441,177) | 50,330,957 |
| |
| NET ASSETS | | |
|
| Beginning of year | 395,110,591 | 344,779,634 |
|
| End of year (including undistributed net investment income | | |
| of $2,465,974 and $10,615,283, respectively) | $320,669,414 | $395,110,591 |
|
The accompanying notes are an integral part of these financial statements.
33
Financial highlights (For a common share outstanding throughout the period)
| | | | | | | | | | | | | | | | |
| INVESTMENT OPERATIONS: | LESS DISTRIBUTIONS: | | | | RATIOS AND SUPPLEMENTAL DATA: | |
|
| | | | | | | | | | | | | | | Ratio | | |
| | | | | | | | | | | | | | | of expenses | | |
| | | | | | | | | | | | | | | to average | Ratio | |
| | Net asset | Net | Net realized | | From | From | | | | | | | Ratio | net assets, | of net investment | |
| | value, | investment | and unrealized | Total from | net | net realized | | | Non-recurring | | Total return | Net assets, | of expenses | excluding | income (loss) | |
| | beginning | income | gain (loss) | investment | investment | gain | Total | Redemption | reimburse- | Net asset value, | at net asset | end of period | to average | interest expense | to average | Portfolio |
| Period ended | of period | (loss) a | on investments | operations | income | on investments | distributions | fees | ments | end of period | value (%) b | (in thousands) | net assets (%) c | (%) c | net assets (%) | turnover (%) |
|
| Class A | | | | | | | | | | | | | | | | |
| August 31, 2012 | $20.81 | .23 | (1.30) | (1.07) | (.56) | — | (.56) | — d | — | $19.18 | (5.08) | $262,969 | 1.29 | 1.29 | 1.18 | 80 |
| August 31, 2011 | 16.62 | .15 | 4.44 | 4.59 | (.40) | — | (.40) | — d | — d,e | 20.81 | 27.53 | 322,408 | 1.26 | 1.26 | .66 | 90 |
| August 31, 2010 | 16.87 | .13 | (.18) | (.05) | (.20) | — | (.20) | — d | — | 16.62 | (.44) | 284,668 | 1.39 | 1.39 | .71 | 107 |
| August 31, 2009 | 27.99 | .19 | (9.21) | (9.02) | — | (2.10) | (2.10) | — d | — | 16.87 | (29.64) | 321,830 | 1.44 f,g | 1.43 g | 1.22 g | 92 |
| August 31, 2008 | 35.18 | .29 | (.54) | (.25) | (.08) | (6.87) | (6.95) | .01 | — | 27.99 | (2.76) | 559,989 | 1.18 g | 1.18 g | .87 g | 99 |
|
| Class B | | | | | | | | | | | | | | | | |
| August 31, 2012 | $18.58 | .08 | (1.16) | (1.08) | (.40) | — | (.40) | — d | — | $17.10 | (5.78) | $15,561 | 2.04 | 2.04 | .46 | 80 |
| August 31, 2011 | 14.87 | (.02) | 3.99 | 3.97 | (.26) | — | (.26) | — d | — d,e | 18.58 | 26.58 | 21,166 | 2.01 | 2.01 | (.10) | 90 |
| August 31, 2010 | 15.11 | (.01) | (.15) | (.16) | (.08) | — | (.08) | — d | — | 14.87 | (1.15) | 21,418 | 2.14 | 2.14 | (.05) | 107 |
| August 31, 2009 | 25.66 | .06 | (8.51) | (8.45) | — | (2.10) | (2.10) | — d | — | 15.11 | (30.18) | 30,849 | 2.19 f,g | 2.18 g | .45 g | 92 |
| August 31, 2008 | 32.93 | .02 | (.43) | (.41) | — | (6.87) | (6.87) | .01 | — | 25.66 | (3.52) | 70,360 | 1.93 g | 1.93 g | .08 g | 99 |
|
| Class C | | | | | | | | | | | | | | | | |
| August 31, 2012 | $18.98 | .08 | (1.19) | (1.11) | (.40) | — | (.40) | — d | — | $17.47 | (5.81) | $13,564 | 2.04 | 2.04 | .43 | 80 |
| August 31, 2011 | 15.20 | (.01) | 4.07 | 4.06 | (.28) | — | (.28) | — d | — d,e | 18.98 | 26.61 | 16,797 | 2.01 | 2.01 | (.04) | 90 |
| August 31, 2010 | 15.47 | (.01) | (.16) | (.17) | (.10) | — | (.10) | — d | — | 15.20 | (1.21) | 13,292 | 2.14 | 2.14 | (.04) | 107 |
| August 31, 2009 | 26.18 | .07 | (8.68) | (8.61) | — | (2.10) | (2.10) | — d | — | 15.47 | (30.18) | 14,156 | 2.19 f,g | 2.18 g | .47 g | 92 |
| August 31, 2008 | 33.46 | .04 | (.45) | (.41) | — | (6.87) | (6.87) | — d | — | 26.18 | (3.49) | 25,383 | 1.93 g | 1.93 g | .12 g | 99 |
|
| Class M | | | | | | | | | | | | | | | | |
| August 31, 2012 | $19.77 | .13 | (1.23) | (1.10) | (.46) | — | (.46) | — d | — | $18.21 | (5.53) | $4,999 | 1.79 | 1.79 | .70 | 80 |
| August 31, 2011 | 15.82 | .03 | 4.23 | 4.26 | (.31) | — | (.31) | — d | — d,e | 19.77 | 26.86 | 6,233 | 1.76 | 1.76 | .17 | 90 |
| August 31, 2010 | 16.08 | .04 | (.17) | (.13) | (.13) | — | (.13) | — d | — | 15.82 | (.91) | 5,141 | 1.89 | 1.89 | .20 | 107 |
| August 31, 2009 | 27.00 | .11 | (8.93) | (8.82) | — | (2.10) | (2.10) | — d | — | 16.08 | (30.03) | 5,609 | 1.94 f,g | 1.93 g | .73 g | 92 |
| August 31, 2008 | 34.22 | .12 | (.48) | (.36) | — | (6.87) | (6.87) | .01 | — | 27.00 | (3.20) | 9,172 | 1.68 g | 1.68 g | .36 g | 99 |
|
| Class R | | | | | | | | | | | | | | | | |
| August 31, 2012 | $20.41 | .18 | (1.27) | (1.09) | (.51) | — | (.51) | — d | — | $18.81 | (5.28) | $13,838 | 1.54 | 1.54 | .94 | 80 |
| August 31, 2011 | 16.31 | .10 | 4.36 | 4.46 | (.36) | — | (.36) | — d | — d,e | 20.41 | 27.27 | 16,971 | 1.51 | 1.51 | .46 | 90 |
| August 31, 2010 | 16.58 | .09 | (.19) | (.10) | (.17) | — | (.17) | — d | — | 16.31 | (.72) | 11,192 | 1.64 | 1.64 | .48 | 107 |
| August 31, 2009 | 27.64 | .15 | (9.11) | (8.96) | — | (2.10) | (2.10) | — d | — | 16.58 | (29.82) | 9,966 | 1.69 f,g | 1.68 g | 1.00 g | 92 |
| August 31, 2008 | 34.87 | .22 | (.53) | (.31) | (.06) | (6.87) | (6.93) | .01 | — | 27.64 | (2.99) | 10,129 | 1.43 g | 1.43 g | .69 g | 99 |
|
| Class Y | | | | | | | | | | | | | | | | |
| August 31, 2012 | $20.96 | .28 | (1.31) | (1.03) | (.62) | — | (.62) | — d | — | $19.31 | (4.85) | $9,739 | 1.04 | 1.04 | 1.44 | 80 |
| August 31, 2011 | 16.73 | .21 | 4.47 | 4.68 | (.45) | — | (.45) | — d | — d,e | 20.96 | 27.89 | 11,535 | 1.01 | 1.01 | .94 | 90 |
| August 31, 2010 | 16.97 | .18 | (.18) | — d | (.24) | — | (.24) | — d | — | 16.73 | (.16) | 9,069 | 1.14 | 1.14 | .95 | 107 |
| August 31, 2009 | 28.07 | .23 | (9.23) | (9.00) | — | (2.10) | (2.10) | — d | — | 16.97 | (29.47) | 11,052 | 1.19 f,g | 1.18 g | 1.48 g | 92 |
| August 31, 2008 | 35.26 | .38 | (.54) | (.16) | (.17) | (6.87) | (7.04) | .01 | — | 28.07 | (2.51) | 16,306 | .93 g | .93 g | 1.16 g | 99 |
|
See notes to financial highlights at the end of this section.
The accompanying notes are an integral part of these financial statements.
Financial highlights (Continued)
a Per share net investment income (loss) has been determined on the basis of the weighted average number of shares outstanding during the period.
b Total return assumes dividend reinvestment and does not reflect the effect of sales charges.
c Includes amounts paid through expense offset and brokerage/service arrangements (Note 2).
d Amount represents less than $0.01 per share.
e Reflects a non-recurring reimbursement related to restitution amounts in connection with a distribution plan approved by the Securities and Exchange Commission (the SEC) which amounted to less than $0.01 per share outstanding on July 21, 2011. Also reflects a non-recurring reimbursement related to short-term trading related lawsuits, which amounted to less than $0.01 per share outstanding on May 11, 2011 (Note 8).
f Includes interest accrued in connection with certain terminated derivatives contracts, which amounted to 0.01% of average net assets for the period ended August 31, 2009.
g Reflects an involuntary contractual expense limitation and/or waivers of certain fund expenses in connection with investments in Putnam Prime Money Market Fund in effect during the period. As a result of such limitation and/or waivers, the expenses of each class reflect a reduction of the following amounts:
| |
| | Percentage of |
| | average net assets |
|
| August 31, 2009 | 0.05% |
|
| August 31, 2008 | <0.01 |
|
The accompanying notes are an integral part of these financial statements.
36
Notes to financial statements 8/31/12
Within the following Notes to financial statements, references to “State Street” represent State Street Bank and Trust Company, references to “the SEC” represent the Securities and Exchange Commission and references to “Putnam Management” represent Putnam Investment Management, LLC, the fund’s manager, an indirect wholly-owned subsidiary of Putnam Investments, LLC. Unless otherwise noted, the “reporting period” represents the period from September 1, 2011 through August 31, 2012.
Putnam Global Natural Resources Fund (the fund) is a Massachusetts business trust, which is registered under the Investment Company Act of 1940, as amended, as a non-diversified open-end management investment company. The investment objective of the fund is to seek capital appreciation by concentrating its investments in the energy and other natural resources industries. The fund invests mainly in common stocks (growth or value stocks or both) of large and midsize companies worldwide that Putnam Management believes have favorable investment potential.
The fund offers class A, class B, class C, class M, class R and class Y shares. Class A and class M shares are sold with a maximum front-end sales charge of 5.75% and 3.50%, respectively, and generally do not pay a contingent deferred sales charge. Class B shares, which convert to class A shares after approximately eight years, do not pay a front-end sales charge and are subject to a contingent deferred sales charge if those shares are redeemed within six years of purchase. Class C shares have a one-year 1.00% contingent deferred sales charge and do not convert to class A shares. Class R shares, which are not available to all investors, are sold at net asset value. The expenses for class A, class B, class C, class M and class R shares may differ based on the distribution fee of each class, which is identified in Note 2. Class Y shares, which are sold at net asset value, are generally subject to the same expenses as class A, class B, class C, class M and class R shares, but do not bear a distribution fee. Class Y shares are not available to all investors.
In the normal course of business, the fund enters into contracts that may include agreements to indemnify another party under given circumstances. The fund’s maximum exposure under these arrangements is unknown as this would involve future claims that may be, but have not yet been, made against the fund. However, the fund’s management team expects the risk of material loss to be remote.
Note 1: Significant accounting policies
The following is a summary of significant accounting policies consistently followed by the fund in the preparation of its financial statements. The preparation of financial statements is in conformity with accounting principles generally accepted in the United States of America and requires management to make estimates and assumptions that affect the reported amounts of assets and liabilities in the financial statements and the reported amounts of increases and decreases in net assets from operations. Actual results could differ from those estimates. Subsequent events after the Statement of assets and liabilities date through the date that the financial statements were issued have been evaluated in the preparation of the financial statements.
A 1.00% redemption fee may apply on shares that are redeemed (either by selling or exchanging into another fund) within 90 days of purchase. The redemption fee is accounted for as an addition to paid-in-capital.
Investment income, realized and unrealized gains and losses and expenses of the fund are borne pro-rata based on the relative net assets of each class to the total net assets of the fund, except that each class bears expenses unique to that class (including the distribution fees applicable to such classes). Each class votes as a class only with respect to its own distribution plan or other matters on which a class vote is required by law or determined by the Trustees. If the fund were liquidated, shares of each class would receive their pro-rata share of the net assets of the fund. In addition, the Trustees declare separate dividends on each class of shares.
Security valuation Investments for which market quotations are readily available are valued at the last reported sales price on their principal exchange, or official closing price for certain markets, and are classified as Level 1 securities. If no sales are reported, as in the case of some securities traded over-the-counter, a security is valued at its last reported bid price and is generally categorized as a Level 2 security.
Investments in other open-end investment companies (excluding exchange traded funds), which are classified as Level 1 securities, are based on their net asset value. The net asset value of an investment company equals the total value of its assets less its liabilities and divided by the number of its outstanding shares. Shares are only valued as of the close of regular trading on the New York Stock Exchange each day that the exchange is open.
Many securities markets and exchanges outside the U.S. close prior to the close of the New York Stock Exchange and therefore the closing prices for securities in such markets or on such exchanges may not fully reflect events
37
that occur after such close but before the close of the New York Stock Exchange. Accordingly, on certain days, the fund will fair value foreign equity securities taking into account multiple factors including movements in the U.S. securities markets, currency valuations and comparisons to the valuation of American Depository Receipts, exchange-traded funds and futures contracts. These securities, which would generally be classified as Level 1 securities, will be transferred to Level 2 of the fair value hierarchy when they are valued at fair value. The number of days on which fair value prices will be used will depend on market activity and it is possible that fair value prices will be used by the fund to a significant extent. At the close of the reporting period, fair value pricing was used for certain foreign securities in the portfolio. Securities quoted in foreign currencies, if any, are translated into U.S. dollars at the current exchange rate.
To the extent a pricing service or dealer is unable to value a security or provides a valuation that Putnam Management does not believe accurately reflects the security’s fair value, the security will be valued at fair value by Putnam Management. Certain investments, including certain restricted and illiquid securities and derivatives, are also valued at fair value following procedures approved by the Trustees. These valuations consider such factors as significant market or specific security events such as interest rate or credit quality changes, various relationships with other securities, discount rates, U.S. Treasury, U.S. swap and credit yields, index levels, convexity exposures and recovery rates. These securities are classified as Level 2 or as Level 3 depending on the priority of the significant inputs.
Such valuations and procedures are reviewed periodically by the Trustees. The fair value of securities is generally determined as the amount that the fund could reasonably expect to realize from an orderly disposition of such securities over a reasonable period of time. By its nature, a fair value price is a good faith estimate of the value of a security in a current sale and does not reflect an actual market price, which may be different by a material amount.
Security transactions and related investment income Security transactions are recorded on the trade date (the date the order to buy or sell is executed). Gains or losses on securities sold are determined on the identified cost basis.
Interest income is recorded on the accrual basis. Dividend income, net of applicable withholding taxes, is recognized on the ex-dividend date except that certain dividends from foreign securities, if any, are recognized as soon as the fund is informed of the ex-dividend date. Non-cash dividends, if any, are recorded at the fair market value of the securities received. Dividends representing a return of capital or capital gains, if any, are reflected as a reduction of cost and/or as a realized gain.
All premiums/discounts are amortized/accreted on a yield-to-maturity basis.
Foreign currency translation The accounting records of the fund are maintained in U.S. dollars. The market value of foreign securities, currency holdings, and other assets and liabilities is recorded in the books and records of the fund after translation to U.S. dollars based on the exchange rates on that day. The cost of each security is determined using historical exchange rates. Income and withholding taxes are translated at prevailing exchange rates when earned or incurred. The fund does not isolate that portion of realized or unrealized gains or losses resulting from changes in the foreign exchange rate on investments from fluctuations arising from changes in the market prices of the securities. Such gains and losses are included with the net realized and unrealized gain or loss on investments. Net realized gains and losses on foreign currency transactions represent net realized exchange gains or losses on closed forward currency contracts, disposition of foreign currencies, currency gains and losses realized between the trade and settlement dates on securities transactions and the difference between the amount of investment income and foreign withholding taxes recorded on the fund’s books and the U.S. dollar equivalent amounts actually received or paid. Net unrealized appreciation and depreciation of assets and liabilities in foreign currencies arise from changes in the value of open forward currency contracts and assets and liabilities other than investments at the period end, resulting from changes in the exchange rate.
Forward currency contracts The fund buys and sells forward currency contracts, which are agreements between two parties to buy and sell currencies at a set price on a future date. These contracts are used to hedge foreign exchange risk.
The U.S. dollar value of forward currency contracts is determined using current forward currency exchange rates supplied by a quotation service. The market value of the contract will fluctuate with changes in currency exchange rates. The contract is marked to market daily and the change in market value is recorded as an unrealized gain or loss. The fund records a realized gain or loss equal to the difference between the value of the contract at the time it was opened and the value at the time it was closed when the contract matures or by delivery of the currency. The fund could be exposed to risk if the value of the currency changes unfavorably, if the counterparties to the contracts
38
are unable to meet the terms of their contracts or if the fund is unable to enter into a closing position. Risks may exceed amounts recognized on the Statement of assets and liabilities.
Forward currency contracts outstanding at period end, if any, are listed after the fund’s portfolio. The fund had an average contract amount of approximately $204,300,000 on forward currency contracts for the reporting period.
Master agreements The fund is a party to ISDA (International Swaps and Derivatives Association, Inc.) Master Agreements (Master Agreements) with certain counterparties that govern over-the-counter derivative and foreign exchange contracts entered into from time to time. The Master Agreements may contain provisions regarding, among other things, the parties’ general obligations, representations, agreements, collateral requirements, events of default and early termination. With respect to certain counterparties, in accordance with the terms of the Master Agreements, collateral posted to the fund is held in a segregated account by the fund’s custodian and with respect to those amounts which can be sold or repledged, are presented in the fund’s portfolio. Collateral posted to the fund which cannot be sold or repledged totaled $103,800 at the close of the reporting period.
Collateral pledged by the fund is segregated by the fund’s custodian and identified in the fund’s portfolio. Collateral can be in the form of cash or debt securities issued by the U.S. Government or related agencies or other securities as agreed to by the fund and the applicable counterparty. Collateral requirements are determined based on the fund’s net position with each counterparty.
Termination events applicable to the fund may occur upon a decline in the fund’s net assets below a specified threshold over a certain period of time. Termination events applicable to counterparties may occur upon a decline in the counterparty’s long-term and short-term credit ratings below a specified level. In each case, upon occurrence, the other party may elect to terminate early and cause settlement of all derivative and foreign exchange contracts outstanding, including the payment of any losses and costs resulting from such early termination, as reasonably determined by the terminating party. Any decision by one or more of the fund’s counterparties to elect early termination could impact the fund’s future derivative activity.
At the close of the reporting period, the fund had a net liability position of $709,870 on derivative contracts subject to the Master Agreements. Collateral posted by the fund totaled $449,624.
Securities lending The fund may lend securities, through its agent, to qualified borrowers in order to earn additional income. The loans are collateralized by cash in an amount at least equal to the market value of the securities loaned. The market value of securities loaned is determined daily and any additional required collateral is allocated to the fund on the next business day. The risk of borrower default will be borne by the fund’s agent; the fund will bear the risk of loss with respect to the investment of the cash collateral. Income from securities lending is included in investment income on the Statement of operations. Cash collateral is invested in Putnam Cash Collateral Pool, LLC, a limited liability company managed by an affiliate of Putnam Management. Investments in Putnam Cash Collateral Pool, LLC are valued at its closing net asset value each business day. There are no management fees charged to Putnam Cash Collateral Pool, LLC. At the close of the reporting period, the fund had no securities out on loan.
Interfund lending The fund, along with other Putnam funds, may participate in an interfund lending program pursuant to an exemptive order issued by the SEC. This program allows the fund to borrow from or lend to other Putnam funds that permit such transactions. Interfund lending transactions are subject to each fund’s investment policies and borrowing and lending limits. Interest earned or paid on the interfund lending transaction will be based on the average of certain current market rates. During the reporting period, the fund did not utilize the program.
Line of credit The fund participates, along with other Putnam funds, in a $315 million unsecured committed line of credit and a $185 million unsecured uncommitted line of credit, both provided by State Street. Borrowings may be made for temporary or emergency purposes, including the funding of shareholder redemption requests and trade settlements. Interest is charged to the fund based on the fund’s borrowing at a rate equal to the Federal Funds rate plus 1.25% for the committed line of credit and the Federal Funds rate plus 1.30% for the uncommitted line of credit. A closing fee equal to 0.02% of the committed line of credit and $50,000 for the uncommitted line of credit has been paid by the participating funds. In addition, a commitment fee of 0.11% per annum on any unutilized portion of the committed line of credit is allocated to the participating funds based on their relative net assets and paid quarterly. During the reporting period, the fund had no borrowings against these arrangements.
Federal taxes It is the policy of the fund to distribute all of its taxable income within the prescribed time period and otherwise comply with the provisions of the Internal Revenue Code of 1986, as amended (the Code), applicable to regulated investment companies. It is also the intention of the fund to distribute an amount sufficient to avoid imposition of any excise tax under Section 4982 of the Code.
39
The fund is subject to the provisions of Accounting Standards Codification ASC 740 Income Taxes (ASC 740). ASC 740 sets forth a minimum threshold for financial statement recognition of the benefit of a tax position taken or expected to be taken in a tax return. The fund did not have a liability to record for any unrecognized tax benefits in the accompanying financial statements. No provision has been made for federal taxes on income, capital gains or unrealized appreciation on securities held nor for excise tax on income and capital gains. Each of the fund’s federal tax returns for the prior three fiscal years remains subject to examination by the Internal Revenue Service.
The fund may also be subject to taxes imposed by governments of countries in which it invests. Such taxes are generally based on either income or gains earned or repatriated. The fund accrues and applies such taxes to net investment income, net realized gains and net unrealized gains as income and/or capital gains are earned. In some cases, the fund may be entitled to reclaim all or a portion of such taxes, and such reclaim amounts, if any, are reflected as an asset on the fund’s books. In many cases, however, the fund may not receive such amounts for an extended period of time, depending on the country of investment.
At August 31, 2012, the fund had a capital loss carryover of $71,068,327 available to the extent allowed by the Code to offset future net capital gain, if any. The amounts of the carryovers and the expiration dates are:
| | | |
| Loss carryover |
|
| Short-term | Long-term | Total | Expiration |
|
| $519,717 | $— | $519,717 | * |
|
| 70,548,610 | N/A | 70,548,610 | August 31, 2018 |
|
* Under the Regulated Investment Company Modernization Act of 2010, the fund will be permitted to carry forward capital losses incurred in taxable years beginning after December 22, 2010 for an unlimited period. However, any losses incurred during those future years will be required to be utilized prior to the losses incurred in pre-enactment tax years. As a result of this ordering rule, pre-enactment capital loss carryforwards may be more likely to expire unused. Additionally, post-enactment capital losses that are carried forward will retain their character as either short-term or long-term capital losses rather than being considered all short-term as under previous law.
Pursuant to federal income tax regulations applicable to regulated investment companies, the fund has elected to defer certain capital losses of $26,651,615 recognized during the period between November 1, 2011 and August 31, 2012 to its fiscal year ending August 31, 2013.
Distributions to shareholders Distributions to shareholders from net investment income are recorded by the fund on the ex-dividend date. Distributions from capital gains, if any, are recorded on the ex-dividend date and paid at least annually. The amount and character of income and gains to be distributed are determined in accordance with income tax regulations, which may differ from generally accepted accounting principles. These differences include temporary and/or permanent differences of losses on wash sale transactions, foreign currency gains and losses, late year loss deferrals and partnership income. Reclassifications are made to the fund’s capital accounts to reflect income and gains available for distribution (or available capital loss carryovers) under income tax regulations. For the reporting period ended, the fund reclassified $2,069,078 to decrease undistributed net investment income, $19 to increase paid-in-capital and $2,069,059 to decrease accumulated net realized loss.
The tax basis components of distributable earnings and the federal tax cost as of the close of the reporting period were as follows:
| |
| Unrealized appreciation | $20,104,155 |
| Unrealized depreciation | (22,416,338) |
|
| Net unrealized depreciation | (2,312,183) |
| Undistributed ordinary income | 2,415,020 |
| Capital loss carryforward | (71,068,327) |
| Post-October capital loss deferral | (26,651,615) |
| Cost for federal income tax purposes | $322,258,948 |
40
Note 2: Management fee, administrative services and other transactions
The fund pays Putnam Management a management fee (based on the fund’s average net assets and computed and paid monthly) at annual rates that may vary based on the average of the aggregate net assets of most open-end funds, as defined in the fund’s management contract, sponsored by Putnam Management. Such annual rates may vary as follows:
| |
| 0.780% | of the first $5 billion, |
| 0.730% | of the next $5 billion, |
| 0.680% | of the next $10 billion, |
| 0.630% | of the next $10 billion, |
| 0.580% | of the next $50 billion, |
| 0.560% | of the next $50 billion, |
| 0.550% | of the next $100 billion and |
| 0.545% | of any excess thereafter. |
Putnam Management has contractually agreed, through June 30, 2013, to waive fees or reimburse the fund’s expenses to the extent necessary to limit the cumulative expenses of the fund, exclusive of brokerage, interest, taxes, investment-related expenses, extraordinary expenses and payments under the fund’s investor servicing contract, investment management contract and distribution plans, on a fiscal year-to-date basis to an annual rate of 0.20% of the fund’s average net assets over such fiscal year-to-date period. During the reporting period, the fund’s expenses were not reduced as a result of this limit.
Putnam Investments Limited (PIL), an affiliate of Putnam Management, is authorized by the Trustees to manage a separate portion of the assets of the fund as determined by Putnam Management from time to time. Putnam Management pays a quarterly sub-management fee to PIL for its services at an annual rate of 0.35% of the average net assets of the portion of the fund managed by PIL.
The Putnam Advisory Company, LLC (PAC), an affiliate of Putnam Management, is authorized by the Trustees to manage a separate portion of the assets of the fund, as designated from time to time by Putnam Management or PIL. Putnam Management or PIL, as applicable, pays a quarterly sub-advisory fee to PAC for its services at the annual rate of 0.35% of the average net assets of the portion of the fund’s assets for which PAC is engaged as sub-adviser.
The fund reimburses Putnam Management an allocated amount for the compensation and related expenses of certain officers of the fund and their staff who provide administrative services to the fund. The aggregate amount of all such reimbursements is determined annually by the Trustees.
Custodial functions for the fund’s assets are provided by State Street. Custody fees are based on the fund’s asset level, the number of its security holdings and transaction volumes.
Putnam Investor Services, Inc., an affiliate of Putnam Management, provides investor servicing agent functions to the fund. Putnam Investor Services, Inc. received fees for investor servicing based on the fund’s retail asset level, the number of shareholder accounts in the fund and the level of defined contribution plan assets in the fund. Investor servicing fees will not exceed an annual rate of 0.32% of the fund’s average net assets. Prior to March 1, 2012, investor servicing fees could not exceed an annual rate of 0.375% of the fund’s average net assets. The amounts incurred for investor servicing agent functions during the reporting period are included in Investor servicing fees in the Statement of operations.
The fund has entered into expense offset arrangements with Putnam Investor Services, Inc. and State Street whereby Putnam Investor Services, Inc.’s and State Street’s fees are reduced by credits allowed on cash balances. The fund also reduced expenses through brokerage/service arrangements. For the reporting period, the fund’s expenses were reduced by $838 under the expense offset arrangements and by $51,400 under the brokerage/service arrangements.
Each independent Trustee of the fund receives an annual Trustee fee, of which $248, as a quarterly retainer, has been allocated to the fund, and an additional fee for each Trustees meeting attended. Trustees also are reimbursed for expenses they incur relating to their services as Trustees.
The fund has adopted a Trustee Fee Deferral Plan (the Deferral Plan) which allows the Trustees to defer the receipt of all or a portion of Trustees fees payable on or after July 1, 1995. The deferred fees remain invested in certain Putnam funds until distribution in accordance with the Deferral Plan.
41
The fund has adopted an unfunded noncontributory defined benefit pension plan (the Pension Plan) covering all Trustees of the fund who have served as a Trustee for at least five years and were first elected prior to 2004. Benefits under the Pension Plan are equal to 50% of the Trustee’s average annual attendance and retainer fees for the three years ended December 31, 2005. The retirement benefit is payable during a Trustee’s lifetime, beginning the year following retirement, for the number of years of service through December 31, 2006. Pension expense for the fund is included in Trustee compensation and expenses in the Statement of operations. Accrued pension liability is included in Payable for Trustee compensation and expenses in the Statement of assets and liabilities. The Trustees have terminated the Pension Plan with respect to any Trustee first elected after 2003.
The fund has adopted distribution plans (the Plans) with respect to its class A, class B, class C, class M and class R shares pursuant to Rule 12b–1 under the Investment Company Act of 1940. The purpose of the Plans is to compensate Putnam Retail Management Limited Partnership, an indirect wholly-owned subsidiary of Putnam Investments, LLC, for services provided and expenses incurred in distributing shares of the fund. The Plans provide for payments by the fund to Putnam Retail Management Limited Partnership at an annual rate of up to 0.35%, 1.00%, 1.00%, 1.00% and 1.00% of the average net assets attributable to class A, class B, class C, class M and class R shares, respectively. The Trustees have approved payment by the fund at an annual rate of 0.25%, 1.00%, 1.00%, 0.75% and 0.50% of the average net assets attributable to class A, class B, class C, class M and class R shares, respectively.
For the reporting period, Putnam Retail Management Limited Partnership, acting as underwriter, received net commissions of $26,482 and $412 from the sale of class A and class M shares, respectively, and received $17,054 and $878 in contingent deferred sales charges from redemptions of class B and class C shares, respectively.
A deferred sales charge of up to 1.00% and 0.65% is assessed on certain redemptions of class A and class M shares, respectively. For the reporting period, Putnam Retail Management Limited Partnership, acting as underwriter, received $13 and no monies on class A and class M redemptions, respectively.
Note 3: Purchases and sales of securities
During the reporting period, cost of purchases and proceeds from sales of investment securities other than short-term investments aggregated $276,173,007 and $322,615,729, respectively. There were no purchases or proceeds from sales of long-term U.S. government securities.
Note 4: Capital shares
At the close of the reporting period, there was an unlimited number of shares of beneficial interest authorized. Transactions in capital shares were as follows:
| | | | |
| | Year ended 8/31/12 | Year ended 8/31/11 |
|
| Class A | Shares | Amount | Shares | Amount |
|
| Shares sold | 1,074,480 | $21,053,603 | 1,584,662 | $35,282,985 |
|
| Shares issued in connection with | | | | |
| reinvestment of distributions | 410,386 | 7,698,843 | 279,069 | 6,061,389 |
|
| | 1,484,866 | 28,752,446 | 1,863,731 | 41,344,374 |
|
| Shares repurchased | (3,267,327) | (63,084,064) | (3,502,953) | (75,719,201) |
|
| Net decrease | (1,782,461) | $(34,331,618) | (1,639,222) | $(34,374,827) |
|
| |
| | Year ended 8/31/12 | Year ended 8/31/11 |
|
| Class B | Shares | Amount | Shares | Amount |
|
| Shares sold | 100,613 | $1,743,636 | 167,609 | $3,350,060 |
|
| Shares issued in connection with | | | | |
| reinvestment of distributions | 23,545 | 395,796 | 16,023 | 312,453 |
|
| | 124,158 | 2,139,432 | 183,632 | 3,662,513 |
|
| Shares repurchased | (353,282) | (6,191,623) | (484,980) | (9,537,714) |
|
| Net decrease | (229,124) | $(4,052,191) | (301,348) | $(5,875,201) |
|
42
| | | | |
| | Year ended 8/31/12 | Year ended 8/31/11 |
|
| Class C | Shares | Amount | Shares | Amount |
|
| Shares sold | 94,306 | $1,681,237 | 320,521 | $6,680,398 |
|
| Shares issued in connection with | | | | |
| reinvestment of distributions | 17,594 | 302,267 | 10,473 | 208,624 |
|
| | 111,900 | 1,983,504 | 330,994 | 6,889,022 |
|
| Shares repurchased | (220,612) | (3,855,893) | (320,474) | (6,445,414) |
|
| Net increase (decrease) | (108,712) | $(1,872,389) | 10,520 | $443,608 |
|
| |
| | Year ended 8/31/12 | Year ended 8/31/11 |
|
| Class M | Shares | Amount | Shares | Amount |
|
| Shares sold | 23,328 | $426,955 | 58,215 | $1,214,469 |
|
| Shares issued in connection with | | | | |
| reinvestment of distributions | 7,514 | 134,284 | 4,599 | 95,293 |
|
| | 30,842 | 561,239 | 62,814 | 1,309,762 |
|
| Shares repurchased | (71,537) | (1,304,773) | (72,625) | (1,505,685) |
|
| Net decrease | (40,695) | $(743,534) | (9,811) | $(195,923) |
|
| |
| | Year ended 8/31/12 | Year ended 8/31/11 |
|
| Class R | Shares | Amount | Shares | Amount |
|
| Shares sold | 269,810 | $5,134,098 | 401,555 | $8,882,662 |
|
| Shares issued in connection with | | | | |
| reinvestment of distributions | 21,812 | 402,004 | 11,882 | 253,679 |
|
| | 291,622 | 5,536,102 | 413,437 | 9,136,341 |
|
| Shares repurchased | (387,216) | (7,413,233) | (267,983) | (5,863,351) |
|
| Net increase (decrease) | (95,594) | $(1,877,131) | 145,454 | $3,272,990 |
|
| |
| | Year ended 8/31/12 | Year ended 8/31/11 |
|
| Class Y | Shares | Amount | Shares | Amount |
|
| Shares sold | 61,110 | $1,208,361 | 136,250 | $3,094,626 |
|
| Shares issued in connection with | | | | |
| reinvestment of distributions | 16,962 | 319,910 | 9,963 | 217,584 |
|
| | 78,072 | 1,528,271 | 146,213 | 3,312,210 |
|
| Shares repurchased | (124,135) | (2,455,453) | (137,948) | (2,996,032) |
|
| Net increase (decrease) | (46,063) | $(927,182) | 8,265 | $316,178 |
|
Note 5: Summary of derivative activity
The following is a summary of the market values of derivative instruments as of the close of the reporting period:
Market values of derivative instruments as of the close of the reporting period
| | | | |
| | Asset derivatives | Liability derivatives |
|
| Derivatives not | | | | |
| accounted for as | Statement of | | Statement of | |
| hedging instruments | assets and | | assets and | |
| under ASC 815 | liabilities location | Market value | liabilities location | Market value |
|
| Foreign exchange | | | | |
| contracts | Receivables | $1,233,712 | Payables | $1,283,609 |
|
| Total | | $1,233,712 | | $1,283,609 |
|
43
The following is a summary of realized and change in unrealized gains or losses of derivative instruments on the Statement of operations for the reporting period (see Note 1):
Amount of realized gain or (loss) on derivatives recognized in net gain or (loss) on investments
| | |
| Derivatives not accounted for as hedging | Forward currency | |
| instruments under ASC 815 | contracts | Total |
|
| Foreign exchange contracts | $(1,847,043) | $(1,847,043) |
|
| Total | $(1,847,043) | $(1,847,043) |
|
Change in unrealized appreciation or (depreciation) on derivatives recognized in net gain or (loss) on investments
| | |
| Derivatives not accounted for as hedging | Forward currency | |
| instruments under ASC 815 | contracts | Total |
|
| Foreign exchange contracts | $892,364 | $892,364 |
|
| Total | $892,364 | $892,364 |
|
Note 6: Investment in Putnam Money Market Liquidity Fund
The fund invested in Putnam Money Market Liquidity Fund, an open-end management investment company managed by Putnam Management. Investments in Putnam Money Market Liquidity Fund are valued at its closing net asset value each business day. Income distributions earned by the fund are recorded as interest income in the Statement of operations and totaled $3,890 for the reporting period. During the reporting period, cost of purchases and proceeds of sales of investments in Putnam Money Market Liquidity Fund aggregated $119,628,172 and $117,336,241, respectively. Management fees charged to Putnam Money Market Liquidity Fund have been waived by Putnam Management.
Note 7: Market, credit and other risks
In the normal course of business, the fund trades financial instruments and enters into financial transactions where risk of potential loss exists due to changes in the market (market risk) or failure of the contracting party to the transaction to perform (credit risk). The fund may be exposed to additional credit risk that an institution or other entity with which the fund has unsettled or open transactions will default. Investments in foreign securities involve certain risks, including those related to economic instability, unfavorable political developments, and currency fluctuations. The fund concentrates its investments in one sector, which involves more risk than a fund that invests more broadly.
Note 8: Regulatory matters and litigation
In late 2003 and 2004, Putnam Management settled charges brought by the SEC and the Massachusetts Securities Division in connection with excessive short-term trading in Putnam funds. In July 2011, the fund recorded a receivable of $59,335 related to restitution amounts in connection with a distribution plan approved by the SEC. This amount, which was received by the fund in December 2011, is reported as part of Increase in capital from settlement payments on the Statement of changes in net assets. These allegations and related matters have served as the general basis for certain lawsuits, including purported class action lawsuits against Putnam Management and, in a limited number of cases, some Putnam funds. In May 2011, the fund received a payment of $990 related to settlement of those lawsuits. This amount is reported as a part of Increase in capital from settlement payments on the Statement of changes in net assets. Putnam Management has agreed to bear any costs incurred by the Putnam funds as a result of these matters.
44
Note 9: New accounting pronouncements
In May 2011, the Financial Accounting Standards Board (FASB) issued Accounting Standards Update (ASU) 2011–04 “Fair Value Measurements and Disclosures (Topic 820) — Amendments to Achieve Common Fair Value Measurement and Disclosure Requirements in U.S. GAAP and IFRS”. ASU 2011–04 amends FASB Topic 820 “Fair Value Measurement” and seeks to develop common requirements for measuring fair value and for disclosing information about fair value measurements in accordance with GAAP. ASU 2011–04 is effective for fiscal years and interim periods beginning after December 15, 2011. The application of ASU 2011–04 did not have a material impact on the fund’s financial statements.
In December 2011, the FASB issued ASU No. 2011–11 “Disclosures about Offsetting Assets and Liabilities”. The update creates new disclosure requirements requiring entities to disclose both gross and net information for derivatives and other financial instruments that are either offset in the Statement of assets and liabilities or subject to an enforceable master netting arrangement or similar agreement. The disclosure requirements are effective for annual reporting periods beginning on or after January 1, 2013 and interim periods within those annual periods. Putnam Management is currently evaluating the application of ASU 2011–11 and its impact, if any, on the fund’s financial statements.
45
Federal tax information (Unaudited)
The fund designated 100% of ordinary income distributions as qualifying for the dividends received deduction for corporations.
For the reporting period ended, the fund hereby designates 100%, or the maximum amount allowable, of its taxable ordinary income distributions as qualified dividends taxed at the individual net capital gain rates.
For the reporting period ended, pursuant to §871(k) of the Internal Revenue Code, the fund hereby designates $6,937 of distributions paid as qualifying to be taxed as interest-related dividends, and no monies to be taxed as short-term capital gain dividends for nonresident alien shareholders.
The Form 1099 that will be mailed to you in January 2013 will show the tax status of all distributions paid to your account in calendar 2012.
46
About the Trustees
Independent Trustees
47
* Mr. Reynolds is an “interested person” (as defined in the Investment Company Act of 1940) of the fund, Putnam Management, and Putnam Retail Management. He is President and Chief Executive Officer of Putnam Investments, as well as the President of your fund and each of the other Putnam funds.
The address of each Trustee is One Post Office Square, Boston, MA 02109.
As of August 31, 2012, there were 109 Putnam funds. All Trustees serve as Trustees of all Putnam funds.
Each Trustee serves for an indefinite term, until his or her resignation, retirement at age 75, removal, or death.
48
Officers
In addition to Robert L. Reynolds, the other officers of the fund are shown below:
| |
| Jonathan S. Horwitz (Born 1955) | Janet C. Smith (Born 1965) |
| Executive Vice President, Principal Executive | Vice President, Principal Accounting Officer, |
| Officer, and Compliance Liaison | and Assistant Treasurer |
| Since 2004 | Since 2007 |
| | Director of Fund Administration Services, |
| Steven D. Krichmar (Born 1958) | Putnam Investments and Putnam Management |
| Vice President and Principal Financial Officer | |
| Since 2002 | Susan G. Malloy (Born 1957) |
| Chief of Operations, Putnam Investments and | Vice President and Assistant Treasurer |
| Putnam Management | Since 2007 |
| | Director of Accounting & Control Services, |
| Robert T. Burns (Born 1961) | Putnam Management |
| Vice President and Chief Legal Officer | |
| Since 2011 | James P. Pappas (Born 1953) |
| General Counsel, Putnam Investments and | Vice President |
| Putnam Management | Since 2004 |
| | Director of Trustee Relations, |
| Robert R. Leveille (Born 1969) | Putnam Investments and Putnam Management |
| Vice President and Chief Compliance Officer | |
| Since 2007 | Mark C. Trenchard (Born 1962) |
| Chief Compliance Officer, Putnam Investments, | Vice President and BSA Compliance Officer |
| Putnam Management, and Putnam Retail | Since 2002 |
| Management | Director of Operational Compliance, |
| | Putnam Investments and Putnam |
| Michael J. Higgins (Born 1976) | Retail Management |
| Vice President and Treasurer | |
| Since 2010 | Judith Cohen (Born 1945) |
| Manager of Finance, Dunkin’ Brands (2008– | Vice President, Clerk, and Associate Treasurer |
| 2010); Senior Financial Analyst, Old Mutual Asset | Since 1993 |
| Management (2007–2008); Senior Financial | |
| Analyst, Putnam Investments (1999–2007) | Nancy E. Florek (Born 1957) |
| | Vice President, Proxy Manager, Assistant Clerk, |
| | and Associate Treasurer |
| Since 2000 |
The principal occupations of the officers for the past five years have been with the employers as shown above although in some cases, they have held different positions with such employers. The address of each Officer is One Post Office Square, Boston, MA 02109.
49
The Putnam family of funds
The following is a list of Putnam’s open-end mutual funds offered to the public. Investors should carefully consider the investment objective, risks, charges, and expenses of a fund before investing. For a prospectus, or a summary prospectus if available, containing this and other information for any Putnam fund or product, call your financial advisor at 1-800-225-1581 and ask for a prospectus. Please read the prospectus carefully before investing.
| |
| Growth | Income |
| Growth Opportunities Fund | American Government Income Fund |
| International Growth Fund | Diversified Income Trust |
| Multi-Cap Growth Fund | Floating Rate Income Fund |
| Small Cap Growth Fund | Global Income Trust |
| Voyager Fund | High Yield Advantage Fund |
| High Yield Trust |
| Blend | Income Fund |
| Asia Pacific Equity Fund | Money Market Fund* |
| Capital Opportunities Fund | Short Duration Income Fund |
| Capital Spectrum Fund | U.S. Government Income Trust |
| Emerging Markets Equity Fund | |
| Equity Spectrum Fund | Tax-free income |
| Europe Equity Fund | AMT-Free Municipal Fund |
| Global Equity Fund | Tax Exempt Income Fund |
| International Capital Opportunities Fund | Tax Exempt Money Market Fund* |
| International Equity Fund | Tax-Free High Yield Fund |
| Investors Fund | |
| Multi-Cap Core Fund | State tax-free income funds: |
| Research Fund | Arizona, California, Massachusetts, Michigan, |
| Minnesota, New Jersey, New York, Ohio, |
| Value | and Pennsylvania. |
| Convertible Securities Fund | |
| Equity Income Fund | Absolute Return |
| George Putnam Balanced Fund | Absolute Return 100 Fund |
| The Putnam Fund for Growth and Income | Absolute Return 300 Fund |
| International Value Fund | Absolute Return 500 Fund |
| Multi-Cap Value Fund | Absolute Return 700 Fund |
| Small Cap Value Fund | |
* An investment in a money market fund is not insured or guaranteed by the Federal Deposit Insurance Corporation or any other government agency. Although the fund seeks to preserve the value of your investment at $1.00 per share, it is possible to lose money by investing in the fund.
50
| |
| Global Sector | Putnam RetirementReady Funds — portfolios |
| Global Consumer Fund | with automatically adjusting allocations to |
| Global Energy Fund | stocks, bonds, and money market instruments, |
| Global Financials Fund | becoming more conservative over time. |
| Global Health Care Fund | |
| Global Industrials Fund | RetirementReady 2055 Fund |
| Global Natural Resources Fund | RetirementReady 2050 Fund |
| Global Sector Fund | RetirementReady 2045 Fund |
| Global Technology Fund | RetirementReady 2040 Fund |
| Global Telecommunications Fund | RetirementReady 2035 Fund |
| Global Utilities Fund | RetirementReady 2030 Fund |
| RetirementReady 2025 Fund |
| Asset Allocation | RetirementReady 2020 Fund |
| Putnam Global Asset Allocation Funds — | RetirementReady 2015 Fund |
| portfolios with allocations to stocks, bonds, | |
| and money market instruments that are | Putnam Retirement Income Lifestyle |
| adjusted dynamically within specified ranges | Funds — portfolios with managed |
| as market conditions change. | allocations to stocks, bonds, and money |
| market investments to generate |
| Dynamic Asset Allocation Balanced Fund | retirement income. |
| Prior to November 30, 2011, this fund was known as | |
| Putnam Asset Allocation: Balanced Portfolio. | Retirement Income Fund Lifestyle 1 |
| Dynamic Asset Allocation | Retirement Income Fund Lifestyle 2 |
| Conservative Fund | Retirement Income Fund Lifestyle 3 |
| Prior to November 30, 2011, this fund was known as | |
| Putnam Asset Allocation: Conservative Portfolio. | |
| Dynamic Asset Allocation Growth Fund | |
| Prior to November 30, 2011, this fund was known as | |
| Putnam Asset Allocation: Growth Portfolio. | |
| Dynamic Risk Allocation Fund | |
A short-term trading fee of 1% may apply to redemptions or exchanges from certain funds within the time period specified in the fund's prospectus.
Check your account balances and the most recent month-end performance in the Individual Investors section at putnam.com.
51
Services for shareholders
Investor services
Systematic investment plan Tell us how much you wish to invest regularly — weekly, semimonthly, or monthly — and the amount you choose will be transferred automatically from your checking or savings account. There’s no additional fee for this service, and you can suspend it at any time. This plan may be a great way to save for college expenses or to plan for your retirement.
Please note that regular investing does not guarantee a profit or protect against loss in a declining market. Before arranging a systematic investment plan, consider your financial ability to continue making purchases in periods when prices are low.
Systematic exchange You can make regular transfers from one Putnam fund to another Putnam fund. There are no additional fees for this service, and you can cancel or change your options at any time.
Dividends PLUS You can choose to have the dividend distributions from one of your Putnam funds automatically reinvested in another Putnam fund at no additional charge.
Free exchange privilege You can exchange money between Putnam funds free of charge, as long as they are the same class of shares. A signature guarantee is required if you are exchanging more than $500,000. The fund reserves the right to revise or terminate the exchange privilege.
Reinstatement privilege If you’ve sold Putnam shares or received a check for a dividend or capital gain, you may reinvest the proceeds with Putnam within 90 days of the transaction and they will be reinvested at the fund’s current net asset value — with no sales charge. However, reinstatement of class B shares may have special tax consequences. Ask your financial or tax representative for details.
Check-writing service You have ready access to many Putnam accounts. It’s as simple as writing a check, and there are no special fees or service charges. For more information about the check-writing service, call Putnam or visit our website.
Dollar cost averaging When you’re investing for long-term goals, it’s time, not timing, that counts. Investing on a systematic basis is a better strategy than trying to figure out when the markets will go up or down. This means investing the same amount of money regularly over a long period. This method of investing is called dollar cost averaging. When a fund’s share price declines, your investment dollars buy more shares at lower prices. When it increases, they buy fewer shares. Over time, you will pay a lower average price per share.
For more information
Visit the Individual Investors section at putnam.com A secure section of our website contains complete information on your account, including balances and transactions, updated daily. You may also conduct transactions, such as exchanges, additional investments, and address changes. Log on today to get your password.
Call us toll free at 1-800-225-1581 Ask a helpful Putnam representative or your financial advisor for details about any of these or other services, or see your prospectus.
52
Fund information
Founded 75 years ago, Putnam Investments was built around the concept that a balance between risk and reward is the hallmark of a well-rounded financial program. We manage over 100 funds across income, value, blend, growth, asset allocation, absolute return, and global sector categories.
| | |
| Investment Manager | Trustees | Robert R. Leveille |
| Putnam Investment | Jameson A. Baxter, Chair | Vice President and |
| Management, LLC | Liaquat Ahamed | Chief Compliance Officer |
| One Post Office Square | Ravi Akhoury | |
| Boston, MA 02109 | Barbara M. Baumann | Michael J. Higgins |
| | Charles B. Curtis | Vice President and Treasurer |
| Investment Sub-Manager | Robert J. Darretta | |
| Putnam Investments Limited | Katinka Domotorffy | Janet C. Smith |
| 57–59 St James’s Street | John A. Hill | Vice President, |
| London, England SW1A 1LD | Paul L. Joskow | Principal Accounting Officer, |
| | Elizabeth T. Kennan | and Assistant Treasurer |
| Investment Sub-Advisor | Kenneth R. Leibler | |
| The Putnam Advisory | Robert E. Patterson | Susan G. Malloy |
| Company, LLC | George Putnam, III | Vice President and |
| One Post Office Square | Robert L. Reynolds | Assistant Treasurer |
| Boston, MA 02109 | W. Thomas Stephens | |
| | | James P. Pappas |
| Marketing Services | Officers | Vice President |
| Putnam Retail Management | Robert L. Reynolds | |
| One Post Office Square | President | Mark C. Trenchard |
| Boston, MA 02109 | | Vice President and |
| | Jonathan S. Horwitz | BSA Compliance Officer |
| Custodian | Executive Vice President, | |
| State Street Bank | Principal Executive Officer, and | Judith Cohen |
| and Trust Company | Compliance Liaison | Vice President, Clerk, and |
| | | Associate Treasurer |
| Legal Counsel | Steven D. Krichmar | |
| Ropes & Gray LLP | Vice President and | Nancy E. Florek |
| | Principal Financial Officer | Vice President, Proxy |
| Independent Registered | | Manager, Assistant Clerk, and |
| Public Accounting Firm | Robert T. Burns | Associate Treasurer |
| KPMG LLP | Vice President and | |
| | Chief Legal Officer | |
This report is for the information of shareholders of Putnam Global Natural Resources Fund. It may also be used as sales literature when preceded or accompanied by the current prospectus, the most recent copy of Putnam’s Quarterly Performance Summary, and Putnam’s Quarterly Ranking Summary. For more recent performance, please visit putnam.com. Investors should carefully consider the investment objectives, risks, charges, and expenses of a fund, which are described in its prospectus. For this and other information or to request a prospectus or summary prospectus, call 1-800-225-1581 toll free. Please read the prospectus carefully before investing. The fund’s Statement of Additional Information contains additional information about the fund’s Trustees and is available without charge upon request by calling 1-800-225-1581.
| |
| (a) The fund’s principal executive, financial and accounting officers are employees of Putnam Investment Management, LLC, the Fund’s investment manager. As such they are subject to a comprehensive Code of Ethics adopted and administered by Putnam Investments which is designed to protect the interests of the firm and its clients. The Fund has adopted a Code of Ethics which incorporates the Code of Ethics of Putnam Investments with respect to all of its officers and Trustees who are employees of Putnam Investment Management, LLC. For this reason, the Fund has not adopted a separate code of ethics governing its principal executive, financial and accounting officers. |
| |
| (c) In May 2008, the Code of Ethics of Putnam Investment Management, LLC was updated in its entirety to include the amendments adopted in August 2007 as well as a several additional technical, administrative and non-substantive changes. In May of 2009, the Code of Ethics of Putnam Investment Management, LLC was amended to reflect that all employees will now be subject to a 90-day blackout restriction on holding Putnam open-end funds, except for portfolio managers and their supervisors (and each of their immediate family members), who will be subject to a one-year blackout restriction on the funds that they manage or supervise. In June 2010, the Code of Ethics of Putnam Investments was updated in its entirety to include the amendments adopted in May of 2009 and to change certain rules and limits contained in the Code of Ethics. In addition, the updated Code of Ethics included numerous technical, administrative and non-substantive changes, which were intended primarily to make the document easier to navigate and understand. In July 2011, the Code of Ethics of Putnam Investments was updated to reflect several technical, administrative and non-substantive changes resulting from changes in employee titles. |
| |
| Item 3. Audit Committee Financial Expert: |
| |
| The Funds’ Audit and Compliance Committee is comprised solely of Trustees who are “independent” (as such term has been defined by the Securities and Exchange Commission (“SEC”) in regulations implementing Section 407 of the Sarbanes-Oxley Act (the “Regulations”)). The Trustees believe that each of the members of the Audit and Compliance Committee also possess a combination of knowledge and experience with respect to financial accounting matters, as well as other attributes, that qualify them for service on the Committee. In addition, the Trustees have determined that each of Mr. Leibler, Mr. Hill, Mr. Darretta and Ms. Baumann qualifies as an “audit committee financial expert” (as such term has been defined by the Regulations) based on their review of his or her pertinent experience and education. The SEC has stated that the designation or identification of a person as an audit committee financial expert pursuant to this Item 3 of Form N-CSR does not impose on such person any duties, obligations or liability that are greater than the duties, obligations and liability imposed on such person as a member of the Audit and Compliance Committee and the Board of Trustees in the absence of such designation or identification. |
| |
| Item 4. Principal Accountant Fees and Services: |
| |
| The following table presents fees billed in each of the last two fiscal years for services rendered to the fund by the fund’s independent auditor: |
| | | | | |
| Fiscal year ended | Audit Fees | Audit-Related Fees | Tax Fees | All Other Fees |
|
|
| | | | | |
| August 31, 2012 | $42,810 | $-- | $4,100 | $ — |
| August 31, 2011 | $43,534 | $-- | $4,000 | $ — |
| |
| For the fiscal years ended August 31, 2012 and August 31, 2011, the fund’s independent auditor billed aggregate non-audit fees in the amounts of $4,100 and $4,000 respectively, to the fund, Putnam Management and any entity controlling, controlled by or under common control with Putnam Management that provides ongoing services to the fund. |
| |
| Audit Fees represent fees billed for the fund’s last two fiscal years relating to the audit and review of the financial statements included in annual reports and registration statements, and other services that are normally provided in connection with statutory and regulatory filings or engagements. |
| |
| Audit-Related Fees represent fees billed in the fund’s last two fiscal years for services traditionally performed by the fund’s auditor, including accounting consultation for proposed transactions or concerning financial accounting and reporting standards and other audit or attest services not required by statute or regulation. |
| |
| Tax Fees represent fees billed in the fund’s last two fiscal years for tax compliance, tax planning and tax advice services. Tax planning and tax advice services include assistance with tax audits, employee benefit plans and requests for rulings or technical advice from taxing authorities. |
| |
| Pre-Approval Policies of the Audit and Compliance Committee. The Audit and Compliance Committee of the Putnam funds has determined that, as a matter of policy, all work performed for the funds by the funds’ independent auditors will be pre-approved by the Committee itself and thus will generally not be subject to pre-approval procedures. |
| |
| The Audit and Compliance Committee also has adopted a policy to pre-approve the engagement by Putnam Management and certain of its affiliates of the funds’ independent auditors, even in circumstances where pre-approval is not required by applicable law. Any such requests by Putnam Management or certain of its affiliates are typically submitted in writing to the Committee and explain, among other things, the nature of the proposed engagement, the estimated fees, and why this work should be performed by that particular audit firm as opposed to another one. In reviewing such requests, the Committee considers, among other things, whether the provision of such services by the audit firm are compatible with the independence of the audit firm. |
| |
| The following table presents fees billed by the fund’s independent auditor for services required to be approved pursuant to paragraph (c)(7)(ii) of Rule 2-01 of Regulation S-X. |
| | | | | |
| Fiscal year ended | Audit-Related Fees | Tax Fees | All Other Fees | Total Non-Audit Fees |
|
|
| | | | | |
| August 31, 2012 | $ — | $ — | $ — | $ — |
| | | | | |
| August 31, 2011 | $ — | $ — | $ — | $ — |
| |
| Item 5. Audit Committee of Listed Registrants |
| |
| Item 6. Schedule of Investments: |
| |
| The registrant’s schedule of investments in unaffiliated issuers is included in the report to shareholders in Item 1 above. |
| |
| Item 7. Disclosure of Proxy Voting Policies and Procedures For Closed-End Management Investment Companies: |
| |
| Item 8. Portfolio Managers of Closed-End Investment Companies |
| |
| Item 9. Purchases of Equity Securities by Closed-End Management Investment Companies and Affiliated Purchasers: |
| |
| Item 10. Submission of Matters to a Vote of Security Holders: |
| |
| Item 11. Controls and Procedures: |
| |
| (a) The registrant’s principal executive officer and principal financial officer have concluded, based on their evaluation of the effectiveness of the design and operation of the registrant’s disclosure controls and procedures as of a date within 90 days of the filing date of this report, that the design and operation of such procedures are generally effective to provide reasonable assurance that information required to be disclosed by the registrant in this report is recorded, processed, summarized and reported within the time periods specified in the Commission’s rules and forms. |
| |
| (b) Changes in internal control over financial reporting: Not applicable |
| |
| (a)(1) The Code of Ethics of The Putnam Funds, which incorporates the Code of Ethics of Putnam Investments, is filed herewith. |
| |
| (a)(2) Separate certifications for the principal executive officer and principal financial officer of the registrant as required by Rule 30a-2(a) under the Investment Company Act of 1940, as amended, are filed herewith. |
| |
| (b) The certifications required by Rule 30a-2(b) under the Investment Company Act of 1940, as amended, are filed herewith. |
| |
| Pursuant to the requirements of the Securities Exchange Act of 1934 and the Investment Company Act of 1940, the registrant has duly caused this report to be signed on its behalf by the undersigned, thereunto duly authorized. |
| |
| Putnam Global Natural Resources Fund |
| |
| By (Signature and Title): |
| |
| /s/Janet C. Smith
Janet C. Smith
Principal Accounting Officer
|
| |
| Pursuant to the requirements of the Securities Exchange Act of 1934 and the Investment Company Act of 1940, this report has been signed below by the following persons on behalf of the registrant and in the capacities and on the dates indicated. |
| |
| By (Signature and Title): |
| |
| /s/Jonathan S. Horwitz
Jonathan S. Horwitz
Principal Executive Officer
|
| |
| By (Signature and Title): |
| |
| /s/Steven D. Krichmar
Steven D. Krichmar
Principal Financial Officer
|