| | |
| UNITED STATES
SECURITIES AND EXCHANGE COMMISSION |
| | |
| CERTIFIED SHAREHOLDER REPORT OF REGISTERED
MANAGEMENT INVESTMENT COMPANIES
|
| | |
| Investment Company Act file number: | (811- 03061) |
| | |
| Exact name of registrant as specified in charter: | Putnam Global Natural Resources Fund |
| | |
| Address of principal executive offices: | One Post Office Square, Boston, Massachusetts 02109 |
| | |
| Name and address of agent for service: | Robert T. Burns, Vice President
One Post Office Square
Boston, Massachusetts 02109 |
| | |
| Copy to: | John W. Gerstmayr, Esq.
Ropes & Gray LLP
800 Boylston Street
Boston, Massachusetts 02199-3600 |
| | |
| Registrant’s telephone number, including area code: | (617) 292-1000 |
| | |
| Date of fiscal year end: | August 31, 2013 |
| | |
| Date of reporting period : | September 1, 2012 — August 31, 2013 |
| | |
|
Item 1. Report to Stockholders: | |
| | |
| The following is a copy of the report transmitted to stockholders pursuant to Rule 30e-1 under the Investment Company Act of 1940: | |
Putnam
Global Natural
Resources Fund
Annual report
8 | 31 | 13
| | | |
| Message from the Trustees | 1 | | |
| | |
| About the fund | 2 | | |
| | |
| Performance snapshot | 4 | | |
| | |
| Interview with your fund’s portfolio managers | 5 | | |
| | |
| Your fund’s performance | 11 | | |
| | |
| Your fund’s expenses | 14 | | |
| | |
| Terms and definitions | 16 | | |
| | |
| Other information for shareholders | 17 | | |
| | |
| Important notice regarding Putnam’s privacy policy | 18 | | |
| | |
| Trustee approval of management contract | 19 | | |
| | |
| Financial statements | 24 | | |
| | |
| Federal tax information | 48 | | |
| | |
| About the Trustees | 49 | | |
| | |
| Officers | 51 | | |
| | |
Consider these risks before investing: International investing involves currency, economic, and political risks. Emerging-market securities carry illiquidity and volatility risks. Investments in small and/or midsize companies increase the risk of greater price fluctuations. The energy and other natural resources industries may be affected by changes in crude oil prices and changes in governmental regulatory policies. The fund concentrates on a limited group of industries and is non-diversified. Because the fund may invest in fewer issuers, it is vulnerable to common economic forces and may result in greater losses and volatility. Growth stocks may be more susceptible to earnings disappointments, and value stocks may fail to rebound. The use of short selling may result in losses if the securities appreciate in value. Risks associated with derivatives include increased investment exposure (which may be considered leverage) and, in the case of over-the-counter instruments, the potential inability to terminate or sell derivatives positions and the potential failure of the other party to the instrument to meet its obligations. Stock prices may fall or fail to rise over time for several reasons, including general financial market conditions and factors related to a specific issuer or industry. You can lose money by investing in the fund.
Message from the Trustees
Dear Fellow Shareholder:
Investors have been digesting a wide array of economic and geopolitical developments in recent months. While economic growth has continued despite the negative impact of the federal budget sequester, the Federal Reserve’s expected tapering of its $85 billion-a-month bond-buying program has prompted greater market volatility, and bond yields have risen substantially.
There is concern that the reduction of Fed purchases will cause long-term interest rates to move higher, running the risk of curtailing the recovery. Already, mortgage rates have jumped and housing market data appear less robust than earlier in the year. Overseas, instability in Egypt and Syria has contributed to higher oil prices, which could undermine the reasonably positive trends in consumer spending. Fortunately, the eurozone posted positive GDP growth in the second calendar quarter after many months of contraction, though the 17-nation currency bloc continues to grapple with significant economic challenges.
While we cannot forecast with precision how economic or geopolitical events will unfold over the coming months, we have confidence that a long-term investment program remains valuable. Putnam’s in-depth fundamental research, active investing, and risk management strategies can serve investors well through changing markets. To address a diverse range of financial goals, Putnam’s investment professionals integrate innovative thinking with traditional and alternative approaches.
We also believe in the importance of relying on the guidance of a professional advisor who can help you develop a financial plan suited to your goals and risk tolerance.
We would like to welcome new shareholders of the fund and to thank you for investing with Putnam. We would also like to extend our thanks to Elizabeth Kennan, who recently retired from the Board of Trustees, for her 20 years of dedicated service.

About the fund
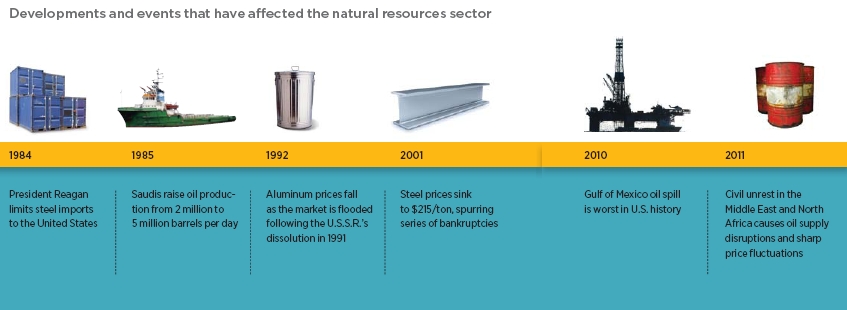
Investing in the natural resources sector for over 30 years
From the oil crisis of the 1970s to the more recent commodities boom, the balance of geopolitical stability, technological development, and economic growth has shaped natural resources markets.
For more than 30 years, Putnam Global Natural Resources Fund has sought to capitalize on that ever-changing balance by investing in stocks of companies that can profit from the global demand for natural resources.
The fund’s diversification sets it apart in two respects: First, its view of natural resources industries includes energy, metals and mining, paper, chemicals, and natural resource equipment and infrastructure companies; and second, it has a global scope. Stock prices in the natural resources sector rise and fall with supply and demand imbalances, so this strategy helps offset that volatility while enabling the fund’s managers to pursue a wider field of opportunities.
From chemicals, construction, and railroads to forest products and packaging, the portfolio managers consider stocks in a wide range of areas, with support from a team of analysts. Among the promising stocks the managers have targeted recently are those of fertilizer, seed, and agrochemical companies. These companies may offer strong growth potential as world population has increased, wealth has grown in emerging markets, and demand for high-protein food has risen along with a greater need for fertilizer that can make land and crops more productive.
Another benefit for investors is the fund’s flexible strategy, which allows the fund to own growth- or value-style stocks, as it seeks to deliver competitive returns no matter which style is in favor.
Sector investing at Putnam
In recent decades, innovation and business growth have propelled stocks in different industries to market-leading performance. Finding these stocks, many of which are in international markets, requires rigorous research and in-depth knowledge of global markets.
Putnam’s sector funds invest in nine sectors worldwide and offer active management, risk controls, and the expertise of dedicated sector analysts. The funds’ managers invest with flexibility and precision, using fundamental research to hand select stocks for the portfolios.
All sectors in one fund:
Putnam Global Sector Fund
A portfolio of individual Putnam Global Sector Funds that provides exposure to all sectors of the MSCI World Index.
Individual sector funds:
Global Consumer Fund
Retail, hotels, restaurants, media, food and beverages
Global Energy Fund
Oil and gas, energy equipment and services
Global Financials Fund
Commercial banks, insurance, diversified financial services, mortgage finance
Global Health Care Fund
Pharmaceuticals, biotechnology, health-care services
Global Industrials Fund
Airlines, railroads, trucking, aerospace and defense, construction, commercial services
Global Natural Resources Fund
Metals, chemicals, oil and gas, forest products
Global Technology Fund
Software, computers, Internet services
Global Telecommunications Fund
Diversified and wireless telecommunications services
Global Utilities Fund
Electric, gas, and water utilities
| | |
| 2 Global Natural Resources Fund | Global Natural Resources Fund 3 |
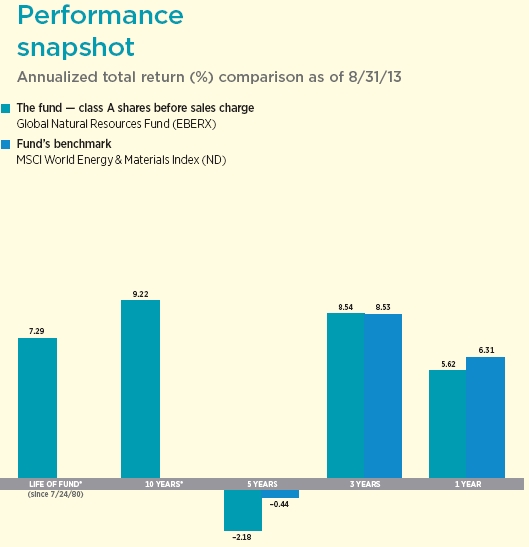
Current performance may be lower or higher than the quoted past performance, which cannot guarantee future results. Share price, principal value, and return will fluctuate, and you may have a gain or a loss when you sell your shares. Performance of class A shares assumes reinvestment of distributions and does not account for taxes. Fund returns in the bar chart do not reflect a sales charge of 5.75%; had they, returns would have been lower. See pages 5 and 11–13 for additional performance information. For a portion of the periods, the fund had expense limitations, without which returns would have been lower. To obtain the most recent month-end performance, visit putnam.com.
* The fund’s benchmark, the MSCI World Energy & Materials Index (ND), was introduced on 6/1/05, which post-dates the inception of the fund’s class A shares.
| |
| 4 Global Natural Resources Fund |
Interview with your fund’s portfolio managers

How did the fund perform for the 12 months ended August 31, 2013?
Steve: Putnam Global Natural Resources Fund returned 5.62% at net asset value, underperforming its benchmark, MSCI World Energy & Materials Index, which gained 6.31% for the annual period.
What was the global economic environment like for natural resources, and what effects did it have on the sector?
Chris: For most of the 12-month period, the commodity-price environment was fairly range-bound. The overarching theme during the period was that economies around the world were slowly improving, and this created a generally positive environment for natural resources stocks. While economies gradually mended, stock markets around the world continued to climb, but not without a measure of volatility. Central banks continued to provide stimulus to the world’s major economies, a move that helped alleviate some of the major macroeconomic concerns that had previously stymied markets. The 17-nation eurozone posted positive GDP growth in the second quarter of 2013 after six consecutive quarters of contraction. China managed to sidestep a “hard landing” in its economy, though the country’s appetite for materials stocks, notably copper and steel, has markedly diminished. The new prime minister of Japan and the central
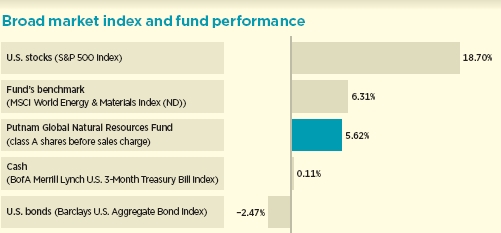
This comparison shows your fund’s performance in the context of broad market indexes for the 12 months ended 8/31/13. See pages 4 and 11–13 for additional fund performance information. Index descriptions can be found on page 16.
| |
| Global Natural Resources Fund 5 |
bank have been successful in stimulating the once-moribund economy.
Meanwhile, the U.S. economy has continued on a slow but steady growth path, though the unemployment rate remains elevated and other headwinds exist. At the end of the annual period, economies around the world sputtered and interest rates rose in reaction to the U.S. Federal Reserve’s anticipated plan to taper its stimulative monetary policy later in 2013 if the economy remained on its current growth path.
Steve: Within the energy portion of the portfolio, shares of companies involved in the growth of North American unconventional resources experienced strong returns during the past 12 months. In the past few years, the story was about discovering and acquiring gas and oil assets. During the 12-month period, the exploration and production [E&P] companies that delivered the strongest returns were those that could effectively develop gas and oil assets in the most efficient and productive manner. A second theme for the portfolio was that the larger integrated energy companies — such as Exxon Mobil and Royal Dutch Shell PLC — lagged as they experienced poor earnings results during the period.
How did geopolitical events affect the price of oil during the period?
Steve: In the spring of 2013, when the price of oil declined, we added to some E&P names that tend to benefit more from rising prices. However, toward the end of the period, as tensions in Syria began to rise, we sold down the positions to lock in profits. At the start of the period, the price of oil was at the higher end of our expected price band and that was mostly demand-driven due to an improving economy. Toward the end of the period, as the United States threatened to conduct air strikes in Syria, the price of oil increased again on fears that there would be supply

Allocations are shown as a percentage of the fund’s net assets as of 8/31/13. Short-term investments and net other assets, if any, represent the market value weights of cash, derivatives, short-term securities, and other unclassified assets in the portfolio. Summary information may differ from the information in the portfolio schedule notes included in the financial statements due to the inclusion of derivative securities, any interest accruals, and the exclusion of as-of trades, if any. Holdings and allocations may vary over time.
| |
| 6 Global Natural Resources Fund |
disruptions in the Middle East as the result of any U.S. military intervention. In addition, political tensions in Egypt represented a risk above and beyond the general area’s instability, as any disruption to the Suez Canal also could cause a supply shock for energy markets.
What were some of the contributors to the fund’s outperformance?
Steve: The top theme for performance during the period was with E&P companies that have high-quality unconventional resource assets in North America and those that provide services using drilling technologies such as hydraulic fracturing and horizontal drilling.
Cabot Oil & Gas, an overweight position for the fund relative to the benchmark and the top contributor for the period, fell into this category. Cabot has a “best-in-class” position in the Marcellus Shale, a shale gas play in the northeastern United States. Cabot has been able to drill wells that generally have been more productive, and to drill them more cheaply, during the period. We anticipate that Cabot will be drilling wells in the Marcellus for years to come. Noble Energy was another overweight and a leading contributor to relative performance, with a strong position in the Niobrara Shale in Colorado. Noble was able to efficiently exploit its shale resources, and its shares were rewarded as a result.
At period-end, we had exited our position in Noble. Halliburton, a leading oilfield services company, also helped performance. Halliburton shares appreciated and its profits
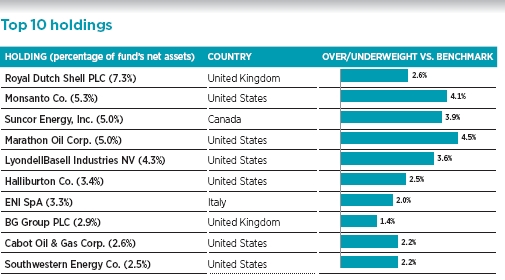
This table shows the fund’s top 10 holdings by percentage of the fund’s net assets as of 8/31/13. Short-term holdings and derivatives, if any, are excluded. Holdings may vary over time.
| |
| Global Natural Resources Fund 7 |
increased as its services, including hydraulic fracturing and horizontal drilling, were in demand during the period.
Another key contributor was the portfolio’s holding in LyondellBasell, a producer of commodity chemicals with a large percentage of the asset base in North America. The company has been one of the primary beneficiaries of the wide spread between global oil and U.S. natural gas prices, as the latter is the primary feedstock for LyondellBasell’s asset base. LyondellBasell has begun using its substantial free cash flow to benefit shareholders with multiple dividend raises and a meaningful share repurchase program, which helped drive its stock price higher.
What holdings detracted from relative performance?
Chris: Our out-of-benchmark position in Tronox was the top detractor. The company produces titanium dioxide, which is used as a building block for paints and other coatings. An inventory-correction cycle during the period hurt the company’s financial performance as the market overreacted to short-term fundamental factors. We believe fundamentals are back on more solid footing as demand has begun to grow once again, inventories have normalized, and the industry has begun consolidating. More recently, improving fundamentals have led to a more positive investor perception and a meaningful recovery in the share price. While we have substantially reduced the portfolio’s exposure to Tronox, we continue to hold shares, believing in the potential for incremental value creation.
Another detractor was the portfolio’s overweight position in Freeport-McMoRan. The company’s stock prices suffered as a result of its announced acquisition of two oil and gas exploration companies, Plains Exploration and McMoRan Exploration. The market saw
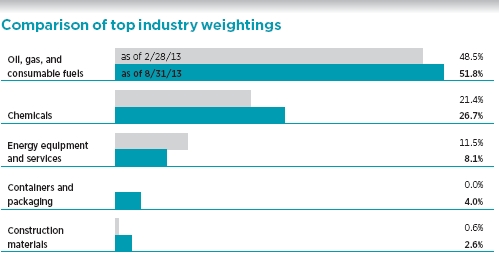
This chart shows how the fund’s top weightings have changed over the past six months. Allocations are represented as a percentage of the fund’s net assets. Current period summary information may differ from the portfolio schedule included in the financial statements due to the inclusion of derivative securities, any interest accruals, the exclusion of as-of trades, if any, and the use of different classifications of securities for presentation purposes. Holdings and allocations may vary over time.
| |
| 8 Global Natural Resources Fund |
the acquisitions as a drift from Freeport’s core strategy, and was concerned that copper production growth could slow. The company’s growth was also negatively affected during the period by a slowdown in copper demand from China. At period-end, we had exited our position in Freeport-McMoRan.
Steve: Another detractor was an overweight position in Royal Dutch Shell. Royal Dutch Shell suffered because it experienced poor financial results for a couple of quarters as a result of a number of factors. The company’s oil production from Nigeria was negatively affected due to civil unrest and oil thefts in the country. In North America, Shell has not been as successful in exploiting unconventional resources, and earnings in that business segment suffered.
How did the fund use derivatives during the period?
Chris: We used currency forwards to hedge portions of the portfolio’s foreign currency exposures. Currency forwards allow us to pursue fundamental-based investment strategies without taking on meaningful exchange-rate risk.
What is your outlook for the sector?
Steve: We are cautiously optimistic on the global economy, as there are signs of recovery taking place. We are not worried about emerging-market demand falling part. We believe that emerging markets could still be a positive driver for commodities going forward but at a slower pace than we have experienced for the past decade. We do feel that the sector as a whole will not have a tailwind of continually rising commodity prices, rather we expect that prices will be more range-bound. Growth in supply and in demand appear to be relatively well balanced. We believe that investors should be careful on the extremes — on both the low and the high sides of the price of oil. For the right companies that have the right resources and capabilities, the North American unconventional resource positions will continue to deliver much better growth over time, in our opinion.
Thank you, Steve and Chris, for your time and insights today.
The views expressed in this report are exclusively those of Putnam Management and are subject to change. They are not meant as investment advice.
Please note that the holdings discussed in this report may not have been held by the fund for the entire period. Portfolio composition is subject to review in accordance with the fund’s investment strategy and may vary in the future. Current and future portfolio holdings are subject to risk.
Portfolio Manager Steven W. Curbow has an M.B.A. from The University of Chicago Booth School of Business and a B.S. from the University of Southern California. Steven joined Putnam in 2008 and has been in the investment industry since 1996.
Portfolio Manager Christopher J. Eitzmann has an M.B.A. from the Tuck School of Business at Dartmouth College and an A.B. from Harvard University. Christopher joined Putnam in 2012 and has been in the investment industry since 2003.
| |
| Global Natural Resources Fund 9 |
IN THE NEWS
With the goal of updating the Dow Jones Industrial Average (DJIA) as an accurate gauge of the U.S. stock market, the committee that oversees the index has dropped three companies and added three new ones. Effective at the close of trading on September 20, 2013, Alcoa, Bank of America, and Hewlett-Packard were removed, replaced with Goldman Sachs, Nike, and Visa. It was the most significant change in nearly a decade for the iconic Dow, the bellwether index to which people commonly refer when they speak of the U.S. stock market. Low stock prices of Alcoa, Bank of America, and Hewlett-Packard triggered the removal of these names and enabled the DJIA committee to reflect the shift of the U.S. economy away from manufacturing and toward services. Unlike most newer indexes, which are weighted by market capitalization and track the performance of hundreds or even thousands of stocks, the Dow is a price-weighted average of only 30 companies, which, some argue, means the Dow is less representative of overall market health.
| |
| 10 Global Natural Resources Fund |
Your fund’s performance
This section shows your fund’s performance, price, and distribution information for periods ended August 31, 2013, the end of its most recent fiscal year. In accordance with regulatory requirements for mutual funds, we also include performance information as of the most recent calendar quarter-end and expense information taken from the fund’s current prospectus. Performance should always be considered in light of a fund’s investment strategy. Data represent past performance. Past performance does not guarantee future results. More recent returns may be less or more than those shown. Investment return and principal value will fluctuate, and you may have a gain or a loss when you sell your shares. Performance information does not reflect any deduction for taxes a shareholder may owe on fund distributions or on the redemption of fund shares. For the most recent month-end performance, please visit the Individual Investors section at putnam.com or call Putnam at 1-800-225-1581. Class R and class Y shares are not available to all investors. See the Terms and Definitions section in this report for definitions of the share classes offered by your fund.
Fund performance Total return for periods ended 8/31/13
| | | | | | | | | | |
| | Class A | Class B | Class C | Class M | Class R | Class Y |
| (inception dates) | (7/24/80) | (2/1/94) | (7/26/99) | (7/3/95) | (12/1/03) | (10/4/05) |
|
| | Before | After | | | | | Before | After | Net | Net |
| | sales | sales | Before | After | Before | After | sales | sales | asset | asset |
| | charge | charge | CDSC | CDSC | CDSC | CDSC | charge | charge | value | value |
|
| Annual average | | | | | | | | | | |
| (life of fund) | 7.29% | 7.10% | 6.42% | 6.42% | 6.49% | 6.49% | 6.69% | 6.57% | 7.03% | 7.36% |
|
| 10 years | 141.48 | 127.59 | 124.15 | 124.15 | 124.12 | 124.12 | 129.78 | 121.74 | 135.81 | 146.51 |
| Annual average | 9.22 | 8.57 | 8.41 | 8.41 | 8.40 | 8.40 | 8.68 | 8.29 | 8.96 | 9.44 |
|
| 5 years | –10.43 | –15.58 | –13.70 | –15.10 | –13.72 | –13.72 | –12.66 | –15.71 | –11.51 | –9.26 |
| Annual average | –2.18 | –3.33 | –2.90 | –3.22 | –2.91 | –2.91 | –2.67 | –3.36 | –2.42 | –1.92 |
|
| 3 years | 27.86 | 20.51 | 25.04 | 22.04 | 25.09 | 25.09 | 25.97 | 21.56 | 27.01 | 28.88 |
| Annual average | 8.54 | 6.42 | 7.73 | 6.87 | 7.75 | 7.75 | 8.00 | 6.73 | 8.30 | 8.83 |
|
| 1 year | 5.62 | –0.45 | 4.84 | –0.16 | 4.89 | 3.89 | 5.11 | 1.43 | 5.36 | 5.92 |
|
Current performance may be lower or higher than the quoted past performance, which cannot guarantee future results. After-sales-charge returns for class A and M shares reflect the deduction of the maximum 5.75% and 3.50% sales charge, respectively, levied at the time of purchase. Class B share returns after contingent deferred sales charge (CDSC) reflect the applicable CDSC, which is 5% in the first year, declining over time to 1% in the sixth year, and is eliminated thereafter. Class C share returns after CDSC reflect a 1% CDSC for the first year that is eliminated thereafter. Class R and Y shares have no initial sales charge or CDSC. Performance for class B, C, M, R, and Y shares before their inception is derived from the historical performance of class A shares, adjusted for the applicable sales charge (or CDSC) and the higher operating expenses for such shares, except for class Y shares, for which 12b-1 fees are not applicable.
For a portion of the periods, the fund had expense limitations, without which returns would have been lower.
Class B share performance does not reflect conversion to class A shares.
| |
| Global Natural Resources Fund 11 |
Comparative index returns For periods ended 8/31/13
| |
| | MSCI World Energy & Materials Index (ND) |
|
| Annual average (life of fund) | —* |
|
| 10 years | —* |
| Annual average | —* |
|
| 5 years | –2.17% |
| Annual average | –0.44 |
|
| 3 years | 27.84 |
| Annual average | 8.53 |
|
| 1 year | 6.31 |
|
Index results should be compared with fund performance before sales charge, before CDSC, or at net asset value.
* The fund’s benchmark, the MSCI World Energy & Materials Index (ND), was introduced on 6/1/05, which post-dates the inception of the fund’s class A shares.

* The fund’s benchmark, the MSCI World Energy & Materials Index (ND), was introduced on 6/1/05, which post-dates the inception of the fund’s class A shares.
Past performance does not indicate future results. At the end of the same time period, a $10,000 investment in the fund’s class B and class C shares would have been valued at $22,415 and $22,412, respectively, and no contingent deferred sales charges would apply. A $10,000 investment in the fund’s class M shares ($9,650 after sales charge) would have been valued at $22,174. A $10,000 investment in the fund’s class R and Y shares would have been valued at $23,581 and $24,651, respectively.
| |
| 12 Global Natural Resources Fund |
Fund price and distribution information For the 12-month period ended 8/31/13
| | | | | | |
| Distributions | Class A | Class B | Class C | Class M | Class R | Class Y |
|
| Number | 1 | 1 | 1 | 1 | 1 | 1 |
|
| Income | $0.166 | $0.018 | $0.024 | $0.060 | $0.117 | $0.219 |
|
| Capital gains | — | — | — | — | — | — |
|
| Total | $0.166 | $0.018 | $0.024 | $0.060 | $0.117 | $0.219 |
|
| | Before | After | Net | Net | Before | After | Net | Net |
| | sales | sales | asset | asset | sales | sales | asset | asset |
| Share value | charge | charge | value | value | charge | charge | value | value |
|
| 8/31/12 | $19.18 | $20.35 | $17.10 | $17.47 | $18.21 | $18.87 | $18.81 | $19.31 |
|
| 8/31/13 | 20.09 | 21.32 | 17.91 | 18.30 | 19.08 | 19.77 | 19.70 | 20.23 |
|
The classification of distributions, if any, is an estimate. Before-sales-charge share value and current dividend rate for class A and M shares, if applicable, do not take into account any sales charge levied at the time of purchase. After-sales-charge share value, current dividend rate, and current 30-day SEC yield, if applicable, are calculated assuming that the maximum sales charge (5.75% for class A shares and 3.50% for class M shares) was levied at the time of purchase. Final distribution information will appear on your year-end tax forms.
Fund performance as of most recent calendar quarter
Total return for periods ended 9/30/13
| | | | | | | | | | |
| | Class A | Class B | Class C | Class M | Class R | Class Y |
| (inception dates) | (7/24/80) | (2/1/94) | (7/26/99) | (7/3/95) | (12/1/03) | (10/4/05) |
|
| | Before | After | | | | | Before | After | Net | Net |
| | sales | sales | Before | After | Before | After | sales | sales | asset | asset |
| | charge | charge | CDSC | CDSC | CDSC | CDSC | charge | charge | value | value |
|
| Annual average | | | | | | | | | | |
| (life of fund) | 7.41% | 7.21% | 6.54% | 6.54% | 6.60% | 6.60% | 6.80% | 6.69% | 7.14% | 7.47% |
|
| 10 years | 158.33 | 143.47 | 139.73 | 139.73 | 139.69 | 139.69 | 145.76 | 137.16 | 152.22 | 163.64 |
| Annual average | 9.96 | 9.31 | 9.14 | 9.14 | 9.14 | 9.14 | 9.41 | 9.02 | 9.69 | 10.18 |
|
| 5 years | 18.83 | 12.00 | 14.50 | 12.65 | 14.48 | 14.48 | 15.90 | 11.85 | 17.41 | 20.32 |
| Annual average | 3.51 | 2.29 | 2.75 | 2.41 | 2.74 | 2.74 | 3.00 | 2.26 | 3.26 | 3.77 |
|
| 3 years | 18.13 | 11.34 | 15.52 | 12.52 | 15.47 | 15.47 | 16.33 | 12.25 | 17.26 | 19.00 |
| Annual average | 5.71 | 3.64 | 4.93 | 4.01 | 4.91 | 4.91 | 5.17 | 3.93 | 5.45 | 5.97 |
|
| 1 year | 6.37 | 0.26 | 5.65 | 0.65 | 5.62 | 4.62 | 5.86 | 2.15 | 6.13 | 6.61 |
|
See the discussion following the Fund performance table on page 11 for information about the calculation of fund performance.
| |
| Global Natural Resources Fund 13 |
Your fund’s expenses
As a mutual fund investor, you pay ongoing expenses, such as management fees, distribution fees (12b-1 fees), and other expenses. Using the following information, you can estimate how these expenses affect your investment and compare them with the expenses of other funds. You may also pay one-time transaction expenses, including sales charges (loads) and redemption fees, which are not shown in this section and would have resulted in higher total expenses. For more information, see your fund’s prospectus or talk to your financial representative.
Expense ratios
| | | | | | |
| | Class A | Class B | Class C | Class M | Class R | Class Y |
|
| Total annual operating expenses | | | | | | |
| for the fiscal year ended | | | | | | |
| 8/31/12* | 1.28% | 2.03% | 2.03% | 1.78% | 1.53% | 1.03% |
|
| Annualized expense ratio for | | | | | | |
| the six-month period ended | | | | | | |
| 8/31/13† | 1.21% | 1.96% | 1.96% | 1.71% | 1.46% | 0.96% |
|
Fiscal-year expense information in this table is taken from the most recent prospectus, is subject to change, and may differ from that shown for the annualized expense ratio and in the financial highlights of this report. Expenses are shown as a percentage of average net assets.
* Other expenses have been restated to reflect current fees.
† For the fund’s most recent fiscal half year; may differ from expense ratios based on one-year data in the financial highlights.
Expenses per $1,000
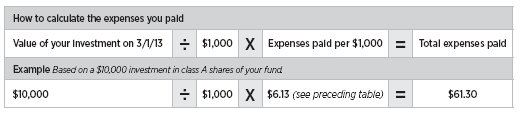
The following table shows the expenses you would have paid on a $1,000 investment in the fund from March 1, 2013, to August 31, 2013. It also shows how much a $1,000 investment would be worth at the close of the period, assuming actual returns and expenses.
| | | | | | |
| | Class A | Class B | Class C | Class M | Class R | Class Y |
|
| Expenses paid per $1,000*† | $6.13 | $9.91 | $9.91 | $8.65 | $7.39 | $4.87 |
|
| Ending value (after expenses) | $1,010.10 | $1,006.20 | $1,006.60 | $1,007.40 | $1,008.70 | $1,011.50 |
|
* Expenses for each share class are calculated using the fund’s annualized expense ratio for each class, which represents the ongoing expenses as a percentage of average net assets for the six months ended 8/31/13. The expense ratio may differ for each share class.
† Expenses are calculated by multiplying the expense ratio by the average account value for the period; then multiplying the result by the number of days in the period; and then dividing that result by the number of days in the year.
| |
| 14 Global Natural Resources Fund |
Estimate the expenses you paid
To estimate the ongoing expenses you paid for the six months ended August 31, 2013, use the following calculation method. To find the value of your investment on March 1, 2013, call Putnam at 1-800-225-1581.
Compare expenses using the SEC’s method
The Securities and Exchange Commission (SEC) has established guidelines to help investors assess fund expenses. Per these guidelines, the following table shows your fund’s expenses based on a $1,000 investment, assuming a hypothetical 5% annualized return. You can use this information to compare the ongoing expenses (but not transaction expenses or total costs) of investing in the fund with those of other funds. All mutual fund shareholder reports will provide this information to help you make this comparison. Please note that you cannot use this information to estimate your actual ending account balance and expenses paid during the period.
| | | | | | |
| | Class A | Class B | Class C | Class M | Class R | Class Y |
|
| Expenses paid per $1,000*† | $6.16 | $9.96 | $9.96 | $8.69 | $7.43 | $4.89 |
|
| Ending value (after expenses) | $1,019.11 | $1,015.32 | $1,015.32 | $1,016.59 | $1,017.85 | $1,020.37 |
|
* Expenses for each share class are calculated using the fund’s annualized expense ratio for each class, which represents the ongoing expenses as a percentage of average net assets for the six months ended 8/31/13. The expense ratio may differ for each share class.
† Expenses are calculated by multiplying the expense ratio by the average account value for the six-month period; then multiplying the result by the number of days in the six-month period; and then dividing that result by the number of days in the year.
| |
| Global Natural Resources Fund 15 |
Terms and definitions
Important terms
Total return shows how the value of the fund’s shares changed over time, assuming you held the shares through the entire period and reinvested all distributions in the fund.
Before sales charge, or net asset value, is the price, or value, of one share of a mutual fund, without a sales charge. Before-sales-charge figures fluctuate with market conditions, and are calculated by dividing the net assets of each class of shares by the number of outstanding shares in the class.
After sales charge is the price of a mutual fund share plus the maximum sales charge levied at the time of purchase. After-sales-charge performance figures shown here assume the 5.75% maximum sales charge for class A shares and 3.50% for class M shares.
Contingent deferred sales charge (CDSC) is generally a charge applied at the time of the redemption of class B or C shares and assumes redemption at the end of the period. Your fund’s class B CDSC declines over time from a 5% maximum during the first year to 1% during the sixth year. After the sixth year, the CDSC no longer applies. The CDSC for class C shares is 1% for one year after purchase.
Share classes
Class A shares are generally subject to an initial sales charge and no CDSC (except on certain redemptions of shares bought without an initial sales charge).
Class B shares are not subject to an initial sales charge. They may be subject to a CDSC.
Class C shares are not subject to an initial sales charge and are subject to a CDSC only if the shares are redeemed during the first year.
Class M shares have a lower initial sales charge and a higher 12b-1 fee than class A shares and no CDSC (except on certain redemptions of shares bought without an initial sales charge).
Class R shares are not subject to an initial sales charge or CDSC and are available only to certain defined contribution plans.
Class Y shares are not subject to an initial sales charge or CDSC, and carry no 12b-1 fee. They are generally only available to corporate and institutional clients and clients in other approved programs.
Comparative indexes
Barclays U.S. Aggregate Bond Index is an unmanaged index of U.S. investment-grade fixed-income securities.
BofA Merrill Lynch U.S. 3-Month Treasury Bill Index is an unmanaged index that seeks to measure the performance of U.S. Treasury bills available in the marketplace.
MSCI World Energy & Materials Index (ND) is a free float-adjusted market capitalization weighted index that is designed to measure the equity market performance of developed markets in the energy and materials sector.
S&P 500 Index is an unmanaged index of common stock performance.
Indexes assume reinvestment of all distributions and do not account for fees. Securities and performance of a fund and an index will differ. You cannot invest directly in an index.
| |
| 16 Global Natural Resources Fund |
Other information for shareholders
Proxy voting
Putnam is committed to managing our mutual funds in the best interests of our shareholders. The Putnam funds’ proxy voting guidelines and procedures, as well as information regarding how your fund voted proxies relating to portfolio securities during the 12-month period ended June 30, 2013, are available in the Individual Investors section of putnam.com, and on the Securities and Exchange Commission (SEC) website, www.sec.gov. If you have questions about finding forms on the SEC’s website, you may call the SEC at 1-800-SEC-0330. You may also obtain the Putnam funds’ proxy voting guidelines and procedures at no charge by calling Putnam’s Shareholder Services at 1-800-225-1581.
Fund portfolio holdings
The fund will file a complete schedule of its portfolio holdings with the SEC for the first and third quarters of each fiscal year on Form N-Q. Shareholders may obtain the fund’s Forms N-Q on the SEC’s website at www.sec.gov. In addition, the fund’s Forms N-Q may be reviewed and copied at the SEC’s Public Reference Room in Washington, D.C. You may call the SEC at 1-800-SEC-0330 for information about the SEC’s website or the operation of the Public Reference Room.
Trustee and employee fund ownership
Putnam employees and members of the Board of Trustees place their faith, confidence, and, most importantly, investment dollars in Putnam mutual funds. As of August 31, 2013, Putnam employees had approximately $387,000,000 and the Trustees had approximately $93,000,000 invested in Putnam mutual funds. These amounts include investments by the Trustees’ and employees’ immediate family members as well as investments through retirement and deferred compensation plans.
| |
| Global Natural Resources Fund 17 |
Important notice regarding Putnam’s privacy policy
In order to conduct business with our shareholders, we must obtain certain personal information such as account holders’ names, addresses, Social Security numbers, and dates of birth. Using this information, we are able to maintain accurate records of accounts and transactions.
It is our policy to protect the confidentiality of our shareholder information, whether or not a shareholder currently owns shares of our funds. In particular, it is our policy not to sell information about you or your accounts to outside marketing firms. We have safeguards in place designed to prevent unauthorized access to our computer systems and procedures to protect personal information from unauthorized use.
Under certain circumstances, we must share account information with outside vendors who provide services to us, such as mailings and proxy solicitations. In these cases, the service providers enter into confidentiality agreements with us, and we provide only the information necessary to process transactions and perform other services related to your account. Finally, it is our policy to share account information with your financial representative, if you’ve listed one on your Putnam account.
| |
| 18 Global Natural Resources Fund |
Trustee approval of management contract
General conclusions
The Board of Trustees of the Putnam funds oversees the management of each fund and, as required by law, determines annually whether to approve the continuance of your fund’s management contract with Putnam Investment Management (“Putnam Management”), the sub-management contract with respect to your fund between Putnam Management and its affiliate, Putnam Investments Limited (“PIL”), and the sub-advisory contract among Putnam Management, PIL, and another affiliate, The Putnam Advisory Company (“PAC”). The Board of Trustees, with the assistance of its Contract Committee, requests and evaluates all information it deems reasonably necessary under the circumstances in connection with its annual contract review. The Contract Committee consists solely of Trustees who are not “interested persons” (as this term is defined in the Investment Company Act of 1940, as amended (the “1940 Act”)) of the Putnam funds (“Independent Trustees”).
At the outset of the review process, members of the Board’s independent staff and independent legal counsel met with representatives of Putnam Management to review the annual contract review materials furnished to the Contract Committee during the course of the previous year’s review and to discuss possible changes in these materials that might be necessary or desirable for the coming year. Following these discussions and in consultation with the Contract Committee, the Independent Trustees’ independent legal counsel requested that Putnam Management furnish specified information, together with any additional information that Putnam Management considered relevant, to the Contract Committee. Over the course of several months ending in June 2013, the Contract Committee met on a number of occasions with representatives of Putnam Management, and separately in executive session, to consider the information that Putnam Management provided. Throughout this process, the Contract Committee was assisted by the members of the Board’s independent staff and by independent legal counsel for the Putnam funds and the Independent Trustees.
In May 2013, the Contract Committee met in executive session to discuss and consider its preliminary recommendations with respect to the continuance of the contracts. At the Trustees’ June 20, 2013 meeting, the Contract Committee met in executive session with the other Independent Trustees to review a summary of the key financial data that the Contract Committee considered in the course of its review. The Contract Committee then presented its written report, which summarized the key factors that the Committee had considered and set forth its final recommendations. The Contract Committee then recommended, and the Independent Trustees approved, the continuance of your fund’s management, sub-management and sub-advisory contracts, effective July 1, 2013, subject to certain changes in the sub-management and sub-advisory contracts noted below. (Because PIL and PAC are affiliates of Putnam Management and Putnam Management remains fully responsible for all services provided by PIL and PAC, the Trustees have not evaluated PIL or PAC as separate entities, and all subsequent references to Putnam Management below should be deemed to include reference to PIL and PAC as necessary or appropriate in the context.)
The Independent Trustees’ approval was based on the following conclusions:
• That the fee schedule in effect for your fund represented reasonable compensation in light of the nature and quality of the services being provided to the fund, the fees paid by competitive funds, and the costs incurred by
| |
| Global Natural Resources Fund 19 |
Putnam Management in providing services to the fund, and
• That the fee schedule represented an appropriate sharing between fund shareholders and Putnam Management of such economies of scale as may exist in the management of the fund at current asset levels.
These conclusions were based on a comprehensive consideration of all information provided to the Trustees and were not the result of any single factor. Some of the factors that figured particularly in the Trustees’ deliberations and how the Trustees considered these factors are described below, although individual Trustees may have evaluated the information presented differently, giving different weights to various factors. It is also important to recognize that the management arrangements for your fund and the other Putnam funds are the result of many years of review and discussion between the Independent Trustees and Putnam Management, that some aspects of the arrangements may receive greater scrutiny in some years than others, and that the Trustees’ conclusions may be based, in part, on their consideration of fee arrangements in previous years. For example, with some minor exceptions, the current fee arrangements in the management contracts for the Putnam funds were implemented at the beginning of 2010 following extensive review and discussion by the Trustees, as well as approval by shareholders.
As noted above, the Trustees considered certain administrative revisions to your fund’s sub-management and sub-advisory contracts. Putnam Management recommended that the sub-management contract be revised to reduce the sub-management fee that Putnam Management pays to PIL with respect to the portion of the portfolios of certain funds, but not your fund, that may be allocated to PIL from time to time. Putnam Management also recommended that the sub-advisory contract be revised to reflect the closure of PAC’s Tokyo office and the termination of PAC’s non-discretionary investment adviser’s license with respect to that office. The Independent Trustees’ approval of these recommendations was based on their conclusion that these changes would have no practical effect on Putnam Management’s continued responsibility for the management of these funds or the costs borne by fund shareholders and would not result in any reduction in the nature and quality of services provided to the funds.
Management fee schedules and total expenses
The Trustees reviewed the management fee schedules in effect for all Putnam funds, including fee levels and breakpoints. The Trustees also reviewed the total expenses of each Putnam fund, recognizing that in most cases management fees represented the major, but not the sole, determinant of total costs to shareholders.
In reviewing fees and expenses, the Trustees generally focus their attention on material changes in circumstances — for example, changes in assets under management, changes in a fund’s investment style, changes in Putnam Management’s operating costs or profitability, or changes in competitive practices in the mutual fund industry — that suggest that consideration of fee changes might be warranted. The Trustees concluded that the circumstances did not warrant changes to the management fee structure of your fund.
Under its management contract, your fund has the benefit of breakpoints in its management fee schedule that provide shareholders with economies of scale in the form of reduced fee levels as assets under management in the Putnam family of funds increase. The Trustees concluded that the fee schedule in effect for your fund represented an appropriate sharing of economies of scale between fund shareholders and Putnam Management.
|
| 20 Global Natural Resources Fund |
As in the past, the Trustees also focused on the competitiveness of each fund’s total expense ratio. In order to ensure that expenses of the Putnam funds continue to meet competitive standards, the Trustees and Putnam Management have implemented certain expense limitations. These expense limitations were: (i) a contractual expense limitation applicable to all retail open-end funds of 32 basis points on investor servicing fees and expenses and (ii) a contractual expense limitation applicable to all open-end funds of 20 basis points on so-called “other expenses” (i.e., all expenses exclusive of management fees, investor servicing fees, distribution fees, investment-related expenses, interest, taxes, brokerage commissions, extraordinary expenses and acquired fund fees and expenses). These expense limitations serve in particular to maintain competitive expense levels for funds with large numbers of small shareholder accounts and funds with relatively small net assets. Most funds had sufficiently low expenses that these expense limitations did not apply. However, in the case of your fund, the first of the expense limitations applied during its fiscal year ending in 2012. Putnam Management’s support for these expense limitations was an important factor in the Trustees’ decision to approve the continuance of your fund’s management, sub-management and sub-advisory contracts.
The Trustees reviewed comparative fee and expense information for a custom group of competitive funds selected by Lipper Inc. This comparative information included your fund’s percentile ranking for effective management fees and total expenses (excluding any applicable 12b-1 fee), which provides a general indication of your fund’s relative standing. In the custom peer group, your fund ranked in the 1st quintile in effective management fees (determined for your fund and the other funds in the custom peer group based on fund asset size and the applicable contractual management fee schedule) and in the 2nd quintile in total expenses (excluding any applicable 12b-1 fees) as of December 31, 2012 (the first quintile representing the least expensive funds and the fifth quintile the most expensive funds). The fee and expense data reported by Lipper as of December 31, 2012 reflected the most recent fiscal year-end data available in Lipper’s database at that time.
In connection with their review of the management fees and total expenses of the Putnam funds, the Trustees also reviewed the costs of the services provided and the profits realized by Putnam Management and its affiliates from their contractual relationships with the funds. This information included trends in revenues, expenses and profitability of Putnam Management and its affiliates relating to the investment management, investor servicing and distribution services provided to the funds. In this regard, the Trustees also reviewed an analysis of Putnam Management’s revenues, expenses and profitability, allocated on a fund-by-fund basis, with respect to the funds’ management, distribution, and investor servicing contracts. For each fund, the analysis presented information about revenues, expenses and profitability for each of the agreements separately and for the agreements taken together on a combined basis. The Trustees concluded that, at current asset levels, the fee schedules in place represented reasonable compensation for the services being provided and represented an appropriate sharing of such economies of scale as may exist in the management of the Putnam funds at that time.
The information examined by the Trustees as part of their annual contract review for the Putnam funds has included for many years information regarding fees charged by Putnam Management and its affiliates to institutional clients such as defined benefit pension plans, college endowments, and the like. This information included comparisons of those fees with fees charged to the funds, as well as an
| |
| Global Natural Resources Fund 21 |
assessment of the differences in the services provided to these different types of clients. The Trustees observed that the differences in fee rates between institutional clients and mutual funds are by no means uniform when examined by individual asset sectors, suggesting that differences in the pricing of investment management services to these types of clients may reflect historical competitive forces operating in separate markets. The Trustees considered the fact that in many cases fee rates across different asset classes are higher on average for mutual funds than for institutional clients, as well as the differences between the services that Putnam Management provides to the Putnam funds and those that it provides to its institutional clients. The Trustees did not rely on these comparisons to any significant extent in concluding that the management fees paid by your fund are reasonable.
Investment performance
The quality of the investment process provided by Putnam Management represented a major factor in the Trustees’ evaluation of the quality of services provided by Putnam Management under your fund’s management contract. The Trustees were assisted in their review of the Putnam funds’ investment process and performance by the work of the investment oversight committees of the Trustees, which meet on a regular basis with the funds’ portfolio teams and with the Chief Investment Officer and other senior members of Putnam Management’s Investment Division throughout the year. The Trustees concluded that Putnam Management generally provides a high-quality investment process — based on the experience and skills of the individuals assigned to the management of fund portfolios, the resources made available to them, and in general Putnam Management’s ability to attract and retain high-quality personnel — but also recognized that this does not guarantee favorable investment results for every fund in every time period.
The Trustees considered that 2012 was a year of strong competitive performance for many of the Putnam funds, with only a relatively small number of exceptions. They noted that this strong performance was exemplified by the fact that the Putnam funds were recognized by Barron’s as the best performing mutual fund complex for 2012 — the sec ond time in four years that Putnam Management has achieved this distinction for the Putnam funds. They also noted, however, the disappointing investment performance of some funds for periods ended December 31, 2012 and considered information provided by Putnam Management regarding the factors contributing to the underperformance and actions being taken to improve the performance of these particular funds. The Trustees indicated their intention to continue to monitor performance trends to assess the effectiveness of these efforts and to evaluate whether additional actions to address areas of underperformance are warranted.
For purposes of evaluating investment performance, the Trustees generally focus on competitive industry rankings for the one-year, three-year, and five-year periods. For a number of Putnam funds with relatively unique investment mandates, the Trustees evaluated performance based on comparisons of their absolute returns with the returns of selected investment benchmarks or targeted annualized returns. In the case of your fund, the Trustees considered information about the absolute return of your fund and your fund’s performance relative to its internal benchmark over the one-year, three-year and five-year periods ended December 31, 2012. Your fund’s class A shares’ return net of fees and expenses was positive over the one-year and three-year periods, was negative over the five-year period, and trailed the return of its benchmark over the one-year, three-year and five-year periods. The Trustees did not find any evidence of underperformance that would suggest a need for concern regarding the investment process
|
| 22 Global Natural Resources Fund |
for your fund. (When considering performance information, shareholders should be mindful that past performance is not a guarantee of future results.)
The Trustees also considered a number of other changes that Putnam Management had made in recent years in efforts to support and improve fund performance generally. These changes included Putnam Management’s efforts to increase accountability and to reduce complexity in the portfolio management process for the Putnam equity funds by moving generally from a portfolio management team structure to a decision-making process that vests full authority and responsibility with individual portfolio managers and by affirming its commitment to a fundamental-driven approach to investing. The Trustees noted that Putnam Management had also worked to strengthen its fundamental research capabilities by adding new investment personnel to the large-cap equities research team and by bringing U.S. and international research under common leadership. In addition, the Trustees recognized that Putnam Management has adjusted the compensation structure for portfolio managers and research analysts so that only those who achieve top-quartile returns over a rolling three-year basis are eligible for full bonuses.
Brokerage and soft-dollar allocations; investor servicing
The Trustees considered various potential benefits that Putnam Management may receive in connection with the services it provides under the management contract with your fund. These include benefits related to brokerage allocation and the use of soft dollars, whereby a portion of the commissions paid by a fund for brokerage may be used to acquire research services that are expected to be useful to Putnam Management in managing the assets of the fund and of other clients. Subject to policies established by the Trustees, soft dollars generated by these means are used primarily to acquire brokerage and research services that enhance Putnam Management’s investment capabilities and supplement Putnam Management’s internal research efforts. However, the Trustees noted that a portion of available soft dollars continues to be used to pay fund expenses. The Trustees indicated their continued intent to monitor regulatory and industry developments in this area with the assistance of their Brokerage Committee and also indicated their continued intent to monitor the allocation of the Putnam funds’ brokerage in order to ensure that the principle of seeking best price and execution remains paramount in the portfolio trading process.
Putnam Management may also receive benefits from payments that the funds make to Putnam Management’s affiliates for investor or distribution services. In conjunction with the annual review of your fund’s management, sub-management and sub-advisory contracts, the Trustees reviewed your fund’s investor servicing agreement with Putnam Investor Services, Inc. (“PSERV”) and its distributor’s contracts and distribution plans with Putnam Retail Management Limited Partnership (“PRM”), both of which are affiliates of Putnam Management. The Trustees concluded that the fees payable by the funds to PSERV and PRM, as applicable, for such services are reasonable in relation to the nature and quality of such services, the fees paid by competitive funds, and the costs incurred by PSERV and PRM, as applicable, in providing such services.
| |
| Global Natural Resources Fund 23 |
Financial statements
These sections of the report, as well as the accompanying Notes, preceded by the Report of Independent Registered Public Accounting Firm, constitute the fund’s financial statements.
The fund’s portfolio lists all the fund’s investments and their values as of the last day of the reporting period. Holdings are organized by asset type and industry sector, country, or state to show areas of concentration and diversification.
Statement of assets and liabilities shows how the fund’s net assets and share price are determined. All investment and non-investment assets are added together. Any unpaid expenses and other liabilities are subtracted from this total. The result is divided by the number of shares to determine the net asset value per share, which is calculated separately for each class of shares. (For funds with preferred shares, the amount subtracted from total assets includes the liquidation preference of preferred shares.)
Statement of operations shows the fund’s net investment gain or loss. This is done by first adding up all the fund’s earnings — from dividends and interest income — and subtracting its operating expenses to determine net investment income (or loss). Then, any net gain or loss the fund realized on the sales of its holdings — as well as any unrealized gains or losses over the period — is added to or subtracted from the net investment result to determine the fund’s net gain or loss for the fiscal year.
Statement of changes in net assets shows how the fund’s net assets were affected by the fund’s net investment gain or loss, by distributions to shareholders, and by changes in the number of the fund’s shares. It lists distributions and their sources (net investment income or realized capital gains) over the current reporting period and the most recent fiscal year-end. The distributions listed here may not match the sources listed in the Statement of operations because the distributions are determined on a tax basis and may be paid in a different period from the one in which they were earned.
Financial highlights provide an overview of the fund’s investment results, per-share distributions, expense ratios, net investment income ratios, and portfolio turnover in one summary table, reflecting the five most recent reporting periods. In a semiannual report, the highlights table also includes the current reporting period.
|
| 24 Global Natural Resources Fund |
Report of Independent Registered Public Accounting Firm
The Board of Trustees and Shareholders
Putnam Global Natural Resources Fund:
We have audited the accompanying statement of assets and liabilities of Putnam Global Natural Resources Fund (the fund), including the fund’s portfolio, as of August 31, 2013, and the related statement of operations for the year then ended, the statements of changes in net assets for each of the years in the two-year period then ended, and the financial highlights for each of the years in the five-year period then ended. These financial statements and financial highlights are the responsibility of the fund’s management. Our responsibility is to express an opinion on these financial statements and financial highlights based on our audits.
We conducted our audits in accordance with the standards of the Public Company Accounting Oversight Board (United States). Those standards require that we plan and perform the audit to obtain reasonable assurance about whether the financial statements and financial highlights are free of material misstatement. An audit includes examining, on a test basis, evidence supporting the amounts and disclosures in the financial statements. Our procedures included confirmation of securities owned as of August 31, 2013 by correspondence with the custodian and brokers or by other appropriate auditing procedures. An audit also includes assessing the accounting principles used and significant estimates made by management, as well as evaluating the overall financial statement presentation. We believe that our audits provide a reasonable basis for our opinion.
In our opinion, the financial statements and financial highlights referred to above present fairly, in all material respects, the financial position of Putnam Global Natural Resources Fund as of August 31, 2013, the results of its operations for the year then ended, the changes in its net assets for each of the years in the two-year period then ended, and the financial highlights for each of the years in the five-year period then ended, in conformity with U.S. generally accepted accounting principles.

Boston, Massachusetts
October 8, 2013
| |
| Global Natural Resources Fund 25 |
The fund’s portfolio 8/31/13
| | |
| COMMON STOCKS (99.3%)* | Shares | Value |
|
| Chemicals (26.8%) | | |
| Agrium, Inc. (Canada) | 78,700 | $6,732,052 |
|
| Albemarle Corp. | 48,300 | 3,012,471 |
|
| Arkema (France) | 46,035 | 4,652,600 |
|
| Celanese Corp. Ser. A | 87,600 | 4,313,424 |
|
| China BlueChemical, Ltd. (China) | 3,050,000 | 1,599,800 |
|
| Dow Chemical Co. (The) | 147,300 | 5,509,020 |
|
| Eastman Chemical Co. | 69,800 | 5,304,800 |
|
| Ecolab, Inc. | 68,600 | 6,266,610 |
|
| Huntsman Corp. | 127,500 | 2,231,250 |
|
| LyondellBasell Industries NV Class A | 191,317 | 13,420,888 |
|
| Marrone Bio Innovations, Inc. † | 32,000 | 420,800 |
|
| Methanex Corp. (Canada) | 89,700 | 4,170,153 |
|
| Monsanto Co. | 167,969 | 16,442,485 |
|
| Solvay SA (Belgium) | 35,253 | 4,910,810 |
|
| Tronox, Ltd. Class A | 234,755 | 5,014,367 |
|
| | | 84,001,530 |
| Construction materials (2.6%) | | |
| Holcim, Ltd. (Switzerland) | 73,475 | 4,986,777 |
|
| Martin Marietta Materials, Inc. | 32,300 | 3,102,415 |
|
| | | 8,089,192 |
| Containers and packaging (4.0%) | | |
| MeadWestvaco Corp. | 173,700 | 6,227,145 |
|
| Sealed Air Corp. | 223,600 | 6,350,240 |
|
| | | 12,577,385 |
| Energy equipment and services (8.1%) | | |
| Ezion Holdings, Ltd. (Singapore) | 2,175,000 | 3,851,320 |
|
| Halliburton Co. | 224,000 | 10,752,000 |
|
| McDermott International, Inc. † | 361,700 | 2,712,750 |
|
| Petrofac, Ltd. (United Kingdom) | 259,408 | 5,567,765 |
|
| Weatherford International, Ltd. † | 162,100 | 2,416,911 |
|
| | | 25,300,746 |
| Food products (0.5%) | | |
| S&W Seed Co. † | 177,012 | 1,474,510 |
|
| | | 1,474,510 |
| Metals and mining (2.4%) | | |
| Glencore Xstrata PLC (United Kingdom) | 1,558,785 | 7,372,563 |
|
| | | 7,372,563 |
| Oil, gas, and consumable fuels (51.8%) | | |
| Anadarko Petroleum Corp. | 66,600 | 6,088,572 |
|
| BG Group PLC (United Kingdom) | 472,492 | 8,984,352 |
|
| Cabot Oil & Gas Corp. | 204,600 | 8,005,998 |
|
| Cairn Energy PLC (United Kingdom) † | 1,006,162 | 4,248,955 |
|
| Cameco Corp. (Canada) | 173,800 | 3,308,355 |
|
| Canadian Natural Resources, Ltd. (Canada) | 204,100 | 6,227,831 |
|
| Chevron Corp. | 46,600 | 5,612,038 |
|
| Cobalt International Energy, Inc. † | 98,279 | 2,398,008 |
|
| Energen Corp. | 38,400 | 2,546,304 |
|
| Energy Transfer Equity LP | 50,100 | 3,222,933 |
|
| ENI SpA (Italy) | 453,265 | 10,351,716 |
|
|
| 26 Global Natural Resources Fund |
| | |
| COMMON STOCKS (99.3%)* cont. | Shares | Value |
|
| Oil, gas, and consumable fuels cont. | | |
| EOG Resources, Inc. | 34,500 | $5,418,225 |
|
| EXCO Resources, Inc. | 194,600 | 1,416,688 |
|
| Exxon Mobil Corp. | 53,538 | 4,666,372 |
|
| Genel Energy PLC (Jersey) † | 443,964 | 6,381,304 |
|
| Gulfport Energy Corp. † | 72,000 | 4,248,000 |
|
| HRT Participacoes em Petroleo SA (Brazil) † | 918,289 | 577,310 |
|
| Kodiak Oil & Gas Corp. † | 376,800 | 3,764,232 |
|
| Marathon Oil Corp. | 450,400 | 15,507,272 |
|
| Occidental Petroleum Corp. | 88,000 | 7,762,480 |
|
| QEP Resources, Inc. | 192,600 | 5,261,832 |
|
| Royal Dutch Shell PLC Class A (United Kingdom) | 702,758 | 22,734,219 |
|
| Southwestern Energy Co. † | 208,400 | 7,960,880 |
|
| Suncor Energy, Inc. (Canada) | 461,500 | 15,554,211 |
|
| | | 162,248,087 |
| Paper and forest products (2.1%) | | |
| International Paper Co. | 136,200 | 6,430,002 |
|
| | | 6,430,002 |
| Trading companies and distributors (1.0%) | | |
| Mitsubishi Corp. (Japan) | 174,100 | 3,248,500 |
|
| | | 3,248,500 |
| | | |
| Total common stocks (cost $296,339,510) | | $310,742,515 |
| |
|
| SHORT-TERM INVESTMENTS (0.4%)* | Principal amount/shares | Value |
|
| U.S. Treasury Bills with effective yields ranging from 0.10% | | |
| to 0.13%, May 29, 2014 ∆ | $240,000 | $239,857 |
|
| U.S. Treasury Bills with effective yields ranging from 0.10% | | |
| to 0.12%, May 1, 2014 ∆ | 234,000 | 233,883 |
|
| U.S. Treasury Bills with an effective yield of 0.12%, | | |
| March 6, 2014 | 9,000 | 8,997 |
|
| U.S. Treasury Bills with an effective yield of 0.10%, | | |
| April 3, 2014 ∆ | 241,000 | 240,904 |
|
| Putnam Short Term Investment Fund 0.07% L | 422,477 | 422,477 |
|
| SSgA Prime Money Market Fund 0.01% P | 100,000 | 100,000 |
|
| Total short-term investments (cost $1,245,943) | | $1,246,118 |
| |
|
| TOTAL INVESTMENTS | | |
|
| Total investments (cost $297,585,453) | | $311,988,633 |
Notes to the fund’s portfolio
Unless noted otherwise, the notes to the fund’s portfolio are for the close of the fund’s reporting period, which ran from September 1, 2012 through August 31, 2013 (the reporting period). Within the following notes to the portfolio, references to “ASC 820” represent Accounting Standards Codification 820 Fair Value Measurements and Disclosures and references to “OTC”, if any, represent over-the-counter.
* Percentages indicated are based on net assets of $313,033,087.
† Non-income-producing security.
∆ This security, in part or in entirety, was pledged and segregated with the custodian for collateral on certain derivative contracts at the close of the reporting period.
L Affiliated company (Note 5). The rate quoted in the security description is the annualized 7-day yield of the fund at the close of the reporting period.
| |
| Global Natural Resources Fund 27 |
P Security was pledged, or purchased with cash that was pledged, to the fund for collateral on certain derivatives contracts. The rate quoted in the security description is the annualized 7-day yield of the fund at the close of the reporting period (Note 1).
At the close of the reporting period, the fund maintained liquid assets totaling $778,541 to cover certain derivatives contracts.
|
| DIVERSIFICATION BY COUNTRY ⌂ |
|
Distribution of investments by country of risk at the close of the reporting period, excluding collateral received, if any (as a percentage of Portfolio Value):
| | | | |
| United States | 59.8% | | France | 1.5% |
| |
|
| United Kingdom | 15.7 | | Singapore | 1.2 |
| |
|
| Canada | 11.5 | | Japan | 1.0 |
| |
|
| Italy | 3.3 | | China | 0.5 |
| |
|
| Jersey | 2.1 | | Brazil | 0.2 |
| |
|
| Switzerland | 1.6 | | Total | 100.0% |
| | | |
| Belgium | 1.6 | | | |
| | |
⌂ Methodology differs from that used for purposes of complying with the fund’s policy regarding investments in securities of foreign issuers, as discussed further in the fund’s prospectus.
FORWARD CURRENCY CONTRACTS at 8/31/13 (aggregate face value $158,132,361)
| | | | | | |
| | | | | | | Unrealized |
| | | Contract | Delivery | | Aggregate | appreciation/ |
| Counterparty | Currency | type | date | Value | face value | (depreciation) |
|
| Bank of America N.A. | | | | | |
| | Australian Dollar | Buy | 10/18/13 | $2,303,667 | $2,340,114 | $(36,447) |
|
| | Australian Dollar | Sell | 10/18/13 | 2,303,667 | 2,382,620 | 78,953 |
|
| | British Pound | Buy | 9/18/13 | 647,085 | 640,085 | 7,000 |
|
| | British Pound | Sell | 9/18/13 | 647,085 | 637,019 | (10,066) |
|
| | Euro | Buy | 9/18/13 | 537,804 | 532,806 | 4,998 |
|
| | Euro | Sell | 9/18/13 | 537,804 | 539,265 | 1,461 |
|
| Barclays Bank PLC | | | | | |
| | Australian Dollar | Buy | 10/18/13 | 5,159,422 | 5,334,128 | (174,706) |
|
| | British Pound | Sell | 9/18/13 | 2,312,677 | 2,205,379 | (107,298) |
|
| | Canadian Dollar | Buy | 10/18/13 | 1,374,549 | 1,405,728 | (31,179) |
|
| | Canadian Dollar | Sell | 10/18/13 | 1,374,549 | 1,401,872 | 27,323 |
|
| | Euro | Buy | 9/18/13 | 3,803,222 | 3,769,738 | 33,484 |
|
| | Japanese Yen | Sell | 11/20/13 | 3,218,729 | 3,182,428 | (36,301) |
|
| | Singapore Dollar | Sell | 11/20/13 | 3,547,109 | 3,544,690 | (2,419) |
|
| | Swiss Franc | Buy | 9/18/13 | 683,827 | 645,332 | 38,495 |
|
| Citibank, N.A. | | | | | | |
| | Australian Dollar | Buy | 10/18/13 | 975,407 | 1,008,501 | (33,094) |
|
| | Australian Dollar | Sell | 10/18/13 | 975,407 | 990,784 | 15,377 |
|
| | British Pound | Buy | 9/18/13 | 1,850,452 | 1,830,565 | 19,887 |
|
| | British Pound | Sell | 9/18/13 | 1,850,452 | 1,821,649 | (28,803) |
|
| | Danish Krone | Buy | 9/18/13 | 555,964 | 550,659 | 5,305 |
|
| | Danish Krone | Sell | 9/18/13 | 555,964 | 557,269 | 1,305 |
|
| | Euro | Buy | 9/18/13 | 2,424,546 | 2,398,381 | 26,165 |
|
|
| 28 Global Natural Resources Fund |
FORWARD CURRENCY CONTRACTS at 8/31/13 (aggregate face value $158,132,361) cont.
| | | | | | |
| | | | | | Unrealized |
| | Contract | Delivery | | Aggregate | appreciation/ |
| Counterparty | Currency | type | date | Value | face value | (depreciation) |
|
| Credit Suisse International | | | | | | |
| Australian Dollar | Buy | 10/18/13 | $929,614 | $961,123 | $(31,509) |
|
| Australian Dollar | Sell | 10/18/13 | 929,614 | 944,416 | 14,802 |
|
| British Pound | Buy | 9/18/13 | 1,123,721 | 1,106,251 | 17,470 |
|
| British Pound | Sell | 9/18/13 | 1,123,721 | 1,111,956 | (11,765) |
|
| Canadian Dollar | Buy | 10/18/13 | 2,022,087 | 2,026,376 | (4,289) |
|
| Canadian Dollar | Sell | 10/18/13 | 2,022,087 | 2,058,506 | 36,419 |
|
| Euro | Buy | 9/18/13 | 1,352,374 | 1,356,016 | (3,642) |
|
| Euro | Sell | 9/18/13 | 1,352,374 | 1,340,044 | (12,330) |
|
| Japanese Yen | Buy | 11/20/13 | 14,183,528 | 14,016,183 | 167,345 |
|
| Norwegian Krone | Buy | 9/18/13 | 1,415,412 | 1,484,586 | (69,174) |
|
| Swiss Franc | Buy | 9/18/13 | 718,438 | 707,354 | 11,084 |
|
| Swiss Franc | Sell | 9/18/13 | 718,438 | 718,462 | 24 |
|
| Deutsche Bank AG | | | | | | |
| Australian Dollar | Buy | 10/18/13 | 1,595,119 | 1,620,374 | (25,255) |
|
| Australian Dollar | Sell | 10/18/13 | 1,595,119 | 1,649,258 | 54,139 |
|
| Canadian Dollar | Buy | 10/18/13 | 1,429,554 | 1,472,678 | (43,124) |
|
| Euro | Sell | 9/18/13 | 4,660,748 | 4,618,748 | (42,000) |
|
| Swedish Krona | Buy | 9/18/13 | 722,942 | 729,247 | (6,305) |
|
| Goldman Sachs International | | | | | | |
| Australian Dollar | Buy | 10/18/13 | 1,580,654 | 1,633,963 | (53,309) |
|
| Australian Dollar | Sell | 10/18/13 | 1,580,654 | 1,605,733 | 25,079 |
|
| HSBC Bank USA, National Association | | | | | |
| Australian Dollar | Buy | 10/18/13 | 8,221,246 | 8,500,463 | (279,217) |
|
| British Pound | Sell | 9/18/13 | 125,977 | 134,077 | 8,100 |
|
| Euro | Buy | 9/18/13 | 544,413 | 539,288 | 5,125 |
|
| Euro | Sell | 9/18/13 | 544,413 | 545,891 | 1,478 |
|
| JPMorgan Chase Bank N.A. | | | | | | |
| Australian Dollar | Buy | 10/18/13 | 970,082 | 1,014,996 | (44,914) |
|
| British Pound | Buy | 9/18/13 | 2,640,248 | 2,612,559 | 27,689 |
|
| British Pound | Sell | 9/18/13 | 2,640,248 | 2,601,255 | (38,993) |
|
| Canadian Dollar | Buy | 10/18/13 | 1,041,201 | 1,052,273 | (11,072) |
|
| Euro | Sell | 9/18/13 | 5,811,165 | 5,774,822 | (36,343) |
|
| Japanese Yen | Sell | 11/20/13 | 1,613,771 | 1,597,290 | (16,481) |
|
| Norwegian Krone | Buy | 9/18/13 | 2,418,772 | 2,537,036 | (118,264) |
|
| Swiss Franc | Buy | 9/18/13 | 433,922 | 403,157 | 30,765 |
|
| State Street Bank and Trust Co. | | | | | | |
| Australian Dollar | Buy | 10/18/13 | 1,287,082 | 1,307,416 | (20,334) |
|
| Australian Dollar | Sell | 10/18/13 | 1,287,082 | 1,330,476 | 43,394 |
|
| Euro | Buy | 9/18/13 | 14,751,744 | 14,762,466 | (10,722) |
|
| Israeli Shekel | Buy | 10/18/13 | 192,446 | 192,035 | 411 |
|
| Japanese Yen | Sell | 11/20/13 | 1,359,968 | 1,343,696 | (16,272) |
|
|
| Global Natural Resources Fund 29 |
FORWARD CURRENCY CONTRACTS at 8/31/13 (aggregate face value $158,132,361) cont.
| | | | | | |
| | | | | | | Unrealized |
| | | Contract | Delivery | | Aggregate | appreciation/ |
| Counterparty | Currency | type | date | Value | face value | (depreciation) |
|
| UBS AG | | | | | | |
| | Australian Dollar | Buy | 10/18/13 | $2,016,574 | $2,074,188 | $(57,614) |
|
| | British Pound | Sell | 9/18/13 | 1,016,028 | 991,812 | (24,216) |
|
| | Canadian Dollar | Sell | 10/18/13 | 5,888,919 | 5,907,790 | 18,871 |
|
| | Euro | Buy | 9/18/13 | 6,555,685 | 6,494,128 | 61,557 |
|
| | Swiss Franc | Buy | 9/18/13 | 2,973,283 | 2,947,868 | 25,415 |
|
| | Swiss Franc | Sell | 9/18/13 | 2,973,283 | 2,926,576 | (46,707) |
|
| WestPac Banking Corp. | | | | | |
| | Australian Dollar | Buy | 10/18/13 | 1,151,833 | 1,170,057 | (18,224) |
|
| | Australian Dollar | Sell | 10/18/13 | 1,151,833 | 1,190,914 | 39,081 |
|
| | British Pound | Sell | 9/18/13 | 2,997,570 | 2,965,115 | (32,455) |
|
| | Canadian Dollar | Buy | 10/18/13 | 1,298,111 | 1,300,251 | (2,140) |
|
| | Canadian Dollar | Sell | 10/18/13 | 1,298,111 | 1,327,553 | 29,442 |
|
| | Euro | Buy | 9/18/13 | 2,827,535 | 2,803,363 | 24,172 |
|
| | Japanese Yen | Sell | 11/20/13 | 914,058 | 903,264 | (10,794) |
|
| Total | | | | | | $(646,162) |
ASC 820 establishes a three-level hierarchy for disclosure of fair value measurements. The valuation hierarchy is based upon the transparency of inputs to the valuation of the fund’s investments. The three levels are defined as follows:
Level 1: Valuations based on quoted prices for identical securities in active markets.
Level 2: Valuations based on quoted prices in markets that are not active or for which all significant inputs are observable, either directly or indirectly.
Level 3: Valuations based on inputs that are unobservable and significant to the fair value measurement.
The following is a summary of the inputs used to value the fund’s net assets as of the close of the reporting period:
| | | |
| | | Valuation inputs | |
|
| Investments in securities: | Level 1 | Level 2 | Level 3 |
|
| Common stocks*: | | | |
|
| Consumer staples | $1,474,510 | $— | $— |
|
| Energy | 183,697,513 | 3,851,320 | — |
|
| Industrials | — | 3,248,500 | — |
|
| Materials | 116,870,872 | 1,599,800 | — |
|
| Total common stocks | 302,042,895 | 8,699,620 | — |
| | | | |
| Short-term investments | 522,477 | 723,641 | — |
|
| Totals by level | $302,565,372 | $9,423,261 | $— |
| | | | |
| | | Valuation inputs | |
|
| Other financial instruments: | Level 1 | Level 2 | Level 3 |
|
| Forward currency contracts | $— | $(646,162) | $— |
|
| Totals by level | $— | $(646,162) | $— |
* Common stock classifications are presented at the sector level, which may differ from the fund’s portfolio presentation.
The accompanying notes are an integral part of these financial statements.
|
| 30 Global Natural Resources Fund |
Statement of assets and liabilities 8/31/13
| |
| ASSETS | |
|
| Investment in securities, at value (Note 1): | |
| Unaffiliated issuers (identified cost $297,162,976) | $311,566,156 |
| Affiliated issuers (identified cost $422,477) (Notes 1 and 5) | 422,477 |
|
| Dividends, interest and other receivables | 935,786 |
|
| Receivable for shares of the fund sold | 257,240 |
|
| Receivable for investments sold | 8,342,953 |
|
| Unrealized appreciation on forward currency contracts (Note 1) | 901,615 |
|
| Total assets | 322,426,227 |
| |
| LIABILITIES | |
|
| Payable to custodian | 1,218,091 |
|
| Payable for investments purchased | 5,698,725 |
|
| Payable for shares of the fund repurchased | 215,355 |
|
| Payable for compensation of Manager (Note 2) | 168,911 |
|
| Payable for custodian fees (Note 2) | 5,886 |
|
| Payable for investor servicing fees (Note 2) | 110,646 |
|
| Payable for Trustee compensation and expenses (Note 2) | 109,200 |
|
| Payable for administrative services (Note 2) | 579 |
|
| Payable for distribution fees (Note 2) | 131,598 |
|
| Unrealized depreciation on forward currency contracts (Note 1) | 1,547,777 |
|
| Collateral on certain derivative contracts, at value (Note 1) | 100,000 |
|
| Other accrued expenses | 86,372 |
|
| Total liabilities | 9,393,140 |
| | |
| Net assets | $313,033,087 |
|
| |
| REPRESENTED BY | |
|
| Paid-in capital (Unlimited shares authorized) (Notes 1 and 4) | $394,197,751 |
|
| Accumulated net investment loss (Note 1) | (1,614,942) |
|
| Accumulated net realized loss on investments and foreign currency transactions (Note 1) | (93,295,252) |
|
| Net unrealized appreciation of investments and assets and liabilities in foreign currencies | 13,745,530 |
|
| Total — Representing net assets applicable to capital shares outstanding | $313,033,087 |
(Continued on next page)
| |
| Global Natural Resources Fund 31 |
Statement of assets and liabilities (Continued)
| |
| COMPUTATION OF NET ASSET VALUE AND OFFERING PRICE | |
|
| Net asset value and redemption price per class A share | |
| ($224,518,834 divided by 11,174,062 shares) | $20.09 |
|
| Offering price per class A share (100/94.25 of $20.09)* | $21.32 |
|
| Net asset value and offering price per class B share ($12,560,836 divided by 701,280 shares)** | $17.91 |
|
| Net asset value and offering price per class C share ($11,889,818 divided by 649,800 shares)** | $18.30 |
|
| Net asset value and redemption price per class M share ($3,872,667 divided by 202,949 shares) | $19.08 |
|
| Offering price per class M share (100/96.50 of $19.08)* | $19.77 |
|
| Net asset value, offering price and redemption price per class R share | |
| ($13,888,087 divided by 704,986 shares) | $19.70 |
|
| Net asset value, offering price and redemption price per class Y share | |
| ($46,302,845 divided by 2,289,208 shares) | $20.23 |
|
* On single retail sales of less than $50,000. On sales of $50,000 or more the offering price is reduced.
** Redemption price per share is equal to net asset value less any applicable contingent deferred sales charge.
The accompanying notes are an integral part of these financial statements.
|
| 32 Global Natural Resources Fund |
Statement of operations Year ended 8/31/13
| |
| INVESTMENT INCOME | |
|
| Dividends (net of foreign tax of $493,833) | $6,378,560 |
|
| Interest (including interest income of $2,656 from investments in affiliated issuers) (Note 5) | 4,626 |
|
| Securities lending (Note 1) | 4,350 |
|
| Total investment income | 6,387,536 |
| |
| EXPENSES | |
|
| Compensation of Manager (Note 2) | 1,959,049 |
|
| Investor servicing fees (Note 2) | 850,290 |
|
| Custodian fees (Note 2) | 27,386 |
|
| Trustee compensation and expenses (Note 2) | 28,682 |
|
| Distribution fees (Note 2) | 991,706 |
|
| Administrative services (Note 2) | 8,748 |
|
| Other | 156,257 |
|
| Total expenses | 4,022,118 |
| | |
| Expense reduction (Note 2) | (35,478) |
|
| Net expenses | 3,986,640 |
| | |
| Net investment income | 2,400,896 |
|
| |
| Net realized gain on investments (Notes 1 and 3) | 4,527,694 |
|
| Net realized loss on foreign currency transactions (Note 1) | (3,993,994) |
|
| Net realized gain on written options (Notes 1 and 3) | 65,234 |
|
| Net unrealized depreciation of assets and liabilities in foreign currencies during the year | (604,572) |
|
| Net unrealized appreciation of investments during the year | 16,443,932 |
|
| Net gain on investments | 16,438,294 |
| | |
| Net increase in net assets resulting from operations | $18,839,190 |
|
The accompanying notes are an integral part of these financial statements.
| |
| Global Natural Resources Fund 33 |
Statement of changes in net assets
| | |
| DECREASE IN NET ASSETS | Year ended 8/31/13 | Year ended 8/31/12 |
|
| Operations: | | |
| Net investment income | $2,400,896 | $3,829,246 |
|
| Net realized gain (loss) on investments | | |
| and foreign currency transactions | 598,934 | (28,544,267) |
|
| Net unrealized appreciation of investments and assets | | |
| and liabilities in foreign currencies | 15,839,360 | 3,915,178 |
|
| Net increase (decrease) in net assets resulting | | |
| from operations | 18,839,190 | (20,799,843) |
|
| Distributions to shareholders (Note 1): | | |
| From ordinary income | | |
| Net investment income | | |
|
| Class A | (2,144,610) | (8,268,152) |
|
| Class B | (14,844) | (421,959) |
|
| Class C | (17,596) | (334,299) |
|
| Class M | (15,020) | (141,190) |
|
| Class R | (83,705) | (410,298) |
|
| Class Y | (113,099) | (333,579) |
|
| Redemption fees (Note 1) | 8,174 | 72,188 |
|
| Decrease from capital share transactions (Note 4) | (24,094,817) | (43,804,045) |
|
| Total decrease in net assets | (7,636,327) | (74,441,177) |
| |
| NET ASSETS | | |
|
| Beginning of year | 320,669,414 | 395,110,591 |
|
| End of year (including accumulated net investment loss | | |
| of $1,614,942 and undistributed net investment income | | |
| of $2,465,974, respectively) | $313,033,087 | $320,669,414 |
|
The accompanying notes are an integral part of these financial statements.
|
| 34 Global Natural Resources Fund |
|
| This page left blank intentionally. |
| |
| Global Natural Resources Fund 35 |
Financial highlights (For a common share outstanding throughout the period)
| | | | | | | | | | | | | | | |
| INVESTMENT OPERATIONS: | | LESS DISTRIBUTIONS: | | RATIOS AND SUPPLEMENTAL DATA: |
|
| | | | | | | | | | | | | | | Ratio | |
| | Net asset | | Net realized | | | | | | | | | | Ratio | of net investment | |
| | value, | | and unrealized | Total from | From | From | | | | | Total return | Net assets, | of expenses | income (loss) | |
| | beginning | Net investment | gain (loss) | investment | net investment | net realized gain | Total | Redemption | Non-recurring | Net asset value, | at net asset | end of period | to average | to average | Portfolio |
| Period ended | of period | income (loss) a | on investments | operations | income | on investments | distributions | fees d | reimbursements | end of period | value (%) b | (in thousands) | net assets (%) c | net assets (%) | turnover (%) |
|
| Class A | | | | | | | | | | | | | | | |
| August 31, 2013 | $19.18 | .17 | .91 | 1.08 | (.17) | — | (.17) | — | — | $20.09 | 5.62 | $224,519 | 1.23 | .85 | 104 |
| August 31, 2012 | 20.81 | .23 | (1.30) | (1.07) | (.56) | — | (.56) | — | — | 19.18 | (5.08) | 262,969 | 1.29 | 1.18 | 80 |
| August 31, 2011 | 16.62 | .15 | 4.44 | 4.59 | (.40) | — | (.40) | — | — d,e | 20.81 | 27.53 | 322,408 | 1.26 | .66 | 90 |
| August 31, 2010 | 16.87 | .13 | (.18) | (.05) | (.20) | — | (.20) | — | — | 16.62 | (.44) | 284,668 | 1.39 | .71 | 107 |
| August 31, 2009 | 27.99 | .19 | (9.21) | (9.02) | — | (2.10) | (2.10) | — | — | 16.87 | (29.64) | 321,830 | 1.44 f,g | 1.22 g | 92 |
|
| Class B | | | | | | | | | | | | | | | |
| August 31, 2013 | $17.10 | .02 | .81 | .83 | (.02) | — | (.02) | — | — | $17.91 | 4.84 | $12,561 | 1.98 | .10 | 104 |
| August 31, 2012 | 18.58 | .08 | (1.16) | (1.08) | (.40) | — | (.40) | — | — | 17.10 | (5.78) | 15,561 | 2.04 | .46 | 80 |
| August 31, 2011 | 14.87 | (.02) | 3.99 | 3.97 | (.26) | — | (.26) | — | — d,e | 18.58 | 26.58 | 21,166 | 2.01 | (.10) | 90 |
| August 31, 2010 | 15.11 | (.01) | (.15) | (.16) | (.08) | — | (.08) | — | — | 14.87 | (1.15) | 21,418 | 2.14 | (.05) | 107 |
| August 31, 2009 | 25.66 | .06 | (8.51) | (8.45) | — | (2.10) | (2.10) | — | — | 15.11 | (30.18) | 30,849 | 2.19 f,g | .45 g | 92 |
|
| Class C | | | | | | | | | | | | | | | |
| August 31, 2013 | $17.47 | .02 | .83 | .85 | (.02) | — | (.02) | — | — | $18.30 | 4.89 | $11,890 | 1.98 | .10 | 104 |
| August 31, 2012 | 18.98 | .08 | (1.19) | (1.11) | (.40) | — | (.40) | — | — | 17.47 | (5.81) | 13,564 | 2.04 | .43 | 80 |
| August 31, 2011 | 15.20 | (.01) | 4.07 | 4.06 | (.28) | — | (.28) | — | — d,e | 18.98 | 26.61 | 16,797 | 2.01 | (.04) | 90 |
| August 31, 2010 | 15.47 | (.01) | (.16) | (.17) | (.10) | — | (.10) | — | — | 15.20 | (1.21) | 13,292 | 2.14 | (.04) | 107 |
| August 31, 2009 | 26.18 | .07 | (8.68) | (8.61) | — | (2.10) | (2.10) | — | — | 15.47 | (30.18) | 14,156 | 2.19 f,g | .47 g | 92 |
|
| Class M | | | | | | | | | | | | | | | |
| August 31, 2013 | $18.21 | .06 | .87 | .93 | (.06) | — | (.06) | — | — | $19.08 | 5.11 | $3,873 | 1.73 | .34 | 104 |
| August 31, 2012 | 19.77 | .13 | (1.23) | (1.10) | (.46) | — | (.46) | — | — | 18.21 | (5.53) | 4,999 | 1.79 | .70 | 80 |
| August 31, 2011 | 15.82 | .03 | 4.23 | 4.26 | (.31) | — | (.31) | — | — d,e | 19.77 | 26.86 | 6,233 | 1.76 | .17 | 90 |
| August 31, 2010 | 16.08 | .04 | (.17) | (.13) | (.13) | — | (.13) | — | — | 15.82 | (.91) | 5,141 | 1.89 | .20 | 107 |
| August 31, 2009 | 27.00 | .11 | (8.93) | (8.82) | — | (2.10) | (2.10) | — | — | 16.08 | (30.03) | 5,609 | 1.94 f,g | .73 g | 92 |
|
| Class R | | | | | | | | | | | | | | | |
| August 31, 2013 | $18.81 | .12 | .89 | 1.01 | (.12) | — | (.12) | — | — | $19.70 | 5.36 | $13,888 | 1.48 | .60 | 104 |
| August 31, 2012 | 20.41 | .18 | (1.27) | (1.09) | (.51) | — | (.51) | — | — | 18.81 | (5.28) | 13,838 | 1.54 | .94 | 80 |
| August 31, 2011 | 16.31 | .10 | 4.36 | 4.46 | (.36) | — | (.36) | — | — d,e | 20.41 | 27.27 | 16,971 | 1.51 | .46 | 90 |
| August 31, 2010 | 16.58 | .09 | (.19) | (.10) | (.17) | — | (.17) | — | — | 16.31 | (.72) | 11,192 | 1.64 | .48 | 107 |
| August 31, 2009 | 27.64 | .15 | (9.11) | (8.96) | — | (2.10) | (2.10) | — | — | 16.58 | (29.82) | 9,966 | 1.69 f,g | 1.00 g | 92 |
|
| Class Y | | | | | | | | | | | | | | | |
| August 31, 2013 | $19.31 | .21 | .93 | 1.14 | (.22) | — | (.22) | — | — | $20.23 | 5.92 | $46,303 | .98 | 1.01 | 104 |
| August 31, 2012 | 20.96 | .28 | (1.31) | (1.03) | (.62) | — | (.62) | — | — | 19.31 | (4.85) | 9,739 | 1.04 | 1.44 | 80 |
| August 31, 2011 | 16.73 | .21 | 4.47 | 4.68 | (.45) | — | (.45) | — | — d,e | 20.96 | 27.89 | 11,535 | 1.01 | .94 | 90 |
| August 31, 2010 | 16.97 | .18 | (.18) | — d | (.24) | — | (.24) | — | — | 16.73 | (.16) | 9,069 | 1.14 | .95 | 107 |
| August 31, 2009 | 28.07 | .23 | (9.23) | (9.00) | — | (2.10) | (2.10) | — | — | 16.97 | (29.47) | 11,052 | 1.19 f,g | 1.48 g | 92 |
|
See notes to financial highlights at the end of this section.
The accompanying notes are an integral part of these financial statements.
| | |
| 36 Global Natural Resources Fund | Global Natural Resources Fund 37 |
Financial highlights (Continued)
a Per share net investment income (loss) has been determined on the basis of the weighted average number of shares outstanding during the period.
b Total return assumes dividend reinvestment and does not reflect the effect of sales charges.
c Includes amounts paid through expense offset and brokerage/service arrangements (Note 2).
d Amount represents less than $0.01 per share.
e Reflects a non-recurring reimbursement related to restitution amounts in connection with a distribution plan approved by the Securities and Exchange Commission (the SEC) which amounted to less than $0.01 per share outstanding on July 21, 2011. Also reflects a non-recurring reimbursement related to short-term trading related lawsuits, which amounted to less than $0.01 per share outstanding on May 11, 2011.
f Includes interest accrued in connection with certain terminated derivatives contracts, which amounted to 0.01% of average net assets for the period ended August 31, 2009.
g Reflects an involuntary contractual expense limitation and/or waivers of certain fund expenses in connection with investments in Putnam Prime Money Market Fund in effect during the period. As a result of such limitation and/ or waivers, the expenses of each class reflect a reduction of 0.05% of average net assets for the period ended August 31, 2009.
The accompanying notes are an integral part of these financial statements.
|
| 38 Global Natural Resources Fund |
Notes to financial statements 8/31/13
Within the following Notes to financial statements, references to “State Street” represent State Street Bank and Trust Company, references to “the SEC” represent the Securities and Exchange Commission, references to “Putnam Management” represent Putnam Investment Management, LLC, the fund’s manager, an indirect wholly-owned subsidiary of Putnam Investments, LLC and references to “OTC”, if any, represent over-the-counter. Unless otherwise noted, the “reporting period” represents the period from September 1, 2012 through August 31, 2013.
Putnam Global Natural Resources Fund (the fund) is a Massachusetts business trust, which is registered under the Investment Company Act of 1940, as amended, as a non-diversified, open-end management investment company. The investment objective of the fund is to seek capital appreciation by concentrating in the energy and other natural resources industries. The fund invests mainly in common stocks (growth or value stocks or both) of large and midsize companies worldwide that Putnam Management believes have favorable investment potential. Potential investments include companies in the discovery, development, production or distribution of energy or other natural resources, in the development of technologies for the production or efficient use of energy and other natural resources, and in furnishing of related supplies or services. The fund may purchase stocks of companies with stock prices that reflect a value lower than that which Putnam Management places on the company. Putnam Management also considers other factors that it believes will cause the stock price to rise. Putnam Management may consider, among other factors, a company’s valuation, financial strength, growth potential, competitive position in its industry, projected future earnings, cash flows and dividends when deciding whether to buy or sell investments.
The fund offers class A, class B, class C, class M, class R and class Y shares. Class A and class M shares are sold with a maximum front-end sales charge of 5.75% and 3.50%, respectively, and generally do not pay a contingent deferred sales charge. Class B shares, which convert to class A shares after approximately eight years, do not pay a front-end sales charge and are subject to a contingent deferred sales charge if those shares are redeemed within six years of purchase. Class C shares have a one-year 1.00% contingent deferred sales charge and do not convert to class A shares. Class R shares, which are not available to all investors, are sold at net asset value. The expenses for class A, class B, class C, class M and class R shares may differ based on the distribution fee of each class, which is identified in Note 2. Class Y shares, which are sold at net asset value, are generally subject to the same expenses as class A, class B, class C, class M and class R shares, but do not bear a distribution fee. Class Y shares are not available to all investors.
In the normal course of business, the fund enters into contracts that may include agreements to indemnify another party under given circumstances. The fund’s maximum exposure under these arrangements is unknown as this would involve future claims that may be, but have not yet been, made against the fund. However, the fund’s management team expects the risk of material loss to be remote.
Note 1: Significant accounting policies
The following is a summary of significant accounting policies consistently followed by the fund in the preparation of its financial statements. The preparation of financial statements is in conformity with accounting principles generally accepted in the United States of America and requires management to make estimates and assumptions that affect the reported amounts of assets and liabilities in the financial statements and the reported amounts of increases and decreases in net assets from operations. Actual results could differ from those estimates. Subsequent events after the Statement of assets and liabilities date through the date that the financial statements were issued have been evaluated in the preparation of the financial statements.
A short-term trading fee of 1.00% may have applied to redemptions (including exchanges into another fund) of shares purchased before January 2, 2013 and held for 90 days or less. The short-term trading fee was accounted for as an addition to paid-in-capital. No short-term trading fee applies to shares purchased on or after January 2, 2013.
Investment income, realized and unrealized gains and losses and expenses of the fund are borne pro-rata based on the relative net assets of each class to the total net assets of the fund, except that each class bears expenses unique to that class (including the distribution fees applicable to such classes). Each class votes as a class only with respect to its own distribution plan or other matters on which a class vote is required by law or determined by the Trustees. If the fund were liquidated, shares of each class would receive their pro-rata share of the net assets of the fund. In addition, the Trustees declare separate dividends on each class of shares.
Security valuation Investments for which market quotations are readily available are valued at the last reported sales price on their principal exchange, or official closing price for certain markets, and are classified as Level 1 securities under Accounting Standards Codification 820 Fair Value Measurements and Disclosures (ASC 820). If no
|
| Global Natural Resources Fund 39 |
sales are reported, as in the case of some securities that are traded OTC, a security is valued at its last reported bid price and is generally categorized as a Level 2 security.
Investments in open-end investment companies (excluding exchange traded funds), if any, which can be classified as Level 1 or Level 2 securities, are valued based on their net asset value. The net asset value of such investment companies equals the total value of their assets less their liabilities and divided by the number of their outstanding shares.
Many securities markets and exchanges outside the U.S. close prior to the close of the New York Stock Exchange and therefore the closing prices for securities in such markets or on such exchanges may not fully reflect events that occur after such close but before the close of the New York Stock Exchange. Accordingly, on certain days, the fund will fair value foreign equity securities taking into account multiple factors including movements in the U.S. securities markets, currency valuations and comparisons to the valuation of American Depository Receipts, exchange-traded funds and futures contracts. These securities, which would generally be classified as Level 1 securities, will be transferred to Level 2 of the fair value hierarchy when they are valued at fair value. The number of days on which fair value prices will be used will depend on market activity and it is possible that fair value prices will be used by the fund to a significant extent. At the close of the reporting period, fair value pricing was used for certain foreign securities in the portfolio. Securities quoted in foreign currencies, if any, are translated into U.S. dollars at the current exchange rate.
To the extent a pricing service or dealer is unable to value a security or provides a valuation that Putnam Management does not believe accurately reflects the security’s fair value, the security will be valued at fair value by Putnam Management in accordance with policies and procedures approved by the Trustees. Certain investments, including certain restricted and illiquid securities and derivatives, are also valued at fair value following procedures approved by the Trustees. These valuations consider such factors as significant market or specific security events such as interest rate or credit quality changes, various relationships with other securities, discount rates, U.S. Treasury, U.S. swap and credit yields, index levels, convexity exposures and recovery rates. These securities are classified as Level 2 or as Level 3 depending on the priority of the significant inputs.
Such valuations and procedures are reviewed periodically by the Trustees. The fair value of securities is generally determined as the amount that the fund could reasonably expect to realize from an orderly disposition of such securities over a reasonable period of time. By its nature, a fair value price is a good faith estimate of the value of a security in a current sale and does not reflect an actual market price, which may be different by a material amount.
Security transactions and related investment income Security transactions are recorded on the trade date (the date the order to buy or sell is executed). Gains or losses on securities sold are determined on the identified cost basis.
Interest income, net of any applicable withholding taxes, is recorded on the accrual basis. Dividend income, net of any applicable withholding taxes, is recognized on the ex-dividend date except that certain dividends from foreign securities, if any, are recognized as soon as the fund is informed of the ex-dividend date. Non-cash dividends, if any, are recorded at the fair market value of the securities received. Dividends representing a return of capital or capital gains, if any, are reflected as a reduction of cost and/or as a realized gain.
All premiums/discounts are amortized/accreted on a yield-to-maturity basis.
Foreign currency translation The accounting records of the fund are maintained in U.S. dollars. The market value of foreign securities, currency holdings, and other assets and liabilities is recorded in the books and records of the fund after translation to U.S. dollars based on the exchange rates on that day. The cost of each security is determined using historical exchange rates. Income and withholding taxes are translated at prevailing exchange rates when earned or incurred. The fund does not isolate that portion of realized or unrealized gains or losses resulting from changes in the foreign exchange rate on investments from fluctuations arising from changes in the market prices of the securities. Such gains and losses are included with the net realized and unrealized gain or loss on investments. Net realized gains and losses on foreign currency transactions represent net realized exchange gains or losses on closed forward currency contracts, disposition of foreign currencies, currency gains and losses realized between the trade and settlement dates on securities transactions and the difference between the amount of investment income and foreign withholding taxes recorded on the fund’s books and the U.S. dollar equivalent amounts actually received or paid. Net unrealized appreciation and depreciation of assets and liabilities in foreign currencies arise from changes in the value of open forward currency contracts and assets and liabilities other than investments at the period end, resulting from changes in the exchange rate.
Options contracts The fund uses options contracts to hedge against changes in values of securities it owns, owned or expects to own and to enhance the return on securities owned.
|
| 40 Global Natural Resources Fund |
The potential risk to the fund is that the change in value of options contracts may not correspond to the change in value of the hedged instruments. In addition, losses may arise from changes in the value of the underlying instruments if there is an illiquid secondary market for the contracts, if interest or exchange rates move unexpectedly or if the counterparty to the contract is unable to perform. Realized gains and losses on purchased options are included in realized gains and losses on investment securities. If a written call option is exercised, the premium originally received is recorded as an addition to sales proceeds. If a written put option is exercised, the premium originally received is recorded as a reduction to the cost of investments.
Exchange traded options are valued at the last sale price or, if no sales are reported, the last bid price for purchased options and the last ask price for written options. OTC traded options are valued using prices supplied by dealers. Forward premium swap option contracts include premiums that do not settle until the expiration date of the contract. The delayed settlement of the premiums are factored into the daily valuation of the option contracts.
Written option contracts outstanding at period end, if any, are listed after the fund’s portfolio.
Forward currency contracts The fund buys and sells forward currency contracts, which are agreements between two parties to buy and sell currencies at a set price on a future date. These contracts are used to hedge foreign exchange risk.
The U.S. dollar value of forward currency contracts is determined using current forward currency exchange rates supplied by a quotation service. The market value of the contract will fluctuate with changes in currency exchange rates. The contract is marked to market daily and the change in market value is recorded as an unrealized gain or loss. The fund records a realized gain or loss equal to the difference between the value of the contract at the time it was opened and the value at the time it was closed when the contract matures or by delivery of the currency. The fund could be exposed to risk if the value of the currency changes unfavorably, if the counterparties to the contracts are unable to meet the terms of their contracts or if the fund is unable to enter into a closing position. Risks may exceed amounts recognized on the Statement of assets and liabilities.
Forward currency contracts outstanding at period end, if any, are listed after the fund’s portfolio.
Master agreements The fund is a party to ISDA (International Swaps and Derivatives Association, Inc.) Master Agreements (Master Agreements) with certain counterparties that govern OTC derivative and foreign exchange contracts entered into from time to time. The Master Agreements may contain provisions regarding, among other things, the parties’ general obligations, representations, agreements, collateral requirements, events of default and early termination. With respect to certain counterparties, in accordance with the terms of the Master Agreements, collateral posted to the fund is held in a segregated account by the fund’s custodian and with respect to those amounts which can be sold or repledged, are presented in the fund’s portfolio. Collateral posted to the fund which cannot be sold or repledged totaled $554,753 at the close of the reporting period.
Collateral pledged by the fund is segregated by the fund’s custodian and identified in the fund’s portfolio. Collateral can be in the form of cash or debt securities issued by the U.S. Government or related agencies or other securities as agreed to by the fund and the applicable counterparty. Collateral requirements are determined based on the fund’s net position with each counterparty.
Termination events applicable to the fund may occur upon a decline in the fund’s net assets below a specified threshold over a certain period of time. Termination events applicable to counterparties may occur upon a decline in the counterparty’s long-term and short-term credit ratings below a specified level. In each case, upon occurrence, the other party may elect to terminate early and cause settlement of all derivative and foreign exchange contracts outstanding, including the payment of any losses and costs resulting from such early termination, as reasonably determined by the terminating party. Any decision by one or more of the fund’s counterparties to elect early termination could impact the fund’s future derivative activity.
At the close of the reporting period, the fund had a net liability position of $841,720 on open derivative contracts subject to the Master Agreements. Collateral posted by the fund for these agreements totaled $649,645.
Securities lending The fund may lend securities, through its agent, to qualified borrowers in order to earn additional income. The loans are collateralized by cash in an amount at least equal to the market value of the securities loaned. The market value of securities loaned is determined daily and any additional required collateral is allocated to the fund on the next business day. The risk of borrower default will be borne by the fund’s agent; the fund will bear the risk of loss with respect to the investment of the cash collateral. Income from securities lending is included in investment income on the Statement of operations. Cash collateral is invested in Putnam Cash Collateral Pool, LLC, a limited liability company managed by an affiliate of Putnam Management. Investments in Putnam Cash Collateral
| |
| Global Natural Resources Fund 41 |
Pool, LLC are valued at its closing net asset value each business day. There are no management fees charged to Putnam Cash Collateral Pool, LLC. At the close of the reporting period, the fund had no securities out on loan.
Interfund lending The fund, along with other Putnam funds, may participate in an interfund lending program pursuant to an exemptive order issued by the SEC. This program allows the fund to borrow from or lend to other Putnam funds that permit such transactions. Interfund lending transactions are subject to each fund’s investment policies and borrowing and lending limits. Interest earned or paid on the interfund lending transaction will be based on the average of certain current market rates. During the reporting period, the fund did not utilize the program.
Line of credit The fund participates, along with other Putnam funds, in a $315 million unsecured committed line of credit and a $185 million unsecured uncommitted line of credit, both provided by State Street. Borrowings may be made for temporary or emergency purposes, including the funding of shareholder redemption requests and trade settlements. Interest is charged to the fund based on the fund’s borrowing at a rate equal to the Federal Funds rate plus 1.25% for the committed line of credit and the Federal Funds rate plus 1.30% for the uncommitted line of credit. A closing fee equal to 0.02% of the committed line of credit and $50,000 for the uncommitted line of credit has been paid by the participating funds. In addition, a commitment fee of 0.11% per annum on any unutilized portion of the committed line of credit is allocated to the participating funds based on their relative net assets and paid quarterly. During the reporting period, the fund had no borrowings against these arrangements.
Federal taxes It is the policy of the fund to distribute all of its taxable income within the prescribed time period and otherwise comply with the provisions of the Internal Revenue Code of 1986, as amended (the Code), applicable to regulated investment companies. It is also the intention of the fund to distribute an amount sufficient to avoid imposition of any excise tax under Section 4982 of the Code.
The fund is subject to the provisions of Accounting Standards Codification 740 Income Taxes (ASC 740). ASC 740 sets forth a minimum threshold for financial statement recognition of the benefit of a tax position taken or expected to be taken in a tax return. The fund did not have a liability to record for any unrecognized tax benefits in the accompanying financial statements. No provision has been made for federal taxes on income, capital gains or unrealized appreciation on securities held nor for excise tax on income and capital gains. Each of the fund’s federal tax returns for the prior three fiscal years remains subject to examination by the Internal Revenue Service.
The fund may also be subject to taxes imposed by governments of countries in which it invests. Such taxes are generally based on either income or gains earned or repatriated. The fund accrues and applies such taxes to net investment income, net realized gains and net unrealized gains as income and/or capital gains are earned. In some cases, the fund may be entitled to reclaim all or a portion of such taxes, and such reclaim amounts, if any, are reflected as an asset on the fund’s books. In many cases, however, the fund may not receive such amounts for an extended period of time, depending on the country of investment.
At August 31, 2013, the fund had a capital loss carryover of $93,268,579 available to the extent allowed by the Code to offset future net capital gain, if any. The amounts of the carryovers and the expiration dates are:
| | | |
| | Loss carryover | | |
|
| Short-term | Long-term | Total | Expiration |
|
| $19,836,371 | $2,883,598 | $22,719,969 | * |
|
| 70,548,610 | N/A | 70,548,610 | August 31, 2018 |
|
* Under the Regulated Investment Company Modernization Act of 2010, the fund will be permitted to carry forward capital losses incurred in taxable years beginning after December 22, 2010 for an unlimited period. However, any losses incurred will be required to be utilized prior to the losses incurred in pre-enactment tax years. As a result of this ordering rule, pre-enactment capital loss carryforwards may be more likely to expire unused. Additionally, post-enactment capital losses that are carried forward will retain their character as either short-term or long-term capital losses rather than being considered all short-term as under previous law.
Distributions to shareholders Distributions to shareholders from net investment income are recorded by the fund on the ex-dividend date. Distributions from capital gains, if any, are recorded on the ex-dividend date and paid at least annually. The amount and character of income and gains to be distributed are determined in accordance with income tax regulations, which may differ from generally accepted accounting principles. These differences include temporary and/or permanent differences from foreign currency gains and losses, late year loss deferrals, realized gains and losses on passive foreign investment companies and partnership income. Reclassifications are made to the fund’s capital accounts to reflect income and gains available for distribution (or available capital loss
|
| 42 Global Natural Resources Fund |
carryovers) under income tax regulations. For the reporting period ended, the fund reclassified $4,092,938 to decrease undistributed net investment income, $4,249 to decrease paid in capital and $4,097,187 to decrease accumulated net realized loss.
The tax basis components of distributable earnings and the federal tax cost as of the close of the reporting period were as follows:
| |
| Unrealized appreciation | $28,118,662 |
| Unrealized depreciation | (13,742,155) |
|
| Net unrealized appreciation | $14,376,507 |
| Capital loss carryforward | (93,268,579) |
| Late year ordinary loss deferral | (2,264,010) |
| Cost for federal income tax purposes | $297,612,126 |
Pursuant to federal income tax regulations applicable to regulated investment companies, the fund has elected to defer $2,036,626 of late year ordinary losses ((i) ordinary losses recognized during the period between January 1, 2013 and August 31, 2013, and (ii) specified ordinary losses recognized during the period between November 1, 2012 and August 31, 2013), to its fiscal year ending August 31, 2014.
Note 2: Management fee, administrative services and other transactions
The fund pays Putnam Management a management fee (based on the fund’s average net assets and computed and paid monthly) at annual rates that may vary based on the average of the aggregate net assets of most open-end funds, as defined in the fund’s management contract, sponsored by Putnam Management. Such annual rates may vary as follows:
| | | | |
| 0.780% | of the first $5 billion, | | 0.580% | of the next $50 billion, |
| |
|
| 0.730% | of the next $5 billion, | | 0.560% | of the next $50 billion, |
| |
|
| 0.680% | of the next $10 billion, | | 0.550% | of the next $100 billion and |
| |
|
| 0.630% | of the next $10 billion, | | 0.545% | of any excess thereafter. |
| |
|
Putnam Management has contractually agreed, through June 30, 2014, to waive fees or reimburse the fund’s expenses to the extent necessary to limit the cumulative expenses of the fund, exclusive of brokerage, interest, taxes, investment-related expenses, extraordinary expenses, acquired fund fees and expenses and payments under the fund’s investor servicing contract, investment management contract and distribution plans, on a fiscal year-to-date basis to an annual rate of 0.20% of the fund’s average net assets over such fiscal year-to-date period. During the reporting period, the fund’s expenses were not reduced as a result of this limit.
Putnam Investments Limited (PIL), an affiliate of Putnam Management, is authorized by the Trustees to manage a separate portion of the assets of the fund as determined by Putnam Management from time to time. Putnam Management pays a quarterly sub-management fee to PIL for its services at an annual rate of 0.35% of the average net assets of the portion of the fund managed by PIL.
The Putnam Advisory Company, LLC (PAC), an affiliate of Putnam Management, is authorized by the Trustees to manage a separate portion of the assets of the fund, as designated from time to time by Putnam Management or PIL. Putnam Management or PIL, as applicable, pays a quarterly sub-advisory fee to PAC for its services at the annual rate of 0.35% of the average net assets of the portion of the fund’s assets for which PAC is engaged as sub-adviser.
The fund reimburses Putnam Management an allocated amount for the compensation and related expenses of certain officers of the fund and their staff who provide administrative services to the fund. The aggregate amount of all such reimbursements is determined annually by the Trustees.
Custodial functions for the fund’s assets are provided by State Street. Custody fees are based on the fund’s asset level, the number of its security holdings and transaction volumes.
Putnam Investor Services, Inc., an affiliate of Putnam Management, provides investor servicing agent functions to the fund. Putnam Investor Services, Inc. received fees for investor servicing based on the fund’s retail asset level, the number of shareholder accounts in the fund and the level of defined contribution plan assets in the fund.
|
| Global Natural Resources Fund 43 |
Investor servicing fees will not exceed an annual rate of 0.32% of the fund’s average net assets. During the reporting period, the expenses for each class of shares related to investor servicing fees were as follows:
| | | | |
| Class A | $682,152 | | Class R | 38,058 |
| |
|
| Class B | 38,688 | | Class Y | 43,670 |
| |
|
| Class C | 35,405 | | Total | $850,290 |
| |
|
| Class M | 12,317 | | | |
| | |
The fund has entered into expense offset arrangements with Putnam Investor Services, Inc. and State Street whereby Putnam Investor Services, Inc.’s and State Street’s fees are reduced by credits allowed on cash balances. The fund also reduced expenses through brokerage/service arrangements. For the reporting period, the fund’s expenses were reduced by $491 under the expense offset arrangements and by $34,987 under the brokerage/ service arrangements.
Each independent Trustee of the fund receives an annual Trustee fee, of which $198, as a quarterly retainer, has been allocated to the fund, and an additional fee for each Trustees meeting attended. Trustees also are reimbursed for expenses they incur relating to their services as Trustees.
The fund has adopted a Trustee Fee Deferral Plan (the Deferral Plan) which allows the Trustees to defer the receipt of all or a portion of Trustees fees payable on or after July 1, 1995. The deferred fees remain invested in certain Putnam funds until distribution in accordance with the Deferral Plan.
The fund has adopted an unfunded noncontributory defined benefit pension plan (the Pension Plan) covering all Trustees of the fund who have served as a Trustee for at least five years and were first elected prior to 2004. Benefits under the Pension Plan are equal to 50% of the Trustee’s average annual attendance and retainer fees for the three years ended December 31, 2005. The retirement benefit is payable during a Trustee’s lifetime, beginning the year following retirement, for the number of years of service through December 31, 2006. Pension expense for the fund is included in Trustee compensation and expenses in the Statement of operations. Accrued pension liability is included in Payable for Trustee compensation and expenses in the Statement of assets and liabilities. The Trustees have terminated the Pension Plan with respect to any Trustee first elected after 2003.
The fund has adopted distribution plans (the Plans) with respect to its class A, class B, class C, class M and class R shares pursuant to Rule 12b–1 under the Investment Company Act of 1940. The purpose of the Plans is to compensate Putnam Retail Management Limited Partnership, an indirect wholly-owned subsidiary of Putnam Investments, LLC, for services provided and expenses incurred in distributing shares of the fund. The Plans provide for payments by the fund to Putnam Retail Management Limited Partnership at an annual rate of up to 0.35%, 1.00%, 1.00%, 1.00% and 1.00% of the average net assets attributable to class A, class B, class C, class M and class R shares, respectively. The Trustees have approved payment by the fund at an annual rate of 0.25%, 1.00%, 1.00%, 0.75% and 0.50% of the average net assets attributable to class A, class B, class C, class M and class R shares, respectively. During the reporting period, the class specific expenses related to distribution fees were as follows:
| | | | |
| Class A | $619,597 | | Class M | 33,528 |
| |
|
| Class B | 140,575 | | Class R | 69,313 |
| |
|
| Class C | 128,693 | | Total | $991,706 |
| |
|
For the reporting period, Putnam Retail Management Limited Partnership, acting as underwriter, received net commissions of $24,383 and $368 from the sale of class A and class M shares, respectively, and received $9,999 and $125 in contingent deferred sales charges from redemptions of class B and class C shares, respectively.
A deferred sales charge of up to 1.00% and 0.65% is assessed on certain redemptions of class A and class M shares, respectively. For the reporting period, Putnam Retail Management Limited Partnership, acting as underwriter, received $150 and no monies on class A and class M redemptions, respectively.
Note 3: Purchases and sales of securities
During the reporting period, cost of purchases and proceeds from sales of investment securities other than short-term investments aggregated $314,976,025 and $337,062,297, respectively. There were no purchases or proceeds from sales of long-term U.S. government securities.
|
| 44 Global Natural Resources Fund |
Written option transactions during the reporting period are summarized as follows:
| | |
| | Written equity option | Written equity |
| | contract amounts | option premiums |
|
| Written options outstanding at the | | |
| beginning of the reporting period | — | $— |
|
| Options opened | 786,897 | 100,514 |
| Options exercised | — | — |
| Options expired | (98,669) | (11,840) |
| Options closed | (688,228) | (88,674) |
|
| Written options outstanding at the | | |
| end of the reporting period | — | $— |
|
Note 4: Capital shares
At the close of the reporting period, there was an unlimited number of shares of beneficial interest authorized. Transactions in capital shares were as follows:
| | | | |
| | Year ended 8/31/13 | Year ended 8/31/12 |
|
| Class A | Shares | Amount | Shares | Amount |
|
| Shares sold | 709,762 | $14,224,586 | 1,074,480 | $21,053,603 |
|
| Shares issued in connection with | | | | |
| reinvestment of distributions | 102,422 | 2,031,024 | 410,386 | 7,698,843 |
|
| | 812,184 | 16,255,610 | 1,484,866 | 28,752,446 |
|
| Shares repurchased | (3,349,537) | (66,747,099) | (3,267,327) | (63,084,064) |
|
| Net decrease | (2,537,353) | $(50,491,489) | (1,782,461) | $(34,331,618) |
|
| |
| | Year ended 8/31/13 | Year ended 8/31/12 |
|
| Class B | Shares | Amount | Shares | Amount |
|
| Shares sold | 92,317 | $1,643,783 | 100,613 | $1,743,636 |
|
| Shares issued in connection with | | | | |
| reinvestment of distributions | 800 | 14,217 | 23,545 | 395,796 |
|
| | 93,117 | 1,658,000 | 124,158 | 2,139,432 |
|
| Shares repurchased | (301,862) | (5,352,264) | (353,282) | (6,191,623) |
|
| Net decrease | (208,745) | $(3,694,264) | (229,124) | $(4,052,191) |
|
| |
| | Year ended 8/31/13 | Year ended 8/31/12 |
|
| Class C | Shares | Amount | Shares | Amount |
|
| Shares sold | 57,620 | $1,046,683 | 94,306 | $1,681,237 |
|
| Shares issued in connection with | | | | |
| reinvestment of distributions | 888 | 16,117 | 17,594 | 302,267 |
|
| | 58,508 | 1,062,800 | 111,900 | 1,983,504 |
|
| Shares repurchased | (185,014) | (3,360,789) | (220,612) | (3,855,893) |
|
| Net decrease | (126,506) | $(2,297,989) | (108,712) | $(1,872,389) |
|
|
| Global Natural Resources Fund 45 |
| | | | |
| | Year ended 8/31/13 | Year ended 8/31/12 |
|
| Class M | Shares | Amount | Shares | Amount |
|
| Shares sold | 11,357 | $213,636 | 23,328 | $426,955 |
|
| Shares issued in connection with | | | | |
| reinvestment of distributions | 787 | 14,866 | 7,514 | 134,284 |
|
| | 12,144 | 228,502 | 30,842 | 561,239 |
|
| Shares repurchased | (83,711) | (1,585,696) | (71,537) | (1,304,773) |
|
| Net decrease | (71,567) | $(1,357,194) | (40,695) | $(743,534) |
|
| |
| | Year ended 8/31/13 | Year ended 8/31/12 |
|
| Class R | Shares | Amount | Shares | Amount |
|
| Shares sold | 221,311 | $4,320,916 | 269,810 | $5,134,098 |
|
| Shares issued in connection with | | | | |
| reinvestment of distributions | 4,161 | 81,008 | 21,812 | 402,004 |
|
| | 225,472 | 4,401,924 | 291,622 | 5,536,102 |
|
| Shares repurchased | (256,335) | (5,005,439) | (387,216) | (7,413,233) |
|
| Net decrease | (30,863) | $(603,515) | (95,594) | $(1,877,131) |
|
| |
| | Year ended 8/31/13 | Year ended 8/31/12 |
|
| Class Y | Shares | Amount | Shares | Amount |
|
| Shares sold | 1,987,627 | $38,431,057 | 61,110 | $1,208,361 |
|
| Shares issued in connection with | | | | |
| reinvestment of distributions | 5,454 | 108,639 | 16,962 | 319,910 |
|
| | 1,993,081 | 38,539,696 | 78,072 | 1,528,271 |
|
| Shares repurchased | (208,231) | (4,190,062) | (124,135) | (2,455,453) |
|
| Net increase (decrease) | 1,784,850 | $34,349,634 | (46,063) | $(927,182) |
|
Note 5: Transactions with affiliated issuers
Transactions during the reporting period with Putnam Money Market Liquidity Fund and Putnam Short Term Investment Fund, which are under common ownership or control, were as follows:
| | | | | |
| | Market value at | | | | Market value |
| | the beginning | | | | at the end of |
| | of the reporting | | | Investment | the reporting |
| Name of affiliate | period | Purchase cost | Sale proceeds | income | period |
|
| Putnam Money Market | | | | | |
| Liquidity Fund* | $6,486,362 | $47,373,434 | $53,859,796 | $1,549 | $— |
|
| Putnam Short Term | | | | | |
| Investment Fund* | — | 102,054,854 | 101,632,377 | 1,107 | 422,477 |
|
| Totals | $6,486,362 | $149,428,288 | $155,492,173 | $2,656 | $422,477 |
|
* Management fees charged to Putnam Money Market Liquidity Fund and Putnam Short Term Investment Fund have been waived by Putnam Management.
|
| 46 Global Natural Resources Fund |
Note 6: Market, credit and other risks
In the normal course of business, the fund trades financial instruments and enters into financial transactions where risk of potential loss exists due to changes in the market (market risk) or failure of the contracting party to the transaction to perform (credit risk). The fund may be exposed to additional credit risk that an institution or other entity with which the fund has unsettled or open transactions will default. Investments in foreign securities involve certain risks, including those related to economic instability, unfavorable political developments, and currency fluctuations. The fund concentrates its investments in one sector, which involves more risk than a fund that invests more broadly.
Note 7: Summary of derivative activity
The average volume of activity for the reporting period for any derivative type that was held during the period is listed below and was as follows:
| |
| Purchased equity option contracts (number of contracts) | 110,000 |
|
| Written equity option contracts (number of contracts) | 110,000 |
|
| Forward currency contracts (contract amount) | $174,500,000 |
|
The following is a summary of the market values of derivative instruments as of the close of the reporting period:
Market values of derivative instruments as of the close of the reporting period
| | | | |
| | Asset derivatives | Liability derivatives |
|
| Derivatives not | | | | |
| accounted for as | Statement of | | Statement of | |
| hedging instruments | assets and | | assets and | |
| under ASC 815 | liabilities location | Market value | liabilities location | Market value |
|
| Foreign exchange | | | | |
| contracts | Receivables | $901,615 | Payables | $1,547,777 |
|
| Total | | $901,615 | | $1,547,777 |
|
The following is a summary of realized and change in unrealized gains or losses of derivative instruments on the Statement of operations for the reporting period (see Note 1):
Amount of realized gain or (loss) on derivatives recognized in net gain or (loss) on investments
| | | |
| Derivatives not accounted for as hedging | | Forward currency | |
| instruments under ASC 815 | Options | contracts | Total |
|
| Foreign exchange contracts | $— | $(3,927,747) | $(3,927,747) |
|
| Equity contracts | 781,586 | — | $781,586 |
|
| Total | $781,586 | $(3,927,747) | $(3,146,161) |
|
Change in unrealized appreciation or (depreciation) on derivatives recognized in net gain or (loss) on investments
| | | |
| Derivatives not accounted for as hedging | | Forward currency | |
| instruments under ASC 815 | | contracts | Total |
|
| Foreign exchange contracts | | $(596,265) | $(596,265) |
|
| Total | | $(596,265) | $(596,265) |
|
Note 8: New accounting pronouncement
In January 2013, ASU 2013–01, “Clarifying the Scope of Disclosures about Offsetting Assets and Liabilities,” amended ASU No. 2011–11, “Disclosures about Offsetting Assets and Liabilities.” The ASUs create new disclosure requirements requiring entities to disclose both gross and net information for derivatives and other financial instruments that are either offset in the Statement of assets and liabilities or subject to an enforceable master netting arrangement or similar agreement. The disclosure requirements are effective for annual reporting periods beginning on or after January 1, 2013 and interim periods within those annual periods. Putnam Management is currently evaluating the application of ASUs 2013–01 and 2011–11 and their impact, if any, on the fund’s financial statements.
|
| Global Natural Resources Fund 47 |
Federal tax information (Unaudited)
The fund designated 100% of ordinary income distributions as qualifying for the dividends received deduction for corporations.
For the reporting period ended, the fund hereby designates 100%, or the maximum amount allowable, of its taxable ordinary income distributions as qualified dividends taxed at the individual net capital gain rates.
For the reporting period ended, pursuant to §871(k) of the Internal Revenue Code, the fund hereby designates $4,778 of distributions paid as qualifying to be taxed as interest-related dividends, and no monies to be taxed as short-term capital gain dividends for nonresident alien shareholders.
The Form 1099 that will be mailed to you in January 2014 will show the tax status of all distributions paid to your account in calendar 2013.
|
| 48 Global Natural Resources Fund |
About the Trustees
Independent Trustees

|
| Global Natural Resources Fund 49 |

* Mr. Reynolds is an “interested person” (as defined in the Investment Company Act of 1940) of the fund and Putnam Investments. He is President and Chief Executive Officer of Putnam Investments, as well as the President of your fund and each of the other Putnam funds.
The address of each Trustee is One Post Office Square, Boston, MA 02109.
As of August 31, 2013, there were 116 Putnam funds. All Trustees serve as Trustees of all Putnam funds.
Each Trustee serves for an indefinite term, until his or her resignation, retirement at age 75, removal, or death.
|
| 50 Global Natural Resources Fund |
Officers
In addition to Robert L. Reynolds, the other officers of the fund are shown below:
| |
| Jonathan S. Horwitz (Born 1955) | Janet C. Smith (Born 1965) |
| Executive Vice President, Principal Executive | Vice President, Principal Accounting Officer, |
| Officer, and Compliance Liaison | and Assistant Treasurer |
| Since 2004 | Since 2007 |
| | Director of Fund Administration Services, |
| Steven D. Krichmar (Born 1958) | Putnam Investments and Putnam Management |
| Vice President and Principal Financial Officer | |
| Since 2002 | Susan G. Malloy (Born 1957) |
| Chief of Operations, Putnam Investments and | Vice President and Assistant Treasurer |
| Putnam Management | Since 2007 |
| | Director of Accounting & Control Services, |
| Robert T. Burns (Born 1961) | Putnam Investments and Putnam Management |
| Vice President and Chief Legal Officer | |
| Since 2011 | James P. Pappas (Born 1953) |
| General Counsel, Putnam Investments, Putnam | Vice President |
| Management, and Putnam Retail Management | Since 2004 |
| | Director of Trustee Relations, |
| Robert R. Leveille (Born 1969) | Putnam Investments and Putnam Management |
| Vice President and Chief Compliance Officer | |
| Since 2007 | Mark C. Trenchard (Born 1962) |
| Chief Compliance Officer, Putnam Investments, | Vice President and BSA Compliance Officer |
| Putnam Management, and Putnam Retail | Since 2002 |
| Management | Director of Operational Compliance, |
| | Putnam Investments and Putnam |
| Michael J. Higgins (Born 1976) | Retail Management |
| Vice President, Treasurer, and Clerk | |
| Since 2010 | Nancy E. Florek (Born 1957) |
| Manager of Finance, Dunkin’ Brands (2008– | Vice President, Director of Proxy Voting and |
| 2010); Senior Financial Analyst, Old Mutual Asset | Corporate Governance, Assistant Clerk, |
| Management (2007–2008); Senior Financial | and Associate Treasurer |
| Analyst, Putnam Investments (1999–2007) | Since 2000 |
The principal occupations of the officers for the past five years have been with the employers as shown above although in some cases, they have held different positions with such employers. The address of each Officer is One Post Office Square, Boston, MA 02109.
| |
| Global Natural Resources Fund 51 |
Services for shareholders
Investor services
Systematic investment plan Tell us how much you wish to invest regularly — weekly, semimonthly, or monthly — and the amount you choose will be transferred automatically from your checking or savings account. There’s no additional fee for this service, and you can suspend it at any time. This plan may be a great way to save for college expenses or to plan for your retirement.
Please note that regular investing does not guarantee a profit or protect against loss in a declining market. Before arranging a systematic investment plan, consider your financial ability to continue making purchases in periods when prices are low.
Systematic exchange You can make regular transfers from one Putnam fund to another Putnam fund. There are no additional fees for this service, and you can cancel or change your options at any time.
Dividends PLUS You can choose to have the dividend distributions from one of your Putnam funds automatically reinvested in another Putnam fund at no additional charge.
Free exchange privilege You can exchange money between Putnam funds free of charge, as long as they are the same class of shares. A signature guarantee is required if you are exchanging more than $500,000. The fund reserves the right to revise or terminate the exchange privilege.
Reinstatement privilege If you’ve sold Putnam shares or received a check for a dividend or capital gain, you may reinvest the proceeds with Putnam within 90 days of the transaction and they will be reinvested at the fund’s current net asset value — with no sales charge. However, reinstatement of class B shares may have special tax consequences. Ask your financial or tax representative for details.
Check-writing service You have ready access to many Putnam accounts. It’s as simple as writing a check, and there are no special fees or service charges. For more information about the check-writing service, call Putnam or visit our website.
Dollar cost averaging When you’re investing for long-term goals, it’s time, not timing, that counts. Investing on a systematic basis is a better strategy than trying to figure out when the markets will go up or down. This means investing the same amount of money regularly over a long period. This method of investing is called dollar cost averaging. When a fund’s share price declines, your investment dollars buy more shares at lower prices. When it increases, they buy fewer shares. Over time, you will pay a lower average price per share.
For more information
Visit the Individual Investors section at putnam.com A secure section of our website contains complete information on your account, including balances and transactions, updated daily. You may also conduct transactions, such as exchanges, additional investments, and address changes. Log on today to get your password.
Call us toll free at 1-800-225-1581 Ask a helpful Putnam representative or your financial advisor for details about any of these or other services, or see your prospectus.
|
| 52 Global Natural Resources Fund |
Fund information
Founded over 75 years ago, Putnam Investments was built around the concept that a balance between risk and reward is the hallmark of a well-rounded financial program. We manage over 100 funds across income, value, blend, growth, asset allocation, absolute return, and global sector categories.
| | |
| Investment Manager | Trustees | Robert R. Leveille |
| Putnam Investment | Jameson A. Baxter, Chair | Vice President and |
| Management, LLC | Liaquat Ahamed | Chief Compliance Officer |
| One Post Office Square | Ravi Akhoury | |
| Boston, MA 02109 | Barbara M. Baumann | Michael J. Higgins |
| | Charles B. Curtis | Vice President, Treasurer, |
| Investment Sub-Manager | Robert J. Darretta | and Clerk |
| Putnam Investments Limited | Katinka Domotorffy | |
| 57–59 St James’s Street | John A. Hill | Janet C. Smith |
| London, England SW1A 1LD | Paul L. Joskow | Vice President, |
| | Kenneth R. Leibler | Principal Accounting Officer, |
| Investment Sub-Advisor | Robert E. Patterson | and Assistant Treasurer |
| The Putnam Advisory | George Putnam, III | |
| Company, LLC | Robert L. Reynolds | Susan G. Malloy |
| One Post Office Square | W. Thomas Stephens | Vice President and |
| Boston, MA 02109 | | Assistant Treasurer |
| | Officers | |
| Marketing Services | Robert L. Reynolds | James P. Pappas |
| Putnam Retail Management | President | Vice President |
| One Post Office Square | | |
| Boston, MA 02109 | Jonathan S. Horwitz | Mark C. Trenchard |
| | Executive Vice President, | Vice President and |
| Custodian | Principal Executive Officer, and | BSA Compliance Officer |
| State Street Bank | Compliance Liaison | |
| and Trust Company | | Nancy E. Florek |
| | Steven D. Krichmar | Vice President, Director of |
| Legal Counsel | Vice President and | Proxy Voting and Corporate |
| Ropes & Gray LLP | Principal Financial Officer | Governance, Assistant Clerk, |
| | | and Associate Treasurer |
| Independent Registered | Robert T. Burns | |
| Public Accounting Firm | Vice President and | |
| KPMG LLP | Chief Legal Officer | |
| | | |
This report is for the information of shareholders of Putnam Global Natural Resources Fund. It may also be used as sales literature when preceded or accompanied by the current prospectus, the most recent copy of Putnam’s Quarterly Performance Summary, and Putnam’s Quarterly Ranking Summary. For more recent performance, please visit putnam.com. Investors should carefully consider the investment objectives, risks, charges, and expenses of a fund, which are described in its prospectus. For this and other information or to request a prospectus or summary prospectus, call 1-800-225-1581 toll free. Please read the prospectus carefully before investing. The fund’s Statement of Additional Information contains additional information about the fund’s Trustees and is available without charge upon request by calling 1-800-225-1581.
| |
| (a) The fund’s principal executive, financial and accounting officers are employees of Putnam Investment Management, LLC, the Fund’s investment manager. As such they are subject to a comprehensive Code of Ethics adopted and administered by Putnam Investments which is designed to protect the interests of the firm and its clients. The Fund has adopted a Code of Ethics which incorporates the Code of Ethics of Putnam Investments with respect to all of its officers and Trustees who are employees of Putnam Investment Management, LLC. For this reason, the Fund has not adopted a separate code of ethics governing its principal executive, financial and accounting officers. |
| |
| (c) In July 2013, the Code of Ethics of Putnam Investment Management, LLC was amended. The changes to the Code of Ethics were as follows: (i) eliminating the requirement for employees to hold their shares of Putnam mutual funds for specified periods of time, (ii) removing the requirement to preclear transactions in certain kinds of exchange-traded funds and exchange-traded notes, although reporting of all such instruments remains required; (iii) eliminating the excessive trading rule related to employee transactions in securities requiring preclearance under the Code; (iv) adding provisions related to monitoring of employee trading; (v) changing from a set number of shares to a set dollar value of stock of mid- and large-cap companies on the Restricted List that can be purchased or sold; (vi) adding a requirement starting in March 2014 for employees to generally use certain approved brokers that provide Putnam with an electronic feed of transactions and statements for their personal brokerage accounts; and (vii) certain other changes. |
| |
| Item 3. Audit Committee Financial Expert: |
| |
| The Funds’ Audit and Compliance Committee is comprised solely of Trustees who are “independent” (as such term has been defined by the Securities and Exchange Commission (“SEC”) in regulations implementing Section 407 of the Sarbanes-Oxley Act (the “Regulations”)). The Trustees believe that each of the members of the Audit and Compliance Committee also possess a combination of knowledge and experience with respect to financial accounting matters, as well as other attributes, that qualify them for service on the Committee. In addition, the Trustees have determined that each of Mr. Leibler, Mr. Hill, Mr. Darretta and Ms. Baumann qualifies as an “audit committee financial expert” (as such term has been defined by the Regulations) based on their review of his or her pertinent experience and education. The SEC has stated that the designation or identification of a person as an audit committee financial expert pursuant to this Item 3 of Form N-CSR does not impose on such person any duties, obligations or liability that are greater than the duties, obligations and liability imposed on such person as a member of the Audit and Compliance Committee and the Board of Trustees in the absence of such designation or identification. |
| |
| Item 4. Principal Accountant Fees and Services: |
| |
| The following table presents fees billed in each of the last two fiscal years for services rendered to the fund by the fund’s independent auditor: |
| | | | | |
| Fiscal year ended | Audit Fees | Audit-Related Fees | Tax Fees | All Other Fees |
|
|
| | | | | |
| August 31, 2013 | $39,763 | $-- | $4,200 | $ — |
| August 31, 2012 | $42,810 | $-- | $4,100 | $ — |
| |
| For the fiscal years ended August 31, 2013 and August 31, 2012, the fund’s independent auditor billed aggregate non-audit fees in the amounts of $4,200 and $4,100 respectively, to the fund, Putnam Management and any entity controlling, controlled by or under common control with Putnam Management that provides ongoing services to the fund. |
| |
| Audit Fees represent fees billed for the fund’s last two fiscal years relating to the audit and review of the financial statements included in annual reports and registration statements, and other services that are normally provided in connection with statutory and regulatory filings or engagements. |
| |
| Audit-Related Fees represent fees billed in the fund’s last two fiscal years for services traditionally performed by the fund’s auditor, including accounting consultation for proposed transactions or concerning financial accounting and reporting standards and other audit or attest services not required by statute or regulation. |
| |
| Tax Fees represent fees billed in the fund’s last two fiscal years for tax compliance, tax planning and tax advice services. Tax planning and tax advice services include assistance with tax audits, employee benefit plans and requests for rulings or technical advice from taxing authorities. |
| |
| Pre-Approval Policies of the Audit and Compliance Committee. The Audit and Compliance Committee of the Putnam funds has determined that, as a matter of policy, all work performed for the funds by the funds’ independent auditors will be pre-approved by the Committee itself and thus will generally not be subject to pre-approval procedures. |
| |
| The Audit and Compliance Committee also has adopted a policy to pre-approve the engagement by Putnam Management and certain of its affiliates of the funds’ independent auditors, even in circumstances where pre-approval is not required by applicable law. Any such requests by Putnam Management or certain of its affiliates are typically submitted in writing to the Committee and explain, among other things, the nature of the proposed engagement, the estimated fees, and why this work should be performed by that particular audit firm as opposed to another one. In reviewing such requests, the Committee considers, among other things, whether the provision of such services by the audit firm are compatible with the independence of the audit firm. |
| |
| The following table presents fees billed by the fund’s independent auditor for services required to be approved pursuant to paragraph (c)(7)(ii) of Rule 2-01 of Regulation S-X. |
| | | | | |
| Fiscal year ended | Audit-Related Fees | Tax Fees | All Other Fees | Total Non-Audit Fees |
|
|
| | | | | |
| August 31, 2013 | $ — | $ — | $ — | $ — |
| | | | | |
| August 31, 2012 | $ — | $ — | $ — | $ — |
| |
| Item 5. Audit Committee of Listed Registrants |
| |
| Item 6. Schedule of Investments: |
| |
| The registrant’s schedule of investments in unaffiliated issuers is included in the report to shareholders in Item 1 above. |
| |
| Item 7. Disclosure of Proxy Voting Policies and Procedures For Closed-End Management Investment Companies: |
| |
| Item 8. Portfolio Managers of Closed-End Investment Companies |
| |
| Item 9. Purchases of Equity Securities by Closed-End Management Investment Companies and Affiliated Purchasers: |
| |
| Item 10. Submission of Matters to a Vote of Security Holders: |
| |
| Item 11. Controls and Procedures: |
| |
| (a) The registrant’s principal executive officer and principal financial officer have concluded, based on their evaluation of the effectiveness of the design and operation of the registrant’s disclosure controls and procedures as of a date within 90 days of the filing date of this report, that the design and operation of such procedures are generally effective to provide reasonable assurance that information required to be disclosed by the registrant in this report is recorded, processed, summarized and reported within the time periods specified in the Commission’s rules and forms. |
| |
| (b) Changes in internal control over financial reporting: Not applicable |
| |
| (a)(1) The Code of Ethics of The Putnam Funds, which incorporates the Code of Ethics of Putnam Investments, is filed herewith. |
| |
| (a)(2) Separate certifications for the principal executive officer and principal financial officer of the registrant as required by Rule 30a-2(a) under the Investment Company Act of 1940, as amended, are filed herewith. |
| |
| (b) The certifications required by Rule 30a-2(b) under the Investment Company Act of 1940, as amended, are filed herewith. |
| |
| Pursuant to the requirements of the Securities Exchange Act of 1934 and the Investment Company Act of 1940, the registrant has duly caused this report to be signed on its behalf by the undersigned, thereunto duly authorized. |
| |
| Putnam Global Natural Resources Fund |
| |
| By (Signature and Title): |
| |
| /s/Janet C. Smith
Janet C. Smith
Principal Accounting Officer
|
| |
| Pursuant to the requirements of the Securities Exchange Act of 1934 and the Investment Company Act of 1940, this report has been signed below by the following persons on behalf of the registrant and in the capacities and on the dates indicated. |
| |
| By (Signature and Title): |
| |
| /s/Jonathan S. Horwitz
Jonathan S. Horwitz
Principal Executive Officer
|
| |
| By (Signature and Title): |
| |
| /s/Steven D. Krichmar
Steven D. Krichmar
Principal Financial Officer
|