CERTIFIED SHAREHOLDER REPORT OF REGISTERED MANAGEMENT INVESTMENT COMPANIES
Investment Company Act file number:
(811-03061)
Exact name of registrant as specified in charter:
Putnam Global Natural Resources Fund
Address of principal executive offices:
One Post Office Square, Boston, Massachusetts 02109
Name and address of agent for service:
Robert T. Burns, Vice President One Post Office Square Boston, Massachusetts 02109
Copy to:
Bryan Chegwidden, Esq. Ropes & Gray LLP 1211 Avenue of the Americas New York, New York 10036
Registrant’s telephone number, including area code:
(617) 292-1000
Date of fiscal year end:
August 31, 2014
Date of reporting period :
September 1, 2013 — August 31, 2014
Item 1. Report to Stockholders:
The following is a copy of the report transmitted to stockholders pursuant to Rule 30e-1 under the Investment Company Act of 1940:
Putnam Global Natural Resources Fund
Annual report 8 | 31 | 14
Message from the Trustees
1
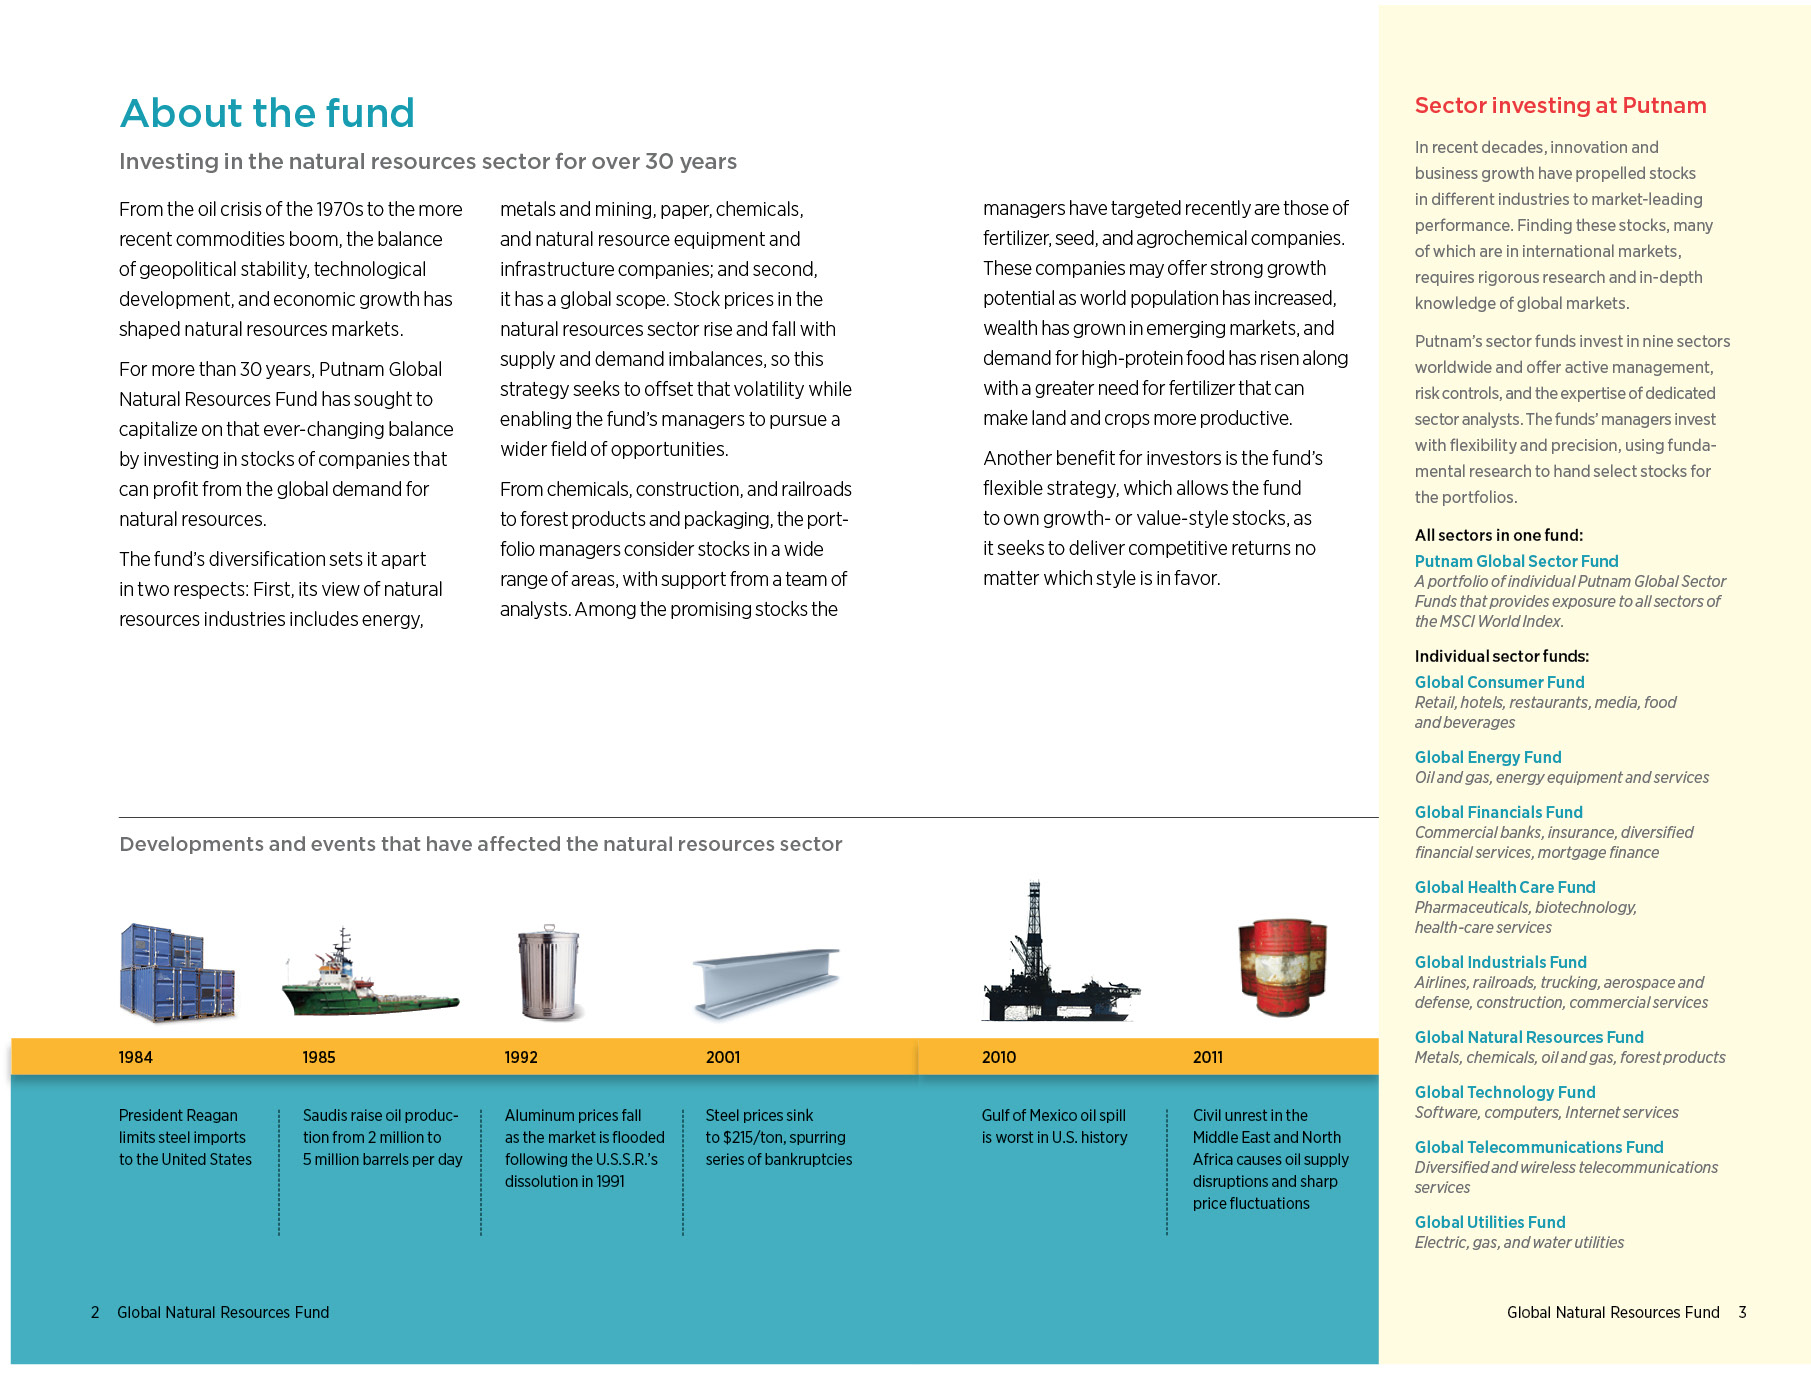
About the fund
2
Performance snapshot
4
Interview with your fund’s portfolio managers
5
Your fund’s performance
11
Your fund’s expenses
14
Terms and definitions
16
Other information for shareholders
17
Important notice regarding Putnam’s privacy policy
18
Trustee approval of management contract
19
Financial statements
24
Federal tax information
52
Shareholder meeting results
53
About the Trustees
54
Officers
56
Consider these risks before investing: International investing involves currency, economic, and political risks. Emerging-market securities carry illiquidity and volatility risks. Investments in small and/or midsize companies increase the risk of greater price fluctuations. The energy and other natural resources industries may be affected by changes in crude oil prices and changes in governmental regulatory policies. The fund concentrates on a limited group of industries and is non-diversified. Because the fund may invest in fewer issuers, it is vulnerable to common economic forces and may result in greater losses and volatility. Growth stocks may be more susceptible to earnings disappointments, and value stocks may fail to rebound. The use of short selling may result in losses if the securities appreciate in value. Risks associated with derivatives include increased investment exposure (which may be considered leverage) and, in the case of over-the-counter instruments, the potential inability to terminate or sell derivatives positions and the potential failure of the other party to the instrument to meet its obligations. Stock prices may fall or fail to rise over time for several reasons, including general financial market conditions and factors related to a specific issuer or industry. You can lose money by investing in the fund.
Message from the Trustees
Dear Fellow Shareholder:
The U.S. stock market has continued to climb this year. With a better-than-expected second-quarter earnings season, the S&P 500 Index was up 8.34% for the first nine months of 2014. This benchmark eclipsed the 2000 level for the first time in late August — one of many record highs set year to date. Government bonds, including municipal bonds, and other fixed-income securities have also performed well, particularly as interest rates have remained steady and even declined from historically low levels.
In the United States, economic indicators have gradually improved. Notably, second-quarter GDP expanded at a seasonally adjusted annual rate of 4.6%, according to a revised estimate released by the Bureau of Economic Analysis. In addition, the unemployment rate has steadily declined, and data show that the housing and manufacturing sectors are gaining strength. World markets have lagged, however. Geopolitical risk has increased in the Middle East and Eastern Europe, although there has been little negative impact on oil and commodity prices to date. In Europe, a sputtering recovery ground to a halt in the second quarter. The European Central Bank has responded by cutting interest rates further and announcing asset- and bond-buying programs to help lift the region out of its economic doldrums.
As U.S. markets enter the fourth quarter on a high note and geopolitical concerns continue, we encourage you to meet with your financial advisor to ensure that your portfolio is properly diversified and aligned with your objectives and risk tolerance. Keep in mind that Putnam offers a wide range of strategies for all environments, as well as new ways of thinking about building portfolios for today’s markets.
As always, thank you for investing with Putnam.
Respectfully yours,
Robert L. Reynolds President and Chief Executive Officer Putnam Investments
Jameson A. Baxter Chair, Board of Trustees
October 8, 2014
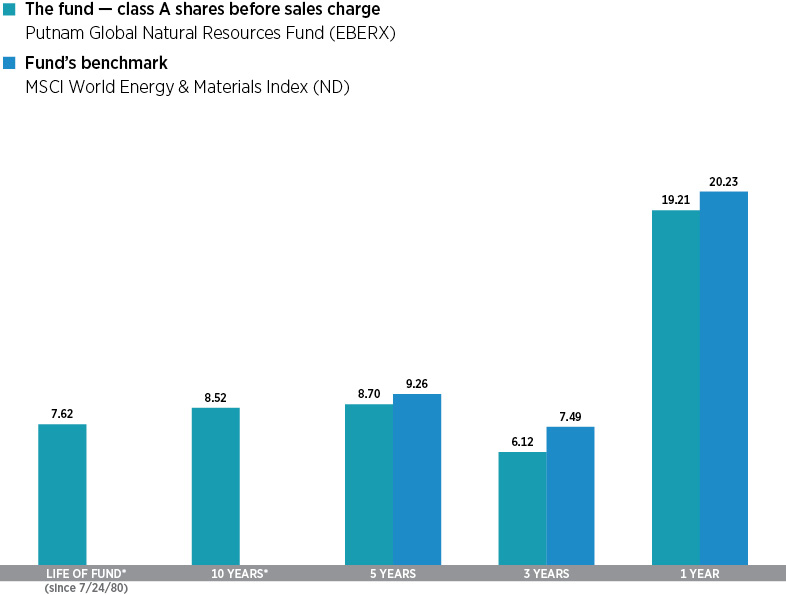
Performance snapshot
Annualized total return (%) comparison as of 8/31/14
Current performance may be lower or higher than the quoted past performance, which cannot guarantee future results. Share price, principal value, and return will fluctuate, and you may have a gain or a loss when you sell your shares. Performance of class A shares assumes reinvestment of distributions and does not account for taxes. Fund returns in the bar chart do not reflect a sales charge of 5.75%; had they, returns would have been lower. See pages 5 and 11–13 for additional performance information. For a portion of the periods, the fund had expense limitations, without which returns would have been lower. To obtain the most recent month-end performance, visit putnam.com.
* The fund’s benchmark, the MSCI World Energy & Materials Index (ND), was introduced on 6/1/05, which post-dates the inception of the fund’s class A shares.
4 Global Natural Resources Fund
Interview with your fund’s portfolio managers
Steven W. Curbow
Christopher J. Eitzmann
What was the market environment like for investing in the natural resources sector for the 12-month period ended August 31, 2014?
Steve:The environment was generally positive. The United States emerged from its harshest winter in almost 20 years, with the nation’s gross domestic product contracting in the first quarter of 2014. Yet, investors seemed to focus on the encouraging signs of capital expenditures broadening and the nation’s unemployment rate falling. Energy stocks performed well early in the period, as commodity prices responded to signs of economic improvement, with help from the unusually cold winter. Other commodities didn’t fare as well, with most industrial metals and agricultural grains marking new 12-month lows at the end of the period due to the capital-expenditure-led supply growth. Recently, the global markets have had to digest a slew of troubling events — Russian sanctions, Portuguese banking issues, renewed Middle East conflicts, and an Ebola outbreak that may impact both demand trends and producing operations in West Africa. In this environment, Putnam Global Natural Resources Fund returned 19.21%, modestly underperforming the 20.23% gain of its benchmark, the MSCI World Energy & Materials Index [ND].
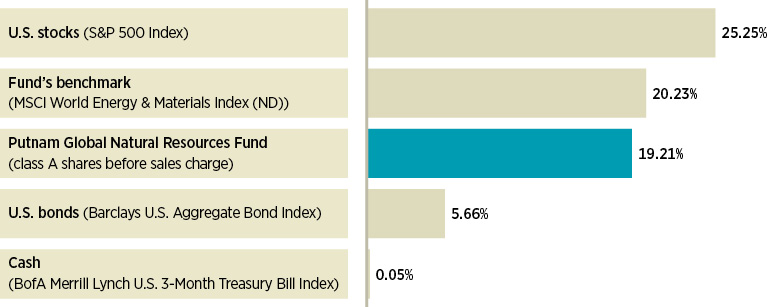
Broad market index and fund performance
This comparison shows your fund’s performance in the context of broad market indexes for the 12 months ended 8/31/14. See pages 4 and 11–13 for additional fund performance information. Index descriptions can be found on page 16.
Global Natural Resources Fund 5
What trends occurred in the natural resources sector during the period?
Steve:The renaissance of the North American energy industry continued as a key theme, with ongoing secondary impact on the U.S. chemicals sector. Companies supplying goods and services to the oil companies that are developing oil and gas resources in the United States and Canada continued to benefit during the period, as producers experimented with new techniques to drill and complete the wells in several different plays. This resulted in an increase in the level of capital spending per well. While these results are leading to bigger production rates and better returns for oil companies, they are also increasing the spending directed toward the service industry. Our conversations with the U.S. oil producers and service companies helped us identify this trend early.
Companies positioned to benefit from the low cost of U.S. natural gas was another area of strong performance. The fund benefited from holdings in companies developing liquefied natural gas [LNG] export facilities on the Gulf Coast. Our view was that LNG exports from the United States were likely to gain political and regulatory momentum, and we identified companies that were at an advantage because they were first in line from a capacity standpoint. The portfolio also continued to benefit from multiyear investments in U.S. chemical producers that now enjoy much stronger profitability throughout their business cycles.
In the final months in the period, however, investors grew more risk-averse and sold energy stocks that faced either perceived or, in some cases, real geopolitical threats to their assets and operations.
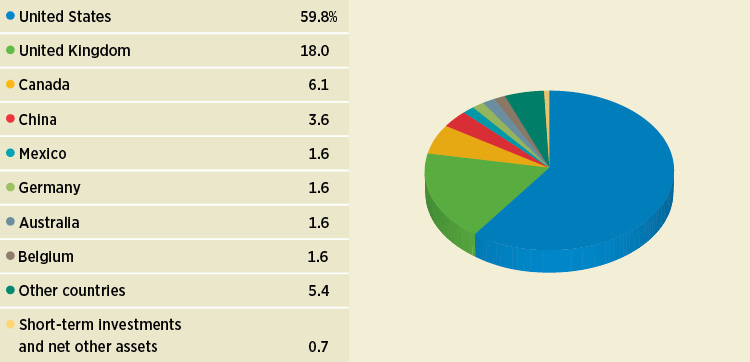
Global composition
Allocations are shown as a percentage of the fund’s net assets as of 8/31/14. Short-term investments and net other assets, if any, represent the market value weights of cash, derivatives, short-term securities, and other unclassified assets in the portfolio. Summary information may differ from the information in the portfolio schedule notes included in the financial statements due to the inclusion of derivative securities, any interest accruals, and the exclusion of as-of trades, if any. Holdings and allocations may vary over time.
6 Global Natural Resources Fund
“Companies supplying goods and services to the oil companies that are developing oil and gas resources in the United States and Canada continued to benefit during the period.”
Steve Curbow
Which specific holdings helped performance relative to the fund’s benchmark?
Steve: In 2013, exploration-and-production companies began using significantly more proppant [raw sand] in their unconventional well designs in North America. While this demand driver for sand was well known, the stock market was concerned with the number of sand mines that had been permitted recently. This suggested excess supply and lower pricing in the future, in our view. We developed our own industry supply model, which indicated many of the new suppliers would not be able to cost-effectively deliver sand due to transportation logistics issues. Believing demand growth would outstrip effective supply growth, we purchased positions in two providers of hydraulic-fracturing sand, U.S. Silica and Hi-Crush Partners. Both of these companies have superior logistics capabilities that allow them to take advantage of increasing sand prices due to the scarcity of low-cost supply, in our view. Both holdings were among the top contributors to the fund’s benchmark-relative performance during the reporting period, and a good example of the collaboration between our energy and materials investment teams. We had sold the fund’s position in U.S. Silica by the end of the period.
Chris:In materials, our long-term investments in U.S. chemical producers continued to have a positive impact, namely the fund’s holdings in Dow Chemical, LyondellBasell Industries, and Huntsman. The feedstock cost advantage
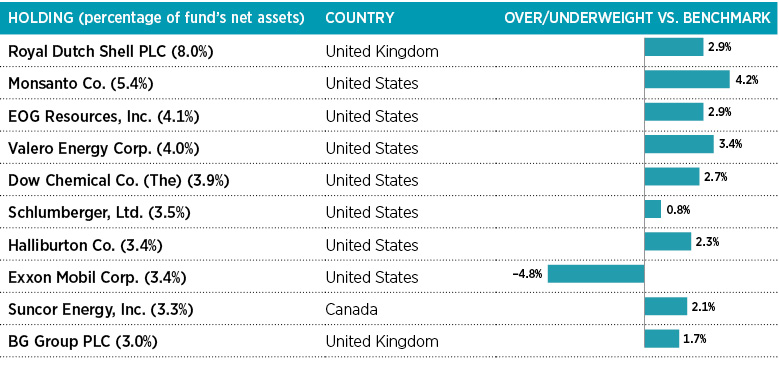
Top 10 holdings
This table shows the fund’s top 10 holdings by percentage of the fund’s net assets as of 8/31/14. Short-term holdings and derivatives, if any, are excluded. Holdings may vary over time.
Global Natural Resources Fund 7
relative to global peers continued to widen as many natural gas liquids fell to their lowest levels in more than a decade. Due to these companies’ much-improved balance sheets and profit margins, going forward we believe our investments in this area are entering the next stage in the business cycle — that is, these companies are now making the transition from harvesting cash flow to deploying that cash flow to benefit shareholders. By the end of the period, we sold off the fund’s position in LyondellBasell.
Turning to detractors, what are some examples of holdings that held back performance relative to the benchmark?
Chris:Six months ago, we mentioned that we were starting to find a limited number of attractive opportunities in the metals and mining space. While we maintained a significant underweight position in the subsector relative to the benchmark, we found what we believed to be a few companies with solid balance sheets, high free cash flow yields, and good management teams in an area where investor appetite was extremely low. Fortescue Metals was one of those holdings in the fund and, unfortunately, was a negative contributor relative to performance during the period. A reduction in Chinese steel production significantly impacted the demand for iron ore at the same time that new supply was coming to market, driving a meaningful drop in iron ore prices and the profitability of Fortescue.
Steve:Within energy, Cobalt International is an exploration company drilling in the deep water of the Gulf of Mexico and offshore Angola. During the 12-month period, investors in general shunned companies involved in high-risk exploration. More specifically to Cobalt, in early August the company received notice from the U.S. Securities and Exchange Commission that it was recommending an enforcement action against the company
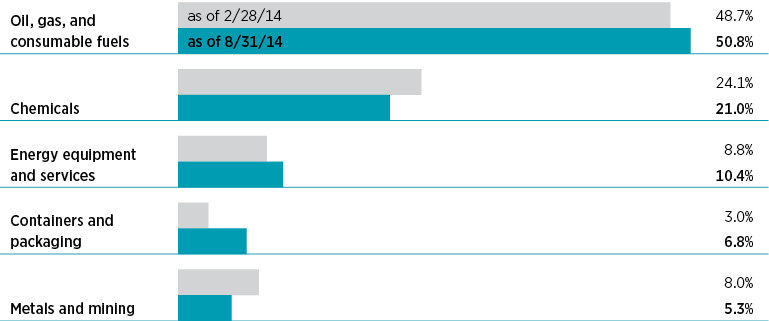
Comparison of top industry weightings
This chart shows how the fund’s top weightings have changed over the past six months. Allocations are shown as a percentage of the fund’s net assets. Current period summary information may differ from the portfolio schedule included in the financial statements due to the inclusion of derivative securities, any interest accruals, the exclusion of as-of trades, if any, and the use of different classifications of securities for presentation purposes. Holdings and allocations may vary over time.
8 Global Natural Resources Fund
regarding alleged violations of the Foreign Corrupt Practices Act. This involved an old issue alleging that one of Cobalt’s partners in Angola had illegal dealings with a government official. Cobalt had investigated the issue previously, and maintains its innocence. We believe that any potential fine is already reflected in the stock’s valuation, and we continue to hold the stock.
What is your outlook for the economy and the global natural resources sector?
Steve:We are cautiously optimistic about the global economy, perhaps a bit less so than we were six months ago. Chinese stimulus appears to have come and gone with little underlying impact on overall demand levels. We believe the sanguine economic data in China are partly a function of a multiyear, destocking period in the country as the total supply chain becomes more efficient and purges some of the excess inventory at most levels of goods and services. Europe appears to be stalling once again and is increasingly dependent on economic stimulus as a means of growth. One bright spot in the global economy is the United States, where economic data continue to surprise to the upside. We are optimistic the U.S. housing recovery and a budding recovery in non-residential construction can continue to support modest growth rates in coming years.
Supply from the Middle East remains as dynamic as ever, with the potential for Libyan and Iranian production to return at some point to previous levels, while a slow decline in production from southern Iraq’s oil fields is keeping the market tight. While macroeconomic risks remain, U.S. accommodative monetary policy has continued to support modest economic growth. A key risk to energy prices, however, may be a reduction in this monetary support at the same time the eurozone becomes more accommodative. We would expect such a situation to increase the value of the U.S. dollar, which tends to move inversely with commodity prices.
As a result, we do not expect our investments to change significantly in the near term. However, we are focused less on higher-cost producers of energy, whose results would be hurt disproportionally relative to lower-cost producers. We continue to favor LNG as a lower-cost substitute for oil in many scenarios, and we continue to creatively invest to capture opportunities around the evolving LNG markets.
Chris:In the global natural resources sector, we continue to focus on selective opportunities and fundamental stock picking. We still believe emerging-market-led demand growth will not achieve the levels last seen several years ago. Incremental supply growth in many commodities will likely lead to growing supply/demand imbalances in the coming year, in our view. That said, we believe the base level of demand is larger today. This implies that a sustained global recovery down the road will likely lead to tightening global supply in many key resources, in our view.
Thank you, Steve and Chris, for your time and insights today.
The views expressed in this report are exclusively those of Putnam Management and are subject to change. They are not meant as investment advice.
Please note that the holdings discussed in this report may not have been held by the fund for the entire period. Portfolio composition is subject to review in accordance with the fund’s investment strategy and may vary in the future. Current and future portfolio holdings are subject to risk.
Global Natural Resources Fund 9
Portfolio Manager Steven W. Curbow has an M.B.A. from The University of Chicago Booth School of Business and a B.S. from the University of Southern California. Steven joined Putnam in 2008 and has been in the investment industry since 1996.
Portfolio Manager Christopher J. Eitzmann has an M.B.A. from the Tuck School of Business at Dartmouth College and an A.B. from Harvard University. Christopher joined Putnam in 2012 and has been in the investment industry since 2003.
IN THE NEWS
A pledge two years ago by the European Central Bank (ECB) to “do whatever it takes” to save the euro is reflected in a landmark decision made early this September. The ECB instituted a bond-buying program that earmarked upward of €700 billion, or $906 billion, aimed at jump-starting lending activity and, ultimately, at reigniting Europe’s decelerating economic recovery. In addition, the ECB slashed its main refinancing rate to a record low of 0.05% and drove its deposit rate deeper into negative territory. This means banks will now pay an even greater premium for parking money at the ECB for short periods of time rather than lending it to businesses. The new measures also seek to lift the eurozone’s historically low inflation rate to its target of 2%. Still, skeptics fear that more intensive fiscal and structural reforms among the 18-nation euro currency bloc will be needed to stimulate a long-term European economic recovery.
10 Global Natural Resources Fund
Your fund’s performance
This section shows your fund’s performance, price, and distribution information for periods ended August 31, 2014, the end of its most recent fiscal year. In accordance with regulatory requirements for mutual funds, we also include performance information as of the most recent calendar quarter-end and expense information taken from the fund’s current prospectus. Performance should always be considered in light of a fund’s investment strategy. Data represent past performance. Past performance does not guarantee future results. More recent returns may be less or more than those shown. Investment return and principal value will fluctuate, and you may have a gain or a loss when you sell your shares. Performance information does not reflect any deduction for taxes a shareholder may owe on fund distributions or on the redemption of fund shares. For the most recent month-end performance, please visit the Individual Investors section at putnam.com or call Putnam at 1-800-225-1581. Class R and class Y shares are not available to all investors. See the Terms and Definitions section in this report for definitions of the share classes offered by your fund.
Fund performance Total return for periods ended 8/31/14
Class A
Class B
Class C
Class M
Class R
Class Y
(inception dates)
(7/24/80)
(2/1/94)
(7/26/99)
(7/3/95)
(12/1/03)
(10/4/05)
Before sales charge
After sales charge
Before CDSC
After CDSC
Before CDSC
After CDSC
Before sales charge
After sales charge
Net asset value
Net asset value
Annual average
(life of fund)
7.62%
7.44%
7.39%
7.39%
6.81%
6.81%
7.02%
6.91%
7.36%
7.69%
10 years
126.46
113.44
113.35
113.35
110.17
110.17
115.51
107.96
121.14
131.69
Annual average
8.52
7.88
7.87
7.87
7.71
7.71
7.98
7.60
8.26
8.77
5 years
51.76
43.03
46.23
44.23
46.20
46.20
48.05
42.87
49.97
53.73
Annual average
8.70
7.42
7.90
7.60
7.89
7.89
8.16
7.40
8.44
8.98
3 years
19.52
12.64
16.87
13.87
16.88
16.88
17.77
13.65
18.69
20.40
Annual average
6.12
4.05
5.33
4.43
5.34
5.34
5.60
4.36
5.88
6.38
1 year
19.21
12.36
18.31
13.31
18.31
17.31
18.61
14.45
18.93
19.48
Current performance may be lower or higher than the quoted past performance, which cannot guarantee future results. After-sales-charge returns for class A and M shares reflect the deduction of the maximum 5.75% and 3.50% sales charge, respectively, levied at the time of purchase. Class B share returns after contingent deferred sales charge (CDSC) reflect the applicable CDSC, which is 5% in the first year, declining over time to 1% in the sixth year, and is eliminated thereafter. Class C share returns after CDSC reflect a 1% CDSC for the first year that is eliminated thereafter. Class R and Y shares have no initial sales charge or CDSC. Performance for class B, C, M, R, and Y shares before their inception is derived from the historical performance of class A shares, adjusted for the applicable sales charge (or CDSC) and the higher operating expenses for such shares, except for class Y shares, for which 12b-1 fees are not applicable.
For a portion of the periods, the fund had expense limitations, without which returns would have been lower.
Class B share performance reflects conversion to class A shares after eight years.
Global Natural Resources Fund 11
Comparative index returns For periods ended 8/31/14
MSCI World Energy & Materials Index (ND)
Annual average (life of fund)
—*
10 years
—*
Annual average
—*
5 years
55.73%
Annual average
9.26
3 years
24.18
Annual average
7.49
1 year
20.23
Index results should be compared with fund performance before sales charge, before CDSC, or at net asset value.
*The fund’s benchmark, the MSCI World Energy & Materials Index (ND), was introduced on 6/1/05, which post-dates the inception of the fund’s class A shares.
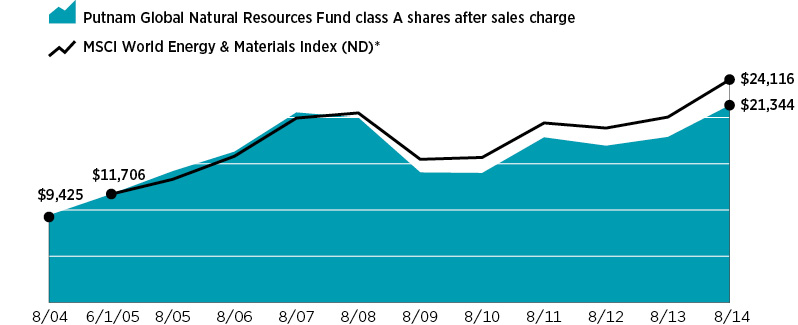
Change in the value of a $10,000 investment ($9,425 after sales charge)
Cumulative total return from 8/31/04 to 8/31/14
Past performance does not indicate future results. At the end of the same time period, a $10,000 investment in the fund’s class B and class C shares would have been valued at $21,335 and $21,017, respectively, and no contingent deferred sales charges would apply. A $10,000 investment in the fund’s class M shares ($9,650 after sales charge) would have been valued at $20,796. A $10,000 investment in the fund’s class R and Y shares would have been valued at $22,114 and $23,169, respectively.
* The fund’s benchmark, the MSCI World Energy & Materials Index (ND), was introduced on 6/1/05, which post-dates the inception of the fund’s class A shares.
12 Global Natural Resources Fund
Fund price and distribution information For the 12-month period ended 8/31/14
Class A
Class B
Class C
Class M
Class R
Class Y
Share value
Before sales charge
After sales charge
Net asset value
Net asset value
Before sales charge
After sales charge
Net asset value
Net asset value
8/31/13
$20.09
$21.32
$17.91
$18.30
$19.08
$19.77
$19.70
$20.23
8/31/14
23.95
25.41
21.19
21.65
22.63
23.45
23.43
24.17
The classification of distributions, if any, is an estimate. Before-sales-charge share value and current dividend rate for class A and M shares, if applicable, do not take into account any sales charge levied at the time of purchase. After-sales-charge share value, current dividend rate, and current 30-day SEC yield, if applicable, are calculated assuming that the maximum sales charge (5.75% for class A shares and 3.50% for class M shares) was levied at the time of purchase. Final distribution information will appear on your year-end tax forms.
The fund made no distributions during the period.
Fund performance as of most recent calendar quarter Total return for periods ended 9/30/14
Class A
Class B
Class C
Class M
Class R
Class Y
(inception dates)
(7/24/80)
(2/1/94)
(7/26/99)
(7/3/95)
(12/1/03)
(10/4/05)
Before sales charge
After sales charge
Before CDSC
After CDSC
Before CDSC
After CDSC
Before sales charge
After sales charge
Net asset value
Net asset value
Annual average
(life of fund)
7.33%
7.15%
7.10%
7.10%
6.53%
6.53%
6.73%
6.62%
7.07%
7.40%
10 years
92.21
81.16
81.02
81.02
78.41
78.41
82.98
76.58
87.65
96.72
Annual average
6.75
6.12
6.11
6.11
5.96
5.96
6.23
5.85
6.50
7.00
5 years
30.62
23.11
25.84
23.84
25.83
25.83
27.49
23.03
29.07
32.34
Annual average
5.49
4.25
4.70
4.37
4.70
4.70
4.98
4.23
5.24
5.76
3 years
34.37
26.64
31.43
28.43
31.40
31.40
32.42
27.79
33.44
35.43
Annual average
10.35
8.19
9.54
8.70
9.53
9.53
9.81
8.52
10.09
10.64
1 year
4.92
–1.11
4.13
–0.87
4.14
3.14
4.43
0.77
4.68
5.22
See the discussion following the fund performance table on page 11 for information about the calculation of fund performance.
Global Natural Resources Fund 13
Your fund’s expenses
As a mutual fund investor, you pay ongoing expenses, such as management fees, distribution fees (12b-1 fees), and other expenses. Using the following information, you can estimate how these expenses affect your investment and compare them with the expenses of other funds. You may also pay one-time transaction expenses, including sales charges (loads) and redemption fees, which are not shown in this section and would have resulted in higher total expenses. For more information, see your fund’s prospectus or talk to your financial representative.
Expense ratios
Class A
Class B
Class C
Class M
Class R
Class Y
Total annual operating expenses for the fiscal year ended 8/31/13
1.23%
1.98%
1.98%
1.73%
1.48%
0.98%
Annualized expense ratio for the six-month period ended 8/31/14*
1.17%
1.92%
1.92%
1.67%
1.42%
0.92%
Fiscal-year expense information in this table is taken from the most recent prospectus, is subject to change, and may differ from that shown for the annualized expense ratio and in the financial highlights of this report.
Expenses are shown as a percentage of average net assets.
* For the fund’s most recent fiscal half year; may differ from expense ratios based on one-year data in the financial highlights.
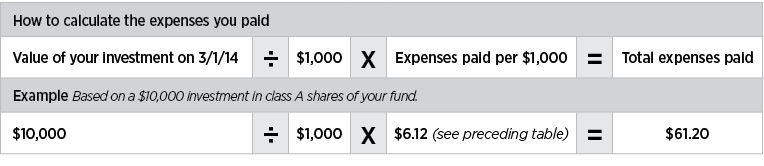
Expenses per $1,000
The following table shows the expenses you would have paid on a $1,000 investment in the fund from March 1, 2014, to August 31, 2014. It also shows how much a $1,000 investment would be worth at the close of the period, assuming actual returns and expenses.
Class A
Class B
Class C
Class M
Class R
Class Y
Expenses paid per $1,000*†
$6.12
$10.03
$10.03
$8.73
$7.43
$4.82
Ending value (after expenses)
$1,075.90
$1,071.80
$1,072.30
$1,073.00
$1,074.80
$1,077.60
* Expenses for each share class are calculated using the fund’s annualized expense ratio for each class, which represents the ongoing expenses as a percentage of average net assets for the six months ended 8/31/14. The expense ratio may differ for each share class.
† Expenses are calculated by multiplying the expense ratio by the average account value for the period; then multiplying the result by the number of days in the period; and then dividing that result by the number of days in the year.
14 Global Natural Resources Fund
Estimate the expenses you paid
To estimate the ongoing expenses you paid for the six months ended August 31, 2014, use the following calculation method. To find the value of your investment on March 1, 2014, call Putnam at 1-800-225-1581.
Compare expenses using the SEC’s method
The Securities and Exchange Commission (SEC) has established guidelines to help investors assess fund expenses. Per these guidelines, the following table shows your fund’s expenses based on a $1,000 investment, assuming a hypothetical 5% annualized return. You can use this information to compare the ongoing expenses (but not transaction expenses or total costs) of investing in the fund with those of other funds. All mutual fund shareholder reports will provide this information to help you make this comparison. Please note that you cannot use this information to estimate your actual ending account balance and expenses paid during the period.
Class A
Class B
Class C
Class M
Class R
Class Y
Expenses paid per $1,000*†
$5.96
$9.75
$9.75
$8.49
$7.22
$4.69
Ending value (after expenses)
$1,019.31
$1,015.53
$1,015.53
$1,016.79
$1,018.05
$1,020.57
* Expenses for each share class are calculated using the fund’s annualized expense ratio for each class, which represents the ongoing expenses as a percentage of average net assets for the six months ended 8/31/14. The expense ratio may differ for each share class.
† Expenses are calculated by multiplying the expense ratio by the average account value for the six-month period; then multiplying the result by the number of days in the six-month period; and then dividing that result by the number of days in the year.
Global Natural Resources Fund 15
Terms and definitions
Important terms
Total return shows how the value of the fund’s shares changed over time, assuming you held the shares through the entire period and reinvested all distributions in the fund.
Before sales charge, or net asset value, is the price, or value, of one share of a mutual fund, without a sales charge. Before-sales-charge figures fluctuate with market conditions, and are calculated by dividing the net assets of each class of shares by the number of outstanding shares in the class.
After sales charge is the price of a mutual fund share plus the maximum sales charge levied at the time of purchase. After-sales-charge performance figures shown here assume the 5.75% maximum sales charge for class A shares and 3.50% for class M shares.
Contingent deferred sales charge (CDSC) is generally a charge applied at the time of the redemption of class B or C shares and assumes redemption at the end of the period. Your fund’s class B CDSC declines over time from a 5% maximum during the first year to 1% during the sixth year. After the sixth year, the CDSC no longer applies. The CDSC for class C shares is 1% for one year after purchase.
Share classes
Class A shares are generally subject to an initial sales charge and no CDSC (except on certain redemptions of shares bought without an initial sales charge).
Class B shares are not subject to an initial sales charge. They may be subject to a CDSC.
Class C shares are not subject to an initial sales charge and are subject to a CDSC only if the shares are redeemed during the first year.
Class M shares have a lower initial sales charge and a higher 12b-1 fee than class A shares and no CDSC (except on certain redemptions of shares bought without an initial sales charge).
Class R shares are not subject to an initial sales charge or CDSC and are available only to certain employer-sponsored retirement plans.
Class Y shares are not subject to an initial sales charge or CDSC, and carry no 12b-1 fee. They are generally only available to corporate and institutional clients and clients in other approved programs.
Comparative indexes
Barclays U.S. Aggregate Bond Index is an unmanaged index of U.S. investment-grade fixed-income securities.
BofA Merrill Lynch U.S. 3-Month Treasury Bill Index is an unmanaged index that seeks to measure the performance of U.S. Treasury bills available in the marketplace.
MSCI World Energy & Materials Index (ND) is a free float-adjusted market capitalization weighted index that is designed to measure the equity market performance of developed markets in the energy and materials sector.
S&P 500 Index is an unmanaged index of common stock performance.
Indexes assume reinvestment of all distributions and do not account for fees. Securities and performance of a fund and an index will differ. You cannot invest directly in an index.
16 Global Natural Resources Fund
Other information for shareholders
Proxy voting
Putnam is committed to managing our mutual funds in the best interests of our shareholders. The Putnam funds’ proxy voting guidelines and procedures, as well as information regarding how your fund voted proxies relating to portfolio securities during the 12-month period ended June 30, 2014, are available in the Individual Investors section of putnam.com, and on the Securities and Exchange Commission (SEC) website, www.sec.gov. If you have questions about finding forms on the SEC’s website, you may call the SEC at 1-800-SEC-0330. You may also obtain the Putnam funds’ proxy voting guidelines and procedures at no charge by calling Putnam’s Shareholder Services at 1-800-225-1581.
Fund portfolio holdings
The fund will file a complete schedule of its portfolio holdings with the SEC for the first and third quarters of each fiscal year on Form N-Q. Shareholders may obtain the fund’s Form N-Q on the SEC’s website at www.sec.gov. In addition, the fund’s Form N-Q may be reviewed and copied at the SEC’s Public Reference Room in Washington, D.C. You may call the SEC at 1-800-SEC-0330 for information about the SEC’s website or the operation of the Public Reference Room.
Trustee and employee fund ownership
Putnam employees and members of the Board of Trustees place their faith, confidence, and, most importantly, investment dollars in Putnam mutual funds. As of August 31, 2014, Putnam employees had approximately $498,000,000 and the Trustees had approximately $138,000,000 invested in Putnam mutual funds. These amounts include investments by the Trustees’ and employees’ immediate family members as well as investments through retirement and deferred compensation plans.
Global Natural Resources Fund 17
Important notice regarding Putnam’s privacy policy
In order to conduct business with our shareholders, we must obtain certain personal information such as account holders’ names, addresses, Social Security numbers, and dates of birth. Using this information, we are able to maintain accurate records of accounts and transactions.
It is our policy to protect the confidentiality of our shareholder information, whether or not a shareholder currently owns shares of our funds. In particular, it is our policy not to sell information about you or your accounts to outside marketing firms. We have safeguards in place designed to prevent unauthorized access to our computer systems and procedures to protect personal information from unauthorized use.
Under certain circumstances, we must share account information with outside vendors who provide services to us, such as mailings and proxy solicitations. In these cases, the service providers enter into confidentiality agreements with us, and we provide only the information necessary to process transactions and perform other services related to your account. Finally, it is our policy to share account information with your financial representative, if you’ve listed one on your Putnam account.
18 Global Natural Resources Fund
Trustee approval of management contract
General conclusions
The Board of Trustees of the Putnam funds oversees the management of each fund and, as required by law, determines annually whether to approve the continuance of your fund’s management contract with Putnam Investment Management, LLC (“Putnam Management”), the sub-management contract with respect to your fund between Putnam Management and its affiliate, Putnam Investments Limited (“PIL”), and the sub-advisory contract among Putnam Management, PIL, and another affiliate, The Putnam Advisory Company (“PAC”). The Board of Trustees, with the assistance of its Contract Committee, requests and evaluates all information it deems reasonably necessary under the circumstances in connection with its annual contract review. The Contract Committee consists solely of Trustees who are not “interested persons” (as this term is defined in the Investment Company Act of 1940, as amended (the “1940 Act”)) of the Putnam funds (“Independent Trustees”).
At the outset of the review process, members of the Board’s independent staff and independent legal counsel met with representatives of Putnam Management to review the annual contract review materials furnished to the Contract Committee during the course of the previous year’s review and to discuss possible changes in these materials that might be necessary or desirable for the coming year. Following these discussions and in consultation with the Contract Committee, the Independent Trustees’ independent legal counsel requested that Putnam Management furnish specified information, together with any additional information that Putnam Management considered relevant, to the Contract Committee. Over the course of several months ending in June 2014, the Contract Committee met on a number of occasions with representatives of Putnam Management, and separately in executive session, to consider the information that Putnam Management provided, as well as supplemental information provided in response to additional requests made by the Contract Committee. Throughout this process, the Contract Committee was assisted by the members of the Board’s independent staff and by independent legal counsel for the Putnam funds and the Independent Trustees.
In May 2014, the Contract Committee met in executive session to discuss and consider its preliminary recommendations with respect to the continuance of the contracts. At the Trustees’ June 20, 2014 meeting, the Contract Committee met in executive session with the other Independent Trustees to review a summary of the key financial, performance and other data that the Contract Committee considered in the course of its review. The Contract Committee then presented its written report, which summarized the key factors that the Committee had considered and set forth its final recommendations. The Contract Committee then recommended, and the Independent Trustees approved, the continuance of your fund’s management, sub-management and sub-advisory contracts, effective July 1, 2014. (Because PIL and PAC are affiliates of Putnam Management and Putnam Management remains fully responsible for all services provided by PIL and PAC, the Trustees have not attempted to evaluate PIL or PAC as separate entities, and all subsequent references to Putnam Management below should be deemed to include reference to PIL and PAC as necessary or appropriate in the context.)
The Independent Trustees’ approval was based on the following conclusions:
• That the fee schedule in effect for your fund represented reasonable compensation in light of the nature and quality of the services being
Global Natural Resources Fund 19
provided to the fund, the fees paid by competitive funds, and the costs incurred by Putnam Management in providing services to the fund; and
• That the fee schedule in effect for your fund represented an appropriate sharing between fund shareholders and Putnam Management of such economies of scale as may exist in the management of the fund at current asset levels.
These conclusions were based on a comprehensive consideration of all information provided to the Trustees and were not the result of any single factor. Some of the factors that figured particularly in the Trustees’ deliberations and how the Trustees considered these factors are described below, although individual Trustees may have evaluated the information presented differently, giving different weights to various factors. It is also important to recognize that the management arrangements for your fund and the other Putnam funds are the result of many years of review and discussion between the Independent Trustees and Putnam Management, that some aspects of the arrangements may receive greater scrutiny in some years than others, and that the Trustees’ conclusions may be based, in part, on their consideration of fee arrangements in previous years. For example, with some minor exceptions, the current fee arrangements under the management contracts for the Putnam funds were implemented at the beginning of 2010 following extensive review by the Contract Committee and discussions with representatives of Putnam Management, as well as approval by shareholders. Shareholders also voted overwhelmingly to approve these fee arrangements in early 2014, when they were asked to approve new management contracts (with the same fees and substantially identical other provisions) following the possible termination of the previous management contracts as a result of the death of the Honorable Paul G. Desmarais. (Mr. Desmarais, both directly and through holding companies, controlled a majority of the voting shares of Power Corporation of Canada, which (directly and indirectly) is the majority owner of Putnam Management. Mr. Desmarais’ voting control of shares of Power Corporation of Canada was transferred to The Desmarais Family Residuary Trust upon his death and this transfer, as a technical matter, may have constituted an “assignment” within the meaning of the 1940 Act, causing the Putnam funds’ management contracts to terminate automatically.)
Management fee schedules and total expenses
The Trustees reviewed the management fee schedules in effect for all Putnam funds, including fee levels and breakpoints. The Trustees also reviewed the total expenses of each Putnam fund, recognizing that in most cases management fees represented the major, but not the sole, determinant of total costs to shareholders.
In reviewing fees and expenses, the Trustees generally focus their attention on material changes in circumstances — for example, changes in assets under management, changes in a fund’s investment style, changes in Putnam Management’s operating costs or profitability, or changes in competitive practices in the mutual fund industry — that suggest that consideration of fee changes might be warranted. The Trustees concluded that the circumstances did not warrant changes to the management fee structure of your fund.
Under its management contract, your fund has the benefit of breakpoints in its management fee schedule that provide shareholders with economies of scale in the form of reduced fee levels as assets under management in the Putnam family of funds increase. The Trustees concluded that the fee schedule in effect for your fund represented an appropriate sharing of economies of scale between fund shareholders and Putnam Management.
20 Global Natural Resources Fund
As in the past, the Trustees also focused on the competitiveness of each fund’s total expense ratio. In order to ensure that expenses of the Putnam funds continue to meet competitive standards, the Trustees and Putnam Management have implemented certain expense limitations. These expense limitations were: (i) a contractual expense limitation applicable to all retail open-end funds of 32 basis points on investor servicing fees and expenses and (ii) a contractual expense limitation applicable to all open-end funds of 20 basis points on so-called “other expenses” (i.e., all expenses exclusive of management fees, investor servicing fees, distribution fees, investment-related expenses, interest, taxes, brokerage commissions, extraordinary expenses and acquired fund fees and expenses). These expense limitations serve in particular to maintain competitive expense levels for funds with large numbers of small shareholder accounts and funds with relatively small net assets. Most funds, including your fund, had sufficiently low expenses that these expense limitations did not apply. Putnam Management’s support for these expense limitation arrangements was an important factor in the Trustees’ decision to approve the continuance of your fund’s management, sub-management and sub-advisory contracts.
The Trustees reviewed comparative fee and expense information for a custom group of competitive funds selected by Lipper Inc. (“Lipper”). This comparative information included your fund’s percentile ranking for effective management fees and total expenses (excluding any applicable 12b-1 fee), which provides a general indication of your fund’s relative standing. In the custom peer group, your fund ranked in the first quintile in effective management fees (determined for your fund and the other funds in the custom peer group based on fund asset size and the applicable contractual management fee schedule) and in the second quintile in total expenses (excluding any applicable 12b-1 fees) as of December 31, 2013 (the first quintile representing the least expensive funds and the fifth quintile the most expensive funds). The fee and expense data reported by Lipper as of December 31, 2013 reflected the most recent fiscal year-end data available in Lipper’s database at that time.
In connection with their review of the management fees and total expenses of the Putnam funds, the Trustees also reviewed the costs of the services provided and the profits realized by Putnam Management and its affiliates from their contractual relationships with the funds. This information included trends in revenues, expenses and profitability of Putnam Management and its affiliates relating to the investment management, investor servicing and distribution services provided to the funds. In this regard, the Trustees also reviewed an analysis of Putnam Management’s revenues, expenses and profitability, allocated on a fund-by-fund basis, with respect to the funds’ management, distribution, and investor servicing contracts. For each fund, the analysis presented information about revenues, expenses and profitability for each of the agreements separately and for the agreements taken together on a combined basis. The Trustees concluded that, at current asset levels, the fee schedules in place represented reasonable compensation for the services being provided and represented an appropriate sharing of such economies of scale as may exist in the management of the Putnam funds at that time.
The information examined by the Trustees as part of their annual contract review for the Putnam funds has included for many years information regarding fees charged by Putnam Management and its affiliates to institutional clients such as defined benefit pension plans, college endowments, and the like. This information included comparisons of those fees with fees charged to the Putnam funds, as well as an assessment of the differences in the services provided to these different types of clients. The
Global Natural Resources Fund 21
Trustees observed that the differences in fee rates between institutional clients and mutual funds are by no means uniform when examined by individual asset sectors, suggesting that differences in the pricing of investment management services to these types of clients may reflect historical competitive forces operating in separate markets. The Trustees considered the fact that in many cases fee rates across different asset classes are higher on average for mutual funds than for institutional clients, as well as the differences between the services that Putnam Management provides to the Putnam funds and those that it provides to its institutional clients. The Trustees did not rely on these comparisons to any significant extent in concluding that the management fees paid by your fund are reasonable.
Investment performance
The quality of the investment process provided by Putnam Management represented a major factor in the Trustees’ evaluation of the quality of services provided by Putnam Management under your fund’s management contract. The Trustees were assisted in their review of the Putnam funds’ investment process and performance by the work of the investment oversight committees of the Trustees, which meet on a regular basis with the funds’ portfolio teams and with the Chief Investment Officer and other senior members of Putnam Management’s Investment Division throughout the year. The Trustees concluded that Putnam Management generally provides a high-quality investment process — based on the experience and skills of the individuals assigned to the management of fund portfolios, the resources made available to them, and in general Putnam Management’s ability to attract and retain high-quality personnel — but also recognized that this does not guarantee favorable investment results for every fund in every time period.
The Trustees considered that 2013 was a year of strong competitive performance for many of the Putnam funds, with only a relatively small number of exceptions. They noted that this strong performance was exemplified by the fact that the Putnam funds were recognized by Barron’s as the second-best performing mutual fund complex for both 2013 and the five-year period ended December 31, 2013. They also noted, however, the disappointing investment performance of some funds for periods ended December 31, 2013 and considered information provided by Putnam Management regarding the factors contributing to the underperformance and actions being taken to improve the performance of these particular funds. The Trustees indicated their intention to continue to monitor performance trends to assess the effectiveness of these efforts and to evaluate whether additional actions to address areas of underperformance are warranted.
For purposes of evaluating investment performance, the Trustees generally focus on competitive industry rankings for the one-year, three-year and five-year periods. For a number of Putnam funds with relatively unique investment mandates for which meaningful competitive performance rankings are not considered available, the Trustees evaluated performance based on comparisons of fund returns with the returns of selected investment benchmarks. In the case of your fund, the Trustees considered information about your fund’s total return and its performance relative to its benchmark over the one-year, three-year and five-year periods ended December 31, 2013. Your fund’s class A shares’ return net of fees and expenses was positive over the one-year, three-year and five-year periods, trailed the return of its benchmark over the one-year and three-year periods, and exceeded the return of its benchmark over the five-year period. The Trustees did not find any evidence of underperformance that would suggest a need for concern regarding the investment process for your fund. (When considering performance information, shareholders should be mindful
22 Global Natural Resources Fund
that past performance is not a guarantee of future results.)
The Trustees also considered Putnam Management’s continued efforts to support fund performance through initiatives including structuring compensation for portfolio managers and research analysts to enhance accountability for fund performance, emphasizing accountability in the portfolio management process, and affirming its commitment to a fundamental-driven approach to investing. The Trustees noted further that Putnam Management continued to strengthen its fundamental research capabilities by adding new investment personnel.
Brokerage and soft-dollar allocations; investor servicing
The Trustees considered various potential benefits that Putnam Management may receive in connection with the services it provides under the management contract with your fund. These include benefits related to brokerage allocation and the use of soft dollars, whereby a portion of the commissions paid by a fund for brokerage may be used to acquire research services that are expected to be useful to Putnam Management in managing the assets of the fund and of other clients. Subject to policies established by the Trustees, soft dollars generated by these means are used primarily to acquire brokerage and research services that enhance Putnam Management’s investment capabilities and supplement Putnam Management’s internal research efforts. However, the Trustees noted that a portion of available soft dollars continues to be used to pay fund expenses. The Trustees indicated their continued intent to monitor regulatory and industry developments in this area with the assistance of their Brokerage Committee and also indicated their continued intent to monitor the allocation of the Putnam funds’ brokerage in order to ensure that the principle of seeking best price and execution remains paramount in the portfolio trading process.
Putnam Management may also receive benefits from payments that the funds make to Putnam Management’s affiliates for investor or distribution services. In conjunction with the annual review of your fund’s management, sub-management and sub-advisory contracts, the Trustees reviewed your fund’s investor servicing agreement with Putnam Investor Services, Inc. (“PSERV”) and its distributor’s contracts and distribution plans with Putnam Retail Management Limited Partnership (“PRM”), both of which are affiliates of Putnam Management. The Trustees concluded that the fees payable by the funds to PSERV and PRM, as applicable, for such services are reasonable in relation to the nature and quality of such services, the fees paid by competitive funds, and the costs incurred by PSERV and PRM, as applicable, in providing such services.
Global Natural Resources Fund 23
Financial statements
These sections of the report, as well as the accompanying Notes, preceded by the Report of Independent Registered Public Accounting Firm, constitute the fund’s financial statements.
The fund’s portfolio lists all the fund’s investments and their values as of the last day of the reporting period. Holdings are organized by asset type and industry sector, country, or state to show areas of concentration and diversification.
Statement of assets and liabilities shows how the fund’s net assets and share price are determined. All investment and non-investment assets are added together. Any unpaid expenses and other liabilities are subtracted from this total. The result is divided by the number of shares to determine the net asset value per share, which is calculated separately for each class of shares. (For funds with preferred shares, the amount subtracted from total assets includes the liquidation preference of preferred shares.)
Statement of operations shows the fund’s net investment gain or loss. This is done by first adding up all the fund’s earnings — from dividends and interest income — and subtracting its operating expenses to determine net investment income (or loss). Then, any net gain or loss the fund realized on the sales of its holdings — as well as any unrealized gains or losses over the period — is added to or subtracted from the net investment result to determine the fund’s net gain or loss for the fiscal year.
Statement of changes in net assets shows how the fund’s net assets were affected by the fund’s net investment gain or loss, by distributions to shareholders, and by changes in the number of the fund’s shares. It lists distributions and their sources (net investment income or realized capital gains) over the current reporting period and the most recent fiscal year-end. The distributions listed here may not match the sources listed in the Statement of operations because the distributions are determined on a tax basis and may be paid in a different period from the one in which they were earned.
Financial highlights provide an overview of the fund’s investment results, per-share distributions, expense ratios, net investment income ratios, and portfolio turnover in one summary table, reflecting the five most recent reporting periods. In a semiannual report, the highlights table also includes the current reporting period.
24 Global Natural Resources Fund
Report of Independent Registered Public Accounting Firm
The Board of Trustees and Shareholders Putnam Global Natural Resources Fund:
We have audited the accompanying statement of assets and liabilities of Putnam Global Natural Resources Fund (the fund), including the fund’s portfolio, as of August 31, 2014, and the related statement of operations for the year then ended, the statements of changes in net assets for each of the years in the two-year period then ended, and the financial highlights for each of the years in the five-year period then ended. These financial statements and financial highlights are the responsibility of the fund’s management. Our responsibility is to express an opinion on these financial statements and financial highlights based on our audits.
We conducted our audits in accordance with the standards of the Public Company Accounting Oversight Board (United States). Those standards require that we plan and perform the audit to obtain reasonable assurance about whether the financial statements and financial highlights are free of material misstatement. An audit includes examining, on a test basis, evidence supporting the amounts and disclosures in the financial statements. Our procedures included confirmation of securities owned as of August 31, 2014, by correspondence with the custodian and brokers or by other appropriate auditing procedures. An audit also includes assessing the accounting principles used and significant estimates made by management, as well as evaluating the overall financial statement presentation. We believe that our audits provide a reasonable basis for our opinion.
In our opinion, the financial statements and financial highlights referred to above present fairly, in all material respects, the financial position of Putnam Global Natural Resources Fund as of August 31, 2014, the results of its operations for the year then ended, the changes in its net assets for each of the years in the two-year period then ended, and the financial highlights for each of the years in the five-year period then ended, in conformity with U.S. generally accepted accounting principles.
Boston, Massachusetts October 8, 2014
Global Natural Resources Fund 25
The fund’s portfolio 8/31/14
COMMON STOCKS (100.1%)*
Shares
Value
Capital markets (0.6%)
Uranium Participation Corp. (Canada) †
377,300
$1,818,313
1,818,313
Chemicals (21.0%)
Air Products & Chemicals, Inc.
30,000
3,996,300
Axiall Corp.
88,600
3,683,988
Chemtura Corp. †
150,300
3,710,907
Croda International PLC (United Kingdom)
103,954
3,765,680
Dow Chemical Co. (The)
213,500
11,432,925
Huntsman Corp.
230,300
6,192,767
Monsanto Co.
136,169
15,747,945
Solvay SA (Belgium)
29,693
4,672,060
Trinseo SA †
17,700
347,982
Tronox, Ltd. Class A
116,555
3,538,610
Wacker Chemie AG (Germany)
39,867
4,734,921
61,824,085
Construction and engineering (1.1%)
China WindPower Group, Ltd. (China) †
34,000,000
3,114,819
3,114,819
Construction materials (1.6%)
Cemex SAB de CV (Units) (Mexico)
3,573,200
4,735,393
4,735,393
Containers and packaging (6.8%)
MeadWestvaco Corp.
188,600
8,109,800
Packaging Corp. of America
61,900
4,208,581
Sealed Air Corp.
121,900
4,400,590
Smurfit Kappa Group PLC (Ireland)
144,906
3,271,059
19,990,030
Energy equipment and services (10.4%)
Aker Solutions ASA (Norway)
291,224
4,407,395
Dril-Quip, Inc. †
16,000
1,623,520
Ezion Holdings, Ltd. (Singapore)
1,190,000
2,095,993
Halliburton Co.
149,900
10,134,739
Schlumberger, Ltd.
94,800
10,393,872
SPT Energy Group, Inc. (China)
4,098,000
2,083,357
30,738,876
Food products (0.5%)
S&W Seed Co. † S
239,712
1,354,373
1,354,373
Independent power and renewable electricity producers (0.9%)
China Power New Energy Development Co., Ltd. (China) †
38,260,000
2,715,208
2,715,208
Metals and mining (5.3%)
Arrium, Ltd. (Australia)
2,937,251
2,153,448
Fortescue Metals Group, Ltd. (Australia)
650,754
2,534,408
Hi-Crush Partners LP (Units)
47,816
3,306,476
Outokumpu OYJ (Finland) †
380,088
2,936,570
United States Steel Corp.
41,100
1,588,515
voestalpine AG (Austria)
72,822
3,124,098
15,643,515
26 Global Natural Resources Fund
COMMON STOCKS (100.1%)* cont.
Shares
Value
Oil, gas, and consumable fuels (50.9%)
Antero Resources Corp. †
61,400
$3,551,990
BG Group PLC (United Kingdom)
439,410
8,764,783
Cabot Oil & Gas Corp.
135,800
4,554,732
Cairn Energy PLC (United Kingdom) †
2,816,188
8,396,832
Cobalt International Energy, Inc. †
226,879
3,482,593
CONSOL Energy, Inc.
88,600
3,568,808
EnCana Corp. (Canada)
357,700
8,247,530
Energen Corp.
34,800
2,800,704
EOG Resources, Inc.
109,100
11,987,908
EP Energy Corp. Class A † S
311,200
6,015,496
Exxon Mobil Corp.
101,438
10,089,023
Genel Energy PLC (United Kingdom) †
580,754
8,383,189
Gulfport Energy Corp. †
101,600
5,943,600
Kodiak Oil & Gas Corp. †
412,000
6,703,240
Noble Energy, Inc.
50,100
3,614,214
QEP Resources, Inc.
240,900
8,568,813
Royal Dutch Shell PLC Class A (United Kingdom)
582,873
23,591,476
Suncor Energy, Inc. (Canada)
236,500
9,707,528
Valero Energy Corp.
216,100
11,699,654
149,672,113
Water utilities (1.0%)
China Water Affairs Group, Ltd. (China)
7,766,000
2,795,742
2,795,742
Total common stocks (cost $267,946,059)
$294,402,467
SHORT-TERM INVESTMENTS (3.1%)*
Principal amount/shares
Value
Putnam Cash Collateral Pool, LLC 0.18% d
Shares 5,771,425
$5,771,425
Putnam Short Term Investment Fund 0.04% L
Shares 2,192,548
2,192,548
SSgA Prime Money Market Fund 0.03% P
Shares 110,000
110,000
U.S. Treasury Bills with an effective yield of 0.03%, December 4, 2014 Δ
$110,000
109,996
U.S. Treasury Bills with an effective yield of 0.05%, January 15, 2015 Δ
600,000
599,944
U.S. Treasury Bills with an effective yield of 0.04%, January 8, 2015 Δ
72,000
71,995
U.S. Treasury Bills with an effective yield of 0.02%, November 13, 2014 Δ
140,000
139,995
Total short-term investments (cost $8,995,824)
$8,995,903
TOTAL INVESTMENTS
Total investments (cost $276,941,883)
$303,398,370
Notes to the fund’s portfolio
Unless noted otherwise, the notes to the fund’s portfolio are for the close of the fund’s reporting period, which ran from September 1, 2013 through August 31, 2014 (the reporting period). Within the following notes to the portfolio, references to “ASC 820” represent Accounting Standards Codification 820 Fair Value Measurements and Disclosures and references to “OTC”, if any, represent over-the-counter.
*
Percentages indicated are based on net assets of $294,152,099.
Global Natural Resources Fund 27
†
Non-income-producing security.
Δ
This security, in part or in entirety, was pledged and segregated with the custodian for collateral on certain derivative contracts at the close of the reporting period.
d
Affiliated company. See Note 1 to the financial statements regarding securities lending. The rate quoted in the security description is the annualized 7-day yield of the fund at the close of the reporting period.
L
Affiliated company (Note 5). The rate quoted in the security description is the annualized 7-day yield of the fund at the close of the reporting period.
P
Security was pledged, or purchased with cash that was pledged, to the fund for collateral on certain derivative contracts. The rate quoted in the security description is the annualized 7-day yield of the fund at the close of the reporting period (Note 1).
S
Security on loan, in part or in entirety, at the close of the reporting period (Note 1).
At the close of the reporting period, the fund maintained liquid assets totaling $1,291,873 to cover certain derivatives contracts.
DIVERSIFICATION BY COUNTRY ⌂
Distribution of investments by country of risk at the close of the reporting period, excluding collateral received, if any (as a percentage of Portfolio Value):
United States
60.3%
United Kingdom
17.8
Canada
6.6
China
3.6
Mexico
1.6
Germany
1.6
Australia
1.6
Belgium
1.6
Norway
1.5
Ireland
1.1
Austria
1.0
Finland
1.0
Singapore
0.7
Total
100.0%
⌂ Methodology differs from that used for purposes of complying with the fund’s policy regarding investments in securities of foreign issuers, as discussed further in the fund’s prospectus.
FORWARD CURRENCY CONTRACTS at 8/31/14 (aggregate face value $100,088,218)
Counterparty
Currency
Contract type
Delivery date
Value
Aggregate face value
Unrealized appreciation/ (depreciation)
Barclays Bank PLC
Australian Dollar
Buy
10/15/14
$5,413,704
$5,476,738
$(63,034)
British Pound
Sell
9/17/14
908,833
824,418
(84,415)
Canadian Dollar
Buy
10/15/14
4,600,695
4,687,913
(87,218)
Euro
Buy
9/17/14
3,781,186
3,919,457
(138,271)
Singapore Dollar
Sell
11/19/14
2,324,191
2,326,985
2,794
Swiss Franc
Buy
9/17/14
2,836,263
2,899,333
(63,070)
Citibank, N.A.
Danish Krone
Buy
9/17/14
658,951
680,736
(21,785)
Euro
Buy
9/17/14
5,389,981
5,586,069
(196,088)
Credit Suisse International
Australian Dollar
Sell
10/15/14
230,658
233,227
2,569
Japanese Yen
Buy
11/19/14
11,913,515
12,065,375
(151,860)
Norwegian Krone
Sell
9/17/14
352,784
363,090
10,306
Swedish Krona
Buy
9/17/14
685,696
715,486
(29,790)
28 Global Natural Resources Fund
FORWARD CURRENCY CONTRACTS at 8/31/14 (aggregate face value $100,088,218) cont.
Counterparty
Currency
Contract type
Delivery date
Value
Aggregate face value
Unrealized appreciation/ (depreciation)
Deutsche Bank AG
Australian Dollar
Sell
10/15/14
$1,626,989
$1,631,955
$4,966
British Pound
Sell
9/17/14
4,034,720
4,139,515
104,795
Euro
Buy
9/17/14
747,433
769,332
(21,899)
Goldman Sachs International
Japanese Yen
Buy
11/19/14
401,418
406,571
(5,153)
HSBC Bank USA, National Association
Australian Dollar
Buy
10/15/14
4,336,401
4,406,918
(70,517)
British Pound
Buy
9/17/14
3,946,741
3,981,172
(34,431)
Canadian Dollar
Buy
10/15/14
1,232,567
1,255,963
(23,396)
Euro
Sell
9/17/14
4,256,216
4,409,296
153,080
JPMorgan Chase Bank N.A.
British Pound
Sell
9/17/14
4,677,957
4,718,429
40,472
Canadian Dollar
Buy
10/15/14
8,396,339
8,589,007
(192,668)
Euro
Sell
9/17/14
3,575,800
3,744,971
169,171
Japanese Yen
Sell
11/19/14
1,018,635
1,031,569
12,934
Norwegian Krone
Sell
9/17/14
586,940
604,366
17,426
Swiss Franc
Buy
9/17/14
2,393,420
2,401,359
(7,939)
State Street Bank and Trust Co.
Australian Dollar
Buy
10/15/14
1,829,152
1,849,487
(20,335)
Euro
Buy
9/17/14
6,794,572
7,137,652
(343,080)
Israeli Shekel
Buy
10/15/14
195,813
204,173
(8,360)
UBS AG
Euro
Buy
9/17/14
5,294,318
5,488,767
(194,449)
WestPac Banking Corp.
British Pound
Sell
9/17/14
3,071,438
3,097,800
26,362
Euro
Buy
9/17/14
425,622
441,089
(15,467)
Total
$(1,228,350)
Global Natural Resources Fund 29
ASC 820 establishes a three-level hierarchy for disclosure of fair value measurements. The valuation hierarchy is based upon the transparency of inputs to the valuation of the fund’s investments. The three levels are defined as follows:
Level 1: Valuations based on quoted prices for identical securities in active markets.
Level 2: Valuations based on quoted prices in markets that are not active or for which all significant inputs are observable, either directly or indirectly.
Level 3: Valuations based on inputs that are unobservable and significant to the fair value measurement.
The following is a summary of the inputs used to value the fund’s net assets as of the close of the reporting period:
Valuation inputs
Investments in securities:
Level 1
Level 2
Level 3
Common stocks*:
Consumer staples
$1,354,373
$—
$—
Energy
180,410,989
—
—
Financials
1,818,313
—
—
Industrials
3,114,819
—
—
Materials
102,193,023
—
—
Utilities
5,510,950
—
—
Total common stocks
294,402,467
—
—
Short-term investments
2,302,548
6,693,355
—
Totals by level
$296,705,015
$6,693,355
$—
Valuation inputs
Other financial instruments:
Level 1
Level 2
Level 3
Forward currency contracts
$—
$(1,228,350)
$—
Totals by level
$—
$(1,228,350)
$—
* Common stock classifications are presented at the sector level, which may differ from the fund’s portfolio presentation.
The accompanying notes are an integral part of these financial statements.
30 Global Natural Resources Fund
Statement of assets and liabilities 8/31/14
ASSETS
Investment in securities, at value, including $5,842,105 of securities on loan (Note 1):
Affiliated issuers (identified cost $7,963,973) (Notes 1 and 5)
7,963,973
Foreign currency (cost $27) (Note 1)
27
Dividends, interest and other receivables
674,247
Foreign tax reclaim
35,261
Receivable for shares of the fund sold
88,267
Unrealized appreciation on forward currency contracts (Note 1)
544,875
Prepaid assets
26,414
Total assets
304,767,461
LIABILITIES
Payable for investments purchased
1,837,621
Payable for shares of the fund repurchased
524,766
Payable for compensation of Manager (Note 2)
153,185
Payable for custodian fees (Note 2)
9,142
Payable for investor servicing fees (Note 2)
56,547
Payable for Trustee compensation and expenses (Note 2)
118,768
Payable for administrative services (Note 2)
1,170
Payable for distribution fees (Note 2)
137,061
Unrealized depreciation on forward currency contracts (Note 1)
1,773,225
Collateral on securities loaned, at value (Note 1)
5,771,425
Collateral on certain derivative contracts, at value (Note 1)
110,000
Other accrued expenses
122,452
Total liabilities
10,615,362
Net assets
$294,152,099
REPRESENTED BY
Paid-in capital (Unlimited shares authorized) (Notes 1 and 4)
$316,493,641
Undistributed net investment income (Note 1)
1,316,533
Accumulated net realized loss on investments and foreign currency transactions (Note 1)
(48,884,346)
Net unrealized appreciation of investments and assets and liabilities in foreign currencies
25,226,271
Total — Representing net assets applicable to capital shares outstanding
$294,152,099
(Continued on next page)
The accompanying notes are an integral part of these financial statements.
Global Natural Resources Fund 31
Statement of assets and liabilities (Continued)
COMPUTATION OF NET ASSET VALUE AND OFFERING PRICE
Net asset value and redemption price per class A share ($238,702,788 divided by 9,965,123 shares)
$23.95
Offering price per class A share (100/94.25 of $23.95)*
$25.41
Net asset value and offering price per class B share ($10,791,287 divided by 509,175 shares)**
$21.19
Net asset value and offering price per class C share ($12,205,088 divided by 563,736 shares)**
$21.65
Net asset value and redemption price per class M share ($4,246,690 divided by 187,621 shares)
$22.63
Offering price per class M share (100/96.50 of $22.63)*
$23.45
Net asset value, offering price and redemption price per class R share ($14,257,960 divided by 608,622 shares)
$23.43
Net asset value, offering price and redemption price per class Y share ($13,948,286 divided by 577,048 shares)
$24.17
*
On single retail sales of less than $50,000. On sales of $50,000 or more the offering price is reduced.
**
Redemption price per share is equal to net asset value less any applicable contingent deferred sales charge.
The accompanying notes are an integral part of these financial statements.
32 Global Natural Resources Fund
Statement of operations Year ended 8/31/14
INVESTMENT INCOME
Dividends (net of foreign tax of $407,294)
$6,489,924
Interest (including interest income of $2,060 from investments in affiliated issuers) (Note 5)
3,200
Securities lending (note 1)
12,750
Total investment income
6,505,874
EXPENSES
Compensation of Manager (Note 2)
2,019,594
Investor servicing fees (Note 2)
706,092
Custodian fees (Note 2)
37,303
Trustee compensation and expenses (Note 2)
22,096
Distribution fees (Note 2)
932,026
Administrative services (Note 2)
8,455
Other
252,928
Total expenses
3,978,494
Expense reduction (Note 2)
(63,669)
Net expenses
3,914,825
Net investment income
2,591,049
Net realized gain on investments (Notes 1 and 3)
44,494,119
Net realized loss on swap contracts (Note 1)
(752,951)
Net realized gain on foreign currency transactions (Note 1)
1,008,563
Net realized gain on written options (Notes 1 and 3)
418
Net unrealized depreciation of assets and liabilities in foreign currencies during the year
(572,566)
Net unrealized appreciation of investments during the year
12,053,307
Net gain on investments
56,230,890
Net increase in net assets resulting from operations
$58,821,939
The accompanying notes are an integral part of these financial statements.
Global Natural Resources Fund 33
Statement of changes in net assets
DECREASE IN NET ASSETS
Year ended 8/31/14
Year ended 8/31/13
Operations:
Net investment income
$2,591,049
$2,400,896
Net realized gain on investments and foreign currency transactions
44,750,149
598,934
Net unrealized appreciation of investments and assets and liabilities in foreign currencies
11,480,741
15,839,360
Net increase in net assets resulting from operations
58,821,939
18,839,190
Distributions to shareholders (Note 1):
From ordinary income
Net investment income
Class A
—
(2,144,610)
Class B
—
(14,844)
Class C
—
(17,596)
Class M
—
(15,020)
Class R
—
(83,705)
Class Y
—
(113,099)
Redemption fees (Note 1)
—
8,174
Decrease from capital share transactions (Note 4)
(77,702,927)
(24,094,817)
Total decrease in net assets
(18,880,988)
(7,636,327)
NET ASSETS
Beginning of year
313,033,087
320,669,414
End of year (including undistributed net investment income of $1,316,533 and $1,614,942, respectively)
$294,152,099
$313,033,087
The accompanying notes are an integral part of these financial statements.
34 Global Natural Resources Fund
This page left blank intentionally.
Global Natural Resources Fund 35
Financial highlights (For a common share outstanding throughout the period)
INVESTMENT OPERATIONS:
LESS DISTRIBUTIONS:
RATIOS AND SUPPLEMENTAL DATA:
Period ended
Net asset value, beginning of period
Net investment income (loss)a
Net realized and unrealized gain (loss) on investments
Total from investment operations
From net investment income
Total distributions
Redemption fees
Non-recurring reimbursements
Net asset value, end of period
Total return at net asset value (%)b
Net assets, end of period (in thousands)
Ratio of expenses to average net assets (%)c
Ratio of net investment income (loss) to average net assets (%)
Portfolio turnover (%)
Class A
August 31, 2014
$20.09
.19
3.67
3.86
—
—
—
—
$23.95
19.21
$238,703
1.19
.83
101
August 31, 2013
19.18
.17
.91
1.08
(.17)
(.17)
—d
—
20.09
5.62
224,519
1.23
.85
104
August 31, 2012
20.81
.23
(1.30)
(1.07)
(.56)
(.56)
—d
—
19.18
(5.08)
262,969
1.29
1.18
80
August 31, 2011
16.62
.15
4.44
4.59
(.40)
(.40)
—d
—d,e
20.81
27.53
322,408
1.26
.66
90
August 31, 2010
16.87
.13
(.18)
(.05)
(.20)
(.20)
—d
—
16.62
(.44)
284,668
1.39
.71
107
Class B
August 31, 2014
$17.91
.02
3.26
3.28
—
—
—
—
$21.19
18.31
$10,791
1.94
.08
101
August 31, 2013
17.10
.02
.81
.83
(.02)
(.02)
—d
—
17.91
4.84
12,561
1.98
.10
104
August 31, 2012
18.58
.08
(1.16)
(1.08)
(.40)
(.40)
—d
—
17.10
(5.78)
15,561
2.04
.46
80
August 31, 2011
14.87
(.02)
3.99
3.97
(.26)
(.26)
—d
—d,e
18.58
26.58
21,166
2.01
(.10)
90
August 31, 2010
15.11
(.01)
(.15)
(.16)
(.08)
(.08)
—d
—
14.87
(1.15)
21,418
2.14
(.05)
107
Class C
August 31, 2014
$18.30
.02
3.33
3.35
—
—
—
—
$21.65
18.31
$12,205
1.94
.08
101
August 31, 2013
17.47
.02
.83
.85
(.02)
(.02)
—d
—
18.30
4.89
11,890
1.98
.10
104
August 31, 2012
18.98
.08
(1.19)
(1.11)
(.40)
(.40)
—d
—
17.47
(5.81)
13,564
2.04
.43
80
August 31, 2011
15.20
(.01)
4.07
4.06
(.28)
(.28)
—d
—d,e
18.98
26.61
16,797
2.01
(.04)
90
August 31, 2010
15.47
(.01)
(.16)
(.17)
(.10)
(.10)
—d
—
15.20
(1.21)
13,292
2.14
(.04)
107
Class M
August 31, 2014
$19.08
.07
3.48
3.55
—
—
—
—
$22.63
18.61
$4,247
1.69
.33
101
August 31, 2013
18.21
.06
.87
.93
(.06)
(.06)
—d
—
19.08
5.11
3,873
1.73
.34
104
August 31, 2012
19.77
.13
(1.23)
(1.10)
(.46)
(.46)
—d
—
18.21
(5.53)
4,999
1.79
.70
80
August 31, 2011
15.82
.03
4.23
4.26
(.31)
(.31)
—d
—d,e
19.77
26.86
6,233
1.76
.17
90
August 31, 2010
16.08
.04
(.17)
(.13)
(.13)
(.13)
—d
—
15.82
(.91)
5,141
1.89
.20
107
Class R
August 31, 2014
$19.70
.13
3.60
3.73
—
—
—
—
$23.43
18.93
$14,258
1.44
.57
101
August 31, 2013
18.81
.12
.89
1.01
(.12)
(.12)
—d
—
19.70
5.36
13,888
1.48
.60
104
August 31, 2012
20.41
.18
(1.27)
(1.09)
(.51)
(.51)
—d
—
18.81
(5.28)
13,838
1.54
.94
80
August 31, 2011
16.31
.10
4.36
4.46
(.36)
(.36)
—d
—d,e
20.41
27.27
16,971
1.51
.46
90
August 31, 2010
16.58
.09
(.19)
(.10)
(.17)
(.17)
—d
—
16.31
(.72)
11,192
1.64
.48
107
Class Y
August 31, 2014
$20.23
.25
3.69
3.94
—
—
—
—
$24.17
19.48
$13,948
.94
1.13
101
August 31, 2013
19.31
.21
.93
1.14
(.22)
(.22)
—d
—
20.23
5.92
46,303
.98
1.01
104
August 31, 2012
20.96
.28
(1.31)
(1.03)
(.62)
(.62)
—d
—
19.31
(4.85)
9,739
1.04
1.44
80
August 31, 2011
16.73
.21
4.47
4.68
(.45)
(.45)
—d
—d,e
20.96
27.89
11,535
1.01
.94
90
August 31, 2010
16.97
.18
(.18)
—d
(.24)
(.24)
—d
—
16.73
(.16)
9,069
1.14
.95
107
See notes to financial highlights at the end of this section.
The accompanying notes are an integral part of these financial statements.
36
Global Natural Resources Fund
Global Natural Resources Fund
37
Financial highlights (Continued)
aPer share net investment income (loss) has been determined on the basis of the weighted average number of shares outstanding during the period.
bTotal return assumes dividend reinvestment and does not reflect the effect of sales charges.
cIncludes amounts paid through expense offset and brokerage/service arrangements, if any (Note 2). Also excludes acquired fund fees and expenses, if any.
dAmount represents less than $0.01 per share.
eReflects a non-recurring reimbursement related to restitution amounts in connection with a distribution plan approved by the Securities and Exchange Commission (SEC) which amounted to less than $0.01 per share outstanding on July 21, 2011. Also reflects a non-recurring reimbursement related to short-term trading related lawsuits, which amounted to less than $0.01 per share outstanding on May 11, 2011.
The accompanying notes are an integral part of these financial statements.
38 Global Natural Resources Fund
Notes to financial statements 8/31/14
Within the following Notes to financial statements, references to “State Street” represent State Street Bank and Trust Company, references to “the SEC” represent the Securities and Exchange Commission, references to “Putnam Management” represent Putnam Investment Management, LLC, the fund’s manager, an indirect wholly-owned subsidiary of Putnam Investments, LLC and references to “OTC”, if any, represent over-the-counter. Unless otherwise noted, the “reporting period” represents the period from September 1, 2013 through August 31, 2014.
Putnam Global Natural Resources Fund (the fund) is a Massachusetts business trust, which is registered under the Investment Company Act of 1940, as amended, as a non-diversified, open-end management investment company. The goal of the fund is to seek capital appreciation by concentrating in the energy and other natural resources industries. The fund invests mainly in common stocks (growth or value stocks or both) of large and midsize companies worldwide that Putnam Management believes have favorable investment potential. Potential investments include companies in the discovery, development, production or distribution of energy or other natural resources, in the development of technologies for the production or efficient use of energy or other natural resources, and in the furnishing of related supplies or services. The fund may purchase stocks of companies with stock prices that reflect a value lower than that which Putnam Management places on the company. Putnam Management may also consider other factors that it believes will cause the stock price to rise. Putnam Management may consider, among other factors, a company’s valuation, financial strength, growth potential, competitive position in its industry, projected future earnings, cash flows and dividends when deciding whether to buy or sell investments.
The fund offers class A, class B, class C, class M, class R and class Y shares. Class A and class M shares are sold with a maximum front-end sales charge of 5.75% and 3.50%, respectively, and generally do not pay a contingent deferred sales charge. Class B shares, which convert to class A shares after approximately eight years, do not pay a front-end sales charge and are subject to a contingent deferred sales charge if those shares are redeemed within six years of purchase. Class C shares have a one-year 1.00% contingent deferred sales charge and do not convert to class A shares. Class R shares, which are not available to all investors, are sold at net asset value. The expenses for class A, class B, class C, class M and class R shares may differ based on the distribution fee of each class, which is identified in Note 2. Class Y shares, which are sold at net asset value, are generally subject to the same expenses as class A, class B, class C, class M and class R shares, but do not bear a distribution fee. Class Y shares are not available to all investors.
In the normal course of business, the fund enters into contracts that may include agreements to indemnify another party under given circumstances. The fund’s maximum exposure under these arrangements is unknown as this would involve future claims that may be, but have not yet been, made against the fund. However, the fund’s management team expects the risk of material loss to be remote.
Note 1: Significant accounting policies
The following is a summary of significant accounting policies consistently followed by the fund in the preparation of its financial statements. The preparation of financial statements is in conformity with accounting principles generally accepted in the United States of America and requires management to make estimates and assumptions that affect the reported amounts of assets and liabilities in the financial statements and the reported amounts of increases and decreases in net assets from operations. Actual results could differ from those estimates. Subsequent events after the Statement of assets and liabilities date through the date that the financial statements were issued have been evaluated in the preparation of the financial statements.
A short-term trading fee of 1.00% may have applied to redemptions (including exchanges into another fund) of shares purchased before January 2, 2013 and held for 90 days or less. The short-term trading fee was accounted for as an addition to paid-in-capital. No short-term trading fee applies to shares purchased on or after January 2, 2013.
Investment income, realized and unrealized gains and losses and expenses of the fund are borne pro-rata based on the relative net assets of each class to the total net assets of the fund, except that each class bears expenses unique to that class (including the distribution fees applicable to such classes). Each class votes as a class only with respect to its own distribution plan or other matters on which a class vote is required by law or determined by the Trustees. If the fund were liquidated, shares of each class would receive their pro-rata share of the net assets of the fund. In addition, the Trustees declare separate dividends on each class of shares.
Global Natural Resources Fund 39
Security valuation Investments for which market quotations are readily available are valued at the last reported sales price on their principal exchange, or official closing price for certain markets, and are classified as Level 1 securities under Accounting Standards Codification 820 Fair Value Measurements and Disclosures (ASC 820). If no sales are reported, as in the case of some securities that are traded OTC, a security is valued at its last reported bid price and is generally categorized as a Level 2 security.
Investments in open-end investment companies (excluding exchange traded funds), if any, which can be classified as Level 1 or Level 2 securities, are valued based on their net asset value. The net asset value of such investment companies equals the total value of their assets less their liabilities and divided by the number of their outstanding shares.
Market quotations are not considered to be readily available for certain debt obligations and other investments; such investments are valued on the basis of valuations furnished by an independent pricing service approved by the Trustees or dealers selected by Putnam Management. Such services or dealers determine valuations for normal institutional-size trading units of such securities using methods based on market transactions for comparable securities and various relationships, generally recognized by institutional traders, between securities (which consider such factors as security prices, yields, maturities and ratings). These securities will generally be categorized as Level 2. Short-term securities with remaining maturities of 60 days or less may be valued at amortized cost, which approximates fair value and are classified as Level 2 securities.
Many securities markets and exchanges outside the U.S. close prior to the close of the New York Stock Exchange and therefore the closing prices for securities in such markets or on such exchanges may not fully reflect events that occur after such close but before the close of the New York Stock Exchange. Accordingly, on certain days, the fund will fair value foreign equity securities taking into account multiple factors including movements in the U.S. securities markets, currency valuations and comparisons to the valuation of American Depository Receipts, exchange-traded funds and futures contracts. These securities, which would generally be classified as Level 1 securities, will be transferred to Level 2 of the fair value hierarchy when they are valued at fair value. The number of days on which fair value prices will be used will depend on market activity and it is possible that fair value prices will be used by the fund to a significant extent. Securities quoted in foreign currencies, if any, are translated into U.S. dollars at the current exchange rate.
To the extent a pricing service or dealer is unable to value a security or provides a valuation that Putnam Management does not believe accurately reflects the security’s fair value, the security will be valued at fair value by Putnam Management in accordance with policies and procedures approved by the Trustees. Certain investments, including certain restricted and illiquid securities and derivatives, are also valued at fair value following procedures approved by the Trustees. These valuations consider such factors as significant market or specific security events such as interest rate or credit quality changes, various relationships with other securities, discount rates, U.S. Treasury, U.S. swap and credit yields, index levels, convexity exposures and recovery rates. These securities are classified as Level 2 or as Level 3 depending on the priority of the significant inputs.
Such valuations and procedures are reviewed periodically by the Trustees. The fair value of securities is generally determined as the amount that the fund could reasonably expect to realize from an orderly disposition of such securities over a reasonable period of time. By its nature, a fair value price is a good faith estimate of the value of a security in a current sale and does not reflect an actual market price, which may be different by a material amount.
Security transactions and related investment income Security transactions are recorded on the trade date (the date the order to buy or sell is executed). Gains or losses on securities sold are determined on the identified cost basis.
Interest income, net of any applicable withholding taxes, is recorded on the accrual basis. Dividend income, net of any applicable withholding taxes, is recognized on the ex-dividend date except that certain dividends from foreign securities, if any, are recognized as soon as the fund is informed of the ex-dividend date. Non-cash dividends, if any, are recorded at the fair value of the securities received. Dividends representing a return of capital or capital gains, if any, are reflected as a reduction of cost and/or as a realized gain.
All premiums/discounts are amortized/accreted on a yield-to-maturity basis.
Foreign currency translation The accounting records of the fund are maintained in U.S. dollars. The fair value of foreign securities, currency holdings, and other assets and liabilities is recorded in the books and records of the fund after translation to U.S. dollars based on the exchange rates on that day. The cost of each security is determined using historical exchange rates. Income and withholding taxes are translated at prevailing exchange rates when earned or incurred. The fund does not isolate that portion of realized or unrealized gains or losses resulting from changes in the foreign exchange rate on investments from fluctuations arising from changes in the market
40 Global Natural Resources Fund
prices of the securities. Such gains and losses are included with the net realized and unrealized gain or loss on investments. Net realized gains and losses on foreign currency transactions represent net realized exchange gains or losses on closed forward currency contracts, disposition of foreign currencies, currency gains and losses realized between the trade and settlement dates on securities transactions and the difference between the amount of investment income and foreign withholding taxes recorded on the fund’s books and the U.S. dollar equivalent amounts actually received or paid. Net unrealized appreciation and depreciation of assets and liabilities in foreign currencies arise from changes in the value of open forward currency contracts and assets and liabilities other than investments at the period end, resulting from changes in the exchange rate.
Options contracts The fund uses options contracts to hedge against changes in values of securities it owns, owned or expects to own.
The potential risk to the fund is that the change in value of options contracts may not correspond to the change in value of the hedged instruments. In addition, losses may arise from changes in the value of the underlying instruments if there is an illiquid secondary market for the contracts, if interest or exchange rates move unexpectedly or if the counterparty to the contract is unable to perform. Realized gains and losses on purchased options are included in realized gains and losses on investment securities. If a written call option is exercised, the premium originally received is recorded as an addition to sales proceeds. If a written put option is exercised, the premium originally received is recorded as a reduction to the cost of investments.
Exchange traded options are valued at the last sale price or, if no sales are reported, the last bid price for purchased options and the last ask price for written options. OTC traded options are valued using prices supplied by dealers.
Options on swaps are similar to options on securities except that the premium paid or received is to buy or grant the right to enter into a previously agreed upon interest rate or credit default contract. Forward premium swap option contracts include premiums that have extended settlement dates. The delayed settlement of the premiums is factored into the daily valuation of the option contracts. In the case of interest rate cap and floor contracts, in return for a premium, ongoing payments between two parties are based on interest rates exceeding a specified rate, in the case of a cap contract, or falling below a specified rate in the case of a floor contract.
Written option contracts outstanding at period end, if any, are listed after the fund’s portfolio.
Forward currency contracts The fund buys and sells forward currency contracts, which are agreements between two parties to buy and sell currencies at a set price on a future date. These contracts are used to hedge foreign exchange risk.
The U.S. dollar value of forward currency contracts is determined using current forward currency exchange rates supplied by a quotation service. The fair value of the contract will fluctuate with changes in currency exchange rates. The contract is marked to market daily and the change in fair value is recorded as an unrealized gain or loss. The fund records a realized gain or loss equal to the difference between the value of the contract at the time it was opened and the value at the time it was closed when the contract matures or by delivery of the currency. The fund could be exposed to risk if the value of the currency changes unfavorably, if the counterparties to the contracts are unable to meet the terms of their contracts or if the fund is unable to enter into a closing position. Risks may exceed amounts recognized on the Statement of assets and liabilities.
Forward currency contracts outstanding at period end, if any, are listed after the fund’s portfolio.
Total return swap contracts The fund entered into OTC total return swap contracts, which are arrangements to exchange a market linked return for a periodic payment, both based on a notional principal amount, to gain exposure to specific sectors or industries.
To the extent that the total return of the security, index or other financial measure underlying the transaction exceeds or falls short of the offsetting interest rate obligation, the fund will receive a payment from or make a payment to the counterparty. OTC total return swap contracts are marked to market daily based upon quotations from an independent pricing service or market makers and the change, if any, is recorded as an unrealized gain or loss. Payments received or made are recorded as realized gains or losses. Certain OTC total return swap contracts may include extended effective dates. Payments related to these swap contracts are accrued based on the terms of the contract. The fund could be exposed to credit or market risk due to unfavorable changes in the fluctuation of interest rates or in the price of the underlying security or index, the possibility that there is no liquid market for these agreements or that the counterparty may default on its obligation to perform. The fund’s maximum risk of loss from counterparty risk is the fair value of the contract. This risk may be mitigated by having a master netting arrangement between the fund and the counterparty. Risk of loss may exceed amounts recognized on the Statement of assets and liabilities.
Global Natural Resources Fund 41
OTC total return swap contracts outstanding, including their respective notional amounts at period end, if any, are listed after the fund’s portfolio.
Master agreements The fund is a party to ISDA (International Swaps and Derivatives Association, Inc.) Master Agreements (Master Agreements) with certain counterparties that govern OTC derivative and foreign exchange contracts entered into from time to time. The Master Agreements may contain provisions regarding, among other things, the parties’ general obligations, representations, agreements, collateral requirements, events of default and early termination. With respect to certain counterparties, in accordance with the terms of the Master Agreements, collateral posted to the fund is held in a segregated account by the fund’s custodian and with respect to those amounts which can be sold or repledged, is presented in the fund’s portfolio.
Collateral pledged by the fund is segregated by the fund’s custodian and identified in the fund’s portfolio. Collateral can be in the form of cash or debt securities issued by the U.S. Government or related agencies or other securities as agreed to by the fund and the applicable counterparty. Collateral requirements are determined based on the fund’s net position with each counterparty.
Termination events applicable to the fund may occur upon a decline in the fund’s net assets below a specified threshold over a certain period of time. Termination events applicable to counterparties may occur upon a decline in the counterparty’s long-term and short-term credit ratings below a specified level. In each case, upon occurrence, the other party may elect to terminate early and cause settlement of all derivative and foreign exchange contracts outstanding, including the payment of any losses and costs resulting from such early termination, as reasonably determined by the terminating party. Any decision by one or more of the fund’s counterparties to elect early termination could impact the fund’s future derivative activity.
At the close of the reporting period, the fund had a net liability position of $1,391,239 on open derivative contracts subject to the Master Agreements. Collateral posted by the fund at period end for these agreements totaled $811,870 and may include amounts related to unsettled agreements.
Securities lending The fund may lend securities, through its agent, to qualified borrowers in order to earn additional income. The loans are collateralized by cash in an amount at least equal to the fair value of the securities loaned. The fair value of securities loaned is determined daily and any additional required collateral is allocated to the fund on the next business day. The risk of borrower default will be borne by the fund’s agent; the fund will bear the risk of loss with respect to the investment of the cash collateral. Income from securities lending is included in investment income on the Statement of operations. Cash collateral is invested in Putnam Cash Collateral Pool, LLC, a limited liability company managed by an affiliate of Putnam Management. Investments in Putnam Cash Collateral Pool, LLC are valued at its closing net asset value each business day. There are no management fees charged to Putnam Cash Collateral Pool, LLC. At the close of the reporting period, the fund received cash collateral of $5,771,425 and the value of securities loaned amounted to $5,842,105.
Interfund lending The fund, along with other Putnam funds, may participate in an interfund lending program pursuant to an exemptive order issued by the SEC. This program allows the fund to borrow from or lend to other Putnam funds that permit such transactions. Interfund lending transactions are subject to each fund’s investment policies and borrowing and lending limits. Interest earned or paid on the interfund lending transaction will be based on the average of certain current market rates. During the reporting period, the fund did not utilize the program.
Lines of credit The fund participates, along with other Putnam funds, in a $392.5 million unsecured committed line of credit and a $235.5 million unsecured uncommitted line of credit, both provided by State Street. Borrowings may be made for temporary or emergency purposes, including the funding of shareholder redemption requests and trade settlements. Interest is charged to the fund based on the fund’s borrowing at a rate equal to the Federal Funds rate plus 1.25% for the committed line of credit and the Federal Funds rate plus 1.30% for the uncommitted line of credit. A closing fee equal to 0.04% of the committed line of credit and 0.04% of the uncommitted line of credit has been paid by the participating funds. In addition, a commitment fee of 0.11% per annum on any unutilized portion of the committed line of credit is allocated to the participating funds based on their relative net assets and paid quarterly. During the reporting period, the fund had no borrowings against these arrangements.
Federal taxes It is the policy of the fund to distribute all of its taxable income within the prescribed time period and otherwise comply with the provisions of the Internal Revenue Code of 1986, as amended (the Code), applicable to regulated investment companies. It is also the intention of the fund to distribute an amount sufficient to avoid imposition of any excise tax under Section 4982 of the Code.
The fund is subject to the provisions of Accounting Standards Codification 740 Income Taxes (ASC 740). ASC 740 sets forth a minimum threshold for financial statement recognition of the benefit of a tax position taken or expected
42 Global Natural Resources Fund
to be taken in a tax return. The fund did not have a liability to record for any unrecognized tax benefits in the accompanying financial statements. No provision has been made for federal taxes on income, capital gains or unrealized appreciation on securities held nor for excise tax on income and capital gains. Each of the fund’s federal tax returns for the prior three fiscal years remains subject to examination by the Internal Revenue Service.
The fund may also be subject to taxes imposed by governments of countries in which it invests. Such taxes are generally based on either income or gains earned or repatriated. The fund accrues and applies such taxes to net investment income, net realized gains and net unrealized gains as income and/or capital gains are earned. In some cases, the fund may be entitled to reclaim all or a portion of such taxes, and such reclaim amounts, if any, are reflected as an asset on the fund’s books. In many cases, however, the fund may not receive such amounts for an extended period of time, depending on the country of investment.
At August 31, 2014, the fund had a capital loss carryover of $48,893,576 available to the extent allowed by the Code to offset future net capital gain, if any. The amounts of the carryovers and the expiration dates are:
Loss carryover
Short-term
Long-term
Total
Expiration
$48,893,576
N/A
$48,893,576
August 31, 2018
Under the Regulated Investment Company Modernization Act of 2010, the fund will be permitted to carry forward capital losses incurred in taxable years beginning after December 22, 2010 for an unlimited period. However, any losses incurred will be required to be utilized prior to the losses incurred in pre-enactment tax years. As a result of this ordering rule, pre-enactment capital loss carryforwards may be more likely to expire unused. Additionally, post-enactment capital losses that are carried forward will retain their character as either short-term or long-term capital losses rather than being considered all short-term as under previous law.
Distributions to shareholders Distributions to shareholders from net investment income are recorded by the fund on the ex-dividend date. Distributions from capital gains, if any, are recorded on the ex-dividend date and paid at least annually. The amount and character of income and gains to be distributed are determined in accordance with income tax regulations, which may differ from generally accepted accounting principles. These differences include temporary and/or permanent differences from foreign currency gains and losses, realized gains and losses on passive investment companies, income on swap contracts, and partnership income. Reclassifications are made to the fund’s capital accounts to reflect income and gains available for distribution (or available capital loss carryovers) under income tax regulations. At the close of the reporting period, the fund reclassified $340,426 to increase undistributed net investment income, $1,183 to decrease paid-in-capital and $339,243 to increase accumulated net realized loss.
The tax basis components of distributable earnings and the federal tax cost as of the close of the reporting period were as follows:
Unrealized appreciation
$36,072,402
Unrealized depreciation
(9,606,685)
Net unrealized appreciation
26,465,717
Capital loss carryforward
(48,893,576)
Undistributed ordinary income
106,743
Cost for federal income tax purposes
$276,932,653
Note 2: Management fee, administrative services and other transactions
The fund pays Putnam Management a management fee (based on the fund’s average net assets and computed and paid monthly) at annual rates that may vary based on the average of the aggregate net assets of most open-end funds, as defined in the fund’s management contract, sponsored by Putnam Management. Such annual rates may vary as follows:
0.780%
of the first $5 billion,
0.730%
of the next $5 billion,
0.680%
of the next $10 billion,
0.630%
of the next $10 billion,
0.580%
of the next $50 billion,
0.560%
of the next $50 billion,
0.550%
of the next $100 billion and
0.545%
of any excess thereafter.
Global Natural Resources Fund 43
The fund’s shareholders approved the fund’s current management contract with Putnam Management effective February 27, 2014. Shareholders were asked to approve the fund’s management contract following the death on October 8, 2013 of The Honourable Paul G. Desmarais, who had controlled directly and indirectly a majority of the voting shares of Power Corporation of Canada, the ultimate parent company of Putnam Management. The substantive terms of the management contract, including terms relating to fees, are identical to the terms of the fund’s previous management contract and reflect the rates provided in the table above.
Putnam Management has contractually agreed, through June 30, 2015, to waive fees or reimburse the fund’s expenses to the extent necessary to limit the cumulative expenses of the fund, exclusive of brokerage, interest, taxes, investment-related expenses, extraordinary expenses, acquired fund fees and expenses and payments under the fund’s investor servicing contract, investment management contract and distribution plans, on a fiscal year-to-date basis to an annual rate of 0.20% of the fund’s average net assets over such fiscal year-to-date period. During the reporting period, the fund’s expenses were not reduced as a result of this limit.
Putnam Investments Limited (PIL), an affiliate of Putnam Management, is authorized by the Trustees to manage a separate portion of the assets of the fund as determined by Putnam Management from time to time. Putnam Management pays a quarterly sub-management fee to PIL for its services at an annual rate of 0.35% of the average net assets of the portion of the fund managed by PIL.
The Putnam Advisory Company, LLC (PAC), an affiliate of Putnam Management, is authorized by the Trustees to manage a separate portion of the assets of the fund, as designated from time to time by Putnam Management or PIL. Putnam Management or PIL, as applicable, pays a quarterly sub-advisory fee to PAC for its services at the annual rate of 0.35% of the average net assets of the portion of the fund’s assets for which PAC is engaged as sub-adviser.
The fund reimburses Putnam Management an allocated amount for the compensation and related expenses of certain officers of the fund and their staff who provide administrative services to the fund. The aggregate amount of all such reimbursements is determined annually by the Trustees.
Custodial functions for the fund’s assets are provided by State Street. Custody fees are based on the fund’s asset level, the number of its security holdings and transaction volumes.
Putnam Investor Services, Inc., an affiliate of Putnam Management, provides investor servicing agent functions to the fund. Putnam Investor Services, Inc. received fees for investor servicing based on the fund’s retail asset level, the number of shareholder accounts in the fund and the level of defined contribution plan assets in the fund. Investor servicing fees will not exceed an annual rate of 0.32% of the fund’s average net assets. During the reporting period, the expenses for each class of shares related to investor servicing fees were as follows:
Class A
$512,100
Class B
25,947
Class C
26,557
Class M
8,998
Class R
30,772
Class Y
101,718
Total
$706,092
The fund has entered into expense offset arrangements with Putnam Investor Services, Inc. and State Street whereby Putnam Investor Services, Inc.’s and State Street’s fees are reduced by credits allowed on cash balances. The fund also reduced expenses through brokerage/service arrangements. For the reporting period, the fund’s expenses were reduced by $537 under the expense offset arrangements and by $63,132 under the brokerage/service arrangements.
Each Independent Trustee of the fund receives an annual Trustee fee, of which $206, as a quarterly retainer, has been allocated to the fund, and an additional fee for each Trustees meeting attended. Trustees also are reimbursed for expenses they incur relating to their services as Trustees.
The fund has adopted a Trustee Fee Deferral Plan (the Deferral Plan) which allows the Trustees to defer the receipt of all or a portion of Trustees fees payable on or after July 1, 1995. The deferred fees remain invested in certain Putnam funds until distribution in accordance with the Deferral Plan.
The fund has adopted an unfunded noncontributory defined benefit pension plan (the Pension Plan) covering all Trustees of the fund who have served as a Trustee for at least five years and were first elected prior to 2004. Benefits under the Pension Plan are equal to 50% of the Trustee’s average annual attendance and retainer fees for the three years ended December 31, 2005. The retirement benefit is payable during a Trustee’s lifetime, beginning the year following retirement, for the number of years of service through December 31, 2006. Pension expense
44 Global Natural Resources Fund
for the fund is included in Trustee compensation and expenses in the Statement of operations. Accrued pension liability is included in Payable for Trustee compensation and expenses in the Statement of assets and liabilities. The Trustees have terminated the Pension Plan with respect to any Trustee first elected after 2003.
The fund has adopted distribution plans (the Plans) with respect to its class A, class B, class C, class M and class R shares pursuant to Rule 12b–1 under the Investment Company Act of 1940. The purpose of the Plans is to compensate Putnam Retail Management Limited Partnership, an indirect wholly-owned subsidiary of Putnam Investments, LLC, for services provided and expenses incurred in distributing shares of the fund. The Plans provide for payments by the fund to Putnam Retail Management Limited Partnership at an annual rate of up to 0.35%, 1.00%, 1.00%, 1.00% and 1.00% of the average net assets attributable to class A, class B, class C, class M and class R shares, respectively. The Trustees have approved payment by the fund at an annual rate of 0.25%, 1.00%, 1.00%, 0.75% and 0.50% of the average net assets attributable to class A, class B, class C, class M and class R shares, respectively. During the reporting period, the class specific expenses related to distribution fees were as follows:
Class A
$589,157
Class B
118,925
Class C
122,139
Class M
31,078
Class R
70,727
Total
$932,026
For the reporting period, Putnam Retail Management Limited Partnership, acting as underwriter, received net commissions of $22,388 and $322 from the sale of class A and class M shares, respectively, and received $8,774 and $175 in contingent deferred sales charges from redemptions of class B and class C shares, respectively.
A deferred sales charge of up to 1.00% and 0.65% is assessed on certain redemptions of class A and class M shares, respectively. For the reporting period, Putnam Retail Management Limited Partnership, acting as underwriter, received $157 and no monies on class A and class M redemptions, respectively.
Note 3: Purchases and sales of securities
During the reporting period, cost of purchases and proceeds from sales of investment securities other than short-term investments aggregated $323,024,018 and $395,810,622, respectively. There were no purchases or proceeds from sales of long-term U.S. government securities.
Written option transactions during the reporting period are summarized as follows:
Written equity option contract amounts
Written equity option premiums
Written options outstanding at the beginning of the reporting period
$—
$—
Options opened
808,290
61,531
Options exercised
—
—
Options expired
(325,823)
(27,758)
Options closed
(482,467)
(33,773)
Written options outstanding at the end of the reporting period
$—
$—
Note 4: Capital shares
At the close of the reporting period, there was an unlimited number of shares of beneficial interest authorized. Transactions in capital shares were as follows:
Year ended 8/31/14
Year ended 8/31/13
Class A
Shares
Amount
Shares
Amount
Shares sold
614,431
$13,824,038
709,762
$14,224,586
Shares issued in connection with reinvestment of distributions
—
—
102,422
2,031,024
614,431
13,824,038
812,184
16,255,610
Shares repurchased
(1,823,370)
(40,643,671)
(3,349,537)
(66,747,099)
Net decrease
(1,208,939)
$(26,819,633)
(2,537,353)
$(50,491,489)
Global Natural Resources Fund 45
Year ended 8/31/14
Year ended 8/31/13
Class B
Shares
Amount
Shares
Amount
Shares sold
36,557
$722,246
92,317
$1,643,783
Shares issued in connection with reinvestment of distributions
—
—
800
14,217
36,557
722,246
93,117
1,658,000
Shares repurchased
(228,662)
(4,526,029)
(301,862)
(5,352,264)
Net decrease
(192,105)
$(3,803,783)
(208,745)
$(3,694,264)
Year ended 8/31/14
Year ended 8/31/13
Class C
Shares
Amount
Shares
Amount
Shares sold
64,456
$1,321,709
57,620
$1,046,683
Shares issued in connection with reinvestment of distributions
—
—
888
16,117
64,456
1,321,709
58,508
1,062,800
Shares repurchased
(150,520)
(3,047,558)
(185,014)
(3,360,789)
Net decrease
(86,064)
$(1,725,849)
(126,506)
$(2,297,989)
Year ended 8/31/14
Year ended 8/31/13
Class M
Shares
Amount
Shares
Amount
Shares sold
13,402
$286,277
11,357
$213,636
Shares issued in connection with reinvestment of distributions
—
—
787
14,866
13,402
286,277
12,144
228,502
Shares repurchased
(28,730)
(616,244)
(83,711)
(1,585,696)
Net decrease
(15,328)
$(329,967)
(71,567)
$(1,357,194)
Year ended 8/31/14
Year ended 8/31/13
Class R
Shares
Amount
Shares
Amount
Shares sold
181,030
$3,987,957
221,311
$4,320,916
Shares issued in connection with reinvestment of distributions
—
—
4,161
81,008
181,030
3,987,957
225,472
4,401,924
Shares repurchased
(277,394)
(5,984,988)
(256,335)
(5,005,439)
Net decrease
(96,364)
$(1,997,031)
(30,863)
$(603,515)
Year ended 8/31/14
Year ended 8/31/13
Class Y
Shares
Amount
Shares
Amount
Shares sold
353,800
$7,907,819
1,987,627
$38,431,057
Shares issued in connection with reinvestment of distributions
—
—
5,454
108,639
353,800
7,907,819
1,993,081
38,539,696
Shares repurchased
(2,065,960)
(50,934,483)
(208,231)
(4,190,062)
Net increase (decrease)
(1,712,160)
$(43,026,664)
1,784,850
$34,349,634
46 Global Natural Resources Fund
Note 5: Affiliated transactions
Transactions during the reporting period with Putnam Short Term Investment Fund, which is under common ownership and control, were as follows:
Name of affiliate
Fair value at the beginning of the reporting period
Purchase cost
Sale proceeds
Investment income
Fair value at the end of the reporting period
Putnam Short Term Investment Fund*
$422,477
$131,421,415
$129,651,344
$2,060
$2,192,548
Totals
$422,477
$131,421,415
$129,651,344
$2,060
$2,192,548
* Management fees charged to Putnam Short Term Investment Fund have been waived by Putnam Management.
Note 6: Market, credit and other risks
In the normal course of business, the fund trades financial instruments and enters into financial transactions where risk of potential loss exists due to changes in the market (market risk) or failure of the contracting party to the transaction to perform (credit risk). The fund may be exposed to additional credit risk that an institution or other entity with which the fund has unsettled or open transactions will default. Investments in foreign securities involve certain risks, including those related to economic instability, unfavorable political developments, and currency fluctuations. The fund concentrates a majority of its investments in the natural resources sector, which involves more risk than a fund that invests more broadly.
Note 7: Summary of derivative activity
The volume of activity for the reporting period for any derivative type that was held during the period is listed below and was as follows based on an average of the holdings at the end of each fiscal quarter:
Written equity option contracts (contract amount) (Note 3)
$—*
Forward currency contracts (contract amount)
$151,400,000
OTC total return swap contracts (notional)
$1,400,000
* For the reporting period there were no holdings at the end of each fiscal quarter and the transactions were considered minimal.
The following is a summary of the fair value of derivative instruments as of the close of the reporting period:
Fair value of derivative instruments as of the close of the reporting period
Asset derivatives
Liability derivatives
Derivatives not accounted for as hedging instruments under ASC 815
Statement of assets and liabilities location
Fair value
Statement of assets and liabilities location
Fair value
Foreign exchange contracts
Receivables
$544,875
Payables
$1,773,225
Total
$544,875
$1,773,225
Global Natural Resources Fund 47
The following is a summary of realized and change in unrealized gains or losses of derivative instruments on the Statement of operations for the reporting period (see Note 1):
Amount of realized gain or (loss) on derivatives recognized in net gain or (loss) on investments
Derivatives not accounted for as hedging instruments under ASC 815
Options
Forward currency contracts
Swaps
Total
Foreign exchange contracts
$—
$1,047,475
$—
$1,047,475
Equity contracts
(158,427)
—
(752,951)
$(911,378)
Total
$(158,427)
$1,047,475
$(752,951)
$136,097
Change in unrealized appreciation or (depreciation) on derivatives recognized in net gain or (loss) on investments
Derivatives not accounted for as hedging instruments under ASC 815
Forward currency contracts
Total
Foreign exchange contracts
$(582,188)
$(582,188)
Total
$(582,188)
$(582,188)
48 Global Natural Resources Fund
This page left blank intentionally.
Global Natural Resources Fund 49
Note 8: Offsetting of financial and derivative assets and liabilities
The following table summarizes any derivatives, repurchase agreements and reverse repurchase agreements, at the end of the reporting period, that are subject to an enforceable master netting agreement or similar agreement. For securities lending transactions or borrowing transactions associated with securities sold short, if any, see Note 1. For financial reporting purposes, the fund does not offset financial assets and financial liabilities that are subject to the master netting agreements in the Statement of assets and liabilities.
Barclays Bank PLC
Citibank, N.A.
Credit Suisse International
Deutsche Bank AG
Goldman Sachs International
HSBC Bank USA, National Association
JPMorgan Chase Bank N.A.
State Street Bank and Trust Co.
UBS AG
WestPac Banking Corp.
Total
Assets:
Forward currency contracts#
$2,794
$—
$12,875
$109,761
$—
$153,080
$240,003
$—
$—
$26,362
$544,875
Total Assets
$2,794
$—
$12,875
$109,761
$—
$153,080
$240,003
$—
$—
$26,362
$544,875
Liabilities:
Forward currency contracts#
436,008
217,873
181,650
21,899
5,153
128,344
200,607
371,775
194,449
15,467
1,773,225
Total Liabilities
$436,008
$217,873
$181,650
$21,899
$5,153
$128,344
$200,607
$371,775
$194,449
$15,467
$1,773,225
Total Financial and Derivative Net Assets
$(433,214)
$(217,873)
$(168,775)
$87,862
$(5,153)
$24,736
$39,396
$(371,775)
$(194,449)
$10,895
$(1,228,350)
Total collateral received (pledged)†##
$(401,920)
$(109,985)
$(139,986)
$87,862
$—
$—
$(49,990)
$—
$(109,989)
$—
Net amount
$(31,294)
$(107,888)
$(28,789)
$—
$(5,153)
$24,736
$89,386
$(371,775)
$(84,460)
$10,895
†
Additional collateral may be required from certain brokers based on individual agreements.
#
Covered by master netting agreement. (Note 1)
##
Any over-collateralization of total financial and derivative net assets is not shown. Collateral may include amounts related to unsettled agreements.
50
Global Natural Resources Fund
Global Natural Resources Fund
51
Federal tax information (Unaudited)
The fund designated 100% of ordinary income distributions as qualifying for the dividends received deduction for corporations.
For the reporting period, the fund hereby designates 100%, or the maximum amount allowable, of its taxable ordinary income distributions as qualified dividends taxed at the individual net capital gain rates.
The Form 1099 that will be mailed to you in January 2015 will show the tax status of all distributions paid to your account in calendar 2014.
52 Global Natural Resources Fund
Shareholder meeting results (Unaudited)
February 27, 2014 special meeting
At the meeting, each of the nominees for Trustees was elected, as follows:
Votes for
Votes withheld
Liaquat Ahamed
10,012,671
511,841
Ravi Akhoury
10,000,152
524,360
Barbara M. Baumann
10,067,778
456,734
Jameson A. Baxter
10,066,628
457,884
Charles B. Curtis
10,058,836
465,676
Robert J. Darretta
10,082,209
442,303
Katinka Domotorffy
10,023,772
500,740
John A. Hill
10,078,829
445,684
Paul L. Joskow
10,089,077
435,435
Kenneth R. Leibler
10,079,060
445,452
Robert E. Patterson
10,080,741
443,771
George Putnam, III
10,044,472
480,040
Robert L. Reynolds
10,065,052
459,460
W. Thomas Stephens
10,060,559
463,953
A proposal to approve a new management contract between the fund and Putnam Management was approved as follows:
Votes for
Votes against
Abstentions
Broker non-votes
8,356,334
302,928
438,853
1,426,398
A proposal to adopt an Amended and Restated Declaration of Trust was approved as follows:
Votes for
Votes against
Abstentions
Broker non-votes
8,337,944
333,792
426,378
1,426,398
All tabulations are rounded to the nearest whole number.
Global Natural Resources Fund 53
About the Trustees
Independent Trustees
Liaquat Ahamed
Born 1952, Trustee since 2012
Principal occupations during past five years: Pulitzer Prize-winning author of Lords of Finance: The Bankers Who Broke the World, whose articles on economics have appeared in such publications as the New York Times, Foreign Affairs, and the Financial Times. Director of Aspen Insurance Co., a New York Stock Exchange company, and Chair of the Aspen Board’s Investment Committee. Trustee of the Brookings Institution and Chair of its Investment Committee.
Other directorships: The Rohatyn Group, an emerging-market fund complex that manages money for institutions
Ravi Akhoury
Born 1947, Trustee since 2009
Principal occupations during past five years: Trustee of American India Foundation and of the Rubin Museum. From 1992 to 2007, was Chairman and CEO of MacKay Shields, a multi-product investment management firm.
Other directorships: RAGE Frameworks, Inc., a private software company; English Helper, Inc., a private software company
Barbara M. Baumann
Born 1955, Trustee since 2010
Principal occupations during past five years: President and Owner of Cross Creek Energy Corporation, a strategic consultant to domestic energy firms and direct investor in energy projects. Current Board member of The Denver Foundation. Former Chair and current Board member of Girls Incorporated of Metro Denver. Member of the Finance Committee, the Children’s Hospital of Colorado.
Other directorships: Buckeye Partners, L.P., a publicly traded master limited partnership focused on pipeline transport, storage, and distribution of petroleum products; Devon Energy Corporation, a leading independent natural gas and oil exploration and production company; UNS Energy Corporation, an Arizona utility; Cody Resources Management, a private company in the energy and ranching businesses
Jameson A. Baxter
Born 1943, Trustee since 1994, Vice Chair from 2005 to 2011, and Chair since 2011
Principal occupations during past five years: President of Baxter Associates, Inc., a private investment firm. Chair of Mutual Fund Directors Forum. Chair Emeritus of the Board of Trustees of Mount Holyoke College. Director of the Adirondack Land Trust and Trustee of the Nature Conservancy’s Adirondack Chapter.
Charles B. Curtis
Born 1940, Trustee since 2001
Principal occupations during past five years: Senior Advisor to the Center for Strategic and International Studies. President Emeritus and former President and Chief Operating Officer of the Nuclear Threat Initiative, a private foundation dealing with national security issues. Member of the Council on Foreign Relations and U.S. State Department International Security Advisory Board.
Robert J. Darretta
Born 1946, Trustee since 2007
Principal occupations during past five years: From 2009 until 2012, served as Health Care Industry Advisor to Permira, a global private equity firm. Until April 2007, was Vice Chairman of the Board of Directors of Johnson & Johnson. Served as Johnson & Johnson’s Chief Financial Officer for a decade.
Other directorships: UnitedHealth Group, a diversified health-care company
Katinka Domotorffy
Born 1975, Trustee since 2012
Principal occupations during past five years: Voting member of the Investment Committees of the Anne Ray Charitable Trust and Margaret A. Cargill Foundation, part of the Margaret A. Cargill Philanthropies. Until 2011, Partner, Chief Investment Officer, and Global Head of Quantitative Investment Strategies at Goldman Sachs Asset Management.
Other directorships: Reach Out and Read of Greater New York, an organization dedicated to promoting childhood literacy
John A. Hill
Born 1942, Trustee since 1985 and Chairman from 2000 to 2011
Principal occupations during past five years: Founder and Vice-Chairman of First Reserve Corporation, the leading private equity buyout firm focused on the worldwide energy industry. Trustee and Chairman of the Board of Trustees of Sarah Lawrence College. Member of the Advisory Board of the Millstein Center for Global Markets and Corporate Ownership at The Columbia University Law School.
Other directorships: Devon Energy Corporation, a leading independent natural gas and oil exploration and production company
54 Global Natural Resources Fund
Paul L. Joskow
Born 1947, Trustee since 1997
Principal occupations during past five years: Economist and President of the Alfred P. Sloan Foundation, a philanthropic institution focused primarily on research and education on issues related to science, technology, and economic performance. Elizabeth and James Killian Professor of Economics, Emeritus at the Massachusetts Institute of Technology (MIT). Prior to 2007, served as the Director of the Center for Energy and Environmental Policy Research at MIT.
Other directorships: Yale University; Exelon Corporation, an energy company focused on power services; Boston Symphony Orchestra; Prior to April 2013, served as Director of TransCanada Corporation and TransCanada Pipelines Ltd., energy companies focused on natural gas transmission, oil pipelines and power services
Kenneth R. Leibler
Born 1949, Trustee since 2006
Principal occupations during past five years: Founder and former Chairman of Boston Options Exchange, an electronic marketplace for the trading of derivative securities. Serves on the Board of Trustees of Beth Israel Deaconess Hospital in Boston, Massachusetts. Director of Beth Israel Deaconess Care Organization. Until November 2010, director of Ruder Finn Group, a global communications and advertising firm.
Other directorships: Northeast Utilities, which operates New England’s largest energy delivery system
Robert E. Patterson
Born 1945, Trustee since 1984
Principal occupations during past five years: Co-Chairman of Cabot Properties, Inc., a private equity firm investing in commercial real estate, and Chairman of its Investment Committee. Past Chairman and Trustee of the Joslin Diabetes Center.
George Putnam, III
Born 1951, Trustee since 1984
Principal occupations during past five years: Chairman of New Generation Research, Inc., a publisher of financial advisory and other research services. Founder and President of New Generation Advisors, LLC, a registered investment advisor to private funds. Director of The Boston Family Office, LLC, a registered investment advisor.
W. Thomas Stephens
Born 1942, Trustee from 1997 to 2008 and since 2009
Principal occupations during past five years: Retired as Chairman and Chief Executive Officer of Boise Cascade, LLC, a paper, forest products, and timberland assets company, in December 2008. Prior to 2010, Director of Boise Inc., a manufacturer of paper and packaging products.
Other directorships: TransCanada Pipelines Ltd., an energy infrastructure company
Interested Trustee
Robert L. Reynolds*
Born 1952, Trustee since 2008 and President of the Putnam Funds since 2009
Principal occupations during past five years: President and Chief Executive Officer of Putnam Investments since 2008 and, since 2014, President and Chief Executive Officer of Great-West Financial, a financial services company that provides retirement savings plans, life insurance, and annuity and executive benefits products, and of Great-West Lifeco U.S. Inc., a holding company that owns Putnam Investments and Great-West Financial. Prior to joining Putnam Investments, served as Vice Chairman and Chief Operating Officer of Fidelity Investments from 2000 to 2007.
* Mr. Reynolds is an “interested person” (as defined in the Investment Company Act of 1940) of the fund and Putnam Investments. He is President and Chief Executive Officer of Putnam Investments, as well as the President of your fund and each of the other Putnam funds.
The address of each Trustee is One Post Office Square, Boston, MA 02109.
As of August 31, 2014, there were 116 Putnam funds. All Trustees serve as Trustees of all Putnam funds.
Each Trustee serves for an indefinite term, until his or her resignation, retirement at age 75, removal, or death.
Global Natural Resources Fund 55
Officers
In addition to Robert L. Reynolds, the other officers of the fund are shown below:
Jonathan S. Horwitz (Born 1955)
Executive Vice President, Principal Executive Officer, and Compliance Liaison
Since 2004
Steven D. Krichmar (Born 1958)
Vice President and Principal Financial Officer
Since 2002
Chief of Operations, Putnam Investments and Putnam Management
Robert T. Burns (Born 1961)
Vice President and Chief Legal Officer
Since 2011
General Counsel, Putnam Investments, Putnam Management, and Putnam Retail Management
Manager of Finance, Dunkin’ Brands (2008–2010); Senior Financial Analyst, Old Mutual Asset Management (2007–2008); Senior Financial Analyst, Putnam Investments (1999–2007)
Janet C. Smith (Born 1965)
Vice President, Principal Accounting Officer, and Assistant Treasurer
Since 2007
Director of Fund Administration Services, Putnam Investments and Putnam Management
Susan G. Malloy (Born 1957)
Vice President and Assistant Treasurer
Since 2007
Director of Accounting & Control Services, Putnam Investments and Putnam Management
James P. Pappas (Born 1953)
Vice President
Since 2004
Director of Trustee Relations, Putnam Investments and Putnam Management
Mark C. Trenchard (Born 1962)
Vice President and BSA Compliance Officer
Since 2002
Director of Operational Compliance, Putnam Investments and Putnam Retail Management
Nancy E. Florek (Born 1957)
Vice President, Director of Proxy Voting and Corporate Governance, Assistant Clerk, and Associate Treasurer
Since 2000
The principal occupations of the officers for the past five years have been with the employers as shown above, although in some cases they have held different positions with such employers. The address of each Officer is One Post Office Square, Boston, MA 02109.
56 Global Natural Resources Fund
Services for shareholders
Investor services
Systematic investment plan Tell us how much you wish to invest regularly — weekly, semimonthly, or monthly — and the amount you choose will be transferred automatically from your checking or savings account. There’s no additional fee for this service, and you can suspend it at any time. This plan may be a great way to save for college expenses or to plan for your retirement.
Please note that regular investing does not guarantee a profit or protect against loss in a declining market. Before arranging a systematic investment plan, consider your financial ability to continue making purchases in periods when prices are low.
Systematic exchange You can make regular transfers from one Putnam fund to another Putnam fund. There are no additional fees for this service, and you can cancel or change your options at any time.
Dividends PLUS You can choose to have the dividend distributions from one of your Putnam funds automatically reinvested in another Putnam fund at no additional charge.
Free exchange privilege You can exchange money between Putnam funds free of charge, as long as they are the same class of shares. A signature guarantee is required if you are exchanging more than $500,000. The fund reserves the right to revise or terminate the exchange privilege.
Reinstatement privilege If you’ve sold Putnam shares or received a check for a dividend or capital gain, you may reinvest the proceeds with Putnam within 90 days of the transaction and they will be reinvested at the fund’s current net asset value — with no sales charge. However, reinstatement of class B shares may have special tax consequences. Ask your financial or tax representative for details.
Check-writing service You have ready access to many Putnam accounts. It’s as simple as writing a check, and there are no special fees or service charges. For more information about the check-writing service, call Putnam or visit our website.
Dollar cost averaging When you’re investing for long-term goals, it’s time, not timing, that counts. Investing on a systematic basis is a better strategy than trying to figure out when the markets will go up or down. This means investing the same amount of money regularly over a long period. This method of investing is called dollar cost averaging. When a fund’s share price declines, your investment dollars buy more shares at lower prices. When it increases, they buy fewer shares. Over time, you will pay a lower average price per share.
For more information
Visit the Individual Investors section at putnam.com A secure section of our website contains complete information on your account, including balances and transactions, updated daily. You may also conduct transactions, such as exchanges, additional investments, and address changes. Log on today to get your password.
Call us toll free at 1-800-225-1581 Ask a helpful Putnam representative or your financial advisor for details about any of these or other services, or see your prospectus.
Global Natural Resources Fund 57
Putnam family of funds
The following is a list of Putnam’s open-end mutual funds offered to the public. Investors should carefully consider the investment objective, risks, charges, and expenses of a fund before investing. For a prospectus, or a summary prospectus if available, containing this and other information for any Putnam fund or product, contact your financial advisor or call Putnam Investor Services at 1-800-225-1581. Please read the prospectus carefully before investing.
Growth
Growth Opportunities Fund
International Growth Fund
Multi-Cap Growth Fund
Small Cap Growth Fund
Voyager Fund
Blend
Asia Pacific Equity Fund
Capital Opportunities Fund
Capital Spectrum Fund
Emerging Markets Equity Fund
Equity Spectrum Fund
Europe Equity Fund
Global Equity Fund
International Capital Opportunities Fund
International Equity Fund
Investors Fund
Low Volatility Equity Fund
Multi-Cap Core Fund
Research Fund
Strategic Volatility Equity Fund
Value
Convertible Securities Fund
Equity Income Fund
Global Dividend Fund
The Putnam Fund for Growth and Income
International Value Fund
Multi-Cap Value Fund
Small Cap Value Fund
Income
American Government Income Fund
Diversified Income Trust
Emerging Markets Income Fund
Floating Rate Income Fund
Global Income Trust
High Yield Advantage Fund
High Yield Trust
Income Fund
Money Market Fund*
Short Duration Income Fund
U.S. Government Income Trust
Tax-free Income
AMT-Free Municipal Fund
Intermediate-Term Municipal Income Fund
Short-Term Municipal Income Fund
Tax Exempt Income Fund
Tax Exempt Money Market Fund*
Tax-Free High Yield Fund
State tax-free income funds†:
Arizona, California, Massachusetts, Michigan, Minnesota, New Jersey, New York, Ohio, and Pennsylvania.
* An investment in a money market fund is not insured or guaranteed by the Federal Deposit Insurance Corporation or any other government agency. Although the fund seeks to preserve the value of your investment at $1.00 per share, it is possible to lose money by investing in the fund.
†Not available in all states.
58 Global Natural Resources Fund
Absolute Return
Absolute Return 100 Fund®
Absolute Return 300 Fund®
Absolute Return 500 Fund®
Absolute Return 700 Fund®
Global Sector
Global Consumer Fund
Global Energy Fund
Global Financials Fund
Global Health Care Fund
Global Industrials Fund
Global Natural Resources Fund
Global Sector Fund
Global Technology Fund
Global Telecommunications Fund
Global Utilities Fund
Asset Allocation
George Putnam Balanced Fund
Global Asset Allocation Funds — four investment portfolios that spread your money across a variety of stocks, bonds, and money market instruments.
Dynamic Asset Allocation Balanced Fund
Dynamic Asset Allocation Conservative Fund
Dynamic Asset Allocation Growth Fund
Dynamic Risk Allocation Fund
Retirement Income Lifestyle Funds — portfolios with managed allocations to stocks, bonds, and money market investments to generate retirement income.
Retirement Income Fund Lifestyle 1
Retirement Income Fund Lifestyle 2
Retirement Income Fund Lifestyle 3
RetirementReady® Funds — portfolios with adjusting allocations to stocks, bonds, and money market instruments, becoming more conservative over time.
RetirementReady® 2055 Fund
RetirementReady® 2050 Fund
RetirementReady® 2045 Fund
RetirementReady® 2040 Fund
RetirementReady® 2035 Fund
RetirementReady® 2030 Fund
RetirementReady® 2025 Fund
RetirementReady® 2020 Fund
RetirementReady® 2015 Fund
Check your account balances and the most recent month-end performance in the Individual Investors section at putnam.com.
Global Natural Resources Fund 59
Fund information
Founded over 75 years ago, Putnam Investments was built around the concept that a balance between risk and reward is the hallmark of a well-rounded financial program. We manage over 100 funds across income, value, blend, growth, asset allocation, absolute return, and global sector categories.
Investment Manager
Putnam Investment Management, LLC One Post Office Square Boston, MA 02109
Investment Sub-Manager
Putnam Investments Limited 57–59 St James’s Street London, England SW1A 1LD
Investment Sub-Advisor
The Putnam Advisory Company, LLC One Post Office Square Boston, MA 02109
Marketing Services
Putnam Retail Management One Post Office Square Boston, MA 02109
Custodian
State Street Bank and Trust Company
Legal Counsel
Ropes & Gray LLP
Independent Registered Public Accounting Firm
KPMG LLP
Trustees
Jameson A. Baxter, Chair Liaquat Ahamed Ravi Akhoury Barbara M. Baumann Charles B. Curtis Robert J. Darretta Katinka Domotorffy John A. Hill Paul L. Joskow Kenneth R. Leibler Robert E. Patterson George Putnam, III Robert L. Reynolds W. Thomas Stephens
Officers
Robert L. Reynolds President
Jonathan S. Horwitz Executive Vice President, Principal Executive Officer, and Compliance Liaison
Steven D. Krichmar Vice President and Principal Financial Officer
Robert T. Burns Vice President and Chief Legal Officer
Robert R. Leveille Vice President and Chief Compliance Officer
Michael J. Higgins Vice President, Treasurer, and Clerk
Janet C. Smith Vice President, Principal Accounting Officer, and Assistant Treasurer
Susan G. Malloy Vice President and Assistant Treasurer
James P. Pappas Vice President
Mark C. Trenchard Vice President and BSA Compliance Officer
Nancy E. Florek Vice President, Director of Proxy Voting and Corporate Governance, Assistant Clerk, and Associate Treasurer
This report is for the information of shareholders of Putnam Global Natural Resources Fund. It may also be used as sales literature when preceded or accompanied by the current prospectus, the most recent copy of Putnam’s Quarterly Performance Summary, and Putnam’s Quarterly Ranking Summary. For more recent performance, please visit putnam.com. Investors should carefully consider the investment objectives, risks, charges, and expenses of a fund, which are described in its prospectus. For this and other information or to request a prospectus or summary prospectus, call 1-800-225-1581 toll free. Please read the prospectus carefully before investing. The fund’s Statement of Additional Information contains additional information about the fund’s Trustees and is available without charge upon request by calling 1-800-225-1581.
60 Global Natural Resources Fund
Item 2. Code of Ethics:
(a) The fund’s principal executive, financial and accounting officers are employees of Putnam Investment Management, LLC, the Fund’s investment manager. As such they are subject to a comprehensive Code of Ethics adopted and administered by Putnam Investments which is designed to protect the interests of the firm and its clients. The Fund has adopted a Code of Ethics which incorporates the Code of Ethics of Putnam Investments with respect to all of its officers and Trustees who are employees of Putnam Investment Management, LLC. For this reason, the Fund has not adopted a separate code of ethics governing its principal executive, financial and accounting officers.
(c) In July 2013, the Code of Ethics of Putnam Investment Management, LLC was amended. The changes to the Code of Ethics were as follows: (i) eliminating the requirement for employees to hold their shares of Putnam mutual funds for specified periods of time, (ii) removing the requirement to preclear transactions in certain kinds of exchange-traded funds and exchange-traded notes, although reporting of all such instruments remains required; (iii) eliminating the excessive trading rule related to employee transactions in securities requiring preclearance under the Code; (iv) adding provisions related to monitoring of employee trading; (v) changing from a set number of shares to a set dollar value of stock of mid- and large-cap companies on the Restricted List that can be purchased or sold; (vi) adding a requirement starting in March 2014 for employees to generally use certain approved brokers that provide Putnam with an electronic feed of transactions and statements for their personal brokerage accounts; and (vii) certain other changes.
Item 3. Audit Committee Financial Expert:
The Funds’ Audit and Compliance Committee is comprised solely of Trustees who are “independent” (as such term has been defined by the Securities and Exchange Commission (“SEC”) in regulations implementing Section 407 of the Sarbanes-Oxley Act (the “Regulations”)). The Trustees believe that each of the members of the Audit and Compliance Committee also possess a combination of knowledge and experience with respect to financial accounting matters, as well as other attributes, that qualify them for service on the Committee. In addition, the Trustees have determined that each of Mr. Leibler, Mr. Hill, Mr. Darretta, and Ms. Baumann qualifies as an “audit committee financial expert” (as such term has been defined by the Regulations) based on their review of his or her pertinent experience and education. The SEC has stated, and the funds’ amended and restated agreement and Declaration of Trust provides, that the designation or identification of a person as an audit committee financial expert pursuant to this Item 3 of Form N-CSR does not impose on such person any duties, obligations or liability that are greater than the duties, obligations and liability imposed on such person as a member of the Audit and Compliance Committee and the Board of Trustees in the absence of such designation or identification.
Item 4. Principal Accountant Fees and Services:
The following table presents fees billed in each of the last two fiscal years for services rendered to the fund by the fund’s independent auditor:
Fiscal year ended
Audit Fees
Audit-Related Fees
Tax Fees
All Other Fees
August 31, 2014
$40,898
$ —
$4,285
$ —
August 31, 2013
$39,763
$ —
$4,200
$ —
For the fiscal years ended August 31, 2014 and August 31, 2013, the fund’s independent auditor billed aggregate non-audit fees in the amounts of $4,285 and $4,200 respectively, to the fund, Putnam Management and any entity controlling, controlled by or under common control with Putnam Management that provides ongoing services to the fund.
Audit Fees represent fees billed for the fund’s last two fiscal years relating to the audit and review of the financial statements included in annual reports and registration statements, and other services that are normally provided in connection with statutory and regulatory filings or engagements.
Audit-Related Fees represent fees billed in the fund’s last two fiscal years for services traditionally performed by the fund’s auditor, including accounting consultation for proposed transactions or concerning financial accounting and reporting standards and other audit or attest services not required by statute or regulation.
Tax Fees represent fees billed in the fund’s last two fiscal years for tax compliance, tax planning and tax advice services. Tax planning and tax advice services include assistance with tax audits, employee benefit plans and requests for rulings or technical advice from taxing authorities.
Pre-Approval Policies of the Audit and Compliance Committee. The Audit and Compliance Committee of the Putnam funds has determined that, as a matter of policy, all work performed for the funds by the funds’ independent auditors will be pre-approved by the Committee itself and thus will generally not be subject to pre-approval procedures.
The Audit and Compliance Committee also has adopted a policy to pre-approve the engagement by Putnam Management and certain of its affiliates of the funds’ independent auditors, even in circumstances where pre-approval is not required by applicable law. Any such requests by Putnam Management or certain of its affiliates are typically submitted in writing to the Committee and explain, among other things, the nature of the proposed engagement, the estimated fees, and why this work should be performed by that particular audit firm as opposed to another one. In reviewing such requests, the Committee considers, among other things, whether the provision of such services by the audit firm are compatible with the independence of the audit firm.
The following table presents fees billed by the fund’s independent auditor for services required to be approved pursuant to paragraph (c)(7)(ii) of Rule 2-01 of Regulation S-X.
Fiscal year ended
Audit-Related Fees
Tax Fees
All Other Fees
Total Non-Audit Fees
August 31, 2014
$ —
$ —
$ —
$ —
August 31, 2013
$ —
$ —
$ —
$ —
Item 5. Audit Committee of Listed Registrants
Not applicable
Item 6. Schedule of Investments:
The registrant’s schedule of investments in unaffiliated issuers is included in the report to shareholders in Item 1 above.
Item 7. Disclosure of Proxy Voting Policies and Procedures For Closed-End Management Investment Companies:
Not applicable
Item 8. Portfolio Managers of Closed-End Investment Companies
Not Applicable
Item 9. Purchases of Equity Securities by Closed-End Management Investment Companies and Affiliated Purchasers:
Not applicable
Item 10. Submission of Matters to a Vote of Security Holders:
Not applicable
Item 11. Controls and Procedures:
(a) The registrant’s principal executive officer and principal financial officer have concluded, based on their evaluation of the effectiveness of the design and operation of the registrant’s disclosure controls and procedures as of a date within 90 days of the filing date of this report, that the design and operation of such procedures are generally effective to provide reasonable assurance that information required to be disclosed by the registrant in this report is recorded, processed, summarized and reported within the time periods specified in the Commission’s rules and forms.
(b) Changes in internal control over financial reporting: Not applicable
Item 12. Exhibits:
(a)(1) The Code of Ethics of The Putnam Funds, which incorporates the Code of Ethics of Putnam Investments, is filed herewith.
(a)(2) Separate certifications for the principal executive officer and principal financial officer of the registrant as required by Rule 30a-2(a) under the Investment Company Act of 1940, as amended, are filed herewith.
(b) The certifications required by Rule 30a-2(b) under the Investment Company Act of 1940, as amended, are filed herewith.
SIGNATURES
Pursuant to the requirements of the Securities Exchange Act of 1934 and the Investment Company Act of 1940, the registrant has duly caused this report to be signed on its behalf by the undersigned, thereunto duly authorized.
Putnam Global Natural Resources Fund
By (Signature and Title):
/s/Janet C. Smith Janet C. Smith Principal Accounting Officer
Date: October 28, 2014
Pursuant to the requirements of the Securities Exchange Act of 1934 and the Investment Company Act of 1940, this report has been signed below by the following persons on behalf of the registrant and in the capacities and on the dates indicated.
By (Signature and Title):
/s/Jonathan S. Horwitz Jonathan S. Horwitz Principal Executive Officer
Date: October 28, 2014
By (Signature and Title):
/s/Steven D. Krichmar Steven D. Krichmar Principal Financial Officer
Date: October 28, 2014
We use cookies on this site to provide a more responsive and personalized service. Continuing to browse, clicking I Agree, or closing this banner indicates agreement. See our Cookie Policy for more information.