UNITED STATES
SECURITIES AND EXCHANGE COMMISSION
Washington, D.C. 20549
FORM N-CSR
CERTIFIED SHAREHOLDER REPORT OF REGISTERED
MANAGEMENT INVESTMENT COMPANIES
Investment Company Act file number 811-3114
Fidelity Select Portfolios
(Exact name of registrant as specified in charter)
245 Summer St., Boston, Massachusetts 02210
(Address of principal executive offices) (Zip code)
Marc Bryant, Secretary
245 Summer St.
Boston, Massachusetts 02210
(Name and address of agent for service)
Registrant's telephone number, including area code:
617-563-7000
| |
Date of fiscal year end: | February 28 |
| |
Date of reporting period: | February 28, 2018 |
Item 1.
Reports to Stockholders
Fidelity® Select Portfolios®
Industrials Sector Air Transportation Portfolio
Defense and Aerospace Portfolio
Environment and Alternative Energy Portfolio
Industrials Portfolio
Transportation Portfolio
Annual Report February 28, 2018 |
 |
Contents
To view a fund's proxy voting guidelines and proxy voting record for the 12-month period ended June 30, visit http://www.fidelity.com/proxyvotingresults or visit the Securities and Exchange Commission's (SEC) web site at http://www.sec.gov.
You may also call 1-800-544-8544 to request a free copy of the proxy voting guidelines.
Standard & Poor's, S&P and S&P 500 are registered service marks of The McGraw-Hill Companies, Inc. and have been licensed for use by Fidelity Distributors Corporation.
Other third-party marks appearing herein are the property of their respective owners.
All other marks appearing herein are registered or unregistered trademarks or service marks of FMR LLC or an affiliated company. © 2018 FMR LLC. All rights reserved.
This report and the financial statements contained herein are submitted for the general information of the shareholders of the Funds. This report is not authorized for distribution to prospective investors in the Funds unless preceded or accompanied by an effective prospectus.
A fund files its complete schedule of portfolio holdings with the SEC for the first and third quarters of each fiscal year on Form N-Q. Forms N-Q are available on the SEC’s web site at http://www.sec.gov. A fund's Forms N-Q may be reviewed and copied at the SEC’s Public Reference Room in Washington, DC. Information regarding the operation of the SEC's Public Reference Room may be obtained by calling 1-800-SEC-0330.
For a complete list of a fund's portfolio holdings, view the most recent holdings listing, semiannual report, or annual report on Fidelity's web site at http://www.fidelity.com, http://www.institutional.fidelity.com, or http://www.401k.com, as applicable.
NOT FDIC INSURED •MAY LOSE VALUE •NO BANK GUARANTEE
Neither the Funds nor Fidelity Distributors Corporation is a bank.
Air Transportation Portfolio
Performance: The Bottom Line
Average annual total return reflects the change in the value of an investment, assuming reinvestment of distributions from dividend income and capital gains (the profits earned upon the sale of securities that have grown in value, if any) and assuming a constant rate of performance each year. The hypothetical investment and the average annual total returns do not reflect the deduction of taxes that a shareholder would pay on fund distributions or the redemption of fund shares. During periods of reimbursement by Fidelity, a fund’s total return will be greater than it would be had the reimbursement not occurred. How a fund did yesterday is no guarantee of how it will do tomorrow.
Average Annual Total Returns
| For the periods ended February 28, 2018 | Past 1 year | Past 5 years | Past 10 years |
| Air Transportation Portfolio | 19.07% | 18.81% | 13.59% |
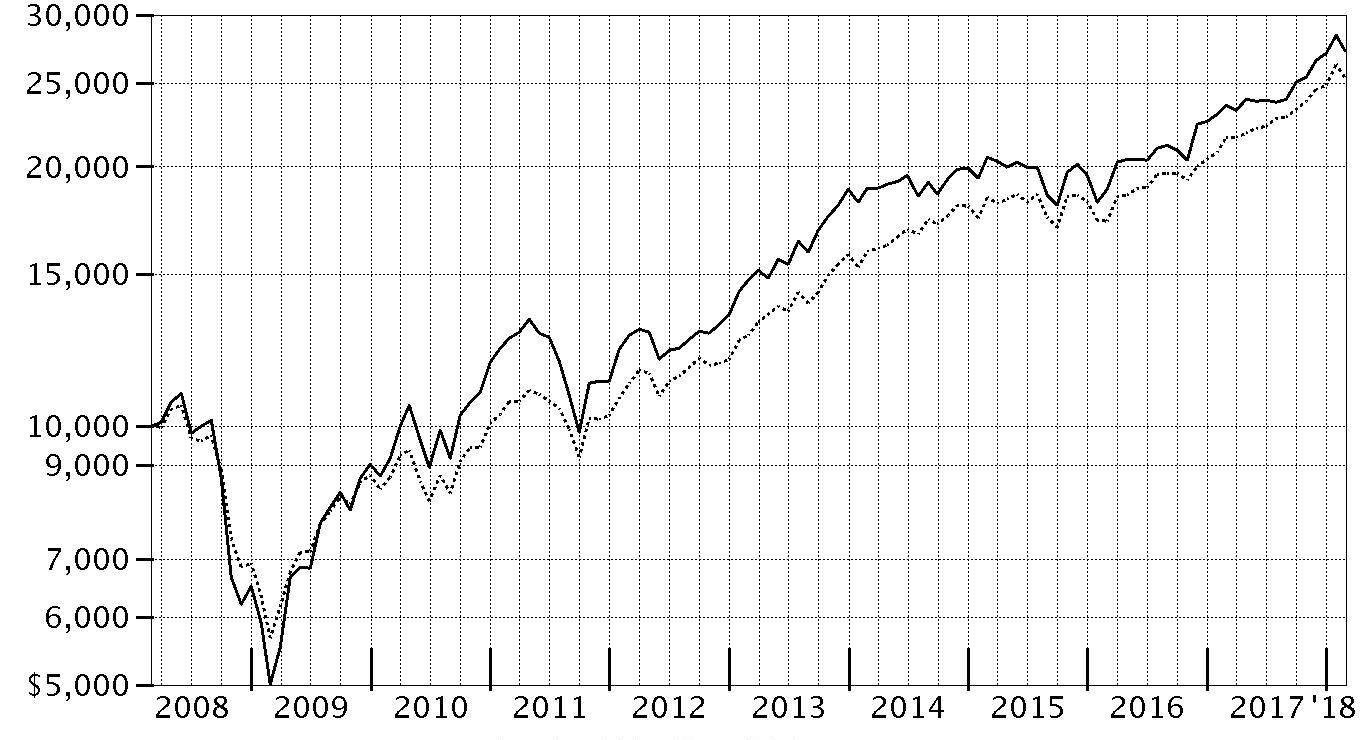
$10,000 Over 10 Years
Let's say hypothetically that $10,000 was invested in Air Transportation Portfolio on February 29, 2008.
The chart shows how the value of your investment would have changed, and also shows how the S&P 500® Index performed over the same period.
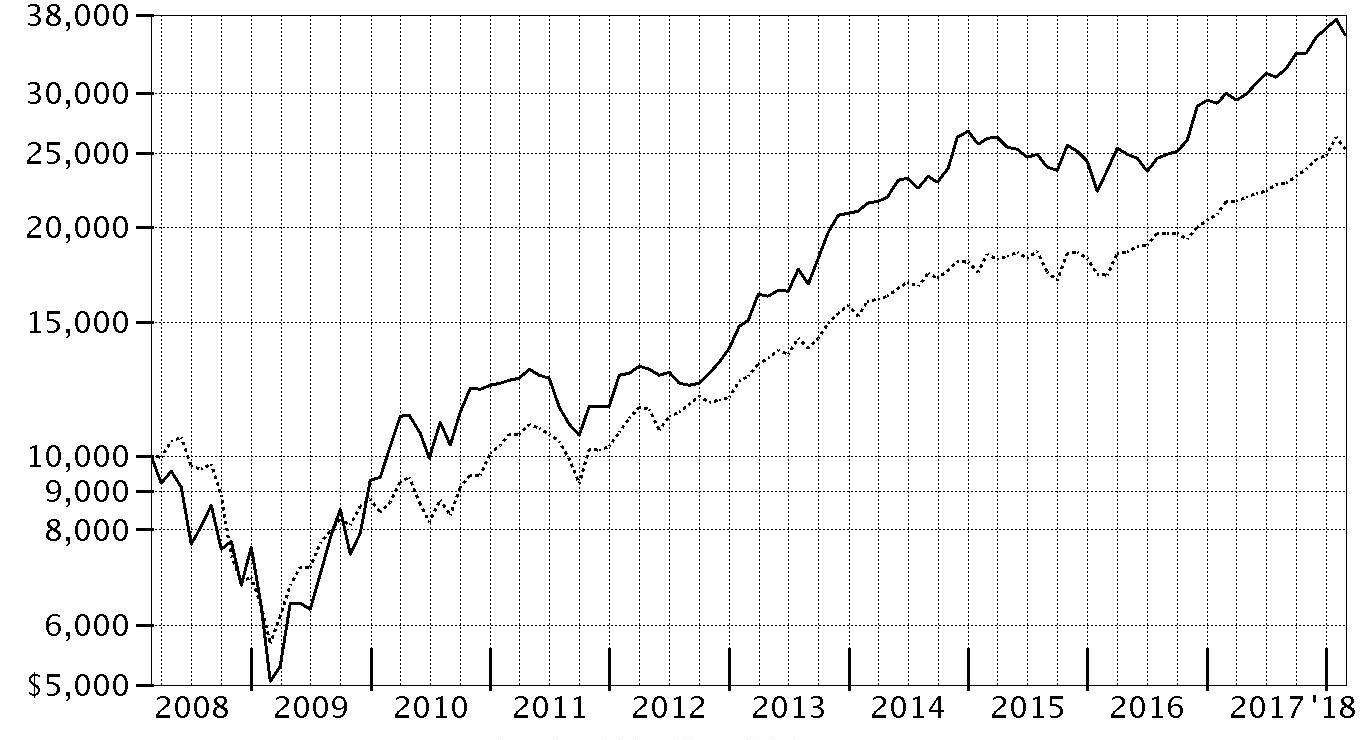
| Period Ending Values |
| $35,751 | Air Transportation Portfolio |
| $25,307 | S&P 500® Index |
Air Transportation Portfolio
Management's Discussion of Fund Performance
Market Recap: U.S. equities gained 17.10% for the 12 months ending February 28, 2018, as the S&P 500
® index moved steadily higher throughout 2017 and into 2018 until sharply reversing course in February. The drop was in stark contrast to the low volatility seen throughout 2017, along with consumer sentiment and other market indicators that stayed positive. Investors remained decidedly upbeat as the calendar turned, and the index rose 5.73% in January. February was a decidedly different story, though, as volatility spiked amid fear that rising inflation and the potential for the economy to overheat would prompt the U.S. Federal Reserve to pick up the pace of interest rate hikes. The index returned -3.69% for the month, its first negative result since October 2016. For the full 12 months, growth stocks handily topped value, while large-caps bested small-caps. By sector, information technology fared best by far, gaining 36% amid strong earnings growth from several major index constituents. Consumer discretionary (+22%) also stood out, driven by retailers. Financials added 20%, riding the uptick in bond yields. Materials and industrials rose about 16% each, boosted by higher demand, especially from China. Conversely, notable laggards included the defensive telecommunication services (-5%) and utilities (-2%) sectors, while rising rates held back real estate (-3%).
Comments from Portfolio Manager Matthew Moulis: For the fiscal year, the fund gained 19.07%, trailing the combined 21.79% return of the S&P
® Custom Air Transportation Index for the first month of the period and the Nasdaq
® North America Air Transportation Total Return Index for the remaining 11 months. However, the fund topped the S&P 500
® index. Versus the Nasdaq linked index, underweighting the strong-performing aerospace & defense segment – especially major index constituent Boeing, by far the fund’s biggest relative detractor – hurt performance. Stock selection within this segment also hurt, as did overweighting air freight & logistics, non-index exposure to railroads and a cash position of 3%, on average. United Parcel Service, where we had an overweighting, also worked against our relative result, along with avoiding aircraft replacement parts maker Heico and not owning Canada-based aircraft manufacturer Bombardier for most of the period. Conversely, relative performance benefited most from stock selection and an underweighting in the lagging airlines group. Our top individual relative contributor was weak-performing United Continental Holdings, parent company of United Airlines. We didn’t own this stock at all early in the period, but I established an underweighted position later on. Our position in Air Canada shares surged roughly 105%, rewarding our overweighting here.
The views expressed above reflect those of the portfolio manager(s) only through the end of the period as stated on the cover of this report and do not necessarily represent the views of Fidelity or any other person in the Fidelity organization. Any such views are subject to change at any time based upon market or other conditions and Fidelity disclaims any responsibility to update such views. These views may not be relied on as investment advice and, because investment decisions for a Fidelity fund are based on numerous factors, may not be relied on as an indication of trading intent on behalf of any Fidelity fund.
Notes to Shareholders: On April 1, 2017, the fund's industry benchmark changed from the S&P
® Custom Air Transportation Index to the Nasdaq
® North America Air Transportation Total Return Linked Index. Due to new international benchmark guidelines, S&P
® Dow Jones
® Indices stopped offering its brand on custom benchmarks, effective March 31, 2017. Fidelity believes that the new Nasdaq index will continue to provide shareholders with meaningful performance comparisons.
On December 8, 2017, shareholders approved proposals from the Board of Trustees to eliminate each sector/industry fund's fundamental “invests primarily” policy and to modify the fundamental concentration policy for certain funds. The changes took effect on January 1, 2018, and do not impact how the funds are managed.
Air Transportation Portfolio
Investment Summary (Unaudited)
Top Ten Stocks as of February 28, 2018
| | % of fund's net assets |
| Delta Air Lines, Inc. | 11.0 |
| United Parcel Service, Inc. Class B | 11.0 |
| Southwest Airlines Co. | 9.7 |
| United Technologies Corp. | 7.6 |
| The Boeing Co. | 5.2 |
| Expeditors International of Washington, Inc. | 4.9 |
| Spirit AeroSystems Holdings, Inc. Class A | 4.8 |
| American Airlines Group, Inc. | 4.5 |
| Alaska Air Group, Inc. | 3.9 |
| FedEx Corp. | 3.8 |
| | 66.4 |
Top Industries (% of fund's net assets)
| As of February 28, 2018 |
| | Airlines | 39.1% |
| | Aerospace & Defense | 30.4% |
| | Air Freight & Logistics | 23.3% |
| | Road & Rail | 2.6% |
| | Internet Software & Services | 1.0% |
| | All Others* | 3.6% |
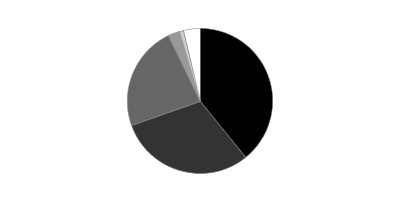
* Includes short-term investments and net other assets (liabilities).
Air Transportation Portfolio
Schedule of Investments February 28, 2018
Showing Percentage of Net Assets
| Common Stocks - 97.1% | | | |
| | | Shares | Value |
| Aerospace & Defense - 30.4% | | | |
| Aerospace & Defense - 30.4% | | | |
| Astronics Corp. (a) | | 44,100 | $1,700,055 |
| Astronics Corp. Class B (a) | | 4,755 | 183,543 |
| Bombardier, Inc. Class B (sub. vtg.) (a) | | 1,021,400 | 3,231,674 |
| CAE, Inc. | | 446,300 | 8,229,004 |
| Hexcel Corp. | | 197,300 | 13,274,344 |
| Moog, Inc. Class A (a) | | 122,100 | 10,235,643 |
| Spirit AeroSystems Holdings, Inc. Class A | | 199,900 | 18,248,871 |
| Textron, Inc. | | 75,100 | 4,494,735 |
| The Boeing Co. | | 55,310 | 20,033,835 |
| TransDigm Group, Inc. | | 25,900 | 7,467,229 |
| United Technologies Corp. | | 217,000 | 29,238,580 |
| | | | 116,337,513 |
| Air Freight & Logistics - 23.3% | | | |
| Air Freight & Logistics - 23.3% | | | |
| Air Transport Services Group, Inc. (a) | | 180,600 | 4,780,482 |
| Atlas Air Worldwide Holdings, Inc. (a) | | 6,200 | 377,270 |
| C.H. Robinson Worldwide, Inc. | | 23,000 | 2,147,280 |
| Expeditors International of Washington, Inc. | | 289,800 | 18,825,408 |
| FedEx Corp. | | 58,400 | 14,390,344 |
| Forward Air Corp. | | 120,150 | 6,488,100 |
| United Parcel Service, Inc. Class B | | 401,200 | 41,889,292 |
| | | | 88,898,176 |
| Airlines - 39.1% | | | |
| Airlines - 39.1% | | | |
| Air Canada (a) | | 311,400 | 6,566,774 |
| Alaska Air Group, Inc. | | 232,500 | 14,996,250 |
| Allegiant Travel Co. | | 4,600 | 764,980 |
| American Airlines Group, Inc. | | 320,400 | 17,381,700 |
| Dart Group PLC | | 104,986 | 1,160,559 |
| Delta Air Lines, Inc. | | 779,502 | 42,015,157 |
| Hawaiian Holdings, Inc. | | 143,400 | 5,162,400 |
| JetBlue Airways Corp. (a) | | 264,200 | 5,561,410 |
| SkyWest, Inc. | | 215,600 | 11,814,880 |
| Southwest Airlines Co. | | 638,700 | 36,942,408 |
| Spirit Airlines, Inc. (a) | | 32,600 | 1,298,784 |
| United Continental Holdings, Inc. (a) | | 89,200 | 6,046,868 |
| | | | 149,712,170 |
| Internet Software & Services - 1.0% | | | |
| Internet Software & Services - 1.0% | | | |
| Stamps.com, Inc. (a) | | 19,800 | 3,782,790 |
| Machinery - 0.4% | | | |
| Industrial Machinery - 0.4% | | | |
| Global Brass & Copper Holdings, Inc. | | 28,887 | 817,502 |
| Park-Ohio Holdings Corp. | | 18,890 | 752,767 |
| | | | 1,570,269 |
| Road & Rail - 2.6% | | | |
| Railroads - 2.6% | | | |
| Genesee & Wyoming, Inc. Class A (a) | | 46,000 | 3,198,380 |
| Norfolk Southern Corp. | | 39,600 | 5,507,568 |
| Union Pacific Corp. | | 9,000 | 1,172,250 |
| | | | 9,878,198 |
| Trading Companies & Distributors - 0.3% | | | |
| Trading Companies & Distributors - 0.3% | | | |
| HD Supply Holdings, Inc. (a) | | 31,900 | 1,156,375 |
| TOTAL COMMON STOCKS | | | |
| (Cost $268,415,642) | | | 371,335,491 |
|
| Money Market Funds - 2.8% | | | |
| Fidelity Cash Central Fund, 1.41% (b) | | | |
| (Cost $10,692,246) | | 10,690,810 | 10,692,948 |
| TOTAL INVESTMENT IN SECURITIES - 99.9% | | | |
| (Cost $279,107,888) | | | 382,028,439 |
| NET OTHER ASSETS (LIABILITIES) - 0.1% | | | 501,097 |
| NET ASSETS - 100% | | | $382,529,536 |
Legend
(a) Non-income producing
(b) Affiliated fund that is generally available only to investment companies and other accounts managed by Fidelity Investments. The rate quoted is the annualized seven-day yield of the fund at period end. A complete unaudited listing of the fund's holdings as of its most recent quarter end is available upon request. In addition, each Fidelity Central Fund's financial statements, which are not covered by the Fund's Report of Independent Registered Public Accounting Firm, are available on the SEC's website or upon request.
Affiliated Central Funds
Information regarding fiscal year to date income earned by the Fund from investments in Fidelity Central Funds is as follows:
| Fund | Income earned |
| Fidelity Cash Central Fund | $133,025 |
| Fidelity Securities Lending Cash Central Fund | 16,539 |
| Total | $149,564 |
Amounts in the income column in the above table include any capital gain distributions from underlying funds, which are presented in the corresponding line-item in the Statement of Operations if applicable.
Investment Valuation
The following is a summary of the inputs used, as of February 28, 2018, involving the Fund's assets and liabilities carried at fair value. The inputs or methodology used for valuing securities may not be an indication of the risk associated with investing in those securities. For more information on valuation inputs, and their aggregation into the levels used below, please refer to the Investment Valuation section in the accompanying Notes to Financial Statements.
| | Valuation Inputs at Reporting Date: |
| Description | Total | Level 1 | Level 2 | Level 3 |
| Investments in Securities: | | | | |
| Common Stocks | $371,335,491 | $370,174,932 | $1,160,559 | $-- |
| Money Market Funds | 10,692,948 | 10,692,948 | -- | -- |
| Total Investments in Securities: | $382,028,439 | $380,867,880 | $1,160,559 | $-- |
See accompanying notes which are an integral part of the financial statements.
Air Transportation Portfolio
Financial Statements
Statement of Assets and Liabilities
| | | February 28, 2018 |
| Assets | | |
Investment in securities, at value — See accompanying schedule:
Unaffiliated issuers (cost $268,415,642) | $371,335,491 | |
| Fidelity Central Funds (cost $10,692,246) | 10,692,948 | |
| Total Investment in Securities (cost $279,107,888) | | $382,028,439 |
| Receivable for fund shares sold | | 263,839 |
| Dividends receivable | | 965,694 |
| Distributions receivable from Fidelity Central Funds | | 14,022 |
| Prepaid expenses | | 1,367 |
| Other receivables | | 3,727 |
| Total assets | | 383,277,088 |
| Liabilities | | |
| Payable for fund shares redeemed | $449,885 | |
| Accrued management fee | 172,619 | |
| Transfer agent fee payable | 65,777 | |
| Other affiliated payables | 12,437 | |
| Other payables and accrued expenses | 46,834 | |
| Total liabilities | | 747,552 |
| Net Assets | | $382,529,536 |
| Net Assets consist of: | | |
| Paid in capital | | $260,582,323 |
| Undistributed net investment income | | 630,200 |
| Accumulated undistributed net realized gain (loss) on investments and foreign currency transactions | | 18,396,462 |
| Net unrealized appreciation (depreciation) on investments | | 102,920,551 |
| Net Assets, for 4,629,078 shares outstanding | | $382,529,536 |
| Net Asset Value, offering price and redemption price per share ($382,529,536 ÷ 4,629,078 shares) | | $82.64 |
See accompanying notes which are an integral part of the financial statements.
Statement of Operations
| | | Year ended February 28, 2018 |
| Investment Income | | |
| Dividends | | $4,370,992 |
| Special dividends | | 1,091,200 |
| Income from Fidelity Central Funds | | 149,564 |
| Total income | | 5,611,756 |
| Expenses | | |
| Management fee | $2,172,556 | |
| Transfer agent fees | 821,303 | |
| Accounting and security lending fees | 156,480 | |
| Custodian fees and expenses | 17,063 | |
| Independent trustees' fees and expenses | 8,644 | |
| Registration fees | 40,602 | |
| Audit | 40,432 | |
| Legal | 4,901 | |
| Miscellaneous | 19,657 | |
| Total expenses before reductions | 3,281,638 | |
| Expense reductions | (18,543) | 3,263,095 |
| Net investment income (loss) | | 2,348,661 |
| Realized and Unrealized Gain (Loss) | | |
| Net realized gain (loss) on: | | |
| Investment securities: | | |
| Unaffiliated issuers | 58,352,376 | |
| Fidelity Central Funds | (788) | |
| Foreign currency transactions | 9,845 | |
| Total net realized gain (loss) | | 58,361,433 |
| Change in net unrealized appreciation (depreciation) on: | | |
| Investment securities: | | |
| Unaffiliated issuers | 7,767,927 | |
| Fidelity Central Funds | (412) | |
| Assets and liabilities in foreign currencies | (266) | |
| Total change in net unrealized appreciation (depreciation) | | 7,767,249 |
| Net gain (loss) | | 66,128,682 |
| Net increase (decrease) in net assets resulting from operations | | $68,477,343 |
See accompanying notes which are an integral part of the financial statements.
Statement of Changes in Net Assets
| | Year ended February 28, 2018 | Year ended February 28, 2017 |
| Increase (Decrease) in Net Assets | | |
| Operations | | |
| Net investment income (loss) | $2,348,661 | $1,569,033 |
| Net realized gain (loss) | 58,361,433 | 15,925,983 |
| Change in net unrealized appreciation (depreciation) | 7,767,249 | 53,078,643 |
| Net increase (decrease) in net assets resulting from operations | 68,477,343 | 70,573,659 |
| Distributions to shareholders from net investment income | (1,727,901) | (1,185,421) |
| Distributions to shareholders from net realized gain | (33,467,895) | (1,110,453) |
| Total distributions | (35,195,796) | (2,295,874) |
| Share transactions | | |
| Proceeds from sales of shares | 112,568,755 | 189,705,911 |
| Reinvestment of distributions | 33,832,861 | 2,204,136 |
| Cost of shares redeemed | (191,306,787) | (191,690,596) |
| Net increase (decrease) in net assets resulting from share transactions | (44,905,171) | 219,451 |
| Redemption fees | 10,516 | 15,263 |
| Total increase (decrease) in net assets | (11,613,108) | 68,512,499 |
| Net Assets | | |
| Beginning of period | 394,142,644 | 325,630,145 |
| End of period | $382,529,536 | $394,142,644 |
| Other Information | | |
| Undistributed net investment income end of period | $630,200 | $335,489 |
| Shares | | |
| Sold | 1,390,397 | 2,678,190 |
| Issued in reinvestment of distributions | 414,264 | 29,373 |
| Redeemed | (2,358,846) | (2,897,377) |
| Net increase (decrease) | (554,185) | (189,814) |
See accompanying notes which are an integral part of the financial statements.
Financial Highlights
Air Transportation Portfolio
| | | | | | |
| Years ended February 28, | 2018 | 2017 | 2016 A | 2015 | 2014 |
| Selected Per–Share Data | | | | | |
| Net asset value, beginning of period | $76.04 | $60.60 | $73.09 | $61.02 | $43.97 |
| Income from Investment Operations | | | | | |
| Net investment income (loss)B | .48C | .32 | .18 | .20D | .12 |
| Net realized and unrealized gain (loss) | 13.85 | 15.61 | (6.82) | 13.09 | 18.28 |
| Total from investment operations | 14.33 | 15.93 | (6.64) | 13.29 | 18.40 |
| Distributions from net investment income | (.38) | (.25) | (.17) | (.08) | (.06) |
| Distributions from net realized gain | (7.36) | (.24) | (5.68) | (1.14) | (1.30) |
| Total distributions | (7.73)E | (.49) | (5.85) | (1.23)F | (1.36) |
| Redemption fees added to paid in capitalB | –G | –G | –G | .01 | .01 |
| Net asset value, end of period | $82.64 | $76.04 | $60.60 | $73.09 | $61.02 |
| Total ReturnH | 19.07% | 26.30% | (9.24)% | 21.93% | 42.26% |
| Ratios to Average Net AssetsI,J | | | | | |
| Expenses before reductions | .82% | .85% | .83% | .83% | .87% |
| Expenses net of fee waivers, if any | .82% | .85% | .83% | .83% | .87% |
| Expenses net of all reductions | .82% | .84% | .82% | .83% | .86% |
| Net investment income (loss) | .59%C | .48% | .27% | .30%D | .22% |
| Supplemental Data | | | | | |
| Net assets, end of period (000 omitted) | $382,530 | $394,143 | $325,630 | $715,925 | $350,960 |
| Portfolio turnover rateK | 86% | 106% | 97% | 65%L | 125% |
A For the year ended February 29.
B Calculated based on average shares outstanding during the period.
C Net Investment income per share reflects a large, non-recurring dividend which amounted to $.22 per share. Excluding this non-recurring dividend, the ratio of net investment income (loss) to average net assets would have been .31%.
D Net Investment income per share reflects a large, non-recurring dividend which amounted to $.22 per share. Excluding this non-recurring dividend, the ratio of net investment income (loss) to average net assets would have been (.04) %.
E Total distributions of $7.73 per share is comprised of distributions from net investment income of $.377 and distributions from net realized gain of $7.357 per share.
F Total distributions of $1.23 per share is comprised of distributions from net investment income of $.084 and distributions from net realized gain of $1.144 per share.
G Amount represents less than $.005 per share.
H Total returns would have been lower if certain expenses had not been reduced during the applicable periods shown.
I Fees and expenses of any underlying Fidelity Central Funds are not included in the Fund's expense ratio. The Fund indirectly bears its proportionate share of the expenses of any underlying Fidelity Central Funds.
J Expense ratios reflect operating expenses of the Fund. Expenses before reductions do not reflect amounts reimbursed by the investment adviser or reductions from brokerage service arrangements or reductions from other expense offset arrangements and do not represent the amount paid by the Fund during periods when reimbursements or reductions occur. Expenses net of fee waivers reflect expenses after reimbursement by the investment adviser but prior to reductions from brokerage service arrangements or other expense offset arrangements. Expenses net of all reductions represent the net expenses paid by the Fund.
K Amount does not include the portfolio activity of any underlying Fidelity Central Funds.
L Portfolio turnover rate excludes securities received or delivered in-kind.
See accompanying notes which are an integral part of the financial statements.
Defense and Aerospace Portfolio
Performance: The Bottom Line
Average annual total return reflects the change in the value of an investment, assuming reinvestment of distributions from dividend income and capital gains (the profits earned upon the sale of securities that have grown in value, if any) and assuming a constant rate of performance each year. The hypothetical investment and the average annual total returns do not reflect the deduction of taxes that a shareholder would pay on fund distributions or the redemption of fund shares. During periods of reimbursement by Fidelity, a fund’s total return will be greater than it would be had the reimbursement not occurred. How a fund did yesterday is no guarantee of how it will do tomorrow.
Average Annual Total Returns
| For the periods ended February 28, 2018 | Past 1 year | Past 5 years | Past 10 years |
| Defense and Aerospace Portfolio | 38.46% | 21.26% | 12.99% |
$10,000 Over 10 Years
Let's say hypothetically that $10,000 was invested in Defense and Aerospace Portfolio on February 29, 2008.
The chart shows how the value of your investment would have changed, and also shows how the S&P 500® Index performed over the same period.
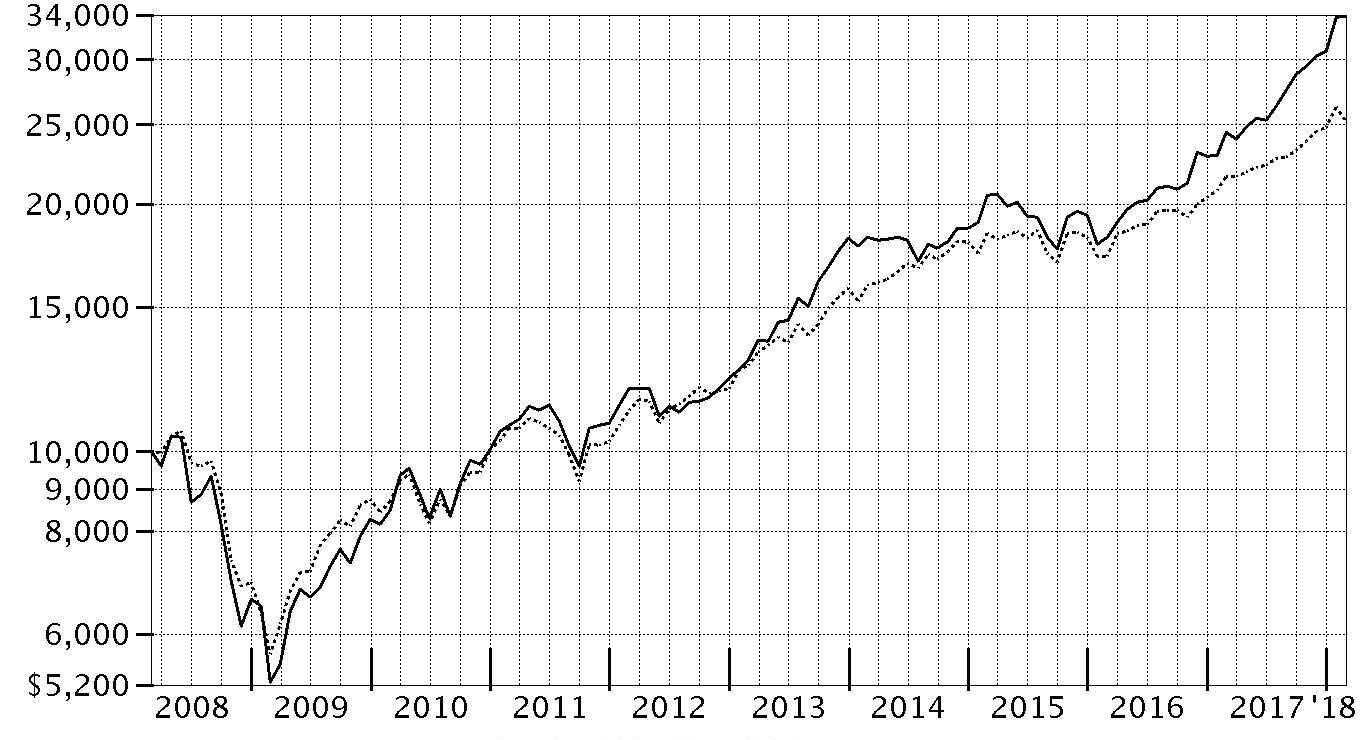
| Period Ending Values |
| $33,911 | Defense and Aerospace Portfolio |
| $25,307 | S&P 500® Index |
Defense and Aerospace Portfolio
Management's Discussion of Fund Performance
Market Recap: U.S. equities gained 17.10% for the 12 months ending February 28, 2018, as the S&P 500
® index moved steadily higher throughout 2017 and into 2018 until sharply reversing course in February. The drop was in stark contrast to the low volatility seen throughout 2017, along with consumer sentiment and other market indicators that stayed positive. Investors remained decidedly upbeat as the calendar turned, and the index rose 5.73% in January. February was a decidedly different story, though, as volatility spiked amid fear that rising inflation and the potential for the economy to overheat would prompt the U.S. Federal Reserve to pick up the pace of interest rate hikes. The index returned -3.69% for the month, its first negative result since October 2016. For the full 12 months, growth stocks handily topped value, while large-caps bested small-caps. By sector, information technology fared best by far, gaining 36% amid strong earnings growth from several major index constituents. Consumer discretionary (+22%) also stood out, driven by retailers. Financials added 20%, riding the uptick in bond yields. Materials and industrials rose about 16% each, boosted by higher demand, especially from China. Conversely, notable laggards included the defensive telecommunication services (-5%) and utilities (-2%) sectors, while rising rates held back real estate (-3%).
Comments from Portfolio Manager Jonathan Siegmann: For the fiscal year, the fund gained 38.46%, trailing the 42.61% return of the MSCI U.S. IMI Aerospace & Defense 25/50 Index, but more than doubling the S&P 500
® index. Versus the MSCI industry index, stock picking in the fund’s primary category of aerospace & defense – especially a significant underweighting in strong-performing index heavyweight Boeing, by far the fund’s biggest relative detractor – hurt performance, as did much smaller allocations to several non-index groups. A cash position of roughly 2%, on average, also weighed on our relative result in such a strong market. Notable relative detractors also included two shipbuilders I overweighted, General Dynamics and Huntington Ingalls Industries, both of which trailed the MSCI index, as did a non-index stake in U.K.-based defense contractor BAE Systems. Conversely, a large underweighting in conglomerate United Technologies proved to be the fund’s top relative contributor. The fund also benefited from timely ownership of aviation-equipment supplier Rockwell Collins, which I sold by period end. Lastly, underweighting and then selling our stake in aluminum fabricator Arconic also helped.
The views expressed above reflect those of the portfolio manager(s) only through the end of the period as stated on the cover of this report and do not necessarily represent the views of Fidelity or any other person in the Fidelity organization. Any such views are subject to change at any time based upon market or other conditions and Fidelity disclaims any responsibility to update such views. These views may not be relied on as investment advice and, because investment decisions for a Fidelity fund are based on numerous factors, may not be relied on as an indication of trading intent on behalf of any Fidelity fund.
Note to Shareholders: On December 8, 2017, shareholders approved proposals from the Board of Trustees to eliminate each sector/industry fund's fundamental “invests primarily” policy and to modify the fundamental concentration policy for certain funds. The changes took effect on January 1, 2018, and do not impact how the funds are managed.
Defense and Aerospace Portfolio
Investment Summary (Unaudited)
Top Ten Stocks as of February 28, 2018
| | % of fund's net assets |
| The Boeing Co. | 15.9 |
| Northrop Grumman Corp. | 11.1 |
| United Technologies Corp. | 8.7 |
| General Dynamics Corp. | 8.4 |
| Huntington Ingalls Industries, Inc. | 5.1 |
| Teledyne Technologies, Inc. | 4.9 |
| TransDigm Group, Inc. | 4.3 |
| Raytheon Co. | 4.0 |
| HEICO Corp. Class A | 3.6 |
| Spirit AeroSystems Holdings, Inc. Class A | 3.6 |
| | 69.6 |
Top Industries (% of fund's net assets)
| As of February 28, 2018 |
| | Aerospace & Defense | 96.6% |
| | IT Services | 1.1% |
| | Machinery | 0.6% |
| | Trading Companies & Distributors | 0.5% |
| | Construction & Engineering | 0.2% |
| | All Others* | 1.0% |

* Includes short-term investments and net other assets (liabilities).
Defense and Aerospace Portfolio
Schedule of Investments February 28, 2018
Showing Percentage of Net Assets
| Common Stocks - 98.7% | | | |
| | | Shares | Value |
| Aerospace & Defense - 96.2% | | | |
| Aerospace & Defense - 96.2% | | | |
| AAR Corp. | | 185,000 | $7,877,300 |
| Airbus Group NV | | 102,400 | 12,257,028 |
| Astronics Corp. (a) | | 1,642,453 | 63,316,563 |
| Astronics Corp. Class B (a) | | 144,569 | 5,580,363 |
| Axon Enterprise, Inc. (a)(b) | | 1,100,521 | 38,331,146 |
| BAE Systems PLC | | 5,293,750 | 42,016,274 |
| Bombardier, Inc. Class B (sub. vtg.) (a) | | 17,105,400 | 54,120,888 |
| Elbit Systems Ltd. | | 506,112 | 72,885,189 |
| Elbit Systems Ltd. (Israel) | | 30,000 | 4,285,406 |
| Engility Holdings, Inc. (a) | | 1,215,936 | 33,207,212 |
| FACC AG (a) | | 235,920 | 6,132,952 |
| General Dynamics Corp. | | 1,165,500 | 259,265,475 |
| Harris Corp. | | 292,500 | 45,673,875 |
| HEICO Corp. | | 524,310 | 44,880,936 |
| HEICO Corp. Class A | | 1,527,370 | 110,734,325 |
| Hexcel Corp. | | 1,465,700 | 98,612,296 |
| Huntington Ingalls Industries, Inc. | | 596,175 | 156,203,812 |
| KEYW Holding Corp. (a) | | 247,582 | 1,859,341 |
| KLX, Inc. (a) | | 848,675 | 57,438,324 |
| Leonardo SpA | | 1,108,243 | 11,863,333 |
| Lockheed Martin Corp. | | 240,315 | 84,696,619 |
| Magellan Aerospace Corp. | | 99,600 | 1,562,459 |
| Moog, Inc. Class A (a) | | 907,717 | 76,093,916 |
| Northrop Grumman Corp. | | 975,750 | 341,551,530 |
| Raytheon Co. | | 573,626 | 124,769,391 |
| Saab AB (B Shares) | | 130,200 | 5,915,171 |
| Senior Engineering Group PLC | | 2,783,000 | 11,090,738 |
| Spirit AeroSystems Holdings, Inc. Class A | | 1,199,450 | 109,497,791 |
| Teledyne Technologies, Inc. (a) | | 803,700 | 149,448,015 |
| Textron, Inc. | | 550,731 | 32,961,250 |
| The Boeing Co. | | 1,351,519 | 489,533,698 |
| TransDigm Group, Inc. | | 459,176 | 132,385,033 |
| United Technologies Corp. | | 1,997,001 | 269,075,915 |
| | | | 2,955,123,564 |
| Construction & Engineering - 0.2% | | | |
| Construction & Engineering - 0.2% | | | |
| KBR, Inc. | | 307,400 | 4,654,036 |
| Diversified Telecommunication Services - 0.1% | | | |
| Alternative Carriers - 0.1% | | | |
| Iridium Communications, Inc. (a)(b) | | 321,150 | 3,757,455 |
| IT Services - 1.1% | | | |
| IT Consulting & Other Services - 1.1% | | | |
| Leidos Holdings, Inc. | | 553,030 | 35,012,329 |
| Machinery - 0.6% | | | |
| Industrial Machinery - 0.6% | | | |
| Woodward, Inc. | | 257,500 | 18,238,725 |
| Trading Companies & Distributors - 0.5% | | | |
| Trading Companies & Distributors - 0.5% | | | |
| Air Lease Corp. Class A | | 359,820 | 15,713,339 |
| TOTAL COMMON STOCKS | | | |
| (Cost $2,029,006,212) | | | 3,032,499,448 |
|
| Nonconvertible Preferred Stocks - 0.4% | | | |
| Aerospace & Defense - 0.4% | | | |
| Aerospace & Defense - 0.4% | | | |
| Embraer SA sponsored ADR | | | |
| (Cost $9,236,942) | | 466,250 | 12,458,200 |
|
| Money Market Funds - 2.4% | | | |
| Fidelity Cash Central Fund, 1.41% (c) | | 43,204,941 | 43,213,582 |
| Fidelity Securities Lending Cash Central Fund 1.42% (c)(d) | | 31,658,913 | 31,662,079 |
| TOTAL MONEY MARKET FUNDS | | | |
| (Cost $74,875,382) | | | 74,875,661 |
| TOTAL INVESTMENT IN SECURITIES - 101.5% | | | |
| (Cost $2,113,118,536) | | | 3,119,833,309 |
| NET OTHER ASSETS (LIABILITIES) - (1.5)% | | | (46,043,959) |
| NET ASSETS - 100% | | | $3,073,789,350 |
Legend
(a) Non-income producing
(b) Security or a portion of the security is on loan at period end.
(c) Affiliated fund that is generally available only to investment companies and other accounts managed by Fidelity Investments. The rate quoted is the annualized seven-day yield of the fund at period end. A complete unaudited listing of the fund's holdings as of its most recent quarter end is available upon request. In addition, each Fidelity Central Fund's financial statements, which are not covered by the Fund's Report of Independent Registered Public Accounting Firm, are available on the SEC's website or upon request.
(d) Investment made with cash collateral received from securities on loan.
Affiliated Central Funds
Information regarding fiscal year to date income earned by the Fund from investments in Fidelity Central Funds is as follows:
| Fund | Income earned |
| Fidelity Cash Central Fund | $518,694 |
| Fidelity Securities Lending Cash Central Fund | 197,758 |
| Total | $716,452 |
Amounts in the income column in the above table include any capital gain distributions from underlying funds, which are presented in the corresponding line-item in the Statement of Operations if applicable.
Investment Valuation
The following is a summary of the inputs used, as of February 28, 2018, involving the Fund's assets and liabilities carried at fair value. The inputs or methodology used for valuing securities may not be an indication of the risk associated with investing in those securities. For more information on valuation inputs, and their aggregation into the levels used below, please refer to the Investment Valuation section in the accompanying Notes to Financial Statements.
| | Valuation Inputs at Reporting Date: |
| Description | Total | Level 1 | Level 2 | Level 3 |
| Investments in Securities: | | | | |
| Common Stocks | $3,032,499,448 | $2,943,223,952 | $89,275,496 | $-- |
| Nonconvertible Preferred Stocks | 12,458,200 | 12,458,200 | -- | -- |
| Money Market Funds | 74,875,661 | 74,875,661 | -- | -- |
| Total Investments in Securities: | $3,119,833,309 | $3,030,557,813 | $89,275,496 | $-- |
See accompanying notes which are an integral part of the financial statements.
Defense and Aerospace Portfolio
Financial Statements
Statement of Assets and Liabilities
| | | February 28, 2018 |
| Assets | | |
Investment in securities, at value (including securities loaned of $38,958,800) — See accompanying schedule:
Unaffiliated issuers (cost $2,038,243,154) | $3,044,957,648 | |
| Fidelity Central Funds (cost $74,875,382) | 74,875,661 | |
| Total Investment in Securities (cost $2,113,118,536) | | $3,119,833,309 |
| Receivable for investments sold | | 33,583,099 |
| Receivable for fund shares sold | | 16,651,724 |
| Dividends receivable | | 4,528,844 |
| Distributions receivable from Fidelity Central Funds | | 53,133 |
| Prepaid expenses | | 6,342 |
| Other receivables | | 110,346 |
| Total assets | | 3,174,766,797 |
| Liabilities | | |
| Payable for investments purchased | $65,289,326 | |
| Payable for fund shares redeemed | 2,108,815 | |
| Accrued management fee | 1,301,925 | |
| Other affiliated payables | 433,918 | |
| Other payables and accrued expenses | 179,383 | |
| Collateral on securities loaned | 31,664,080 | |
| Total liabilities | | 100,977,447 |
| Net Assets | | $3,073,789,350 |
| Net Assets consist of: | | |
| Paid in capital | | $1,979,337,180 |
| Undistributed net investment income | | 3,275,263 |
| Accumulated undistributed net realized gain (loss) on investments and foreign currency transactions | | 84,461,719 |
| Net unrealized appreciation (depreciation) on investments and assets and liabilities in foreign currencies | | 1,006,715,188 |
| Net Assets, for 16,659,318 shares outstanding | | $3,073,789,350 |
| Net Asset Value, offering price and redemption price per share ($3,073,789,350 ÷ 16,659,318 shares) | | $184.51 |
See accompanying notes which are an integral part of the financial statements.
Statement of Operations
| | | Year ended February 28, 2018 |
| Investment Income | | |
| Dividends | | $18,533,243 |
| Special dividends | | 9,382,472 |
| Income from Fidelity Central Funds | | 716,452 |
| Total income | | 28,632,167 |
| Expenses | | |
| Management fee | $11,655,948 | |
| Transfer agent fees | 3,696,396 | |
| Accounting and security lending fees | 659,203 | |
| Custodian fees and expenses | 33,274 | |
| Independent trustees' fees and expenses | 43,301 | |
| Registration fees | 125,789 | |
| Audit | 40,325 | |
| Legal | 22,891 | |
| Miscellaneous | 79,663 | |
| Total expenses before reductions | 16,356,790 | |
| Expense reductions | (64,642) | 16,292,148 |
| Net investment income (loss) | | 12,340,019 |
| Realized and Unrealized Gain (Loss) | | |
| Net realized gain (loss) on: | | |
| Investment securities: | | |
| Unaffiliated issuers | 165,259,978 | |
| Fidelity Central Funds | 3,073 | |
| Foreign currency transactions | (59,904) | |
| Total net realized gain (loss) | | 165,203,147 |
| Change in net unrealized appreciation (depreciation) on: | | |
| Investment securities: | | |
| Unaffiliated issuers | 566,832,395 | |
| Fidelity Central Funds | (4,824) | |
| Assets and liabilities in foreign currencies | 415 | |
| Total change in net unrealized appreciation (depreciation) | | 566,827,986 |
| Net gain (loss) | | 732,031,133 |
| Net increase (decrease) in net assets resulting from operations | | $744,371,152 |
See accompanying notes which are an integral part of the financial statements.
Statement of Changes in Net Assets
| | Year ended February 28, 2018 | Year ended February 28, 2017 |
| Increase (Decrease) in Net Assets | | |
| Operations | | |
| Net investment income (loss) | $12,340,019 | $11,596,929 |
| Net realized gain (loss) | 165,203,147 | 64,001,438 |
| Change in net unrealized appreciation (depreciation) | 566,827,986 | 254,946,544 |
| Net increase (decrease) in net assets resulting from operations | 744,371,152 | 330,544,911 |
| Distributions to shareholders from net investment income | (9,697,066) | (11,758,000) |
| Distributions to shareholders from net realized gain | (75,569,005) | (53,922,271) |
| Total distributions | (85,266,071) | (65,680,271) |
| Share transactions | | |
| Proceeds from sales of shares | 1,383,656,760 | 698,805,364 |
| Reinvestment of distributions | 81,021,871 | 62,788,633 |
| Cost of shares redeemed | (651,462,161) | (310,408,871) |
| Net increase (decrease) in net assets resulting from share transactions | 813,216,470 | 451,185,126 |
| Redemption fees | – | 19,875 |
| Total increase (decrease) in net assets | 1,472,321,551 | 716,069,641 |
| Net Assets | | |
| Beginning of period | 1,601,467,799 | 885,398,158 |
| End of period | $3,073,789,350 | $1,601,467,799 |
| Other Information | | |
| Undistributed net investment income end of period | $3,275,263 | $1,273,925 |
| Shares | | |
| Sold | 8,658,150 | 5,346,927 |
| Issued in reinvestment of distributions | 502,158 | 492,405 |
| Redeemed | (4,077,840) | (2,454,187) |
| Net increase (decrease) | 5,082,468 | 3,385,145 |
See accompanying notes which are an integral part of the financial statements.
Financial Highlights
Defense and Aerospace Portfolio
| | | | | | |
| Years ended February 28, | 2018 | 2017 | 2016 A | 2015 | 2014 |
| Selected Per–Share Data | | | | | |
| Net asset value, beginning of period | $138.33 | $108.08 | $128.97 | $122.55 | $91.73 |
| Income from Investment Operations | | | | | |
| Net investment income (loss)B | .90C | 1.28D | 1.08 | 1.06E | .77 |
| Net realized and unrealized gain (loss) | 51.36 | 35.26 | (14.72) | 13.14 | 36.34 |
| Total from investment operations | 52.26 | 36.54 | (13.64) | 14.20 | 37.11 |
| Distributions from net investment income | (.69) | (1.15) | (1.01) | (.97) | (.64) |
| Distributions from net realized gain | (5.39) | (5.14) | (6.24) | (6.81) | (5.65) |
| Total distributions | (6.08) | (6.29) | (7.25) | (7.78) | (6.29) |
| Redemption fees added to paid in capitalB | – | –F | –F | –F | –F |
| Net asset value, end of period | $184.51 | $138.33 | $108.08 | $128.97 | $122.55 |
| Total ReturnG | 38.46% | 34.36% | (11.08)% | 12.53% | 40.85% |
| Ratios to Average Net AssetsH,I | | | | | |
| Expenses before reductions | .76% | .79% | .80% | .79% | .81% |
| Expenses net of fee waivers, if any | .76% | .79% | .79% | .79% | .81% |
| Expenses net of all reductions | .76% | .79% | .79% | .79% | .81% |
| Net investment income (loss) | .58%C | 1.03%D | .92% | .90%E | .70% |
| Supplemental Data | | | | | |
| Net assets, end of period (000 omitted) | $3,073,789 | $1,601,468 | $885,398 | $948,156 | $1,023,393 |
| Portfolio turnover rateJ | 32% | 24% | 52% | 20% | 48% |
A For the year ended February 29.
B Calculated based on average shares outstanding during the period.
C Net Investment income per share reflects a large, non-recurring dividend which amounted to $.69 per share. Excluding this non-recurring dividend, the ratio of net investment income (loss) to average net assets would have been .14%.
D Net Investment income per share reflects a large, non-recurring dividend which amounted to $.49 per share. Excluding this non-recurring dividend, the ratio of net investment income (loss) to average net assets would have been .64%.
E Net Investment income per share reflects a large, non-recurring dividend which amounted to $.66 per share. Excluding this non-recurring dividend, the ratio of net investment income (loss) to average net assets would have been .34%.
F Amount represents less than $.005 per share.
G Total returns would have been lower if certain expenses had not been reduced during the applicable periods shown.
H Fees and expenses of any underlying Fidelity Central Funds are not included in the Fund's expense ratio. The Fund indirectly bears its proportionate share of the expenses of any underlying Fidelity Central Funds.
I Expense ratios reflect operating expenses of the Fund. Expenses before reductions do not reflect amounts reimbursed by the investment adviser or reductions from brokerage service arrangements or reductions from other expense offset arrangements and do not represent the amount paid by the Fund during periods when reimbursements or reductions occur. Expenses net of fee waivers reflect expenses after reimbursement by the investment adviser but prior to reductions from brokerage service arrangements or other expense offset arrangements. Expenses net of all reductions represent the net expenses paid by the Fund.
J Amount does not include the portfolio activity of any underlying Fidelity Central Funds.
See accompanying notes which are an integral part of the financial statements.
Environment and Alternative Energy Portfolio
Performance: The Bottom Line
Average annual total return reflects the change in the value of an investment, assuming reinvestment of distributions from dividend income and capital gains (the profits earned upon the sale of securities that have grown in value, if any) and assuming a constant rate of performance each year. The hypothetical investment and the average annual total returns do not reflect the deduction of taxes that a shareholder would pay on fund distributions or the redemption of fund shares. During periods of reimbursement by Fidelity, a fund’s total return will be greater than it would be had the reimbursement not occurred. How a fund did yesterday is no guarantee of how it will do tomorrow.
Average Annual Total Returns
| For the periods ended February 28, 2018 | Past 1 year | Past 5 years | Past 10 years |
| Environment and Alternative Energy Portfolio | 17.73% | 13.20% | 7.06% |
Prior to July 1, 2010, the fund was named Environmental Portfolio, and the fund operated under certain different investment policies and compared its performance to a different additional index. The fund's historical performance may not represent its current investment policies.
$10,000 Over 10 Years
Let's say hypothetically that $10,000 was invested in Environment and Alternative Energy Portfolio on February 29, 2008.
The chart shows how the value of your investment would have changed, and also shows how the S&P 500® Index performed over the same period.
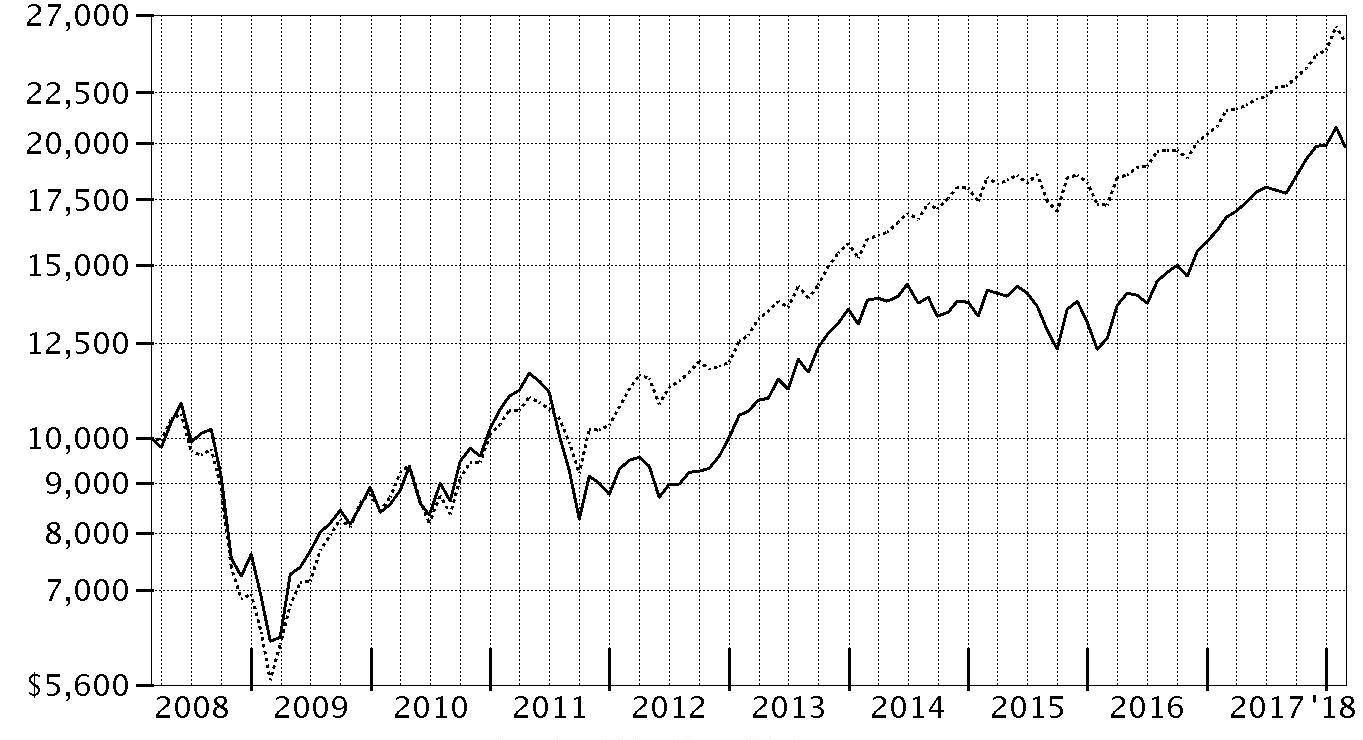
| Period Ending Values |
| $19,783 | Environment and Alternative Energy Portfolio |
| $25,307 | S&P 500® Index |
Environment and Alternative Energy Portfolio
Management's Discussion of Fund Performance
Market Recap: U.S. equities gained 17.10% for the 12 months ending February 28, 2018, as the S&P 500
® index moved steadily higher throughout 2017 and into 2018 until sharply reversing course in February. The drop was in stark contrast to the low volatility seen throughout 2017, along with consumer sentiment and other market indicators that stayed positive. Investors remained decidedly upbeat as the calendar turned, and the index rose 5.73% in January. February was a decidedly different story, though, as volatility spiked amid fear that rising inflation and the potential for the economy to overheat would prompt the U.S. Federal Reserve to pick up the pace of interest rate hikes. The index returned -3.69% for the month, its first negative result since October 2016. For the full 12 months, growth stocks handily topped value, while large-caps bested small-caps. By sector, information technology fared best by far, gaining 36% amid strong earnings growth from several major index constituents. Consumer discretionary (+22%) also stood out, driven by retailers. Financials added 20%, riding the uptick in bond yields. Materials and industrials rose about 16% each, boosted by higher demand, especially from China. Conversely, notable laggards included the defensive telecommunication services (-5%) and utilities (-2%) sectors, while rising rates held back real estate (-3%).
Comments from Portfolio Manager Kevin Walenta: For the year, the fund returned 17.73%, lagging the 21.98% gain of the FTSE
® Environmental Opportunities & Alternative Energy Index and edging out the broadly based S&P 500
®. Versus the FTSE index, stock picks in the energy-efficiency group hurt most, followed by security selection in the pollution control and renewable & alternative energy segments. Individual detractors included an overweighting in Apogee Enterprises (-24%), which makes architectural glass systems that improve the energy efficiency of commercial buildings. An earnings shortfall, acquisition costs and fear of a slowdown in U.S. commercial construction pressured the stock’s return. Elsewhere, Italy-based electric utility Enel hurt because we didn’t own the stock during its run-up in the first half of the period, but added a stake on a late-period downturn. Plus, foreign holdings detracted overall, despite the tailwind from a broadly weaker U.S. dollar. By contrast, stock picks in the waste management & technologies group and positioning in the water infrastructure & technologies segment aided relative performance. In terms of individual contributors, not owning Ireland-based Johnson Controls International (-10%), which makes heating, ventilation and air conditioning equipment that assists in reducing energy costs for buildings, was a plus. Johnson is going through a sizable transformation that pressured its stock return.
The views expressed above reflect those of the portfolio manager(s) only through the end of the period as stated on the cover of this report and do not necessarily represent the views of Fidelity or any other person in the Fidelity organization. Any such views are subject to change at any time based upon market or other conditions and Fidelity disclaims any responsibility to update such views. These views may not be relied on as investment advice and, because investment decisions for a Fidelity fund are based on numerous factors, may not be relied on as an indication of trading intent on behalf of any Fidelity fund.
Note to shareholders: On December 8, 2017, shareholders approved proposals from the Board of Trustees to eliminate each sector/industry fund’s fundamental “invests primarily” policy and to modify the fundamental concentration policy for certain funds. The changes took effect on January 1, 2018, and do not impact how the fund are managed.
Environment and Alternative Energy Portfolio
Investment Summary (Unaudited)
Top Ten Stocks as of February 28, 2018
| | % of fund's net assets |
| 3M Co. | 10.1 |
| Honeywell International, Inc. | 8.0 |
| Danaher Corp. | 5.0 |
| Deere & Co. | 4.2 |
| TE Connectivity Ltd. | 3.5 |
| Ingersoll-Rand PLC | 3.3 |
| Fortive Corp. | 3.0 |
| Enel SpA | 2.8 |
| Cummins, Inc. | 2.8 |
| Lennox International, Inc. | 2.5 |
| | 45.2 |
Top Industries (% of fund's net assets)
| As of February 28, 2018 |
| | Energy Efficiency | 31.7% |
| | Renewable & Alternative Energy | 22.1% |
| | Environmental Support Services | 10.1% |
| | Food Agriculture & Forestry | 9.8% |
| | Water Infrastructure & Technologies | 8.2% |
| | All Others* | 18.1% |
* Includes short-term investments and net other assets (liabilities).
Environment and Alternative Energy Portfolio
Schedule of Investments February 28, 2018
Showing Percentage of Net Assets
| Common Stocks - 98.3% | | | |
| | | Shares | Value |
| Energy Efficiency - 31.7% | | | |
| Aerospace & Defense - 1.6% | | | |
| Hexcel Corp. | | 46,480 | $3,127,174 |
| Auto Parts & Equipment - 0.6% | | | |
| Delphi Technologies PLC | | 25,180 | 1,202,345 |
| Building Products - 2.0% | | | |
| Apogee Enterprises, Inc. | | 87,670 | 3,782,084 |
| Buildings Energy Efficiency - 2.3% | | | |
| A.O. Smith Corp. | | 25,172 | 1,615,791 |
| Hubbell, Inc. Class B | | 20,650 | 2,706,183 |
| | | | 4,321,974 |
| Construction & Engineering - 2.0% | | | |
| Comfort Systems U.S.A., Inc. | | 91,890 | 3,772,085 |
| Electrical Components & Equipment - 1.0% | | | |
| Acuity Brands, Inc. | | 13,120 | 1,870,650 |
| Industrial Conglomerates - 1.3% | | | |
| Carlisle Companies, Inc. | | 23,175 | 2,384,939 |
| Industrial Energy Efficiency - 3.5% | | | |
| EMCOR Group, Inc. | | 34,988 | 2,669,934 |
| Minerals Technologies, Inc. | | 23,300 | 1,600,710 |
| Regal Beloit Corp. | | 31,184 | 2,254,603 |
| | | | 6,525,247 |
| Industrial Machinery - 3.3% | | | |
| Ingersoll-Rand PLC | | 70,360 | 6,247,968 |
| Renewable Energy Developers an - 11.4% | | | |
| EnerSys | | 22,620 | 1,576,388 |
| Honeywell International, Inc. | | 99,997 | 15,110,547 |
| Lennox International, Inc. | | 23,041 | 4,714,880 |
| | | | 21,401,815 |
| Transport Energy Efficiency - 2.7% | | | |
| BorgWarner, Inc. | | 18,920 | 928,594 |
| Innospec, Inc. | | 64,407 | 4,183,235 |
| | | | 5,111,829 |
|
| TOTAL ENERGY EFFICIENCY | | | 59,748,110 |
|
| Environmental Support Services - 10.1% | | | |
| Diversified Environmental - 10.1% | | | |
| 3M Co. | | 81,272 | 19,140,364 |
| Food Agriculture & Forestry - 9.8% | | | |
| Agricultural Products - 0.5% | | | |
| Bunge Ltd. | | 12,210 | 921,000 |
| Paper Packaging - 2.7% | | | |
| Bemis Co., Inc. | | 49,590 | 2,186,423 |
| Sealed Air Corp. | | 69,750 | 2,955,308 |
| | | | 5,141,731 |
| Pharmaceuticals - 2.4% | | | |
| Zoetis, Inc. Class A | | 55,440 | 4,482,878 |
| Sustainable and Efficient Agri - 4.2% | | | |
| Deere & Co. | | 49,348 | 7,938,613 |
|
| TOTAL FOOD AGRICULTURE & FORESTRY | | | 18,484,222 |
|
| Miscellaneous Environmental - 3.4% | | | |
| Electronic Manufacturing Services - 0.9% | | | |
| Philips Lighting NV (a) | | 42,880 | 1,698,692 |
| Household Appliances - 0.8% | | | |
| Whirlpool Corp. | | 9,320 | 1,513,848 |
| IT Consulting & Other Services - 0.8% | | | |
| IBM Corp. | | 9,965 | 1,552,846 |
| Pharmaceuticals - 0.9% | | | |
| Johnson & Johnson | | 12,230 | 1,588,432 |
|
| TOTAL MISCELLANEOUS ENVIRONMENTAL | | | 6,353,818 |
|
| Pollution Control - 7.8% | | | |
| Environmental Testing and Gas - 1.6% | | | |
| Thermo Fisher Scientific, Inc. | | 14,470 | 3,018,153 |
| Life Sciences Tools & Services - 0.9% | | | |
| PerkinElmer, Inc. | | 22,960 | 1,752,766 |
| Pollution Control Solutions - 4.7% | | | |
| Cummins, Inc. | | 30,972 | 5,208,561 |
| Tenneco, Inc. | | 68,268 | 3,587,483 |
| | | | 8,796,044 |
| Semiconductor Equipment - 0.6% | | | |
| Entegris, Inc. | | 31,820 | 1,056,424 |
|
| TOTAL POLLUTION CONTROL | | | 14,623,387 |
|
| Renewable & Alternative Energy - 22.1% | | | |
| Electric Utilities - 1.9% | | | |
| BKW AG | | 8,810 | 504,220 |
| Enersis SA | | 2,990,220 | 693,121 |
| Enersis SA sponsored | | 205,920 | 2,351,606 |
| | | | 3,548,947 |
| Electrical Components & Equipment - 3.0% | | | |
| Fortive Corp. | | 74,760 | 5,741,568 |
| Electronic Equipment & Instruments - 1.4% | | | |
| Enel Chile SA | | 6,820,772 | 843,367 |
| Enel Chile SA (b) | | 1,389,364 | 236 |
| Hollysys Automation Technologies Ltd. | | 68,571 | 1,810,960 |
| | | | 2,654,563 |
| Electronic Manufacturing Services - 3.5% | | | |
| TE Connectivity Ltd. | | 63,240 | 6,519,412 |
| Heavy Electrical Equipment - 1.6% | | | |
| Vestas Wind Systems A/S | | 43,140 | 3,117,773 |
| Independent Power Producers & Energy Traders - 0.6% | | | |
| Electric Power Development Co. Ltd. | | 28,740 | 728,740 |
| Empresa Nacional de Electricidad SA | | 355,303 | 332,441 |
| | | | 1,061,181 |
| Oil & Gas Refining & Marketing - 0.7% | | | |
| Cosan SA Industria e Comercio | | 94,140 | 1,257,462 |
| Other Renewables Equipment - 2.3% | | | |
| Andritz AG | | 74,042 | 4,295,600 |
| Renewable Electricity - 0.3% | | | |
| NHPC Ltd. | | 1,192,643 | 497,584 |
| Renewable Energy Developers an - 6.5% | | | |
| Empresa Nacional de Electricidad SA sponsored ADR | | 38,590 | 1,088,238 |
| Enel SpA | | 912,817 | 5,298,690 |
| ENGIE Brasil Energia SA | | 211,240 | 2,547,059 |
| Iberdrola SA | | 228,328 | 1,680,339 |
| Portland General Electric Co. | | 40,661 | 1,615,462 |
| | | | 12,229,788 |
| Semiconductor Equipment - 0.3% | | | |
| Advanced Energy Industries, Inc. (b) | | 10,180 | 675,138 |
|
| TOTAL RENEWABLE & ALTERNATIVE ENERGY | | | 41,599,016 |
|
| Waste Management & Technologies - 5.2% | | | |
| Office Services & Supplies - 1.9% | | | |
| Interface, Inc. | | 146,243 | 3,539,081 |
| Recycling and Value Added Wast - 1.7% | | | |
| Copart, Inc. (b) | | 69,488 | 3,252,733 |
| Steel - 1.6% | | | |
| Steel Dynamics, Inc. | | 65,580 | 3,033,075 |
|
| TOTAL WASTE MANAGEMENT & TECHNOLOGIES | | | 9,824,889 |
|
| Water Infrastructure & Technologies - 8.2% | | | |
| Diversified Water Infrastructu - 5.0% | | | |
| Danaher Corp. | | 95,720 | 9,359,502 |
| Trading Companies & Distributors - 0.8% | | | |
| HD Supply Holdings, Inc. (b) | | 42,110 | 1,526,488 |
| Water Infrastructure - 2.4% | | | |
| Crane Co. | | 49,717 | 4,589,376 |
|
| TOTAL WATER INFRASTRUCTURE & TECHNOLOGIES | | | 15,475,366 |
|
| TOTAL COMMON STOCKS | | | |
| (Cost $152,523,665) | | | 185,249,172 |
|
| Cash Equivalents - 1.4% | | | |
| Fidelity Cash Central Fund, 1.41% (c) | | | |
| (Cost $2,655,849) | | 2,655,318 | 2,655,849 |
| TOTAL INVESTMENT IN SECURITIES - 99.7% | | | |
| (Cost $155,179,514) | | | 187,905,021 |
| NET OTHER ASSETS (LIABILITIES) - 0.3% | | | 477,689 |
| NET ASSETS - 100% | | | $188,382,710 |
Legend
(a) Security exempt from registration under Rule 144A of the Securities Act of 1933. These securities may be resold in transactions exempt from registration, normally to qualified institutional buyers. At the end of the period, the value of these securities amounted to $1,698,692 or 0.9% of net assets.
(b) Non-income producing
(c) Affiliated fund that is generally available only to investment companies and other accounts managed by Fidelity Investments. The rate quoted is the annualized seven-day yield of the fund at period end. A complete unaudited listing of the fund's holdings as of its most recent quarter end is available upon request. In addition, each Fidelity Central Fund's financial statements, which are not covered by the Fund's Report of Independent Registered Public Accounting Firm, are available on the SEC's website or upon request.
Affiliated Central Funds
Information regarding fiscal year to date income earned by the Fund from investments in Fidelity Central Funds is as follows:
| Fund | Income earned |
| Fidelity Cash Central Fund | $28,766 |
| Fidelity Securities Lending Cash Central Fund | 28,222 |
| Total | $56,988 |
Amounts in the income column in the above table include any capital gain distributions from underlying funds, which are presented in the corresponding line-item in the Statement of Operations if applicable.
Investment Valuation
The following is a summary of the inputs used, as of February 28, 2018, involving the Fund's assets and liabilities carried at fair value. The inputs or methodology used for valuing securities may not be an indication of the risk associated with investing in those securities. For more information on valuation inputs, and their aggregation into the levels used below, please refer to the Investment Valuation section in the accompanying Notes to Financial Statements.
| | Valuation Inputs at Reporting Date: |
| Description | Total | Level 1 | Level 2 | Level 3 |
| Investments in Securities: | | | | |
| Common Stocks | $185,249,172 | $167,427,534 | $17,821,638 | $-- |
| Money Market Funds | 2,655,849 | 2,655,849 | -- | -- |
| Total Investments in Securities: | $187,905,021 | $170,083,383 | $17,821,638 | $-- |
The following is a summary of transfers between Level 1 and Level 2 for the period ended February 28, 2018. Transfers are assumed to have occurred at the beginning of the period, and are primarily attributable to the valuation techniques used for foreign equity securities, as discussed in the accompanying Notes to Financial Statements:
| Transfers | Total |
| Level 1 to Level 2 | $12,097,190 |
| Level 2 to Level 1 | $3,349,088 |
Other Information
Distribution of investments by country or territory of incorporation, as a percentage of Total Net Assets, is as follows (Unaudited):
| United States of America | 76.8% |
| Switzerland | 3.8% |
| Ireland | 3.3% |
| Chile | 2.8% |
| Italy | 2.8% |
| Austria | 2.3% |
| Brazil | 2.0% |
| Denmark | 1.6% |
| British Virgin Islands | 1.0% |
| Others (Individually Less Than 1%) | 3.6% |
| | 100.0% |
See accompanying notes which are an integral part of the financial statements.
Environment and Alternative Energy Portfolio
Financial Statements
Statement of Assets and Liabilities
| | | February 28, 2018 |
| Assets | | |
Investment in securities, at value — See accompanying schedule:
Unaffiliated issuers (cost $152,523,665) | $185,249,172 | |
| Fidelity Central Funds (cost $2,655,849) | 2,655,849 | |
| Total Investment in Securities (cost $155,179,514) | | $187,905,021 |
| Receivable for investments sold | | 44,275 |
| Receivable for fund shares sold | | 288,636 |
| Dividends receivable | | 451,145 |
| Distributions receivable from Fidelity Central Funds | | 2,937 |
| Prepaid expenses | | 604 |
| Other receivables | | 2,404 |
| Total assets | | 188,695,022 |
| Liabilities | | |
| Payable for fund shares redeemed | $142,207 | |
| Accrued management fee | 84,629 | |
| Transfer agent fee payable | 32,359 | |
| Other affiliated payables | 6,098 | |
| Other payables and accrued expenses | 47,019 | |
| Total liabilities | | 312,312 |
| Net Assets | | $188,382,710 |
| Net Assets consist of: | | |
| Paid in capital | | $151,835,643 |
| Undistributed net investment income | | 428,840 |
| Accumulated undistributed net realized gain (loss) on investments and foreign currency transactions | | 3,390,063 |
| Net unrealized appreciation (depreciation) on investments and assets and liabilities in foreign currencies | | 32,728,164 |
| Net Assets, for 7,159,681 shares outstanding | | $188,382,710 |
| Net Asset Value, offering price and redemption price per share ($188,382,710 ÷ 7,159,681 shares) | | $26.31 |
See accompanying notes which are an integral part of the financial statements.
Statement of Operations
| | | Year ended February 28, 2018 |
| Investment Income | | |
| Dividends | | $3,097,308 |
| Non-Cash dividends | | 170,822 |
| Income from Fidelity Central Funds | | 56,988 |
| Total income | | 3,325,118 |
| Expenses | | |
| Management fee | $937,926 | |
| Transfer agent fees | 364,606 | |
| Accounting and security lending fees | 67,452 | |
| Custodian fees and expenses | 19,831 | |
| Independent trustees' fees and expenses | 3,632 | |
| Registration fees | 35,761 | |
| Audit | 48,516 | |
| Legal | 1,903 | |
| Miscellaneous | 13,720 | |
| Total expenses before reductions | 1,493,347 | |
| Expense reductions | (6,184) | 1,487,163 |
| Net investment income (loss) | | 1,837,955 |
| Realized and Unrealized Gain (Loss) | | |
| Net realized gain (loss) on: | | |
| Investment securities: | | |
| Unaffiliated issuers | 10,614,184 | |
| Fidelity Central Funds | 222 | |
| Foreign currency transactions | (5,915) | |
| Total net realized gain (loss) | | 10,608,491 |
| Change in net unrealized appreciation (depreciation) on: | | |
| Unaffiliated issuers (net of decrease in deferred foreign taxes of $12,300) | 14,659,243 | |
| Fidelity Central Funds | (606) | |
| Assets and liabilities in foreign currencies | 5,134 | |
| Total change in net unrealized appreciation (depreciation) | | 14,663,771 |
| Net gain (loss) | | 25,272,262 |
| Net increase (decrease) in net assets resulting from operations | | $27,110,217 |
See accompanying notes which are an integral part of the financial statements.
Statement of Changes in Net Assets
| | Year ended February 28, 2018 | Year ended February 28, 2017 |
| Increase (Decrease) in Net Assets | | |
| Operations | | |
| Net investment income (loss) | $1,837,955 | $930,588 |
| Net realized gain (loss) | 10,608,491 | 5,955,658 |
| Change in net unrealized appreciation (depreciation) | 14,663,771 | 21,441,835 |
| Net increase (decrease) in net assets resulting from operations | 27,110,217 | 28,328,081 |
| Distributions to shareholders from net investment income | (1,447,374) | (790,016) |
| Distributions to shareholders from net realized gain | (9,452,414) | (676,548) |
| Total distributions | (10,899,788) | (1,466,564) |
| Share transactions | | |
| Proceeds from sales of shares | 111,369,434 | 66,656,121 |
| Reinvestment of distributions | 10,265,405 | 1,399,954 |
| Cost of shares redeemed | (87,147,383) | (30,686,349) |
| Net increase (decrease) in net assets resulting from share transactions | 34,487,456 | 37,369,726 |
| Redemption fees | 11,308 | 10,066 |
| Total increase (decrease) in net assets | 50,709,193 | 64,241,309 |
| Net Assets | | |
| Beginning of period | 137,673,517 | 73,432,208 |
| End of period | $188,382,710 | $137,673,517 |
| Other Information | | |
| Undistributed net investment income end of period | $428,840 | $279,557 |
| Shares | | |
| Sold | 4,413,503 | 3,101,751 |
| Issued in reinvestment of distributions | 413,420 | 64,231 |
| Redeemed | (3,430,336) | (1,437,873) |
| Net increase (decrease) | 1,396,587 | 1,728,109 |
See accompanying notes which are an integral part of the financial statements.
Financial Highlights
Environment and Alternative Energy Portfolio
| | | | | | |
| Years ended February 28, | 2018 | 2017 | 2016 A | 2015 | 2014 |
| Selected Per–Share Data | | | | | |
| Net asset value, beginning of period | $23.89 | $18.20 | $20.94 | $23.36 | $18.12 |
| Income from Investment Operations | | | | | |
| Net investment income (loss)B | .27 | .20 | .17 | .16 | .14 |
| Net realized and unrealized gain (loss) | 3.83 | 5.78 | (2.34) | .31 | 5.27 |
| Total from investment operations | 4.10 | 5.98 | (2.17) | .47 | 5.41 |
| Distributions from net investment income | (.22) | (.16) | (.13) | (.14) | (.17) |
| Distributions from net realized gain | (1.46) | (.13) | (.44) | (2.75) | – |
| Total distributions | (1.68) | (.29) | (.57) | (2.89) | (.17) |
| Redemption fees added to paid in capitalB,C | – | – | – | – | – |
| Net asset value, end of period | $26.31 | $23.89 | $18.20 | $20.94 | $23.36 |
| Total ReturnD | 17.73% | 33.02% | (10.63)% | 2.19% | 29.97% |
| Ratios to Average Net AssetsE,F | | | | | |
| Expenses before reductions | .87% | .94% | .95% | .92% | .97% |
| Expenses net of fee waivers, if any | .87% | .94% | .95% | .92% | .97% |
| Expenses net of all reductions | .86% | .94% | .95% | .92% | .97% |
| Net investment income (loss) | 1.07% | .94% | .86% | .71% | .70% |
| Supplemental Data | | | | | |
| Net assets, end of period (000 omitted) | $188,383 | $137,674 | $73,432 | $88,573 | $102,869 |
| Portfolio turnover rateG | 47% | 82% | 20% | 160% | 28% |
A For the year ended February 29.
B Calculated based on average shares outstanding during the period.
C Amount represents less than $.005 per share.
D Total returns would have been lower if certain expenses had not been reduced during the applicable periods shown.
E Fees and expenses of any underlying Fidelity Central Funds are not included in the Fund's expense ratio. The Fund indirectly bears its proportionate share of the expenses of any underlying Fidelity Central Funds.
F Expense ratios reflect operating expenses of the Fund. Expenses before reductions do not reflect amounts reimbursed by the investment adviser or reductions from brokerage service arrangements or reductions from other expense offset arrangements and do not represent the amount paid by the Fund during periods when reimbursements or reductions occur. Expenses net of fee waivers reflect expenses after reimbursement by the investment adviser but prior to reductions from brokerage service arrangements or other expense offset arrangements. Expenses net of all reductions represent the net expenses paid by the Fund.
G Amount does not include the portfolio activity of any underlying Fidelity Central Funds.
See accompanying notes which are an integral part of the financial statements.
Industrials Portfolio
Performance: The Bottom Line
Average annual total return reflects the change in the value of an investment, assuming reinvestment of distributions from dividend income and capital gains (the profits earned upon the sale of securities that have grown in value, if any) and assuming a constant rate of performance each year. The hypothetical investment and the average annual total returns do not reflect the deduction of taxes that a shareholder would pay on fund distributions or the redemption of fund shares. During periods of reimbursement by Fidelity, a fund’s total return will be greater than it would be had the reimbursement not occurred. How a fund did yesterday is no guarantee of how it will do tomorrow.
Average Annual Total Returns
| For the periods ended February 28, 2018 | Past 1 year | Past 5 years | Past 10 years |
| Industrials Portfolio | 15.73% | 13.05% | 10.54% |
$10,000 Over 10 Years
Let's say hypothetically that $10,000 was invested in Industrials Portfolio on February 29, 2008.
The chart shows how the value of your investment would have changed, and also shows how the S&P 500® Index performed over the same period.
| Period Ending Values |
| $27,241 | Industrials Portfolio |
| $25,307 | S&P 500® Index |
Industrials Portfolio
Management's Discussion of Fund Performance
Market Recap: U.S. equities gained 17.10% for the 12 months ending February 28, 2018, as the S&P 500
® index moved steadily higher throughout 2017 and into 2018 until sharply reversing course in February. The drop was in stark contrast to the low volatility seen throughout 2017, along with consumer sentiment and other market indicators that stayed positive. Investors remained decidedly upbeat as the calendar turned, and the index rose 5.73% in January. February was a decidedly different story, though, as volatility spiked amid fear that rising inflation and the potential for the economy to overheat would prompt the U.S. Federal Reserve to pick up the pace of interest rate hikes. The index returned -3.69% for the month, its first negative result since October 2016. For the full 12 months, growth stocks handily topped value, while large-caps bested small-caps. By sector, information technology fared best by far, gaining 36% amid strong earnings growth from several major index constituents. Consumer discretionary (+22%) also stood out, driven by retailers. Financials added 20%, riding the uptick in bond yields. Materials and industrials rose about 16% each, boosted by higher demand, especially from China. Conversely, notable laggards included the defensive telecommunication services (-5%) and utilities (-2%) sectors, while rising rates held back real estate (-3%).
Comments from Portfolio Manager Tobias Welo: For the fiscal year, the fund gained 15.73%, a bit behind the 16.05% return of the MSCI U.S. IMI Industrials 25/50 Index, and also trailing the S&P 500
® index. Versus the MSCI sector index, stock selection in aerospace & defense – especially underweighting strong-performing index constituent Boeing, by far the fund’s largest relative detractor – hindered fund performance, along with positioning in trading companies & distributors and picks in industrial machinery. Other relative detractors included conglomerate 3M, where an underweighting hurt, as well as untimely positioning in industrial supplier MSC Industrial Direct and a sizable overweighting in multinational engineering firm Aecom. MSC Industrial Direct was not held at period end. Conversely, a large underweighting in the weak industrial conglomerates category – mainly due to relatively light exposure to General Electric – worked in our favor, as did overweighting construction machinery & heavy trucks, where our large stake in Caterpillar added value. Defense contractor Northrop Grumman also had a strong showing.
The views expressed above reflect those of the portfolio manager(s) only through the end of the period as stated on the cover of this report and do not necessarily represent the views of Fidelity or any other person in the Fidelity organization. Any such views are subject to change at any time based upon market or other conditions and Fidelity disclaims any responsibility to update such views. These views may not be relied on as investment advice and, because investment decisions for a Fidelity fund are based on numerous factors, may not be relied on as an indication of trading intent on behalf of any Fidelity fund.
Note to Shareholders: On December 8, 2017, shareholders approved proposals from the Board of Trustees to eliminate each sector/industry fund's fundamental “invests primarily” policy and to modify the fundamental concentration policy for certain funds. The changes took effect on January 1, 2018, and do not impact how the funds are managed.
Industrials Portfolio
Investment Summary (Unaudited)
Top Ten Stocks as of February 28, 2018
| | % of fund's net assets |
| United Technologies Corp. | 6.5 |
| Northrop Grumman Corp. | 5.1 |
| Honeywell International, Inc. | 4.9 |
| The Boeing Co. | 4.0 |
| General Dynamics Corp. | 4.0 |
| Union Pacific Corp. | 3.7 |
| Caterpillar, Inc. | 3.2 |
| FedEx Corp. | 3.0 |
| Fortive Corp. | 2.7 |
| Ingersoll-Rand PLC | 2.7 |
| | 39.8 |
Top Industries (% of fund's net assets)
| As of February 28, 2018 |
| | Aerospace & Defense | 29.2% |
| | Machinery | 20.8% |
| | Industrial Conglomerates | 7.6% |
| | Road & Rail | 7.0% |
| | Electrical Equipment | 6.6% |
| | All Others* | 28.8% |

* Includes short-term investments and net other assets (liabilities).
Industrials Portfolio
Schedule of Investments February 28, 2018
Showing Percentage of Net Assets
| Common Stocks - 99.6% | | | |
| | | Shares | Value |
| Aerospace & Defense - 29.2% | | | |
| Aerospace & Defense - 29.2% | | | |
| Astronics Corp. (a) | | 77,317 | $2,980,570 |
| Axon Enterprise, Inc. (a)(b) | | 230,900 | 8,042,247 |
| Bombardier, Inc. Class B (sub. vtg.) (a) | | 2,814,500 | 8,904,980 |
| Elbit Systems Ltd. | | 33,400 | 4,809,934 |
| General Dynamics Corp. | | 192,297 | 42,776,468 |
| Huntington Ingalls Industries, Inc. | | 48,100 | 12,602,681 |
| Moog, Inc. Class A (a) | | 62,700 | 5,256,141 |
| Northrop Grumman Corp. | | 157,600 | 55,166,304 |
| Raytheon Co. | | 126,100 | 27,428,011 |
| Spirit AeroSystems Holdings, Inc. Class A | | 108,400 | 9,895,836 |
| Teledyne Technologies, Inc. (a) | | 67,340 | 12,521,873 |
| The Boeing Co. | | 120,200 | 43,537,642 |
| TransDigm Group, Inc. | | 36,900 | 10,638,639 |
| United Technologies Corp. | | 521,871 | 70,316,900 |
| | | | 314,878,226 |
| Air Freight & Logistics - 4.8% | | | |
| Air Freight & Logistics - 4.8% | | | |
| Air Transport Services Group, Inc. (a) | | 141,000 | 3,732,270 |
| FedEx Corp. | | 132,300 | 32,600,043 |
| XPO Logistics, Inc. (a) | | 161,200 | 15,866,916 |
| | | | 52,199,229 |
| Airlines - 4.3% | | | |
| Airlines - 4.3% | | | |
| Allegiant Travel Co. | | 40,396 | 6,717,855 |
| Delta Air Lines, Inc. | | 261,300 | 14,084,070 |
| Southwest Airlines Co. | | 323,500 | 18,711,240 |
| Spirit Airlines, Inc. (a) | | 159,300 | 6,346,512 |
| | | | 45,859,677 |
| Building Products - 4.1% | | | |
| Building Products - 4.1% | | | |
| A.O. Smith Corp. | | 131,178 | 8,420,316 |
| Fortune Brands Home & Security, Inc. | | 103,100 | 6,254,046 |
| Johnson Controls International PLC | | 409,500 | 15,098,265 |
| Masco Corp. | | 351,800 | 14,466,016 |
| | | | 44,238,643 |
| Commercial Services & Supplies - 3.0% | | | |
| Diversified Support Services - 1.9% | | | |
| Cintas Corp. | | 68,900 | 11,758,474 |
| KAR Auction Services, Inc. | | 147,900 | 7,998,432 |
| | | | 19,756,906 |
| Environmental & Facility Services - 1.1% | | | |
| Waste Connection, Inc. (United States) | | 170,900 | 12,096,302 |
|
| TOTAL COMMERCIAL SERVICES & SUPPLIES | | | 31,853,208 |
|
| Construction & Engineering - 4.7% | | | |
| Construction & Engineering - 4.7% | | | |
| AECOM (a) | | 211,291 | 7,502,943 |
| Dycom Industries, Inc. (a) | | 59,200 | 6,467,008 |
| Fluor Corp. | | 233,100 | 13,263,390 |
| Jacobs Engineering Group, Inc. | | 222,300 | 13,573,638 |
| KBR, Inc. | | 610,900 | 9,249,026 |
| | | | 50,056,005 |
| Electrical Equipment - 6.6% | | | |
| Electrical Components & Equipment - 6.4% | | | |
| Acuity Brands, Inc. | | 48,400 | 6,900,872 |
| AMETEK, Inc. | | 258,454 | 19,575,306 |
| Emerson Electric Co. | | 187,000 | 13,288,220 |
| Fortive Corp. | | 382,210 | 29,353,728 |
| | | | 69,118,126 |
| Heavy Electrical Equipment - 0.2% | | | |
| TPI Composites, Inc. (a) | | 101,511 | 2,011,948 |
|
| TOTAL ELECTRICAL EQUIPMENT | | | 71,130,074 |
|
| Electronic Equipment & Components - 0.8% | | | |
| Electronic Equipment & Instruments - 0.8% | | | |
| ADT, Inc. (a) | | 854,300 | 9,021,408 |
| Household Durables - 0.5% | | | |
| Homebuilding - 0.5% | | | |
| Lennar Corp. Class A | | 45,000 | 2,546,100 |
| TRI Pointe Homes, Inc. (a) | | 167,300 | 2,564,709 |
| | | | 5,110,809 |
| Industrial Conglomerates - 7.6% | | | |
| Industrial Conglomerates - 7.6% | | | |
| General Electric Co. | | 1,050,539 | 14,823,105 |
| Honeywell International, Inc. | | 348,859 | 52,716,083 |
| ITT, Inc. | | 278,600 | 13,980,148 |
| | | | 81,519,336 |
| Machinery - 20.8% | | | |
| Agricultural & Farm Machinery - 1.7% | | | |
| Deere & Co. | | 111,100 | 17,872,657 |
| Construction Machinery & Heavy Trucks - 7.2% | | | |
| Allison Transmission Holdings, Inc. | | 487,100 | 19,303,773 |
| Caterpillar, Inc. | | 224,000 | 34,637,120 |
| WABCO Holdings, Inc. (a) | | 129,200 | 17,825,724 |
| Wabtec Corp. (b) | | 66,700 | 5,425,378 |
| | | | 77,191,995 |
| Industrial Machinery - 11.9% | | | |
| Flowserve Corp. | | 115,008 | 4,870,589 |
| Gardner Denver Holdings, Inc. | | 525,600 | 16,824,456 |
| IDEX Corp. | | 66,298 | 9,069,566 |
| Ingersoll-Rand PLC | | 323,700 | 28,744,560 |
| Lincoln Electric Holdings, Inc. | | 111,300 | 9,743,202 |
| Parker Hannifin Corp. | | 112,600 | 20,095,722 |
| SMC Corp. | | 6,900 | 2,875,761 |
| Snap-On, Inc. | | 142,600 | 22,704,772 |
| The Weir Group PLC | | 132,000 | 3,683,182 |
| Xylem, Inc. | | 132,100 | 9,852,018 |
| | | | 128,463,828 |
|
| TOTAL MACHINERY | | | 223,528,480 |
|
| Professional Services - 3.2% | | | |
| Human Resource & Employment Services - 0.8% | | | |
| Robert Half International, Inc. | | 152,400 | 8,697,468 |
| Research & Consulting Services - 2.4% | | | |
| IHS Markit Ltd. (a) | | 535,708 | 25,205,061 |
|
| TOTAL PROFESSIONAL SERVICES | | | 33,902,529 |
|
| Road & Rail - 7.0% | | | |
| Railroads - 5.4% | | | |
| Norfolk Southern Corp. | | 134,800 | 18,747,984 |
| Union Pacific Corp. | | 303,500 | 39,530,875 |
| | | | 58,278,859 |
| Trucking - 1.6% | | | |
| J.B. Hunt Transport Services, Inc. | | 74,420 | 8,823,979 |
| Old Dominion Freight Lines, Inc. | | 61,900 | 8,599,148 |
| | | | 17,423,127 |
|
| TOTAL ROAD & RAIL | | | 75,701,986 |
|
| Specialty Retail - 0.9% | | | |
| Home Improvement Retail - 0.9% | | | |
| Lowe's Companies, Inc. | | 109,200 | 9,783,228 |
| Trading Companies & Distributors - 1.9% | | | |
| Trading Companies & Distributors - 1.9% | | | |
| Bunzl PLC | | 192,900 | 5,177,435 |
| Univar, Inc. (a) | | 541,800 | 15,609,258 |
| | | | 20,786,693 |
| Water Utilities - 0.2% | | | |
| Water Utilities - 0.2% | | | |
| AquaVenture Holdings Ltd. (a) | | 189,300 | 2,432,505 |
| TOTAL COMMON STOCKS | | | |
| (Cost $831,389,831) | | | 1,072,002,036 |
|
| Money Market Funds - 1.3% | | | |
| Fidelity Cash Central Fund, 1.41% (c) | | 6,574,236 | 6,575,550 |
| Fidelity Securities Lending Cash Central Fund 1.42% (c)(d) | | 7,571,247 | 7,572,004 |
| TOTAL MONEY MARKET FUNDS | | | |
| (Cost $14,147,554) | | | 14,147,554 |
| TOTAL INVESTMENT IN SECURITIES - 100.9% | | | |
| (Cost $845,537,385) | | | 1,086,149,590 |
| NET OTHER ASSETS (LIABILITIES) - (0.9)% | | | (9,199,529) |
| NET ASSETS - 100% | | | $1,076,950,061 |
Legend
(a) Non-income producing
(b) Security or a portion of the security is on loan at period end.
(c) Affiliated fund that is generally available only to investment companies and other accounts managed by Fidelity Investments. The rate quoted is the annualized seven-day yield of the fund at period end. A complete unaudited listing of the fund's holdings as of its most recent quarter end is available upon request. In addition, each Fidelity Central Fund's financial statements, which are not covered by the Fund's Report of Independent Registered Public Accounting Firm, are available on the SEC's website or upon request.
(d) Investment made with cash collateral received from securities on loan.
Affiliated Central Funds
Information regarding fiscal year to date income earned by the Fund from investments in Fidelity Central Funds is as follows:
| Fund | Income earned |
| Fidelity Cash Central Fund | $78,373 |
| Fidelity Securities Lending Cash Central Fund | 37,499 |
| Total | $115,872 |
Amounts in the income column in the above table include any capital gain distributions from underlying funds, which are presented in the corresponding line-item in the Statement of Operations if applicable.
Investment Valuation
The following is a summary of the inputs used, as of February 28, 2018, involving the Fund's assets and liabilities carried at fair value. The inputs or methodology used for valuing securities may not be an indication of the risk associated with investing in those securities. For more information on valuation inputs, and their aggregation into the levels used below, please refer to the Investment Valuation section in the accompanying Notes to Financial Statements.
| | Valuation Inputs at Reporting Date: |
| Description | Total | Level 1 | Level 2 | Level 3 |
| Investments in Securities: | | | | |
| Common Stocks | $1,072,002,036 | $1,060,265,658 | $11,736,378 | $-- |
| Money Market Funds | 14,147,554 | 14,147,554 | -- | -- |
| Total Investments in Securities: | $1,086,149,590 | $1,074,413,212 | $11,736,378 | $-- |
Other Information
Distribution of investments by country or territory of incorporation, as a percentage of Total Net Assets, is as follows (Unaudited):
| United States of America | 89.9% |
| Ireland | 4.1% |
| Bermuda | 2.4% |
| Canada | 1.9% |
| Others (Individually Less Than 1%) | 1.7% |
| | 100.0% |
See accompanying notes which are an integral part of the financial statements.
Industrials Portfolio
Financial Statements
Statement of Assets and Liabilities
| | | February 28, 2018 |
| Assets | | |
Investment in securities, at value (including securities loaned of $8,362,434) — See accompanying schedule:
Unaffiliated issuers (cost $831,389,831) | $1,072,002,036 | |
| Fidelity Central Funds (cost $14,147,554) | 14,147,554 | |
| Total Investment in Securities (cost $845,537,385) | | $1,086,149,590 |
| Receivable for investments sold | | 7,588,735 |
| Receivable for fund shares sold | | 831,929 |
| Dividends receivable | | 1,693,457 |
| Distributions receivable from Fidelity Central Funds | | 8,964 |
| Prepaid expenses | | 2,946 |
| Other receivables | | 95,118 |
| Total assets | | 1,096,370,739 |
| Liabilities | | |
| Payable for investments purchased | $10,075,217 | |
| Payable for fund shares redeemed | 972,037 | |
| Accrued management fee | 487,747 | |
| Other affiliated payables | 168,623 | |
| Other payables and accrued expenses | 146,204 | |
| Collateral on securities loaned | 7,570,850 | |
| Total liabilities | | 19,420,678 |
| Net Assets | | $1,076,950,061 |
| Net Assets consist of: | | |
| Paid in capital | | $794,881,482 |
| Undistributed net investment income | | 1,342,839 |
| Accumulated undistributed net realized gain (loss) on investments and foreign currency transactions | | 40,113,541 |
| Net unrealized appreciation (depreciation) on investments and assets and liabilities in foreign currencies | | 240,612,199 |
| Net Assets, for 29,136,830 shares outstanding | | $1,076,950,061 |
| Net Asset Value, offering price and redemption price per share ($1,076,950,061 ÷ 29,136,830 shares) | | $36.96 |
See accompanying notes which are an integral part of the financial statements.
Statement of Operations
| | | Year ended February 28, 2018 |
| Investment Income | | |
| Dividends | | $12,423,121 |
| Income from Fidelity Central Funds | | 115,872 |
| Total income | | 12,538,993 |
| Expenses | | |
| Management fee | $4,968,632 | |
| Transfer agent fees | 1,584,990 | |
| Accounting and security lending fees | 311,518 | |
| Custodian fees and expenses | 18,956 | |
| Independent trustees' fees and expenses | 19,888 | |
| Registration fees | 52,289 | |
| Audit | 49,207 | |
| Legal | 13,582 | |
| Interest | 1,978 | |
| Miscellaneous | 45,801 | |
| Total expenses before reductions | 7,066,841 | |
| Expense reductions | (53,864) | 7,012,977 |
| Net investment income (loss) | | 5,526,016 |
| Realized and Unrealized Gain (Loss) | | |
| Net realized gain (loss) on: | | |
| Investment securities: | | |
| Unaffiliated issuers | 75,767,764 | |
| Fidelity Central Funds | 2,989 | |
| Foreign currency transactions | (14,406) | |
| Total net realized gain (loss) | | 75,756,347 |
| Change in net unrealized appreciation (depreciation) on: | | |
| Investment securities: | | |
| Unaffiliated issuers | 33,436,408 | |
| Fidelity Central Funds | (205) | |
| Assets and liabilities in foreign currencies | (6) | |
| Total change in net unrealized appreciation (depreciation) | | 33,436,197 |
| Net gain (loss) | | 109,192,544 |
| Net increase (decrease) in net assets resulting from operations | | $114,718,560 |
See accompanying notes which are an integral part of the financial statements.
Statement of Changes in Net Assets
| | Year ended February 28, 2018 | Year ended February 28, 2017 |
| Increase (Decrease) in Net Assets | | |
| Operations | | |
| Net investment income (loss) | $5,526,016 | $8,475,623 |
| Net realized gain (loss) | 75,756,347 | 113,517,493 |
| Change in net unrealized appreciation (depreciation) | 33,436,197 | 81,799,219 |
| Net increase (decrease) in net assets resulting from operations | 114,718,560 | 203,792,335 |
| Distributions to shareholders from net investment income | (5,401,531) | (5,098,193) |
| Distributions to shareholders from net realized gain | (43,099,432) | (33,247,891) |
| Total distributions | (48,500,963) | (38,346,084) |
| Share transactions | | |
| Proceeds from sales of shares | 196,779,599 | 405,686,354 |
| Net asset value of shares issued in exchange for the net assets of Industrial Equipment Portfolio (note 11) | 186,045,666 | – |
| Reinvestment of distributions | 46,751,393 | 37,026,695 |
| Cost of shares redeemed | (425,264,580) | (580,294,997) |
| Net increase (decrease) in net assets resulting from share transactions | 4,312,078 | (137,581,948) |
| Redemption fees | – | 6,151 |
| Total increase (decrease) in net assets | 70,529,675 | 27,870,454 |
| Net Assets | | |
| Beginning of period | 1,006,420,386 | 978,549,932 |
| End of period | $1,076,950,061 | $1,006,420,386 |
| Other Information | | |
| Undistributed net investment income end of period | $1,342,839 | $1,623,010 |
| Shares | | |
| Sold | 5,592,749 | 12,627,592 |
| Issued in exchange for the shares of Industrial Equipment Portfolio (note 11) | 4,761,855 | – |
| Issued in reinvestment of distributions | 1,349,204 | 1,142,094 |
| Redeemed | (12,414,624) | (18,750,051) |
| Net increase (decrease) | (710,816) | (4,980,365) |
See accompanying notes which are an integral part of the financial statements.
Financial Highlights
Industrials Portfolio
| | | | | | |
| Years ended February 28, | 2018 | 2017 | 2016 A | 2015 | 2014 |
| Selected Per–Share Data | | | | | |
| Net asset value, beginning of period | $33.72 | $28.10 | $32.69 | $33.69 | $28.04 |
| Income from Investment Operations | | | | | |
| Net investment income (loss)B | .21 | .26 | .24 | .22 | .23 |
| Net realized and unrealized gain (loss) | 4.95 | 6.76 | (2.90) | 2.44 | 7.36 |
| Total from investment operations | 5.16 | 7.02 | (2.66) | 2.66 | 7.59 |
| Distributions from net investment income | (.22) | (.19) | (.20) | (.23) | (.20) |
| Distributions from net realized gain | (1.71) | (1.21) | (1.73) | (3.43) | (1.74) |
| Total distributions | (1.92)C | (1.40) | (1.93) | (3.66) | (1.94) |
| Redemption fees added to paid in capitalB | – | –D | –D | –D | –D |
| Net asset value, end of period | $36.96 | $33.72 | $28.10 | $32.69 | $33.69 |
| Total ReturnE | 15.73% | 25.18% | (8.29)% | 8.74% | 27.80% |
| Ratios to Average Net AssetsF,G | | | | | |
| Expenses before reductions | .77% | .77% | .77% | .78% | .81% |
| Expenses net of fee waivers, if any | .77% | .77% | .76% | .78% | .81% |
| Expenses net of all reductions | .77% | .77% | .76% | .78% | .81% |
| Net investment income (loss) | .60% | .83% | .79% | .68% | .74% |
| Supplemental Data | | | | | |
| Net assets, end of period (000 omitted) | $1,076,950 | $1,006,420 | $978,550 | $1,142,689 | $1,217,117 |
| Portfolio turnover rateH | 64%I | 62%J | 75%J | 72%J | 58% |
A For the year ended February 29.
B Calculated based on average shares outstanding during the period.
C Total distributions of $1.92 per share is comprised of distributions from net investment income of $.216 and distributions from net realized gain of $1.705 per share.
D Amount represents less than $.005 per share.
E Total returns would have been lower if certain expenses had not been reduced during the applicable periods shown.
F Fees and expenses of any underlying Fidelity Central Funds are not included in the Fund's expense ratio. The Fund indirectly bears its proportionate share of the expenses of any underlying Fidelity Central Funds.
G Expense ratios reflect operating expenses of the Fund. Expenses before reductions do not reflect amounts reimbursed by the investment adviser or reductions from brokerage service arrangements or reductions from other expense offset arrangements and do not represent the amount paid by the Fund during periods when reimbursements or reductions occur. Expenses net of fee waivers reflect expenses after reimbursement by the investment adviser but prior to reductions from brokerage service arrangements or other expense offset arrangements. Expenses net of all reductions represent the net expenses paid by the Fund.
H Amount does not include the portfolio activity of any underlying Fidelity Central Funds.
I The portfolio turnover rate does not include the assets acquired in the merger.
J Portfolio turnover rate excludes securities received or delivered in-kind.
See accompanying notes which are an integral part of the financial statements.
Transportation Portfolio
Performance: The Bottom Line
Average annual total return reflects the change in the value of an investment, assuming reinvestment of distributions from dividend income and capital gains (the profits earned upon the sale of securities that have grown in value, if any) and assuming a constant rate of performance each year. The hypothetical investment and the average annual total returns do not reflect the deduction of taxes that a shareholder would pay on fund distributions or the redemption of fund shares. During periods of reimbursement by Fidelity, a fund’s total return will be greater than it would be had the reimbursement not occurred. How a fund did yesterday is no guarantee of how it will do tomorrow.
Average Annual Total Returns
| For the periods ended February 28, 2018 | Past 1 year | Past 5 years | Past 10 years |
| Transportation Portfolio | 12.48% | 16.11% | 12.57% |
$10,000 Over 10 Years
Let's say hypothetically that $10,000 was invested in Transportation Portfolio on February 29, 2008.
The chart shows how the value of your investment would have changed, and also shows how the S&P 500® Index performed over the same period.
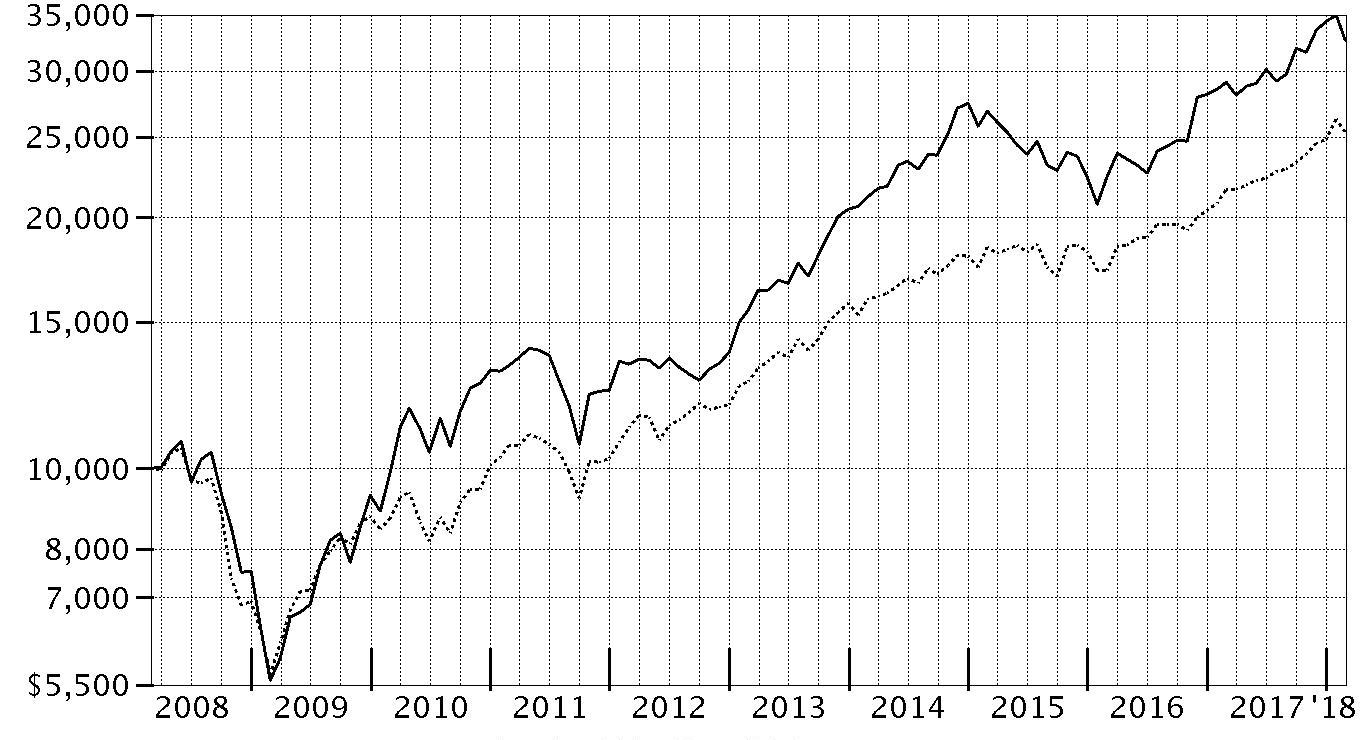
| Period Ending Values |
| $32,674 | Transportation Portfolio |
| $25,307 | S&P 500® Index |
Transportation Portfolio
Management's Discussion of Fund Performance
Market Recap: U.S. equities gained 17.10% for the 12 months ending February 28, 2018, as the S&P 500
® index moved steadily higher throughout 2017 and into 2018 until sharply reversing course in February. The drop was in stark contrast to the low volatility seen throughout 2017, along with consumer sentiment and other market indicators that stayed positive. Investors remained decidedly upbeat as the calendar turned, and the index rose 5.73% in January. February was a decidedly different story, though, as volatility spiked amid fear that rising inflation and the potential for the economy to overheat would prompt the U.S. Federal Reserve to pick up the pace of interest rate hikes. The index returned -3.69% for the month, its first negative result since October 2016. For the full 12 months, growth stocks handily topped value, while large-caps bested small-caps. By sector, information technology fared best by far, gaining 36% amid strong earnings growth from several major index constituents. Consumer discretionary (+22%) also stood out, driven by retailers. Financials added 20%, riding the uptick in bond yields. Materials and industrials rose about 16% each, boosted by higher demand, especially from China. Conversely, notable laggards included the defensive telecommunication services (-5%) and utilities (-2%) sectors, while rising rates held back real estate (-3%).
Comments from Portfolio Manager Matthew Moulis: For the fiscal year, the fund gained 12.48%, trailing the 13.74% return of the MSCI U.S. IMI Transportation 25/50 Index, and also behind the S&P 500
® index. Versus the MSCI industry index, underweighting the strong-performing trucking segment, and picks within that group, detracted from fund performance, as did stock selection in railroads. The fund’s largest detractor was Alaska Air Group. This period, the carrier ran into some problems with the regional airline connecting most of its flights. Within trucking, avoiding Old Dominion Freight Lines proved costly to relative performance, as this index stock delivered a 52% return. Conversely, an underweighting and stock picking in airlines benefited the fund’s relative result. Our top individual relative contributor was United Continental Holdings, parent company of United Airlines. We didn’t own it at all early in the period, but I established an underweighted position later on – to the fund’s benefit. Truck brokerage CH Robinson Worldwide, part of the air freight & logistics segment, also lifted our relative result.
The views expressed above reflect those of the portfolio manager(s) only through the end of the period as stated on the cover of this report and do not necessarily represent the views of Fidelity or any other person in the Fidelity organization. Any such views are subject to change at any time based upon market or other conditions and Fidelity disclaims any responsibility to update such views. These views may not be relied on as investment advice and, because investment decisions for a Fidelity fund are based on numerous factors, may not be relied on as an indication of trading intent on behalf of any Fidelity fund.
Note to Shareholders: On December 8, 2017, shareholders approved proposals from the Board of Trustees to eliminate each sector/industry fund's fundamental “invests primarily” policy and to modify the fundamental concentration policy for certain funds. The changes took effect on January 1, 2018, and do not impact how the funds are managed.
Transportation Portfolio
Investment Summary (Unaudited)
Top Ten Stocks as of February 28, 2018
| | % of fund's net assets |
| Union Pacific Corp. | 18.5 |
| United Parcel Service, Inc. Class B | 12.0 |
| CSX Corp. | 9.1 |
| FedEx Corp. | 7.0 |
| Delta Air Lines, Inc. | 5.1 |
| Southwest Airlines Co. | 5.0 |
| Norfolk Southern Corp. | 4.9 |
| Genesee & Wyoming, Inc. Class A | 3.4 |
| C.H. Robinson Worldwide, Inc. | 3.2 |
| J.B. Hunt Transport Services, Inc. | 3.1 |
| | 71.3 |
Top Industries (% of fund's net assets)
| As of February 28, 2018 |
| | Road & Rail | 45.4% |
| | Air Freight & Logistics | 29.3% |
| | Airlines | 17.8% |
| | Machinery | 1.2% |
| | Transportation Infrastructure | 1.1% |
| | All Others* | 5.2% |
* Includes short-term investments and net other assets (liabilities).
Transportation Portfolio
Schedule of Investments February 28, 2018
Showing Percentage of Net Assets
| Common Stocks - 96.2% | | | |
| | | Shares | Value |
| Air Freight & Logistics - 29.3% | | | |
| Air Freight & Logistics - 29.3% | | | |
| Air Transport Services Group, Inc. (a) | | 189,300 | $5,010,771 |
| Atlas Air Worldwide Holdings, Inc. (a) | | 55,110 | 3,353,444 |
| C.H. Robinson Worldwide, Inc. | | 176,096 | 16,440,323 |
| Echo Global Logistics, Inc. (a) | | 141,100 | 3,732,095 |
| Expeditors International of Washington, Inc. | | 225,500 | 14,648,480 |
| FedEx Corp. | | 145,950 | 35,963,540 |
| Forward Air Corp. | | 106,544 | 5,753,376 |
| United Parcel Service, Inc. Class B | | 587,200 | 61,309,552 |
| XPO Logistics, Inc. (a) | | 38,800 | 3,819,084 |
| | | | 150,030,665 |
| Airlines - 17.8% | | | |
| Airlines - 17.8% | | | |
| Alaska Air Group, Inc. | | 169,400 | 10,926,300 |
| Allegiant Travel Co. | | 4,700 | 781,610 |
| American Airlines Group, Inc. | | 134,700 | 7,307,475 |
| Delta Air Lines, Inc. | | 483,402 | 26,055,368 |
| Hawaiian Holdings, Inc. | | 107,600 | 3,873,600 |
| JetBlue Airways Corp. (a) | | 63,300 | 1,332,465 |
| SkyWest, Inc. | | 193,500 | 10,603,800 |
| Southwest Airlines Co. | | 446,300 | 25,813,992 |
| United Continental Holdings, Inc. (a) | | 67,600 | 4,582,604 |
| | | | 91,277,214 |
| Auto Components - 0.7% | | | |
| Auto Parts & Equipment - 0.7% | | | |
| Hertz Global Holdings, Inc. (a)(b) | | 178,800 | 3,252,372 |
| Machinery - 1.2% | | | |
| Construction Machinery & Heavy Trucks - 0.8% | | | |
| Allison Transmission Holdings, Inc. | | 107,300 | 4,252,299 |
| Industrial Machinery - 0.4% | | | |
| Park-Ohio Holdings Corp. | | 51,470 | 2,051,080 |
|
| TOTAL MACHINERY | | | 6,303,379 |
|
| Marine - 0.7% | | | |
| Marine - 0.7% | | | |
| Matson, Inc. | | 123,700 | 3,525,450 |
| Road & Rail - 45.4% | | | |
| Railroads - 37.7% | | | |
| CSX Corp. | | 872,219 | 46,855,605 |
| Genesee & Wyoming, Inc. Class A (a) | | 248,700 | 17,292,111 |
| Kansas City Southern | | 88,200 | 9,088,128 |
| Norfolk Southern Corp. | | 180,000 | 25,034,400 |
| Union Pacific Corp. | | 727,295 | 94,730,172 |
| | | | 193,000,416 |
| Trucking - 7.7% | | | |
| AMERCO | | 2,800 | 963,200 |
| Avis Budget Group, Inc. (a) | | 134,800 | 6,090,264 |
| J.B. Hunt Transport Services, Inc. | | 134,900 | 15,995,093 |
| Landstar System, Inc. | | 17,300 | 1,882,240 |
| Marten Transport Ltd. | | 217,200 | 4,702,380 |
| Roadrunner Transportation Systems, Inc. (a) | | 441,000 | 1,689,030 |
| Ryder System, Inc. | | 79,500 | 5,753,415 |
| Universal Logistics Holdings, Inc. | | 61,890 | 1,367,769 |
| YRC Worldwide, Inc. (a) | | 120,200 | 1,048,144 |
| | | | 39,491,535 |
|
| TOTAL ROAD & RAIL | | | 232,491,951 |
|
| Transportation Infrastructure - 1.1% | | | |
| Airport Services - 1.1% | | | |
| Macquarie Infrastructure Co. LLC | | 142,400 | 5,767,200 |
| TOTAL COMMON STOCKS | | | |
| (Cost $323,156,531) | | | 492,648,231 |
|
| Money Market Funds - 3.6% | | | |
| Fidelity Cash Central Fund, 1.41% (c) | | 16,021,208 | 16,024,412 |
| Fidelity Securities Lending Cash Central Fund 1.42% (c)(d) | | 2,384,094 | 2,384,332 |
| TOTAL MONEY MARKET FUNDS | | | |
| (Cost $18,408,744) | | | 18,408,744 |
| TOTAL INVESTMENT IN SECURITIES - 99.8% | | | |
| (Cost $341,565,275) | | | 511,056,975 |
| NET OTHER ASSETS (LIABILITIES) - 0.2% | | | 1,098,235 |
| NET ASSETS - 100% | | | $512,155,210 |
Legend
(a) Non-income producing
(b) Security or a portion of the security is on loan at period end.
(c) Affiliated fund that is generally available only to investment companies and other accounts managed by Fidelity Investments. The rate quoted is the annualized seven-day yield of the fund at period end. A complete unaudited listing of the fund's holdings as of its most recent quarter end is available upon request. In addition, each Fidelity Central Fund's financial statements, which are not covered by the Fund's Report of Independent Registered Public Accounting Firm, are available on the SEC's website or upon request.
(d) Investment made with cash collateral received from securities on loan.
Affiliated Central Funds
Information regarding fiscal year to date income earned by the Fund from investments in Fidelity Central Funds is as follows:
| Fund | Income earned |
| Fidelity Cash Central Fund | $162,524 |
| Fidelity Securities Lending Cash Central Fund | 77,318 |
| Total | $239,842 |
Amounts in the income column in the above table include any capital gain distributions from underlying funds, which are presented in the corresponding line-item in the Statement of Operations if applicable.
Investment Valuation
All investments are categorized as Level 1 under the Fair Value Hierarchy. The inputs or methodology used for valuing securities may not be an indication of the risk associated with investing in those securities. For more information on valuation inputs please refer to the Investment Valuation section in the accompanying Notes to Financial Statements.
See accompanying notes which are an integral part of the financial statements.
Transportation Portfolio
Financial Statements
Statement of Assets and Liabilities
| | | February 28, 2018 |
| Assets | | |
Investment in securities, at value (including securities loaned of $2,195,533) — See accompanying schedule:
Unaffiliated issuers (cost $323,156,531) | $492,648,231 | |
| Fidelity Central Funds (cost $18,408,744) | 18,408,744 | |
| Total Investment in Securities (cost $341,565,275) | | $511,056,975 |
| Receivable for investments sold | | 20,813,286 |
| Receivable for fund shares sold | | 261,225 |
| Dividends receivable | | 1,730,330 |
| Distributions receivable from Fidelity Central Funds | | 17,738 |
| Prepaid expenses | | 1,867 |
| Other receivables | | 7,192 |
| Total assets | | 533,888,613 |
| Liabilities | | |
| Payable for investments purchased | $17,292,133 | |
| Payable for fund shares redeemed | 1,667,173 | |
| Accrued management fee | 237,061 | |
| Other affiliated payables | 103,605 | |
| Other payables and accrued expenses | 49,606 | |
| Collateral on securities loaned | 2,383,825 | |
| Total liabilities | | 21,733,403 |
| Net Assets | | $512,155,210 |
| Net Assets consist of: | | |
| Paid in capital | | $320,095,626 |
| Undistributed net investment income | | 1,226,779 |
| Accumulated undistributed net realized gain (loss) on investments | | 21,341,105 |
| Net unrealized appreciation (depreciation) on investments | | 169,491,700 |
| Net Assets, for 5,169,462 shares outstanding | | $512,155,210 |
| Net Asset Value, offering price and redemption price per share ($512,155,210 ÷ 5,169,462 shares) | | $99.07 |
See accompanying notes which are an integral part of the financial statements.
Statement of Operations
| | | Year ended February 28, 2018 |
| Investment Income | | |
| Dividends | | $8,564,812 |
| Income from Fidelity Central Funds | | 239,842 |
| Total income | | 8,804,654 |
| Expenses | | |
| Management fee | $2,993,360 | |
| Transfer agent fees | 1,077,202 | |
| Accounting and security lending fees | 210,923 | |
| Custodian fees and expenses | 9,483 | |
| Independent trustees' fees and expenses | 12,184 | |
| Registration fees | 39,050 | |
| Audit | 47,571 | |
| Legal | 7,334 | |
| Miscellaneous | 24,747 | |
| Total expenses before reductions | 4,421,854 | |
| Expense reductions | (31,510) | 4,390,344 |
| Net investment income (loss) | | 4,414,310 |
| Realized and Unrealized Gain (Loss) | | |
| Net realized gain (loss) on: | | |
| Investment securities: | | |
| Unaffiliated issuers | 54,398,032 | |
| Fidelity Central Funds | 1,964 | |
| Total net realized gain (loss) | | 54,399,996 |
| Change in net unrealized appreciation (depreciation) on: | | |
| Investment securities: | | |
| Unaffiliated issuers | (489,689) | |
| Fidelity Central Funds | (1,456) | |
| Total change in net unrealized appreciation (depreciation) | | (491,145) |
| Net gain (loss) | | 53,908,851 |
| Net increase (decrease) in net assets resulting from operations | | $58,323,161 |
See accompanying notes which are an integral part of the financial statements.
Statement of Changes in Net Assets
| | Year ended February 28, 2018 | Year ended February 28, 2017 |
| Increase (Decrease) in Net Assets | | |
| Operations | | |
| Net investment income (loss) | $4,414,310 | $3,560,984 |
| Net realized gain (loss) | 54,399,996 | 25,777,009 |
| Change in net unrealized appreciation (depreciation) | (491,145) | 86,525,869 |
| Net increase (decrease) in net assets resulting from operations | 58,323,161 | 115,863,862 |
| Distributions to shareholders from net investment income | (3,594,752) | (2,471,329) |
| Distributions to shareholders from net realized gain | (25,696,815) | (9,022,622) |
| Total distributions | (29,291,567) | (11,493,951) |
| Share transactions | | |
| Proceeds from sales of shares | 129,618,153 | 345,780,616 |
| Reinvestment of distributions | 27,926,461 | 11,028,020 |
| Cost of shares redeemed | (317,501,802) | (226,311,294) |
| Net increase (decrease) in net assets resulting from share transactions | (159,957,188) | 130,497,342 |
| Redemption fees | 13,501 | 29,312 |
| Total increase (decrease) in net assets | (130,912,093) | 234,896,565 |
| Net Assets | | |
| Beginning of period | 643,067,303 | 408,170,738 |
| End of period | $512,155,210 | $643,067,303 |
| Other Information | | |
| Undistributed net investment income end of period | $1,226,779 | $885,200 |
| Shares | | |
| Sold | 1,302,357 | 3,926,788 |
| Issued in reinvestment of distributions | 280,882 | 120,921 |
| Redeemed | (3,330,145) | (2,703,847) |
| Net increase (decrease) | (1,746,906) | 1,343,862 |
See accompanying notes which are an integral part of the financial statements.
Financial Highlights
Transportation Portfolio
| | | | | | |
| Years ended February 28, | 2018 | 2017 | 2016 A | 2015 | 2014 |
| Selected Per–Share Data | | | | | |
| Net asset value, beginning of period | $92.98 | $73.25 | $94.04 | $76.28 | $57.75 |
| Income from Investment Operations | | | | | |
| Net investment income (loss)B | .78 | .63 | .50 | .46 | .45 |
| Net realized and unrealized gain (loss) | 10.83 | 20.86 | (15.81) | 19.67 | 20.44 |
| Total from investment operations | 11.61 | 21.49 | (15.31) | 20.13 | 20.89 |
| Distributions from net investment income | (.67) | (.38) | (.52) | (.34) | (.27) |
| Distributions from net realized gain | (4.85) | (1.39) | (4.95) | (2.04) | (2.09) |
| Total distributions | (5.52) | (1.77) | (5.48)C | (2.38) | (2.36) |
| Redemption fees added to paid in capitalB | –D | .01 | –D | .01 | –D |
| Net asset value, end of period | $99.07 | $92.98 | $73.25 | $94.04 | $76.28 |
| Total ReturnE | 12.48% | 29.40% | (16.28)% | 26.80% | 36.60% |
| Ratios to Average Net AssetsF,G | | | | | |
| Expenses before reductions | .80% | .83% | .81% | .81% | .85% |
| Expenses net of fee waivers, if any | .80% | .83% | .81% | .81% | .85% |
| Expenses net of all reductions | .80% | .82% | .80% | .81% | .84% |
| Net investment income (loss) | .80% | .76% | .60% | .53% | .68% |
| Supplemental Data | | | | | |
| Net assets, end of period (000 omitted) | $512,155 | $643,067 | $408,171 | $1,146,633 | $450,237 |
| Portfolio turnover rateH | 47% | 104% | 80% | 72%I | 78% |
A For the year ended February 29.
B Calculated based on average shares outstanding during the period.
C Total distributions of $5.48 per share is comprised of distributions from net investment income of $.521 and distributions from net realized gain of $4.954 per share.
D Amount represents less than $.005 per share.
E Total returns would have been lower if certain expenses had not been reduced during the applicable periods shown.
F Fees and expenses of any underlying Fidelity Central Funds are not included in the Fund's expense ratio. The Fund indirectly bears its proportionate share of the expenses of any underlying Fidelity Central Funds.
G Expense ratios reflect operating expenses of the Fund. Expenses before reductions do not reflect amounts reimbursed by the investment adviser or reductions from brokerage service arrangements or reductions from other expense offset arrangements and do not represent the amount paid by the Fund during periods when reimbursements or reductions occur. Expenses net of fee waivers reflect expenses after reimbursement by the investment adviser but prior to reductions from brokerage service arrangements or other expense offset arrangements. Expenses net of all reductions represent the net expenses paid by the Fund.
H Amount does not include the portfolio activity of any underlying Fidelity Central Funds.
I Portfolio turnover rate excludes securities received or delivered in-kind.
See accompanying notes which are an integral part of the financial statements.
Notes to Financial Statements
For the period ended February 28, 2018
1. Organization.
Air Transportation Portfolio, Defense and Aerospace Portfolio, Environment and Alternative Energy Portfolio, Industrials Portfolio, and Transportation Portfolio (the Funds) are non-diversified funds of Fidelity Select Portfolios (the Trust). The Trust is registered under the Investment Company Act of 1940, as amended (the 1940 Act), as an open-end management investment company organized as a Massachusetts business trust. The Funds invest primarily in securities of companies whose principal business activities fall within specific industries. Each Fund is authorized to issue an unlimited number of shares. Share transactions on the Statement of Changes in Net Assets may contain exchanges between affiliated funds.
2. Investments in Fidelity Central Funds.
The Funds invest in Fidelity Central Funds, which are open-end investment companies generally available only to other investment companies and accounts managed by the investment adviser and its affiliates. The Funds' Schedules of Investments list each of the Fidelity Central Funds held as of period end, if any, as an investment of each Fund, but do not include the underlying holdings of each Fidelity Central Fund. As an Investing Fund, each Fund indirectly bears its proportionate share of the expenses of the underlying Fidelity Central Funds.
The Money Market Central Funds seek preservation of capital and current income and are managed by Fidelity Investments Money Management, Inc. (FIMM), an affiliate of the investment adviser. Annualized expenses of the Money Market Central Funds as of their most recent shareholder report date are less than .005%.
A complete unaudited list of holdings for each Fidelity Central Fund is available upon request or at the Securities and Exchange Commission (the SEC) website at www.sec.gov. In addition, the financial statements of the Fidelity Central Funds, which are not covered by the Funds' Report of Independent Registered Public Accounting Firm, are available on the SEC website or upon request.
3. Significant Accounting Policies.
Each Fund is an investment company and applies the accounting and reporting guidance of the Financial Accounting Standards Board (FASB) Accounting Standards Codification Topic 946 Financial Services – Investments Companies. The financial statements have been prepared in conformity with accounting principles generally accepted in the United States of America (GAAP), which require management to make certain estimates and assumptions at the date of the financial statements. Actual results could differ from those estimates. Subsequent events, if any, through the date that the financial statements were issued have been evaluated in the preparation of the financial statements. The following summarizes the significant accounting policies of the Funds:
Investment Valuation. Investments are valued as of 4:00 p.m. Eastern time on the last calendar day of the period. The Board of Trustees (the Board) has delegated the day to day responsibility for the valuation of each Fund's investments to the Fair Value Committee (the Committee) established by each Fund's investment adviser. In accordance with valuation policies and procedures approved by the Board, each Fund attempts to obtain prices from one or more third party pricing vendors or brokers to value its investments. When current market prices, quotations or currency exchange rates are not readily available or reliable, investments will be fair valued in good faith by the Committee, in accordance with procedures adopted by the Board. Factors used in determining fair value vary by investment type and may include market or investment specific events. The frequency with which these procedures are used cannot be predicted and they may be utilized to a significant extent. The Committee oversees each Fund's valuation policies and procedures and reports to the Board on the Committee's activities and fair value determinations. The Board monitors the appropriateness of the procedures used in valuing each Fund's investments and ratifies the fair value determinations of the Committee.
Each Fund categorizes the inputs to valuation techniques used to value its investments into a disclosure hierarchy consisting of three levels as shown below:
- Level 1 – quoted prices in active markets for identical investments
- Level 2 – other significant observable inputs (including quoted prices for similar investments, interest rates, prepayment speeds, etc.)
- Level 3 – unobservable inputs (including the Fund's own assumptions based on the best information available)
Valuation techniques used to value each Fund's investments by major category are as follows:
Equity securities, including restricted securities, for which market quotations are readily available, are valued at the last reported sale price or official closing price as reported by a third party pricing vendor on the primary market or exchange on which they are traded and are categorized as Level 1 in the hierarchy. In the event there were no sales during the day or closing prices are not available, securities are valued at the last quoted bid price or may be valued using the last available price and are generally categorized as Level 2 in the hierarchy. For foreign equity securities, when market or security specific events arise, comparisons to the valuation of American Depositary Receipts (ADRs), futures contracts, Exchange-Traded Funds (ETFs) and certain indexes as well as quoted prices for similar securities may be used and would be categorized as Level 2 in the hierarchy. Utilizing these techniques may result in transfers between Level 1 and Level 2. For equity securities, including restricted securities, where observable inputs are limited, assumptions about market activity and risk are used and these securities may be categorized as Level 3 in the hierarchy.
Investments in open-end mutual funds ,including the Fidelity Central Funds, are valued at their closing net asset value (NAV) each business day and are categorized as Level 1 in the hierarchy.
Changes in valuation techniques may result in transfers in or out of an assigned level within the disclosure hierarchy. The aggregate value of investments by input level as of February 28, 2018, including information on transfers between Levels 1 and 2 is included at the end of each applicable Fund's Schedule of Investments.
Foreign Currency. The Funds may use foreign currency contracts to facilitate transactions in foreign-denominated securities. Gains and losses from these transactions may arise from changes in the value of the foreign currency or if the counterparties do not perform under the contracts' terms.
Foreign-denominated assets, including investment securities, and liabilities are translated into U.S. dollars at the exchange rates at period end. Purchases and sales of investment securities, income and dividends received and expenses denominated in foreign currencies are translated into U.S. dollars at the exchange rate in effect on the transaction date.
The effects of exchange rate fluctuations on investments are included with the net realized and unrealized gain (loss) on investment securities. Other foreign currency transactions resulting in realized and unrealized gain (loss) are disclosed separately.
Investment Transactions and Income. For financial reporting purposes, the Funds' investment holdings and NAV include trades executed through the end of the last business day of the period. The NAV per share for processing shareholder transactions is calculated as of the close of business of the New York Stock Exchange (NYSE), normally 4:00 p.m. Eastern time and includes trades executed through the end of the prior business day. Gains and losses on securities sold are determined on the basis of identified cost and includes proceeds received from litigation. Dividend income is recorded on the ex-dividend date, except for certain dividends from foreign securities where the ex-dividend date may have passed, which are recorded as soon as the Funds are informed of the ex-dividend date. Non-cash dividends included in dividend income, if any, are recorded at the fair market value of the securities received. Income and capital gain distributions from Fidelity Central Funds, if any, are recorded on the ex-dividend date. Certain distributions received by the Funds represent a return of capital or capital gain. The Funds determine the components of these distributions subsequent to the ex-dividend date, based upon receipt of tax filings or other correspondence relating to the underlying investment. These distributions are recorded as a reduction of cost of investments and/or as a realized gain. Large, non-recurring dividends recognized by the Funds are presented separately on the Statement of Operations as "Special Dividends" and the impact of these dividends is presented in the Financial Highlights. Investment income is recorded net of foreign taxes withheld where recovery of such taxes is uncertain.
Expenses. Expenses directly attributable to a fund are charged to that fund. Expenses attributable to more than one fund are allocated among the respective funds on the basis of relative net assets or other appropriate methods. Expense estimates are accrued in the period to which they relate and adjustments are made when actual amounts are known.
Deferred Trustee Compensation. Under a Deferred Compensation Plan (the Plan) for Defense and Aerospace Portfolio and Industrials Portfolio, independent Trustees may elect to defer receipt of a portion of their annual compensation. Deferred amounts are invested in a cross-section of Fidelity funds, are marked-to-market and remain in the Fund until distributed in accordance with the Plan. The investment of deferred amounts and the offsetting payable to the Trustees are included in the accompanying Statement of Assets and Liabilities.
Income Tax Information and Distributions to Shareholders. Each year, each Fund intends to qualify as a regulated investment company under Subchapter M of the Internal Revenue Code, including distributing substantially all of its taxable income and realized gains. As a result, no provision for U.S. Federal income taxes is required. As of February 28, 2018, each Fund did not have any unrecognized tax benefits in the financial statements; nor is each Fund aware of any tax positions for which it is reasonably possible that the total amounts of unrecognized tax benefits will significantly change in the next twelve months. Each Fund files a U.S. federal tax return, in addition to state and local tax returns as required. Each Fund's federal income tax returns are subject to examination by the Internal Revenue Service (IRS) for a period of three fiscal years after they are filed. State and local tax returns may be subject to examination for an additional fiscal year depending on the jurisdiction. Foreign taxes are provided for based on each Fund's understanding of the tax rules and rates that exist in the foreign markets in which it invests.
Distributions are declared and recorded on the ex-dividend date. Income and capital gain distributions are determined in accordance with income tax regulations, which may differ from GAAP. In addition, the Funds claimed a portion of the payment made to redeeming shareholders as a distribution for income tax purposes.
Capital accounts within the financial statements are adjusted for permanent book-tax differences. These adjustments have no impact on net assets or the results of operations. Capital accounts are not adjusted for temporary book-tax differences which will reverse in a subsequent period.
Book-tax differences are primarily due to foreign currency transactions, passive foreign investment companies (PFIC), deferred trustees compensation and losses deferred due to wash sales.
As of period end, the cost and unrealized appreciation (depreciation) in securities, and derivatives if applicable, for federal income tax purposes were as follows for each Fund:
| | Tax cost | Gross unrealized appreciation | Gross unrealized depreciation | Net unrealized appreciation (depreciation) |
| Air Transportation Portfolio | $279,991,890 | $107,084,773 | $(5,048,224) | $102,036,549 |
| Defense and Aerospace Portfolio | 2,113,544,605 | 1,021,194,268 | (14,905,564) | 1,006,288,704 |
| Environment and Alternative Energy Portfolio | 155,456,101 | 35,843,243 | (3,394,323) | 32,448,920 |
| Industrials Portfolio | 846,605,271 | 270,442,368 | (30,898,049) | 239,544,319 |
| Transportation Portfolio | 343,000,517 | 179,661,025 | (11,604,567) | 168,056,458 |
The tax-based components of distributable earnings as of period end were as follows for each Fund:
| | Undistributed ordinary income | Undistributed long-term capital gain | Net unrealized appreciation (depreciation) on securities and other investments |
| Air Transportation Portfolio | $8,117,418 | $11,793,245 | $102,036,549 |
| Defense and Aerospace Portfolio | 34,936,984 | 53,312,570 | 1,006,289,119 |
| Environment and Alternative Energy Portfolio | 1,373,397 | 2,722,093 | 32,451,577 |
| Industrials Portfolio | 7,718,674 | 34,883,481 | 239,544,313 |
| Transportation Portfolio | 2,849,789 | 21,153,336 | 168,056,458 |
The tax character of distributions paid was as follows:
| February 28, 2018 | | | | | |
| | Ordinary Income | Long-term Capital Gains | Total |
| Air Transportation Portfolio | $5,548,777 | $29,647,019 | $35,195,796 |
| Defense and Aerospace Portfolio | 19,819,026 | 65,447,045 | 85,266,071 |
| Environment and Alternative Energy Portfolio | 4,709,514 | 6,190,274 | 10,899,788 |
| Industrials Portfolio | 6,232,259 | 42,268,704 | 48,500,963 |
| Transportation Portfolio | 3,759,198 | 25,532,369 | 29,291,567 |
| February 28, 2017 | | | | | |
| | Ordinary Income | Long-term Capital Gains | Total |
| Air Transportation Portfolio | $1,185,421 | $1,110,453 | $2,295,874 |
| Defense and Aerospace Portfolio | 15,056,809 | 50,623,462 | 65,680,271 |
| Environment and Alternative Energy Portfolio | 790,016 | 676,548 | 1,466,564 |
| Industrials Portfolio | 5,098,193 | 33,247,891 | 38,346,084 |
| Transportation Portfolio | 2,471,329 | 9,022,622 | 11,493,951 |
Trading (Redemption) Fees. Shares held by investors in Air Transportation Portfolio, Environment and Alternative Energy Portfolio and Transportation Portfolio less than 30 days may be subject to a redemption fee equal to .75% of the NAV of shares redeemed. All redemption fees, which reduce the proceeds of the shareholder redemption, are retained by the Funds and accounted for as an addition to paid in capital. In November 2017, the Board of Trustees approved the elimination of these redemption fees effective December 18, 2017.
Restricted Securities. The Funds may invest in securities that are subject to legal or contractual restrictions on resale. These securities generally may be resold in transactions exempt from registration or to the public if the securities are registered. Disposal of these securities may involve time-consuming negotiations and expense, and prompt sale at an acceptable price may be difficult. Information regarding restricted securities is included at the end of each applicable Fund's Schedule of Investments.
4. Purchases and Sales of Investments.
Purchases and sales of securities, other than short-term securities and securities acquired in the merger, are noted in the table below.
| | Purchases ($) | Sales ($) |
| Air Transportation Portfolio | 332,582,976 | 407,475,204 |
| Defense and Aerospace Portfolio | 1,459,980,070 | 671,803,851 |
| Environment and Alternative Energy Portfolio | 107,768,118 | 80,213,213 |
| Industrials Portfolio | 586,523,918 | 790,168,048 |
| Transportation Portfolio | 253,920,852 | 442,954,799 |
5. Fees and Other Transactions with Affiliates.
Management Fee. Fidelity SelectCo, LLC (the investment adviser) and its affiliates provide the Funds with investment management related services for which the Funds pay a monthly management fee. The management fee is the sum of an individual fund fee rate and an annualized group fee rate. The individual fund fee rate is applied to each Fund's average net assets. The group fee rate is based upon the average net assets of all the mutual funds advised by Fidelity Management & Research Company (FMR) and the investment adviser. The group fee rate decreases as assets under management increase and increases as assets under management decrease. For the reporting period, each Fund's annual management fee rate expressed as a percentage of each Fund's average net assets was as follows:
| | Individual Rate | Group Rate | Total |
| Air Transportation Portfolio | .30% | .24% | .54% |
| Defense and Aerospace Portfolio | .30% | .24% | .54% |
| Environment and Alternative Energy Portfolio | .30% | .24% | .54% |
| Industrials Portfolio | .30% | .24% | .54% |
| Transportation Portfolio | .30% | .24% | .54% |
Transfer Agent Fees. Fidelity Investments Institutional Operations Company, Inc. (FIIOC), an affiliate of the investment adviser, is the Funds' transfer, dividend disbursing and shareholder servicing agent. FIIOC receives account fees and asset-based fees that vary according to account size and type of account. FIIOC pays for typesetting, printing and mailing of shareholder reports, except proxy statements. For the period, transfer agent fees were equivalent to the following annual rates expressed as a percentage of average net assets:
| Air Transportation Portfolio | .21% |
| Defense and Aerospace Portfolio | .17% |
| Environment and Alternative Energy Portfolio | .21% |
| Industrials Portfolio | .17% |
| Transportation Portfolio | .20% |
Accounting and Security Lending Fees. Fidelity Service Company, Inc. (FSC), an affiliate of the investment adviser, maintains each Fund's accounting records. The accounting fee is based on the level of average net assets for each month. Under a separate contract, FSC administers the security lending program. The security lending fee is based on the number and duration of lending transactions.
Brokerage Commissions. Certain Funds placed a portion of their portfolio transactions with brokerage firms which are affiliates of the investment adviser. Brokerage commissions are included in net realized gain (loss) and change in net unrealized appreciation (depreciation) in the Statement of Operations. The commissions paid to these affiliated firms were as follows:
| | Amount |
| Air Transportation Portfolio | $6,981 |
| Defense and Aerospace Portfolio | 17,977 |
| Environment and Alternative Energy Portfolio | 975 |
| Industrials Portfolio | 20,139 |
| Transportation Portfolio | 9,965 |
Interfund Lending Program. Pursuant to an Exemptive Order issued by the SEC, the Funds, along with other registered investment companies having management contracts with Fidelity Management & Research Company (FMR) or other affiliated entities of FMR, may participate in an interfund lending program. This program provides an alternative credit facility allowing the funds to borrow from, or lend money to, other participating affiliated funds. At period end, there were no interfund loans outstanding. Each applicable fund's activity in this program during the period for which loans were outstanding was as follows:
| | Borrower or Lender | Average Loan Balance | Weighted Average Interest Rate | Interest Expense |
| Industrials Portfolio | Borrower | $6,988,750 | 1.09% | $1,691 |
Interfund Trades. The Funds may purchase from or sell securities to other Fidelity Funds under procedures adopted by the Board. The procedures have been designed to ensure these interfund trades are executed in accordance with Rule 17a-7 of the 1940 Act. Interfund trades are included within the respective purchases and sales amounts shown in the Purchases and Sales of Investments note.
Prior Fiscal Year Redemptions In-Kind. During the prior period, 6,790,326 shares of Industrials Portfolio held by an affiliated entity were redeemed in-kind for investments and cash with a value of $203,573,978. The Fund had a net realized gain of $45,579,937 on investments delivered through in-kind redemptions. The amount of in-kind redemptions is included in share transactions in the accompanying Statement of Changes in Net Assets. Industrials Portfolio recognized no gain or loss for federal income tax purposes.
6. Committed Line of Credit.
Certain Funds participate with other funds managed by the investment adviser or an affiliate in a $4.25 billion credit facility (the "line of credit") to be utilized for temporary or emergency purposes to fund shareholder redemptions or for other short-term liquidity purposes. The participating funds have agreed to pay commitment fees on their pro-rata portion of the line of credit, which are reflected in Miscellaneous expenses on the Statement of Operations, and are as follows:
| Air Transportation Portfolio | $1,223 |
| Defense and Aerospace Portfolio | 5,788 |
| Environment and Alternative Energy Portfolio | 494 |
| Industrials Portfolio | 2,797 |
| Transportation Portfolio | 1,770 |
During the period, the Funds did not borrow on this line of credit.
7. Security Lending.
Certain Funds lend portfolio securities through a lending agent from time to time in order to earn additional income. On the settlement date of the loan, each applicable Fund receives collateral (in the form of U.S. Treasury obligations, letters of credit and/or cash) against the loaned securities and maintains collateral in an amount not less than 100% of the market value of the loaned securities during the period of the loan. The market value of the loaned securities is determined at the close of business of the Funds and any additional required collateral is delivered to the Funds on the next business day. The Funds or borrower may terminate the loan at any time, and if the borrower defaults on its obligation to return the securities loaned because of insolvency or other reasons, the Funds may apply collateral received from the borrower against the obligation. The Funds may experience delays and costs in recovering the securities loaned. Any cash collateral received is invested in the Fidelity Securities Lending Cash Central Fund. The value of loaned securities and cash collateral at period end are disclosed on each applicable Fund's Statement of Assets and Liabilities. Security lending income represents the income earned on investing cash collateral, less rebates paid to borrowers and any lending agent fees associated with the loan, plus any premium payments received for lending certain types of securities. Security lending income is presented on each applicable Fund's Statement of Operations as a component of income from Fidelity Central Funds. Security lending activity was as follows:
| | Total Security Lending Income |
| Air Transportation Portfolio | $16,539 |
| Defense and Aerospace Portfolio | 197,758 |
| Environment and Alternative Energy Portfolio | 28,222 |
| Industrials Portfolio | 37,499 |
| Transportation Portfolio | 77,318 |
8. Bank Borrowings.
Each Fund is permitted to have bank borrowings for temporary or emergency purposes to fund shareholder redemptions or for other short-term liquidity requirements. Each Fund has established borrowing arrangements with certain banks. The interest rate on the borrowings is the bank's base rate, as revised from time to time. At period end, there were no bank borrowings outstanding. Each applicable Fund's activity in this program during the period for which loans were outstanding was as follows:
| | Average Loan Balance | Weighted Average Interest Rate | Interest Expense |
| Industrials Portfolio | $7,324,000 | 1.41% | $287 |
9. Expense Reductions.
Commissions paid to certain brokers with whom the investment adviser, or its affiliates, places trades on behalf of Certain Funds include an amount in addition to trade execution, which may be rebated back to the Funds to offset certain expenses. In addition, through arrangements with each applicable Fund's custodian, credits realized as a result of certain uninvested cash balances were used to reduce each applicable Fund's expenses. All of the applicable expense reductions are noted in the table below.
| | Brokerage Service reduction | Custody expense reduction |
| Air Transportation Portfolio | $14,835 | $148 |
| Defense and Aerospace Portfolio | 44,617 | 1,761 |
| Environment and Alternative Energy Portfolio | 4,765 | – |
| Industrials Portfolio | 45,251 | – |
| Transportation Portfolio | 26,062 | 2 |
In addition, during the period the investment adviser reimbursed and/or waived a portion of operating expenses as follows:
| | Amount |
| Air Transportation Portfolio | $3,560 |
| Defense and Aerospace Portfolio | 18,264 |
| Environment and Alternative Energy Portfolio | 1,419 |
| Industrials Portfolio | 8,613 |
| Transportation Portfolio | 5,446 |
10. Other.
The Funds' organizational documents provide former and current trustees and officers with a limited indemnification against liabilities arising in connection with the performance of their duties to the Funds. In the normal course of business, the Funds may also enter into contracts that provide general indemnifications. The Funds' maximum exposure under these arrangements is unknown as this would be dependent on future claims that may be made against the Funds. The risk of material loss from such claims is considered remote.
At the end of the period, the following mutual funds managed by the investment adviser or its affiliates were the owners of record of 10% or more of the total outstanding shares of the following Funds.
| | VIP FundsManager 50% Portfolio | VIP FundsManager 60% Portfolio |
| Industrials Portfolio | 10% | 12% |
Mutual funds managed by the investment adviser or its affiliates, in aggregate, were the owners of record of more than 20% of the total outstanding shares of the following Funds.
| | % of shares held |
| Industrials Portfolio | 27% |
Effective after the close of business on April 13, 2018, shares of Industrials Portfolio held by the VIP FundsManager Portfolios were redeemed in-kind for investments. Industrials Portfolio realized gain (loss) for book purposes, but did not recognize any gain or loss for federal income tax purposes. The VIP FundsManager Portfolios’ ownership in Industrials Portfolio was reduced to 0%.
11. Merger Information.
On January 26, 2018, Industrials Portfolio acquired all of the assets and assumed all of the liabilities of Industrial Equipment Portfolio ("Target Fund") pursuant to an Agreement and Plan of Reorganization approved by the Board of Trustees ("The Board"). The acquisition was accomplished by an exchange of shares then outstanding of the Target Fund at its respective net asset value on the acquisition date. The reorganization provides shareholders of the Target Fund access to a larger portfolio with a similar investment objective. The reorganization qualified as a tax-free reorganization for federal income tax purposes with no gain or loss recognized to the funds or their shareholders. The Target Fund's net assets of $186,045,666, including securities of $186,126,516 and unrealized appreciation of $32,401,431 was combined with the Fund's net assets of $965,428,804 for total net assets after the acquisition of $1,151,474,470.
Pro forma results of operations of the combined entity for the entire period ended February 28, 2018, as though the acquisition had occurred as of the beginning of the year (rather than on the actual acquisition date), are as follows:
Net investment income (loss) .......................................................... $6,705,094
Total net realized gain (loss) ......................................................... 101,913,604
Total change in net unrealized appreciation (depreciation) ................... 40,445,283
Net increase (decrease) in net assets resulting from operations ......... $149,063,981
Because the combined investment portfolios have been managed as a single portfolio since the acquisition was completed, it is not practicable to separate the amounts of revenue and earnings of the acquired fund that have been included in the Industrial Portfolio's accompanying Statement of Operations since January 26, 2018.
Report of Independent Registered Public Accounting Firm
To the Trustees of Fidelity Select Portfolio and the Shareholders of Air Transportation Portfolio, Defense and Aerospace Portfolio, Environment and Alternative Energy Portfolio, Industrials Portfolio and Transportation Portfolio:
Opinions on the Financial Statements
We have audited the accompanying statements of assets and liabilities, including the schedules of investments, of Air Transportation Portfolio, Defense and Aerospace Portfolio, Environment and Alternative Energy Portfolio, Industrials Portfolio and Transportation Portfolio (five of the funds constituting Fidelity Select Portfolios, hereafter collectively referred to as the "Funds") as of February 28, 2018, the related statements of operations for the year ended February 28, 2018, the statements of changes in net assets for each of the two years in the period ended February 28, 2018, including the related notes, and the financial highlights for each of the five years in the period ended February 28, 2018 (collectively referred to as the “financial statements”). In our opinion, the financial statements present fairly, in all material respects, the financial position of each of the Funds as of February 28, 2018, the results of each of their operations for the year then ended, the changes in each of their net assets for each of the two years in the period ended February 28, 2018 and each of the financial highlights for each of the five years in the period ended February 28, 2018 in conformity with accounting principles generally accepted in the United States of America.
Basis for Opinions
These financial statements are the responsibility of the Funds' management. Our responsibility is to express an opinion on the Funds' financial statements based on our audits. We are a public accounting firm registered with the Public Company Accounting Oversight Board (United States) (“PCAOB”) and are required to be independent with respect to the Funds in accordance with the U.S. federal securities laws and the applicable rules and regulations of the Securities and Exchange Commission and the PCAOB.
We conducted our audits of these financial statements in accordance with the standards of the PCAOB. Those standards require that we plan and perform the audit to obtain reasonable assurance about whether the financial statements are free of material misstatement, whether due to error or fraud.
Our audits included performing procedures to assess the risks of material misstatement of the financial statements, whether due to error or fraud, and performing procedures that respond to those risks. Such procedures included examining, on a test basis, evidence regarding the amounts and disclosures in the financial statements. Our audits also included evaluating the accounting principles used and significant estimates made by management, as well as evaluating the overall presentation of the financial statements. Our procedures included confirmation of securities owned as of February 28, 2018 by correspondence with the custodian and brokers; when replies were not received from brokers, we performed other auditing procedures. We believe that our audits provide a reasonable basis for our Opinions.
PricewaterhouseCoopers LLP
Boston, Massachusetts
April 18, 2018
We have served as the auditor of one or more investment companies in the Fidelity group of funds since 1932.
Trustees and Officers
The Trustees, Members of the Advisory Board (if any), and officers of the trust and funds, as applicable, are listed below. The Board of Trustees governs each fund and is responsible for protecting the interests of shareholders. The Trustees are experienced executives who meet periodically throughout the year to oversee each fund's activities, review contractual arrangements with companies that provide services to each fund, oversee management of the risks associated with such activities and contractual arrangements, and review each fund's performance. Except for Michael. E. Wiley, each of the Trustees oversees 281 funds. Mr Wiley oversees 193 funds.
The Trustees hold office without limit in time except that (a) any Trustee may resign; (b) any Trustee may be removed by written instrument, signed by at least two-thirds of the number of Trustees prior to such removal; (c) any Trustee who requests to be retired or who has become incapacitated by illness or injury may be retired by written instrument signed by a majority of the other Trustees; and (d) any Trustee may be removed at any special meeting of shareholders by a two-thirds vote of the outstanding voting securities of the trust. Each Trustee who is not an interested person (as defined in the 1940 Act) of the trust and the funds is referred to herein as an Independent Trustee. Each Independent Trustee shall retire not later than the last day of the calendar year in which his or her 75th birthday occurs. The Independent Trustees may waive this mandatory retirement age policy with respect to individual Trustees. Officers and Advisory Board Members hold office without limit in time, except that any officer or Advisory Board Member may resign or may be removed by a vote of a majority of the Trustees at any regular meeting or any special meeting of the Trustees. Except as indicated, each individual has held the office shown or other offices in the same company for the past five years.
Each fund’s Statement of Additional Information (SAI) includes more information about the Trustees. To request a free copy, call Fidelity at 1-800-544-8544.
Experience, Skills, Attributes, and Qualifications of the Trustees. The Governance and Nominating Committee has adopted a statement of policy that describes the experience, qualifications, attributes, and skills that are necessary and desirable for potential Independent Trustee candidates (Statement of Policy). The Board believes that each Trustee satisfied at the time he or she was initially elected or appointed a Trustee, and continues to satisfy, the standards contemplated by the Statement of Policy. The Governance and Nominating Committee also engages professional search firms to help identify potential Independent Trustee candidates who have the experience, qualifications, attributes, and skills consistent with the Statement of Policy. From time to time, additional criteria based on the composition and skills of the current Independent Trustees, as well as experience or skills that may be appropriate in light of future changes to board composition, business conditions, and regulatory or other developments, have also been considered by the professional search firms and the Governance and Nominating Committee. In addition, the Board takes into account the Trustees' commitment and participation in Board and committee meetings, as well as their leadership of standing and ad hoc committees throughout their tenure.
In determining that a particular Trustee was and continues to be qualified to serve as a Trustee, the Board has considered a variety of criteria, none of which, in isolation, was controlling. The Board believes that, collectively, the Trustees have balanced and diverse experience, qualifications, attributes, and skills, which allow the Board to operate effectively in governing each fund and protecting the interests of shareholders. Information about the specific experience, skills, attributes, and qualifications of each Trustee, which in each case led to the Board's conclusion that the Trustee should serve (or continue to serve) as a trustee of the funds, is provided below.
Board Structure and Oversight Function. James C. Curvey is an interested person and currently serves as Chairman. The Trustees have determined that an interested Chairman is appropriate and benefits shareholders because an interested Chairman has a personal and professional stake in the quality and continuity of services provided to the funds. Independent Trustees exercise their informed business judgment to appoint an individual of their choosing to serve as Chairman, regardless of whether the Trustee happens to be independent or a member of management. The Independent Trustees have determined that they can act independently and effectively without having an Independent Trustee serve as Chairman and that a key structural component for assuring that they are in a position to do so is for the Independent Trustees to constitute a substantial majority for the Board. The Independent Trustees also regularly meet in executive session. Ned C. Lautenbach serves as Chairman of the Independent Trustees and as such (i) acts as a liaison between the Independent Trustees and management with respect to matters important to the Independent Trustees and (ii) with management prepares agendas for Board meetings.
Fidelity® funds are overseen by different Boards of Trustees. The funds' Board oversees Fidelity's high income and certain equity funds, and other Boards oversee Fidelity's investment-grade bond, money market, asset allocation, and other equity funds. The asset allocation funds may invest in Fidelity® funds overseen by the funds' Board. The use of separate Boards, each with its own committee structure, allows the Trustees of each group of Fidelity® funds to focus on the unique issues of the funds they oversee, including common research, investment, and operational issues. On occasion, the separate Boards establish joint committees to address issues of overlapping consequences for the Fidelity® funds overseen by each Board.
The Trustees operate using a system of committees to facilitate the timely and efficient consideration of all matters of importance to the Trustees, each fund, and fund shareholders and to facilitate compliance with legal and regulatory requirements and oversight of the funds' activities and associated risks. The Board, acting through its committees, has charged SelectCo and its affiliates with (i) identifying events or circumstances the occurrence of which could have demonstrably adverse effects on the funds' business and/or reputation; (ii) implementing processes and controls to lessen the possibility that such events or circumstances occur or to mitigate the effects of such events or circumstances if they do occur; and (iii) creating and maintaining a system designed to evaluate continuously business and market conditions in order to facilitate the identification and implementation processes described in (i) and (ii) above. Because the day-to-day operations and activities of the funds are carried out by or through SelectCo, its affiliates, and other service providers, the funds' exposure to risks is mitigated but not eliminated by the processes overseen by the Trustees. While each of the Board's committees has responsibility for overseeing different aspects of the funds' activities, oversight is exercised primarily through the Operations, Audit, and Compliance Committees. In addition, the Independent Trustees have worked with Fidelity to enhance the Board's oversight of investment and financial risks, legal and regulatory risks, technology risks, and operational risks, including the development of additional risk reporting to the Board. Appropriate personnel, including but not limited to the funds' Chief Compliance Officer (CCO), SelectCo's internal auditor, the independent accountants, the funds' Treasurer and portfolio management personnel, make periodic reports to the Board's committees, as appropriate, including an annual review of Fidelity's risk management program for the Fidelity® funds. The responsibilities of each standing committee, including their oversight responsibilities, are described further under "Standing Committees of the Trustees."
Interested Trustees*:
Correspondence intended for a Trustee who is an interested person may be sent to Fidelity Investments, 245 Summer Street, Boston, Massachusetts 02210.
Name, Year of Birth; Principal Occupations and Other Relevant Experience+
James C. Curvey (1935)
Year of Election or Appointment: 2018
Trustee
Chairman of the Board of Trustees
Mr. Curvey also serves as Trustee of other Fidelity® funds. Mr. Curvey is a Director of Fidelity Research & Analysis Co. (investment adviser firm, 2009-present), and Vice Chairman (2007-present) and Director of FMR LLC (diversified financial services company). In addition, Mr. Curvey serves as an Overseer for the Boston Symphony Orchestra and a member of the board of Artis-Naples, Naples, Florida, and as a Trustee for Brewster Academy, Wolfeboro, New Hampshire. Previously, Mr. Curvey served as a Director of Fidelity Investments Money Management, Inc. (investment adviser firm, 2009-2014) and a Director of FMR and FMR Co., Inc. (investment adviser firms, 2007-2014).
Charles S. Morrison (1960)
Year of Election or Appointment: 2018
Trustee
Mr. Morrison also serves as Trustee of other funds. He serves as President of Fidelity SelectCo, LLC (investment adviser firm, 2017-present) and Fidelity Management & Research Company (FMR) (investment adviser firm, 2016-present), a Director of Fidelity Investments Money Management, Inc. (FIMM) (investment adviser firm, 2014-present), Director of Fidelity SelectCo, LLC (investment adviser firm, 2014-present), President, Asset Management (2014-present), and is an employee of Fidelity Investments. Previously, Mr. Morrison served as Vice President of Fidelity's Fixed Income and Asset Allocation Funds (2012-2014), President, Fixed Income (2011-2014), Vice President of Fidelity's Money Market Funds (2005-2009), President, Money Market Group Leader of FMR (investment adviser firm, 2009), and Senior Vice President, Money Market Group of FMR (2004-2009). Mr. Morrison also served as Vice President of Fidelity's Bond Funds (2002-2005), certain Balanced Funds (2002-2005), and certain Asset Allocation Funds (2002-2007), and as Senior Vice President (2002-2005) of Fidelity's Bond Division.
* Determined to be an "Interested Trustee" by virtue of, among other things, his or her affiliation with the trust or various entities under common control with SelectCo.
+ The information includes the Trustee's principal occupation during the last five years and other information relating to the experience, attributes, and skills relevant to the Trustee's qualifications to serve as a Trustee, which led to the conclusion that the Trustee should serve as a Trustee for each fund.
Independent Trustees:
Correspondence intended for an Independent Trustee may be sent to Fidelity Investments, P.O. Box 55235, Boston, Massachusetts 02205-5235.
Name, Year of Birth; Principal Occupations and Other Relevant Experience+
Dennis J. Dirks (1948)
Year of Election or Appointment: 2018
Trustee
Mr. Dirks also serves as Trustee of other Fidelity® funds. Prior to his retirement in May 2003, Mr. Dirks was Chief Operating Officer and a member of the Board of The Depository Trust & Clearing Corporation (DTCC). He also served as President, Chief Operating Officer, and Board member of The Depository Trust Company (DTC) and President and Board member of the National Securities Clearing Corporation (NSCC). In addition, Mr. Dirks served as Chief Executive Officer and Board member of the Government Securities Clearing Corporation, Chief Executive Officer and Board member of the Mortgage-Backed Securities Clearing Corporation, as a Trustee and a member of the Finance Committee of Manhattan College (2005-2008), as a Trustee and a member of the Finance Committee of AHRC of Nassau County (2006-2008), as a member of the Independent Directors Council (IDC) Governing Council (2010-2015), and as a member of the Board of Directors for The Brookville Center for Children’s Services, Inc. (2009-2017). Mr. Dirks is a member of the Finance Committee (2016-present) and Board of Directors (2017-present) of the Asolo Repertory Theatre.
Donald F. Donahue (1950)
Year of Election or Appointment: 2018
Trustee
Mr. Donahue also serves as a Trustee of other Fidelity® funds. Mr. Donahue is President and Chief Executive Officer of Miranda Partners, LLC (risk consulting for the financial services industry, 2012-present). Previously, Mr. Donahue served as a Member of the Advisory Board of certain Fidelity® funds (2015-2018) and Chief Executive Officer (2006-2012), Chief Operating Officer (2003-2006), and Managing Director, Customer Marketing and Development (1999-2003) of The Depository Trust & Clearing Corporation (financial markets infrastructure). Mr. Donahue serves as a Member (2007-present) and Co-Chairman (2016-present) of the Board of Directors of United Way of New York, Member of the Board of Directors of NYC Leadership Academy (2012-present) and Member of the Board of Advisors of Ripple Labs, Inc. (financial services, 2015-present). He also served as Chairman (2010-2012) and Member of the Board of Directors (2012-2013) of Omgeo, LLC (financial services), Treasurer of United Way of New York (2012-2016), and Member of the Board of Directors of XBRL US (financial services non-profit, 2009-2012) and the International Securities Services Association (2009-2012).
Alan J. Lacy (1953)
Year of Election or Appointment: 2018
Trustee
Mr. Lacy also serves as Trustee of other Fidelity® funds. Mr. Lacy serves as a Director of Bristol-Myers Squibb Company (global pharmaceuticals, 2008-present). He is a Trustee of the California Chapter of The Nature Conservancy (2015-present) and a Director of the Center for Advanced Study in the Behavioral Sciences at Stanford University (2015-present). In addition, Mr. Lacy served as Senior Adviser (2007-2014) of Oak Hill Capital Partners, L.P. (private equity) and also served as Chief Executive Officer (2005) and Vice Chairman (2005-2006) of Sears Holdings Corporation (retail) and Chief Executive Officer and Chairman of the Board of Sears, Roebuck and Co. (retail, 2000-2005). Previously, Mr. Lacy served as Chairman (2014-2017) and a member (2010-2017) of the Board of Directors of Dave & Buster’s Entertainment, Inc. (restaurant and entertainment complexes), as Chairman (2008-2011) and a member (2006-2015) of the Board of Trustees of the National Parks Conservation Association, and as a member of the Board of Directors for The Hillman Companies, Inc. (hardware wholesalers, 2010-2014), Earth Fare, Inc. (retail grocery, 2010-2014), and The Western Union Company (global money transfer, 2006-2011).
Ned C. Lautenbach (1944)
Year of Election or Appointment: 2018
Trustee
Chairman of the Independent Trustees
Mr. Lautenbach also serves as Trustee of other Fidelity® funds. Mr. Lautenbach currently serves as Vice Chair of the Board of Governors, State University System of Florida (2013-present) and is a member of the Council on Foreign Relations (1994-present). He is also a member and has most recently served as Chairman of the Board of Directors of Artis-Naples (2012-present). Previously, Mr. Lautenbach served as a member and then Lead Director of the Board of Directors of Eaton Corporation (diversified industrial, 1997-2016). He was also a Partner and Advisory Partner at Clayton, Dubilier & Rice, LLC (private equity investment, 1998-2010), as well as a Director of Sony Corporation (2006-2007). In addition, Mr. Lautenbach also had a 30-year career with IBM (technology company) during which time he served as Senior Vice President and a member of the Corporate Executive Committee (1968-1998).
Joseph Mauriello (1944)
Year of Election or Appointment: 2018
Trustee
Mr. Mauriello also serves as Trustee of other Fidelity® funds. Prior to his retirement in January 2006, Mr. Mauriello served in numerous senior management positions including Deputy Chairman and Chief Operating Officer (2004-2005), and Vice Chairman of Financial Services (2002-2004) of KPMG LLP US (professional services, 1965-2005). Mr. Mauriello currently serves as a member of the Board of Directors of XL Group plc. (global insurance and re-insurance, 2006-present) and the Independent Directors Council (IDC) Governing Council (2015-present). Previously, Mr. Mauriello served as a Director of the Hamilton Funds of the Bank of New York (2006-2007) and of Arcadia Resources Inc. (health care services and products, 2007-2012).
Cornelia M. Small (1944)
Year of Election or Appointment: 2018
Trustee
Ms. Small also serves as Trustee of other Fidelity® funds. Ms. Small is a member of the Board of Directors (2009-present) and Chair of the Investment Committee (2010-present) of the Teagle Foundation. Ms. Small also serves on the Investment Committee of the Berkshire Taconic Community Foundation (2008-present). Previously, Ms. Small served as Chairperson (2002-2008) and a member of the Investment Committee and Chairperson (2008-2012) and a member of the Board of Trustees of Smith College. In addition, Ms. Small served as Chief Investment Officer, Director of Global Equity Investments, and a member of the Board of Directors of Scudder, Stevens & Clark and Scudder Kemper Investments.
Garnett A. Smith (1947)
Year of Election or Appointment: 2013
Trustee
Mr. Smith also serves as Trustee of other Fidelity® funds. Prior to Mr. Smith's retirement, he served as Chairman and Chief Executive Officer of Inbrand Corp. (manufacturer of personal absorbent products, 1990-1997). He also served as President (1986-1990) of Inbrand Corp. Prior to his employment with Inbrand Corp., he was employed by a retail fabric chain and North Carolina National Bank. In addition, Mr. Smith served as a Member of the Advisory Board of certain Fidelity® funds (2012-2013) and as a board member of the Jackson Hole Land Trust (2009-2012).
David M. Thomas (1949)
Year of Election or Appointment: 2018
Trustee
Mr. Thomas also serves as Trustee of other Fidelity® funds. Mr. Thomas serves as Non-Executive Chairman of the Board of Directors of Fortune Brands Home and Security (home and security products, 2011-present), as a member of the Board of Directors (2004-present) and Presiding Director (2013-present) of Interpublic Group of Companies, Inc. (marketing communication), and as a member of the Board of Trustees of the University of Florida (2013-present). Previously, Mr. Thomas served as Executive Chairman (2005-2006) and Chairman and Chief Executive Officer (2000-2005) of IMS Health, Inc. (pharmaceutical and healthcare information solutions), and a Director of Fortune Brands, Inc. (consumer products, 2000-2011).
Michael E. Wiley (1950)
Year of Election or Appointment: 2008
Trustee
Mr. Wiley also serves as Trustee or Member of the Advisory Board of other Fidelity® funds. Mr. Wiley serves as a Director of Andeavor Corporation (independent oil refiner and marketer, 2005-present), a Director of Andeavor Logistics LP (natural resources logistics, 2015-present), and a Director of Bill Barrett Corporation (exploration and production, 2005-present). In addition, Mr. Wiley also serves as a Director of Post Oak Bank (privately-held bank, 2004-present). Previously, Mr. Wiley served as a Trustee of other Fidelity® funds (2008-2013), as a Director of Asia Pacific Exploration Consolidated (international oil and gas exploration and production, 2008-2013), as a member of the Board of Trustees of the University of Tulsa (2000-2006; 2007-2010), as a Senior Energy Advisor of Katzenbach Partners, LLC (consulting, 2006-2007), as an Advisory Director of Riverstone Holdings (private investment), Chairman, President, and CEO of Baker Hughes, Inc. (oilfield services, 2000-2004), and as Director of Spinnaker Exploration Company (exploration and production, 2001-2005).
+ The information includes the Trustee's principal occupation during the last five years and other information relating to the experience, attributes, and skills relevant to the Trustee's qualifications to serve as a Trustee, which led to the conclusion that the Trustee should serve as a Trustee for each fund.
Advisory Board Members and Officers:
Correspondence intended for a Member of the Advisory Board (if any) may be sent to Fidelity Investments, P.O. Box 55235, Boston, Massachusetts 02205-5235. Correspondence intended for an officer or Peter S. Lynch may be sent to Fidelity Investments, 245 Summer Street, Boston, Massachusetts 02210. Officers appear below in alphabetical order.
Name, Year of Birth; Principal Occupation
Peter S. Lynch (1944)
Year of Election or Appointment: 2018
Member of the Advisory Board
Mr. Lynch also serves as Member of the Advisory Board of other Fidelity® funds. Mr. Lynch is Vice Chairman and a Director of FMR (investment adviser firm) and FMR Co., Inc. (investment adviser firm). In addition, Mr. Lynch serves as a Trustee of Boston College and as the Chairman of the Inner-City Scholarship Fund. Previously, Mr. Lynch served on the Special Olympics International Board of Directors (1997-2006).
William S. Stavropoulos (1939)
Year of Election or Appointment: 2018
Member of the Advisory Board
Mr. Stavropoulos also serves as Member of the Advisory Board of other Fidelity® funds. Mr. Stavropoulos serves as President and Founder of the Michigan Baseball Foundation, the Great Lakes Loons (2007-present). Mr. Stavropoulos is Chairman Emeritus of the Board of Directors of The Dow Chemical Company, where he previously served in numerous senior management positions, including President, CEO (1995-2000; 2002-2004), Chairman of the Executive Committee (2000-2006), and as a member of the Board of Directors (1990-2006). Currently, Mr. Stavropoulos is Chairman of the Board of Directors of Univar Inc. (global distributor of commodity and specialty chemicals), a Director of Teradata Corporation (data warehousing and technology solutions), and a member of the Advisory Board for Metalmark Capital LLC (private equity investment, 2005-present). Mr. Stavropoulos is an operating advisor to Clayton, Dubilier & Rice, LLC (private equity investment). In addition, Mr. Stavropoulos is a member of the University of Notre Dame Advisory Council for the College of Science, a Trustee of the Rollin L. Gerstacker Foundation, and a Director of Artis-Naples in Naples, Florida. Previously, Mr. Stavropoulos served as Trustee of certain Fidelity® funds (2001-2018) and as a Director of Chemical Financial Corporation (bank holding company, 1993-2012) and Tyco International, Ltd. (multinational manufacturing and services, 2007-2012).
Carol B. Tomé (1957)
Year of Election or Appointment: 2017
Member of the Advisory Board
Ms. Tomé also serves as Member of the Advisory Board of other Fidelity® funds. Ms. Tomé is Chief Financial Officer (2001-present) and Executive Vice President of Corporate Services (2007-present) of The Home Depot, Inc. (home improvement retailer) and a Director (2003-present) and Chair of the Audit Committee (2004-present) of United Parcel Service, Inc. (package delivery and supply chain management). Previously, Ms. Tomé served as Trustee of certain Fidelity® funds (2017), Senior Vice President of Finance and Accounting/Treasurer (2000-2007) and Vice President and Treasurer (1995-2000) of The Home Depot, Inc. and Chair of the Board (2010-2012), Vice Chair of the Board (2009 and 2013), and a Director (2008-2013) of the Federal Reserve Bank of Atlanta. Ms. Tomé is also a director or trustee of many community and professional organizations.
Elizabeth Paige Baumann (1968)
Year of Election or Appointment: 2017
Anti-Money Laundering (AML) Officer
Ms. Baumann also serves as AML Officer of other funds. She is Chief AML Officer (2012-present) and Senior Vice President (2014-present) of FMR LLC (diversified financial services company) and is an employee of Fidelity Investments. Previously, Ms. Baumann served as AML Officer of the funds (2012-2016), and Vice President (2007-2014) and Deputy Anti-Money Laundering Officer (2007-2012) of FMR LLC.
Marc R. Bryant (1966)
Year of Election or Appointment: 2013
Secretary and Chief Legal Officer (CLO)
Mr. Bryant also serves as Secretary and CLO of other funds. Mr. Bryant serves as CLO, Secretary, and Senior Vice President of Fidelity Management & Research Company (investment adviser firm, 2015-present) and FMR Co., Inc. (investment adviser firm, 2015-present); Secretary of Fidelity SelectCo, LLC (investment adviser firm, 2015-present) and Fidelity Investments Money Management, Inc. (investment adviser firm, 2015-present); and CLO of Fidelity Management & Research (Hong Kong) Limited and FMR Investment Management (UK) Limited (investment adviser firms, 2015-present) and Fidelity Management & Research (Japan) Limited (investment adviser firm, 2016-present). He is Senior Vice President and Deputy General Counsel of FMR LLC (diversified financial services company). Previously, Mr. Bryant served as Secretary and CLO of Fidelity Rutland Square Trust II (2010-2014) and Assistant Secretary of Fidelity's Fixed Income and Asset Allocation Funds (2013-2015). Prior to joining Fidelity Investments, Mr. Bryant served as a Senior Vice President and the Head of Global Retail Legal for AllianceBernstein L.P. (2006-2010), and as the General Counsel for ProFund Advisors LLC (2001-2006).
William C. Coffey (1969)
Year of Election or Appointment: 2009
Assistant Secretary
Mr. Coffey also serves as Assistant Secretary of other funds. He is Senior Vice President and Deputy General Counsel of FMR LLC (diversified financial services company, 2010-present), and is an employee of Fidelity Investments. Previously, Mr. Coffey served as Vice President and Associate General Counsel of FMR LLC (2005-2009).
Jonathan Davis (1968)
Year of Election or Appointment: 2010
Assistant Treasurer
Mr. Davis also serves as Assistant Treasurer of other funds. Mr. Davis serves as Assistant Treasurer of FMR Capital, Inc. (2017-present) and is an employee of Fidelity Investments. Previously, Mr. Davis served as Vice President and Associate General Counsel of FMR LLC (diversified financial services company, 2003-2010).
Adrien E. Deberghes (1967)
Year of Election or Appointment: 2018
Assistant Treasurer
Mr. Deberghes also serves as an officer of other funds. He serves as Assistant Treasurer of FMR Capital, Inc. (2017-present), Executive Vice President of Fidelity Investments Money Management, Inc. (FIMM) (investment adviser firm, 2016-present), and is an employee of Fidelity Investments (2008-present). Previously, Mr. Deberghes served as President and Treasurer of certain Fidelity® funds (2013-2018). Prior to joining Fidelity Investments, Mr. Deberghes was Senior Vice President of Mutual Fund Administration at State Street Corporation (2007-2008), Senior Director of Mutual Fund Administration at Investors Bank & Trust (2005-2007), and Director of Finance for Dunkin' Brands (2000-2005). Previously, Mr. Deberghes served in other fund officer roles.
Joseph DeSantis (1959)
Year of Election or Appointment: 2015
Vice President
Mr. DeSantis also serves as Vice President of other funds. Mr. DeSantis serves as a Director of Fidelity Management & Research (Japan) Limited (investment adviser firm, 2016-present), Chief Investment Officer, Equities (2010-present) and is an employee of Fidelity Investments.
Stephanie J. Dorsey (1969)
Year of Election or Appointment: 2010
Assistant Treasurer
Ms. Dorsey also serves as an officer of other funds. Ms. Dorsey serves as Assistant Treasurer of FMR Capital, Inc. (2017-present), is an employee of Fidelity Investments (2008-present), and has served in other fund officer roles. Prior to joining Fidelity Investments, Ms. Dorsey served as Treasurer (2004-2008) of the JPMorgan Mutual Funds and Vice President (2004-2008) of JPMorgan Chase Bank.
Howard J. Galligan III (1966)
Year of Election or Appointment: 2014
Chief Financial Officer
Mr. Galligan also serves as Chief Financial Officer of other funds. Mr. Galligan serves as President of Fidelity Pricing and Cash Management Services (FPCMS) (2014-present) and as a Director of Strategic Advisers LLC (investment adviser firm, 2008-present). Previously, Mr. Galligan served as Chief Administrative Officer of Asset Management (2011-2014) and Chief Operating Officer and Senior Vice President of Investment Support for Strategic Advisers, Inc. (2003-2011).
Brian B. Hogan (1964)
Year of Election or Appointment: 2009
Vice President
Mr. Hogan also serves as Trustee or Vice President of other funds. Mr. Hogan serves as Head of Fidelity Investments’ Investment Solutions and Innovation organization (2018-present), and as a Director of FMR Investment Management (UK) Limited (investment adviser firm, 2015-present) and Fidelity SelectCo, LLC (investment adviser firm, 2014-present). Previously, Mr. Hogan served as Trustee of certain Fidelity® funds (2014-2018), President of the Equity Division of FMR (investment adviser firm, 2009-2018), Senior Vice President, Equity Research of FMR (2006-2009), and as a portfolio manager. Mr. Brian B. Hogan is not related to Mr. Colm A. Hogan.
Colm A. Hogan (1973)
Year of Election or Appointment: 2018
Deputy Treasurer
Mr. Hogan also serves as an officer of other funds. Mr. Hogan serves as Assistant Treasurer of FMR Capital, Inc. (2017-present) and is an employee of Fidelity Investments (2005-present). Previously, Mr. Hogan served as Assistant Treasurer of certain Fidelity® funds (2016-2018). Mr. Colm A. Hogan is not related to Mr. Brian B. Hogan.
Chris Maher (1972)
Year of Election or Appointment: 2013
Assistant Treasurer
Mr. Maher serves as Assistant Treasurer of other funds. Mr. Maher is Vice President of Valuation Oversight, serves as Assistant Treasurer of FMR Capital, Inc. (2017-present), and is an employee of Fidelity Investments. Previously, Mr. Maher served as Vice President of Asset Management Compliance (2013), Vice President of the Program Management Group of FMR (investment adviser firm, 2010-2013), and Vice President of Valuation Oversight (2008-2010).
Rieco E. Mello (1969)
Year of Election or Appointment: 2017
Assistant Treasurer
Mr. Mello also serves as Assistant Treasurer of other funds. Mr. Mello serves as Assistant Treasurer of FMR Capital, Inc. (2017-present) and is an employee of Fidelity Investments (1995-present).
Kenneth B. Robins (1969)
Year of Election or Appointment: 2018
Chief Compliance Officer
Mr. Robins also serves as an officer of other funds. Mr. Robins serves as Compliance Officer of Fidelity Management & Research Company and FMR Co., Inc. (investment adviser firms, 2016-present) and is an employee of Fidelity Investments (2004-present). Previously, Mr. Robins served as Executive Vice President of Fidelity Investments Money Management, Inc. (investment adviser firm, 2013-2016) and served in other fund officer roles.
Stacie M. Smith (1974)
Year of Election or Appointment: 2018
President and Treasurer
Ms. Smith also serves as an officer of other funds. Ms. Smith serves as Assistant Treasurer of FMR Capital, Inc. (2017-present), is an employee of Fidelity Investments (2009-present), and has served in other fund officer roles. Prior to joining Fidelity Investments, Ms. Smith served as Senior Audit Manager of Ernst & Young LLP (accounting firm, 1996-2009). Previously, Ms. Smith served as Assistant Treasurer (2013-2018) and Deputy Treasurer (2013-2016) of certain Fidelity® funds.
Marc L. Spector (1972)
Year of Election or Appointment: 2017
Assistant Treasurer
Mr. Spector also serves as an officer of other funds. Mr. Spector serves as Assistant Treasurer of FMR Capital, Inc. (2017-present) and is an employee of Fidelity Investments (2016-present). Prior to joining Fidelity Investments, Mr. Spector served as Director at the Siegfried Group (accounting firm, 2013-2016), and prior to Siegfried Group as audit senior manager at Deloitte & Touche (accounting firm, 2005-2013).
Renee Stagnone (1975)
Year of Election or Appointment: 2016
Assistant Treasurer
Ms. Stagnone also serves as an officer of other funds. Ms. Stagnone serves as Assistant Treasurer of FMR Capital, Inc. (2017-present) and is an employee of Fidelity Investments (1997-present). Previously, Ms. Stagnone served as Deputy Treasurer of certain Fidelity® funds (2013-2016).
Shareholder Expense Example
As a shareholder of a Fund, you incur two types of costs: (1) transaction costs, including redemption fees and (2) ongoing costs, including management fees and other Fund expenses. This Example is intended to help you understand your ongoing costs (in dollars) of investing in the Funds and to compare these costs with the ongoing costs of investing in other mutual funds.
The Example is based on an investment of $1,000 invested at the beginning of the period and held for the entire period (September 1, 2017 to February 28, 2018).
Actual Expenses
The first line of the accompanying table for each fund provides information about actual account values and actual expenses. You may use the information in this line, together with the amount you invested, to estimate the expenses that you paid over the period. Simply divide your account value by $1,000.00 (for example, an $8,600 account value divided by $1,000.00 = 8.6), then multiply the result by the number in the first line for a fund under the heading entitled "Expenses Paid During Period" to estimate the expenses you paid on your account during this period. A small balance maintenance fee of $12.00 that is charged once a year may apply for certain accounts with a value of less than $2,000. This fee is not included in the table below. If it was, the estimate of expenses you paid during the period would be higher, and your ending account value lower, by this amount. In addition, each Fund, as a shareholder in the underlying Fidelity Central Funds, will indirectly bear its pro-rata share of the fees and expenses incurred by the underlying Fidelity Central Funds. These fees and expenses are not included in the Fund's annualized expense ratio used to calculate the expense estimate in the table below.
Hypothetical Example for Comparison Purposes
The second line of the accompanying table for each fund provides information about hypothetical account values and hypothetical expenses based on a fund's actual expense ratio and an assumed rate of return of 5% per year before expenses, which is not the Fund's actual return. The hypothetical account values and expenses may not be used to estimate the actual ending account balance or expenses you paid for the period. You may use this information to compare the ongoing costs of investing in the Fund and other funds. To do so, compare this 5% hypothetical example with the 5% hypothetical examples that appear in the shareholder reports of the other funds. A small balance maintenance fee of $12.00 that is charged once a year may apply for certain accounts with a value of less than $2,000. This fee is not included in the table below. If it was, the estimate of expenses you paid during the period would be higher, and your ending account value lower, by this amount.In addition, each Fund, as a shareholder in the underlying Fidelity Central Funds, will indirectly bear its pro-rata share of the fees and expenses incurred by the underlying Fidelity Central Funds. These fees and expenses are not included in the Fund's annualized expense ratio used to calculate the expense estimate in the table below.
Please note that the expenses shown in the table are meant to highlight your ongoing costs only and do not reflect any transaction costs. Therefore, the second line of the table is useful in comparing ongoing costs only, and will not help you determine the relative total costs of owning different funds. In addition, if these transactional costs were included, your costs would have been higher.
| | Annualized Expense Ratio-A | Beginning
Account Value
September 1, 2017 | Ending
Account Value
February 28, 2018 | Expenses Paid
During Period-B
September 1, 2017
to February 28, 2018 |
| Air Transportation Portfolio | .81% | | | |
| Actual | | $1,000.00 | $1,105.80 | $4.23 |
| Hypothetical-C | | $1,000.00 | $1,020.78 | $4.06 |
| Defense and Aerospace Portfolio | .76% | | | |
| Actual | | $1,000.00 | $1,230.40 | $4.20 |
| Hypothetical-C | | $1,000.00 | $1,021.03 | $3.81 |
| Environment and Alternative Energy Portfolio | .84% | | | |
| Actual | | $1,000.00 | $1,112.30 | $4.40 |
| Hypothetical-C | | $1,000.00 | $1,020.63 | $4.21 |
| Industrials Portfolio | .77% | | | |
| Actual | | $1,000.00 | $1,138.50 | $4.08 |
| Hypothetical-C | | $1,000.00 | $1,020.98 | $3.86 |
| Transportation Portfolio | .79% | | | |
| Actual | | $1,000.00 | $1,099.20 | $4.11 |
| Hypothetical-C | | $1,000.00 | $1,020.88 | $3.96 |
A Annualized expense ratio reflects expenses net of applicable fee waivers.
B Expenses are equal to each Fund's annualized expense ratio, multiplied by the average account value over the period, multiplied by 181/ 365 (to reflect the one-half year period).
C 5% return per year before expenses
Distributions (Unaudited)
The Board of Trustees of Industrial Equipment Portfolio voted to pay to shareholders of record at the opening of business on record date, the following distributions per share derived from capital gains realized from sales of portfolio securities, and dividends derived from net investment income:
| | Pay Date | Record Date | Dividends | Capital Gains |
| Industrial Equipment Portfolio | 1/24/18 | 1/23/18 | $0.014 | $5.542 |
|
The Board of Trustees of each fund voted to pay to shareholders of record at the opening of business on record date, the following distributions per share derived from capital gains realized from sales of portfolio securities, and dividends derived from net investment income:
| | Pay Date | Record Date | Dividends | Capital Gains |
| Air Transportation Portfolio | 04/12/18 | 04/11/18 | $0.140 | $4.261 |
| Defense and Aerospace Portfolio | 04/12/18 | 04/11/18 | $0.196 | $4.941 |
| Environment and Alternative Energy Portfolio | 04/12/18 | 04/11/18 | $0.068 | $0.580 |
| Industrials Portfolio | 04/12/18 | 04/11/18 | $0.054 | $1.450 |
| Transportation Portfolio | 04/12/18 | 04/11/18 | $0.248 | $4.588 |
|
Industrial Equipment Portfolio hereby designates as a capital gain dividend with respect to the taxable year ended January 26, 2018, $20,535,000, or, if subsequently determined to be different, the net capital gain of such year. The preceding designation includes $490,605 of long-term capital gains that were distributed by Industrials Portfolio on April 11, 2018. On April 11, 2018, Industrials Portfolio paid a distribution of $34,879,271 of long-term capital gains to its shareholders, which $490,605 of long-term capital gains that were realized, but not distributed, by Industrial Equipment Portfolio before Industrial Equipment Portfolio merged into the fund on January 26, 2018.
The funds hereby designate as capital gain dividend the amounts noted below for the taxable year ended February 28, 2018, or, if subsequently determined to be different, the net capital gain of such year.
| Air Transportation Portfolio | $37,689,769 |
| Defense and Aerospace Portfolio | $111,447,451 |
| Environment and Alternative Energy Portfolio | $5,180,074 |
| Industrials Portfolio | $61,144,035 |
| Transportation Portfolio | $42,461,541 |
|
A percentage of the dividends distributed during the fiscal year for the following funds qualify for the dividends–received deduction for corporate shareholders:
| | April 2017 | December 2017 |
| Air Transportation Portfolio | 100% | 95% |
| Defense and Aerospace Portfolio | 100% | 100% |
| Environment and Alternative Energy Portfolio | 62% | 45% |
| Industrials Portfolio | 100% | 100% |
| Transportation Portfolio | 100% | 100% |
| Industrial Equipment Portfolio | 33% | 100% |
|
A percentage of the dividends distributed during the fiscal year for the following funds may be taken into account as a dividend for purposes of the maximum rate under section 1(h)(11) of the Internal Revenue Code.
| | April 2017 | December 2017 |
| Air Transportation Portfolio | 100% | 98% |
| Defense and Aerospace Portfolio | 100% | 100% |
| Environment and Alternative Energy Portfolio | 100% | 64% |
| Industrials Portfolio | 100% | 100% |
| Transportation Portfolio | 100% | 100% |
| Industrial Equipment Portfolio | 40% | 100% |
|
The funds will notify shareholders in January 2019 of amounts for use in preparing 2018 income tax returns.
Board Approval of Investment Advisory Contracts and Management Fees
Air Transportation Portfolio
Defense and Aerospace Portfolio
Environment and Alternative Energy Portfolio
Industrials Portfolio
Transportation Portfolio
Each year, the Board of Trustees, including the Independent Trustees (together, the Board), votes on the renewal of the management contract with Fidelity SelectCo, LLC (SelectCo), an affiliate of Fidelity Management & Research Company (FMR), and the sub-advisory agreements with affiliates of FMR (together, the Advisory Contracts) for each fund. SelectCo and the sub-advisers are collectively referred to herein as the Investment Advisers. The Board, assisted by the advice of fund counsel and Independent Trustees' counsel, requests and considers a broad range of information relevant to the renewal of the Advisory Contracts throughout the year.
The Board meets regularly and, at each of its meetings, covers an extensive agenda of topics and materials and considers factors that are relevant to its annual consideration of the renewal of each fund's Advisory Contracts, including the services and support provided to each fund and its shareholders. The Board has established four standing committees (Committees) — Operations, Audit, Fair Valuation, and Governance and Nominating — each composed of and chaired by Independent Trustees with varying backgrounds, to which the Board has assigned specific subject matter responsibilities in order to enhance effective decision-making by the Board. The Operations Committee, of which all of the Independent Trustees are members, meets regularly throughout the year and considers, among other matters, information specifically related to the annual consideration of the renewal of each fund's Advisory Contracts. The Board, acting directly and through its Committees, requests and receives information concerning the annual consideration of the renewal of each fund's Advisory Contracts. The Board also meets as needed to review matters specifically related to the Board's annual consideration of the renewal of the Advisory Contracts. Members of the Board may also meet with trustees of other Fidelity funds through ad hoc joint committees to discuss certain matters relevant to all of the Fidelity funds.
At its January 2018 meeting, the Board unanimously determined to renew each fund's Advisory Contracts. In reaching its determination, the Board considered all factors it believed relevant, including (i) the nature, extent, and quality of the services to be provided to each fund and its shareholders (including the investment performance of each fund); (ii) the competitiveness of each fund's management fee and total expense ratio relative to peer funds; (iii) the total costs of the services to be provided by and the profits to be realized by Fidelity from its relationships with each fund; and (iv) the extent to which, if any, economies of scale exist and would be realized as each fund grows, and whether any economies of scale are appropriately shared with fund shareholders.
In considering whether to renew the Advisory Contracts for each fund, the Board reached a determination, with the assistance of fund counsel and Independent Trustees' counsel and through the exercise of its business judgment, that the renewal of the Advisory Contracts was in the best interests of each fund and its shareholders and that the compensation payable under the Advisory Contracts was fair and reasonable. The Board's decision to renew the Advisory Contracts was not based on any single factor, but rather was based on a comprehensive consideration of all the information provided to the Board at its meetings throughout the year. The Board, in reaching its determination to renew the Advisory Contracts, was aware that shareholders of each fund have a broad range of investment choices available to them, including a wide choice among funds offered by Fidelity's competitors, and that each fund's shareholders, who have the opportunity to review and weigh the disclosure provided by the fund in its prospectus and other public disclosures, have chosen to invest in that fund, which is part of the Fidelity family of funds.
Amendment to Group Fee Rate. The Board also ratified an amendment to the management contract for each fund to add an additional breakpoint to the group fee schedule, which was effective October 1, 2017. The Board noted that the additional breakpoint would result in lower management fee rates to the extent that assets under management that are included in group fee calculations increase above the new breakpoint.
Nature, Extent, and Quality of Services Provided. The Board considered the staffing of the Investment Advisers as it relates to the funds, including the backgrounds of investment personnel of SelectCo, and also considered the funds' investment objectives, strategies, and related investment philosophies. The Independent Trustees also had discussions with senior management of Fidelity's investment operations and investment groups. The Board considered the structure of the investment personnel compensation program and whether this structure provides appropriate incentives to act in the best interests of each fund. Additionally, the Board considered the portfolio managers' investments, if any, in the funds that they manage.
Resources Dedicated to Investment Management and Support Services. The Board reviewed the general qualifications and capabilities of the Investment Advisers' investment staffs, including their size, education, experience, and resources, as well as Fidelity's approach to recruiting, training, managing, and compensating investment personnel. The Board noted that Fidelity has continued to increase the resources devoted to non-U.S. offices, including expansion of Fidelity's global investment organization. The Board also noted that Fidelity's analysts have extensive resources, tools and capabilities that allow them to conduct sophisticated quantitative and fundamental analysis, as well as credit analysis of issuers, counterparties and guarantors. Further, the Board considered that Fidelity's investment professionals have sufficient access to global information and data so as to provide competitive investment results over time, and that those professionals also have access to sophisticated tools that permit them to assess portfolio construction and risk and performance attribution characteristics continuously, as well as to transmit new information and research conclusions rapidly around the world. Additionally, in its deliberations, the Board considered Fidelity's trading, risk management, compliance, and technology and operations capabilities and resources, which are integral parts of the investment management process.
Shareholder and Administrative Services. The Board considered (i) the nature, extent, quality, and cost of advisory, administrative, and shareholder services performed by the Investment Advisers and their affiliates under the Advisory Contracts and under separate agreements covering transfer agency, pricing and bookkeeping, and securities lending services for each fund; (ii) the nature and extent of the supervision of third party service providers, principally custodians, subcustodians, and pricing vendors; and (iii) the resources devoted to, and the record of compliance with, each fund's compliance policies and procedures. The Board also reviewed the allocation of fund brokerage, including allocations to brokers affiliated with the Investment Advisers, the use of brokerage commissions to pay fund expenses, and the use of "soft" commission dollars to pay for research services.
The Board noted that the growth of fund assets over time across the complex allows Fidelity to reinvest in the development of services designed to enhance the value or convenience of the Fidelity funds as investment vehicles. These services include 24-hour access to account information and market information through telephone representatives and over the Internet, investor education materials and asset allocation tools, and the expanded availability of Fidelity Investor Centers.
The Board noted that it and the boards of certain other Fidelity funds had formed an ad hoc Committee on Transfer Agency Fees to review the variety of transfer agency fee structures throughout the industry and Fidelity's competitive positioning with respect to industry participants.
Investment in a Large Fund Family. The Board considered the benefits to shareholders of investing in a Fidelity fund, including the benefits of investing in a fund that is part of a large family of funds offering a variety of investment disciplines and providing a large variety of mutual fund investor services. The Board noted that Fidelity had taken, or had made recommendations that resulted in the Fidelity funds taking, a number of actions over the previous year that benefited particular funds, including: (i) continuing to dedicate additional resources to Fidelity's investment research process, which includes meetings with management of issuers in which the funds invest, and to the support of the senior management team that oversees asset management; (ii) continuing efforts to enhance Fidelity's global research capabilities; (iii) launching new funds and making other enhancements to meet client needs; (iv) launching new share classes of existing funds; (v) eliminating purchase minimums and broadening eligibility requirements for certain lower-priced share classes; (vi) reducing management fees and total expenses for certain growth equity funds and index funds; (vii) lowering expense caps for certain existing funds and classes to reduce expenses borne by shareholders; (viii) eliminating short-term redemption fees for certain funds; (ix) introducing a new pricing structure for certain funds of funds that is expected to reduce overall expenses paid by shareholders; (x) rationalizing product lines and gaining increased efficiencies through proposals for fund mergers and share class consolidations; (xi) continuing to develop, acquire and implement systems and technology to improve services to the funds and shareholders, strengthen information security, and increase efficiency; and (xii) implementing enhancements to further strengthen Fidelity's product line to increase investors' probability of success in achieving their investment goals, including retirement income goals.
The Board considered whether each fund has operated in accordance with its investment objective, as well as its record of compliance with its investment restrictions and its performance history.
The Board took into account discussions with representatives of SelectCo about fund investment performance that occur at Board meetings throughout the year. In this regard the Board noted that as part of regularly scheduled fund reviews and other reports to the Board on fund performance, the Board considers annualized return information for each fund for different time periods, measured against a securities market index ("benchmark index"). In its evaluation of fund investment performance at meetings throughout the year, the Board gave particular attention to information indicating underperformance of certain Fidelity funds for specific time periods and discussed with the Investment Advisers the reasons for such underperformance. Each of Air Transportation Portfolio, Defense and Aerospace Portfolio, Industrials Portfolio, and Transportation Portfolio underperformed its benchmark for the one-, three-, and five-year periods ended June 30, 2017, and as a result, the Board will continue to discuss with SelectCo the steps it is taking to address each such fund's performance.
In addition to reviewing absolute and relative fund performance, the Independent Trustees periodically consider the appropriateness of fund performance metrics in evaluating the results achieved. In general, the Independent Trustees believe that fund performance should be evaluated based on net performance (after fees and expenses) of both the highest performing and lowest performing fund share classes, where applicable, compared to appropriate benchmark indices, over appropriate time periods that may include full market cycles, taking into account relevant factors, including the following: general market conditions; issuer-specific information; and fund cash flows and other factors. Depending on the circumstances, the Independent Trustees may be satisfied with a fund's performance notwithstanding that it lags its benchmark index for certain periods.
The Independent Trustees recognize that shareholders evaluate performance on a net basis over their own holding periods, for which one-, three-, and five-year periods are often used as a proxy. For this reason, the performance information reviewed by the Board also included net cumulative total return information for each fund and an appropriate benchmark index for the most recent one-, three-, and five-year periods ended June 30, 2017.
Based on its review, the Board concluded that the nature, extent, and quality of services provided to each fund under the Advisory Contracts should continue to benefit the shareholders of each fund.
Competitiveness of Management Fee and Total Expense Ratio. The Board considered each fund's management fee and total expense ratio compared to "mapped groups" of competitive funds and classes created for the purpose of facilitating the Trustees' analysis of the competitiveness of management fees and total expenses. Fidelity creates "mapped groups" by combining similar Lipper investment objective categories that have comparable investment mandates. For this purpose, all sector focused equity funds are grouped in the same mapped group. Combining Lipper investment objective categories aids the Board's management fee and total expense ratio comparisons by broadening the competitive group used for comparison.
Management Fee. The Board considered two proprietary management fee comparisons for the 12-month periods ended June 30 shown in basis points (BP) in the charts below. The group of Lipper funds used by the Board for management fee comparisons is referred to below as the "Total Mapped Group." The Total Mapped Group comparison focuses on a fund's standing in terms of gross management fees before expense reimbursements or caps relative to the total universe of funds with comparable investment mandates (
i.e., sector equities), regardless of whether their management fee structures also are comparable. Funds with comparable management fee structures have similar management fee contractual arrangements (
e.g., flat rate charged for advisory services, all-inclusive fee rate,
etc.). "TMG %" represents the percentage of funds in the Total Mapped Group that had management fees that were lower than a fund's. For example, a hypothetical TMG % of 20% would mean that 80% of the funds in the Total Mapped Group had higher, and 20% had lower, management fees than a fund. The funds' actual TMG %s and the number of funds in the Total Mapped Group are in the charts below. The "Asset-Size Peer Group" (ASPG) comparison focuses on a fund's standing relative to a subset of non-Fidelity funds within the Total Mapped Group that are similar in size and management fee structure. For example, if a fund is in the first quartile of the ASPG, the fund's management fee ranks in the least expensive or lowest 25% of funds in the ASPG. The ASPG represents at least 15% of the funds in the Total Mapped Group with comparable asset size and management fee structures, subject to a minimum of 50 funds (or all funds in the Total Mapped Group if fewer than 50). Additional information, such as the ASPG quartile in which a fund's management fee rate ranked, is also included in the charts and considered by the Board.
Air Transportation Portfolio

Defense and Aerospace Portfolio
Environment and Alternative Energy Portfolio
Industrials Portfolio
Transportation Portfolio
The Board noted that each fund's management fee rate ranked below the median of its Total Mapped Group and below the median of its ASPG for the 12-month period ended June 30, 2017.
The Board noted that it and the boards of other Fidelity funds formed an ad hoc Committee on Group Fee, which meets periodically, to conduct an in-depth review of the "group fee" component of the management fee of funds with such management fee structures. The Committee's focus included the mechanics of the group fee, the competitive landscape of group fee structures, Fidelity funds with no group fee component and investment products not included in group fee assets. The Board also considered that, for funds subject to the group fee, FMR agreed to voluntarily waive fees over a specified period of time in amounts designed to account for assets converted from certain funds to certain collective investment trusts.
Based on its review, the Board concluded that each fund's management fee is fair and reasonable in light of the services that each fund receives and the other factors considered.
Total Expense Ratio. In its review of each fund's total expense ratio, the Board considered the fund's management fee rate as well as other fund expenses, such as transfer agent fees, pricing and bookkeeping fees, and custodial, legal, and audit fees. The Board also noted that Fidelity may agree to waive fees and expenses from time to time, and the extent to which, if any, it has done so for each fund. As part of its review, the Board also considered the current and historical total expense ratios of each fund compared to competitive fund median expenses. Each fund is compared to those funds and classes in the Total Mapped Group (used by the Board for management fee comparisons) that have a similar sales load structure.
The Board noted that each fund's total expense ratio ranked below the competitive median for the 12-month period ended June 30, 2017.
Fees Charged to Other Fidelity Clients. The Board also considered Fidelity fee structures and other information with respect to clients of Fidelity, such as other funds advised or subadvised by Fidelity, pension plan clients, and other institutional clients with similar mandates. The Board noted that an ad hoc joint committee created by it and the boards of other Fidelity funds periodically reviews and compares Fidelity's institutional investment advisory business with its business of providing services to the Fidelity funds, including the differences in services provided, fees charged, and costs incurred, as well as competition in their respective marketplaces.
Based on its review of total expense ratios and fees charged to other Fidelity clients, the Board concluded that each fund's total expense ratio was reasonable in light of the services that each fund and its shareholders receive and the other factors considered.
Costs of the Services and Profitability. The Board considered the revenues earned and the expenses incurred by Fidelity in conducting the business of developing, marketing, distributing, managing, administering and servicing each fund and servicing each fund's shareholders. The Board also considered the level of Fidelity's profits in respect of all the Fidelity funds.
On an annual basis, Fidelity presents to the Board information about the profitability of its relationships with each fund. Fidelity calculates profitability information for each fund, as well as aggregate profitability information for groups of Fidelity funds and all Fidelity funds, using a series of detailed revenue and cost allocation methodologies which originate with the books and records of Fidelity on which Fidelity's audited financial statements are based. The Audit Committee of the Board reviews any significant changes from the prior year's methodologies.
PricewaterhouseCoopers LLP (PwC), independent registered public accounting firm and auditor to Fidelity and certain Fidelity funds, has been engaged annually by the Board as part of the Board's assessment of the profitability analysis used by Fidelity. PwC's engagement includes the review and assessment of Fidelity's methodologies used in determining the revenues and expenses attributable to Fidelity's mutual fund business, and completion of agreed-upon procedures in respect of the mathematical accuracy of the fund profitability information and its conformity to established allocation methodologies. After considering PwC's reports issued under the engagement and information provided by Fidelity, the Board concluded that while other allocation methods may also be reasonable, Fidelity's profitability methodologies are reasonable in all material respects.
The Board also reviewed Fidelity's non-fund businesses and potential fall-out benefits related to the mutual fund business as well as cases where Fidelity's affiliates may benefit from or be related to the funds' business.
The Board considered the costs of the services provided by and the profits realized by Fidelity in connection with the operation of each fund and was satisfied that the profitability was not excessive.
Economies of Scale. The Board considered whether there have been economies of scale in respect of the management of the Fidelity funds, whether the Fidelity funds (including each fund) have appropriately benefited from any such economies of scale, and whether there is potential for realization of any further economies of scale. The Board considered the extent to which each fund will benefit from economies of scale as assets grow through increased services to the fund, through waivers or reimbursements, or through fee or expense ratio reductions. The Board also noted that a committee (the Economies of Scale Committee) created by it and the boards of other Fidelity funds periodically analyzes whether Fidelity attains economies of scale in respect of the management and servicing of the Fidelity funds, whether the Fidelity funds have appropriately benefited from such economies of scale, and whether there is potential for realization of any further economies of scale.
The Board recognized that each fund's management contract incorporates a "group fee" structure, which provides for lower group fee rates as total group assets increase, and for higher group fee rates as total group assets decrease (with "group assets" defined to include fund assets under SelectCo's management plus assets under FMR's management). SelectCo calculates the group fee rates based on a tiered asset "breakpoint" schedule that varies based on asset class. The Board considered that the group fee is designed to deliver the benefits of economies of scale to fund shareholders when total group assets increase, even if assets of any particular fund are unchanged or have declined, because some portion of Fidelity's costs are attributable to services provided to all Fidelity funds, and all funds benefit if those costs can be allocated among more assets. The Board concluded that, given the group fee structure, fund shareholders will benefit from lower management fees as group assets increase at the fund complex level, regardless of whether Fidelity achieves any such economies of scale.
The Board concluded, taking into account the analysis of the Economies of Scale Committee, that economies of scale, if any, are being appropriately shared between fund shareholders and Fidelity.
Additional Information Requested by the Board. In order to develop fully the factual basis for consideration of the Fidelity funds' advisory contracts, the Board requested and received additional information on certain topics, including: (i) Fidelity's fund profitability methodology, profitability trends for certain funds, and the impact of certain factors on fund profitability results; (ii) portfolio manager changes that have occurred during the past year and the amount of the investment that each portfolio manager has made in the Fidelity fund(s) that he or she manages; (iii) Fidelity's compensation structure for portfolio managers, research analysts, and other key personnel, including its effects on fund profitability; (iv) comparisons to institutional products; (v) the arrangements with and compensation paid to certain fund sub-advisers on behalf of the Fidelity funds; (vi) the impact of proposed changes to contractual expense cap arrangements in place for certain funds; (vii) Fidelity's long-term expectations for its offerings in the workplace investing channel; (viii) the methodology with respect to evaluating competitive fund data and peer group classifications and fee comparisons; (ix) the presentation of certain fund performance information; (x) Fidelity's transfer agent fee, expense, and service structures for different funds and classes, including the increased use of omnibus accounts and lower pricing in the retirement channel; (xi) fluctuations in trading expenses; (xii) explanations regarding the relative total expense ratios of certain funds and classes; and (xiii) Fidelity's expectations regarding the future asset levels of certain funds.
Based on its evaluation of all of the conclusions noted above, and after considering all factors it believed relevant, the Board concluded that the advisory fee structures are fair and reasonable, and that each fund's Advisory Contracts should be renewed.
Proxy Voting Results
A special meeting of shareholders was held on December 8, 2017. The results of votes taken among shareholders on the proposals before them are reported below. Each vote reported represents one dollar of net asset value held on the record date for the meeting.
PROPOSAL 1
To elect a Board of Trustees.
| | # of
Votes | % of
Votes |
| James C. Curvey |
| Affirmative | 40,874,579,146.19 | 94.146 |
| Withheld | 2,541,618,753.48 | 5.854 |
| TOTAL | 43,416,197,899.67 | 100.000 |
| Dennis J. Dirks |
| Affirmative | 41,093,243,800.03 | 94.650 |
| Withheld | 2,322,954,099.64 | 5.350 |
| TOTAL | 43,416,197,899.67 | 100.000 |
| Donald F. Donahue |
| Affirmative | 41,121,116,505.64 | 94.714 |
| Withheld | 2,295,081,394.03 | 5.286 |
| TOTAL | 43,416,197,899.67 | 100.000 |
| Alan J. Lacy |
| Affirmative | 41,091,494,851.72 | 94.646 |
| Withheld | 2,324,703,047.95 | 5.354 |
| TOTAL | 43,416,197,899.67 | 100.00 |
| Ned C. Lautenbach |
| Affirmative | 40,970,733,721.42 | 94.368 |
| Withheld | 2,445,464,178.25 | 5.632 |
| TOTAL | 43,416,197,899.67 | 100.000 |
| Joseph Mauriello |
| Affirmative | 41,021,688,840.89 | 94.485 |
| Withheld | 2,394,509,058.78 | 5.515 |
| TOTAL | 43,416,197,899.67 | 100.000 |
| Charles S. Morrison |
| Affirmative | 41,163,534,997.01 | 94.812 |
| Withheld | 2,252,662,902.66 | 5.188 |
| TOTAL | 43,416,197,899.67 | 100.000 |
| Cornelia M. Small |
| Affirmative | 41,061,752,034.66 | 94.578 |
| Withheld | 2,354,445,865.01 | 5.422 |
| TOTAL | 43,416,197,899.67 | 100.000 |
| Garnett A. Smith |
| Affirmative | 41,061,939,407.02 | 94.578 |
| Withheld | 2,354,258,492.65 | 5.422 |
| TOTAL | 43,416,197,899.67 | 100.000 |
| David M. Thomas |
| Affirmative | 41,102,875,738.06 | 94.672 |
| Withheld | 2,313,322,161.61 | 5.328 |
| TOTAL | 43,416,197,899.67 | 100.000 |
| Michael E. Wiley |
| Affirmative | 41,112,279,187.11 | 94.694 |
| Withheld | 2,303,918,712.56 | 5.306 |
| TOTAL | 43,416,197,899.67 | 100.000 |
PROPOSAL 2
To eliminate a fundamental investment policy for Air Transportation Portfolio.
| | # of
Votes | % of
Votes |
| Affirmative | 209,840,344.82 | 70.848 |
| Against | 38,280,376.49 | 12.925 |
| Abstain | 17,813,274.59 | 6.014 |
| Broker Non-Vote | 30,251,551.64 | 10.213 |
| TOTAL | 296,185,547.54 | 100.000 |
PROPOSAL 2
To eliminate a fundamental investment policy for Defense and Aerospace Portfolio.
| | # of
Votes | % of
Votes |
| Affirmative | 1,062,541,359.33 | 71.004 |
| Against | 173,847,725.09 | 11.618 |
| Abstain | 118,073,349.66 | 7.890 |
| Broker Non-Vote | 141,991,419.34 | 9.488 |
| TOTAL | 1,496,453,853.42 | 100.000 |
PROPOSAL 2
To eliminate a fundamental investment policy for Environment and Alternative Energy Portfolio.
| | # of
Votes | % of
Votes |
| Affirmative | 69,794,884.01 | 67.924 |
| Against | 18,750,020.00 | 18.247 |
| Abstain | 10,805,974.80 | 10.516 |
| Broker Non-Vote | 3,404,665.09 | 3.313 |
| TOTAL | 102,755,543.90 | 100.000 |
PROPOSAL 2
To eliminate a fundamental investment policy for Industrials Portfolio.
| | # of
Votes | % of
Votes |
| Affirmative | 387,501,772.06 | 75.862 |
| Against | 58,494,475.79 | 11.452 |
| Abstain | 33,763,747.06 | 6.609 |
| Broker Non-Vote | 31,044,354.70 | 6.077 |
| TOTAL | 510,804,349.61 | 100.000 |
PROPOSAL 2
To eliminate a fundamental investment policy for Transportation Portfolio.
| | # of
Votes | % of
Votes |
| Affirmative | 246,658,802.32 | 70.251 |
| Against | 53,230,602.00 | 15.161 |
| Abstain | 24,097,075.50 | 6.863 |
| Broker Non-Vote | 27,125,697.92 | 7.725 |
| TOTAL | 351,112,177.74 | 100.000 |
PROPOSAL 3
To modify Air Transportation Portfolio's fundamental concentration policy.
| | # of
Votes | % of
Votes |
| Affirmative | 215,022,556.50 | 72.598 |
| Against | 33,581,586.90 | 11.338 |
| Abstain | 17,329,852.50 | 5.851 |
| Broker Non-Vote | 30,251,551.64 | 10.213 |
| TOTAL | 296,185,547.54 | 100.000 |
PROPOSAL 3
To modify Defense and Aerospace Portfolio's fundamental concentration policy.
| | # of
Votes | % of
Votes |
| Affirmative | 1,101,695,500.22 | 73.621 |
| Against | 152,896,572.94 | 10.218 |
| Abstain | 99,870,360.92 | 6.673 |
| Broker Non-Vote | 141,991,419.34 | 9.488 |
| TOTAL | 1,496,453,853.42 | 100.000 |
PROPOSAL 3
To modify Transportation Portfolio's fundamental concentration policy.
| | # of
Votes | % of
Votes |
| Affirmative | 255,722,824.61 | 72.833 |
| Against | 44,200,601.88 | 12.589 |
| Abstain | 24,063,053.33 | 6.853 |
| Broker Non-Vote | 27,125,697.92 | 7.725 |
| TOTAL | 351,112,177.74 | 100.000 |
|
| Proposal 1 reflects trust wide proposal and voting results. |

SELCI-ANN-0418
1.813657.113
Fidelity® Select Portfolios®
Consumer Discretionary Sector Automotive Portfolio
Construction and Housing Portfolio
Consumer Discretionary Portfolio
Leisure Portfolio
Multimedia Portfolio
Retailing Portfolio
Annual Report February 28, 2018 |
|
Contents
To view a fund's proxy voting guidelines and proxy voting record for the 12-month period ended June 30, visit http://www.fidelity.com/proxyvotingresults or visit the Securities and Exchange Commission's (SEC) web site at http://www.sec.gov.
You may also call 1-800-544-8544 to request a free copy of the proxy voting guidelines.
Standard & Poor's, S&P and S&P 500 are registered service marks of The McGraw-Hill Companies, Inc. and have been licensed for use by Fidelity Distributors Corporation.
Other third-party marks appearing herein are the property of their respective owners.
All other marks appearing herein are registered or unregistered trademarks or service marks of FMR LLC or an affiliated company. © 2018 FMR LLC. All rights reserved.
This report and the financial statements contained herein are submitted for the general information of the shareholders of the Funds. This report is not authorized for distribution to prospective investors in the Funds unless preceded or accompanied by an effective prospectus.
A fund files its complete schedule of portfolio holdings with the SEC for the first and third quarters of each fiscal year on Form N-Q. Forms N-Q are available on the SEC’s web site at http://www.sec.gov. A fund's Forms N-Q may be reviewed and copied at the SEC’s Public Reference Room in Washington, DC. Information regarding the operation of the SEC's Public Reference Room may be obtained by calling 1-800-SEC-0330.
For a complete list of a fund's portfolio holdings, view the most recent holdings listing, semiannual report, or annual report on Fidelity's web site at http://www.fidelity.com, http://www.institutional.fidelity.com, or http://www.401k.com, as applicable.
NOT FDIC INSURED •MAY LOSE VALUE •NO BANK GUARANTEE
Neither the Funds nor Fidelity Distributors Corporation is a bank.
Automotive Portfolio
Performance: The Bottom Line
Average annual total return reflects the change in the value of an investment, assuming reinvestment of distributions from dividend income and capital gains (the profits earned upon the sale of securities that have grown in value, if any) and assuming a constant rate of performance each year. The hypothetical investment and the average annual total returns do not reflect the deduction of taxes that a shareholder would pay on fund distributions or the redemption of fund shares. During periods of reimbursement by Fidelity, a fund’s total return will be greater than it would be had the reimbursement not occurred. How a fund did yesterday is no guarantee of how it will do tomorrow.
Average Annual Total Returns
| For the periods ended February 28, 2018 | Past 1 year | Past 5 years | Past 10 years |
| Automotive Portfolio | 19.08% | 11.34% | 8.62% |
$10,000 Over 10 Years
Let's say hypothetically that $10,000 was invested in Automotive Portfolio on February 29, 2008.
The chart shows how the value of your investment would have changed, and also shows how the S&P 500® Index performed over the same period.
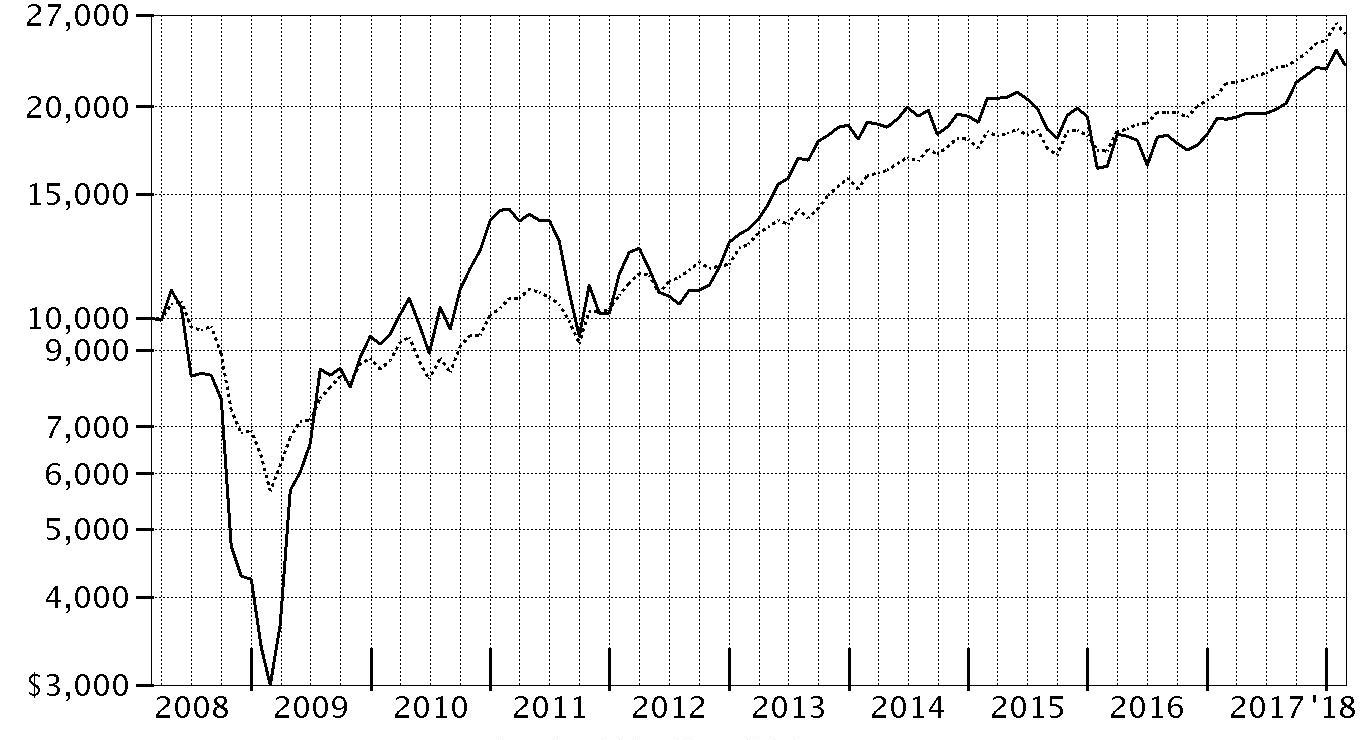
| Period Ending Values |
| $22,871 | Automotive Portfolio |
| $25,307 | S&P 500® Index |
Automotive Portfolio
Management's Discussion of Fund Performance
Market Recap: U.S. equities gained 17.10% for the 12 months ending February 28, 2018, as the S&P 500
® index moved steadily higher throughout 2017 and into 2018 until sharply reversing course in February. Investors remained decidedly upbeat as the calendar turned, and the index rose 5.73% in January. February was a decidedly different story, though, as volatility spiked amid fear that rising inflation and the potential for the economy to overheat would prompt the U.S. Federal Reserve to pick up the pace of interest rate hikes. The index returned -3.69% for the month, its first negative result since October 2016. By sector, information technology fared best by far, gaining 36% amid strong earnings growth from several major index constituents. Consumer discretionary (+22%) also stood out, driven by retailers. Financials added 20%, riding the uptick in bond yields. Conversely, notable laggards included the defensive telecommunication services (-5%) and utilities (-2%) sectors, while rising rates held back real estate (-3%).
Comments from Portfolio Elliot Mattingly: For the year, fund gained 19.08%, outpacing the 13.81% advance of the FactSet Automotive Linked Index; the fund also outperformed the broader S&P 500
®. Favorable stock selection drove the bulk of our performance versus the industry index. Picks within the automobile manufacturers segment helped most. At the stock level, successful timing in automotive software firm Mobileye proved the fund's top individual relative contributor; our position gained 36% in the fund. Our stake in online auto auction firm Copart, our No. 2 relative contributor, gained 51% in the fund. Overweighting electric-vehicle maker Tesla (+37%) also helped. On the downside, overweightings in auto-parts retailers O'Reilly Automotive (-10%) and Autozone (-8%) were among the fund's biggest individual relative detractors. Our underweighting in Fiat Chrysler Automobiles (+94%) also hurt.
The views expressed above reflect those of the portfolio manager(s) only through the end of the period as stated on the cover of this report and do not necessarily represent the views of Fidelity or any other person in the Fidelity organization. Any such views are subject to change at any time based upon market or other conditions and Fidelity disclaims any responsibility to update such views. These views may not be relied on as investment advice and, because investment decisions for a Fidelity fund are based on numerous factors, may not be relied on as an indication of trading intent on behalf of any Fidelity fund.
Notes to Shareholders: On April 1, 2017, the fund's industry benchmark changed from the S&P
® Custom Automobiles & Components Index to the FactSet Automotive Linked Index. Due to new international benchmark guidelines, S&P
® Dow Jones
® Indices stopped offering its brand on custom benchmarks, effective March 31, 2017. Fidelity believes that the new FactSet index will continue to provide shareholders with meaningful performance comparisons.
On December 8, 2017, shareholders approved proposals from the Board of Trustees to eliminate each sector/industry fund's fundamental “invests primarily” policy and to modify the fundamental concentration policy for certain funds. The changes took effect on January 1, 2018, and do not impact how the funds are managed.
Automotive Portfolio
Investment Summary (Unaudited)
Top Ten Stocks as of February 28, 2018
| | % of fund's net assets |
| Honda Motor Co. Ltd. sponsored ADR | 11.0 |
| General Motors Co. | 10.1 |
| Toyota Motor Corp. sponsored ADR | 9.0 |
| Tesla, Inc. | 7.9 |
| Ford Motor Co. | 6.9 |
| O'Reilly Automotive, Inc. | 4.8 |
| Fiat Chrysler Automobiles NV | 4.7 |
| Magna International, Inc. Class A (sub. vtg.) | 4.5 |
| Aptiv PLC | 4.3 |
| AutoZone, Inc. | 4.2 |
| | 67.4 |
Top Industries (% of fund's net assets)
| As of February 28, 2018 |
| | Automobiles | 55.0% |
| | Auto Components | 21.7% |
| | Specialty Retail | 12.0% |
| | Commercial Services & Supplies | 5.8% |
| | Distributors | 3.9% |
| | All Others* | 1.6% |

* Includes short-term investments and net other assets (liabilities).
Automotive Portfolio
Schedule of Investments February 28, 2018
Showing Percentage of Net Assets
| Common Stocks - 99.4% | | | |
| | | Shares | Value |
| Auto Components - 21.7% | | | |
| Auto Parts & Equipment - 21.0% | | | |
| Adient PLC | | 7,000 | $434,420 |
| Aptiv PLC | | 26,058 | 2,379,877 |
| Autoliv, Inc. (a) | | 6,700 | 961,048 |
| BorgWarner, Inc. | | 15,200 | 746,016 |
| Dana Holding Corp. | | 24,000 | 637,680 |
| Delphi Technologies PLC | | 10,152 | 484,758 |
| Gentex Corp. | | 42,300 | 960,633 |
| Lear Corp. | | 10,000 | 1,865,700 |
| Magna International, Inc. Class A (sub. vtg.) | | 45,600 | 2,508,853 |
| Stoneridge, Inc. (b) | | 8,140 | 177,126 |
| Tenneco, Inc. | | 6 | 315 |
| Visteon Corp. (b) | | 5,040 | 624,154 |
| | | | 11,780,580 |
| Tires & Rubber - 0.7% | | | |
| The Goodyear Tire & Rubber Co. | | 13,700 | 396,478 |
|
| TOTAL AUTO COMPONENTS | | | 12,177,058 |
|
| Automobiles - 54.1% | | | |
| Automobile Manufacturers - 53.6% | | | |
| Ferrari NV | | 15,100 | 1,875,571 |
| Fiat Chrysler Automobiles NV | | 125,500 | 2,659,345 |
| Ford Motor Co. | | 364,031 | 3,862,369 |
| General Motors Co. | | 143,514 | 5,647,276 |
| Honda Motor Co. Ltd. sponsored ADR (a) | | 171,695 | 6,196,474 |
| Subaru Corp. | | 10,400 | 364,746 |
| Tesla, Inc. (a)(b) | | 12,900 | 4,425,474 |
| Toyota Motor Corp. sponsored ADR (a) | | 37,717 | 5,076,708 |
| | | | 30,107,963 |
| Motorcycle Manufacturers - 0.5% | | | |
| Harley-Davidson, Inc. (a) | | 6,000 | 272,280 |
|
| TOTAL AUTOMOBILES | | | 30,380,243 |
|
| Chemicals - 0.1% | | | |
| Specialty Chemicals - 0.1% | | | |
| Umicore SA | | 1,009 | 56,878 |
| Commercial Services & Supplies - 5.8% | | | |
| Diversified Support Services - 5.8% | | | |
| Copart, Inc. (b) | | 40,400 | 1,891,124 |
| KAR Auction Services, Inc. | | 25,480 | 1,377,958 |
| | | | 3,269,082 |
| Distributors - 3.9% | | | |
| Distributors - 3.9% | | | |
| Genuine Parts Co. | | 6,600 | 606,144 |
| LKQ Corp. (b) | | 39,500 | 1,559,460 |
| | | | 2,165,604 |
| Household Durables - 0.4% | | | |
| Consumer Electronics - 0.4% | | | |
| Panasonic Corp. | | 14,700 | 228,819 |
| Machinery - 1.4% | | | |
| Construction Machinery & Heavy Trucks - 1.4% | | | |
| Allison Transmission Holdings, Inc. | | 18,800 | 745,044 |
| Specialty Retail - 12.0% | | | |
| Automotive Retail - 12.0% | | | |
| Advance Auto Parts, Inc. | | 2,100 | 239,925 |
| AutoZone, Inc. (b) | | 3,559 | 2,365,738 |
| CarMax, Inc. (b) | | 23,100 | 1,430,352 |
| O'Reilly Automotive, Inc. (b) | | 11,100 | 2,710,509 |
| | | | 6,746,524 |
| Trading Companies & Distributors - 0.0% | | | |
| Trading Companies & Distributors - 0.0% | | | |
| Rush Enterprises, Inc. Class A (b) | | 100 | 4,251 |
| TOTAL COMMON STOCKS | | | |
| (Cost $41,555,829) | | | 55,773,503 |
|
| Nonconvertible Preferred Stocks - 0.9% | | | |
| Automobiles - 0.9% | | | |
| Automobile Manufacturers - 0.9% | | | |
| Volkswagen AG | | | |
| (Cost $381,309) | | 2,700 | 525,254 |
|
| Money Market Funds - 10.8% | | | |
| Fidelity Securities Lending Cash Central Fund 1.42% (c)(d) | | | |
| (Cost $6,056,339) | | 6,055,734 | 6,056,339 |
| TOTAL INVESTMENT IN SECURITIES - 111.1% | | | |
| (Cost $47,993,477) | | | 62,355,096 |
| NET OTHER ASSETS (LIABILITIES) - (11.1)% | | | (6,215,658) |
| NET ASSETS - 100% | | | $56,139,438 |
Legend
(a) Security or a portion of the security is on loan at period end.
(b) Non-income producing
(c) Affiliated fund that is generally available only to investment companies and other accounts managed by Fidelity Investments. The rate quoted is the annualized seven-day yield of the fund at period end. A complete unaudited listing of the fund's holdings as of its most recent quarter end is available upon request. In addition, each Fidelity Central Fund's financial statements, which are not covered by the Fund's Report of Independent Registered Public Accounting Firm, are available on the SEC's website or upon request.
(d) Investment made with cash collateral received from securities on loan.
Affiliated Central Funds
Information regarding fiscal year to date income earned by the Fund from investments in Fidelity Central Funds is as follows:
| Fund | Income earned |
| Fidelity Cash Central Fund | $5,296 |
| Fidelity Securities Lending Cash Central Fund | 60,750 |
| Total | $66,046 |
Amounts in the income column in the above table include any capital gain distributions from underlying funds, which are presented in the corresponding line-item in the Statement of Operations if applicable.
Investment Valuation
The following is a summary of the inputs used, as of February 28, 2018, involving the Fund's assets and liabilities carried at fair value. The inputs or methodology used for valuing securities may not be an indication of the risk associated with investing in those securities. For more information on valuation inputs, and their aggregation into the levels used below, please refer to the Investment Valuation section in the accompanying Notes to Financial Statements.
| | Valuation Inputs at Reporting Date: |
| Description | Total | Level 1 | Level 2 | Level 3 |
| Investments in Securities: | | | | |
| Common Stocks | $55,773,503 | $55,123,060 | $650,443 | $-- |
| Nonconvertible Preferred Stocks | 525,254 | -- | 525,254 | -- |
| Money Market Funds | 6,056,339 | 6,056,339 | -- | -- |
| Total Investments in Securities: | $62,355,096 | $61,179,399 | $1,175,697 | $-- |
The following is a summary of transfers between Level 1 and Level 2 for the period ended February 28, 2018. Transfers are assumed to have occurred at the beginning of the period, and are primarily attributable to the valuation techniques used for foreign equity securities, as discussed in the accompanying Notes to Financial Statements:
| Transfers | Total |
| Level 1 to Level 2 | $1,139,586 |
| Level 2 to Level 1 | $0 |
Other Information
Distribution of investments by country or territory of incorporation, as a percentage of Total Net Assets, is as follows (Unaudited):
| United States of America | 59.4% |
| Japan | 21.1% |
| Netherlands | 8.0% |
| Bailiwick of Jersey | 5.2% |
| Canada | 4.5% |
| Others (Individually Less Than 1%) | 1.8% |
| | 100.0% |
See accompanying notes which are an integral part of the financial statements.
Automotive Portfolio
Financial Statements
Statement of Assets and Liabilities
| | | February 28, 2018 |
| Assets | | |
Investment in securities, at value (including securities loaned of $5,820,400) — See accompanying schedule:
Unaffiliated issuers (cost $41,937,138) | $56,298,757 | |
| Fidelity Central Funds (cost $6,056,339) | 6,056,339 | |
| Total Investment in Securities (cost $47,993,477) | | $62,355,096 |
| Receivable for investments sold | | 971,553 |
| Receivable for fund shares sold | | 17,079 |
| Dividends receivable | | 161,164 |
| Distributions receivable from Fidelity Central Funds | | 5,435 |
| Prepaid expenses | | 156 |
| Other receivables | | 4,432 |
| Total assets | | 63,514,915 |
| Liabilities | | |
| Payable to custodian bank | $377,632 | |
| Payable for investments purchased | 287,858 | |
| Payable for fund shares redeemed | 574,485 | |
| Accrued management fee | 26,611 | |
| Other affiliated payables | 12,347 | |
| Other payables and accrued expenses | 39,944 | |
| Collateral on securities loaned | 6,056,600 | |
| Total liabilities | | 7,375,477 |
| Net Assets | | $56,139,438 |
| Net Assets consist of: | | |
| Paid in capital | | $40,236,795 |
| Undistributed net investment income | | 79,774 |
| Accumulated undistributed net realized gain (loss) on investments and foreign currency transactions | | 1,462,563 |
| Net unrealized appreciation (depreciation) on investments and assets and liabilities in foreign currencies | | 14,360,306 |
| Net Assets, for 1,496,178 shares outstanding | | $56,139,438 |
| Net Asset Value, offering price and redemption price per share ($56,139,438 ÷ 1,496,178 shares) | | $37.52 |
See accompanying notes which are an integral part of the financial statements.
Statement of Operations
| | | Year ended February 28, 2018 |
| Investment Income | | |
| Dividends | | $916,246 |
| Special dividends | | 114,669 |
| Income from Fidelity Central Funds (including $60,750 from security lending) | | 66,046 |
| Total income | | 1,096,961 |
| Expenses | | |
| Management fee | $298,290 | |
| Transfer agent fees | 123,877 | |
| Accounting and security lending fees | 23,278 | |
| Custodian fees and expenses | 13,209 | |
| Independent trustees' fees and expenses | 1,195 | |
| Registration fees | 24,205 | |
| Audit | 40,940 | |
| Legal | 1,009 | |
| Miscellaneous | 4,178 | |
| Total expenses before reductions | 530,181 | |
| Expense reductions | (2,720) | 527,461 |
| Net investment income (loss) | | 569,500 |
| Realized and Unrealized Gain (Loss) | | |
| Net realized gain (loss) on: | | |
| Investment securities: | | |
| Unaffiliated issuers | 8,859,837 | |
| Fidelity Central Funds | (1,519) | |
| Foreign currency transactions | (11,506) | |
| Total net realized gain (loss) | | 8,846,812 |
| Change in net unrealized appreciation (depreciation) on: | | |
| Investment securities: | | |
| Unaffiliated issuers | (368,148) | |
| Fidelity Central Funds | (133) | |
| Assets and liabilities in foreign currencies | 544 | |
| Total change in net unrealized appreciation (depreciation) | | (367,737) |
| Net gain (loss) | | 8,479,075 |
| Net increase (decrease) in net assets resulting from operations | | $9,048,575 |
See accompanying notes which are an integral part of the financial statements.
Statement of Changes in Net Assets
| | Year ended February 28, 2018 | Year ended February 28, 2017 |
| Increase (Decrease) in Net Assets | | |
| Operations | | |
| Net investment income (loss) | $569,500 | $554,402 |
| Net realized gain (loss) | 8,846,812 | 7,164,534 |
| Change in net unrealized appreciation (depreciation) | (367,737) | 1,447,014 |
| Net increase (decrease) in net assets resulting from operations | 9,048,575 | 9,165,950 |
| Distributions to shareholders from net investment income | (298,505) | (804,065) |
| Distributions to shareholders from net realized gain | (8,188,561) | (3,128,021) |
| Total distributions | (8,487,066) | (3,932,086) |
| Share transactions | | |
| Proceeds from sales of shares | 34,198,768 | 20,368,287 |
| Reinvestment of distributions | 8,170,537 | 3,717,039 |
| Cost of shares redeemed | (40,862,610) | (40,996,727) |
| Net increase (decrease) in net assets resulting from share transactions | 1,506,695 | (16,911,401) |
| Redemption fees | 2,072 | 1,913 |
| Total increase (decrease) in net assets | 2,070,276 | (11,675,624) |
| Net Assets | | |
| Beginning of period | 54,069,162 | 65,744,786 |
| End of period | $56,139,438 | $54,069,162 |
| Other Information | | |
| Undistributed net investment income end of period | $79,774 | $– |
| Distributions in excess of net investment income end of period | $– | $(82,188) |
| Shares | | |
| Sold | 882,784 | 560,082 |
| Issued in reinvestment of distributions | 228,135 | 104,277 |
| Redeemed | (1,084,888) | (1,143,684) |
| Net increase (decrease) | 26,031 | (479,325) |
See accompanying notes which are an integral part of the financial statements.
Financial Highlights
Automotive Portfolio
| | | | | | |
| Years ended February 28, | 2018 | 2017 | 2016 A | 2015 | 2014 |
| Selected Per–Share Data | | | | | |
| Net asset value, beginning of period | $36.78 | $33.72 | $48.82 | $56.95 | $40.65 |
| Income from Investment Operations | | | | | |
| Net investment income (loss)B | .39C | .33 | .65 | .42 | .22 |
| Net realized and unrealized gain (loss) | 6.11 | 5.22 | (9.37) | 3.05 | 16.96 |
| Total from investment operations | 6.50 | 5.55 | (8.72) | 3.47 | 17.18 |
| Distributions from net investment income | (.20) | (.52) | (.45) | (.38) | (.15) |
| Distributions from net realized gain | (5.56) | (1.98) | (5.93) | (11.22) | (.73) |
| Total distributions | (5.76) | (2.49)D | (6.38) | (11.60) | (.88) |
| Redemption fees added to paid in capitalB,E | – | – | – | – | – |
| Net asset value, end of period | $37.52 | $36.78 | $33.72 | $48.82 | $56.95 |
| Total ReturnF | 19.08% | 16.80% | (20.00)% | 8.04% | 42.33% |
| Ratios to Average Net AssetsG,H | | | | | |
| Expenses before reductions | .97% | .96% | .87% | .85% | .84% |
| Expenses net of fee waivers, if any | .96% | .96% | .87% | .85% | .84% |
| Expenses net of all reductions | .96% | .95% | .86% | .85% | .83% |
| Net investment income (loss) | 1.04%C | .92% | 1.49% | .82% | .43% |
| Supplemental Data | | | | | |
| Net assets, end of period (000 omitted) | $56,139 | $54,069 | $65,745 | $137,877 | $214,227 |
| Portfolio turnover rateI | 117% | 83% | 80% | 71% | 148% |
A For the year ended February 29.
B Calculated based on average shares outstanding during the period.
C Net Investment income per share reflects a large, non-recurring dividend which amounted to $.08 per share. Excluding this non-recurring dividend, the ratio of net investment income (loss) to average net assets would have been .83%.
D Total distributions of $2.49 per share is comprised of distributions from net investment income of $.515 and distributions from net realized gain of $1.975 per share.
E Amount represents less than $.005 per share.
F Total returns would have been lower if certain expenses had not been reduced during the applicable periods shown.
G Fees and expenses of any underlying Fidelity Central Funds are not included in the Fund's expense ratio. The Fund indirectly bears its proportionate share of the expenses of any underlying Fidelity Central Funds.
H Expense ratios reflect operating expenses of the Fund. Expenses before reductions do not reflect amounts reimbursed by the investment adviser or reductions from brokerage service arrangements or reductions from other expense offset arrangements and do not represent the amount paid by the Fund during periods when reimbursements or reductions occur. Expenses net of fee waivers reflect expenses after reimbursement by the investment adviser but prior to reductions from brokerage service arrangements or other expense offset arrangements. Expenses net of all reductions represent the net expenses paid by the Fund.
I Amount does not include the portfolio activity of any underlying Fidelity Central Funds.
See accompanying notes which are an integral part of the financial statements.
Construction and Housing Portfolio
Performance: The Bottom Line
Average annual total return reflects the change in the value of an investment, assuming reinvestment of distributions from dividend income and capital gains (the profits earned upon the sale of securities that have grown in value, if any) and assuming a constant rate of performance each year. The hypothetical investment and the average annual total returns do not reflect the deduction of taxes that a shareholder would pay on fund distributions or the redemption of fund shares. During periods of reimbursement by Fidelity, a fund’s total return will be greater than it would be had the reimbursement not occurred. How a fund did yesterday is no guarantee of how it will do tomorrow.
Average Annual Total Returns
| For the periods ended February 28, 2018 | Past 1 year | Past 5 years | Past 10 years |
| Construction and Housing Portfolio | 11.07% | 11.46% | 11.26% |
$10,000 Over 10 Years
Let's say hypothetically that $10,000 was invested in Construction and Housing Portfolio on February 29, 2008.
The chart shows how the value of your investment would have changed, and also shows how the S&P 500® Index performed over the same period.
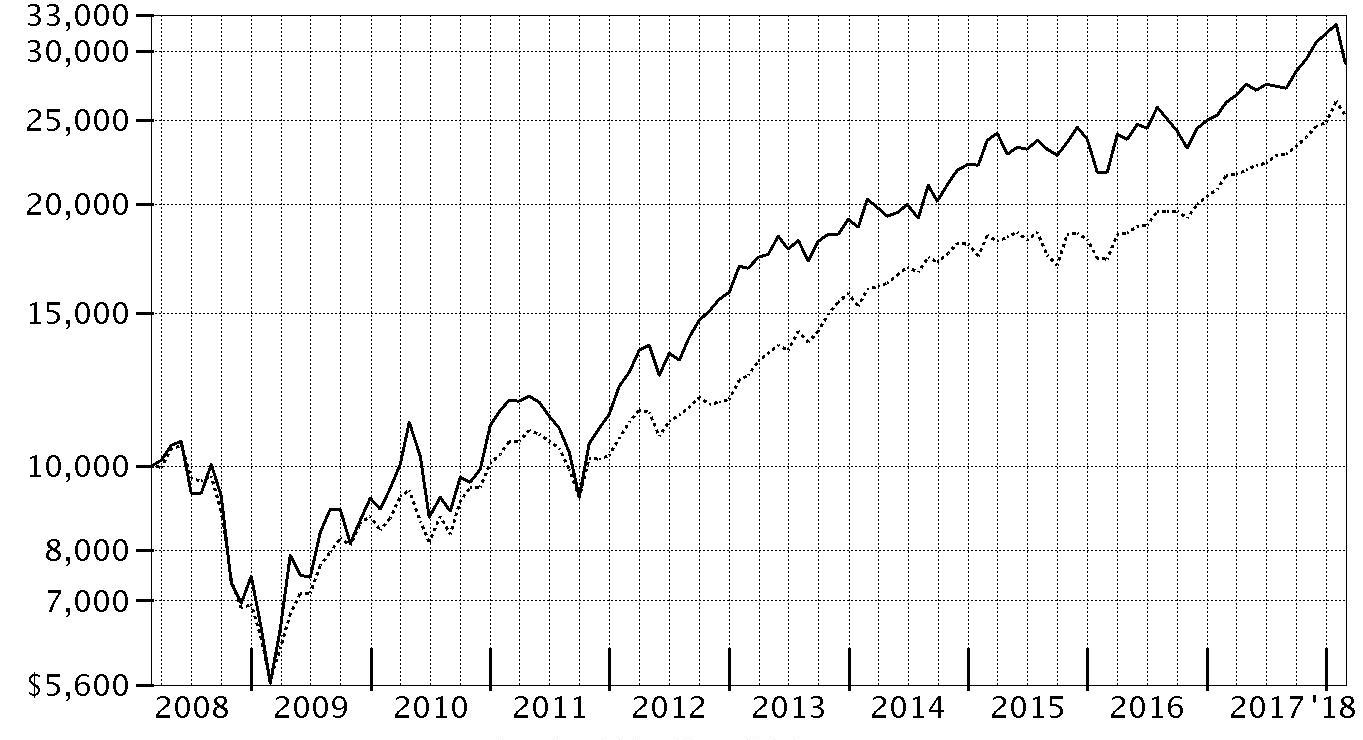
| Period Ending Values |
| $29,060 | Construction and Housing Portfolio |
| $25,307 | S&P 500® Index |
Construction and Housing Portfolio
Management's Discussion of Fund Performance
Market Recap: U.S. equities gained 17.10% for the 12 months ending February 28, 2018, as the S&P 500
® index moved steadily higher throughout 2017 and into 2018 until sharply reversing course in February. The drop was in stark contrast to the low volatility seen throughout 2017, along with consumer sentiment and other market indicators that stayed positive. Investors remained decidedly upbeat as the calendar turned, and the index rose 5.73% in January. February was a decidedly different story, though, as volatility spiked amid fear that rising inflation and the potential for the economy to overheat would prompt the U.S. Federal Reserve to pick up the pace of interest rate hikes. The index returned -3.69% for the month, its first negative result since October 2016. For the full 12 months, growth stocks handily topped value, while large-caps bested small-caps. By sector, information technology fared best by far, gaining 36% amid strong earnings growth from several major index constituents. Consumer discretionary (+22%) also stood out, driven by retailers. Financials added 20%, riding the uptick in bond yields. Materials and industrials rose about 16% each, boosted by higher demand, especially from China. Conversely, notable laggards included the defensive telecommunication services (-5%) and utilities (-2%) sectors, while rising rates held back real estate (-3%).
Comments from Portfolio Manager Neil Nabar: For the year, the fund gained 11.07%, versus 12.01% for the MSCI U.S. IMI Construction & Housing 25/50 Index. The fund and MSCI industry index lagged the S&P 500
®, particularly the last two months of the period as investors locked in profits, long-term mortgage rates rose and U.S. tax reform put new limits on mortgage interest and property tax deductions. Versus the MSCI index, positioning within the home improvement retail group detracted most. In particular, underexposure to Home Depot, which gained about 28%, detracted, as strong execution drove same-store and online sales ahead of its main competitor. A sizable overweighting in residential real estate investment trust (REIT) AvalonBay Communities (-12%) also hurt because an oversupply of multifamily housing and higher interest rates hindered the group. Home Depot and AvalonBay were among our largest holdings at period end. By contrast, stock picks in the building products segment aided relative performance. In terms of individual contributors, a sizable underweighting in Ireland-headquartered industrials conglomerate Johnson Controls International helped most, as the stock declined due to market share losses in the heating, ventilation and air conditioning space.
The views expressed above reflect those of the portfolio manager(s) only through the end of the period as stated on the cover of this report and do not necessarily represent the views of Fidelity or any other person in the Fidelity organization. Any such views are subject to change at any time based upon market or other conditions and Fidelity disclaims any responsibility to update such views. These views may not be relied on as investment advice and, because investment decisions for a Fidelity fund are based on numerous factors, may not be relied on as an indication of trading intent on behalf of any Fidelity fund.
Note to Shareholders: On December 8, 2017, shareholders approved proposals from the Board of Trustees to eliminate each sector/industry fund’s fundamental “invests primarily” policy and to modify the fundamental concentration policy for certain funds. These changes took effect on January 1, 2018, and do not impact how the funds are managed.
Construction and Housing Portfolio
Investment Summary (Unaudited)
Top Ten Stocks as of February 28, 2018
| | % of fund's net assets |
| Home Depot, Inc. | 18.1 |
| Lowe's Companies, Inc. | 14.7 |
| AvalonBay Communities, Inc. | 5.4 |
| Lennar Corp. Class A | 4.8 |
| Equity Residential (SBI) | 4.1 |
| Vulcan Materials Co. | 3.5 |
| Masco Corp. | 3.4 |
| Martin Marietta Materials, Inc. | 2.8 |
| Owens Corning | 2.6 |
| NVR, Inc. | 2.6 |
| | 62.0 |
Top Industries (% of fund's net assets)
| As of February 28, 2018 |
| | Specialty Retail | 32.8% |
| | Equity Real Estate Investment Trusts (Reits) | 17.3% |
| | Building Products | 17.0% |
| | Household Durables | 15.4% |
| | Construction & Engineering | 8.1% |
| | All Others* | 9.4% |

* Includes short-term investments and net other assets (liabilities).
Construction and Housing Portfolio
Schedule of Investments February 28, 2018
Showing Percentage of Net Assets
| Common Stocks - 99.5% | | | |
| | | Shares | Value |
| Building Products - 17.0% | | | |
| Building Products - 17.0% | | | |
| A.O. Smith Corp. | | 93,684 | $6,013,576 |
| Allegion PLC | | 91,400 | 7,687,654 |
| Apogee Enterprises, Inc. | | 79,660 | 3,436,532 |
| Fortune Brands Home & Security, Inc. | | 26,084 | 1,582,255 |
| Johnson Controls International PLC | | 161,154 | 5,941,748 |
| Masco Corp. | | 269,100 | 11,065,392 |
| Masonite International Corp. (a) | | 52,700 | 3,217,335 |
| Owens Corning | | 106,943 | 8,694,466 |
| Patrick Industries, Inc. (a) | | 58,400 | 3,588,680 |
| Simpson Manufacturing Co. Ltd. | | 53,000 | 2,931,960 |
| Trex Co., Inc. (a) | | 20,100 | 2,078,340 |
| | | | 56,237,938 |
| Construction & Engineering - 8.1% | | | |
| Construction & Engineering - 8.1% | | | |
| EMCOR Group, Inc. | | 58,428 | 4,458,641 |
| Granite Construction, Inc. | | 59,800 | 3,474,380 |
| Jacobs Engineering Group, Inc. | | 88,202 | 5,385,614 |
| KBR, Inc. | | 226,654 | 3,431,542 |
| Quanta Services, Inc. (a) | | 176,700 | 6,085,548 |
| Valmont Industries, Inc. | | 28,000 | 4,118,800 |
| | | | 26,954,525 |
| Construction Materials - 6.4% | | | |
| Construction Materials - 6.4% | | | |
| Martin Marietta Materials, Inc. | | 45,344 | 9,247,002 |
| Summit Materials, Inc. | | 10,005 | 316,458 |
| Vulcan Materials Co. | | 98,531 | 11,600,055 |
| | | | 21,163,515 |
| Equity Real Estate Investment Trusts (REITs) - 17.3% | | | |
| Residential REITs - 16.2% | | | |
| AvalonBay Communities, Inc. | | 115,498 | 18,019,998 |
| Camden Property Trust (SBI) | | 85,822 | 6,840,872 |
| Education Realty Trust, Inc. | | 74,100 | 2,307,474 |
| Equity Lifestyle Properties, Inc. | | 76,987 | 6,513,870 |
| Equity Residential (SBI) | | 244,600 | 13,753,858 |
| Invitation Homes, Inc. | | 285,200 | 6,203,100 |
| | | | 53,639,172 |
| Specialized REITs - 1.1% | | | |
| Equinix, Inc. | | 9,300 | 3,646,530 |
|
| TOTAL EQUITY REAL ESTATE INVESTMENT TRUSTS (REITS) | | | 57,285,702 |
|
| Household Durables - 15.4% | | | |
| Home Furnishings - 1.4% | | | |
| Mohawk Industries, Inc. (a) | | 19,853 | 4,762,338 |
| Homebuilding - 14.0% | | | |
| Lennar Corp.: | | | |
| Class A | | 279,910 | 15,837,308 |
| Class B | | 4,254 | 192,961 |
| M/I Homes, Inc. | | 34,800 | 1,010,940 |
| NVR, Inc. (a) | | 3,030 | 8,614,805 |
| PulteGroup, Inc. | | 290,400 | 8,151,528 |
| Taylor Morrison Home Corp. (a) | | 244,701 | 5,491,090 |
| TopBuild Corp. (a) | | 30,372 | 2,115,106 |
| TRI Pointe Homes, Inc. (a) | | 312,100 | 4,784,493 |
| | | | 46,198,231 |
|
| TOTAL HOUSEHOLD DURABLES | | | 50,960,569 |
|
| Real Estate Management & Development - 2.0% | | | |
| Real Estate Development - 1.4% | | | |
| Howard Hughes Corp. (a) | | 36,292 | 4,652,271 |
| Real Estate Operating Company - 0.6% | | | |
| The RMR Group, Inc. | | 33,415 | 2,098,462 |
|
| TOTAL REAL ESTATE MANAGEMENT & DEVELOPMENT | | | 6,750,733 |
|
| Specialty Retail - 32.8% | | | |
| Home Improvement Retail - 32.8% | | | |
| Home Depot, Inc. | | 329,460 | 60,050,675 |
| Lowe's Companies, Inc. | | 542,070 | 48,564,051 |
| | | | 108,614,726 |
| Trading Companies & Distributors - 0.5% | | | |
| Trading Companies & Distributors - 0.5% | | | |
| BMC Stock Holdings, Inc. (a) | | 93,045 | 1,744,594 |
| TOTAL COMMON STOCKS | | | |
| (Cost $234,385,568) | | | 329,712,302 |
|
| Convertible Preferred Stocks - 0.0% | | | |
| Household Durables - 0.0% | | | |
| Homebuilding - 0.0% | | | |
| Blu Homes, Inc. Series A, 5.00% (a)(b)(c) | | | |
| (Cost $4,000,001) | | 865,801 | 17,316 |
|
| Money Market Funds - 0.6% | | | |
| Fidelity Cash Central Fund, 1.41% (d) | | | |
| (Cost $2,111,957) | | 2,111,535 | 2,111,957 |
| TOTAL INVESTMENT IN SECURITIES - 100.1% | | | |
| (Cost $240,497,526) | | | 331,841,575 |
| NET OTHER ASSETS (LIABILITIES) - (0.1)% | | | (423,504) |
| NET ASSETS - 100% | | | $331,418,071 |
Legend
(a) Non-income producing
(b) Restricted securities - Investment in securities not registered under the Securities Act of 1933 (excluding 144A issues). At the end of the period, the value of restricted securities (excluding 144A issues) amounted to $17,316 or 0.0% of net assets.
(c) Level 3 security
(d) Affiliated fund that is generally available only to investment companies and other accounts managed by Fidelity Investments. The rate quoted is the annualized seven-day yield of the fund at period end. A complete unaudited listing of the fund's holdings as of its most recent quarter end is available upon request. In addition, each Fidelity Central Fund's financial statements, which are not covered by the Fund's Report of Independent Registered Public Accounting Firm, are available on the SEC's website or upon request.
Additional information on each restricted holding is as follows:
| Security | Acquisition Date | Acquisition Cost |
| Blu Homes, Inc. Series A, 5.00% | 6/10/13 | $4,000,001 |
Affiliated Central Funds
Information regarding fiscal year to date income earned by the Fund from investments in Fidelity Central Funds is as follows:
| Fund | Income earned |
| Fidelity Cash Central Fund | $31,288 |
| Fidelity Securities Lending Cash Central Fund | 5,407 |
| Total | $36,695 |
Amounts in the income column in the above table include any capital gain distributions from underlying funds, which are presented in the corresponding line-item in the Statement of Operations if applicable.
Investment Valuation
The following is a summary of the inputs used, as of February 28, 2018, involving the Fund's assets and liabilities carried at fair value. The inputs or methodology used for valuing securities may not be an indication of the risk associated with investing in those securities. For more information on valuation inputs, and their aggregation into the levels used below, please refer to the Investment Valuation section in the accompanying Notes to Financial Statements.
| | Valuation Inputs at Reporting Date: |
| Description | Total | Level 1 | Level 2 | Level 3 |
| Investments in Securities: | | | | |
| Common Stocks | $329,712,302 | $329,712,302 | $-- | $-- |
| Convertible Preferred Stocks | 17,316 | -- | -- | 17,316 |
| Money Market Funds | 2,111,957 | 2,111,957 | -- | -- |
| Total Investments in Securities: | $331,841,575 | $331,824,259 | $-- | $17,316 |
See accompanying notes which are an integral part of the financial statements.
Construction and Housing Portfolio
Financial Statements
Statement of Assets and Liabilities
| | | February 28, 2018 |
| Assets | | |
Investment in securities, at value — See accompanying schedule:
Unaffiliated issuers (cost $238,385,569) | $329,729,618 | |
| Fidelity Central Funds (cost $2,111,957) | 2,111,957 | |
| Total Investment in Securities (cost $240,497,526) | | $331,841,575 |
| Receivable for investments sold | | 2,359,905 |
| Receivable for fund shares sold | | 410,122 |
| Dividends receivable | | 67,894 |
| Distributions receivable from Fidelity Central Funds | | 2,146 |
| Prepaid expenses | | 1,338 |
| Other receivables | | 7,690 |
| Total assets | | 334,690,670 |
| Liabilities | | |
| Payable for investments purchased | $571,675 | |
| Payable for fund shares redeemed | 2,430,052 | |
| Accrued management fee | 159,461 | |
| Other affiliated payables | 68,039 | |
| Other payables and accrued expenses | 43,372 | |
| Total liabilities | | 3,272,599 |
| Net Assets | | $331,418,071 |
| Net Assets consist of: | | |
| Paid in capital | | $225,588,228 |
| Undistributed net investment income | | 515,582 |
| Accumulated undistributed net realized gain (loss) on investments | | 13,970,212 |
| Net unrealized appreciation (depreciation) on investments | | 91,344,049 |
| Net Assets, for 5,534,527 shares outstanding | | $331,418,071 |
| Net Asset Value, offering price and redemption price per share ($331,418,071 ÷ 5,534,527 shares) | | $59.88 |
See accompanying notes which are an integral part of the financial statements.
Statement of Operations
| | | Year ended February 28, 2018 |
| Investment Income | | |
| Dividends | | $5,587,486 |
| Income from Fidelity Central Funds (including $5,407 from security lending) | | 36,695 |
| Total income | | 5,624,181 |
| Expenses | | |
| Management fee | $2,062,327 | |
| Transfer agent fees | 706,021 | |
| Accounting and security lending fees | 148,033 | |
| Custodian fees and expenses | 9,947 | |
| Independent trustees' fees and expenses | 8,312 | |
| Registration fees | 39,689 | |
| Audit | 40,415 | |
| Legal | 5,969 | |
| Interest | 420 | |
| Miscellaneous | 17,013 | |
| Total expenses before reductions | 3,038,146 | |
| Expense reductions | (22,595) | 3,015,551 |
| Net investment income (loss) | | 2,608,630 |
| Realized and Unrealized Gain (Loss) | | |
| Net realized gain (loss) on: | | |
| Investment securities: | | |
| Unaffiliated issuers | 61,747,375 | |
| Fidelity Central Funds | (415) | |
| Total net realized gain (loss) | | 61,746,960 |
| Change in net unrealized appreciation (depreciation) on investment securities | | (25,870,943) |
| Net gain (loss) | | 35,876,017 |
| Net increase (decrease) in net assets resulting from operations | | $38,484,647 |
See accompanying notes which are an integral part of the financial statements.
Statement of Changes in Net Assets
| | Year ended February 28, 2018 | Year ended February 28, 2017 |
| Increase (Decrease) in Net Assets | | |
| Operations | | |
| Net investment income (loss) | $2,608,630 | $2,871,772 |
| Net realized gain (loss) | 61,746,960 | 45,337,281 |
| Change in net unrealized appreciation (depreciation) | (25,870,943) | 31,572,029 |
| Net increase (decrease) in net assets resulting from operations | 38,484,647 | 79,781,082 |
| Distributions to shareholders from net investment income | (1,543,811) | (2,958,507) |
| Distributions to shareholders from net realized gain | (46,308,729) | (10,930,766) |
| Total distributions | (47,852,540) | (13,889,273) |
| Share transactions | | |
| Proceeds from sales of shares | 131,533,408 | 139,679,030 |
| Reinvestment of distributions | 45,604,178 | 13,323,889 |
| Cost of shares redeemed | (240,882,477) | (263,677,954) |
| Net increase (decrease) in net assets resulting from share transactions | (63,744,891) | (110,675,035) |
| Redemption fees | 5,063 | 5,822 |
| Total increase (decrease) in net assets | (73,107,721) | (44,777,404) |
| Net Assets | | |
| Beginning of period | 404,525,792 | 449,303,196 |
| End of period | $331,418,071 | $404,525,792 |
| Other Information | | |
| Undistributed net investment income end of period | $515,582 | $– |
| Distributions in excess of net investment income end of period | $– | $(84,156) |
| Shares | | |
| Sold | 2,043,349 | 2,347,435 |
| Issued in reinvestment of distributions | 729,117 | 225,218 |
| Redeemed | (3,793,864) | (4,467,875) |
| Net increase (decrease) | (1,021,398) | (1,895,222) |
See accompanying notes which are an integral part of the financial statements.
Financial Highlights
Construction and Housing Portfolio
| | | | | | |
| Years ended February 28, | 2018 | 2017 | 2016 A | 2015 | 2014 |
| Selected Per–Share Data | | | | | |
| Net asset value, beginning of period | $61.70 | $53.16 | $59.74 | $57.48 | $52.01 |
| Income from Investment Operations | | | | | |
| Net investment income (loss)B | .44 | .37 | .33 | .29 | .26 |
| Net realized and unrealized gain (loss) | 6.58 | 10.29 | (5.02) | 8.53 | 9.65 |
| Total from investment operations | 7.02 | 10.66 | (4.69) | 8.82 | 9.91 |
| Distributions from net investment income | (.30) | (.45) | (.23) | (.29) | (.30) |
| Distributions from net realized gain | (8.53) | (1.67) | (1.66) | (6.28) | (4.14) |
| Total distributions | (8.84)C | (2.12) | (1.89) | (6.56)D | (4.44) |
| Redemption fees added to paid in capitalB,E | – | – | – | – | – |
| Net asset value, end of period | $59.88 | $61.70 | $53.16 | $59.74 | $57.48 |
| Total ReturnF | 11.07% | 20.23% | (8.11)% | 16.99% | 19.84% |
| Ratios to Average Net AssetsG,H | | | | | |
| Expenses before reductions | .80% | .80% | .81% | .82% | .81% |
| Expenses net of fee waivers, if any | .80% | .80% | .80% | .82% | .81% |
| Expenses net of all reductions | .79% | .79% | .80% | .82% | .81% |
| Net investment income (loss) | .69% | .62% | .57% | .52% | .47% |
| Supplemental Data | | | | | |
| Net assets, end of period (000 omitted) | $331,418 | $404,526 | $449,303 | $419,479 | $376,750 |
| Portfolio turnover rateI | 56% | 87% | 80% | 71% | 53% |
A For the year ended February 29.
B Calculated based on average shares outstanding during the period.
C Total distributions of $8.84 per share is comprised of distributions from net investment income of $.303 and distributions from net realized gain of $8.534 per share.
D Total distributions of $6.56 per share is comprised of distributions from net investment income of $.287 and distributions from net realized gain of $6.276 per share.
E Amount represents less than $.005 per share.
F Total returns would have been lower if certain expenses had not been reduced during the applicable periods shown.
G Fees and expenses of any underlying Fidelity Central Funds are not included in the Fund's expense ratio. The Fund indirectly bears its proportionate share of the expenses of any underlying Fidelity Central Funds.
H Expense ratios reflect operating expenses of the Fund. Expenses before reductions do not reflect amounts reimbursed by the investment adviser or reductions from brokerage service arrangements or reductions from other expense offset arrangements and do not represent the amount paid by the Fund during periods when reimbursements or reductions occur. Expenses net of fee waivers reflect expenses after reimbursement by the investment adviser but prior to reductions from brokerage service arrangements or other expense offset arrangements. Expenses net of all reductions represent the net expenses paid by the Fund.
I Amount does not include the portfolio activity of any underlying Fidelity Central Funds.
See accompanying notes which are an integral part of the financial statements.
Consumer Discretionary Portfolio
Performance: The Bottom Line
Average annual total return reflects the change in the value of an investment, assuming reinvestment of distributions from dividend income and capital gains (the profits earned upon the sale of securities that have grown in value, if any) and assuming a constant rate of performance each year. The hypothetical investment and the average annual total returns do not reflect the deduction of taxes that a shareholder would pay on fund distributions or the redemption of fund shares. During periods of reimbursement by Fidelity, a fund’s total return will be greater than it would be had the reimbursement not occurred. How a fund did yesterday is no guarantee of how it will do tomorrow.
Average Annual Total Returns
| For the periods ended February 28, 2018 | Past 1 year | Past 5 years | Past 10 years |
| Consumer Discretionary Portfolio | 22.79% | 15.43% | 12.72% |
$10,000 Over 10 Years
Let's say hypothetically that $10,000 was invested in Consumer Discretionary Portfolio on February 29, 2008.
The chart shows how the value of your investment would have changed, and also shows how the S&P 500® Index performed over the same period.
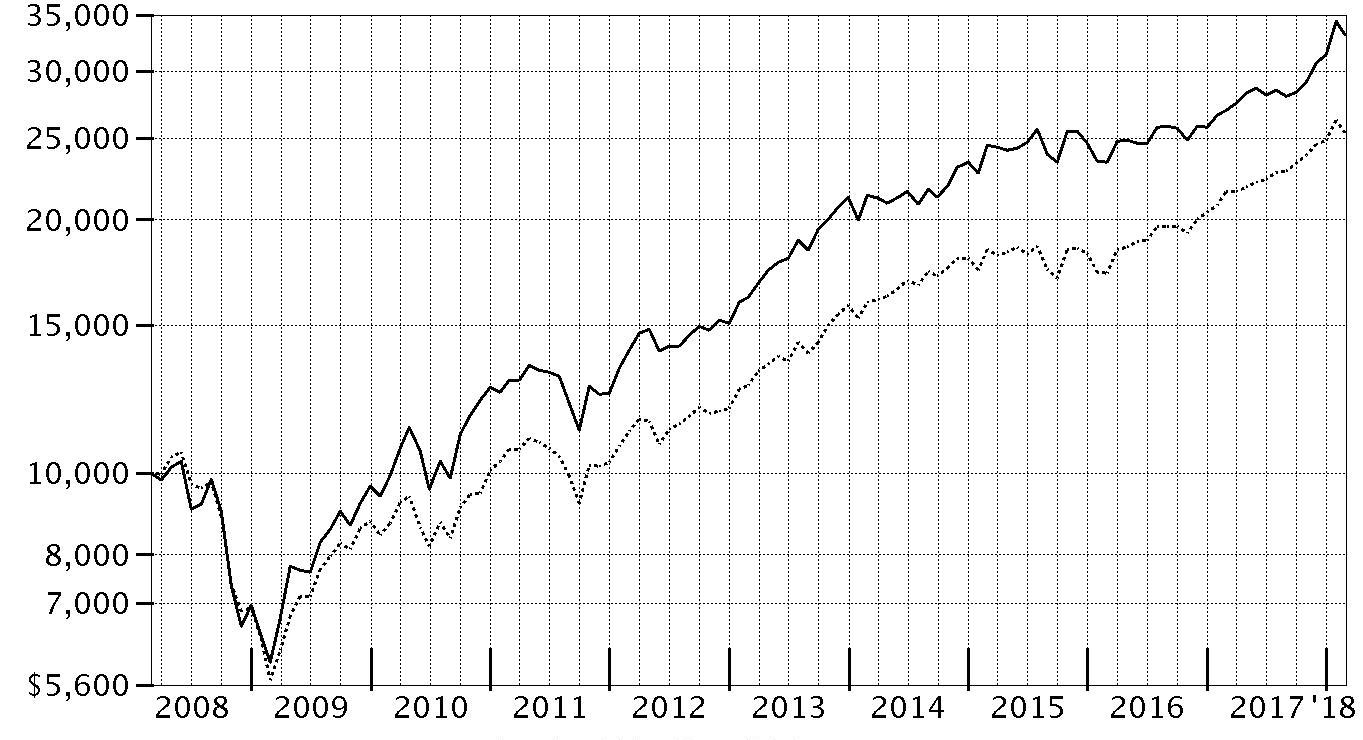
| Period Ending Values |
| $33,101 | Consumer Discretionary Portfolio |
| $25,307 | S&P 500® Index |
Consumer Discretionary Portfolio
Management's Discussion of Fund Performance
Market Recap: U.S. equities gained 17.10% for the 12 months ending February 28, 2018, as the S&P 500
® index moved steadily higher throughout 2017 and into 2018 until sharply reversing course in February. The drop was in stark contrast to the low volatility seen throughout 2017, along with consumer sentiment and other market indicators that stayed positive. Investors remained decidedly upbeat as the calendar turned, and the index rose 5.73% in January. February was a decidedly different story, though, as volatility spiked amid fear that rising inflation and the potential for the economy to overheat would prompt the U.S. Federal Reserve to pick up the pace of interest rate hikes. The index returned -3.69% for the month, its first negative result since October 2016. For the full 12 months, growth stocks handily topped value, while large-caps bested small-caps. By sector, information technology fared best by far, gaining 36% amid strong earnings growth from several major index constituents. Consumer discretionary (+22%) also stood out, driven by retailers. Financials added 20%, riding the uptick in bond yields. Materials and industrials rose about 16% each, boosted by higher demand, especially from China. Conversely, notable laggards included the defensive telecommunication services (-5%) and utilities (-2%) sectors, while rising rates held back real estate (-3%).
Comments from Portfolio Manager Katherine Shaw: For the year, fund gained 22.79%, outpacing the 21.40% advance of the MSCI U.S. IMI Consumer Discretionary 25/50 Index, as well as the broad-market S&P 500
® index. Consumer discretionary stocks rode atop myriad positives this period, including a surge in business and consumer sentiment, low unemployment, wage growth, and a sweeping tax-reform bill that drove optimism about consumer spending in 2018. Versus the MSCI sector index, the top contributor by far was the fund’s overweighting in online retailing giant Amazon.com (+79%). Avoiding underperforming index components Newell Brands (-46%) and Ford Motor (-10%) also helped. Conversely – and despite a positive result for the fund – an outsized stake in apparel retailer L Brands during the period’s first half proved the fund’s largest individual detractor; in the sector index, the stock declined slightly for the full 12 months.
The views expressed above reflect those of the portfolio manager(s) only through the end of the period as stated on the cover of this report and do not necessarily represent the views of Fidelity or any other person in the Fidelity organization. Any such views are subject to change at any time based upon market or other conditions and Fidelity disclaims any responsibility to update such views. These views may not be relied on as investment advice and, because investment decisions for a Fidelity fund are based on numerous factors, may not be relied on as an indication of trading intent on behalf of any Fidelity fund.
Note to shareholders: On December 8, 2017, shareholders approved proposals from the Board of Trustees to eliminate each sector/industry fund's fundamental “invests primarily” policy and to modify the fundamental concentration policy for certain funds. The changes took effect on January 1, 2018, and do not impact how the funds are managed.
Consumer Discretionary Portfolio
Investment Summary (Unaudited)
Top Ten Stocks as of February 28, 2018
| | % of fund's net assets |
| Amazon.com, Inc. | 17.7 |
| Home Depot, Inc. | 7.4 |
| The Walt Disney Co. | 3.8 |
| McDonald's Corp. | 3.7 |
| Comcast Corp. Class A | 3.6 |
| Charter Communications, Inc. Class A | 3.5 |
| Netflix, Inc. | 3.3 |
| Dollar Tree, Inc. | 3.0 |
| The Booking Holdings, Inc. | 2.8 |
| Lowe's Companies, Inc. | 2.6 |
| | 51.4 |
Top Industries (% of fund's net assets)
| As of February 28, 2018 |
| | Internet & Direct Marketing Retail | 24.4% |
| | Hotels, Restaurants & Leisure | 24.2% |
| | Specialty Retail | 17.3% |
| | Media | 12.8% |
| | Textiles, Apparel & Luxury Goods | 5.0% |
| | All Others* | 16.3% |

* Includes short-term investments and net other assets (liabilities).
Consumer Discretionary Portfolio
Schedule of Investments February 28, 2018
Showing Percentage of Net Assets
| Common Stocks - 99.5% | | | |
| | | Shares | Value |
| Air Freight & Logistics - 0.1% | | | |
| Air Freight & Logistics - 0.1% | | | |
| XPO Logistics, Inc. (a) | | 8,800 | $866,184 |
| Auto Components - 0.2% | | | |
| Auto Parts & Equipment - 0.2% | | | |
| Aptiv PLC | | 17,700 | 1,616,541 |
| Tenneco, Inc. | | 1,000 | 52,550 |
| | | | 1,669,091 |
| Automobiles - 2.3% | | | |
| Automobile Manufacturers - 2.3% | | | |
| Ferrari NV | | 12,600 | 1,565,046 |
| General Motors Co. | | 51,400 | 2,022,590 |
| Tesla, Inc. (a) | | 38,700 | 13,276,422 |
| Thor Industries, Inc. | | 15,700 | 2,025,300 |
| | | | 18,889,358 |
| Beverages - 0.8% | | | |
| Distillers & Vintners - 0.7% | | | |
| Constellation Brands, Inc. Class A (sub. vtg.) | | 24,000 | 5,171,520 |
| Soft Drinks - 0.1% | | | |
| Monster Beverage Corp. (a) | | 16,820 | 1,065,883 |
|
| TOTAL BEVERAGES | | | 6,237,403 |
|
| Building Products - 0.1% | | | |
| Building Products - 0.1% | | | |
| Masco Corp. | | 29,700 | 1,221,264 |
| Chemicals - 0.0% | | | |
| Specialty Chemicals - 0.0% | | | |
| Sherwin-Williams Co. | | 600 | 240,948 |
| Commercial Services & Supplies - 0.2% | | | |
| Diversified Support Services - 0.2% | | | |
| Copart, Inc. (a) | | 31,200 | 1,460,472 |
| Distributors - 0.7% | | | |
| Distributors - 0.7% | | | |
| LKQ Corp. (a) | | 105,400 | 4,161,192 |
| Pool Corp. | | 9,629 | 1,329,091 |
| | | | 5,490,283 |
| Diversified Consumer Services - 0.7% | | | |
| Education Services - 0.5% | | | |
| Adtalem Global Education, Inc. (a) | | 16,200 | 746,010 |
| Grand Canyon Education, Inc. (a) | | 25,900 | 2,542,085 |
| New Oriental Education & Technology Group, Inc. sponsored ADR | | 9,300 | 849,927 |
| | | | 4,138,022 |
| Specialized Consumer Services - 0.2% | | | |
| Service Corp. International | | 10,600 | 396,758 |
| ServiceMaster Global Holdings, Inc. (a) | | 23,100 | 1,186,416 |
| | | | 1,583,174 |
|
| TOTAL DIVERSIFIED CONSUMER SERVICES | | | 5,721,196 |
|
| Electronic Equipment & Components - 0.1% | | | |
| Electronic Equipment & Instruments - 0.1% | | | |
| ADT, Inc. (a) | | 70,200 | 741,312 |
| Food & Staples Retailing - 1.1% | | | |
| Food Distributors - 0.8% | | | |
| Performance Food Group Co. (a) | | 200,900 | 6,157,585 |
| Hypermarkets & Super Centers - 0.3% | | | |
| Costco Wholesale Corp. | | 6,000 | 1,145,400 |
| Walmart, Inc. | | 17,000 | 1,530,170 |
| | | | 2,675,570 |
|
| TOTAL FOOD & STAPLES RETAILING | | | 8,833,155 |
|
| Health Care Providers & Services - 0.0% | | | |
| Health Care Services - 0.0% | | | |
| National Vision Holdings, Inc. | | 3,600 | 124,416 |
| Hotels, Restaurants & Leisure - 24.2% | | | |
| Casinos & Gaming - 4.1% | | | |
| Boyd Gaming Corp. | | 36,000 | 1,273,680 |
| Caesars Entertainment Corp. (a) | | 164,900 | 2,094,230 |
| Churchill Downs, Inc. | | 4,700 | 1,213,540 |
| Eldorado Resorts, Inc. (a) | | 103,000 | 3,512,300 |
| Las Vegas Sands Corp. | | 169,652 | 12,352,362 |
| Melco Crown Entertainment Ltd. sponsored ADR | | 34,800 | 955,260 |
| MGM Mirage, Inc. | | 224,300 | 7,677,789 |
| Penn National Gaming, Inc. (a) | | 71,423 | 1,900,566 |
| PlayAGS, Inc. (a) | | 25,800 | 534,318 |
| Wynn Resorts Ltd. | | 13,900 | 2,328,250 |
| | | | 33,842,295 |
| Hotels, Resorts & Cruise Lines - 8.4% | | | |
| Accor SA | | 11,700 | 674,356 |
| Bluegreen Vacations Corp. | | 97,800 | 1,891,452 |
| Carnival Corp. | | 94,400 | 6,316,304 |
| Hilton Grand Vacations, Inc. (a) | | 61,887 | 2,671,043 |
| Hilton Worldwide Holdings, Inc. | | 168,100 | 13,580,799 |
| Hyatt Hotels Corp. Class A | | 25,600 | 1,978,112 |
| ILG, Inc. | | 29,100 | 883,476 |
| Marriott International, Inc. Class A | | 93,933 | 13,264,279 |
| Marriott Vacations Worldwide Corp. | | 30,188 | 4,241,414 |
| Royal Caribbean Cruises Ltd. | | 108,725 | 13,764,585 |
| Wyndham Worldwide Corp. | | 84,200 | 9,748,676 |
| | | | 69,014,496 |
| Leisure Facilities - 1.1% | | | |
| Cedar Fair LP (depositary unit) | | 10,600 | 708,186 |
| Drive Shack, Inc. | | 18,618 | 94,021 |
| Planet Fitness, Inc. (a) | | 12,800 | 473,344 |
| Vail Resorts, Inc. | | 35,089 | 7,223,772 |
| | | | 8,499,323 |
| Restaurants - 10.6% | | | |
| ARAMARK Holdings Corp. | | 73,200 | 3,053,172 |
| Compass Group PLC | | 25,500 | 541,753 |
| Darden Restaurants, Inc. | | 42,100 | 3,881,199 |
| Del Frisco's Restaurant Group, Inc. (a) | | 47,800 | 795,870 |
| Del Taco Restaurants, Inc. (a) | | 22,828 | 287,633 |
| DineEquity, Inc. | | 6,000 | 455,880 |
| Domino's Pizza, Inc. | | 20,000 | 4,448,200 |
| Dunkin' Brands Group, Inc. | | 69,900 | 4,186,311 |
| Jack in the Box, Inc. | | 15,277 | 1,376,152 |
| McDonald's Corp. | | 193,300 | 30,491,142 |
| Papa John's International, Inc. | | 8,300 | 479,242 |
| Restaurant Brands International, Inc. | | 58,210 | 3,411,763 |
| Ruth's Hospitality Group, Inc. | | 41,728 | 1,024,422 |
| Shake Shack, Inc. Class A (a)(b) | | 22,600 | 881,174 |
| Starbucks Corp. | | 340,962 | 19,468,930 |
| Texas Roadhouse, Inc. Class A | | 39,700 | 2,193,822 |
| U.S. Foods Holding Corp. (a) | | 163,467 | 5,458,163 |
| Wingstop, Inc. | | 51,417 | 2,329,704 |
| Yum! Brands, Inc. | | 25,800 | 2,099,604 |
| | | | 86,864,136 |
|
| TOTAL HOTELS, RESTAURANTS & LEISURE | | | 198,220,250 |
|
| Household Durables - 2.3% | | | |
| Home Furnishings - 0.2% | | | |
| Mohawk Industries, Inc. (a) | | 8,305 | 1,992,203 |
| Homebuilding - 2.0% | | | |
| Cavco Industries, Inc. (a) | | 7,200 | 1,145,520 |
| D.R. Horton, Inc. | | 125,200 | 5,245,880 |
| Lennar Corp.: | | | |
| Class A | | 69,400 | 3,926,652 |
| Class B | | 1,158 | 52,527 |
| LGI Homes, Inc. (a) | | 7,500 | 424,425 |
| New Home Co. LLC (a) | | 31,400 | 352,936 |
| NVR, Inc. (a) | | 956 | 2,718,071 |
| Taylor Morrison Home Corp. (a) | | 23,000 | 516,120 |
| TopBuild Corp. (a) | | 2,300 | 160,172 |
| TRI Pointe Homes, Inc. (a) | | 98,600 | 1,511,538 |
| | | | 16,053,841 |
| Household Appliances - 0.1% | | | |
| Techtronic Industries Co. Ltd. | | 191,000 | 1,198,333 |
|
| TOTAL HOUSEHOLD DURABLES | | | 19,244,377 |
|
| Internet & Direct Marketing Retail - 24.4% | | | |
| Internet & Direct Marketing Retail - 24.4% | | | |
| Amazon.com, Inc. (a) | | 95,600 | 144,590,219 |
| Boohoo.Com PLC (a) | | 331,000 | 841,727 |
| Liberty Interactive Corp. QVC Group Series A (a) | | 150,810 | 4,353,885 |
| Netflix, Inc. (a) | | 93,679 | 27,296,187 |
| The Booking Holdings, Inc. (a) | | 11,042 | 22,459,870 |
| Wayfair LLC Class A (a) | | 2,600 | 201,292 |
| Zalando SE (a) | | 4,100 | 233,333 |
| | | | 199,976,513 |
| Internet Software & Services - 1.0% | | | |
| Internet Software & Services - 1.0% | | | |
| 2U, Inc. (a) | | 31,600 | 2,615,848 |
| Alphabet, Inc. Class A (a) | | 3,500 | 3,863,720 |
| CarGurus, Inc. Class A | | 1,100 | 35,508 |
| Facebook, Inc. Class A (a) | | 9,800 | 1,747,536 |
| | | | 8,262,612 |
| IT Services - 0.4% | | | |
| Data Processing & Outsourced Services - 0.4% | | | |
| Global Payments, Inc. | | 10,800 | 1,224,612 |
| PayPal Holdings, Inc. (a) | | 25,400 | 2,017,014 |
| | | | 3,241,626 |
| Leisure Products - 0.5% | | | |
| Leisure Products - 0.5% | | | |
| Mattel, Inc. (b) | | 280,100 | 4,453,590 |
| Media - 12.8% | | | |
| Advertising - 0.1% | | | |
| Interpublic Group of Companies, Inc. | | 11,400 | 266,760 |
| Broadcasting - 0.1% | | | |
| CBS Corp. Class B | | 20,400 | 1,080,588 |
| Cable & Satellite - 7.5% | | | |
| Charter Communications, Inc. Class A (a) | | 84,869 | 29,019,257 |
| Comcast Corp. Class A | | 821,247 | 29,737,354 |
| DISH Network Corp. Class A (a) | | 21,800 | 908,842 |
| Naspers Ltd. Class N | | 7,700 | 2,090,180 |
| | | | 61,755,633 |
| Movies & Entertainment - 5.1% | | | |
| Cinemark Holdings, Inc. | | 87,481 | 3,723,191 |
| Liberty Media Corp. Liberty Formula One Group Series C (a) | | 20,200 | 665,186 |
| Lions Gate Entertainment Corp. Class B | | 3,400 | 91,256 |
| Live Nation Entertainment, Inc. (a) | | 23,300 | 1,043,840 |
| The Walt Disney Co. | | 302,847 | 31,241,697 |
| Time Warner, Inc. | | 44,700 | 4,155,312 |
| Twenty-First Century Fox, Inc. Class A | | 22,500 | 828,450 |
| | | | 41,748,932 |
|
| TOTAL MEDIA | | | 104,851,913 |
|
| Multiline Retail - 4.7% | | | |
| Department Stores - 0.3% | | | |
| Kohl's Corp. | | 13,500 | 892,215 |
| Macy's, Inc. | | 53,000 | 1,558,730 |
| | | | 2,450,945 |
| General Merchandise Stores - 4.4% | | | |
| B&M European Value Retail S.A. | | 243,668 | 1,378,553 |
| Dollar General Corp. | | 73,800 | 6,980,742 |
| Dollar Tree, Inc. (a) | | 242,221 | 24,861,563 |
| Ollie's Bargain Outlet Holdings, Inc. (a) | | 11,600 | 688,460 |
| Target Corp. | | 30,900 | 2,330,169 |
| | | | 36,239,487 |
|
| TOTAL MULTILINE RETAIL | | | 38,690,432 |
|
| Personal Products - 0.0% | | | |
| Personal Products - 0.0% | | | |
| Estee Lauder Companies, Inc. Class A | | 2,800 | 387,632 |
| Real Estate Management & Development - 0.1% | | | |
| Real Estate Services - 0.1% | | | |
| Redfin Corp. (b) | | 32,100 | 660,939 |
| Software - 0.2% | | | |
| Application Software - 0.1% | | | |
| Adobe Systems, Inc. (a) | | 3,100 | 648,303 |
| Home Entertainment Software - 0.1% | | | |
| Activision Blizzard, Inc. | | 11,400 | 833,682 |
|
| TOTAL SOFTWARE | | | 1,481,985 |
|
| Specialty Retail - 17.3% | | | |
| Apparel Retail - 4.7% | | | |
| Burlington Stores, Inc. (a) | | 76,900 | 9,431,016 |
| Inditex SA | | 26,401 | 799,321 |
| Ross Stores, Inc. | | 174,580 | 13,632,952 |
| The Children's Place Retail Stores, Inc. | | 10,600 | 1,508,380 |
| TJX Companies, Inc. | | 158,809 | 13,130,328 |
| | | | 38,501,997 |
| Automotive Retail - 2.0% | | | |
| AutoZone, Inc. (a) | | 10,200 | 6,780,144 |
| O'Reilly Automotive, Inc. (a) | | 39,498 | 9,645,017 |
| | | | 16,425,161 |
| Home Improvement Retail - 10.1% | | | |
| Floor & Decor Holdings, Inc. Class A | | 17,900 | 806,753 |
| Home Depot, Inc. | | 331,700 | 60,458,959 |
| Lowe's Companies, Inc. | | 241,600 | 21,644,944 |
| | | | 82,910,656 |
| Specialty Stores - 0.5% | | | |
| Tiffany & Co., Inc. | | 5,900 | 596,136 |
| Ulta Beauty, Inc. | | 16,300 | 3,314,605 |
| | | | 3,910,741 |
|
| TOTAL SPECIALTY RETAIL | | | 141,748,555 |
|
| Technology Hardware, Storage & Peripherals - 0.3% | | | |
| Technology Hardware, Storage & Peripherals - 0.3% | | | |
| Apple, Inc. | | 15,600 | 2,778,672 |
| Textiles, Apparel & Luxury Goods - 5.0% | | | |
| Apparel, Accessories & Luxury Goods - 2.6% | | | |
| adidas AG | | 7,991 | 1,770,518 |
| Canada Goose Holdings, Inc. | | 26,600 | 841,822 |
| Carter's, Inc. | | 22,800 | 2,660,304 |
| G-III Apparel Group Ltd. (a) | | 41,000 | 1,513,310 |
| Kering SA | | 1,700 | 797,758 |
| LVMH Moet Hennessy - Louis Vuitton SA | | 7,206 | 2,155,293 |
| Prada SpA | | 264,000 | 1,091,962 |
| PVH Corp. | | 57,900 | 8,353,812 |
| Swatch Group AG (Bearer) | | 930 | 391,985 |
| Tapestry, Inc. | | 32,900 | 1,674,939 |
| | | | 21,251,703 |
| Footwear - 2.4% | | | |
| NIKE, Inc. Class B | | 289,250 | 19,388,428 |
|
| TOTAL TEXTILES, APPAREL & LUXURY GOODS | | | 40,640,131 |
|
| TOTAL COMMON STOCKS | | | |
| (Cost $575,388,582) | | | 816,134,309 |
|
| Money Market Funds - 1.3% | | | |
| Fidelity Cash Central Fund, 1.41% (c) | | 4,307,286 | 4,308,148 |
| Fidelity Securities Lending Cash Central Fund 1.42% (c)(d) | | 6,144,558 | 6,145,173 |
| TOTAL MONEY MARKET FUNDS | | | |
| (Cost $10,453,321) | | | 10,453,321 |
| TOTAL INVESTMENT IN SECURITIES - 100.8% | | | |
| (Cost $585,841,903) | | | 826,587,630 |
| NET OTHER ASSETS (LIABILITIES) - (0.8)% | | | (6,650,581) |
| NET ASSETS - 100% | | | $819,937,049 |
Legend
(a) Non-income producing
(b) Security or a portion of the security is on loan at period end.
(c) Affiliated fund that is generally available only to investment companies and other accounts managed by Fidelity Investments. The rate quoted is the annualized seven-day yield of the fund at period end. A complete unaudited listing of the fund's holdings as of its most recent quarter end is available upon request. In addition, each Fidelity Central Fund's financial statements, which are not covered by the Fund's Report of Independent Registered Public Accounting Firm, are available on the SEC's website or upon request.
(d) Investment made with cash collateral received from securities on loan.
Affiliated Central Funds
Information regarding fiscal year to date income earned by the Fund from investments in Fidelity Central Funds is as follows:
| Fund | Income earned |
| Fidelity Cash Central Fund | $36,585 |
| Fidelity Securities Lending Cash Central Fund | 190,162 |
| Total | $226,747 |
Amounts in the income column in the above table include any capital gain distributions from underlying funds, which are presented in the corresponding line-item in the Statement of Operations if applicable.
Investment Valuation
The following is a summary of the inputs used, as of February 28, 2018, involving the Fund's assets and liabilities carried at fair value. The inputs or methodology used for valuing securities may not be an indication of the risk associated with investing in those securities. For more information on valuation inputs, and their aggregation into the levels used below, please refer to the Investment Valuation section in the accompanying Notes to Financial Statements.
| | Valuation Inputs at Reporting Date: |
| Description | Total | Level 1 | Level 2 | Level 3 |
| Investments in Securities: | | | | |
| Common Stocks | $816,134,309 | $802,169,237 | $13,965,072 | $-- |
| Money Market Funds | 10,453,321 | 10,453,321 | -- | -- |
| Total Investments in Securities: | $826,587,630 | $812,622,558 | $13,965,072 | $-- |
The following is a summary of transfers between Level 1 and Level 2 for the period ended February 28, 2018. Transfers are assumed to have occurred at the beginning of the period, and are primarily attributable to the valuation techniques used for foreign equity securities, as discussed in the accompanying Notes to Financial Statements:
| Transfers | Total |
| Level 1 to Level 2 | $13,309,051 |
| Level 2 to Level 1 | $0 |
See accompanying notes which are an integral part of the financial statements.
Consumer Discretionary Portfolio
Financial Statements
Statement of Assets and Liabilities
| | | February 28, 2018 |
| Assets | | |
Investment in securities, at value (including securities loaned of $5,929,670) — See accompanying schedule:
Unaffiliated issuers (cost $575,388,582) | $816,134,309 | |
| Fidelity Central Funds (cost $10,453,321) | 10,453,321 | |
| Total Investment in Securities (cost $585,841,903) | | $826,587,630 |
| Foreign currency held at value (cost $434,755) | | 434,755 |
| Receivable for investments sold | | 352,862 |
| Receivable for fund shares sold | | 3,281,468 |
| Dividends receivable | | 394,941 |
| Distributions receivable from Fidelity Central Funds | | 14,316 |
| Prepaid expenses | | 2,337 |
| Other receivables | | 41,507 |
| Total assets | | 831,109,816 |
| Liabilities | | |
| Payable for investments purchased | $3,105,926 | |
| Payable for fund shares redeemed | 1,381,798 | |
| Accrued management fee | 365,649 | |
| Other affiliated payables | 133,468 | |
| Other payables and accrued expenses | 45,926 | |
| Collateral on securities loaned | 6,140,000 | |
| Total liabilities | | 11,172,767 |
| Net Assets | | $819,937,049 |
| Net Assets consist of: | | |
| Paid in capital | | $567,239,188 |
| Undistributed net investment income | | 228,222 |
| Accumulated undistributed net realized gain (loss) on investments and foreign currency transactions | | 11,723,576 |
| Net unrealized appreciation (depreciation) on investments and assets and liabilities in foreign currencies | | 240,746,063 |
| Net Assets, for 18,783,166 shares outstanding | | $819,937,049 |
| Net Asset Value, offering price and redemption price per share ($819,937,049 ÷ 18,783,166 shares) | | $43.65 |
See accompanying notes which are an integral part of the financial statements.
Statement of Operations
| | | Year ended February 28, 2018 |
| Investment Income | | |
| Dividends | | $8,438,518 |
| Interest | | 42,091 |
| Income from Fidelity Central Funds (including $190,162 from security lending) | | 226,747 |
| Total income | | 8,707,356 |
| Expenses | | |
| Management fee | $4,032,288 | |
| Transfer agent fees | 1,298,139 | |
| Accounting and security lending fees | 265,216 | |
| Custodian fees and expenses | 27,427 | |
| Independent trustees' fees and expenses | 16,175 | |
| Registration fees | 40,535 | |
| Audit | 49,307 | |
| Legal | 10,820 | |
| Interest | 4,246 | |
| Miscellaneous | 22,254 | |
| Total expenses before reductions | 5,766,407 | |
| Expense reductions | (58,287) | 5,708,120 |
| Net investment income (loss) | | 2,999,236 |
| Realized and Unrealized Gain (Loss) | | |
| Net realized gain (loss) on: | | |
| Investment securities: | | |
| Unaffiliated issuers | 45,686,011 | |
| Fidelity Central Funds | 6,071 | |
| Foreign currency transactions | 20,243 | |
| Total net realized gain (loss) | | 45,712,325 |
| Change in net unrealized appreciation (depreciation) on: | | |
| Investment securities: | | |
| Unaffiliated issuers | 102,452,069 | |
| Fidelity Central Funds | (6,366) | |
| Assets and liabilities in foreign currencies | 6,510 | |
| Total change in net unrealized appreciation (depreciation) | | 102,452,213 |
| Net gain (loss) | | 148,164,538 |
| Net increase (decrease) in net assets resulting from operations | | $151,163,774 |
See accompanying notes which are an integral part of the financial statements.
Statement of Changes in Net Assets
| | Year ended February 28, 2018 | Year ended February 28, 2017 |
| Increase (Decrease) in Net Assets | | |
| Operations | | |
| Net investment income (loss) | $2,999,236 | $6,092,738 |
| Net realized gain (loss) | 45,712,325 | 106,936,943 |
| Change in net unrealized appreciation (depreciation) | 102,452,213 | 18,937,528 |
| Net increase (decrease) in net assets resulting from operations | 151,163,774 | 131,967,209 |
| Distributions to shareholders from net investment income | (2,342,887) | (7,587,944) |
| Distributions to shareholders from net realized gain | (26,353,209) | – |
| Total distributions | (28,696,096) | (7,587,944) |
| Share transactions | | |
| Proceeds from sales of shares | 143,731,533 | 189,032,213 |
| Reinvestment of distributions | 28,101,673 | 7,429,891 |
| Cost of shares redeemed | (303,355,779) | (610,875,058) |
| Net increase (decrease) in net assets resulting from share transactions | (131,522,573) | (414,412,954) |
| Redemption fees | – | 4,452 |
| Total increase (decrease) in net assets | (9,054,895) | (290,029,237) |
| Net Assets | | |
| Beginning of period | 828,991,944 | 1,119,021,181 |
| End of period | $819,937,049 | $828,991,944 |
| Other Information | | |
| Undistributed net investment income end of period | $228,222 | $– |
| Distributions in excess of net investment income end of period | $– | $(329,110) |
| Shares | | |
| Sold | 3,475,740 | 5,346,026 |
| Issued in reinvestment of distributions | 683,905 | 208,347 |
| Redeemed | (7,779,213) | (17,715,321) |
| Net increase (decrease) | (3,619,568) | (12,160,948) |
See accompanying notes which are an integral part of the financial statements.
Financial Highlights
Consumer Discretionary Portfolio
| | | | | | |
| Years ended February 28, | 2018 | 2017 | 2016 A | 2015 | 2014 |
| Selected Per–Share Data | | | | | |
| Net asset value, beginning of period | $37.00 | $32.38 | $35.23 | $33.30 | $27.40 |
| Income from Investment Operations | | | | | |
| Net investment income (loss)B | .16 | .21 | .24 | .15 | .04 |
| Net realized and unrealized gain (loss) | 8.17 | 4.73 | (1.79) | 4.39 | 8.67 |
| Total from investment operations | 8.33 | 4.94 | (1.55) | 4.54 | 8.71 |
| Distributions from net investment income | (.14) | (.32) | (.18) | (.11) | (.03) |
| Distributions from net realized gain | (1.54) | – | (1.13) | (2.51) | (2.77) |
| Total distributions | (1.68) | (.32) | (1.30)C | (2.61)D | (2.81)E |
| Redemption fees added to paid in capitalB | – | –F | –F | –F | –F |
| Net asset value, end of period | $43.65 | $37.00 | $32.38 | $35.23 | $33.30 |
| Total ReturnG | 22.79% | 15.29% | (4.60)% | 14.79% | 32.17% |
| Ratios to Average Net AssetsH,I | | | | | |
| Expenses before reductions | .78% | .76% | .77% | .79% | .82% |
| Expenses net of fee waivers, if any | .78% | .76% | .77% | .79% | .82% |
| Expenses net of all reductions | .77% | .76% | .76% | .79% | .81% |
| Net investment income (loss) | .40% | .60% | .71% | .46% | .14% |
| Supplemental Data | | | | | |
| Net assets, end of period (000 omitted) | $819,937 | $828,992 | $1,119,021 | $1,078,988 | $557,868 |
| Portfolio turnover rateJ | 74% | 39%K | 69% | 109%K | 138% |
A For the year ended February 29.
B Calculated based on average shares outstanding during the period.
C Total distributions of $1.30 per share is comprised of distributions from net investment income of $.175 and distributions from net realized gain of $1.126 per share.
D Total distributions of $2.61 per share is comprised of distributions from net investment income of $.105 and distributions from net realized gain of $2.508 per share.
E Total distributions of $2.81 per share is comprised of distributions from net investment income of $.034 and distributions from net realized gain of $2.772 per share.
F Amount represents less than $.005 per share.
G Total returns would have been lower if certain expenses had not been reduced during the applicable periods shown.
H Fees and expenses of any underlying Fidelity Central Funds are not included in the Fund's expense ratio. The Fund indirectly bears its proportionate share of the expenses of any underlying Fidelity Central Funds.
I Expense ratios reflect operating expenses of the Fund. Expenses before reductions do not reflect amounts reimbursed by the investment adviser or reductions from brokerage service arrangements or reductions from other expense offset arrangements and do not represent the amount paid by the Fund during periods when reimbursements or reductions occur. Expenses net of fee waivers reflect expenses after reimbursement by the investment adviser but prior to reductions from brokerage service arrangements or other expense offset arrangements. Expenses net of all reductions represent the net expenses paid by the Fund.
J Amount does not include the portfolio activity of any underlying Fidelity Central Funds.
K Portfolio turnover rate excludes securities received or delivered in-kind.
See accompanying notes which are an integral part of the financial statements.
Leisure Portfolio
Performance: The Bottom Line
Average annual total return reflects the change in the value of an investment, assuming reinvestment of distributions from dividend income and capital gains (the profits earned upon the sale of securities that have grown in value, if any) and assuming a constant rate of performance each year. The hypothetical investment and the average annual total returns do not reflect the deduction of taxes that a shareholder would pay on fund distributions or the redemption of fund shares. During periods of reimbursement by Fidelity, a fund’s total return will be greater than it would be had the reimbursement not occurred. How a fund did yesterday is no guarantee of how it will do tomorrow.
Average Annual Total Returns
| For the periods ended February 28, 2018 | Past 1 year | Past 5 years | Past 10 years |
| Leisure Portfolio | 24.75% | 15.30% | 13.27% |
$10,000 Over 10 Years
Let's say hypothetically that $10,000 was invested in Leisure Portfolio on February 29, 2008.
The chart shows how the value of your investment would have changed, and also shows how the S&P 500® Index performed over the same period.

| Period Ending Values |
| $34,754 | Leisure Portfolio |
| $25,307 | S&P 500® Index |
Leisure Portfolio
Management's Discussion of Fund Performance
Market Recap: U.S. equities gained 17.10% for the 12 months ending February 28, 2018, as the S&P 500
® index moved steadily higher throughout 2017 and into 2018 until sharply reversing course in February. The drop was in stark contrast to the low volatility seen throughout 2017, along with consumer sentiment and other market indicators that stayed positive. Investors remained decidedly upbeat as the calendar turned, and the index rose 5.73% in January. February was a decidedly different story, though, as volatility spiked amid fear that rising inflation and the potential for the economy to overheat would prompt the U.S. Federal Reserve to pick up the pace of interest rate hikes. The index returned -3.69% for the month, its first negative result since October 2016. For the full 12 months, growth stocks handily topped value, while large-caps bested small-caps. By sector, information technology fared best by far, gaining 36% amid strong earnings growth from several major index constituents. Consumer discretionary (+22%) also stood out, driven by retailers. Financials added 20%, riding the uptick in bond yields. Materials and industrials rose about 16% each, boosted by higher demand, especially from China. Conversely, notable laggards included the defensive telecommunication services (-5%) and utilities (-2%) sectors, while rising rates held back real estate (-3%).
Comments from Portfolio Manager Rebecca Painter: For the fiscal year, the fund gained 24.75%, modestly behind the 25.48% advance of the MSCI U.S. IMI Consumer Services 25/50 Index, but well ahead of the 17.10% result of the broad-market S&P 500
®. Leisure stocks benefited from a supportive backdrop the past 12 months, including rising business and consumer sentiment, a tight labor market, low unemployment, and wage growth. Solid fundamentals, among other factors, boosted the casinos & gaming and hotels, resorts & cruise lines subindustries. Versus the MSCI index, stock picks in the casinos & gaming category was the fund’s biggest detractor, whereas choices in hotels, resorts & cruise lines segment contributed most. Among individual stocks, underweighting fast-food giant McDonald's was by far the fund’s biggest individual detractor versus the MSCI industry index, though the stock was the fund’s largest holding. I materially added to the fund’s position in McDonald’s, ending the period with a modest overweighting. Underexposure to casino giant Wynn Resorts (+77%) also hurt. Conversely, an overweighting in hotel chain Marriott International (+64%) was our top contributor. Among our largest holdings, Marriott was boosted by a surge in business confidence following the November 2016 presidential election, and continuing throughout most of the past 12 months.
The views expressed above reflect those of the portfolio manager(s) only through the end of the period as stated on the cover of this report and do not necessarily represent the views of Fidelity or any other person in the Fidelity organization. Any such views are subject to change at any time based upon market or other conditions and Fidelity disclaims any responsibility to update such views. These views may not be relied on as investment advice and, because investment decisions for a Fidelity fund are based on numerous factors, may not be relied on as an indication of trading intent on behalf of any Fidelity fund.
Notes to shareholders: On December 8, 2017, shareholders approved proposals from the Board of Trustees to eliminate each sector/industry fund's fundamental “invests primarily” policy and to modify the fundamental concentration policy for certain funds. The changes took effect on January 1, 2018, and do not impact how the funds are managed.
On August 3, 2017, Rebecca Painter became Co-Portfolio Manager of the fund, joining Lead Manager Katherine Shaw. On March 1, 2018, Rebecca was named sole manager of the fund.
Leisure Portfolio
Investment Summary (Unaudited)
Top Ten Stocks as of February 28, 2018
| | % of fund's net assets |
| McDonald's Corp. | 21.1 |
| Starbucks Corp. | 11.5 |
| Marriott International, Inc. Class A | 8.6 |
| Royal Caribbean Cruises Ltd. | 5.0 |
| Las Vegas Sands Corp. | 4.9 |
| Carnival Corp. | 4.2 |
| MGM Mirage, Inc. | 3.2 |
| Hilton Worldwide Holdings, Inc. | 3.1 |
| Wyndham Worldwide Corp. | 3.0 |
| Yum! Brands, Inc. | 3.0 |
| | 67.6 |
Top Industries (% of fund's net assets)
| As of February 28, 2018 |
| | Hotels, Restaurants & Leisure | 92.9% |
| | Diversified Consumer Services | 4.0% |
| | Food & Staples Retailing | 1.2% |
| | Internet Software & Services | 0.8% |
| | Internet & Direct Marketing Retail | 0.4% |
| | All Others* | 0.7% |

* Includes short-term investments and net other assets (liabilities).
Leisure Portfolio
Schedule of Investments February 28, 2018
Showing Percentage of Net Assets
| Common Stocks - 99.8% | | | |
| | | Shares | Value |
| Diversified Consumer Services - 4.0% | | | |
| Education Services - 2.0% | | | |
| Adtalem Global Education, Inc. (a) | | 87,200 | $4,015,560 |
| Grand Canyon Education, Inc. (a) | | 62,800 | 6,163,820 |
| New Oriental Education & Technology Group, Inc. sponsored ADR | | 6,600 | 603,174 |
| | | | 10,782,554 |
| Specialized Consumer Services - 2.0% | | | |
| Service Corp. International | | 146,300 | 5,476,009 |
| ServiceMaster Global Holdings, Inc. (a) | | 107,834 | 5,538,354 |
| | | | 11,014,363 |
|
| TOTAL DIVERSIFIED CONSUMER SERVICES | | | 21,796,917 |
|
| Food & Staples Retailing - 1.2% | | | |
| Food Distributors - 1.2% | | | |
| Performance Food Group Co. (a) | | 208,600 | 6,393,590 |
| Hotels, Restaurants & Leisure - 92.9% | | | |
| Casinos & Gaming - 14.4% | | | |
| Boyd Gaming Corp. | | 132,100 | 4,673,698 |
| Caesars Entertainment Corp. (a) | | 300,000 | 3,810,000 |
| Churchill Downs, Inc. | | 5,123 | 1,322,759 |
| Eldorado Resorts, Inc. (a)(b) | | 249,400 | 8,504,540 |
| Las Vegas Sands Corp. | | 364,208 | 26,517,984 |
| MGM Mirage, Inc. | | 514,400 | 17,607,912 |
| Penn National Gaming, Inc. (a) | | 180,449 | 4,801,748 |
| Pinnacle Entertainment, Inc. (a) | | 39,400 | 1,188,698 |
| PlayAGS, Inc. (a) | | 106,700 | 2,209,757 |
| Scientific Games Corp. Class A (a) | | 49,400 | 2,195,830 |
| Wynn Resorts Ltd. | | 32,300 | 5,410,250 |
| | | | 78,243,176 |
| Hotels, Resorts & Cruise Lines - 29.0% | | | |
| Bluegreen Vacations Corp. | | 72,700 | 1,406,018 |
| Carnival Corp. | | 340,700 | 22,796,237 |
| Hilton Grand Vacations, Inc. (a) | | 215,912 | 9,318,762 |
| Hilton Worldwide Holdings, Inc. | | 209,597 | 16,933,342 |
| Hyatt Hotels Corp. Class A | | 79,900 | 6,173,873 |
| ILG, Inc. | | 103,300 | 3,136,188 |
| Marriott International, Inc. Class A | | 330,993 | 46,739,522 |
| Marriott Vacations Worldwide Corp. | | 55,797 | 7,839,479 |
| Royal Caribbean Cruises Ltd. | | 215,390 | 27,268,374 |
| Wyndham Worldwide Corp. | | 143,314 | 16,592,895 |
| | | | 158,204,690 |
| Leisure Facilities - 3.4% | | | |
| Cedar Fair LP (depositary unit) | | 26,543 | 1,773,338 |
| Planet Fitness, Inc. (a) | | 204,600 | 7,566,108 |
| Vail Resorts, Inc. | | 44,778 | 9,218,447 |
| | | | 18,557,893 |
| Restaurants - 46.1% | | | |
| ARAMARK Holdings Corp. | | 173,600 | 7,240,856 |
| Chipotle Mexican Grill, Inc. (a) | | 29,600 | 9,424,936 |
| Darden Restaurants, Inc. | | 57,700 | 5,319,363 |
| Dave & Buster's Entertainment, Inc. (a) | | 11,214 | 502,051 |
| DineEquity, Inc. | | 23,900 | 1,815,922 |
| Domino's Pizza, Inc. | | 48,300 | 10,742,403 |
| Dunkin' Brands Group, Inc. (b) | | 196,800 | 11,786,352 |
| McDonald's Corp. | | 726,858 | 114,654,579 |
| Papa John's International, Inc. (b) | | 17,600 | 1,016,224 |
| Red Robin Gourmet Burgers, Inc. (a) | | 15,700 | 842,305 |
| Restaurant Brands International, Inc. | | 36,300 | 2,127,590 |
| Shake Shack, Inc. Class A (a)(b) | | 21,000 | 818,790 |
| Starbucks Corp. | | 1,099,300 | 62,770,030 |
| U.S. Foods Holding Corp. (a) | | 135,833 | 4,535,464 |
| Wingstop, Inc. | | 18,807 | 852,145 |
| Yum! Brands, Inc. | | 203,336 | 16,547,484 |
| | | | 250,996,494 |
|
| TOTAL HOTELS, RESTAURANTS & LEISURE | | | 506,002,253 |
|
| Internet & Direct Marketing Retail - 0.4% | | | |
| Internet & Direct Marketing Retail - 0.4% | | | |
| Amazon.com, Inc. (a) | | 1,300 | 1,966,185 |
| Internet Software & Services - 0.8% | | | |
| Internet Software & Services - 0.8% | | | |
| 2U, Inc. (a) | | 21,124 | 1,748,645 |
| Alphabet, Inc. Class A (a) | | 2,300 | 2,539,016 |
| | | | 4,287,661 |
| Multiline Retail - 0.2% | | | |
| General Merchandise Stores - 0.2% | | | |
| Dollar Tree, Inc. (a) | | 12,700 | 1,303,528 |
| Textiles, Apparel & Luxury Goods - 0.3% | | | |
| Apparel, Accessories & Luxury Goods - 0.3% | | | |
| LVMH Moet Hennessy - Louis Vuitton SA | | 5,005 | 1,496,981 |
| TOTAL COMMON STOCKS | | | |
| (Cost $340,042,312) | | | 543,247,115 |
|
| Money Market Funds - 2.4% | | | |
| Fidelity Cash Central Fund, 1.41% (c) | | 521,262 | 521,366 |
| Fidelity Securities Lending Cash Central Fund 1.42% (c)(d) | | 12,518,458 | 12,519,710 |
| TOTAL MONEY MARKET FUNDS | | | |
| (Cost $13,041,920) | | | 13,041,076 |
| TOTAL INVESTMENT IN SECURITIES - 102.2% | | | |
| (Cost $353,084,232) | | | 556,288,191 |
| NET OTHER ASSETS (LIABILITIES) - (2.2)% | | | (11,748,563) |
| NET ASSETS - 100% | | | $544,539,628 |
Legend
(a) Non-income producing
(b) Security or a portion of the security is on loan at period end.
(c) Affiliated fund that is generally available only to investment companies and other accounts managed by Fidelity Investments. The rate quoted is the annualized seven-day yield of the fund at period end. A complete unaudited listing of the fund's holdings as of its most recent quarter end is available upon request. In addition, each Fidelity Central Fund's financial statements, which are not covered by the Fund's Report of Independent Registered Public Accounting Firm, are available on the SEC's website or upon request.
(d) Investment made with cash collateral received from securities on loan.
Affiliated Central Funds
Information regarding fiscal year to date income earned by the Fund from investments in Fidelity Central Funds is as follows:
| Fund | Income earned |
| Fidelity Cash Central Fund | $43,230 |
| Fidelity Securities Lending Cash Central Fund | 58,066 |
| Total | $101,296 |
Amounts in the income column in the above table include any capital gain distributions from underlying funds, which are presented in the corresponding line-item in the Statement of Operations if applicable.
Investment Valuation
The following is a summary of the inputs used, as of February 28, 2018, involving the Fund's assets and liabilities carried at fair value. The inputs or methodology used for valuing securities may not be an indication of the risk associated with investing in those securities. For more information on valuation inputs, and their aggregation into the levels used below, please refer to the Investment Valuation section in the accompanying Notes to Financial Statements.
| | Valuation Inputs at Reporting Date: |
| Description | Total | Level 1 | Level 2 | Level 3 |
| Investments in Securities: | | | | |
| Common Stocks | $543,247,115 | $541,750,134 | $1,496,981 | $-- |
| Money Market Funds | 13,041,076 | 13,041,076 | -- | -- |
| Total Investments in Securities: | $556,288,191 | $554,791,210 | $1,496,981 | $-- |
Other Information
Distribution of investments by country or territory of incorporation, as a percentage of Total Net Assets, is as follows (Unaudited):
| United States of America | 90.0% |
| Liberia | 5.0% |
| Panama | 4.2% |
| Others (Individually Less Than 1%) | 0.8% |
| | 100.0% |
See accompanying notes which are an integral part of the financial statements.
Leisure Portfolio
Financial Statements
Statement of Assets and Liabilities
| | | February 28, 2018 |
| Assets | | |
Investment in securities, at value (including securities loaned of $12,036,431) — See accompanying schedule:
Unaffiliated issuers (cost $340,042,312) | $543,247,115 | |
| Fidelity Central Funds (cost $13,041,920) | 13,041,076 | |
| Total Investment in Securities (cost $353,084,232) | | $556,288,191 |
| Receivable for investments sold | | 1,483,953 |
| Receivable for fund shares sold | | 442,289 |
| Dividends receivable | | 1,111,782 |
| Distributions receivable from Fidelity Central Funds | | 6,207 |
| Prepaid expenses | | 1,838 |
| Other receivables | | 5,260 |
| Total assets | | 559,339,520 |
| Liabilities | | |
| Payable for investments purchased | $814,988 | |
| Payable for fund shares redeemed | 1,092,151 | |
| Accrued management fee | 245,293 | |
| Other affiliated payables | 88,750 | |
| Other payables and accrued expenses | 44,985 | |
| Collateral on securities loaned | 12,513,725 | |
| Total liabilities | | 14,799,892 |
| Net Assets | | $544,539,628 |
| Net Assets consist of: | | |
| Paid in capital | | $316,347,263 |
| Undistributed net investment income | | 962,291 |
| Accumulated undistributed net realized gain (loss) on investments and foreign currency transactions | | 24,026,115 |
| Net unrealized appreciation (depreciation) on investments | | 203,203,959 |
| Net Assets, for 3,284,619 shares outstanding | | $544,539,628 |
| Net Asset Value, offering price and redemption price per share ($544,539,628 ÷ 3,284,619 shares) | | $165.78 |
See accompanying notes which are an integral part of the financial statements.
Statement of Operations
| | | Year ended February 28, 2018 |
| Investment Income | | |
| Dividends | | $9,342,661 |
| Income from Fidelity Central Funds (including $58,066 from security lending) | | 101,296 |
| Total income | | 9,443,957 |
| Expenses | | |
| Management fee | $2,760,350 | |
| Transfer agent fees | 842,565 | |
| Accounting and security lending fees | 197,130 | |
| Custodian fees and expenses | 9,587 | |
| Independent trustees' fees and expenses | 10,752 | |
| Registration fees | 35,333 | |
| Audit | 41,304 | |
| Legal | 6,235 | |
| Interest | 1,595 | |
| Miscellaneous | 18,924 | |
| Total expenses before reductions | 3,923,775 | |
| Expense reductions | (15,903) | 3,907,872 |
| Net investment income (loss) | | 5,536,085 |
| Realized and Unrealized Gain (Loss) | | |
| Net realized gain (loss) on: | | |
| Investment securities: | | |
| Unaffiliated issuers | 64,227,420 | |
| Fidelity Central Funds | 540 | |
| Foreign currency transactions | (1,249) | |
| Total net realized gain (loss) | | 64,226,711 |
| Change in net unrealized appreciation (depreciation) on: | | |
| Investment securities: | | |
| Unaffiliated issuers | 31,872,231 | |
| Fidelity Central Funds | (1,246) | |
| Total change in net unrealized appreciation (depreciation) | | 31,870,985 |
| Net gain (loss) | | 96,097,696 |
| Net increase (decrease) in net assets resulting from operations | | $101,633,781 |
See accompanying notes which are an integral part of the financial statements.
Statement of Changes in Net Assets
| | Year ended February 28, 2018 | Year ended February 28, 2017 |
| Increase (Decrease) in Net Assets | | |
| Operations | | |
| Net investment income (loss) | $5,536,085 | $4,724,283 |
| Net realized gain (loss) | 64,226,711 | 4,111,071 |
| Change in net unrealized appreciation (depreciation) | 31,870,985 | 33,169,030 |
| Net increase (decrease) in net assets resulting from operations | 101,633,781 | 42,004,384 |
| Distributions to shareholders from net investment income | (4,166,156) | (3,947,620) |
| Distributions to shareholders from net realized gain | (27,657,199) | – |
| Total distributions | (31,823,355) | (3,947,620) |
| Share transactions | | |
| Proceeds from sales of shares | 243,148,042 | 56,175,802 |
| Reinvestment of distributions | 29,908,337 | 3,699,415 |
| Cost of shares redeemed | (201,277,044) | (111,769,338) |
| Net increase (decrease) in net assets resulting from share transactions | 71,779,335 | (51,894,121) |
| Redemption fees | 9,285 | 6,683 |
| Total increase (decrease) in net assets | 141,599,046 | (13,830,674) |
| Net Assets | | |
| Beginning of period | 402,940,582 | 416,771,256 |
| End of period | $544,539,628 | $402,940,582 |
| Other Information | | |
| Undistributed net investment income end of period | $962,291 | $54,750 |
| Shares | | |
| Sold | 1,507,775 | 417,493 |
| Issued in reinvestment of distributions | 181,314 | 26,364 |
| Redeemed | (1,254,794) | (841,666) |
| Net increase (decrease) | 434,295 | (397,809) |
See accompanying notes which are an integral part of the financial statements.
Financial Highlights
Leisure Portfolio
| | | | | | |
| Years ended February 28, | 2018 | 2017 | 2016 A | 2015 | 2014 |
| Selected Per–Share Data | | | | | |
| Net asset value, beginning of period | $141.37 | $128.31 | $140.13 | $135.06 | $108.30 |
| Income from Investment Operations | | | | | |
| Net investment income (loss)B | 1.75 | 1.56 | 1.47 | 1.31 | 1.40C |
| Net realized and unrealized gain (loss) | 33.18 | 12.88 | (6.24) | 14.80 | 35.09 |
| Total from investment operations | 34.93 | 14.44 | (4.77) | 16.11 | 36.49 |
| Distributions from net investment income | (1.39) | (1.38) | (1.30) | (1.47) | (1.01) |
| Distributions from net realized gain | (9.13) | – | (5.75) | (9.57) | (8.72) |
| Total distributions | (10.52) | (1.38) | (7.05) | (11.04) | (9.73) |
| Redemption fees added to paid in capitalB,D | – | – | – | – | – |
| Net asset value, end of period | $165.78 | $141.37 | $128.31 | $140.13 | $135.06 |
| Total ReturnE,F | 24.75% | 11.26% | (3.48)% | 12.91% | 34.71% |
| Ratios to Average Net AssetsF,G | | | | | |
| Expenses before reductions | .77% | .80% | .79% | .80% | .82% |
| Expenses net of fee waivers, if any | .77% | .79% | .79% | .80% | .82% |
| Expenses net of all reductions | .77% | .79% | .78% | .80% | .81% |
| Net investment income (loss) | 1.09% | 1.17% | 1.08% | 1.00% | 1.13%C |
| Supplemental Data | | | | | |
| Net assets, end of period (000 omitted) | $544,540 | $402,941 | $416,771 | $445,296 | $568,149 |
| Portfolio turnover rateH | 56% | 23% | 48% | 32%I | 65% |
A For the year ended February 29.
B Calculated based on average shares outstanding during the period.
C Net Investment income per share reflects a large, non-recurring dividend which amounted to $.43 per share. Excluding this non-recurring dividend, the ratio of net investment income (loss) to average net assets would have been .79%.
D Amount represents less than $.005 per share.
E Total returns would have been lower if certain expenses had not been reduced during the applicable periods shown.
F Fees and expenses of any underlying Fidelity Central Funds are not included in the Fund's expense ratio. The Fund indirectly bears its proportionate share of the expenses of any underlying Fidelity Central Funds.
G Expense ratios reflect operating expenses of the Fund. Expenses before reductions do not reflect amounts reimbursed by the investment adviser or reductions from brokerage service arrangements or reductions from other expense offset arrangements and do not represent the amount paid by the Fund during periods when reimbursements or reductions occur. Expenses net of fee waivers reflect expenses after reimbursement by the investment adviser but prior to reductions from brokerage service arrangements or other expense offset arrangements. Expenses net of all reductions represent the net expenses paid by the Fund.
H Amount does not include the portfolio activity of any underlying Fidelity Central Funds.
I Portfolio turnover rate excludes securities received or delivered in-kind.
See accompanying notes which are an integral part of the financial statements.
Multimedia Portfolio
Performance: The Bottom Line
Average annual total return reflects the change in the value of an investment, assuming reinvestment of distributions from dividend income and capital gains (the profits earned upon the sale of securities that have grown in value, if any) and assuming a constant rate of performance each year. The hypothetical investment and the average annual total returns do not reflect the deduction of taxes that a shareholder would pay on fund distributions or the redemption of fund shares. During periods of reimbursement by Fidelity, a fund’s total return will be greater than it would be had the reimbursement not occurred. How a fund did yesterday is no guarantee of how it will do tomorrow.
Average Annual Total Returns
| For the periods ended February 28, 2018 | Past 1 year | Past 5 years | Past 10 years |
| Multimedia Portfolio | 4.16% | 12.19% | 12.60% |
$10,000 Over 10 Years
Let's say hypothetically that $10,000 was invested in Multimedia Portfolio on February 29, 2008.
The chart shows how the value of your investment would have changed, and also shows how the S&P 500® Index performed over the same period.
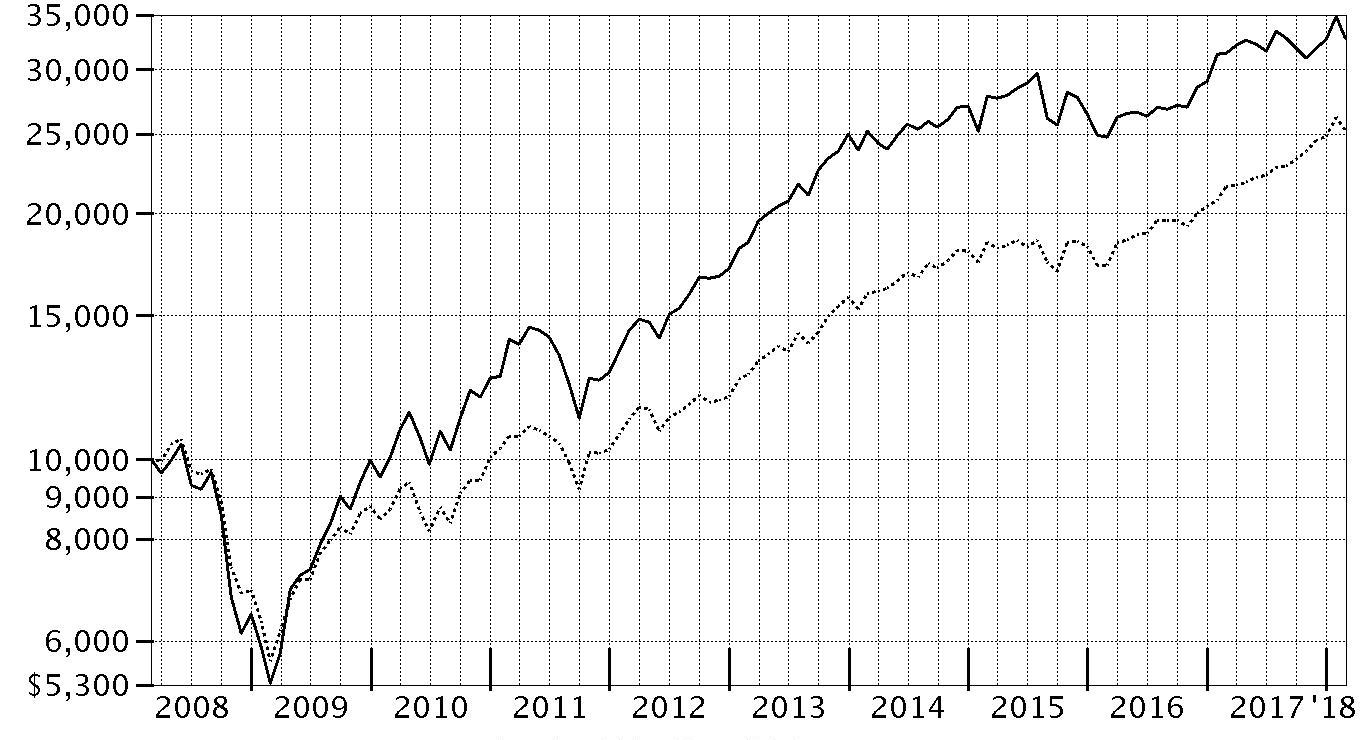
| Period Ending Values |
| $32,752 | Multimedia Portfolio |
| $25,307 | S&P 500® Index |
Multimedia Portfolio
Management's Discussion of Fund Performance
Market Recap: U.S. equities gained 17.10% for the 12 months ending February 28, 2018, as the S&P 500
® index moved steadily higher throughout 2017 and into 2018 until sharply reversing course in February. The drop was in stark contrast to the low volatility seen throughout 2017, along with consumer sentiment and other market indicators that stayed positive. Investors remained decidedly upbeat as the calendar turned, and the index rose 5.73% in January. February was a decidedly different story, though, as volatility spiked amid fear that rising inflation and the potential for the economy to overheat would prompt the U.S. Federal Reserve to pick up the pace of interest rate hikes. The index returned -3.69% for the month, its first negative result since October 2016. For the full 12 months, growth stocks handily topped value, while large-caps bested small-caps. By sector, information technology fared best by far, gaining 36% amid strong earnings growth from several major index constituents. Consumer discretionary (+22%) also stood out, driven by retailers. Financials added 20%, riding the uptick in bond yields. Materials and industrials rose about 16% each, boosted by higher demand, especially from China. Conversely, notable laggards included the defensive telecommunication services (-5%) and utilities (-2%) sectors, while rising rates held back real estate (-3%).
Comments from Portfolio Manager Nidhi Gupta: For the fiscal year, the fund gained 4.16%, well ahead of the -1.30% return of the industry benchmark, the MSCI U.S. IMI Media 25/50 Index, but well behind the broadly based S&P 500
®. As audiences continued to shift away from linear viewing on traditional platforms – watching programs at their time of broadcast – to internet and on-demand services, traditional media experienced widespread weakness the past 12 months. Versus the MSCI industry index, stock selection drove the fund's outperformance, led by choices in two out-of-index segments: internet & direct marketing retail and internet software & services. On a stock basis, the fund's out-of-index position in streaming-media provider Netflix proved the top relative contributor. A sizable out-of-index stake in social-media platform Facebook (+32%) also helped. Conversely, largely avoiding the strong-performing publishing segment, particularly not owning shares of News Corp. or The New York Times, detracted from the fund’s relative result. Given my investment focus on "new media" platforms, these two more-traditional media companies fell outside my investment parameters.
The views expressed above reflect those of the portfolio manager(s) only through the end of the period as stated on the cover of this report and do not necessarily represent the views of Fidelity or any other person in the Fidelity organization. Any such views are subject to change at any time based upon market or other conditions and Fidelity disclaims any responsibility to update such views. These views may not be relied on as investment advice and, because investment decisions for a Fidelity fund are based on numerous factors, may not be relied on as an indication of trading intent on behalf of any Fidelity fund.
Note to Shareholders: On December 8, 2017, shareholders approved proposals from the Board of Trustees to eliminate each sector/industry fund's fundamental “invests primarily” policy and to modify the fundamental concentration policy for certain funds. The changes took effect on January 1, 2018, and do not impact how the funds are managed.
Multimedia Portfolio
Investment Summary (Unaudited)
Top Ten Stocks as of February 28, 2018
| | % of fund's net assets |
| Comcast Corp. Class A | 20.9 |
| The Walt Disney Co. | 20.6 |
| Charter Communications, Inc. Class A | 4.9 |
| Twenty-First Century Fox, Inc. Class A | 4.4 |
| Netflix, Inc. | 4.3 |
| Time Warner, Inc. | 4.0 |
| Facebook, Inc. Class A | 3.5 |
| Lions Gate Entertainment Corp. Class B | 3.3 |
| Sirius XM Holdings, Inc. | 3.2 |
| Live Nation Entertainment, Inc. | 3.1 |
| | 72.2 |
Top Industries (% of fund's net assets)
| As of February 28, 2018 |
| | Media | 81.6% |
| | Internet Software & Services | 7.7% |
| | Internet & Direct Marketing Retail | 6.5% |
| | Technology Hardware, Storage & Peripherals | 3.1% |
| | All Others* | 1.1% |

* Includes short-term investments and net other assets (liabilities).
Multimedia Portfolio
Schedule of Investments February 28, 2018
Showing Percentage of Net Assets
| Common Stocks - 98.9% | | | |
| | | Shares | Value |
| Household Durables - 0.0% | | | |
| Consumer Electronics - 0.0% | | | |
| Roku, Inc. Class A | | 5,600 | $228,312 |
| Internet & Direct Marketing Retail - 6.5% | | | |
| Internet & Direct Marketing Retail - 6.5% | | | |
| Netflix, Inc. (a) | | 75,000 | 21,853,500 |
| The Booking Holdings, Inc. (a) | | 5,600 | 11,390,624 |
| | | | 33,244,124 |
| Internet Software & Services - 7.7% | | | |
| Internet Software & Services - 7.7% | | | |
| Alphabet, Inc.: | | | |
| Class A (a) | | 9,600 | 10,597,632 |
| Class C (a) | | 9,714 | 10,731,347 |
| Facebook, Inc. Class A (a) | | 100,100 | 17,849,832 |
| | | | 39,178,811 |
| Media - 81.6% | | | |
| Advertising - 1.8% | | | |
| Interpublic Group of Companies, Inc. | | 145,900 | 3,414,060 |
| Omnicom Group, Inc. | | 76,600 | 5,839,218 |
| | | | 9,253,278 |
| Broadcasting - 2.2% | | | |
| CBS Corp. Class B | | 205,538 | 10,887,348 |
| Cumulus Media, Inc. Class A (a) | | 26 | 3 |
| Discovery Communications, Inc. Class A (a) | | 450 | 10,944 |
| | | | 10,898,295 |
| Cable & Satellite - 33.1% | | | |
| Charter Communications, Inc. Class A (a) | | 73,071 | 24,985,167 |
| Comcast Corp. Class A | | 2,938,400 | 106,399,464 |
| Liberty Broadband Corp.: | | | |
| Class A (a) | | 146,623 | 12,811,918 |
| Class C (a) | | 90,740 | 7,974,231 |
| Sirius XM Holdings, Inc. (b) | | 2,636,400 | 16,556,592 |
| | | | 168,727,372 |
| Movies & Entertainment - 44.5% | | | |
| Cinemark Holdings, Inc. | | 116,700 | 4,966,752 |
| Liberty Media Corp.: | | | |
| Liberty Media Class A (a) | | 333,362 | 10,524,238 |
| Liberty SiriusXM Series A (a) | | 63,500 | 2,663,825 |
| Liberty SiriusXM Series C (a) | | 207,186 | 8,652,087 |
| Lions Gate Entertainment Corp. Class B | | 629,834 | 16,904,745 |
| Live Nation Entertainment, Inc. (a) | | 357,300 | 16,007,040 |
| The Madison Square Garden Co. (a) | | 49,899 | 12,185,336 |
| The Walt Disney Co. | | 1,017,304 | 104,945,081 |
| Time Warner, Inc. | | 219,382 | 20,393,751 |
| Twenty-First Century Fox, Inc.: | | | |
| Class A | | 604,607 | 22,261,630 |
| Class B | | 191,600 | 6,978,072 |
| | | | 226,482,557 |
| Publishing - 0.0% | | | |
| China Literature Ltd. (a)(c) | | 6,800 | 66,302 |
| Gannett Co., Inc. | | 6,937 | 69,647 |
| | | | 135,949 |
|
| TOTAL MEDIA | | | 415,497,451 |
|
| Technology Hardware, Storage & Peripherals - 3.1% | | | |
| Technology Hardware, Storage & Peripherals - 3.1% | | | |
| Apple, Inc. | | 87,200 | 15,532,064 |
| Textiles, Apparel & Luxury Goods - 0.0% | | | |
| Textiles - 0.0% | | | |
| Despegar.com Corp. | | 4,716 | 133,934 |
| TOTAL COMMON STOCKS | | | |
| (Cost $242,080,419) | | | 503,814,696 |
|
| Money Market Funds - 3.4% | | | |
| Fidelity Cash Central Fund, 1.41% (d) | | 51,147 | 51,157 |
| Fidelity Securities Lending Cash Central Fund 1.42% (d)(e) | | 17,136,418 | 17,138,132 |
| TOTAL MONEY MARKET FUNDS | | | |
| (Cost $17,189,156) | | | 17,189,289 |
| TOTAL INVESTMENT IN SECURITIES - 102.3% | | | |
| (Cost $259,269,575) | | | 521,003,985 |
| NET OTHER ASSETS (LIABILITIES) - (2.3)% | | | (11,628,846) |
| NET ASSETS - 100% | | | $509,375,139 |
Legend
(a) Non-income producing
(b) Security or a portion of the security is on loan at period end.
(c) Security exempt from registration under Rule 144A of the Securities Act of 1933. These securities may be resold in transactions exempt from registration, normally to qualified institutional buyers. At the end of the period, the value of these securities amounted to $66,302 or 0.0% of net assets.
(d) Affiliated fund that is generally available only to investment companies and other accounts managed by Fidelity Investments. The rate quoted is the annualized seven-day yield of the fund at period end. A complete unaudited listing of the fund's holdings as of its most recent quarter end is available upon request. In addition, each Fidelity Central Fund's financial statements, which are not covered by the Fund's Report of Independent Registered Public Accounting Firm, are available on the SEC's website or upon request.
(e) Investment made with cash collateral received from securities on loan.
Affiliated Central Funds
Information regarding fiscal year to date income earned by the Fund from investments in Fidelity Central Funds is as follows:
| Fund | Income earned |
| Fidelity Cash Central Fund | $23,803 |
| Fidelity Securities Lending Cash Central Fund | 401,207 |
| Total | $425,010 |
Amounts in the income column in the above table include any capital gain distributions from underlying funds, which are presented in the corresponding line-item in the Statement of Operations if applicable.
Investment Valuation
The following is a summary of the inputs used, as of February 28, 2018, involving the Fund's assets and liabilities carried at fair value. The inputs or methodology used for valuing securities may not be an indication of the risk associated with investing in those securities. For more information on valuation inputs, and their aggregation into the levels used below, please refer to the Investment Valuation section in the accompanying Notes to Financial Statements.
| | Valuation Inputs at Reporting Date: |
| Description | Total | Level 1 | Level 2 | Level 3 |
| Investments in Securities: | | | | |
| Common Stocks | $503,814,696 | $503,748,394 | $66,302 | $-- |
| Money Market Funds | 17,189,289 | 17,189,289 | -- | -- |
| Total Investments in Securities: | $521,003,985 | $520,937,683 | $66,302 | $-- |
See accompanying notes which are an integral part of the financial statements.
Multimedia Portfolio
Financial Statements
Statement of Assets and Liabilities
| | | February 28, 2018 |
| Assets | | |
Investment in securities, at value (including securities loaned of $16,555,336) — See accompanying schedule:
Unaffiliated issuers (cost $242,080,419) | $503,814,696 | |
| Fidelity Central Funds (cost $17,189,156) | 17,189,289 | |
| Total Investment in Securities (cost $259,269,575) | | $521,003,985 |
| Receivable for investments sold | | 6,382,461 |
| Receivable for fund shares sold | | 163,141 |
| Dividends receivable | | 30,639 |
| Distributions receivable from Fidelity Central Funds | | 57,087 |
| Prepaid expenses | | 2,125 |
| Other receivables | | 4,025 |
| Total assets | | 527,643,463 |
| Liabilities | | |
| Payable for fund shares redeemed | $743,159 | |
| Accrued management fee | 236,348 | |
| Other affiliated payables | 103,109 | |
| Other payables and accrued expenses | 50,408 | |
| Collateral on securities loaned | 17,135,300 | |
| Total liabilities | | 18,268,324 |
| Net Assets | | $509,375,139 |
| Net Assets consist of: | | |
| Paid in capital | | $224,148,932 |
| Undistributed net investment income | | 270,718 |
| Accumulated undistributed net realized gain (loss) on investments and foreign currency transactions | | 23,221,079 |
| Net unrealized appreciation (depreciation) on investments | | 261,734,410 |
| Net Assets, for 6,391,240 shares outstanding | | $509,375,139 |
| Net Asset Value, offering price and redemption price per share ($509,375,139 ÷ 6,391,240 shares) | | $79.70 |
See accompanying notes which are an integral part of the financial statements.
Statement of Operations
| | | Year ended February 28, 2018 |
| Investment Income | | |
| Dividends | | $6,001,665 |
| Income from Fidelity Central Funds (including $401,207 from security lending) | | 425,010 |
| Total income | | 6,426,675 |
| Expenses | | |
| Management fee | $3,322,480 | |
| Transfer agent fees | 1,210,912 | |
| Accounting and security lending fees | 229,871 | |
| Custodian fees and expenses | 8,352 | |
| Independent trustees' fees and expenses | 13,597 | |
| Registration fees | 31,084 | |
| Audit | 40,712 | |
| Legal | 8,346 | |
| Interest | 873 | |
| Miscellaneous | 28,242 | |
| Total expenses before reductions | 4,894,469 | |
| Expense reductions | (47,037) | 4,847,432 |
| Net investment income (loss) | | 1,579,243 |
| Realized and Unrealized Gain (Loss) | | |
| Net realized gain (loss) on: | | |
| Investment securities: | | |
| Unaffiliated issuers | 55,287,039 | |
| Fidelity Central Funds | (508) | |
| Foreign currency transactions | 10 | |
| Total net realized gain (loss) | | 55,286,541 |
| Change in net unrealized appreciation (depreciation) on: | | |
| Investment securities: | | |
| Unaffiliated issuers | (33,682,565) | |
| Fidelity Central Funds | (1,853) | |
| Total change in net unrealized appreciation (depreciation) | | (33,684,418) |
| Net gain (loss) | | 21,602,123 |
| Net increase (decrease) in net assets resulting from operations | | $23,181,366 |
See accompanying notes which are an integral part of the financial statements.
Statement of Changes in Net Assets
| | Year ended February 28, 2018 | Year ended February 28, 2017 |
| Increase (Decrease) in Net Assets | | |
| Operations | | |
| Net investment income (loss) | $1,579,243 | $1,721,308 |
| Net realized gain (loss) | 55,286,541 | 33,248,436 |
| Change in net unrealized appreciation (depreciation) | (33,684,418) | 102,417,983 |
| Net increase (decrease) in net assets resulting from operations | 23,181,366 | 137,387,727 |
| Distributions to shareholders from net investment income | (1,071,017) | (2,410,179) |
| Distributions to shareholders from net realized gain | (29,592,267) | (39,255,107) |
| Total distributions | (30,663,284) | (41,665,286) |
| Share transactions | | |
| Proceeds from sales of shares | 53,712,116 | 142,629,475 |
| Reinvestment of distributions | 29,534,153 | 40,020,773 |
| Cost of shares redeemed | (246,786,302) | (174,102,382) |
| Net increase (decrease) in net assets resulting from share transactions | (163,540,033) | 8,547,866 |
| Redemption fees | 5,340 | 3,008 |
| Total increase (decrease) in net assets | (171,016,611) | 104,273,315 |
| Net Assets | | |
| Beginning of period | 680,391,750 | 576,118,435 |
| End of period | $509,375,139 | $680,391,750 |
| Other Information | | |
| Undistributed net investment income end of period | $270,718 | $– |
| Distributions in excess of net investment income end of period | $– | $(167,902) |
| Shares | | |
| Sold | 658,481 | 1,849,202 |
| Issued in reinvestment of distributions | 368,028 | 546,111 |
| Redeemed | (3,060,717) | (2,369,431) |
| Net increase (decrease) | (2,034,208) | 25,882 |
See accompanying notes which are an integral part of the financial statements.
Financial Highlights
Multimedia Portfolio
| | | | | | |
| Years ended February 28, | 2018 | 2017 | 2016 A | 2015 | 2014 |
| Selected Per–Share Data | | | | | |
| Net asset value, beginning of period | $80.75 | $68.59 | $82.48 | $81.74 | $61.55 |
| Income from Investment Operations | | | | | |
| Net investment income (loss)B | .21 | .22 | .27 | .22 | .20 |
| Net realized and unrealized gain (loss) | 3.14 | 17.53 | (8.82) | 7.62 | 22.46 |
| Total from investment operations | 3.35 | 17.75 | (8.55) | 7.84 | 22.66 |
| Distributions from net investment income | (.16) | (.33) | (.23) | (.20) | (.19) |
| Distributions from net realized gain | (4.23) | (5.26) | (5.12) | (6.89) | (2.30) |
| Total distributions | (4.40)C | (5.59) | (5.34)D | (7.10)E | (2.48)F |
| Redemption fees added to paid in capitalB | –G | –G | –G | –G | .01 |
| Net asset value, end of period | $79.70 | $80.75 | $68.59 | $82.48 | $81.74 |
| Total ReturnH | 4.16% | 26.85% | (10.88)% | 10.16% | 37.01% |
| Ratios to Average Net AssetsI,J | | | | | |
| Expenses before reductions | .80% | .82% | .81% | .81% | .81% |
| Expenses net of fee waivers, if any | .80% | .82% | .81% | .81% | .81% |
| Expenses net of all reductions | .79% | .82% | .80% | .81% | .80% |
| Net investment income (loss) | .26% | .30% | .34% | .27% | .27% |
| Supplemental Data | | | | | |
| Net assets, end of period (000 omitted) | $509,375 | $680,392 | $576,118 | $802,988 | $1,008,988 |
| Portfolio turnover rateK | 22% | 33% | 42% | 55% | 111% |
A For the year ended February 29.
B Calculated based on average shares outstanding during the period.
C Total distributions of $4.40 per share is comprised of distributions from net investment income of $.163 and distributions from net realized gain of $4.233 per share.
D Total distributions of $5.34 per share is comprised of distributions from net investment income of $.227 and distributions from net realized gain of $5.115 per share.
E Total distributions of $7.10 per share is comprised of distributions from net investment income of $.204 and distributions from net realized gain of $6.892 per share.
F Total distributions of $2.48 per share is comprised of distributions from net investment income of $.187 and distributions from net realized gain of $2.295 per share.
G Amount represents less than $.005 per share.
H Total returns would have been lower if certain expenses had not been reduced during the applicable periods shown.
I Fees and expenses of any underlying Fidelity Central Funds are not included in the Fund's expense ratio. The Fund indirectly bears its proportionate share of the expenses of any underlying Fidelity Central Funds.
J Expense ratios reflect operating expenses of the Fund. Expenses before reductions do not reflect amounts reimbursed by the investment adviser or reductions from brokerage service arrangements or reductions from other expense offset arrangements and do not represent the amount paid by the Fund during periods when reimbursements or reductions occur. Expenses net of fee waivers reflect expenses after reimbursement by the investment adviser but prior to reductions from brokerage service arrangements or other expense offset arrangements. Expenses net of all reductions represent the net expenses paid by the Fund.
K Amount does not include the portfolio activity of any underlying Fidelity Central Funds.
See accompanying notes which are an integral part of the financial statements.
Retailing Portfolio
Performance: The Bottom Line
Average annual total return reflects the change in the value of an investment, assuming reinvestment of distributions from dividend income and capital gains (the profits earned upon the sale of securities that have grown in value, if any) and assuming a constant rate of performance each year. The hypothetical investment and the average annual total returns do not reflect the deduction of taxes that a shareholder would pay on fund distributions or the redemption of fund shares. During periods of reimbursement by Fidelity, a fund’s total return will be greater than it would be had the reimbursement not occurred. How a fund did yesterday is no guarantee of how it will do tomorrow.
Average Annual Total Returns
| For the periods ended February 28, 2018 | Past 1 year | Past 5 years | Past 10 years |
| Retailing Portfolio | 28.66% | 20.35% | 18.70% |
$10,000 Over 10 Years
Let's say hypothetically that $10,000 was invested in Retailing Portfolio on February 29, 2008.
The chart shows how the value of your investment would have changed, and also shows how the S&P 500® Index performed over the same period.
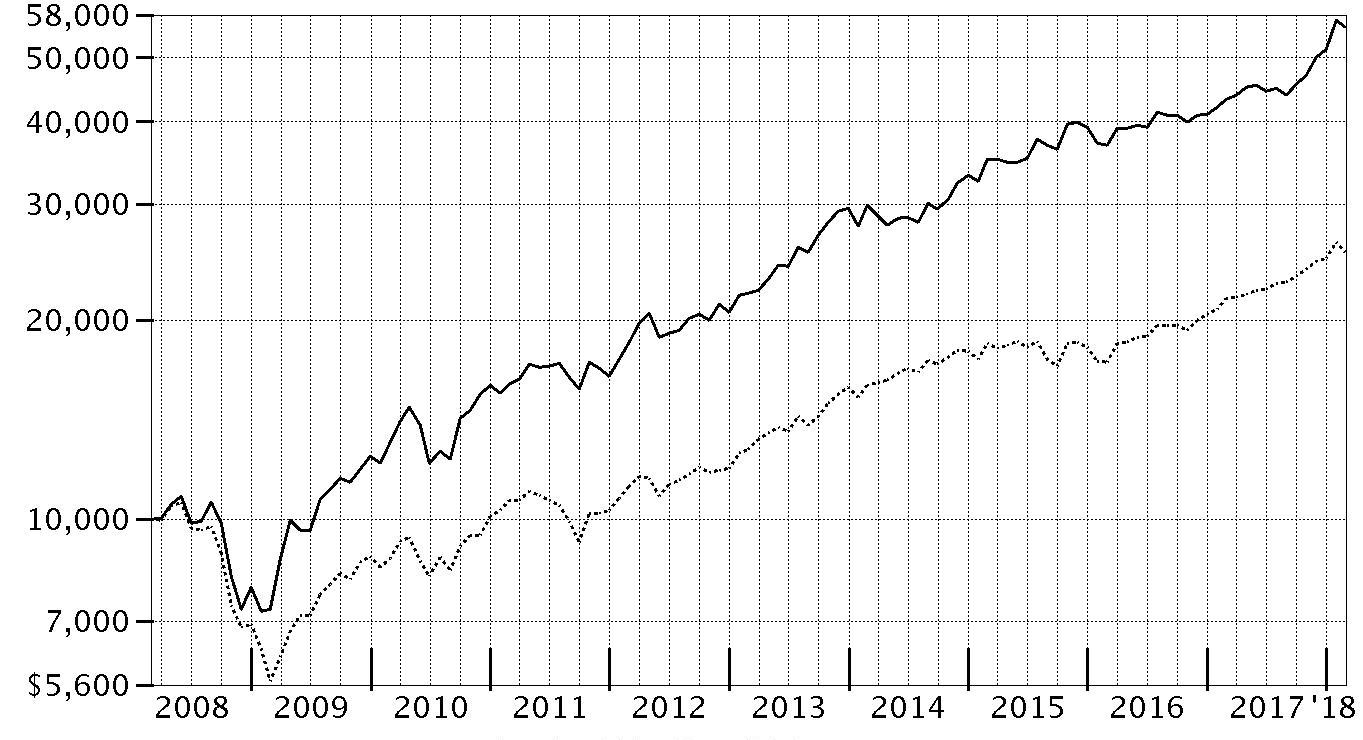
| Period Ending Values |
| $55,532 | Retailing Portfolio |
| $25,307 | S&P 500® Index |
Retailing Portfolio
Management's Discussion of Fund Performance
Market Recap: U.S. equities gained 17.10% for the 12 months ending February 28, 2018, as the S&P 500
® index moved steadily higher throughout 2017 and into 2018 until sharply reversing course in February. The drop was in stark contrast to the low volatility seen throughout 2017, along with consumer sentiment and other market indicators that stayed positive. Investors remained decidedly upbeat as the calendar turned, and the index rose 5.73% in January. February was a decidedly different story, though, as volatility spiked amid fear that rising inflation and the potential for the economy to overheat would prompt the U.S. Federal Reserve to pick up the pace of interest rate hikes. The index returned -3.69% for the month, its first negative result since October 2016. For the full 12 months, growth stocks handily topped value, while large-caps bested small-caps. By sector, information technology fared best by far, gaining 36% amid strong earnings growth from several major index constituents. Consumer discretionary (+22%) also stood out, driven by retailers. Financials added 20%, riding the uptick in bond yields. Materials and industrials rose about 16% each, boosted by higher demand, especially from China. Conversely, notable laggards included the defensive telecommunication services (-5%) and utilities (-2%) sectors, while rising rates held back real estate (-3%).
Comments from Portfolio Manager Nicola Stafford: For the fiscal year, the fund gained 28.66%, trailing the 30.77% result of the MSCI U.S. IMI Retailing 25/50 Index, but handily topping the broader S&P 500
® index. A strong job market in the U.S. and increasing wages lifted the retailing industry the past 12 months. Versus the MSCI industry index, the largest detractor was the fund's position in cash – about 3% of assets, on average – in a strong market for retailing stocks. Security selection detracted to a much lesser extent, with my picks in a number of subindustries hampering our relative return. In particular, overweightings in auto-parts retailers AutoZone and O'Reilly Automotive were the largest individual relative detractors. The shares of each suffered due to the threat of more online competition. Both were among the fund's biggest holdings. Elsewhere, not owning index stocks Best Buy and Overstock.com hurt versus the index, as did overweighing poor-performing specialty retailer Ulta Beauty. Conversely, among the largest relative detractors were not owning apparel retailer Foot Locker and home-furnishings retailer Bed Bath & Beyond – each of which lost ground as they faced sluggish sales growth. Lastly, it helped to largely avoid auto-parts retailer Advance Auto Parts, which reported disappointing earnings for 2017. The fund did not own Advance Auto Parts until December, and we ended the period with an overweighting.
The views expressed above reflect those of the portfolio manager(s) only through the end of the period as stated on the cover of this report and do not necessarily represent the views of Fidelity or any other person in the Fidelity organization. Any such views are subject to change at any time based upon market or other conditions and Fidelity disclaims any responsibility to update such views. These views may not be relied on as investment advice and, because investment decisions for a Fidelity fund are based on numerous factors, may not be relied on as an indication of trading intent on behalf of any Fidelity fund.
Note to shareholders: On December 8, 2017, shareholders approved proposals from the Board of Trustees to eliminate each sector/industry fund's fundamental “invests primarily” policy and to modify the fundamental concentration policy for certain funds. The changes took effect on January 1, 2018, and do not impact how the funds are managed.
Retailing Portfolio
Investment Summary (Unaudited)
Top Ten Stocks as of February 28, 2018
| | % of fund's net assets |
| Amazon.com, Inc. | 24.4 |
| Home Depot, Inc. | 15.8 |
| Lowe's Companies, Inc. | 4.8 |
| Netflix, Inc. | 4.8 |
| The Booking Holdings, Inc. | 4.8 |
| TJX Companies, Inc. | 4.4 |
| Dollar General Corp. | 3.0 |
| Ross Stores, Inc. | 2.9 |
| AutoZone, Inc. | 2.5 |
| O'Reilly Automotive, Inc. | 2.4 |
| | 69.8 |
Top Industries (% of fund's net assets)
| As of February 28, 2018 |
| | Specialty Retail | 39.9% |
| | Internet & Direct Marketing Retail | 36.9% |
| | Multiline Retail | 5.6% |
| | Hotels, Restaurants & Leisure | 3.8% |
| | Textiles, Apparel & Luxury Goods | 2.7% |
| | All Others* | 11.1% |
* Includes short-term investments and net other assets (liabilities).
Retailing Portfolio
Schedule of Investments February 28, 2018
Showing Percentage of Net Assets
| Common Stocks - 94.7% | | | |
| | | Shares | Value |
| Distributors - 1.1% | | | |
| Distributors - 1.1% | | | |
| LKQ Corp. (a) | | 633,300 | $25,002,684 |
| Food & Staples Retailing - 1.9% | | | |
| Food Retail - 0.5% | | | |
| Alimentation Couche-Tard, Inc. Class B (sub. vtg.) | | 240,400 | 11,688,401 |
| Hypermarkets & Super Centers - 1.4% | | | |
| Costco Wholesale Corp. | | 98,443 | 18,792,769 |
| Walmart, Inc. | | 150,900 | 13,582,509 |
| | | | 32,375,278 |
|
| TOTAL FOOD & STAPLES RETAILING | | | 44,063,679 |
|
| Health Care Providers & Services - 0.4% | | | |
| Health Care Facilities - 0.4% | | | |
| Ryman Healthcare Group Ltd. | | 1,203,809 | 9,272,238 |
| Hotels, Restaurants & Leisure - 3.8% | | | |
| Casinos & Gaming - 0.5% | | | |
| MGM Mirage, Inc. | | 347,200 | 11,884,656 |
| Hotels, Resorts & Cruise Lines - 0.5% | | | |
| Accor SA | | 204,600 | 11,792,582 |
| Leisure Facilities - 0.6% | | | |
| Cedar Fair LP (depositary unit) | | 217,400 | 14,524,494 |
| Restaurants - 2.2% | | | |
| Compass Group PLC | | 824,600 | 17,518,800 |
| Dunkin' Brands Group, Inc. (b) | | 231,900 | 13,888,491 |
| U.S. Foods Holding Corp. (a) | | 545,600 | 18,217,584 |
| | | | 49,624,875 |
|
| TOTAL HOTELS, RESTAURANTS & LEISURE | | | 87,826,607 |
|
| Household Durables - 0.5% | | | |
| Household Appliances - 0.5% | | | |
| Techtronic Industries Co. Ltd. | | 1,873,500 | 11,754,329 |
| Internet & Direct Marketing Retail - 36.9% | | | |
| Internet & Direct Marketing Retail - 36.9% | | | |
| Amazon.com, Inc. (a) | | 375,330 | 567,667,859 |
| Expedia, Inc. | | 212,700 | 22,369,659 |
| Liberty Interactive Corp. QVC Group Series A (a) | | 1,230,200 | 35,515,874 |
| Netflix, Inc. (a) | | 386,700 | 112,676,646 |
| The Booking Holdings, Inc. (a) | | 54,880 | 111,628,115 |
| YOOX SpA (a) | | 207,400 | 9,518,317 |
| | | | 859,376,470 |
| Leisure Products - 0.4% | | | |
| Leisure Products - 0.4% | | | |
| Mattel, Inc. (b) | | 580,000 | 9,222,000 |
| Media - 0.9% | | | |
| Cable & Satellite - 0.4% | | | |
| Comcast Corp. Class A | | 259,300 | 9,389,253 |
| Movies & Entertainment - 0.5% | | | |
| Cinemark Holdings, Inc. | | 255,600 | 10,878,336 |
|
| TOTAL MEDIA | | | 20,267,589 |
|
| Multiline Retail - 5.6% | | | |
| Department Stores - 0.9% | | | |
| Macy's, Inc. | | 697,200 | 20,504,652 |
| General Merchandise Stores - 4.7% | | | |
| B&M European Value Retail S.A. | | 2,233,396 | 12,635,446 |
| Dollar General Corp. | | 726,600 | 68,729,094 |
| Dollar Tree, Inc. (a) | | 279,000 | 28,636,560 |
| | | | 110,001,100 |
|
| TOTAL MULTILINE RETAIL | | | 130,505,752 |
|
| Personal Products - 0.4% | | | |
| Personal Products - 0.4% | | | |
| Coty, Inc. Class A | | 527,600 | 10,193,232 |
| Specialty Retail - 39.9% | | | |
| Apparel Retail - 8.9% | | | |
| Inditex SA | | 261,098 | 7,905,047 |
| L Brands, Inc. | | 616,583 | 30,416,039 |
| Ross Stores, Inc. | | 857,300 | 66,946,557 |
| TJX Companies, Inc. | | 1,230,100 | 101,704,668 |
| | | | 206,972,311 |
| Automotive Retail - 5.9% | | | |
| Advance Auto Parts, Inc. | | 181,100 | 20,690,675 |
| AutoZone, Inc. (a) | | 88,463 | 58,803,125 |
| Monro, Inc. | | 55,000 | 2,799,500 |
| O'Reilly Automotive, Inc. (a) | | 224,186 | 54,743,979 |
| | | | 137,037,279 |
| Home Improvement Retail - 20.6% | | | |
| Home Depot, Inc. | | 2,016,400 | 367,529,228 |
| Lowe's Companies, Inc. | | 1,260,000 | 112,883,400 |
| | | | 480,412,628 |
| Specialty Stores - 4.5% | | | |
| Signet Jewelers Ltd. (b) | | 382,700 | 19,242,156 |
| Tiffany & Co., Inc. | | 347,400 | 35,101,296 |
| Tractor Supply Co. | | 338,600 | 21,985,298 |
| Ulta Beauty, Inc. | | 145,200 | 29,526,420 |
| | | | 105,855,170 |
|
| TOTAL SPECIALTY RETAIL | | | 930,277,388 |
|
| Textiles, Apparel & Luxury Goods - 2.7% | | | |
| Apparel, Accessories & Luxury Goods - 2.1% | | | |
| lululemon athletica, Inc. (a) | | 89,157 | 7,230,633 |
| Luxottica Group SpA | | 204,000 | 12,234,390 |
| Prada SpA | | 3,874,600 | 16,026,202 |
| Tapestry, Inc. | | 230,900 | 11,755,119 |
| | | | 47,246,344 |
| Footwear - 0.6% | | | |
| NIKE, Inc. Class B | | 217,840 | 14,601,815 |
|
| TOTAL TEXTILES, APPAREL & LUXURY GOODS | | | 61,848,159 |
|
| Trading Companies & Distributors - 0.2% | | | |
| Trading Companies & Distributors - 0.2% | | | |
| Bunzl PLC | | 210,300 | 5,644,451 |
| TOTAL COMMON STOCKS | | | |
| (Cost $1,151,013,078) | | | 2,205,254,578 |
|
| Money Market Funds - 5.5% | | | |
| Fidelity Cash Central Fund, 1.41% (c) | | 107,543,921 | 107,565,430 |
| Fidelity Securities Lending Cash Central Fund 1.42% (c)(d) | | 20,400,274 | 20,402,314 |
| TOTAL MONEY MARKET FUNDS | | | |
| (Cost $127,967,744) | | | 127,967,744 |
| TOTAL INVESTMENT IN SECURITIES - 100.2% | | | |
| (Cost $1,278,980,822) | | | 2,333,222,322 |
| NET OTHER ASSETS (LIABILITIES) - (0.2)% | | | (3,856,011) |
| NET ASSETS - 100% | | | $2,329,366,311 |
Legend
(a) Non-income producing
(b) Security or a portion of the security is on loan at period end.
(c) Affiliated fund that is generally available only to investment companies and other accounts managed by Fidelity Investments. The rate quoted is the annualized seven-day yield of the fund at period end. A complete unaudited listing of the fund's holdings as of its most recent quarter end is available upon request. In addition, each Fidelity Central Fund's financial statements, which are not covered by the Fund's Report of Independent Registered Public Accounting Firm, are available on the SEC's website or upon request.
(d) Investment made with cash collateral received from securities on loan.
Affiliated Central Funds
Information regarding fiscal year to date income earned by the Fund from investments in Fidelity Central Funds is as follows:
| Fund | Income earned |
| Fidelity Cash Central Fund | $579,935 |
| Fidelity Securities Lending Cash Central Fund | 213,108 |
| Total | $793,043 |
Amounts in the income column in the above table include any capital gain distributions from underlying funds, which are presented in the corresponding line-item in the Statement of Operations if applicable.
Investment Valuation
The following is a summary of the inputs used, as of February 28, 2018, involving the Fund's assets and liabilities carried at fair value. The inputs or methodology used for valuing securities may not be an indication of the risk associated with investing in those securities. For more information on valuation inputs, and their aggregation into the levels used below, please refer to the Investment Valuation section in the accompanying Notes to Financial Statements.
| | Valuation Inputs at Reporting Date: |
| Description | Total | Level 1 | Level 2 | Level 3 |
| Investments in Securities: | | | | |
| Common Stocks | $2,205,254,578 | $2,100,225,014 | $105,029,564 | $-- |
| Money Market Funds | 127,967,744 | 127,967,744 | -- | -- |
| Total Investments in Securities: | $2,333,222,322 | $2,228,192,758 | $105,029,564 | $-- |
The following is a summary of transfers between Level 1 and Level 2 for the period ended February 28, 2018. Transfers are assumed to have occurred at the beginning of the period, and are primarily attributable to the valuation techniques used for foreign equity securities, as discussed in the accompanying Notes to Financial Statements:
| Transfers | Total |
| Level 1 to Level 2 | $24,553,787 |
| Level 2 to Level 1 | $0 |
See accompanying notes which are an integral part of the financial statements.
Retailing Portfolio
Financial Statements
Statement of Assets and Liabilities
| | | February 28, 2018 |
| Assets | | |
Investment in securities, at value (including securities loaned of $19,580,828) — See accompanying schedule:
Unaffiliated issuers (cost $1,151,013,078) | $2,205,254,578 | |
| Fidelity Central Funds (cost $127,967,744) | 127,967,744 | |
| Total Investment in Securities (cost $1,278,980,822) | | $2,333,222,322 |
| Foreign currency held at value (cost $779,287) | | 779,287 |
| Receivable for investments sold | | 15,439,232 |
| Receivable for fund shares sold | | 7,641,847 |
| Dividends receivable | | 1,112,247 |
| Distributions receivable from Fidelity Central Funds | | 117,144 |
| Prepaid expenses | | 6,140 |
| Other receivables | | 10,725 |
| Total assets | | 2,358,328,944 |
| Liabilities | | |
| Payable for investments purchased | $5,408,949 | |
| Payable for fund shares redeemed | 1,669,473 | |
| Accrued management fee | 1,020,466 | |
| Other affiliated payables | 369,247 | |
| Other payables and accrued expenses | 89,598 | |
| Collateral on securities loaned | 20,404,900 | |
| Total liabilities | | 28,962,633 |
| Net Assets | | $2,329,366,311 |
| Net Assets consist of: | | |
| Paid in capital | | $1,257,111,162 |
| Distributions in excess of net investment income | | (639,206) |
| Accumulated undistributed net realized gain (loss) on investments and foreign currency transactions | | 18,652,146 |
| Net unrealized appreciation (depreciation) on investments and assets and liabilities in foreign currencies | | 1,054,242,209 |
| Net Assets, for 16,230,991 shares outstanding | | $2,329,366,311 |
| Net Asset Value, offering price and redemption price per share ($2,329,366,311 ÷ 16,230,991 shares) | | $143.51 |
See accompanying notes which are an integral part of the financial statements.
Statement of Operations
| | | Year ended February 28, 2018 |
| Investment Income | | |
| Dividends | | $19,645,426 |
| Income from Fidelity Central Funds (including $213,108 from security lending) | | 793,043 |
| Total income | | 20,438,469 |
| Expenses | | |
| Management fee | $10,491,795 | |
| Transfer agent fees | 3,566,871 | |
| Accounting and security lending fees | 593,187 | |
| Custodian fees and expenses | 27,638 | |
| Independent trustees' fees and expenses | 41,140 | |
| Registration fees | 93,455 | |
| Audit | 41,025 | |
| Legal | 24,215 | |
| Interest | 2,430 | |
| Miscellaneous | 82,199 | |
| Total expenses before reductions | 14,963,955 | |
| Expense reductions | (34,016) | 14,929,939 |
| Net investment income (loss) | | 5,508,530 |
| Realized and Unrealized Gain (Loss) | | |
| Net realized gain (loss) on: | | |
| Investment securities: | | |
| Unaffiliated issuers | 113,659,376 | |
| Fidelity Central Funds | (4,420) | |
| Foreign currency transactions | (17,622) | |
| Total net realized gain (loss) | | 113,637,334 |
| Change in net unrealized appreciation (depreciation) on: | | |
| Investment securities: | | |
| Unaffiliated issuers | 368,013,699 | |
| Fidelity Central Funds | (799) | |
| Assets and liabilities in foreign currencies | 7,071 | |
| Total change in net unrealized appreciation (depreciation) | | 368,019,971 |
| Net gain (loss) | | 481,657,305 |
| Net increase (decrease) in net assets resulting from operations | | $487,165,835 |
See accompanying notes which are an integral part of the financial statements.
Statement of Changes in Net Assets
| | Year ended February 28, 2018 | Year ended February 28, 2017 |
| Increase (Decrease) in Net Assets | | |
| Operations | | |
| Net investment income (loss) | $5,508,530 | $1,397,815 |
| Net realized gain (loss) | 113,637,334 | 18,197,857 |
| Change in net unrealized appreciation (depreciation) | 368,019,971 | 289,174,021 |
| Net increase (decrease) in net assets resulting from operations | 487,165,835 | 308,769,693 |
| Distributions to shareholders from net investment income | (4,427,075) | (2,743,328) |
| Distributions to shareholders from net realized gain | (65,230,373) | – |
| Total distributions | (69,657,448) | (2,743,328) |
| Share transactions | | |
| Proceeds from sales of shares | 575,718,782 | 851,900,058 |
| Reinvestment of distributions | 66,546,015 | 2,631,909 |
| Cost of shares redeemed | (654,809,547) | (1,086,215,468) |
| Net increase (decrease) in net assets resulting from share transactions | (12,544,750) | (231,683,501) |
| Redemption fees | – | 64,279 |
| Total increase (decrease) in net assets | 404,963,637 | 74,407,143 |
| Net Assets | | |
| Beginning of period | 1,924,402,674 | 1,849,995,531 |
| End of period | $2,329,366,311 | $1,924,402,674 |
| Other Information | | |
| Distributions in excess of net investment income end of period | $(639,206) | $(1,279,549) |
| Shares | | |
| Sold | 4,373,409 | 7,963,159 |
| Issued in reinvestment of distributions | 508,567 | 23,719 |
| Redeemed | (5,294,315) | (10,069,012) |
| Net increase (decrease) | (412,339) | (2,082,134) |
See accompanying notes which are an integral part of the financial statements.
Financial Highlights
Retailing Portfolio
| | | | | | |
| Years ended February 28, | 2018 | 2017 | 2016 A | 2015 | 2014 |
| Selected Per–Share Data | | | | | |
| Net asset value, beginning of period | $115.63 | $98.80 | $95.26 | $88.40 | $66.59 |
| Income from Investment Operations | | | | | |
| Net investment income (loss)B | .36 | .08 | .13C | .31D | .15E |
| Net realized and unrealized gain (loss) | 32.32 | 16.90 | 4.69 | 13.72 | 23.64 |
| Total from investment operations | 32.68 | 16.98 | 4.82 | 14.03 | 23.79 |
| Distributions from net investment income | (.31) | (.15) | (.18) | (.17) | (.12) |
| Distributions from net realized gain | (4.49) | – | (1.10) | (7.01) | (1.86) |
| Total distributions | (4.80) | (.15) | (1.29)F | (7.17)G | (1.99)H |
| Redemption fees added to paid in capitalB | – | –I | .01 | –I | .01 |
| Net asset value, end of period | $143.51 | $115.63 | $98.80 | $95.26 | $88.40 |
| Total ReturnJ | 28.66% | 17.20% | 5.11% | 17.29% | 35.82% |
| Ratios to Average Net AssetsK,L | | | | | |
| Expenses before reductions | .78% | .78% | .81% | .81% | .83% |
| Expenses net of fee waivers, if any | .77% | .78% | .80% | .81% | .83% |
| Expenses net of all reductions | .77% | .78% | .80% | .81% | .82% |
| Net investment income (loss) | .29% | .07% | .14%C | .36%D | .18%E |
| Supplemental Data | | | | | |
| Net assets, end of period (000 omitted) | $2,329,366 | $1,924,403 | $1,849,996 | $915,177 | $1,063,920 |
| Portfolio turnover rateM | 24% | 17% | 11% | 31% | 72% |
A For the year ended February 29.
B Calculated based on average shares outstanding during the period.
C Net Investment income per share reflects a large, non-recurring dividend which amounted to $.12 per share. Excluding this non-recurring dividend, the ratio of net investment income (loss) to average net assets would have been .02%.
D Net Investment income per share reflects a large, non-recurring dividend which amounted to $.13 per share. Excluding this non-recurring dividend, the ratio of net investment income (loss) to average net assets would have been .22%.
E Net Investment income per share reflects a large, non-recurring dividend which amounted to $.08 per share. Excluding this non-recurring dividend, the ratio of net investment income (loss) to average net assets would have been .08%.
F Total distributions of $1.29 per share is comprised of distributions from net investment income of $.182 and distributions from net realized gain of $1.103 per share.
G Total distributions of $7.17 per share is comprised of distributions from net investment income of $.166 and distributions from net realized gain of $7.006 per share.
H Total distributions of $1.99 per share is comprised of distributions from net investment income of $.124 and distributions from net realized gain of $1.861 per share.
I Amount represents less than $.005 per share.
J Total returns would have been lower if certain expenses had not been reduced during the applicable periods shown.
K Fees and expenses of any underlying Fidelity Central Funds are not included in the Fund's expense ratio. The Fund indirectly bears its proportionate share of the expenses of any underlying Fidelity Central Funds.
L Expense ratios reflect operating expenses of the Fund. Expenses before reductions do not reflect amounts reimbursed by the investment adviser or reductions from brokerage service arrangements or reductions from other expense offset arrangements and do not represent the amount paid by the Fund during periods when reimbursements or reductions occur. Expenses net of fee waivers reflect expenses after reimbursement by the investment adviser but prior to reductions from brokerage service arrangements or other expense offset arrangements. Expenses net of all reductions represent the net expenses paid by the Fund.
M Amount does not include the portfolio activity of any underlying Fidelity Central Funds.
See accompanying notes which are an integral part of the financial statements.
Notes to Financial Statements
For the period ended February 28, 2018
1. Organization.
Automotive Portfolio, Construction and Housing Portfolio, Consumer Discretionary Portfolio, Leisure Portfolio, Multimedia Portfolio, and Retailing Portfolio (the Funds) are non-diversified funds of Fidelity Select Portfolios (the Trust). The Trust is registered under the Investment Company Act of 1940, as amended (the 1940 Act), as an open-end management investment company organized as a Massachusetts business trust. The Funds invest primarily in securities of companies whose principal business activities fall within specific industries. Each Fund is authorized to issue an unlimited number of shares. Share transactions on the Statement of Changes in Net Assets may contain exchanges between affiliated funds.
2. Investments in Fidelity Central Funds.
The Funds invests in Fidelity Central Funds, which are open-end investment companies generally available only to other investment companies and accounts managed by the investment adviser and its affiliates. The Funds' Schedules of Investments list each of the Fidelity Central Funds held as of period end, if any, as an investment of each Fund, but do not include the underlying holdings of each Fidelity Central Fund. As an Investing Fund, each Fund indirectly bears its proportionate share of the expenses of the underlying Fidelity Central Funds.
The Money Market Central Funds seek preservation of capital and current income and are managed by Fidelity Investments Money Management, Inc. (FIMM), an affiliate of the investment adviser. Annualized expenses of the Money Market Central Funds as of their most recent shareholder report date are less than .005%.
A complete unaudited list of holdings for each Fidelity Central Fund is available upon request or at the Securities and Exchange Commission (the SEC) website at www.sec.gov. In addition, the financial statements of the Fidelity Central Funds, which are not covered by the Funds' Report of Independent Registered Public Accounting Firm, are available on the SEC website or upon request.
3. Significant Accounting Policies.
Each Fund is an investment company and applies the accounting and reporting guidance of the Financial Accounting Standards Board (FASB) Accounting Standards Codification Topic 946 Financial Services – Investments Companies. The financial statements have been prepared in conformity with accounting principles generally accepted in the United States of America (GAAP), which require management to make certain estimates and assumptions at the date of the financial statements. Actual results could differ from those estimates. Subsequent events, if any, through the date that the financial statements were issued have been evaluated in the preparation of the financial statements. The following summarizes the significant accounting policies of the Funds:
Investment Valuation. Investments are valued as of 4:00 p.m. Eastern time on the last calendar day of the period. The Board of Trustees (the Board) has delegated the day to day responsibility for the valuation of each Fund's investments to the Fair Value Committee (the Committee) established by each Fund's investment adviser. In accordance with valuation policies and procedures approved by the Board, each Fund attempts to obtain prices from one or more third party pricing vendors or brokers to value its investments. When current market prices, quotations or currency exchange rates are not readily available or reliable, investments will be fair valued in good faith by the Committee, in accordance with procedures adopted by the Board. Factors used in determining fair value vary by investment type and may include market or investment specific events, changes in interest rates and credit quality. The frequency with which these procedures are used cannot be predicted and they may be utilized to a significant extent. The Committee oversees each Fund's valuation policies and procedures and reports to the Board on the Committee's activities and fair value determinations. The Board monitors the appropriateness of the procedures used in valuing each Fund's investments and ratifies the fair value determinations of the Committee.
Each Fund categorizes the inputs to valuation techniques used to value its investments into a disclosure hierarchy consisting of three levels as shown below:
- Level 1 – quoted prices in active markets for identical investments
- Level 2 – other significant observable inputs (including quoted prices for similar investments, interest rates, prepayment speeds, etc.)
- Level 3 – unobservable inputs (including the Fund's own assumptions based on the best information available)
Valuation techniques used to value each Fund's investments by major category are as follows:
Equity securities, including restricted securities, for which market quotations are readily available, are valued at the last reported sale price or official closing price as reported by a third party pricing vendor on the primary market or exchange on which they are traded and are categorized as Level 1 in the hierarchy. In the event there were no sales during the day or closing prices are not available, securities are valued at the last quoted bid price or may be valued using the last available price and are generally categorized as Level 2 in the hierarchy. For foreign equity securities, when market or security specific events arise, comparisons to the valuation of American Depositary Receipts (ADRs), futures contracts, Exchange-Traded Funds (ETFs) and certain indexes as well as quoted prices for similar securities may be used and would be categorized as Level 2 in the hierarchy. Utilizing these techniques may result in transfers between Level 1 and Level 2. For equity securities, including restricted securities, where observable inputs are limited, assumptions about market activity and risk are used and these securities may be categorized as Level 3 in the hierarchy.
Investments in open-end mutual funds, including the Fidelity Central Funds, are valued at their closing net asset value (NAV) each business day and are categorized as Level 1 in the hierarchy.
Changes in valuation techniques may result in transfers in or out of an assigned level within the disclosure hierarchy. The aggregate value of investments by input level as of February 28, 2018, including information on transfers between Levels 1 and 2, is included at the end of each applicable Fund's Schedule of Investments.
Foreign Currency. The Funds may use foreign currency contracts to facilitate transactions in foreign-denominated securities. Gains and losses from these transactions may arise from changes in the value of the foreign currency or if the counterparties do not perform under the contracts' terms.
Foreign-denominated assets, including investment securities, and liabilities are translated into U.S. dollars at the exchange rates at period end. Purchases and sales of investment securities, income and dividends received and expenses denominated in foreign currencies are translated into U.S. dollars at the exchange rate in effect on the transaction date.
The effects of exchange rate fluctuations on investments are included with the net realized and unrealized gain (loss) on investment securities. Other foreign currency transactions resulting in realized and unrealized gain (loss) are disclosed separately.
Investment Transactions and Income. For financial reporting purposes, the Funds' investment holdings and NAV include trades executed through the end of the last business day of the period. The NAV per share for processing shareholder transactions is calculated as of the close of business of the New York Stock Exchange (NYSE), normally 4:00 p.m. Eastern time and includes trades executed through the end of the prior business day. Gains and losses on securities sold are determined on the basis of identified cost and includes proceeds received from litigation. Dividend income is recorded on the ex-dividend date, except for certain dividends from foreign securities where the ex-dividend date may have passed, which are recorded as soon as the Funds are informed of the ex-dividend date. Non-cash dividends included in dividend income, if any, are recorded at the fair market value of the securities received. Income and capital gain distributions from Fidelity Central Funds, if any, are recorded on the ex-dividend date. Certain distributions received by the Funds represent a return of capital or capital gain. The Funds determine the components of these distributions subsequent to the ex-dividend date, based upon receipt of tax filings or other correspondence relating to the underlying investment. These distributions are recorded as a reduction of cost of investments and/or as a realized gain. Large, non-recurring dividends recognized by the Funds are presented separately on the Statement of Operations as "Special Dividends" and the impact of these dividends is presented in the Financial Highlights. Interest income is accrued as earned and includes coupon interest and amortization of premium and accretion of discount on debt securities as applicable. Investment income is recorded net of foreign taxes withheld where recovery of such taxes is uncertain.
Expenses. Expenses directly attributable to a fund are charged to that fund. Expenses attributable to more than one fund are allocated among the respective funds on the basis of relative net assets or other appropriate methods. Expense estimates are accrued in the period to which they relate and adjustments are made when actual amounts are known.
Income Tax Information and Distributions to Shareholders. Each year, each Fund intends to qualify as a regulated investment company under Subchapter M of the Internal Revenue Code, including distributing substantially all of its taxable income and realized gains. As a result, no provision for U.S. Federal income taxes is required. As of February 28, 2018, each Fund did not have any unrecognized tax benefits in the financial statements; nor is each Fund aware of any tax positions for which it is reasonably possible that the total amounts of unrecognized tax benefits will significantly change in the next twelve months. Each Fund files a U.S. federal tax return, in addition to state and local tax returns as required. Each Fund's federal income tax returns are subject to examination by the Internal Revenue Service (IRS) for a period of three fiscal years after they are filed. State and local tax returns may be subject to examination for an additional fiscal year depending on the jurisdiction. Foreign taxes are provided for based on each Fund's understanding of the tax rules and rates that exist in the foreign markets in which it invests.
Distributions are declared and recorded on the ex-dividend date. Income and capital gain distributions are determined in accordance with income tax regulations, which may differ from GAAP. In addition, certain Funds claimed a portion of the payment made to redeeming shareholders as a distribution for income tax purposes.
Capital accounts within the financial statements are adjusted for permanent book-tax differences. These adjustments have no impact on net assets or the results of operations. Capital accounts are not adjusted for temporary book-tax differences which will reverse in a subsequent period.
Book-tax differences are primarily due to foreign currency transactions, partnerships, deferred trustees compensation, capital loss carryforwards and losses deferred due to wash sales and excise tax regulations.
As of period end, the cost and unrealized appreciation (depreciation) in securities, and derivatives if applicable, for federal income tax purposes were as follows for each Fund:
| | Tax cost | Gross unrealized appreciation | Gross unrealized depreciation | Net unrealized appreciation (depreciation) |
| Automotive Portfolio | $48,350,294 | $15,179,114 | $(1,174,312) | $14,004,802 |
| Construction and Housing Portfolio | 241,598,756 | 102,832,732 | (12,589,913) | 90,242,819 |
| Consumer Discretionary Portfolio | 586,614,012 | 251,132,237 | (11,158,619) | 239,973,618 |
| Leisure Portfolio | 356,062,592 | 202,026,815 | (1,801,216) | 200,225,599 |
| Multimedia Portfolio | 262,933,452 | 259,025,275 | (954,742) | 258,070,533 |
| Retailing Portfolio | 1,279,397,373 | 1,106,220,921 | (52,395,972) | 1,053,824,949 |
The tax-based components of distributable earnings as of period end were as follows for each Fund:
| | Undistributed ordinary income | Undistributed long-term capital gain | Net unrealized appreciation (depreciation) on securities and other investments |
| Automotive Portfolio | $79,776 | $1,819,380 | $14,003,489 |
| Construction and Housing Portfolio | 512,402 | 15,030,984 | 90,242,819 |
| Consumer Discretionary Portfolio | 228,321 | 12,501,078 | 239,973,954 |
| Leisure Portfolio | 1,407,976 | 27,004,476 | 199,779,914 |
| Multimedia Portfolio | 270,717 | 26,884,955 | 258,070,533 |
| Retailing Portfolio | – | 19,068,697 | 1,053,582,248 |
The tax character of distributions paid was as follows:
| February 28, 2018 | | | |
| | Ordinary Income | Long-term Capital Gains | Total |
| Automotive Portfolio | $298,505 | $8,188,561 | $8,487,066 |
| Construction and Housing Portfolio | 1,543,811 | 46,308,729 | 47,852,540 |
| Consumer Discretionary Portfolio | 2,342,887 | 26,353,209 | 28,696,096 |
| Leisure Portfolio | 4,166,156 | 27,657,199 | 31,823,355 |
| Multimedia Portfolio | 1,071,017 | 29,592,267 | 30,663,284 |
| Retailing Portfolio | 4,427,075 | 65,230,373 | 69,657,448 |
| February 28, 2017 | | | |
| | Ordinary Income | Long-term Capital Gains | Total |
| Automotive Portfolio | $804,065 | $3,128,021 | $3,932,086 |
| Construction and Housing Portfolio | 2,958,507 | 10,930,766 | 13,889,273 |
| Consumer Discretionary Portfolio | 7,587,944 | – | 7,587,944 |
| Leisure Portfolio | 3,947,620 | – | 3,947,620 |
| Multimedia Portfolio | 12,985,625 | 28,679,661 | 41,665,286 |
| Retailing Portfolio | 2,743,328 | – | 2,743,328 |
Trading (Redemption) Fees. Shares held by investors in the Automotive Portfolio, Construction and Housing Portfolio, Leisure Portfolio and Multimedia portfolio for less than 30 days may be subject to a redemption fee equal to .75% of the NAV of shares redeemed. All redemption fees, which reduce the proceeds of the shareholder redemption, are retained by the Funds and accounted for as an addition to paid in capital. In November 2017, the Board of Trustees approved the elimination of these redemption fees effective December 18, 2017.
Restricted Securities. The Funds may invest in securities that are subject to legal or contractual restrictions on resale. These securities generally may be resold in transactions exempt from registration or to the public if the securities are registered. Disposal of these securities may involve time-consuming negotiations and expense, and prompt sale at an acceptable price may be difficult. Information regarding restricted securities is included at the end of each applicable Fund's Schedule of Investments.
4. Purchases and Sales of Investments.
Purchases and sales of securities, other than short-term securities, are noted in the table below.
| | Purchases ($) | Sales ($) |
| Automotive Portfolio | 63,538,415 | 69,082,748 |
| Construction and Housing Portfolio | 210,873,365 | 317,739,562 |
| Consumer Discretionary Portfolio | 553,185,537 | 709,443,204 |
| Leisure Portfolio | 333,530,630 | 282,430,532 |
| Multimedia Portfolio | 136,137,805 | 314,960,714 |
| Retailing Portfolio | 457,398,374 | 569,157,179 |
5. Fees and Other Transactions with Affiliates.
Management Fee. Fidelity SelectCo, LLC (the investment adviser) and its affiliates provide the Funds with investment management related services for which the Funds pay a monthly management fee. The management fee is the sum of an individual fund fee rate and an annualized group fee rate. The individual fund fee rate is applied to each Fund's average net assets. The group fee rate is based upon the average net assets of all the mutual funds advised by Fidelity Management & Research Company (FMR) and the investment adviser. The group fee rate decreases as assets under management increase and increases as assets under management decrease. For the reporting period, each Fund's annual management fee rate expressed as a percentage of each Fund's average net assets was as follows:
| | Individual Rate | Group Rate | Total |
| Automotive Portfolio | .30% | .24% | .54% |
| Construction and Housing Portfolio | .30% | .24% | .54% |
| Consumer Discretionary Portfolio | .30% | .24% | .54% |
| Leisure Portfolio | .30% | .24% | .54% |
| Multimedia Portfolio | .30% | .24% | .54% |
| Retailing Portfolio | .30% | .24% | .54% |
Transfer Agent Fees. Fidelity Investments Institutional Operations Company, Inc. (FIIOC), an affiliate of the investment adviser, is the Funds' transfer, dividend disbursing and shareholder servicing agent. FIIOC receives account fees and asset-based fees that vary according to account size and type of account. FIIOC pays for typesetting, printing and mailing of shareholder reports, except proxy statements. For the period, transfer agent fees were equivalent to the following annual rates expressed as a percentage of average net assets:
| Automotive Portfolio | .23% |
| Construction and Housing Portfolio | .19% |
| Consumer Discretionary Portfolio | .17% |
| Leisure Portfolio | .17% |
| Multimedia Portfolio | .20% |
| Retailing Portfolio | .18% |
Accounting and Security Lending Fees. Fidelity Service Company, Inc. (FSC), an affiliate of the investment adviser, maintains each Fund's accounting records. The accounting fee is based on the level of average net assets for each month. Under a separate contract, FSC administers the security lending program. The security lending fee is based on the number and duration of lending transactions.
Brokerage Commissions. Certain Funds placed a portion of their portfolio transactions with brokerage firms which are affiliates of the investment adviser. Brokerage commissions are included in net realized gain (loss) and change in net unrealized appreciation (depreciation) in the Statement of Operations. The commissions paid to these affiliated firms were as follows:
| | Amount |
| Automotive Portfolio | $1,228 |
| Construction and Housing Portfolio | 6,485 |
| Consumer Discretionary Portfolio | 12,128 |
| Leisure Portfolio | 7,077 |
| Multimedia Portfolio | 6,539 |
| Retailing Portfolio | 5,687 |
Interfund Lending Program. Pursuant to an Exemptive Order issued by the SEC, the Funds, along with other registered investment companies having management contracts with Fidelity Management & Research Company (FMR) or other affiliated entities of FMR, may participate in an interfund lending program. This program provides an alternative credit facility allowing the funds to borrow from, or lend money to, other participating affiliated funds. At period end, there were no interfund loans outstanding. Each applicable fund's activity in this program during the period for which loans were outstanding was as follows:
| | Borrower or Lender | Average Loan Balance | Weighted Average Interest Rate | Interest Expense |
| Construction and Housing Portfolio | Borrower | $5,651,500 | 1.34% | $420 |
| Consumer Discretionary Portfolio | Borrower | 27,816,600 | 1.10% | 4,246 |
| Leisure Portfolio | Borrower | 8,600,000 | 1.33% | 1,595 |
| Multimedia Portfolio | Borrower | 5,795,000 | 1.08% | 873 |
| Retailing Portfolio | Borrower | 2,708,800 | 1.35% | 1,013 |
Interfund Trades. The Funds may purchase from or sell securities to other Fidelity Funds under procedures adopted by the Board. The procedures have been designed to ensure these interfund trades are executed in accordance with Rule 17a-7 of the 1940 Act. Interfund trades are included within the respective purchases and sales amounts shown in the Purchases and Sales of Investments note.
Prior Fiscal Year Redemptions In-Kind. During the prior period, 7,597,094 shares of Consumer Discretionary Portfolio held by an affiliated entity were redeemed in-kind for investments and cash with a value of $255,946,088. The Fund had a net realized gain of $63,305,455 on investments delivered through in-kind redemptions. The amount of in-kind redemptions is included in share transactions in the accompanying Statement of Changes in Net Assets. Consumer Discretionary Portfolio recognized no gain or loss for federal income tax purposes.
6. Committed Line of Credit.
Certain Funds participate with other funds managed by the investment adviser or an affiliate in a $4.25 billion credit facility (the "line of credit") to be utilized for temporary or emergency purposes to fund shareholder redemptions or for other short-term liquidity purposes. The participating funds have agreed to pay commitment fees on their pro-rata portion of the line of credit, which are reflected in Miscellaneous expenses on the Statement of Operations, and are as follows:
| Automotive Portfolio | $166 |
| Construction and Housing Portfolio | 1,189 |
| Consumer Discretionary Portfolio | 2,323 |
| Leisure Portfolio | 1,482 |
| Multimedia Portfolio | 1,959 |
| Retailing Portfolio | 5,781 |
During the period, the Funds did not borrow on this line of credit.
7. Security Lending.
Certain Funds lend portfolio securities through a lending agent from time to time in order to earn additional income. On the settlement date of the loan, each applicable Fund receives collateral (in the form of U.S. Treasury obligations, letters of credit and/or cash) against the loaned securities and maintains collateral in an amount not less than 100% of the market value of the loaned securities during the period of the loan. The market value of the loaned securities is determined at the close of business of the Funds and any additional required collateral is delivered to the Funds on the next business day. The Funds or borrower may terminate the loan at any time, and if the borrower defaults on its obligation to return the securities loaned because of insolvency or other reasons, the Funds may apply collateral received from the borrower against the obligation. The Funds may experience delays and costs in recovering the securities loaned. Any cash collateral received is invested in the Fidelity Securities Lending Cash Central Fund. The value of loaned securities and cash collateral at period end are disclosed on each applicable Fund's Statement of Assets and Liabilities. Security lending income represents the income earned on investing cash collateral, less rebates paid to borrowers and any lending agent fees associated with the loan, plus any premium payments received for lending certain types of securities. Security lending income is presented on each applicable Fund's Statement of Operations as a component of income from Fidelity Central Funds.
8. Bank Borrowings.
Each Fund is permitted to have bank borrowings for temporary or emergency purposes to fund shareholder redemptions or for other short-term liquidity requirements. Each Fund has established borrowing arrangements with certain banks. The interest rate on the borrowings is the bank's base rate, as revised from time to time. At period end, there were no bank borrowings outstanding. Each applicable Fund's activity in this program during the period for which loans were outstanding was as follows:
| | Average Loan Balance | Weighted Average Interest Rate | Interest Expense |
| Retailing Portfolio | $2,794,273 | 1.66% | $1,417 |
9. Expense Reductions.
Commissions paid to certain brokers with whom the investment adviser, or its affiliates, places trades on behalf of Certain Funds include an amount in addition to trade execution, which may be rebated back to the Funds to offset certain expenses. In addition, through arrangements with each applicable Fund's custodian, credits realized as a result of certain uninvested cash balances were used to reduce each applicable Fund's expenses. All of the applicable expense reductions are noted in the table below.
| | Brokerage Service reduction |
| Automotive Portfolio | $2,175 |
| Construction and Housing Portfolio | 18,991 |
| Consumer Discretionary Portfolio | 50,948 |
| Leisure Portfolio | 11,499 |
| Multimedia Portfolio | 41,807 |
| Retailing Portfolio | 15,192 |
In addition, during the period the investment adviser reimbursed and/or waived a portion of operating expenses as follows:
| | Amount |
| Automotive Portfolio | $545 |
| Construction and Housing Portfolio | 3,604 |
| Consumer Discretionary Portfolio | 7,339 |
| Leisure Portfolio | 4,404 |
| Multimedia Portfolio | 5,230 |
| Retailing Portfolio | 18,824 |
10. Other.
The Funds' organizational documents provide former and current trustees and officers with a limited indemnification against liabilities arising in connection with the performance of their duties to the Funds. In the normal course of business, the Funds may also enter into contracts that provide general indemnifications. The Funds' maximum exposure under these arrangements is unknown as this would be dependent on future claims that may be made against the Funds. The risk of material loss from such claims is considered remote.
At the end of the period, the following mutual funds managed by the investment adviser or its affiliates were the owners of record of 10% or more of the total outstanding shares of the following Funds.
| | VIP Funds Manager 50% Portfolio | VIP Funds Manager 60% Portfolio |
| Consumer Discretionary Portfolio | 20% | 23% |
Mutual funds managed by the investment adviser or its affiliates, in aggregate, were the owners of record of more than 20% of the total outstanding shares of the following Funds.
| | % of shares held |
| Consumer Discretionary Portfolio | 54% |
Effective after the close of business on April 13, 2018, shares of Consumer Discretionary Portfolio held by the VIP FundsManager Portfolios were redeemed in-kind for investments. Consumer Discretionary Portfolio realized gain (loss) for book purposes, but did not recognize any gain or loss for federal income tax purposes. The VIP FundsManager Portfolios' ownership in Consumer Discretionary Portfolio was reduced to 0%.
Report of Independent Registered Public Accounting Firm
To the Trustees of Fidelity Select Portfolios and the Shareholders of Automotive Portfolio, Construction and Housing Portfolio, Consumer Discretionary Portfolio, Leisure Portfolio, Multimedia Portfolio and Retailing Portfolio:
Opinion on the Financial Statements
We have audited the accompanying statements of assets and liabilities, including the schedules of investments, of Automotive Portfolio, Construction and Housing Portfolio, Consumer Discretionary Portfolio, Leisure Portfolio, Multimedia Portfolio and Retailing Portfolio (six of the funds constituting Fidelity Select Portfolios, hereafter collectively referred to as the "Funds") as of February 28, 2018, the related statements of operations for the year ended February 28, 2018, the statements of changes in net assets for each of the two years in the period ended February 28, 2018 including the related notes, and the financial highlights for each of the five years in the period ended February 28, 2018 (collectively referred to as the “financial statements”). In our opinion, the financial statements present fairly, in all material respects, the financial position of each of the Funds as of February 28, 2018, the results of each of their operations for the year then ended, the changes in each of their net assets for each of the two years in the period ended February 28, 2018 and each of the financial highlights for each of the five years in the period ended February 28, 2018 in conformity with accounting principles generally accepted in the United States of America.
Basis for Opinion
These financial statements are the responsibility of the Funds' management. Our responsibility is to express an opinion on the Funds' financial statements based on our audits. We are a public accounting firm registered with the Public Company Accounting Oversight Board (United States) (“PCAOB”) and are required to be independent with respect to the Funds in accordance with the U.S. federal securities laws and the applicable rules and regulations of the Securities and Exchange Commission and the PCAOB.
We conducted our audits of these financial statements in accordance with the standards of the PCAOB. Those standards require that we plan and perform the audit to obtain reasonable assurance about whether the financial statements are free of material misstatement, whether due to error or fraud.
Our audits included performing procedures to assess the risks of material misstatement of the financial statements, whether due to error or fraud, and performing procedures that respond to those risks. Such procedures included examining, on a test basis, evidence regarding the amounts and disclosures in the financial statements. Our audits also included evaluating the accounting principles used and significant estimates made by management, as well as evaluating the overall presentation of the financial statements. Our procedures included confirmation of securities owned as of February 28, 2018 by correspondence with the custodians, and brokers; when replies were not received from brokers, we performed other auditing procedures. We believe that our audits provide a reasonable basis for our opinion.
PricewaterhouseCoopers LLP
Boston, Massachusetts
April 16, 2018
We have served as the auditor of one or more investment companies in the Fidelity group of funds since 1932.
Trustees and Officers
The Trustees, Members of the Advisory Board (if any), and officers of the trusts and funds, as applicable, are listed below. The Board of Trustees governs each fund and is responsible for protecting the interests of shareholders. The Trustees are experienced executives who meet periodically throughout the year to oversee each fund's activities, review contractual arrangements with companies that provide services to each fund, oversee management of the risks associated with such activities and contractual arrangements, and review each fund's performance. Except for Michael E. Wiley, each of the Trustees oversees 281 funds. Michael E. Wiley oversees 193 funds.
The Trustees hold office without limit in time except that (a) any Trustee may resign; (b) any Trustee may be removed by written instrument, signed by at least two-thirds of the number of Trustees prior to such removal; (c) any Trustee who requests to be retired or who has become incapacitated by illness or injury may be retired by written instrument signed by a majority of the other Trustees; and (d) any Trustee may be removed at any special meeting of shareholders by a two-thirds vote of the outstanding voting securities of the trust. Each Trustee who is not an interested person (as defined in the 1940 Act) of the trust and the funds is referred to herein as an Independent Trustee. Each Independent Trustee shall retire not later than the last day of the calendar year in which his or her 75th birthday occurs. The Independent Trustees may waive this mandatory retirement age policy with respect to individual Trustees. Officers and Advisory Board Members hold office without limit in time, except that any officer or Advisory Board Member may resign or may be removed by a vote of a majority of the Trustees at any regular meeting or any special meeting of the Trustees. Except as indicated, each individual has held the office shown or other offices in the same company for the past five years.
Each fund’s Statement of Additional Information (SAI) includes more information about the Trustees. To request a free copy, call Fidelity at [insert applicable phone number(s) from SAI front cover].
Experience, Skills, Attributes, and Qualifications of the Trustees. The Governance and Nominating Committee has adopted a statement of policy that describes the experience, qualifications, attributes, and skills that are necessary and desirable for potential Independent Trustee candidates (Statement of Policy). The Board believes that each Trustee satisfied at the time he or she was initially elected or appointed a Trustee, and continues to satisfy, the standards contemplated by the Statement of Policy. The Governance and Nominating Committee also engages professional search firms to help identify potential Independent Trustee candidates who have the experience, qualifications, attributes, and skills consistent with the Statement of Policy. From time to time, additional criteria based on the composition and skills of the current Independent Trustees, as well as experience or skills that may be appropriate in light of future changes to board composition, business conditions, and regulatory or other developments, have also been considered by the professional search firms and the Governance and Nominating Committee. In addition, the Board takes into account the Trustees' commitment and participation in Board and committee meetings, as well as their leadership of standing and ad hoc committees throughout their tenure.
In determining that a particular Trustee was and continues to be qualified to serve as a Trustee, the Board has considered a variety of criteria, none of which, in isolation, was controlling. The Board believes that, collectively, the Trustees have balanced and diverse experience, qualifications, attributes, and skills, which allow the Board to operate effectively in governing each fund and protecting the interests of shareholders. Information about the specific experience, skills, attributes, and qualifications of each Trustee, which in each case led to the Board's conclusion that the Trustee should serve (or continue to serve) as a trustee of the funds, is provided below.
Board Structure and Oversight Function. James C. Curvey is an interested person and currently serves as Chairman. The Trustees have determined that an interested Chairman is appropriate and benefits shareholders because an interested Chairman has a personal and professional stake in the quality and continuity of services provided to the funds. Independent Trustees exercise their informed business judgment to appoint an individual of their choosing to serve as Chairman, regardless of whether the Trustee happens to be independent or a member of management. The Independent Trustees have determined that they can act independently and effectively without having an Independent Trustee serve as Chairman and that a key structural component for assuring that they are in a position to do so is for the Independent Trustees to constitute a substantial majority for the Board. The Independent Trustees also regularly meet in executive session. Ned C. Lautenbach serves as Chairman of the Independent Trustees and as such (i) acts as a liaison between the Independent Trustees and management with respect to matters important to the Independent Trustees and (ii) with management prepares agendas for Board meetings.
Fidelity® funds are overseen by different Boards of Trustees. The funds' Board oversees Fidelity's high income and certain equity funds, and other Boards oversee Fidelity's investment-grade bond, money market, asset allocation, and other equity funds. The asset allocation funds may invest in Fidelity® funds overseen by the funds' Board. The use of separate Boards, each with its own committee structure, allows the Trustees of each group of Fidelity® funds to focus on the unique issues of the funds they oversee, including common research, investment, and operational issues. On occasion, the separate Boards establish joint committees to address issues of overlapping consequences for the Fidelity® funds overseen by each Board.
The Trustees operate using a system of committees to facilitate the timely and efficient consideration of all matters of importance to the Trustees, each fund, and fund shareholders and to facilitate compliance with legal and regulatory requirements and oversight of the funds' activities and associated risks. The Board, acting through its committees, has charged SelectCo and its affiliates with (i) identifying events or circumstances the occurrence of which could have demonstrably adverse effects on the funds' business and/or reputation; (ii) implementing processes and controls to lessen the possibility that such events or circumstances occur or to mitigate the effects of such events or circumstances if they do occur; and (iii) creating and maintaining a system designed to evaluate continuously business and market conditions in order to facilitate the identification and implementation processes described in (i) and (ii) above. Because the day-to-day operations and activities of the funds are carried out by or through SelectCo, its affiliates, and other service providers, the funds' exposure to risks is mitigated but not eliminated by the processes overseen by the Trustees. While each of the Board's committees has responsibility for overseeing different aspects of the funds' activities, oversight is exercised primarily through the Operations, Audit, and Compliance Committees. In addition, the Independent Trustees have worked with Fidelity to enhance the Board's oversight of investment and financial risks, legal and regulatory risks, technology risks, and operational risks, including the development of additional risk reporting to the Board. Appropriate personnel, including but not limited to the funds' Chief Compliance Officer (CCO), SelectCo's internal auditor, the independent accountants, the funds' Treasurer and portfolio management personnel, make periodic reports to the Board's committees, as appropriate, including an annual review of Fidelity's risk management program for the Fidelity® funds. The responsibilities of each standing committee, including their oversight responsibilities, are described further under "Standing Committees of the Trustees."
Interested Trustees*:
Correspondence intended for a Trustee who is an interested person may be sent to Fidelity Investments, 245 Summer Street, Boston, Massachusetts 02210.
Name, Year of Birth; Principal Occupations and Other Relevant Experience+
James C. Curvey (1935)
Year of Election or Appointment: 2018
Trustee
Chairman of the Board of Trustees
Mr. Curvey also serves as Trustee of other Fidelity® funds. Mr. Curvey is a Director of Fidelity Research & Analysis Co. (investment adviser firm, 2009-present), and Vice Chairman (2007-present) and Director of FMR LLC (diversified financial services company). In addition, Mr. Curvey serves as an Overseer for the Boston Symphony Orchestra and a member of the board of Artis-Naples, Naples, Florida, and as a Trustee for Brewster Academy, Wolfeboro, New Hampshire. Previously, Mr. Curvey served as a Director of Fidelity Investments Money Management, Inc. (investment adviser firm, 2009-2014) and a Director of FMR and FMR Co., Inc. (investment adviser firms, 2007-2014).
Charles S. Morrison (1960)
Year of Election or Appointment: 2018
Trustee
Mr. Morrison also serves as Trustee of other funds. He serves as President of Fidelity SelectCo, LLC (investment adviser firm, 2017-present) and Fidelity Management & Research Company (FMR) (investment adviser firm, 2016-present), a Director of Fidelity Investments Money Management, Inc. (FIMM) (investment adviser firm, 2014-present), Director of Fidelity SelectCo, LLC (investment adviser firm, 2014-present), President, Asset Management (2014-present), and is an employee of Fidelity Investments. Previously, Mr. Morrison served as Vice President of Fidelity's Fixed Income and Asset Allocation Funds (2012-2014), President, Fixed Income (2011-2014), Vice President of Fidelity's Money Market Funds (2005-2009), President, Money Market Group Leader of FMR (investment adviser firm, 2009), and Senior Vice President, Money Market Group of FMR (2004-2009). Mr. Morrison also served as Vice President of Fidelity's Bond Funds (2002-2005), certain Balanced Funds (2002-2005), and certain Asset Allocation Funds (2002-2007), and as Senior Vice President (2002-2005) of Fidelity's Bond Division.
* Determined to be an "Interested Trustee" by virtue of, among other things, his or her affiliation with the trust[s] or various entities under common control with SelectCo.
+ The information includes the Trustee's principal occupation during the last five years and other information relating to the experience, attributes, and skills relevant to the Trustee's qualifications to serve as a Trustee, which led to the conclusion that the Trustee should serve as a Trustee for each fund.
Independent Trustees:
Correspondence intended for an Independent Trustee may be sent to Fidelity Investments, P.O. Box 55235, Boston, Massachusetts 02205-5235.
Name, Year of Birth; Principal Occupations and Other Relevant Experience+
Dennis J. Dirks (1948)
Year of Election or Appointment: 2018
Trustee
Mr. Dirks also serves as Trustee of other Fidelity® funds. Prior to his retirement in May 2003, Mr. Dirks was Chief Operating Officer and a member of the Board of The Depository Trust & Clearing Corporation (DTCC). He also served as President, Chief Operating Officer, and Board member of The Depository Trust Company (DTC) and President and Board member of the National Securities Clearing Corporation (NSCC). In addition, Mr. Dirks served as Chief Executive Officer and Board member of the Government Securities Clearing Corporation, Chief Executive Officer and Board member of the Mortgage-Backed Securities Clearing Corporation, as a Trustee and a member of the Finance Committee of Manhattan College (2005-2008), as a Trustee and a member of the Finance Committee of AHRC of Nassau County (2006-2008), as a member of the Independent Directors Council (IDC) Governing Council (2010-2015), and as a member of the Board of Directors for The Brookville Center for Children’s Services, Inc. (2009-2017). Mr. Dirks is a member of the Finance Committee (2016-present) and Board of Directors (2017-present) of the Asolo Repertory Theatre.
Donald F. Donahue (1950)
Year of Election or Appointment: 2018
Trustee
Mr. Donahue also serves as a Trustee of other Fidelity® funds. Mr. Donahue is President and Chief Executive Officer of Miranda Partners, LLC (risk consulting for the financial services industry, 2012-present). Previously, Mr. Donahue served as a Member of the Advisory Board of certain Fidelity® funds (2015-2018) and Chief Executive Officer (2006-2012), Chief Operating Officer (2003-2006), and Managing Director, Customer Marketing and Development (1999-2003) of The Depository Trust & Clearing Corporation (financial markets infrastructure). Mr. Donahue serves as a Member (2007-present) and Co-Chairman (2016-present) of the Board of Directors of United Way of New York, Member of the Board of Directors of NYC Leadership Academy (2012-present) and Member of the Board of Advisors of Ripple Labs, Inc. (financial services, 2015-present). He also served as Chairman (2010-2012) and Member of the Board of Directors (2012-2013) of Omgeo, LLC (financial services), Treasurer of United Way of New York (2012-2016), and Member of the Board of Directors of XBRL US (financial services non-profit, 2009-2012) and the International Securities Services Association (2009-2012).
Alan J. Lacy (1953)
Year of Election or Appointment: 2018
Trustee
Mr. Lacy also serves as Trustee of other Fidelity® funds. Mr. Lacy serves as a Director of Bristol-Myers Squibb Company (global pharmaceuticals, 2008-present). He is a Trustee of the California Chapter of The Nature Conservancy (2015-present) and a Director of the Center for Advanced Study in the Behavioral Sciences at Stanford University (2015-present). In addition, Mr. Lacy served as Senior Adviser (2007-2014) of Oak Hill Capital Partners, L.P. (private equity) and also served as Chief Executive Officer (2005) and Vice Chairman (2005-2006) of Sears Holdings Corporation (retail) and Chief Executive Officer and Chairman of the Board of Sears, Roebuck and Co. (retail, 2000-2005). Previously, Mr. Lacy served as Chairman (2014-2017) and a member (2010-2017) of the Board of Directors of Dave & Buster’s Entertainment, Inc. (restaurant and entertainment complexes), as Chairman (2008-2011) and a member (2006-2015) of the Board of Trustees of the National Parks Conservation Association, and as a member of the Board of Directors for The Hillman Companies, Inc. (hardware wholesalers, 2010-2014), Earth Fare, Inc. (retail grocery, 2010-2014), and The Western Union Company (global money transfer, 2006-2011).
Ned C. Lautenbach (1944)
Year of Election or Appointment: 2018
Trustee
Chairman of the Independent Trustees
Mr. Lautenbach also serves as Trustee of other Fidelity® funds. Mr. Lautenbach currently serves as Vice Chair of the Board of Governors, State University System of Florida (2013-present) and is a member of the Council on Foreign Relations (1994-present). He is also a member and has most recently served as Chairman of the Board of Directors of Artis-Naples (2012-present). Previously, Mr. Lautenbach served as a member and then Lead Director of the Board of Directors of Eaton Corporation (diversified industrial, 1997-2016). He was also a Partner and Advisory Partner at Clayton, Dubilier & Rice, LLC (private equity investment, 1998-2010), as well as a Director of Sony Corporation (2006-2007). In addition, Mr. Lautenbach also had a 30-year career with IBM (technology company) during which time he served as Senior Vice President and a member of the Corporate Executive Committee (1968-1998).
Joseph Mauriello (1944)
Year of Election or Appointment: 2018
Trustee
Mr. Mauriello also serves as Trustee of other Fidelity® funds. Prior to his retirement in January 2006, Mr. Mauriello served in numerous senior management positions including Deputy Chairman and Chief Operating Officer (2004-2005), and Vice Chairman of Financial Services (2002-2004) of KPMG LLP US (professional services, 1965-2005). Mr. Mauriello currently serves as a member of the Board of Directors of XL Group plc. (global insurance and re-insurance, 2006-present) and the Independent Directors Council (IDC) Governing Council (2015-present). Previously, Mr. Mauriello served as a Director of the Hamilton Funds of the Bank of New York (2006-2007) and of Arcadia Resources Inc. (health care services and products, 2007-2012).
Cornelia M. Small (1944)
Year of Election or Appointment: 2018
Trustee
Ms. Small also serves as Trustee of other Fidelity® funds. Ms. Small is a member of the Board of Directors (2009-present) and Chair of the Investment Committee (2010-present) of the Teagle Foundation. Ms. Small also serves on the Investment Committee of the Berkshire Taconic Community Foundation (2008-present). Previously, Ms. Small served as Chairperson (2002-2008) and a member of the Investment Committee and Chairperson (2008-2012) and a member of the Board of Trustees of Smith College. In addition, Ms. Small served as Chief Investment Officer, Director of Global Equity Investments, and a member of the Board of Directors of Scudder, Stevens & Clark and Scudder Kemper Investments.
Garnett A. Smith (1947)
Year of Election or Appointment: 2013
Trustee
Mr. Smith also serves as Trustee of other Fidelity® funds. Prior to Mr. Smith's retirement, he served as Chairman and Chief Executive Officer of Inbrand Corp. (manufacturer of personal absorbent products, 1990-1997). He also served as President (1986-1990) of Inbrand Corp. Prior to his employment with Inbrand Corp., he was employed by a retail fabric chain and North Carolina National Bank. In addition, Mr. Smith served as a Member of the Advisory Board of certain Fidelity® funds (2012-2013) and as a board member of the Jackson Hole Land Trust (2009-2012).
David M. Thomas (1949)
Year of Election or Appointment: 2018
Trustee
Mr. Thomas also serves as Trustee of other Fidelity® funds. Mr. Thomas serves as Non-Executive Chairman of the Board of Directors of Fortune Brands Home and Security (home and security products, 2011-present), as a member of the Board of Directors (2004-present) and Presiding Director (2013-present) of Interpublic Group of Companies, Inc. (marketing communication), and as a member of the Board of Trustees of the University of Florida (2013-present). Previously, Mr. Thomas served as Executive Chairman (2005-2006) and Chairman and Chief Executive Officer (2000-2005) of IMS Health, Inc. (pharmaceutical and healthcare information solutions), and a Director of Fortune Brands, Inc. (consumer products, 2000-2011).
Michael E. Wiley (1950)
Year of Election or Appointment: 2008
Trustee
Mr. Wiley also serves as Trustee or Member of the Advisory Board of other Fidelity® funds. Mr. Wiley serves as a Director of Andeavor Corporation (independent oil refiner and marketer, 2005-present), a Director of Andeavor Logistics LP (natural resources logistics, 2015-present), and a Director of Bill Barrett Corporation (exploration and production, 2005-present). In addition, Mr. Wiley also serves as a Director of Post Oak Bank (privately-held bank, 2004-present). Previously, Mr. Wiley served as a Trustee of other Fidelity® funds (2008-2013), as a Director of Asia Pacific Exploration Consolidated (international oil and gas exploration and production, 2008-2013), as a member of the Board of Trustees of the University of Tulsa (2000-2006; 2007-2010), as a Senior Energy Advisor of Katzenbach Partners, LLC (consulting, 2006-2007), as an Advisory Director of Riverstone Holdings (private investment), Chairman, President, and CEO of Baker Hughes, Inc. (oilfield services, 2000-2004), and as Director of Spinnaker Exploration Company (exploration and production, 2001-2005).
+ The information includes the Trustee's principal occupation during the last five years and other information relating to the experience, attributes, and skills relevant to the Trustee's qualifications to serve as a Trustee, which led to the conclusion that the Trustee should serve as a Trustee for each fund.
Advisory Board Members and Officers:
Correspondence intended for a Member of the Advisory Board (if any) may be sent to Fidelity Investments, P.O. Box 55235, Boston, Massachusetts 02205-5235. Correspondence intended for an officer or Peter S. Lynch may be sent to Fidelity Investments, 245 Summer Street, Boston, Massachusetts 02210. Officers appear below in alphabetical order.
Name, Year of Birth; Principal Occupation
Peter S. Lynch (1944)
Year of Election or Appointment: 2018
Member of the Advisory Board
Mr. Lynch also serves as Member of the Advisory Board of other Fidelity® funds. Mr. Lynch is Vice Chairman and a Director of FMR (investment adviser firm) and FMR Co., Inc. (investment adviser firm). In addition, Mr. Lynch serves as a Trustee of Boston College and as the Chairman of the Inner-City Scholarship Fund. Previously, Mr. Lynch served on the Special Olympics International Board of Directors (1997-2006).
William S. Stavropoulos (1939)
Year of Election or Appointment: 2018
Member of the Advisory Board
Mr. Stavropoulos also serves as Member of the Advisory Board of other Fidelity® funds. Mr. Stavropoulos serves as President and Founder of the Michigan Baseball Foundation, the Great Lakes Loons (2007-present). Mr. Stavropoulos is Chairman Emeritus of the Board of Directors of The Dow Chemical Company, where he previously served in numerous senior management positions, including President, CEO (1995-2000; 2002-2004), Chairman of the Executive Committee (2000-2006), and as a member of the Board of Directors (1990-2006). Currently, Mr. Stavropoulos is Chairman of the Board of Directors of Univar Inc. (global distributor of commodity and specialty chemicals), a Director of Teradata Corporation (data warehousing and technology solutions), and a member of the Advisory Board for Metalmark Capital LLC (private equity investment, 2005-present). Mr. Stavropoulos is an operating advisor to Clayton, Dubilier & Rice, LLC (private equity investment). In addition, Mr. Stavropoulos is a member of the University of Notre Dame Advisory Council for the College of Science, a Trustee of the Rollin L. Gerstacker Foundation, and a Director of Artis-Naples in Naples, Florida. Previously, Mr. Stavropoulos served as Trustee of certain Fidelity® funds (2001-2018) and as a Director of Chemical Financial Corporation (bank holding company, 1993-2012) and Tyco International, Ltd. (multinational manufacturing and services, 2007-2012).
Carol B. Tomé (1957)
Year of Election or Appointment: 2017
Member of the Advisory Board
Ms. Tomé also serves as Member of the Advisory Board of other Fidelity® funds. Ms. Tomé is Chief Financial Officer (2001-present) and Executive Vice President of Corporate Services (2007-present) of The Home Depot, Inc. (home improvement retailer) and a Director (2003-present) and Chair of the Audit Committee (2004-present) of United Parcel Service, Inc. (package delivery and supply chain management). Previously, Ms. Tomé served as Trustee of certain Fidelity® funds (2017), Senior Vice President of Finance and Accounting/Treasurer (2000-2007) and Vice President and Treasurer (1995-2000) of The Home Depot, Inc. and Chair of the Board (2010-2012), Vice Chair of the Board (2009 and 2013), and a Director (2008-2013) of the Federal Reserve Bank of Atlanta. Ms. Tomé is also a director or trustee of many community and professional organizations.
Elizabeth Paige Baumann (1968)
Year of Election or Appointment: 2017
Anti-Money Laundering (AML) Officer
Ms. Baumann also serves as AML Officer of other funds. She is Chief AML Officer (2012-present) and Senior Vice President (2014-present) of FMR LLC (diversified financial services company) and is an employee of Fidelity Investments. Previously, Ms. Baumann served as AML Officer of the funds (2012-2016), and Vice President (2007-2014) and Deputy Anti-Money Laundering Officer (2007-2012) of FMR LLC.
Marc R. Bryant (1966)
Year of Election or Appointment: 2013
Secretary and Chief Legal Officer (CLO)
Mr. Bryant also serves as Secretary and CLO of other funds. Mr. Bryant serves as CLO, Secretary, and Senior Vice President of Fidelity Management & Research Company (investment adviser firm, 2015-present) and FMR Co., Inc. (investment adviser firm, 2015-present); Secretary of Fidelity SelectCo, LLC (investment adviser firm, 2015-present) and Fidelity Investments Money Management, Inc. (investment adviser firm, 2015-present); and CLO of Fidelity Management & Research (Hong Kong) Limited and FMR Investment Management (UK) Limited (investment adviser firms, 2015-present) and Fidelity Management & Research (Japan) Limited (investment adviser firm, 2016-present). He is Senior Vice President and Deputy General Counsel of FMR LLC (diversified financial services company). Previously, Mr. Bryant served as Secretary and CLO of Fidelity Rutland Square Trust II (2010-2014) and Assistant Secretary of Fidelity's Fixed Income and Asset Allocation Funds (2013-2015). Prior to joining Fidelity Investments, Mr. Bryant served as a Senior Vice President and the Head of Global Retail Legal for AllianceBernstein L.P. (2006-2010), and as the General Counsel for ProFund Advisors LLC (2001-2006).
William C. Coffey (1969)
Year of Election or Appointment: 2009
Assistant Secretary
Mr. Coffey also serves as Assistant Secretary of other funds. He is Senior Vice President and Deputy General Counsel of FMR LLC (diversified financial services company, 2010-present), and is an employee of Fidelity Investments. Previously, Mr. Coffey served as Vice President and Associate General Counsel of FMR LLC (2005-2009).
Jonathan Davis (1968)
Year of Election or Appointment: 2010
Assistant Treasurer
Mr. Davis also serves as Assistant Treasurer of other funds. Mr. Davis serves as Assistant Treasurer of FMR Capital, Inc. (2017-present) and is an employee of Fidelity Investments. Previously, Mr. Davis served as Vice President and Associate General Counsel of FMR LLC (diversified financial services company, 2003-2010).
Adrien E. Deberghes (1967)
Year of Election or Appointment: 2018
Assistant Treasurer
Mr. Deberghes also serves as an officer of other funds. He serves as Assistant Treasurer of FMR Capital, Inc. (2017-present), Executive Vice President of Fidelity Investments Money Management, Inc. (FIMM) (investment adviser firm, 2016-present), and is an employee of Fidelity Investments (2008-present). Previously, Mr. Deberghes served as President and Treasurer of certain Fidelity® funds (2013-2018). Prior to joining Fidelity Investments, Mr. Deberghes was Senior Vice President of Mutual Fund Administration at State Street Corporation (2007-2008), Senior Director of Mutual Fund Administration at Investors Bank & Trust (2005-2007), and Director of Finance for Dunkin' Brands (2000-2005). Previously, Mr. Deberghes served in other fund officer roles.
Joseph DeSantis (1959)
Year of Election or Appointment: 2015
Vice President
Mr. DeSantis also serves as Vice President of other funds. Mr. DeSantis serves as a Director of Fidelity Management & Research (Japan) Limited (investment adviser firm, 2016-present), Chief Investment Officer, Equities (2010-present) and is an employee of Fidelity Investments.
Stephanie J. Dorsey (1969)
Year of Election or Appointment: 2010
Assistant Treasurer
Ms. Dorsey also serves as an officer of other funds. Ms. Dorsey serves as Assistant Treasurer of FMR Capital, Inc. (2017-present), is an employee of Fidelity Investments (2008-present), and has served in other fund officer roles. Prior to joining Fidelity Investments, Ms. Dorsey served as Treasurer (2004-2008) of the JPMorgan Mutual Funds and Vice President (2004-2008) of JPMorgan Chase Bank.
Howard J. Galligan III (1966)
Year of Election or Appointment: 2014
Chief Financial Officer
Mr. Galligan also serves as Chief Financial Officer of other funds. Mr. Galligan serves as President of Fidelity Pricing and Cash Management Services (FPCMS) (2014-present) and as a Director of Strategic Advisers LLC (investment adviser firm, 2008-present). Previously, Mr. Galligan served as Chief Administrative Officer of Asset Management (2011-2014) and Chief Operating Officer and Senior Vice President of Investment Support for Strategic Advisers, Inc. (2003-2011).
Brian B. Hogan (1964)
Year of Election or Appointment: 2009
Vice President
Mr. Hogan also serves as Trustee or Vice President of other funds. Mr. Hogan serves as Head of Fidelity Investments’ Investment Solutions and Innovation organization (2018-present), and as a Director of FMR Investment Management (UK) Limited (investment adviser firm, 2015-present) and Fidelity SelectCo, LLC (investment adviser firm, 2014-present). Previously, Mr. Hogan served as Trustee of certain Fidelity® funds (2014-2018), President of the Equity Division of FMR (investment adviser firm, 2009-2018), Senior Vice President, Equity Research of FMR (2006-2009), and as a portfolio manager. Mr. Brian B. Hogan is not related to Mr. Colm A. Hogan.
Colm A. Hogan (1973)
Year of Election or Appointment: 2018
Deputy Treasurer
Mr. Hogan also serves as an officer of other funds. Mr. Hogan serves as Assistant Treasurer of FMR Capital, Inc. (2017-present) and is an employee of Fidelity Investments (2005-present). Previously, Mr. Hogan served as Assistant Treasurer of certain Fidelity® funds (2016-2018). Mr. Colm A. Hogan is not related to Mr. Brian B. Hogan.
Chris Maher (1972)
Year of Election or Appointment: 2013
Assistant Treasurer
Mr. Maher serves as Assistant Treasurer of other funds. Mr. Maher is Vice President of Valuation Oversight, serves as Assistant Treasurer of FMR Capital, Inc. (2017-present), and is an employee of Fidelity Investments. Previously, Mr. Maher served as Vice President of Asset Management Compliance (2013), Vice President of the Program Management Group of FMR (investment adviser firm, 2010-2013), and Vice President of Valuation Oversight (2008-2010).
Rieco E. Mello (1969)
Year of Election or Appointment: 2017
Assistant Treasurer
Mr. Mello also serves as Assistant Treasurer of other funds. Mr. Mello serves as Assistant Treasurer of FMR Capital, Inc. (2017-present) and is an employee of Fidelity Investments (1995-present).
Kenneth B. Robins (1969)
Year of Election or Appointment: 2018
Chief Compliance Officer
Mr. Robins also serves as an officer of other funds. Mr. Robins serves as Compliance Officer of Fidelity Management & Research Company and FMR Co., Inc. (investment adviser firms, 2016-present) and is an employee of Fidelity Investments (2004-present). Previously, Mr. Robins served as Executive Vice President of Fidelity Investments Money Management, Inc. (investment adviser firm, 2013-2016) and served in other fund officer roles.
Stacie M. Smith (1974)
Year of Election or Appointment: 2018
President and Treasurer
Ms. Smith also serves as an officer of other funds. Ms. Smith serves as Assistant Treasurer of FMR Capital, Inc. (2017-present), is an employee of Fidelity Investments (2009-present), and has served in other fund officer roles. Prior to joining Fidelity Investments, Ms. Smith served as Senior Audit Manager of Ernst & Young LLP (accounting firm, 1996-2009). Previously, Ms. Smith served as Assistant Treasurer (2013-2018) and Deputy Treasurer (2013-2016) of certain Fidelity® funds.
Marc L. Spector (1972)
Year of Election or Appointment: 2017
Assistant Treasurer
Mr. Spector also serves as an officer of other funds. Mr. Spector serves as Assistant Treasurer of FMR Capital, Inc. (2017-present) and is an employee of Fidelity Investments (2016-present). Prior to joining Fidelity Investments, Mr. Spector served as Director at the Siegfried Group (accounting firm, 2013-2016), and prior to Siegfried Group as audit senior manager at Deloitte & Touche (accounting firm, 2005-2013).
Renee Stagnone (1975)
Year of Election or Appointment: 2016
Assistant Treasurer
Ms. Stagnone also serves as an officer of other funds. Ms. Stagnone serves as Assistant Treasurer of FMR Capital, Inc. (2017-present) and is an employee of Fidelity Investments (1997-present). Previously, Ms. Stagnone served as Deputy Treasurer of certain Fidelity® funds (2013-2016).
Shareholder Expense Example
As a shareholder of the Fund, you incur two types of costs: (1) transaction costs, including redemption fees and (2) ongoing costs, including management fees and other Fund expenses. This Example is intended to help you understand your ongoing costs (in dollars) of investing in the Fund and to compare these costs with the ongoing costs of investing in other mutual funds.
The Example is based on an investment of $1,000 invested at the beginning of the period and held for the entire period (September 1, 2017 to February 28, 2018).
Actual Expenses
The first line of the accompanying table provides information about actual account values and actual expenses. You may use the information in this line, together with the amount you invested, to estimate the expenses that you paid over the period. Simply divide your account value by $1,000.00 (for example, an $8,600 account value divided by $1,000.00 = 8.6), then multiply the result by the number in the first line under the heading entitled "Expenses Paid During Period" to estimate the expenses you paid on your account during this period. A small balance maintenance fee of $12.00 that is charged once a year may apply for certain accounts with a value of less than $2,000. This fee is not included in the table below. If it was, the estimate of expenses you paid during the period would be higher, and your ending account value lower, by this amount.
Hypothetical Example for Comparison Purposes
The second line of the accompanying table provides information about hypothetical account values and hypothetical expenses based on the Fund's actual expense ratio and an assumed rate of return of 5% per year before expenses, which is not the Fund's actual return. The hypothetical account values and expenses may not be used to estimate the actual ending account balance or expenses you paid for the period. You may use this information to compare the ongoing costs of investing in the Fund and other funds. To do so, compare this 5% hypothetical example with the 5% hypothetical examples that appear in the shareholder reports of the other funds. A small balance maintenance fee of $12.00 that is charged once a year may apply for certain accounts with a value of less than $2,000. This fee is not included in the table below. If it was, the estimate of expenses you paid during the period would be higher, and your ending account value lower, by this amount. In addition, the Fund, as a shareholder in the underlying Fidelity Central Funds, will indirectly bear its pro-rata share of the fees and expenses incurred by the underlying Fidelity Central Funds. These fees and expenses are not included in the Fund's annualized expense ratio used to calculate the expense estimate in the table below.
Please note that the expenses shown in the table are meant to highlight your ongoing costs only and do not reflect any transaction costs. Therefore, the second line of the table is useful in comparing ongoing costs only, and will not help you determine the relative total costs of owning different funds. In addition, if these transactional costs were included, your costs would have been higher.
| | Annualized Expense RatioBA | Beginning
Account Value
September 1, 2017 | Ending
Account Value
February 28, 2018 | Expenses Paid
During Period-B
September 1, 2017
to February 28, 2018 |
| Automotive Portfolio | .94% | | | |
| Actual | | $1,000.00 | $1,133.10 | $4.97 |
| Hypothetical-C | | $1,000.00 | $1,020.13 | $4.71 |
| Construction and Housing Portfolio | .80% | | | |
| Actual | | $1,000.00 | $1,070.10 | $4.11 |
| Hypothetical-C | | $1,000.00 | $1,020.83 | $4.01 |
| Consumer Discretionary Portfolio | .77% | | | |
| Actual | | $1,000.00 | $1,180.10 | $4.16 |
| Hypothetical-C | | $1,000.00 | $1,020.98 | $3.86 |
| Leisure Portfolio | .77% | | | |
| Actual | | $1,000.00 | $1,101.40 | 3.96 |
| Hypothetical-C | | $1,000.00 | 1,021.03 | 3.81 |
| Multimedia Portfolio | .80% | | | |
| Actual | | $1,000.00 | 998.80 | $3.96 |
| Hypothetical-C | | $1,000.00 | $1,020.83 | $4.01 |
| Retailing Portfolio | .77% | | | |
| Actual | | $1,000.00 | $1,264.60 | $4.32 |
| Hypothetical-C | | $1,000.00 | $1,020.98 | $3.86 |
A Annualized expense ratio reflects expenses net of applicable fee waivers.
B Expenses are equal to each Fund's annualized expense ratio, multiplied by the average account value over the period, multiplied by 181/ 365 (to reflect the one-half year period).
C 5% return per year before expenses
Distributions (Unaudited)
The Board of Trustees of each fund voted to pay to shareholders of record at the opening of business on record date, the following distributions per share derived from capital gains realized from sales of portfolio securities, and dividends derived from net investment income:
| | Pay Date | Record Date | Dividends | Capital Gains |
| Automotive Portfolio | 04/09/18 | 04/06/18 | $0.060 | $1.355 |
| Construction and Housing Portfolio | 04/09/18 | 04/06/18 | $0.098 | $2.855 |
| Consumer Discretionary Portfolio | 04/09/18 | 04/06/18 | $0.013 | $0.673 |
| Leisure Portfolio | 04/09/18 | 04/06/18 | $0.442 | $8.473 |
| Multimedia Portfolio | 04/09/18 | 04/06/18 | $0.044 | $4.294 |
| Retailing Portfolio | 04/09/18 | 04/06/18 | $0.000 | $1.165 |
|
The funds hereby designate as capital gain dividend the amounts noted below for the taxable year ended February 28, 2018, or, if subsequently determined to be different, the net capital gain of such year.
| Automotive Portfolio | $8,072,482 |
| Construction and Housing Portfolio | $60,040,359 |
| Consumer Discretionary Portfolio | $44,583,203 |
| Leisure Portfolio | $55,903,397 |
| Multimedia Portfolio | $54,771,652 |
| Retailing Portfolio | $94,563,655 |
|
A percentage of the dividends distributed during the fiscal year for the following funds qualify for the dividends–received deduction for corporate shareholders:
| | April 2017 | December 2017 |
| Automotive Portfolio | – | 100% |
| Construction and Housing Portfolio | – | 100% |
| Consumer Discretionary Portfolio | – | 100% |
| Leisure Portfolio | 100% | 100% |
| Multimedia Portfolio | – | 100% |
| | | |
|
A percentage of the dividends distributed during the fiscal year for the following funds may be taken into account as a dividend for purposes of the maximum rate under section 1(h)(11) of the Internal Revenue Code.
| | April 2017 | December 2017 |
| Automotive Portfolio | – | 100% |
| Construction and Housing Portfolio | – | 100% |
| Consumer Discretionary Portfolio | – | 100% |
| Leisure Portfolio | 100% | 100% |
| Multimedia Portfolio | – | 100% |
| | | |
|
The funds will notify shareholders in January 2019 of amounts for use in preparing 2018 income tax returns.
Board Approval of Investment Advisory Contracts and Management Fees
Automotive Portfolio
Construction and Housing Portfolio
Consumer Discretionary Portfolio
Leisure Portfolio
Multimedia Portfolio
Retailing Portfolio
Each year, the Board of Trustees, including the Independent Trustees (together, the Board), votes on the renewal of the management contract with Fidelity SelectCo, LLC (SelectCo), an affiliate of Fidelity Management & Research Company (FMR), and the sub-advisory agreements with affiliates of FMR (together, the Advisory Contracts) for each fund. SelectCo and the sub-advisers are collectively referred to herein as the Investment Advisers. The Board, assisted by the advice of fund counsel and Independent Trustees' counsel, requests and considers a broad range of information relevant to the renewal of the Advisory Contracts throughout the year.
The Board meets regularly and, at each of its meetings, covers an extensive agenda of topics and materials and considers factors that are relevant to its annual consideration of the renewal of each fund's Advisory Contracts, including the services and support provided to each fund and its shareholders. The Board has established four standing committees (Committees) — Operations, Audit, Fair Valuation, and Governance and Nominating — each composed of and chaired by Independent Trustees with varying backgrounds, to which the Board has assigned specific subject matter responsibilities in order to enhance effective decision-making by the Board. The Operations Committee, of which all of the Independent Trustees are members, meets regularly throughout the year and considers, among other matters, information specifically related to the annual consideration of the renewal of each fund's Advisory Contracts. The Board, acting directly and through its Committees, requests and receives information concerning the annual consideration of the renewal of each fund's Advisory Contracts. The Board also meets as needed to review matters specifically related to the Board's annual consideration of the renewal of the Advisory Contracts. Members of the Board may also meet with trustees of other Fidelity funds through ad hoc joint committees to discuss certain matters relevant to all of the Fidelity funds.
At its January 2018 meeting, the Board unanimously determined to renew each fund's Advisory Contracts. In reaching its determination, the Board considered all factors it believed relevant, including (i) the nature, extent, and quality of the services to be provided to each fund and its shareholders (including the investment performance of each fund); (ii) the competitiveness of each fund's management fee and total expense ratio relative to peer funds; (iii) the total costs of the services to be provided by and the profits to be realized by Fidelity from its relationships with each fund; and (iv) the extent to which, if any, economies of scale exist and would be realized as each fund grows, and whether any economies of scale are appropriately shared with fund shareholders.
In considering whether to renew the Advisory Contracts for each fund, the Board reached a determination, with the assistance of fund counsel and Independent Trustees' counsel and through the exercise of its business judgment, that the renewal of the Advisory Contracts was in the best interests of each fund and its shareholders and that the compensation payable under the Advisory Contracts was fair and reasonable. The Board's decision to renew the Advisory Contracts was not based on any single factor, but rather was based on a comprehensive consideration of all the information provided to the Board at its meetings throughout the year. The Board, in reaching its determination to renew the Advisory Contracts, was aware that shareholders of each fund have a broad range of investment choices available to them, including a wide choice among funds offered by Fidelity's competitors, and that each fund's shareholders, who have the opportunity to review and weigh the disclosure provided by the fund in its prospectus and other public disclosures, have chosen to invest in that fund, which is part of the Fidelity family of funds.
Amendment to Group Fee Rate. The Board also ratified an amendment to the management contract for each fund to add an additional breakpoint to the group fee schedule, which was effective October 1, 2017. The Board noted that the additional breakpoint would result in lower management fee rates to the extent that assets under management that are included in group fee calculations increase above the new breakpoint.
Nature, Extent, and Quality of Services Provided. The Board considered the staffing of the Investment Advisers as it relates to the funds, including the backgrounds of investment personnel of SelectCo, and also considered the funds' investment objectives, strategies, and related investment philosophies. The Independent Trustees also had discussions with senior management of Fidelity's investment operations and investment groups. The Board considered the structure of the investment personnel compensation program and whether this structure provides appropriate incentives to act in the best interests of each fund. Additionally, the Board considered the portfolio managers' investments, if any, in the funds that they manage.
Resources Dedicated to Investment Management and Support Services. The Board reviewed the general qualifications and capabilities of the Investment Advisers' investment staffs, including their size, education, experience, and resources, as well as Fidelity's approach to recruiting, training, managing, and compensating investment personnel. The Board noted that Fidelity has continued to increase the resources devoted to non-U.S. offices, including expansion of Fidelity's global investment organization. The Board also noted that Fidelity's analysts have extensive resources, tools and capabilities that allow them to conduct sophisticated quantitative and fundamental analysis, as well as credit analysis of issuers, counterparties and guarantors. Further, the Board considered that Fidelity's investment professionals have sufficient access to global information and data so as to provide competitive investment results over time, and that those professionals also have access to sophisticated tools that permit them to assess portfolio construction and risk and performance attribution characteristics continuously, as well as to transmit new information and research conclusions rapidly around the world. Additionally, in its deliberations, the Board considered Fidelity's trading, risk management, compliance, and technology and operations capabilities and resources, which are integral parts of the investment management process.
Shareholder and Administrative Services. The Board considered (i) the nature, extent, quality, and cost of advisory, administrative, and shareholder services performed by the Investment Advisers and their affiliates under the Advisory Contracts and under separate agreements covering transfer agency, pricing and bookkeeping, and securities lending services for each fund; (ii) the nature and extent of the supervision of third party service providers, principally custodians, subcustodians, and pricing vendors; and (iii) the resources devoted to, and the record of compliance with, each fund's compliance policies and procedures. The Board also reviewed the allocation of fund brokerage, including allocations to brokers affiliated with the Investment Advisers, the use of brokerage commissions to pay fund expenses, and the use of "soft" commission dollars to pay for research services.
The Board noted that the growth of fund assets over time across the complex allows Fidelity to reinvest in the development of services designed to enhance the value or convenience of the Fidelity funds as investment vehicles. These services include 24-hour access to account information and market information through telephone representatives and over the Internet, investor education materials and asset allocation tools, and the expanded availability of Fidelity Investor Centers.
The Board noted that it and the boards of certain other Fidelity funds had formed an ad hoc Committee on Transfer Agency Fees to review the variety of transfer agency fee structures throughout the industry and Fidelity's competitive positioning with respect to industry participants.
Investment in a Large Fund Family. The Board considered the benefits to shareholders of investing in a Fidelity fund, including the benefits of investing in a fund that is part of a large family of funds offering a variety of investment disciplines and providing a large variety of mutual fund investor services. The Board noted that Fidelity had taken, or had made recommendations that resulted in the Fidelity funds taking, a number of actions over the previous year that benefited particular funds, including: (i) continuing to dedicate additional resources to Fidelity's investment research process, which includes meetings with management of issuers in which the funds invest, and to the support of the senior management team that oversees asset management; (ii) continuing efforts to enhance Fidelity's global research capabilities; (iii) launching new funds and making other enhancements to meet client needs; (iv) launching new share classes of existing funds; (v) eliminating purchase minimums and broadening eligibility requirements for certain lower-priced share classes; (vi) reducing management fees and total expenses for certain growth equity funds and index funds; (vii) lowering expense caps for certain existing funds and classes to reduce expenses borne by shareholders; (viii) eliminating short-term redemption fees for certain funds; (ix) introducing a new pricing structure for certain funds of funds that is expected to reduce overall expenses paid by shareholders; (x) rationalizing product lines and gaining increased efficiencies through proposals for fund mergers and share class consolidations; (xi) continuing to develop, acquire and implement systems and technology to improve services to the funds and shareholders, strengthen information security, and increase efficiency; and (xii) implementing enhancements to further strengthen Fidelity's product line to increase investors' probability of success in achieving their investment goals, including retirement income goals.
Investment Performance. The Board considered whether each fund has operated in accordance with its investment objective, as well as its record of compliance with its investment restrictions and its performance history.
The Board took into account discussions with representatives of SelectCo about fund investment performance that occur at Board meetings throughout the year. In this regard the Board noted that as part of regularly scheduled fund reviews and other reports to the Board on fund performance, the Board considers annualized return information for each fund for different time periods, measured against a securities market index ("benchmark index"). In its evaluation of fund investment performance at meetings throughout the year, the Board gave particular attention to information indicating underperformance of certain Fidelity funds for specific time periods and discussed with the Investment Advisers the reasons for such underperformance. Each of Automotive Portfolio, Construction and Housing Portfolio, Consumer Discretionary Portfolio, and Leisure Portfolio underperformed its benchmark for the one-, three-, and five-year periods ended June 30, 2017, and as a result, the Board will continue to discuss with SelectCo the steps it is taking to address each such fund's performance.
In addition to reviewing absolute and relative fund performance, the Independent Trustees periodically consider the appropriateness of fund performance metrics in evaluating the results achieved. In general, the Independent Trustees believe that fund performance should be evaluated based on net performance (after fees and expenses) of both the highest performing and lowest performing fund share classes, where applicable, compared to appropriate benchmark indices, over appropriate time periods that may include full market cycles, taking into account relevant factors, including the following: general market conditions; issuer-specific information; and fund cash flows and other factors. Depending on the circumstances, the Independent Trustees may be satisfied with a fund's performance notwithstanding that it lags its benchmark index for certain periods.
The Independent Trustees recognize that shareholders evaluate performance on a net basis over their own holding periods, for which one-, three-, and five-year periods are often used as a proxy. For this reason, the performance information reviewed by the Board also included net cumulative total return information for each fund and an appropriate benchmark index for the most recent one-, three-, and five-year periods ended June 30, 2017.
Based on its review, the Board concluded that the nature, extent, and quality of services provided to each fund under the Advisory Contracts should continue to benefit the shareholders of each fund.
Competitiveness of Management Fee and Total Expense Ratio. The Board considered each fund's management fee and total expense ratio compared to "mapped groups" of competitive funds and classes created for the purpose of facilitating the Trustees' analysis of the competitiveness of management fees and total expenses. Fidelity creates "mapped groups" by combining similar Lipper investment objective categories that have comparable investment mandates. For this purpose, all sector focused equity funds are grouped in the same mapped group. Combining Lipper investment objective categories aids the Board's management fee and total expense ratio comparisons by broadening the competitive group used for comparison.
Management Fee. The Board considered two proprietary management fee comparisons for the 12-month periods ended June 30 shown in basis points (BP) in the charts below. The group of Lipper funds used by the Board for management fee comparisons is referred to below as the "Total Mapped Group." The Total Mapped Group comparison focuses on a fund's standing in terms of gross management fees before expense reimbursements or caps relative to the total universe of funds with comparable investment mandates (
i.e., sector equities), regardless of whether their management fee structures also are comparable. Funds with comparable management fee structures have similar management fee contractual arrangements (
e.g., flat rate charged for advisory services, all-inclusive fee rate,
etc.). "TMG %" represents the percentage of funds in the Total Mapped Group that had management fees that were lower than a fund's. For example, a hypothetical TMG % of 20% would mean that 80% of the funds in the Total Mapped Group had higher, and 20% had lower, management fees than a fund. The funds' actual TMG %s and the number of funds in the Total Mapped Group are in the charts below. The "Asset-Size Peer Group" (ASPG) comparison focuses on a fund's standing relative to a subset of non-Fidelity funds within the Total Mapped Group that are similar in size and management fee structure. For example, if a fund is in the first quartile of the ASPG, the fund's management fee ranks in the least expensive or lowest 25% of funds in the ASPG. The ASPG represents at least 15% of the funds in the Total Mapped Group with comparable asset size and management fee structures, subject to a minimum of 50 funds (or all funds in the Total Mapped Group if fewer than 50). Additional information, such as the ASPG quartile in which a fund's management fee rate ranked, is also included in the charts and considered by the Board.
Automotive Portfolio
Construction and Housing Portfolio
Consumer Discretionary Portfolio

Leisure Portfolio
Multimedia Portfolio

Retailing Portfolio

The Board noted that each fund's management fee rate ranked below the median of its Total Mapped Group and below the median of its ASPG for the 12-month period ended June 30, 2017.
The Board noted that it and the boards of other Fidelity funds formed an ad hoc Committee on Group Fee, which meets periodically, to conduct an in-depth review of the "group fee" component of the management fee of funds with such management fee structures. The Committee's focus included the mechanics of the group fee, the competitive landscape of group fee structures, Fidelity funds with no group fee component and investment products not included in group fee assets. The Board also considered that, for funds subject to the group fee, FMR agreed to voluntarily waive fees over a specified period of time in amounts designed to account for assets converted from certain funds to certain collective investment trusts.
Based on its review, the Board concluded that each fund's management fee is fair and reasonable in light of the services that each fund receives and the other factors considered.
Total Expense Ratio. In its review of each fund's total expense ratio, the Board considered the fund's management fee rate as well as other fund expenses, such as transfer agent fees, pricing and bookkeeping fees, and custodial, legal, and audit fees. The Board also noted that Fidelity may agree to waive fees and expenses from time to time, and the extent to which, if any, it has done so for each fund. As part of its review, the Board also considered the current and historical total expense ratios of each fund compared to competitive fund median expenses. Each fund is compared to those funds and classes in the Total Mapped Group (used by the Board for management fee comparisons) that have a similar sales load structure.
The Board noted that each fund's total expense ratio ranked below the competitive median for the 12-month period ended June 30, 2017.
Fees Charged to Other Fidelity Clients. The Board also considered Fidelity fee structures and other information with respect to clients of Fidelity, such as other funds advised or subadvised by Fidelity, pension plan clients, and other institutional clients with similar mandates. The Board noted that an ad hoc joint committee created by it and the boards of other Fidelity funds periodically reviews and compares Fidelity's institutional investment advisory business with its business of providing services to the Fidelity funds, including the differences in services provided, fees charged, and costs incurred, as well as competition in their respective marketplaces.
Based on its review of total expense ratios and fees charged to other Fidelity clients, the Board concluded that each fund's total expense ratio was reasonable in light of the services that each fund and its shareholders receive and the other factors considered.
Costs of the Services and Profitability. The Board considered the revenues earned and the expenses incurred by Fidelity in conducting the business of developing, marketing, distributing, managing, administering and servicing each fund and servicing each fund's shareholders. The Board also considered the level of Fidelity's profits in respect of all the Fidelity funds.
On an annual basis, Fidelity presents to the Board information about the profitability of its relationships with each fund. Fidelity calculates profitability information for each fund, as well as aggregate profitability information for groups of Fidelity funds and all Fidelity funds, using a series of detailed revenue and cost allocation methodologies which originate with the books and records of Fidelity on which Fidelity's audited financial statements are based. The Audit Committee of the Board reviews any significant changes from the prior year's methodologies.
PricewaterhouseCoopers LLP (PwC), independent registered public accounting firm and auditor to Fidelity and certain Fidelity funds, has been engaged annually by the Board as part of the Board's assessment of the profitability analysis used by Fidelity. PwC's engagement includes the review and assessment of Fidelity's methodologies used in determining the revenues and expenses attributable to Fidelity's mutual fund business, and completion of agreed-upon procedures in respect of the mathematical accuracy of the fund profitability information and its conformity to established allocation methodologies. After considering PwC's reports issued under the engagement and information provided by Fidelity, the Board concluded that while other allocation methods may also be reasonable, Fidelity's profitability methodologies are reasonable in all material respects.
The Board also reviewed Fidelity's non-fund businesses and potential fall-out benefits related to the mutual fund business as well as cases where Fidelity's affiliates may benefit from or be related to the funds' business.
The Board considered the costs of the services provided by and the profits realized by Fidelity in connection with the operation of each fund and was satisfied that the profitability was not excessive.
Economies of Scale. The Board considered whether there have been economies of scale in respect of the management of the Fidelity funds, whether the Fidelity funds (including each fund) have appropriately benefited from any such economies of scale, and whether there is potential for realization of any further economies of scale. The Board considered the extent to which each fund will benefit from economies of scale as assets grow through increased services to the fund, through waivers or reimbursements, or through fee or expense ratio reductions. The Board also noted that a committee (the Economies of Scale Committee) created by it and the boards of other Fidelity funds periodically analyzes whether Fidelity attains economies of scale in respect of the management and servicing of the Fidelity funds, whether the Fidelity funds have appropriately benefited from such economies of scale, and whether there is potential for realization of any further economies of scale.
The Board recognized that each fund's management contract incorporates a "group fee" structure, which provides for lower group fee rates as total group assets increase, and for higher group fee rates as total group assets decrease (with "group assets" defined to include fund assets under SelectCo's management plus assets under FMR's management). SelectCo calculates the group fee rates based on a tiered asset "breakpoint" schedule that varies based on asset class. The Board considered that the group fee is designed to deliver the benefits of economies of scale to fund shareholders when total group assets increase, even if assets of any particular fund are unchanged or have declined, because some portion of Fidelity's costs are attributable to services provided to all Fidelity funds, and all funds benefit if those costs can be allocated among more assets. The Board concluded that, given the group fee structure, fund shareholders will benefit from lower management fees as group assets increase at the fund complex level, regardless of whether Fidelity achieves any such economies of scale.
The Board concluded, taking into account the analysis of the Economies of Scale Committee, that economies of scale, if any, are being appropriately shared between fund shareholders and Fidelity.
Additional Information Requested by the Board. In order to develop fully the factual basis for consideration of the Fidelity funds' advisory contracts, the Board requested and received additional information on certain topics, including: (i) Fidelity's fund profitability methodology, profitability trends for certain funds, and the impact of certain factors on fund profitability results; (ii) portfolio manager changes that have occurred during the past year and the amount of the investment that each portfolio manager has made in the Fidelity fund(s) that he or she manages; (iii) Fidelity's compensation structure for portfolio managers, research analysts, and other key personnel, including its effects on fund profitability; (iv) comparisons to institutional products; (v) the arrangements with and compensation paid to certain fund sub-advisers on behalf of the Fidelity funds; (vi) the impact of proposed changes to contractual expense cap arrangements in place for certain funds; (vii) Fidelity's long-term expectations for its offerings in the workplace investing channel; (viii) the methodology with respect to evaluating competitive fund data and peer group classifications and fee comparisons; (ix) the presentation of certain fund performance information; (x) Fidelity's transfer agent fee, expense, and service structures for different funds and classes, including the increased use of omnibus accounts and lower pricing in the retirement channel; (xi) fluctuations in trading expenses; (xii) explanations regarding the relative total expense ratios of certain funds and classes; and (xiii) Fidelity's expectations regarding the future asset levels of certain funds.
Based on its evaluation of all of the conclusions noted above, and after considering all factors it believed relevant, the Board concluded that the advisory fee structures are fair and reasonable, and that each fund's Advisory Contracts should be renewed.
Proxy Voting Results
A special meeting of shareholders was held on December 8, 2017. The results of votes taken among shareholders on the proposals before them are reported below. Each vote reported represents one dollar of net asset value held on the record date for the meeting.
PROPOSAL 1
To elect a Board of Trustees.
| | # of
Votes | % of
Votes |
| James C. Curvey |
| Affirmative | 40,874,579,146.19 | 94.146 |
| Withheld | 2,541,618,753.48 | 5.854 |
| TOTAL | 43,416,197,899.67 | 100.000 |
| Dennis J. Dirks |
| Affirmative | 41,093,243,800.03 | 94.650 |
| Withheld | 2,322,954,099.64 | 5.350 |
| TOTAL | 43,416,197,899.67 | 100.000 |
| Donald F. Donahue |
| Affirmative | 41,121,116,505.64 | 94.714 |
| Withheld | 2,295,081,394.03 | 5.286 |
| TOTAL | 43,416,197,899.67 | 100.000 |
| Alan J. Lacy |
| Affirmative | 41,091,494,851.72 | 94.646 |
| Withheld | 2,324,703,047.95 | 5.354 |
| TOTAL | 43,416,197,899.67 | 100.00 |
| Ned C. Lautenbach |
| Affirmative | 40,970,733,721.42 | 94.368 |
| Withheld | 2,445,464,178.25 | 5.632 |
| TOTAL | 43,416,197,899.67 | 100.000 |
| Joseph Mauriello |
| Affirmative | 41,021,688,840.89 | 94.485 |
| Withheld | 2,394,509,058.78 | 5.515 |
| TOTAL | 43,416,197,899.67 | 100.000 |
| Charles S. Morrison |
| Affirmative | 41,163,534,997.01 | 94.812 |
| Withheld | 2,252,662,902.66 | 5.188 |
| TOTAL | 43,416,197,899.67 | 100.000 |
| Cornelia M. Small |
| Affirmative | 41,061,752,034.66 | 94.578 |
| Withheld | 2,354,445,865.01 | 5.422 |
| TOTAL | 43,416,197,899.67 | 100.000 |
| Garnett A. Smith |
| Affirmative | 41,061,939,407.02 | 94.578 |
| Withheld | 2,354,258,492.65 | 5.422 |
| TOTAL | 43,416,197,899.67 | 100.000 |
| David M. Thomas |
| Affirmative | 41,102,875,738.06 | 94.672 |
| Withheld | 2,313,322,161.61 | 5.328 |
| TOTAL | 43,416,197,899.67 | 100.000 |
| Michael E. Wiley |
| Affirmative | 41,112,279,187.11 | 94.694 |
| Withheld | 2,303,918,712.56 | 5.306 |
| TOTAL | 43,416,197,899.67 | 100.000 |
PROPOSAL 2
To eliminate a fundamental investment policy for Automotive Portfolio.
| | # of
Votes | % of
Votes |
| Affirmative | 27,036,109.38 | 75.965 |
| Against | 2,996,923.26 | 8.421 |
| Abstain | 1,550,910.38 | 4.357 |
| Broker Non-Vote | 4,006,582.74 | 11.257 |
| TOTAL | 35,590,525.76 | 100.000 |
PROPOSAL 2
To eliminate a fundamental investment policy for Construction and Housing Portfolio.
| | # of
Votes | % of
Votes |
| Affirmative | 156,364,972.36 | 68.427 |
| Against | 34,867,739.77 | 15.258 |
| Abstain | 21,660,092.97 | 9.478 |
| Broker Non-Vote | 15,624,057.17 | 6.837 |
| TOTAL | 228,516,862.27 | 100.000 |
PROPOSAL 2
To eliminate a fundamental investment policy for Consumer Discretionary Portfolio.
| | # of
Votes | % of
Votes |
| Affirmative | 436,017,398.20 | 79.892 |
| Against | 62,811,703.14 | 11.509 |
| Abstain | 34,930,477.38 | 6.400 |
| Broker Non-Vote | 12,002,492.54 | 2.199 |
| TOTAL | 545,762,071.26 | 100.000 |
PROPOSAL 2
To eliminate a fundamental investment policy for Leisure Portfolio.
| | # of
Votes | % of
Votes |
| Affirmative | 220,998,535.96 | 70.470 |
| Against | 57,191,707.26 | 18.237 |
| Abstain | 23,695,870.57 | 7.556 |
| Broker Non-Vote | 11,721,748.42 | 3.737 |
| TOTAL | 313,607,862.21 | 100.000 |
PROPOSAL 2
To eliminate a fundamental investment policy for Multimedia Portfolio.
| | # of
Votes | % of
Votes |
| Affirmative | 313,144,940.54 | 74.902 |
| Against | 48,155,304.60 | 11.518 |
| Abstain | 30,701,082.51 | 7.343 |
| Broker Non-Vote | 26,075,881.84 | 6.237 |
| TOTAL | 418,077,209.49 | 100.000 |
PROPOSAL 2
To eliminate a fundamental investment policy for Retailing Portfolio.
| | # of
Votes | % of
Votes |
| Affirmative | 801,179,729.38 | 70.291 |
| Against | 135,976,292.91 | 11.930 |
| Abstain | 78,243,392.45 | 6.865 |
| Broker Non-Vote | 124,408,405.10 | 10.914 |
| TOTAL | 1,139,807,819.84 | 100.000 |
PROPOSAL 3
To modify Automotive Portfolio's fundamental concentration policy.
| | # of
Votes | % of
Votes |
| Affirmative | 27,288,762.73 | 76.675 |
| Against | 2,728,600.54 | 7.667 |
| Abstain | 1,566,579.75 | 4.401 |
| Broker Non-Vote | 4,006,582.74 | 11.257 |
| TOTAL | 35,590,525.76 | 100.000 |
PROPOSAL 3
To modify Leisure Portfolio's fundamental concentration policy.
| | # of
Votes | % of
Votes |
| Affirmative | 233,252,103.06 | 74.377 |
| Against | 44,732,657.96 | 14.264 |
| Abstain | 23,901,352.77 | 7.622 |
| Broker Non-Vote | 11,721,748.42 | 3.737 |
| TOTAL | 313,607,862.21 | 100.000 |
PROPOSAL 3
To modify Multimedia Portfolio's fundamental concentration policy.
| | # of
Votes | % of
Votes |
| Affirmative | 320,359,376.27 | 76.627 |
| Against | 40,759,903.08 | 9.750 |
| Abstain | 30,882,048.30 | 7.386 |
| Broker Non-Vote | 26,075,881.84 | 6.237 |
| TOTAL | 418,077,209.49 | 100.000 |
PROPOSAL 3
To modify Retailing Portfolio's fundamental concentration policy.
| | # of
Votes | % of
Votes |
| Affirmative | 834,866,382.54 | 73.247 |
| Against | 104,495,346.17 | 9.168 |
| Abstain | 76,037,686.03 | 6.671 |
| Broker Non-Vote | 124,408,405.10 | 10.914 |
| TOTAL | 1,139,807,819.84 | 100.000 |
|
| Proposal 1 reflects trust wide proposal and voting results. |
SELCON-ANN-0418
1.813633.113
Fidelity® Select Portfolios®
Financials Sector Banking Portfolio
Brokerage and Investment Management Portfolio
Consumer Finance Portfolio
Financial Services Portfolio
Insurance Portfolio
Annual Report February 28, 2018 |
|
Contents
To view a fund's proxy voting guidelines and proxy voting record for the 12-month period ended June 30, visit http://www.fidelity.com/proxyvotingresults or visit the Securities and Exchange Commission's (SEC) web site at http://www.sec.gov.
You may also call 1-800-544-8544 to request a free copy of the proxy voting guidelines.
Standard & Poor's, S&P and S&P 500 are registered service marks of The McGraw-Hill Companies, Inc. and have been licensed for use by Fidelity Distributors Corporation.
Other third-party marks appearing herein are the property of their respective owners.
All other marks appearing herein are registered or unregistered trademarks or service marks of FMR LLC or an affiliated company. © 2018 FMR LLC. All rights reserved.
This report and the financial statements contained herein are submitted for the general information of the shareholders of the Funds. This report is not authorized for distribution to prospective investors in the Funds unless preceded or accompanied by an effective prospectus.
A fund files its complete schedule of portfolio holdings with the SEC for the first and third quarters of each fiscal year on Form N-Q. Forms N-Q are available on the SEC’s web site at http://www.sec.gov. A fund's Forms N-Q may be reviewed and copied at the SEC’s Public Reference Room in Washington, DC. Information regarding the operation of the SEC's Public Reference Room may be obtained by calling 1-800-SEC-0330.
For a complete list of a fund's portfolio holdings, view the most recent holdings listing, semiannual report, or annual report on Fidelity's web site at http://www.fidelity.com, http://www.institutional.fidelity.com, or http://www.401k.com, as applicable.
NOT FDIC INSURED •MAY LOSE VALUE •NO BANK GUARANTEE
Neither the Funds nor Fidelity Distributors Corporation is a bank.
Banking Portfolio
Performance: The Bottom Line
Average annual total return reflects the change in the value of an investment, assuming reinvestment of distributions from dividend income and capital gains (the profits earned upon the sale of securities that have grown in value, if any) and assuming a constant rate of performance each year. The hypothetical investment and the average annual total returns do not reflect the deduction of taxes that a shareholder would pay on fund distributions or the redemption of fund shares. During periods of reimbursement by Fidelity, a fund’s total return will be greater than it would be had the reimbursement not occurred. How a fund did yesterday is no guarantee of how it will do tomorrow.
Average Annual Total Returns
| For the periods ended February 28, 2018 | Past 1 year | Past 5 years | Past 10 years |
| Banking Portfolio | 12.31% | 16.07% | 7.66% |
$10,000 Over 10 Years
Let's say hypothetically that $10,000 was invested in Banking Portfolio on February 29, 2008.
The chart shows how the value of your investment would have changed, and also shows how the S&P 500® Index performed over the same period.
| Period Ending Values |
| $20,918 | Banking Portfolio |
| $25,307 | S&P 500® Index |
Banking Portfolio
Management's Discussion of Fund Performance
Market Recap: U.S. equities gained 17.10% for the 12 months ending February 28, 2018, as the S&P 500
® index moved steadily higher throughout 2017 and into 2018 until sharply reversing course in February. The drop was in stark contrast to the low volatility seen throughout 2017, along with consumer sentiment and other market indicators that stayed positive. Investors remained decidedly upbeat as the calendar turned, and the index rose 5.73% in January. February was a decidedly different story, though, as volatility spiked amid fear that rising inflation and the potential for the economy to overheat would prompt the U.S. Federal Reserve to pick up the pace of interest rate hikes. The index returned -3.69% for the month, its first negative result since October 2016. For the full 12 months, growth stocks handily topped value, while large-caps bested small-caps. By sector, information technology fared best by far, gaining 36% amid strong earnings growth from several major index constituents. Consumer discretionary (+22%) also stood out, driven by retailers. Financials added 20%, riding the uptick in bond yields. Materials and industrials rose about 16% each, boosted by higher demand, especially from China. Conversely, notable laggards included the defensive telecommunication services (-5%) and utilities (-2%) sectors, while rising rates held back real estate (-3%).
Comments from Portfolio Manager Matthew Reed: For the year, the fund gained 12.31%, comfortably ahead of the 10.10% return of the MSCI U.S. IMI Banks 5% Capped Linked Index, but trailing the S&P 500
®. Versus the MSCI index, stock selection and an underweighting in regional banks lifted performance, as did positioning in thrifts & mortgage finance. Our top relative contributor and one of the fund’s largest holdings was Bank of America, which saw its shares advance about 32% this period. Other notable contributors included a group of three stocks of companies that provide mortgage or title insurance: NMI Holdings, and two non-index stocks, First American Financial Group and FNF Group. Conversely, an out-of-index allocation to consumer finance was a mild detractor this period. Bank of the Ozarks was the fund’s largest relative detractor. Shares of the Arkansas-based regional lender tumbled near the end of July. Selling the strong-performing shares of regional bank Comerica early in the period also hurt.
The views expressed above reflect those of the portfolio manager(s) only through the end of the period as stated on the cover of this report and do not necessarily represent the views of Fidelity or any other person in the Fidelity organization. Any such views are subject to change at any time based upon market or other conditions and Fidelity disclaims any responsibility to update such views. These views may not be relied on as investment advice and, because investment decisions for a Fidelity fund are based on numerous factors, may not be relied on as an indication of trading intent on behalf of any Fidelity fund.
Notes to shareholders: On April 3, 2017, Matthew Reed became sole Portfolio Manager of the fund, after having served as Co-Manager with John Sheehy since September 1, 2016.
On December 8, 2017, shareholders approved proposals from the Board of Trustees to eliminate each sector/industry fund's fundamental “invests primarily” policy and to modify the fundamental concentration policy for certain funds. Additionally, shareholders approved a proposal to reclassify Select Banking Portfolio as a non-diversified fund, which allows it to focus its investments more heavily in securities of fewer issuers. The changes took effect on January 1, 2018, and do not impact how the funds are managed.
Banking Portfolio
Investment Summary (Unaudited)
Top Ten Stocks as of February 28, 2018
| | % of fund's net assets |
| Bank of America Corp. | 7.8 |
| Wells Fargo & Co. | 7.1 |
| Huntington Bancshares, Inc. | 6.4 |
| PNC Financial Services Group, Inc. | 5.3 |
| U.S. Bancorp | 5.0 |
| Bank of the Ozarks, Inc. | 3.8 |
| Capital One Financial Corp. | 3.2 |
| Citigroup, Inc. | 2.9 |
| SunTrust Banks, Inc. | 2.8 |
| Signature Bank | 2.7 |
| | 47.0 |
Top Industries (% of fund's net assets)
| As of February 28, 2018 |
| | Banks | 83.9% |
| | Consumer Finance | 6.8% |
| | Thrifts & Mortgage Finance | 3.8% |
| | Capital Markets | 2.9% |
| | Textiles, Apparel & Luxury Goods | 0.7% |
| | All Others* | 1.9% |

* Includes short-term investments and net other assets (liabilities).
Banking Portfolio
Schedule of Investments February 28, 2018
Showing Percentage of Net Assets
| Common Stocks - 99.1% | | | |
| | | Shares | Value |
| Banks - 83.9% | | | |
| Diversified Banks - 25.3% | | | |
| Bank of America Corp. | | 2,016,576 | $64,732,091 |
| Citigroup, Inc. | | 314,400 | 23,734,056 |
| JPMorgan Chase & Co. | | 142,500 | 16,458,750 |
| The Bank of NT Butterfield & Son Ltd. | | 94,200 | 4,296,462 |
| U.S. Bancorp | | 765,100 | 41,590,836 |
| Wells Fargo & Co. | | 1,014,292 | 59,244,796 |
| | | | 210,056,991 |
| Regional Banks - 58.6% | | | |
| 1st Source Corp. | | 160,860 | 7,933,615 |
| Associated Banc-Corp. | | 526,200 | 12,997,140 |
| Bank of the Ozarks, Inc. | | 639,500 | 31,904,655 |
| BB&T Corp. | | 180,500 | 9,810,175 |
| Camden National Corp. | | 96,332 | 4,067,137 |
| CIT Group, Inc. | | 253,000 | 13,421,650 |
| Commerce Bancshares, Inc. | | 66,172 | 3,822,756 |
| Community Trust Bancorp, Inc. | | 175,776 | 7,646,256 |
| ConnectOne Bancorp, Inc. | | 204,300 | 5,883,840 |
| Cullen/Frost Bankers, Inc. | | 69,000 | 7,175,310 |
| CVB Financial Corp. | | 176,200 | 4,052,600 |
| East West Bancorp, Inc. | | 277,000 | 18,157,350 |
| First Citizen Bancshares, Inc. | | 39,200 | 15,958,320 |
| First Hawaiian, Inc. | | 399,200 | 11,093,768 |
| Great Western Bancorp, Inc. | | 214,300 | 8,762,727 |
| Hanmi Financial Corp. | | 279,900 | 8,550,945 |
| Hilltop Holdings, Inc. | | 362,400 | 8,809,944 |
| Hope Bancorp, Inc. | | 683,620 | 12,346,177 |
| Huntington Bancshares, Inc. | | 3,371,300 | 52,929,410 |
| Investors Bancorp, Inc. | | 642,900 | 8,679,150 |
| Lakeland Financial Corp. | | 158,700 | 7,190,697 |
| Northrim Bancorp, Inc. | | 44,500 | 1,479,625 |
| PacWest Bancorp | | 195,336 | 10,184,819 |
| PNC Financial Services Group, Inc. | | 277,291 | 43,717,699 |
| Popular, Inc. | | 197,737 | 8,306,931 |
| Preferred Bank, Los Angeles | | 142,256 | 8,866,816 |
| Prosperity Bancshares, Inc. | | 183,400 | 13,755,000 |
| Regions Financial Corp. | | 993,200 | 19,278,012 |
| Signature Bank (a) | | 155,500 | 22,732,545 |
| SunTrust Banks, Inc. | | 337,000 | 23,536,080 |
| SVB Financial Group (a) | | 16,000 | 3,983,680 |
| Trico Bancshares | | 16,897 | 631,103 |
| UMB Financial Corp. | | 160,500 | 11,716,500 |
| Univest Corp. of Pennsylvania | | 167,300 | 4,584,020 |
| Valley National Bancorp | | 996,300 | 12,423,861 |
| WesBanco, Inc. | | 289,800 | 11,942,658 |
| Wintrust Financial Corp. | | 157,400 | 13,301,874 |
| Zions Bancorporation | | 268,450 | 14,756,697 |
| | | | 486,391,542 |
|
| TOTAL BANKS | | | 696,448,533 |
|
| Capital Markets - 2.9% | | | |
| Asset Management & Custody Banks - 2.4% | | | |
| Northern Trust Corp. | | 64,500 | 6,828,615 |
| State Street Corp. | | 89,800 | 9,532,270 |
| The Blackstone Group LP | | 115,300 | 3,920,200 |
| | | | 20,281,085 |
| Investment Banking & Brokerage - 0.5% | | | |
| Goldman Sachs Group, Inc. | | 15,800 | 4,154,294 |
|
| TOTAL CAPITAL MARKETS | | | 24,435,379 |
|
| Consumer Finance - 6.8% | | | |
| Consumer Finance - 6.8% | | | |
| Capital One Financial Corp. | | 270,800 | 26,519,444 |
| Discover Financial Services | | 107,300 | 8,458,459 |
| OneMain Holdings, Inc. (a) | | 265,300 | 8,134,098 |
| SLM Corp. (a) | | 844,700 | 9,215,677 |
| Synchrony Financial | | 118,200 | 4,301,298 |
| | | | 56,628,976 |
| Insurance - 0.5% | | | |
| Property & Casualty Insurance - 0.5% | | | |
| First American Financial Corp. | | 22,200 | 1,288,266 |
| FNF Group | | 64,700 | 2,583,471 |
| | | | 3,871,737 |
| Textiles, Apparel & Luxury Goods - 0.7% | | | |
| Textiles - 0.7% | | | |
| Cadence Bancorp | | 213,200 | 5,845,944 |
| Thrifts & Mortgage Finance - 3.8% | | | |
| Thrifts & Mortgage Finance - 3.8% | | | |
| Beneficial Bancorp, Inc. | | 546,705 | 8,200,575 |
| Essent Group Ltd. (a) | | 50,500 | 2,277,045 |
| Meridian Bancorp, Inc. Maryland | | 222,465 | 4,460,423 |
| NMI Holdings, Inc. (a) | | 527,226 | 10,465,436 |
| TFS Financial Corp. | | 435,200 | 6,380,032 |
| | | | 31,783,511 |
| Trading Companies & Distributors - 0.5% | | | |
| Trading Companies & Distributors - 0.5% | | | |
| AerCap Holdings NV (a) | | 76,400 | 3,790,204 |
| TOTAL COMMON STOCKS | | | |
| (Cost $568,934,791) | | | 822,804,284 |
|
| Money Market Funds - 1.2% | | | |
| Fidelity Cash Central Fund, 1.41% (b) | | | |
| (Cost $10,070,337) | | 10,068,323 | 10,070,337 |
| TOTAL INVESTMENT IN SECURITIES - 100.3% | | | |
| (Cost $579,005,128) | | | 832,874,621 |
| NET OTHER ASSETS (LIABILITIES) - (0.3)% | | | (2,629,975) |
| NET ASSETS - 100% | | | $830,244,646 |
Legend
(a) Non-income producing
(b) Affiliated fund that is generally available only to investment companies and other accounts managed by Fidelity Investments. The rate quoted is the annualized seven-day yield of the fund at period end. A complete unaudited listing of the fund's holdings as of its most recent quarter end is available upon request. In addition, each Fidelity Central Fund's financial statements, which are not covered by the Fund's Report of Independent Registered Public Accounting Firm, are available on the SEC's website or upon request.
Affiliated Central Funds
Information regarding fiscal year to date income earned by the Fund from investments in Fidelity Central Funds is as follows:
| Fund | Income earned |
| Fidelity Cash Central Fund | $80,463 |
| Fidelity Securities Lending Cash Central Fund | 7,950 |
| Total | $88,413 |
Amounts in the income column in the above table include any capital gain distributions from underlying funds, which are presented in the corresponding line-item in the Statement of Operations if applicable.
Investment Valuation
All investments are categorized as Level 1 under the Fair Value Hierarchy. The inputs or methodology used for valuing securities may not be an indication of the risk associated with investing in those securities. For more information on valuation inputs please refer to the Investment Valuation section in the accompanying Notes to Financial Statements.
See accompanying notes which are an integral part of the financial statements.
Banking Portfolio
Financial Statements
Statement of Assets and Liabilities
| | | February 28, 2018 |
| Assets | | |
Investment in securities, at value — See accompanying schedule:
Unaffiliated issuers (cost $568,934,791) | $822,804,284 | |
| Fidelity Central Funds (cost $10,070,337) | 10,070,337 | |
| Total Investment in Securities (cost $579,005,128) | | $832,874,621 |
| Receivable for fund shares sold | | 1,675,272 |
| Dividends receivable | | 910,328 |
| Distributions receivable from Fidelity Central Funds | | 5,811 |
| Prepaid expenses | | 3,342 |
| Other receivables | | 15,392 |
| Total assets | | 835,484,766 |
| Liabilities | | |
| Payable for investments purchased | $2,661,070 | |
| Payable for fund shares redeemed | 2,010,270 | |
| Accrued management fee | 373,571 | |
| Other affiliated payables | 141,399 | |
| Other payables and accrued expenses | 53,810 | |
| Total liabilities | | 5,240,120 |
| Net Assets | | $830,244,646 |
| Net Assets consist of: | | |
| Paid in capital | | $518,930,999 |
| Undistributed net investment income | | 3,597,671 |
| Accumulated undistributed net realized gain (loss) on investments and foreign currency transactions | | 53,846,483 |
| Net unrealized appreciation (depreciation) on investments | | 253,869,493 |
| Net Assets, for 22,549,375 shares outstanding | | $830,244,646 |
| Net Asset Value, offering price and redemption price per share ($830,244,646 ÷ 22,549,375 shares) | | $36.82 |
See accompanying notes which are an integral part of the financial statements.
Statement of Operations
| | | Year ended February 28, 2018 |
| Investment Income | | |
| Dividends | | $19,743,722 |
| Income from Fidelity Central Funds | | 88,413 |
| Total income | | 19,832,135 |
| Expenses | | |
| Management fee | $5,308,403 | |
| Transfer agent fees | 1,728,727 | |
| Accounting and security lending fees | 326,422 | |
| Custodian fees and expenses | 16,287 | |
| Independent trustees' fees and expenses | 22,113 | |
| Registration fees | 63,933 | |
| Audit | 42,618 | |
| Legal | 20,350 | |
| Interest | 2,928 | |
| Miscellaneous | 32,674 | |
| Total expenses before reductions | 7,564,455 | |
| Expense reductions | (50,189) | 7,514,266 |
| Net investment income (loss) | | 12,317,869 |
| Realized and Unrealized Gain (Loss) | | |
| Net realized gain (loss) on: | | |
| Investment securities: | | |
| Unaffiliated issuers | 103,298,963 | |
| Fidelity Central Funds | (450) | |
| Foreign currency transactions | 26,119 | |
| Total net realized gain (loss) | | 103,324,632 |
| Change in net unrealized appreciation (depreciation) on: | | |
| Investment securities: | | |
| Unaffiliated issuers | (46,469,930) | |
| Fidelity Central Funds | (1,600) | |
| Assets and liabilities in foreign currencies | (18,521) | |
| Total change in net unrealized appreciation (depreciation) | | (46,490,051) |
| Net gain (loss) | | 56,834,581 |
| Net increase (decrease) in net assets resulting from operations | | $69,152,450 |
See accompanying notes which are an integral part of the financial statements.
Statement of Changes in Net Assets
| | Year ended February 28, 2018 | Year ended February 28, 2017 |
| Increase (Decrease) in Net Assets | | |
| Operations | | |
| Net investment income (loss) | $12,317,869 | $8,899,856 |
| Net realized gain (loss) | 103,324,632 | 950,718 |
| Change in net unrealized appreciation (depreciation) | (46,490,051) | 316,502,560 |
| Net increase (decrease) in net assets resulting from operations | 69,152,450 | 326,353,134 |
| Distributions to shareholders from net investment income | (7,600,446) | (7,718,086) |
| Distributions to shareholders from net realized gain | (13,137,423) | – |
| Total distributions | (20,737,869) | (7,718,086) |
| Share transactions | | |
| Proceeds from sales of shares | 415,824,225 | 644,775,316 |
| Reinvestment of distributions | 19,534,739 | 7,448,757 |
| Cost of shares redeemed | (915,429,348) | (274,527,992) |
| Net increase (decrease) in net assets resulting from share transactions | (480,070,384) | 377,696,081 |
| Redemption fees | 41,261 | 49,199 |
| Total increase (decrease) in net assets | (431,614,542) | 696,380,328 |
| Net Assets | | |
| Beginning of period | 1,261,859,188 | 565,478,860 |
| End of period | $830,244,646 | $1,261,859,188 |
| Other Information | | |
| Undistributed net investment income end of period | $3,597,671 | $151,758 |
| Shares | | |
| Sold | 12,143,322 | 21,208,450 |
| Issued in reinvestment of distributions | 553,617 | 232,556 |
| Redeemed | (27,674,968) | (9,972,925) |
| Net increase (decrease) | (14,978,029) | 11,468,081 |
See accompanying notes which are an integral part of the financial statements.
Financial Highlights
Banking Portfolio
| | | | | | |
| Years ended February 28, | 2018 | 2017 | 2016 A | 2015 | 2014 |
| Selected Per–Share Data | | | | | |
| Net asset value, beginning of period | $33.63 | $21.70 | $26.24 | $26.11 | $20.58 |
| Income from Investment Operations | | | | | |
| Net investment income (loss)B | .42 | .33 | .33 | .30 | .29 |
| Net realized and unrealized gain (loss) | 3.68 | 11.85 | (3.43) | 1.04 | 5.97 |
| Total from investment operations | 4.10 | 12.18 | (3.10) | 1.34 | 6.26 |
| Distributions from net investment income | (.33) | (.25) | (.28) | (.34) | (.20) |
| Distributions from net realized gain | (.58) | – | (1.16) | (.87) | (.53) |
| Total distributions | (.91) | (.25) | (1.44) | (1.21) | (.73) |
| Redemption fees added to paid in capitalB,C | – | – | – | – | – |
| Net asset value, end of period | $36.82 | $33.63 | $21.70 | $26.24 | $26.11 |
| Total ReturnD | 12.31% | 56.16% | (12.57)% | 5.30% | 30.48% |
| Ratios to Average Net AssetsE,F | | | | | |
| Expenses before reductions | .77% | .79% | .79% | .80% | .81% |
| Expenses net of fee waivers, if any | .77% | .79% | .79% | .80% | .81% |
| Expenses net of all reductions | .77% | .79% | .79% | .79% | .80% |
| Net investment income (loss) | 1.26% | 1.20% | 1.27% | 1.14% | 1.22% |
| Supplemental Data | | | | | |
| Net assets, end of period (000 omitted) | $830,245 | $1,261,859 | $565,479 | $584,635 | $809,980 |
| Portfolio turnover rateG | 35% | 34% | 63% | 65% | 91% |
A For the year ended February 29.
B Calculated based on average shares outstanding during the period.
C Amount represents less than $.005 per share.
D Total returns would have been lower if certain expenses had not been reduced during the applicable periods shown.
E Fees and expenses of any underlying Fidelity Central Funds are not included in the Fund's expense ratio. The Fund indirectly bears its proportionate share of the expenses of any underlying Fidelity Central Funds.
F Expense ratios reflect operating expenses of the Fund. Expenses before reductions do not reflect amounts reimbursed by the investment adviser or reductions from brokerage service arrangements or reductions from other expense offset arrangements and do not represent the amount paid by the Fund during periods when reimbursements or reductions occur. Expenses net of fee waivers reflect expenses after reimbursement by the investment adviser but prior to reductions from brokerage service arrangements or other expense offset arrangements. Expenses net of all reductions represent the net expenses paid by the Fund.
G Amount does not include the portfolio activity of any underlying Fidelity Central Funds.
See accompanying notes which are an integral part of the financial statements.
Brokerage and Investment Management Portfolio
Performance: The Bottom Line
Average annual total return reflects the change in the value of an investment, assuming reinvestment of distributions from dividend income and capital gains (the profits earned upon the sale of securities that have grown in value, if any) and assuming a constant rate of performance each year. The hypothetical investment and the average annual total returns do not reflect the deduction of taxes that a shareholder would pay on fund distributions or the redemption of fund shares. During periods of reimbursement by Fidelity, a fund’s total return will be greater than it would be had the reimbursement not occurred. How a fund did yesterday is no guarantee of how it will do tomorrow.
Average Annual Total Returns
| For the periods ended February 28, 2018 | Past 1 year | Past 5 years | Past 10 years |
| Brokerage and Investment Management Portfolio | 27.51% | 12.66% | 6.75% |
$10,000 Over 10 Years
Let's say hypothetically that $10,000 was invested in Brokerage and Investment Management Portfolio on February 29, 2008.
The chart shows how the value of your investment would have changed, and also shows how the S&P 500® Index performed over the same period.
| Period Ending Values |
| $19,216 | Brokerage and Investment Management Portfolio |
| $25,307 | S&P 500® Index |
Brokerage and Investment Management Portfolio
Management's Discussion of Fund Performance
Market Recap: U.S. equities gained 17.10% for the 12 months ending February 28, 2018, as the S&P 500
® index moved steadily higher throughout 2017 and into 2018 until sharply reversing course in February. The drop was in stark contrast to the low volatility seen throughout 2017, along with consumer sentiment and other market indicators that stayed positive. Investors remained decidedly upbeat as the calendar turned, and the index rose 5.73% in January. February was a decidedly different story, though, as volatility spiked amid fear that rising inflation and the potential for the economy to overheat would prompt the U.S. Federal Reserve to pick up the pace of interest rate hikes. The index returned -3.69% for the month, its first negative result since October 2016. For the full 12 months, growth stocks handily topped value, while large-caps bested small-caps. By sector, information technology fared best by far, gaining 36% amid strong earnings growth from several major index constituents. Consumer discretionary (+22%) also stood out, driven by retailers. Financials added 20%, riding the uptick in bond yields. Materials and industrials rose about 16% each, boosted by higher demand, especially from China. Conversely, notable laggards included the defensive telecommunication services (-5%) and utilities (-2%) sectors, while rising rates held back real estate (-3%).
Comments from Portfolio Manager Daniel Dittler: For the year, the fund gained 27.51%, modestly trailing the 28.28% return of the MSCI U.S. IMI Capital Markets 5% Capped Linked Index and well ahead of the S&P 500
®. Versus the MSCI index, stock picks in the asset management & custody banks group hindered the fund’s result, while security selection in the financial exchanges & data category helped. Individual detractors included asset manager T. Rowe Price Group, which I eliminated from the fund in the first half of the period. We largely missed out as the equity market rally and lower corporate tax rates drove the stock’s strong return this period. Elsewhere, untimely ownership of electronic market maker Virtu Financial hurt. I sold Virtu following news it would acquire competitor KCG Holdings, a deal that closed in July. We didn’t own Virtu in early February when a much better-than-expected earnings report from the combined entity resulted in a huge gain. I later re-established positions in both T. Rowe and Virtu. Top individual contributors included Cboe Global Markets, parent of the Chicago Board Options Exchange. Synergies from Cboe’s acquisition of Bats Global Markets in early 2017 helped drive the stock’s strong advance this period.
The views expressed above reflect those of the portfolio manager(s) only through the end of the period as stated on the cover of this report and do not necessarily represent the views of Fidelity or any other person in the Fidelity organization. Any such views are subject to change at any time based upon market or other conditions and Fidelity disclaims any responsibility to update such views. These views may not be relied on as investment advice and, because investment decisions for a Fidelity fund are based on numerous factors, may not be relied on as an indication of trading intent on behalf of any Fidelity fund.
Note to shareholders: On December 8, 2017, shareholders approved proposals from the Board of Trustees to eliminate each sector/industry fund’s fundamental “invests primarily” policy and to modify the fundamental concentration policy for certain funds. Additionally, Select Brokerage and Investment Management Portfolio broadened its investment focus to include companies involved in providing data and decision support tools to the capital markets industry. The changes took effect on January 1, 2018.
Brokerage and Investment Management Portfolio
Investment Summary (Unaudited)
Top Ten Stocks as of February 28, 2018
| | % of fund's net assets |
| BlackRock, Inc. Class A | 7.5 |
| S&P Global, Inc. | 6.8 |
| Morgan Stanley | 6.4 |
| TD Ameritrade Holding Corp. | 6.2 |
| Charles Schwab Corp. | 6.1 |
| Goldman Sachs Group, Inc. | 4.9 |
| T. Rowe Price Group, Inc. | 4.8 |
| Ameriprise Financial, Inc. | 4.6 |
| LPL Financial | 4.3 |
| State Street Corp. | 4.2 |
| | 55.8 |
Top Industries (% of fund's net assets)
| As of February 28, 2018 |
| | Capital Markets | 99.4% |
| | All Others* | 0.6% |

* Includes short-term investments and net other assets (liabilities).
Brokerage and Investment Management Portfolio
Schedule of Investments February 28, 2018
Showing Percentage of Net Assets
| Common Stocks - 99.4% | | | |
| | | Shares | Value |
| Capital Markets - 99.4% | | | |
| Asset Management & Custody Banks - 36.9% | | | |
| Affiliated Managers Group, Inc. | | 83,100 | $15,735,816 |
| Ameriprise Financial, Inc. | | 134,800 | 21,088,112 |
| Apollo Global Management LLC Class A | | 485,800 | 15,934,240 |
| BlackRock, Inc. Class A | | 62,700 | 34,449,261 |
| Eaton Vance Corp. (non-vtg.) | | 186,300 | 9,860,859 |
| Invesco Ltd. | | 577,900 | 18,804,866 |
| Legg Mason, Inc. | | 322,042 | 12,852,696 |
| State Street Corp. | | 181,900 | 19,308,685 |
| T. Rowe Price Group, Inc. | | 200,500 | 22,435,950 |
| | | | 170,470,485 |
| Financial Exchanges & Data - 18.9% | | | |
| Cboe Global Markets, Inc. | | 140,738 | 15,764,063 |
| CME Group, Inc. | | 105,200 | 17,480,032 |
| MarketAxess Holdings, Inc. | | 23,700 | 4,796,880 |
| Moody's Corp. | | 60,600 | 10,112,928 |
| MSCI, Inc. | | 54,400 | 7,698,688 |
| S&P Global, Inc. | | 163,100 | 31,282,580 |
| | | | 87,135,171 |
| Investment Banking & Brokerage - 43.6% | | | |
| Charles Schwab Corp. | | 528,180 | 28,004,104 |
| E*TRADE Financial Corp. (a) | | 218,500 | 11,412,255 |
| Gain Capital Holdings, Inc. (b) | | 337,886 | 2,395,612 |
| Goldman Sachs Group, Inc. | | 86,900 | 22,848,617 |
| Houlihan Lokey | | 44,522 | 2,066,711 |
| Lazard Ltd. Class A | | 99,100 | 5,348,427 |
| LPL Financial | | 310,900 | 19,981,543 |
| Moelis & Co. Class A | | 199,800 | 10,139,850 |
| Morgan Stanley | | 530,900 | 29,741,018 |
| PJT Partners, Inc. | | 253,412 | 12,115,628 |
| Raymond James Financial, Inc. | | 122,400 | 11,347,704 |
| Stifel Financial Corp. | | 214,700 | 13,712,889 |
| TD Ameritrade Holding Corp. | | 501,100 | 28,813,250 |
| Virtu Financial, Inc. Class A | | 126,100 | 3,745,170 |
| | | | 201,672,778 |
|
| TOTAL CAPITAL MARKETS | | | 459,278,434 |
|
| Diversified Financial Services - 0.0% | | | |
| Other Diversified Financial Services - 0.0% | | | |
| NEX Group PLC | | 5,340 | 49,233 |
| TOTAL COMMON STOCKS | | | |
| (Cost $349,760,415) | | | 459,327,667 |
|
| Money Market Funds - 0.7% | | | |
| Fidelity Cash Central Fund, 1.41% (c) | | 2,977,473 | 2,978,069 |
| Fidelity Securities Lending Cash Central Fund 1.42% (c)(d) | | 65,993 | 66,000 |
| TOTAL MONEY MARKET FUNDS | | | |
| (Cost $3,044,069) | | | 3,044,069 |
| TOTAL INVESTMENT IN SECURITIES - 100.1% | | | |
| (Cost $352,804,484) | | | 462,371,736 |
| NET OTHER ASSETS (LIABILITIES) - (0.1)% | | | (390,895) |
| NET ASSETS - 100% | | | $461,980,841 |
Legend
(a) Non-income producing
(b) Security or a portion of the security is on loan at period end.
(c) Affiliated fund that is generally available only to investment companies and other accounts managed by Fidelity Investments. The rate quoted is the annualized seven-day yield of the fund at period end. A complete unaudited listing of the fund's holdings as of its most recent quarter end is available upon request. In addition, each Fidelity Central Fund's financial statements, which are not covered by the Fund's Report of Independent Registered Public Accounting Firm, are available on the SEC's website or upon request.
(d) Includes investment made with cash collateral received from securities on loan.
Affiliated Central Funds
Information regarding fiscal year to date income earned by the Fund from investments in Fidelity Central Funds is as follows:
| Fund | Income earned |
| Fidelity Cash Central Fund | $41,339 |
| Fidelity Securities Lending Cash Central Fund | 44,170 |
| Total | $85,509 |
Amounts in the income column in the above table include any capital gain distributions from underlying funds, which are presented in the corresponding line-item in the Statement of Operations if applicable.
Investment Valuation
The following is a summary of the inputs used, as of February 28, 2018, involving the Fund's assets and liabilities carried at fair value. The inputs or methodology used for valuing securities may not be an indication of the risk associated with investing in those securities. For more information on valuation inputs, and their aggregation into the levels used below, please refer to the Investment Valuation section in the accompanying Notes to Financial Statements.
| | Valuation Inputs at Reporting Date: |
| Description | Total | Level 1 | Level 2 | Level 3 |
| Investments in Securities: | | | | |
| Common Stocks | $459,327,667 | $459,278,434 | $49,233 | $-- |
| Money Market Funds | 3,044,069 | 3,044,069 | -- | -- |
| Total Investments in Securities: | $462,371,736 | $462,322,503 | $49,233 | $-- |
See accompanying notes which are an integral part of the financial statements.
Brokerage and Investment Management Portfolio
Financial Statements
Statement of Assets and Liabilities
| | | February 28, 2018 |
| Assets | | |
Investment in securities, at value (including securities loaned of $62,392) — See accompanying schedule:
Unaffiliated issuers (cost $349,760,415) | $459,327,667 | |
| Fidelity Central Funds (cost $3,044,069) | 3,044,069 | |
| Total Investment in Securities (cost $352,804,484) | | $462,371,736 |
| Receivable for investments sold | | 551,070 |
| Receivable for fund shares sold | | 340,433 |
| Dividends receivable | | 868,898 |
| Distributions receivable from Fidelity Central Funds | | 1,143 |
| Prepaid expenses | | 1,511 |
| Other receivables | | 48,974 |
| Total assets | | 464,183,765 |
| Liabilities | | |
| Payable for investments purchased | $653,769 | |
| Payable for fund shares redeemed | 1,112,111 | |
| Accrued management fee | 206,992 | |
| Other affiliated payables | 78,211 | |
| Other payables and accrued expenses | 85,841 | |
| Collateral on securities loaned | 66,000 | |
| Total liabilities | | 2,202,924 |
| Net Assets | | $461,980,841 |
| Net Assets consist of: | | |
| Paid in capital | | $331,339,212 |
| Undistributed net investment income | | 987,434 |
| Accumulated undistributed net realized gain (loss) on investments and foreign currency transactions | | 20,084,621 |
| Net unrealized appreciation (depreciation) on investments and assets and liabilities in foreign currencies | | 109,569,574 |
| Net Assets, for 5,468,945 shares outstanding | | $461,980,841 |
| Net Asset Value, offering price and redemption price per share ($461,980,841 ÷ 5,468,945 shares) | | $84.47 |
See accompanying notes which are an integral part of the financial statements.
Statement of Operations
| | | Year ended February 28, 2018 |
| Investment Income | | |
| Dividends | | $9,846,356 |
| Income from Fidelity Central Funds | | 85,509 |
| Total income | | 9,931,865 |
| Expenses | | |
| Management fee | $2,373,618 | |
| Transfer agent fees | 766,014 | |
| Accounting and security lending fees | 171,183 | |
| Custodian fees and expenses | 7,396 | |
| Independent trustees' fees and expenses | 9,298 | |
| Registration fees | 33,920 | |
| Audit | 40,613 | |
| Legal | 7,705 | |
| Interest | 1,937 | |
| Miscellaneous | 23,500 | |
| Total expenses before reductions | 3,435,184 | |
| Expense reductions | (34,271) | 3,400,913 |
| Net investment income (loss) | | 6,530,952 |
| Realized and Unrealized Gain (Loss) | | |
| Net realized gain (loss) on: | | |
| Investment securities: | | |
| Unaffiliated issuers | 45,733,642 | |
| Fidelity Central Funds | (181) | |
| Foreign currency transactions | 9,686 | |
| Total net realized gain (loss) | | 45,743,147 |
| Change in net unrealized appreciation (depreciation) on: | | |
| Investment securities: | | |
| Unaffiliated issuers | 51,879,600 | |
| Fidelity Central Funds | (735) | |
| Assets and liabilities in foreign currencies | 2,322 | |
| Total change in net unrealized appreciation (depreciation) | | 51,881,187 |
| Net gain (loss) | | 97,624,334 |
| Net increase (decrease) in net assets resulting from operations | | $104,155,286 |
See accompanying notes which are an integral part of the financial statements.
Statement of Changes in Net Assets
| | Year ended February 28, 2018 | Year ended February 28, 2017 |
| Increase (Decrease) in Net Assets | | |
| Operations | | |
| Net investment income (loss) | $6,530,952 | $4,812,904 |
| Net realized gain (loss) | 45,743,147 | 13,312,025 |
| Change in net unrealized appreciation (depreciation) | 51,881,187 | 74,061,176 |
| Net increase (decrease) in net assets resulting from operations | 104,155,286 | 92,186,105 |
| Distributions to shareholders from net investment income | (4,145,029) | (4,381,249) |
| Distributions to shareholders from net realized gain | (25,376,935) | (73,811) |
| Total distributions | (29,521,964) | (4,455,060) |
| Share transactions | | |
| Proceeds from sales of shares | 145,843,098 | 79,591,297 |
| Reinvestment of distributions | 27,880,043 | 4,230,142 |
| Cost of shares redeemed | (191,663,677) | (76,843,261) |
| Net increase (decrease) in net assets resulting from share transactions | (17,940,536) | 6,978,178 |
| Redemption fees | 5,197 | 3,550 |
| Total increase (decrease) in net assets | 56,697,983 | 94,712,773 |
| Net Assets | | |
| Beginning of period | 405,282,858 | 310,570,085 |
| End of period | $461,980,841 | $405,282,858 |
| Other Information | | |
| Undistributed net investment income end of period | $987,434 | $83,762 |
| Shares | | |
| Sold | 1,846,524 | 1,190,777 |
| Issued in reinvestment of distributions | 357,771 | 61,844 |
| Redeemed | (2,432,909) | (1,237,856) |
| Net increase (decrease) | (228,614) | 14,765 |
See accompanying notes which are an integral part of the financial statements.
Financial Highlights
Brokerage and Investment Management Portfolio
| | | | | | |
| Years ended February 28, | 2018 | 2017 | 2016 A | 2015 | 2014 |
| Selected Per–Share Data | | | | | |
| Net asset value, beginning of period | $71.13 | $54.65 | $74.78 | $71.99 | $55.99 |
| Income from Investment Operations | | | | | |
| Net investment income (loss)B | 1.15 | .89 | .72 | .96 | .99 |
| Net realized and unrealized gain (loss) | 17.88 | 16.44 | (16.77) | 4.39 | 15.41 |
| Total from investment operations | 19.03 | 17.33 | (16.05) | 5.35 | 16.40 |
| Distributions from net investment income | (.82) | (.83) | (.74) | (.83) | (.39) |
| Distributions from net realized gain | (4.87) | (.01) | (3.34) | (1.73) | (.02) |
| Total distributions | (5.69) | (.85)C | (4.08) | (2.56) | (.40)D |
| Redemption fees added to paid in capitalB,E | – | – | – | – | – |
| Net asset value, end of period | $84.47 | $71.13 | $54.65 | $74.78 | $71.99 |
| Total ReturnF | 27.51% | 31.76% | (22.23)% | 7.43% | 29.29% |
| Ratios to Average Net AssetsG,H | | | | | |
| Expenses before reductions | .79% | .82% | .79% | .79% | .82% |
| Expenses net of fee waivers, if any | .79% | .82% | .79% | .79% | .82% |
| Expenses net of all reductions | .78% | .80% | .78% | .79% | .80% |
| Net investment income (loss) | 1.49% | 1.43% | 1.02% | 1.32% | 1.52% |
| Supplemental Data | | | | | |
| Net assets, end of period (000 omitted) | $461,981 | $405,283 | $310,570 | $577,953 | $834,222 |
| Portfolio turnover rateI | 75% | 146% | 67% | 31% | 182% |
A For the year ended February 29.
B Calculated based on average shares outstanding during the period.
C Total distributions of $.85 per share is comprised of distributions from net investment income of $.831 and distributions from net realized gain of $.014 per share.
D Total distributions of $.40 per share is comprised of distributions from net investment income of $.388 and distributions from net realized gain of $.016 per share.
E Amount represents less than $.005 per share.
F Total returns would have been lower if certain expenses had not been reduced during the applicable periods shown.
G Fees and expenses of any underlying Fidelity Central Funds are not included in the Fund's expense ratio. The Fund indirectly bears its proportionate share of the expenses of any underlying Fidelity Central Funds.
H Expense ratios reflect operating expenses of the Fund. Expenses before reductions do not reflect amounts reimbursed by the investment adviser or reductions from brokerage service arrangements or reductions from other expense offset arrangements and do not represent the amount paid by the Fund during periods when reimbursements or reductions occur. Expenses net of fee waivers reflect expenses after reimbursement by the investment adviser but prior to reductions from brokerage service arrangements or other expense offset arrangements. Expenses net of all reductions represent the net expenses paid by the Fund.
I Amount does not include the portfolio activity of any underlying Fidelity Central Funds.
See accompanying notes which are an integral part of the financial statements.
Consumer Finance Portfolio
Performance: The Bottom Line
Average annual total return reflects the change in the value of an investment, assuming reinvestment of distributions from dividend income and capital gains (the profits earned upon the sale of securities that have grown in value, if any) and assuming a constant rate of performance each year. The hypothetical investment and the average annual total returns do not reflect the deduction of taxes that a shareholder would pay on fund distributions or the redemption of fund shares. During periods of reimbursement by Fidelity, a fund’s total return will be greater than it would be had the reimbursement not occurred. How a fund did yesterday is no guarantee of how it will do tomorrow.
Average Annual Total Returns
| For the periods ended February 28, 2018 | Past 1 year | Past 5 years | Past 10 years |
| Consumer Finance Portfolio | 18.07% | 12.67% | 2.34% |
Prior to December 1, 2010, the fund was named Home Finance Portfolio, and the fund operated under certain different investment policies and compared its performance to a different additional index. The fund's historical performance may not represent its current investment policies.
$10,000 Over 10 Years
Let's say hypothetically that $10,000 was invested in Consumer Finance Portfolio on February 29, 2008.
The chart shows how the value of your investment would have changed, and also shows how the S&P 500® Index performed over the same period.
| Period Ending Values |
| $12,597 | Consumer Finance Portfolio |
| $25,307 | S&P 500® Index |
Consumer Finance Portfolio
Management's Discussion of Fund Performance
Market Recap: U.S. equities gained 17.10% for the 12 months ending February 28, 2018, as the S&P 500
® index moved steadily higher throughout 2017 and into 2018 until sharply reversing course in February. The drop was in stark contrast to the low volatility seen throughout 2017, along with consumer sentiment and other market indicators that stayed positive. Investors remained decidedly upbeat as the calendar turned, and the index rose 5.73% in January. February was a decidedly different story, though, as volatility spiked amid fear that rising inflation and the potential for the economy to overheat would prompt the U.S. Federal Reserve to pick up the pace of interest rate hikes. The index returned -3.69% for the month, its first negative result since October 2016. For the full 12 months, growth stocks handily topped value, while large-caps bested small-caps. By sector, information technology fared best by far, gaining 36% amid strong earnings growth from several major index constituents. Consumer discretionary (+22%) also stood out, driven by retailers. Financials added 20%, riding the uptick in bond yields. Materials and industrials rose about 16% each, boosted by higher demand, especially from China. Conversely, notable laggards included the defensive telecommunication services (-5%) and utilities (-2%) sectors, while rising rates held back real estate (-3%).
Comments from Portfolio Manager Shilpa Mehra: For the year, the fund returned 18.07%, which outpaced the 12.11% advance of the S&P
® Consumer Finance Index and also beat the S&P 500
®. A sizable overweighting in the top-performing data processing & outsourced services group – which returned 50% this past year – was the single biggest driver of the fund’s outperformance of the industry index. An underweighting in the thrifts & mortgage finance segment and positioning in mortgage real estate investments trusts (REITs) also had a positive impact. Individual contributors included a non-index stake in payment processor PayPal Holdings (+79%), which benefited from recent turnaround efforts and a deal in November to sell its portfolio of consumer loans. An underweighting, on average, in Annaly Capital Management and our timely sale of Chimera Investment also contributed to the fund’s outperformance, as rising interest rates hindered the performance of mortgage REITs. By contrast, stock picks in the consumer finance group detracted from the fund’s relative result. In particular, the fund’s underexposure to auto lender Credit Acceptance proved costly, as strong loan-volume growth, better-than-anticipated earnings and share buybacks drove its 57% gain for the year. Elsewhere, an overweighting in mortgage REIT New Residential Investment also hurt.
The views expressed above reflect those of the portfolio manager(s) only through the end of the period as stated on the cover of this report and do not necessarily represent the views of Fidelity or any other person in the Fidelity organization. Any such views are subject to change at any time based upon market or other conditions and Fidelity disclaims any responsibility to update such views. These views may not be relied on as investment advice and, because investment decisions for a Fidelity fund are based on numerous factors, may not be relied on as an indication of trading intent on behalf of any Fidelity fund.
Note to shareholders: On December 8, 2017, shareholders approved proposals from the Board of Trustees to eliminate each sector/industry fund’s fundamental “invests primarily” policy and to modify the fundamental concentration policy for certain funds. The changes took effect on January 1, 2018, and do not impact how the funds are managed.
Consumer Finance Portfolio
Investment Summary (Unaudited)
Top Ten Stocks as of February 28, 2018
| | % of fund's net assets |
| Capital One Financial Corp. | 8.5 |
| Discover Financial Services | 8.0 |
| Synchrony Financial | 8.0 |
| Ally Financial, Inc. | 7.5 |
| MasterCard, Inc. Class A | 6.5 |
| Visa, Inc. Class A | 5.7 |
| JPMorgan Chase & Co. | 4.8 |
| MGIC Investment Corp. | 3.5 |
| SLM Corp. | 3.4 |
| AGNC Investment Corp. | 3.4 |
| | 59.3 |
Top Industries (% of fund's net assets)
| As of February 28, 2018 |
| | Consumer Finance | 47.3% |
| | IT Services | 16.8% |
| | Thrifts & Mortgage Finance | 14.6% |
| | Banks | 11.7% |
| | Mortgage Real Estate Investment Trusts | 9.3% |
| | All Others* | 0.3% |

* Includes short-term investments and net other assets (liabilities).
Consumer Finance Portfolio
Schedule of Investments February 28, 2018
Showing Percentage of Net Assets
| Common Stocks - 99.7% | | | |
| | | Shares | Value |
| Banks - 11.7% | | | |
| Diversified Banks - 9.0% | | | |
| Bank of America Corp. | | 69,700 | $2,237,370 |
| JPMorgan Chase & Co. | | 43,700 | 5,047,350 |
| Wells Fargo & Co. | | 35,100 | 2,050,191 |
| | | | 9,334,911 |
| Regional Banks - 2.7% | | | |
| Huntington Bancshares, Inc. | | 141,400 | 2,219,980 |
| SVB Financial Group (a) | | 2,600 | 647,348 |
| | | | 2,867,328 |
|
| TOTAL BANKS | | | 12,202,239 |
|
| Consumer Finance - 47.3% | | | |
| Consumer Finance - 47.3% | | | |
| Ally Financial, Inc. | | 278,100 | 7,758,990 |
| American Express Co. | | 400 | 39,004 |
| Capital One Financial Corp. | | 90,700 | 8,882,250 |
| Credit Acceptance Corp. (a)(b) | | 9,175 | 2,887,281 |
| Discover Financial Services | | 106,100 | 8,363,863 |
| First Cash Financial Services, Inc. | | 25,011 | 1,843,311 |
| LendingClub Corp. (a) | | 80,800 | 254,520 |
| Navient Corp. | | 104,600 | 1,355,616 |
| Nelnet, Inc. Class A | | 300 | 16,602 |
| OneMain Holdings, Inc. (a) | | 114,000 | 3,495,240 |
| Santander Consumer U.S.A. Holdings, Inc. | | 146,700 | 2,398,545 |
| SLM Corp. (a) | | 327,300 | 3,570,843 |
| Synchrony Financial | | 228,900 | 8,329,671 |
| | | | 49,195,736 |
| IT Services - 16.8% | | | |
| Data Processing & Outsourced Services - 16.8% | | | |
| Alliance Data Systems Corp. | | 2,200 | 530,112 |
| FleetCor Technologies, Inc. (a) | | 8,600 | 1,719,398 |
| MasterCard, Inc. Class A | | 38,600 | 6,784,336 |
| PayPal Holdings, Inc. (a) | | 14,400 | 1,143,504 |
| Total System Services, Inc. | | 7,400 | 650,830 |
| Visa, Inc. Class A | | 47,836 | 5,880,958 |
| Worldpay, Inc. (a) | | 9,500 | 772,160 |
| | | | 17,481,298 |
| Mortgage Real Estate Investment Trusts - 9.3% | | | |
| Mortgage REITs - 9.3% | | | |
| AGNC Investment Corp. | | 196,700 | 3,528,798 |
| Annaly Capital Management, Inc. | | 1,315 | 13,189 |
| Capstead Mortgage Corp. | | 100 | 835 |
| Invesco Mortgage Capital, Inc. | | 84,457 | 1,298,104 |
| MFA Financial, Inc. | | 237,700 | 1,692,424 |
| New Residential Investment Corp. | | 196,350 | 3,167,126 |
| | | | 9,700,476 |
| Thrifts & Mortgage Finance - 14.6% | | | |
| Thrifts & Mortgage Finance - 14.6% | | | |
| BofI Holding, Inc. (a)(b) | | 49,900 | 1,855,781 |
| Dime Community Bancshares, Inc. | | 23,400 | 421,200 |
| Flagstar Bancorp, Inc. (a) | | 100 | 3,526 |
| Meridian Bancorp, Inc. Maryland | | 63,200 | 1,267,160 |
| MGIC Investment Corp. (a) | | 266,728 | 3,678,179 |
| New York Community Bancorp, Inc. | | 191,500 | 2,608,230 |
| Northwest Bancshares, Inc. | | 30,700 | 503,787 |
| Oritani Financial Corp. | | 29,600 | 461,760 |
| Radian Group, Inc. | | 59,365 | 1,218,170 |
| TFS Financial Corp. | | 120,200 | 1,762,132 |
| Washington Federal, Inc. | | 42,400 | 1,471,280 |
| | | | 15,251,205 |
| TOTAL COMMON STOCKS | | | |
| (Cost $77,570,293) | | | 103,830,954 |
|
| Money Market Funds - 3.9% | | | |
| Fidelity Cash Central Fund, 1.41% (c) | | 424,133 | 424,218 |
| Fidelity Securities Lending Cash Central Fund 1.42% (c)(d) | | 3,622,348 | 3,622,711 |
| TOTAL MONEY MARKET FUNDS | | | |
| (Cost $4,047,018) | | | 4,046,929 |
| TOTAL INVESTMENT IN SECURITIES - 103.6% | | | |
| (Cost $81,617,311) | | | 107,877,883 |
| NET OTHER ASSETS (LIABILITIES) - (3.6)% | | | (3,772,662) |
| NET ASSETS - 100% | | | $104,105,221 |
Legend
(a) Non-income producing
(b) Security or a portion of the security is on loan at period end.
(c) Affiliated fund that is generally available only to investment companies and other accounts managed by Fidelity Investments. The rate quoted is the annualized seven-day yield of the fund at period end. A complete unaudited listing of the fund's holdings as of its most recent quarter end is available upon request. In addition, each Fidelity Central Fund's financial statements, which are not covered by the Fund's Report of Independent Registered Public Accounting Firm, are available on the SEC's website or upon request.
(d) Includes investment made with cash collateral received from securities on loan.
Affiliated Central Funds
Information regarding fiscal year to date income earned by the Fund from investments in Fidelity Central Funds is as follows:
| Fund | Income earned |
| Fidelity Cash Central Fund | $10,664 |
| Fidelity Securities Lending Cash Central Fund | 47,129 |
| Total | $57,793 |
Amounts in the income column in the above table include any capital gain distributions from underlying funds, which are presented in the corresponding line-item in the Statement of Operations if applicable.
Investment Valuation
All investments are categorized as Level 1 under the Fair Value Hierarchy. The inputs or methodology used for valuing securities may not be an indication of the risk associated with investing in those securities. For more information on valuation inputs please refer to the Investment Valuation section in the accompanying Notes to Financial Statements.
See accompanying notes which are an integral part of the financial statements.
Consumer Finance Portfolio
Financial Statements
Statement of Assets and Liabilities
| | | February 28, 2018 |
| Assets | | |
Investment in securities, at value (including securities loaned of $3,530,798) — See accompanying schedule:
Unaffiliated issuers (cost $77,570,293) | $103,830,954 | |
| Fidelity Central Funds (cost $4,047,018) | 4,046,929 | |
| Total Investment in Securities (cost $81,617,311) | | $107,877,883 |
| Receivable for fund shares sold | | 38,673 |
| Dividends receivable | | 98,038 |
| Distributions receivable from Fidelity Central Funds | | 1,745 |
| Prepaid expenses | | 317 |
| Other receivables | | 3,037 |
| Total assets | | 108,019,693 |
| Liabilities | | |
| Payable for fund shares redeemed | $184,590 | |
| Accrued management fee | 47,362 | |
| Other affiliated payables | 22,837 | |
| Other payables and accrued expenses | 36,983 | |
| Collateral on securities loaned | 3,622,700 | |
| Total liabilities | | 3,914,472 |
| Net Assets | | $104,105,221 |
| Net Assets consist of: | | |
| Paid in capital | | $75,491,619 |
| Distributions in excess of net investment income | | (124,037) |
| Accumulated undistributed net realized gain (loss) on investments | | 2,477,067 |
| Net unrealized appreciation (depreciation) on investments | | 26,260,572 |
| Net Assets, for 6,389,824 shares outstanding | | $104,105,221 |
| Net Asset Value, offering price and redemption price per share ($104,105,221 ÷ 6,389,824 shares) | | $16.29 |
See accompanying notes which are an integral part of the financial statements.
Statement of Operations
| | | Year ended February 28, 2018 |
| Investment Income | | |
| Dividends | | $2,167,131 |
| Income from Fidelity Central Funds | | 57,793 |
| Total income | | 2,224,924 |
| Expenses | | |
| Management fee | $534,276 | |
| Transfer agent fees | 231,127 | |
| Accounting and security lending fees | 39,026 | |
| Custodian fees and expenses | 3,907 | |
| Independent trustees' fees and expenses | 2,141 | |
| Registration fees | 21,040 | |
| Audit | 42,504 | |
| Legal | 4,121 | |
| Miscellaneous | 2,132 | |
| Total expenses before reductions | 880,274 | |
| Expense reductions | (8,699) | 871,575 |
| Net investment income (loss) | | 1,353,349 |
| Realized and Unrealized Gain (Loss) | | |
| Net realized gain (loss) on: | | |
| Investment securities: | | |
| Unaffiliated issuers | 14,541,110 | |
| Fidelity Central Funds | (75) | |
| Total net realized gain (loss) | | 14,541,035 |
| Change in net unrealized appreciation (depreciation) on: | | |
| Investment securities: | | |
| Unaffiliated issuers | 117,043 | |
| Fidelity Central Funds | (618) | |
| Total change in net unrealized appreciation (depreciation) | | 116,425 |
| Net gain (loss) | | 14,657,460 |
| Net increase (decrease) in net assets resulting from operations | | $16,010,809 |
See accompanying notes which are an integral part of the financial statements.
Statement of Changes in Net Assets
| | Year ended February 28, 2018 | Year ended February 28, 2017 |
| Increase (Decrease) in Net Assets | | |
| Operations | | |
| Net investment income (loss) | $1,353,349 | $1,593,348 |
| Net realized gain (loss) | 14,541,035 | 376,285 |
| Change in net unrealized appreciation (depreciation) | 116,425 | 24,444,332 |
| Net increase (decrease) in net assets resulting from operations | 16,010,809 | 26,413,965 |
| Distributions to shareholders from net investment income | (1,603,897) | (1,693,811) |
| Distributions to shareholders from net realized gain | – | (2,140,248) |
| Total distributions | (1,603,897) | (3,834,059) |
| Share transactions | | |
| Proceeds from sales of shares | 22,638,327 | 24,529,703 |
| Reinvestment of distributions | 1,541,855 | 3,691,039 |
| Cost of shares redeemed | (36,306,154) | (35,623,808) |
| Net increase (decrease) in net assets resulting from share transactions | (12,125,972) | (7,403,066) |
| Redemption fees | 1,316 | 3,187 |
| Total increase (decrease) in net assets | 2,282,256 | 15,180,027 |
| Net Assets | | |
| Beginning of period | 101,822,965 | 86,642,938 |
| End of period | $104,105,221 | $101,822,965 |
| Other Information | | |
| Undistributed net investment income end of period | $– | $99,540 |
| Distributions in excess of net investment income end of period | $(124,037) | $– |
| Shares | | |
| Sold | 1,464,790 | 1,911,163 |
| Issued in reinvestment of distributions | 97,268 | 300,993 |
| Redeemed | (2,436,648) | (2,869,642) |
| Net increase (decrease) | (874,590) | (657,486) |
See accompanying notes which are an integral part of the financial statements.
Financial Highlights
Consumer Finance Portfolio
| | | | | | |
| Years ended February 28, | 2018 | 2017 | 2016 A | 2015 | 2014 |
| Selected Per–Share Data | | | | | |
| Net asset value, beginning of period | $14.02 | $10.94 | $14.01 | $16.16 | $15.37 |
| Income from Investment Operations | | | | | |
| Net investment income (loss)B | .20 | .21 | .20 | .22 | .34 |
| Net realized and unrealized gain (loss) | 2.33C | 3.38 | (1.99) | .95 | 3.18 |
| Total from investment operations | 2.53 | 3.59 | (1.79) | 1.17 | 3.52 |
| Distributions from net investment income | (.26) | (.23) | (.20) | (.30) | (.40) |
| Distributions from net realized gain | – | (.28) | (1.08) | (3.03) | (2.33) |
| Total distributions | (.26) | (.51) | (1.28) | (3.32)D | (2.73) |
| Redemption fees added to paid in capitalB,E | – | – | – | – | – |
| Net asset value, end of period | $16.29 | $14.02 | $10.94 | $14.01 | $16.16 |
| Total ReturnF | 18.07%C | 33.57% | (14.01)% | 7.69% | 24.31% |
| Ratios to Average Net AssetsG,H | | | | | |
| Expenses before reductions | .90% | .94% | .90% | .88% | .85% |
| Expenses net of fee waivers, if any | .89% | .94% | .89% | .88% | .85% |
| Expenses net of all reductions | .89% | .93% | .89% | .88% | .83% |
| Net investment income (loss) | 1.38% | 1.72% | 1.53% | 1.45% | 2.07% |
| Supplemental Data | | | | | |
| Net assets, end of period (000 omitted) | $104,105 | $101,823 | $86,643 | $134,569 | $250,222 |
| Portfolio turnover rateI | 81% | 44% | 48% | 71% | 89% |
A For the year ended February 29.
B Calculated based on average shares outstanding during the period.
C Net realized and unrealized gain (loss) per share reflects proceeds received from litigation which amounted to $.28 per share. Excluding these litigation proceeds, the total return would have been 16.18%
D Total distributions of $3.32 per share is comprised of distributions from net investment income of $.296 and distributions from net realized gain of $3.026 per share.
E Amount represents less than $.005 per share.
F Total returns would have been lower if certain expenses had not been reduced during the applicable periods shown.
G Fees and expenses of any underlying Fidelity Central Funds are not included in the Fund's expense ratio. The Fund indirectly bears its proportionate share of the expenses of any underlying Fidelity Central Funds.
H Expense ratios reflect operating expenses of the Fund. Expenses before reductions do not reflect amounts reimbursed by the investment adviser or reductions from brokerage service arrangements or reductions from other expense offset arrangements and do not represent the amount paid by the Fund during periods when reimbursements or reductions occur. Expenses net of fee waivers reflect expenses after reimbursement by the investment adviser but prior to reductions from brokerage service arrangements or other expense offset arrangements. Expenses net of all reductions represent the net expenses paid by the Fund.
I Amount does not include the portfolio activity of any underlying Fidelity Central Funds.
See accompanying notes which are an integral part of the financial statements.
Financial Services Portfolio
Performance: The Bottom Line
Average annual total return reflects the change in the value of an investment, assuming reinvestment of distributions from dividend income and capital gains (the profits earned upon the sale of securities that have grown in value, if any) and assuming a constant rate of performance each year. The hypothetical investment and the average annual total returns do not reflect the deduction of taxes that a shareholder would pay on fund distributions or the redemption of fund shares. During periods of reimbursement by Fidelity, a fund’s total return will be greater than it would be had the reimbursement not occurred. How a fund did yesterday is no guarantee of how it will do tomorrow.
Average Annual Total Returns
| For the periods ended February 28, 2018 | Past 1 year | Past 5 years | Past 10 years |
| Financial Services Portfolio | 18.33% | 14.45% | 4.93% |
$10,000 Over 10 Years
Let's say hypothetically that $10,000 was invested in Financial Services Portfolio on February 29, 2008.
The chart shows how the value of your investment would have changed, and also shows how the S&P 500® Index performed over the same period.
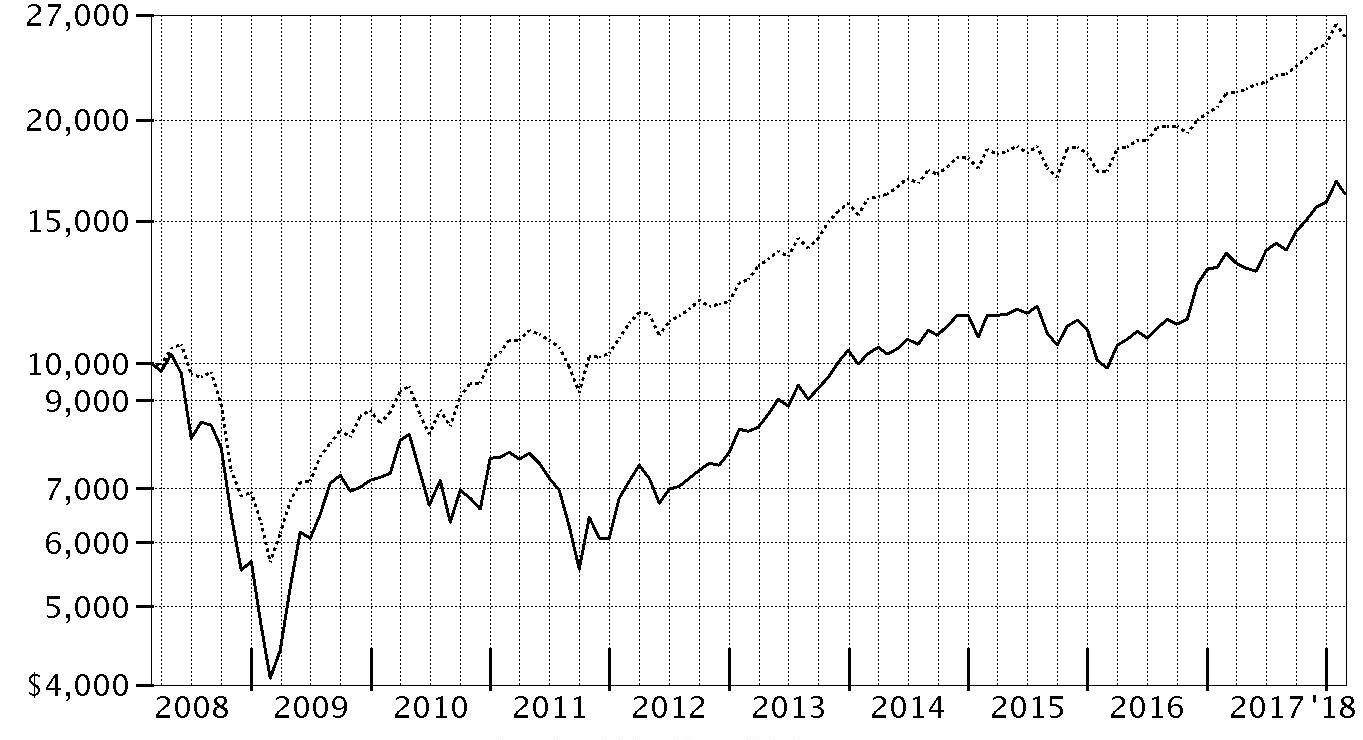
| Period Ending Values |
| $16,182 | Financial Services Portfolio |
| $25,307 | S&P 500® Index |
Financial Services Portfolio
Management's Discussion of Fund Performance
Market Recap: U.S. equities gained 17.10% for the 12 months ending February 28, 2018, as the S&P 500
® index moved steadily higher throughout 2017 and into 2018 until sharply reversing course in February. The drop was in stark contrast to the low volatility seen throughout 2017, along with consumer sentiment and other market indicators that stayed positive. Investors remained decidedly upbeat as the calendar turned, and the index rose 5.73% in January. February was a decidedly different story, though, as volatility spiked amid fear that rising inflation and the potential for the economy to overheat would prompt the U.S. Federal Reserve to pick up the pace of interest rate hikes. The index returned -3.69% for the month, its first negative result since October 2016. For the full 12 months, growth stocks handily topped value, while large-caps bested small-caps. By sector, information technology fared best by far, gaining 36% amid strong earnings growth from several major index constituents. Consumer discretionary (+22%) also stood out, driven by retailers. Financials added 20%, riding the uptick in bond yields. Materials and industrials rose about 16% each, boosted by higher demand, especially from China. Conversely, notable laggards included the defensive telecommunication services (-5%) and utilities (-2%) sectors, while rising rates held back real estate (-3%).
Comments from Portfolio Manager Christopher Lee: For the year, the fund returned 18.33%, topping both the 16.01% gain of the MSCI U.S. IMI Financials 5% Capped Linked Index and the S&P 500
® index. New tax legislation, improved economic growth, higher interest rates and expectations of less regulatory oversight aided the sector’s return. Stock picks, especially in the regional banks, property & casualty insurance and investment banking & brokerage segments, drove the fund ahead of the MSCI sector index. Top individual contributors included online brokers TD Ameritrade Holding (+49%) and E*TRADE Financial (+51%). Both stocks benefited from higher interest rates, a rising equity market and increased market volatility. By contrast, security selection in the consumer finance and asset management & custody banks groups detracted. Our biggest individual disappointment was Capital One Financial, a consumer finance firm specializing in credit cards and auto loans. The stock, which was one of our largest positions, returned 6%, held back by a fourth-quarter loss that was exacerbated by changes to the new U.S. tax law and concern about rising credit card loss rates.
The views expressed above reflect those of the portfolio manager(s) only through the end of the period as stated on the cover of this report and do not necessarily represent the views of Fidelity or any other person in the Fidelity organization. Any such views are subject to change at any time based upon market or other conditions and Fidelity disclaims any responsibility to update such views. These views may not be relied on as investment advice and, because investment decisions for a Fidelity fund are based on numerous factors, may not be relied on as an indication of trading intent on behalf of any Fidelity fund.
Note to shareholders: On December 8, 2017, shareholders agreed to proposals from the Board of Trustees to eliminate each sector/industry fund’s fundamental “invests primarily” policy and to modify the fundamental concentration policy for certain funds. Additionally, shareholders approved a proposal to reclassify Select Financial Services Portfolio as a non-diversified fund, which allows it to focus its investments more heavily in securities of fewer issuers. These changes took effect on January 1, 2018.
Financial Services Portfolio
Investment Summary (Unaudited)
Top Ten Stocks as of February 28, 2018
| | % of fund's net assets |
| Bank of America Corp. | 5.5 |
| Huntington Bancshares, Inc. | 5.2 |
| Capital One Financial Corp. | 5.0 |
| Citigroup, Inc. | 5.0 |
| Goldman Sachs Group, Inc. | 4.5 |
| Berkshire Hathaway, Inc. Class B | 4.4 |
| TD Ameritrade Holding Corp. | 4.4 |
| Wells Fargo & Co. | 4.2 |
| The Travelers Companies, Inc. | 3.8 |
| E*TRADE Financial Corp. | 3.7 |
| | 45.7 |
Top Industries (% of fund's net assets)
| As of February 28, 2018 |
| | Banks | 34.7% |
| | Capital Markets | 24.9% |
| | Insurance | 20.5% |
| | Consumer Finance | 10.7% |
| | Diversified Financial Services | 4.4% |
| | All Others* | 4.8% |
* Includes short-term investments and net other assets (liabilities).
Financial Services Portfolio
Schedule of Investments February 28, 2018
Showing Percentage of Net Assets
| Common Stocks - 98.8% | | | |
| | | Shares | Value |
| Banks - 34.7% | | | |
| Diversified Banks - 18.2% | | | |
| Bank of America Corp. | | 2,242,000 | $71,968,200 |
| Citigroup, Inc. | | 860,890 | 64,988,586 |
| HDFC Bank Ltd. sponsored ADR | | 25,000 | 2,429,500 |
| JPMorgan Chase & Co. | | 378,400 | 43,705,200 |
| Wells Fargo & Co. | | 950,000 | 55,489,500 |
| | | | 238,580,986 |
| Regional Banks - 16.5% | | | |
| Bank of the Ozarks, Inc. | | 300,000 | 14,967,000 |
| CoBiz, Inc. | | 425,000 | 8,058,000 |
| East West Bancorp, Inc. | | 200,000 | 13,110,000 |
| First Republic Bank | | 57,563 | 5,341,846 |
| Huntington Bancshares, Inc. | | 4,290,000 | 67,353,000 |
| PNC Financial Services Group, Inc. | | 300,000 | 47,298,000 |
| Popular, Inc. | | 200,000 | 8,402,000 |
| Preferred Bank, Los Angeles | | 50,000 | 3,116,500 |
| Signature Bank (a) | | 125,000 | 18,273,750 |
| SunTrust Banks, Inc. | | 423,200 | 29,556,288 |
| | | | 215,476,384 |
|
| TOTAL BANKS | | | 454,057,370 |
|
| Capital Markets - 24.9% | | | |
| Asset Management & Custody Banks - 7.0% | | | |
| Affiliated Managers Group, Inc. | | 95,000 | 17,989,200 |
| BlackRock, Inc. Class A | | 51,600 | 28,350,588 |
| Invesco Ltd. | | 390,300 | 12,700,362 |
| Northern Trust Corp. | | 303,800 | 32,163,306 |
| | | | 91,203,456 |
| Financial Exchanges & Data - 3.8% | | | |
| Cboe Global Markets, Inc. | | 215,000 | 24,082,150 |
| IntercontinentalExchange, Inc. | | 350,000 | 25,578,000 |
| | | | 49,660,150 |
| Investment Banking & Brokerage - 14.1% | | | |
| E*TRADE Financial Corp. (a) | | 925,000 | 48,312,750 |
| Goldman Sachs Group, Inc. | | 225,000 | 59,159,250 |
| Greenhill & Co., Inc. (b) | | 50,000 | 1,017,500 |
| Hamilton Lane, Inc. Class A | | 85,000 | 2,969,900 |
| Investment Technology Group, Inc. | | 350,000 | 6,937,000 |
| Lazard Ltd. Class A | | 110,000 | 5,936,700 |
| PJT Partners, Inc. | | 65,000 | 3,107,650 |
| TD Ameritrade Holding Corp. | | 1,000,000 | 57,500,000 |
| | | | 184,940,750 |
|
| TOTAL CAPITAL MARKETS | | | 325,804,356 |
|
| Consumer Finance - 10.7% | | | |
| Consumer Finance - 10.7% | | | |
| Capital One Financial Corp. | | 665,000 | 65,123,450 |
| Discover Financial Services | | 225,000 | 17,736,750 |
| OneMain Holdings, Inc. (a) | | 217,636 | 6,672,720 |
| SLM Corp. (a) | | 1,500,000 | 16,365,000 |
| Synchrony Financial | | 950,000 | 34,570,500 |
| | | | 140,468,420 |
| Diversified Financial Services - 4.4% | | | |
| Multi-Sector Holdings - 4.4% | | | |
| Berkshire Hathaway, Inc. Class B (a) | | 280,000 | 58,016,000 |
| Insurance - 20.5% | | | |
| Life & Health Insurance - 5.0% | | | |
| MetLife, Inc. | | 900,000 | 41,571,000 |
| Torchmark Corp. | | 287,100 | 24,509,727 |
| | | | 66,080,727 |
| Multi-Line Insurance - 5.2% | | | |
| American International Group, Inc. | | 471,500 | 27,035,810 |
| Hartford Financial Services Group, Inc. | | 775,000 | 40,958,750 |
| | | | 67,994,560 |
| Property & Casualty Insurance - 8.5% | | | |
| Allstate Corp. | | 25,000 | 2,306,500 |
| Aspen Insurance Holdings Ltd. | | 75,000 | 2,730,000 |
| Chubb Ltd. | | 279,400 | 39,652,448 |
| FNF Group | | 413,800 | 16,523,034 |
| The Travelers Companies, Inc. | | 361,000 | 50,179,000 |
| | | | 111,390,982 |
| Reinsurance - 1.8% | | | |
| Reinsurance Group of America, Inc. | | 150,000 | 23,068,500 |
|
| TOTAL INSURANCE | | | 268,534,769 |
|
| IT Services - 1.9% | | | |
| Data Processing & Outsourced Services - 1.9% | | | |
| Visa, Inc. Class A | | 107,100 | 13,166,874 |
| WEX, Inc. (a) | | 75,000 | 11,216,250 |
| | | | 24,383,124 |
| Mortgage Real Estate Investment Trusts - 0.4% | | | |
| Mortgage REITs - 0.4% | | | |
| AGNC Investment Corp. | | 250,000 | 4,485,000 |
| Software - 0.5% | | | |
| Application Software - 0.5% | | | |
| Black Knight, Inc. (a) | | 122,652 | 5,844,368 |
| Thrifts & Mortgage Finance - 0.8% | | | |
| Thrifts & Mortgage Finance - 0.8% | | | |
| MGIC Investment Corp. (a) | | 500,000 | 6,895,000 |
| Radian Group, Inc. | | 200,000 | 4,104,000 |
| | | | 10,999,000 |
| TOTAL COMMON STOCKS | | | |
| (Cost $973,575,047) | | | 1,292,592,407 |
|
| Money Market Funds - 1.2% | | | |
| Fidelity Cash Central Fund, 1.41% (c) | | 14,288,342 | 14,291,199 |
| Fidelity Securities Lending Cash Central Fund 1.42% (c)(d) | | 852,067 | 852,152 |
| TOTAL MONEY MARKET FUNDS | | | |
| (Cost $15,143,351) | | | 15,143,351 |
| TOTAL INVESTMENT IN SECURITIES - 100.0% | | | |
| (Cost $988,718,398) | | | 1,307,735,758 |
| NET OTHER ASSETS (LIABILITIES) - 0.0% | | | 518,540 |
| NET ASSETS - 100% | | | $1,308,254,298 |
Legend
(a) Non-income producing
(b) Security or a portion of the security is on loan at period end.
(c) Affiliated fund that is generally available only to investment companies and other accounts managed by Fidelity Investments. The rate quoted is the annualized seven-day yield of the fund at period end. A complete unaudited listing of the fund's holdings as of its most recent quarter end is available upon request. In addition, each Fidelity Central Fund's financial statements, which are not covered by the Fund's Report of Independent Registered Public Accounting Firm, are available on the SEC's website or upon request.
(d) Includes investment made with cash collateral received from securities on loan.
Affiliated Central Funds
Information regarding fiscal year to date income earned by the Fund from investments in Fidelity Central Funds is as follows:
| Fund | Income earned |
| Fidelity Cash Central Fund | $176,617 |
| Fidelity Securities Lending Cash Central Fund | 3,214 |
| Total | $179,831 |
Amounts in the income column in the above table include any capital gain distributions from underlying funds, which are presented in the corresponding line-item in the Statement of Operations if applicable.
Investment Valuation
All investments are categorized as Level 1 under the Fair Value Hierarchy. The inputs or methodology used for valuing securities may not be an indication of the risk associated with investing in those securities. For more information on valuation inputs please refer to the Investment Valuation section in the accompanying Notes to Financial Statements.
See accompanying notes which are an integral part of the financial statements.
Financial Services Portfolio
Financial Statements
Statement of Assets and Liabilities
| | | February 28, 2018 |
| Assets | | |
Investment in securities, at value (including securities loaned of $816,035) — See accompanying schedule:
Unaffiliated issuers (cost $973,575,047) | $1,292,592,407 | |
| Fidelity Central Funds (cost $15,143,351) | 15,143,351 | |
| Total Investment in Securities (cost $988,718,398) | | $1,307,735,758 |
| Receivable for investments sold | | 2,249,490 |
| Receivable for fund shares sold | | 1,965,653 |
| Dividends receivable | | 1,377,713 |
| Distributions receivable from Fidelity Central Funds | | 15,870 |
| Prepaid expenses | | 3,542 |
| Other receivables | | 16,870 |
| Total assets | | 1,313,364,896 |
| Liabilities | | |
| Payable for investments purchased | $1,841,021 | |
| Payable for fund shares redeemed | 1,568,688 | |
| Accrued management fee | 586,410 | |
| Other affiliated payables | 210,011 | |
| Other payables and accrued expenses | 52,343 | |
| Collateral on securities loaned | 852,125 | |
| Total liabilities | | 5,110,598 |
| Net Assets | | $1,308,254,298 |
| Net Assets consist of: | | |
| Paid in capital | | $962,064,367 |
| Undistributed net investment income | | 2,042,926 |
| Accumulated undistributed net realized gain (loss) on investments and foreign currency transactions | | 25,130,453 |
| Net unrealized appreciation (depreciation) on investments and assets and liabilities in foreign currencies | | 319,016,552 |
| Net Assets, for 11,214,539 shares outstanding | | $1,308,254,298 |
| Net Asset Value, offering price and redemption price per share ($1,308,254,298 ÷ 11,214,539 shares) | | $116.66 |
See accompanying notes which are an integral part of the financial statements.
Statement of Operations
| | | Year ended February 28, 2018 |
| Investment Income | | |
| Dividends | | $17,743,877 |
| Income from Fidelity Central Funds | | 179,831 |
| Total income | | 17,923,708 |
| Expenses | | |
| Management fee | $5,974,729 | |
| Transfer agent fees | 1,896,012 | |
| Accounting and security lending fees | 359,906 | |
| Custodian fees and expenses | 13,461 | |
| Independent trustees' fees and expenses | 23,094 | |
| Registration fees | 60,011 | |
| Audit | 46,074 | |
| Legal | 15,843 | |
| Miscellaneous | 32,190 | |
| Total expenses before reductions | 8,421,320 | |
| Expense reductions | (45,447) | 8,375,873 |
| Net investment income (loss) | | 9,547,835 |
| Realized and Unrealized Gain (Loss) | | |
| Net realized gain (loss) on: | | |
| Investment securities: | | |
| Unaffiliated issuers | 63,333,548 | |
| Fidelity Central Funds | (1,408) | |
| Foreign currency transactions | 7,661 | |
| Total net realized gain (loss) | | 63,339,801 |
| Change in net unrealized appreciation (depreciation) on: | | |
| Investment securities: | | |
| Unaffiliated issuers | 116,792,452 | |
| Assets and liabilities in foreign currencies | 40 | |
| Total change in net unrealized appreciation (depreciation) | | 116,792,492 |
| Net gain (loss) | | 180,132,293 |
| Net increase (decrease) in net assets resulting from operations | | $189,680,128 |
See accompanying notes which are an integral part of the financial statements.
Statement of Changes in Net Assets
| | Year ended February 28, 2018 | Year ended February 28, 2017 |
| Increase (Decrease) in Net Assets | | |
| Operations | | |
| Net investment income (loss) | $9,547,835 | $11,209,051 |
| Net realized gain (loss) | 63,339,801 | 79,390,901 |
| Change in net unrealized appreciation (depreciation) | 116,792,492 | 210,318,275 |
| Net increase (decrease) in net assets resulting from operations | 189,680,128 | 300,918,227 |
| Distributions to shareholders from net investment income | (7,413,422) | (9,666,149) |
| Distributions to shareholders from net realized gain | (42,209,545) | – |
| Total distributions | (49,622,967) | (9,666,149) |
| Share transactions | | |
| Proceeds from sales of shares | 503,440,101 | 369,367,686 |
| Reinvestment of distributions | 48,197,971 | 9,404,400 |
| Cost of shares redeemed | (403,096,639) | (693,953,459) |
| Net increase (decrease) in net assets resulting from share transactions | 148,541,433 | (315,181,373) |
| Redemption fees | – | 11,423 |
| Total increase (decrease) in net assets | 288,598,594 | (23,917,872) |
| Net Assets | | |
| Beginning of period | 1,019,655,704 | 1,043,573,576 |
| End of period | $1,308,254,298 | $1,019,655,704 |
| Other Information | | |
| Undistributed net investment income end of period | $2,042,926 | $425,415 |
| Shares | | |
| Sold | 4,684,352 | 3,895,979 |
| Issued in reinvestment of distributions | 443,496 | 95,090 |
| Redeemed | (3,807,711) | (8,010,907) |
| Net increase (decrease) | 1,320,137 | (4,019,838) |
See accompanying notes which are an integral part of the financial statements.
Financial Highlights
Financial Services Portfolio
| | | | | | |
| Years ended February 28, | 2018 | 2017 | 2016 A | 2015 | 2014 |
| Selected Per–Share Data | | | | | |
| Net asset value, beginning of period | $103.05 | $75.00 | $88.84 | $80.90 | $65.56 |
| Income from Investment Operations | | | | | |
| Net investment income (loss)B | .93 | .95 | .87 | .84 | 1.06 |
| Net realized and unrealized gain (loss) | 17.54 | 28.09 | (13.34) | 8.75 | 15.03 |
| Total from investment operations | 18.47 | 29.04 | (12.47) | 9.59 | 16.09 |
| Distributions from net investment income | (.71) | (.99) | (.78) | (.89) | (.75) |
| Distributions from net realized gain | (4.15) | – | (.59) | (.76) | – |
| Total distributions | (4.86) | (.99) | (1.37) | (1.65) | (.75) |
| Redemption fees added to paid in capitalB | – | –C | –C | –C | –C |
| Net asset value, end of period | $116.66 | $103.05 | $75.00 | $88.84 | $80.90 |
| Total ReturnD | 18.33% | 38.78% | (14.18)% | 11.87% | 24.56% |
| Ratios to Average Net AssetsE,F | | | | | |
| Expenses before reductions | .77% | .77% | .76% | .78% | .83% |
| Expenses net of fee waivers, if any | .77% | .77% | .76% | .78% | .83% |
| Expenses net of all reductions | .76% | .76% | .75% | .78% | .81% |
| Net investment income (loss) | .87% | 1.10% | 1.01% | .99% | 1.43% |
| Supplemental Data | | | | | |
| Net assets, end of period (000 omitted) | $1,308,254 | $1,019,656 | $1,043,574 | $1,385,490 | $779,524 |
| Portfolio turnover rateG | 54% | 84%H | 55% | 42%H | 197% |
A For the year ended February 29.
B Calculated based on average shares outstanding during the period.
C Amount represents less than $.005 per share.
D Total returns would have been lower if certain expenses had not been reduced during the applicable periods shown.
E Fees and expenses of any underlying Fidelity Central Funds are not included in the Fund's expense ratio. The Fund indirectly bears its proportionate share of the expenses of any underlying Fidelity Central Funds.
F Expense ratios reflect operating expenses of the Fund. Expenses before reductions do not reflect amounts reimbursed by the investment adviser or reductions from brokerage service arrangements or reductions from other expense offset arrangements and do not represent the amount paid by the Fund during periods when reimbursements or reductions occur. Expenses net of fee waivers reflect expenses after reimbursement by the investment adviser but prior to reductions from brokerage service arrangements or other expense offset arrangements. Expenses net of all reductions represent the net expenses paid by the Fund.
G Amount does not include the portfolio activity of any underlying Fidelity Central Funds.
H Portfolio turnover rate excludes securities received or delivered in-kind.
See accompanying notes which are an integral part of the financial statements.
Insurance Portfolio
Performance: The Bottom Line
Average annual total return reflects the change in the value of an investment, assuming reinvestment of distributions from dividend income and capital gains (the profits earned upon the sale of securities that have grown in value, if any) and assuming a constant rate of performance each year. The hypothetical investment and the average annual total returns do not reflect the deduction of taxes that a shareholder would pay on fund distributions or the redemption of fund shares. During periods of reimbursement by Fidelity, a fund’s total return will be greater than it would be had the reimbursement not occurred. How a fund did yesterday is no guarantee of how it will do tomorrow.
Average Annual Total Returns
| For the periods ended February 28, 2018 | Past 1 year | Past 5 years | Past 10 years |
| Insurance Portfolio | 9.62% | 14.86% | 8.49% |
$10,000 Over 10 Years
Let's say hypothetically that $10,000 was invested in Insurance Portfolio on February 29, 2008.
The chart shows how the value of your investment would have changed, and also shows how the S&P 500® Index performed over the same period.
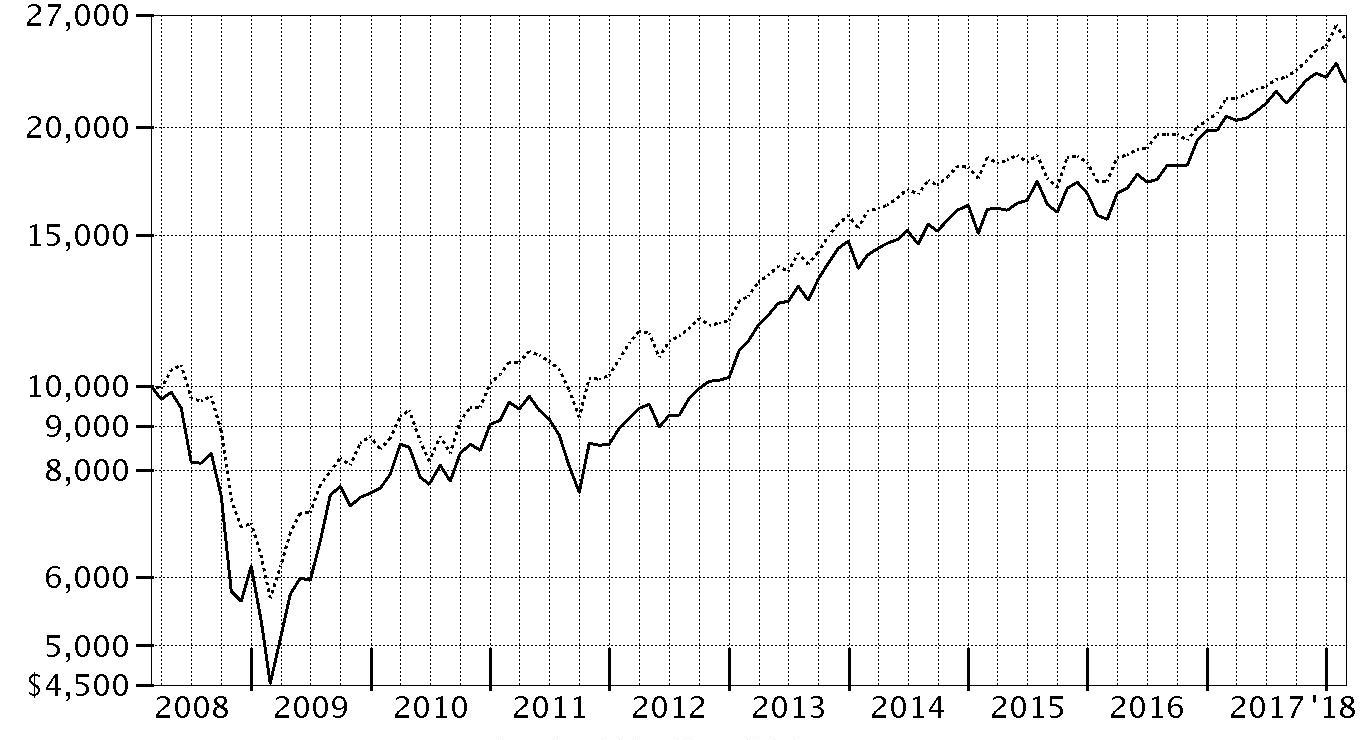
| Period Ending Values |
| $22,584 | Insurance Portfolio |
| $25,307 | S&P 500® Index |
Insurance Portfolio
Management's Discussion of Fund Performance
Market Recap: U.S. equities gained 17.10% for the 12 months ending February 28, 2018, as the S&P 500
® index moved steadily higher throughout 2017 and into 2018 until sharply reversing course in February. The drop was in stark contrast to the low volatility seen throughout 2017, along with consumer sentiment and other market indicators that stayed positive. Investors remained decidedly upbeat as the calendar turned, and the index rose 5.73% in January. February was a decidedly different story, though, as volatility spiked amid fear that rising inflation and the potential for the economy to overheat would prompt the U.S. Federal Reserve to pick up the pace of interest rate hikes. The index returned -3.69% for the month, its first negative result since October 2016. For the full 12 months, growth stocks handily topped value, while large-caps bested small-caps. By sector, information technology fared best by far, gaining 36% amid strong earnings growth from several major index constituents. Consumer discretionary (+22%) also stood out, driven by retailers. Financials added 20%, riding the uptick in bond yields. Materials and industrials rose about 16% each, boosted by higher demand, especially from China. Conversely, notable laggards included the defensive telecommunication services (-5%) and utilities (-2%) sectors, while rising rates held back real estate (-3%).
Comments from Portfolio Manager Peter Deutsch: For the year, fund gained 9.62%, outpacing the 8.38% advance of the MSCI U.S. IMI Insurance 25/50 Index, both of which lagged the broad-market S&P 500
® index. Pricing pressure and low interest rates continued to hinder return on capital (a measure of profitability) for many industry constituents. Favorable stock selection drove the fund's result versus the MSCI industry index, with picks in reinsurers delivering the biggest contribution, followed by choices in the non-benchmark multi-sector holdings and the asset management & custody banks segments. A sizable, out-of-index position in diversified firm Berkshire Hathaway (+21%) proved the top individual relative contributor by a notable margin. On the downside, selection among multi-line and property & casualty (P&C) insurers detracted. The fund's biggest relative detraction came from unfavorable timing and an underweighting, on average, in P&C firm Progressive, which returned 50% in the MSCI industry index the past 12 months. I sold our stake in June, unfortunately missing the stock’s follow-on run.
The views expressed above reflect those of the portfolio manager(s) only through the end of the period as stated on the cover of this report and do not necessarily represent the views of Fidelity or any other person in the Fidelity organization. Any such views are subject to change at any time based upon market or other conditions and Fidelity disclaims any responsibility to update such views. These views may not be relied on as investment advice and, because investment decisions for a Fidelity fund are based on numerous factors, may not be relied on as an indication of trading intent on behalf of any Fidelity fund.
Note to Shareholders: On December 8, 2017, shareholders approved proposals from the Board of Trustees to eliminate each sector/industry fund's fundamental “invests primarily” policy and to modify the fundamental concentration policy for certain funds. The changes took effect on January 1, 2018, and do not impact how the funds are managed.
Insurance Portfolio
Investment Summary (Unaudited)
Top Ten Stocks as of February 28, 2018
| | % of fund's net assets |
| Chubb Ltd. | 12.2 |
| American International Group, Inc. | 8.9 |
| The Travelers Companies, Inc. | 8.5 |
| MetLife, Inc. | 7.4 |
| Marsh & McLennan Companies, Inc. | 5.3 |
| Berkshire Hathaway, Inc. Class B | 4.6 |
| Prudential Financial, Inc. | 3.8 |
| Principal Financial Group, Inc. | 3.2 |
| AFLAC, Inc. | 3.0 |
| Allstate Corp. | 2.9 |
| | 59.8 |
Top Industries (% of fund's net assets)
| As of February 28, 2018 |
| | Insurance | 87.2% |
| | Diversified Financial Services | 5.8% |
| | Capital Markets | 3.3% |
| | Software | 0.3% |
| | Consumer Finance | 0.2% |
| | All Others* | 3.2% |

* Includes short-term investments and net other assets (liabilities).
Insurance Portfolio
Schedule of Investments February 28, 2018
Showing Percentage of Net Assets
| Common Stocks - 96.8% | | | |
| | | Shares | Value |
| Banks - 0.0% | | | |
| Regional Banks - 0.0% | | | |
| Hilltop Holdings, Inc. | | 500 | $12,155 |
| Capital Markets - 3.3% | | | |
| Asset Management & Custody Banks - 3.3% | | | |
| Apollo Global Management LLC Class A | | 96,444 | 3,163,363 |
| Ares Management LP | | 285,514 | 6,966,542 |
| Brighthouse Financial, Inc. | | 21,806 | 1,183,412 |
| | | | 11,313,317 |
| Consumer Finance - 0.2% | | | |
| Consumer Finance - 0.2% | | | |
| OneMain Holdings, Inc. (a) | | 21,900 | 671,454 |
| Diversified Financial Services - 5.8% | | | |
| Multi-Sector Holdings - 4.6% | | | |
| Berkshire Hathaway, Inc. Class B (a) | | 75,300 | 15,602,160 |
| Other Diversified Financial Services - 1.2% | | | |
| Cannae Holdings, Inc. (a) | | 16,099 | 295,900 |
| Voya Financial, Inc. | | 74,300 | 3,790,786 |
| | | | 4,086,686 |
|
| TOTAL DIVERSIFIED FINANCIAL SERVICES | | | 19,688,846 |
|
| Insurance - 87.2% | | | |
| Insurance Brokers - 14.4% | | | |
| Aon PLC | | 60,200 | 8,447,264 |
| Arthur J. Gallagher & Co. | | 134,900 | 9,322,939 |
| Brown & Brown, Inc. | | 146,300 | 7,701,232 |
| Marsh & McLennan Companies, Inc. | | 217,300 | 18,040,246 |
| Willis Group Holdings PLC | | 35,728 | 5,641,451 |
| | | | 49,153,132 |
| Life & Health Insurance - 25.4% | | | |
| AFLAC, Inc. | | 113,400 | 10,078,992 |
| CNO Financial Group, Inc. | | 158,700 | 3,577,098 |
| FBL Financial Group, Inc. Class A | | 300 | 19,470 |
| Genworth Financial, Inc. Class A (a) | | 335,600 | 912,832 |
| MetLife, Inc. | | 545,775 | 25,209,347 |
| Primerica, Inc. | | 37,200 | 3,627,000 |
| Principal Financial Group, Inc. | | 175,700 | 10,951,381 |
| Prudential Financial, Inc. | | 120,589 | 12,821,022 |
| Sony Financial Holdings, Inc. | | 413,800 | 7,628,161 |
| Torchmark Corp. | | 69,900 | 5,967,363 |
| Unum Group | | 113,361 | 5,776,877 |
| | | | 86,569,543 |
| Multi-Line Insurance - 12.7% | | | |
| American International Group, Inc. | | 532,800 | 30,550,752 |
| Hartford Financial Services Group, Inc. | | 156,700 | 8,281,595 |
| Loews Corp. | | 75,400 | 3,719,482 |
| Zurich Insurance Group AG | | 2,732 | 898,269 |
| | | | 43,450,098 |
| Property & Casualty Insurance - 31.7% | | | |
| Allstate Corp. | | 108,800 | 10,037,888 |
| AmTrust Financial Services, Inc. (b) | | 66,400 | 794,808 |
| Arch Capital Group Ltd. (a) | | 49,200 | 4,341,408 |
| Argo Group International Holdings, Ltd. | | 12,581 | 732,843 |
| Aspen Insurance Holdings Ltd. | | 78,100 | 2,842,840 |
| Assured Guaranty Ltd. | | 81,000 | 2,800,980 |
| Axis Capital Holdings Ltd. | | 11,100 | 547,674 |
| Chubb Ltd. | | 294,705 | 41,824,533 |
| First American Financial Corp. | | 69,300 | 4,021,479 |
| FNF Group | | 79,500 | 3,174,435 |
| Hanover Insurance Group, Inc. | | 33,200 | 3,582,612 |
| Markel Corp. (a) | | 3,600 | 4,003,200 |
| MBIA, Inc. (a)(b) | | 70,200 | 560,898 |
| Mercury General Corp. | | 200 | 9,128 |
| The Travelers Companies, Inc. | | 208,900 | 29,037,100 |
| | | | 108,311,826 |
| Reinsurance - 3.0% | | | |
| Everest Re Group Ltd. | | 4,100 | 984,984 |
| Maiden Holdings Ltd. | | 700 | 4,200 |
| Muenchener Rueckversicherungs AG | | 11,300 | 2,526,794 |
| Reinsurance Group of America, Inc. | | 41,233 | 6,341,223 |
| Third Point Reinsurance Ltd. (a) | | 35,000 | 486,500 |
| | | | 10,343,701 |
|
| TOTAL INSURANCE | | | 297,828,300 |
|
| Software - 0.3% | | | |
| Application Software - 0.3% | | | |
| Black Knight, Inc. (a) | | 24,357 | 1,160,611 |
| TOTAL COMMON STOCKS | | | |
| (Cost $190,319,787) | | | 330,674,683 |
|
| Nonconvertible Preferred Stocks - 0.0% | | | |
| Insurance - 0.0% | | | |
| Life & Health Insurance - 0.0% | | | |
| Torchmark Corp. 6.125% | | | |
| (Cost $76,079) | | 3,059 | 79,825 |
|
| Money Market Funds - 3.5% | | | |
| Fidelity Cash Central Fund, 1.41% (c) | | 11,339,745 | 11,342,012 |
| Fidelity Securities Lending Cash Central Fund 1.42% (c)(d) | | 789,327 | 789,406 |
| TOTAL MONEY MARKET FUNDS | | | |
| (Cost $12,130,739) | | | 12,131,418 |
| TOTAL INVESTMENT IN SECURITIES - 100.3% | | | |
| (Cost $202,526,605) | | | 342,885,926 |
| NET OTHER ASSETS (LIABILITIES) - (0.3)% | | | (1,143,402) |
| NET ASSETS - 100% | | | $341,742,524 |
Legend
(a) Non-income producing
(b) Security or a portion of the security is on loan at period end.
(c) Affiliated fund that is generally available only to investment companies and other accounts managed by Fidelity Investments. The rate quoted is the annualized seven-day yield of the fund at period end. A complete unaudited listing of the fund's holdings as of its most recent quarter end is available upon request. In addition, each Fidelity Central Fund's financial statements, which are not covered by the Fund's Report of Independent Registered Public Accounting Firm, are available on the SEC's website or upon request.
(d) Includes investment made with cash collateral received from securities on loan.
Affiliated Central Funds
Information regarding fiscal year to date income earned by the Fund from investments in Fidelity Central Funds is as follows:
| Fund | Income earned |
| Fidelity Cash Central Fund | $148,124 |
| Fidelity Securities Lending Cash Central Fund | 23,054 |
| Total | $171,178 |
Amounts in the income column in the above table include any capital gain distributions from underlying funds, which are presented in the corresponding line-item in the Statement of Operations if applicable.
Investment Valuation
The following is a summary of the inputs used, as of February 28, 2018, involving the Fund's assets and liabilities carried at fair value. The inputs or methodology used for valuing securities may not be an indication of the risk associated with investing in those securities. For more information on valuation inputs, and their aggregation into the levels used below, please refer to the Investment Valuation section in the accompanying Notes to Financial Statements.
| | Valuation Inputs at Reporting Date: |
| Description | Total | Level 1 | Level 2 | Level 3 |
| Investments in Securities: | | | | |
| Common Stocks | $330,674,683 | $319,621,459 | $11,053,224 | $-- |
| Nonconvertible Preferred Stocks | 79,825 | 79,825 | -- | -- |
| Money Market Funds | 12,131,418 | 12,131,418 | -- | -- |
| Total Investments in Securities: | $342,885,926 | $331,832,702 | $11,053,224 | $-- |
The following is a summary of transfers between Level 1 and Level 2 for the period ended February 28, 2018. Transfers are assumed to have occurred at the beginning of the period, and are primarily attributable to the valuation techniques used for foreign equity securities, as discussed in the accompanying Notes to Financial Statements:
| Transfers | Total |
| Level 1 to Level 2 | $6,556,146 |
| Level 2 to Level 1 | $0 |
Other Information
Distribution of investments by country or territory of incorporation, as a percentage of Total Net Assets, is as follows (Unaudited):
| United States of America | 78.4% |
| Switzerland | 12.5% |
| Bermuda | 3.7% |
| United Kingdom | 2.5% |
| Japan | 2.2% |
| Others (Individually Less Than 1%) | 0.7% |
| | 100.0% |
See accompanying notes which are an integral part of the financial statements.
Insurance Portfolio
Financial Statements
Statement of Assets and Liabilities
| | | February 28, 2018 |
| Assets | | |
Investment in securities, at value (including securities loaned of $771,094) — See accompanying schedule:
Unaffiliated issuers (cost $190,395,866) | $330,754,508 | |
| Fidelity Central Funds (cost $12,130,739) | 12,131,418 | |
| Total Investment in Securities (cost $202,526,605) | | $342,885,926 |
| Cash | | 2,316 |
| Receivable for fund shares sold | | 198,784 |
| Dividends receivable | | 466,911 |
| Distributions receivable from Fidelity Central Funds | | 15,928 |
| Prepaid expenses | | 1,706 |
| Other receivables | | 3,452 |
| Total assets | | 343,575,023 |
| Liabilities | | |
| Payable for fund shares redeemed | $773,168 | |
| Accrued management fee | 156,747 | |
| Other affiliated payables | 68,490 | |
| Other payables and accrued expenses | 44,669 | |
| Collateral on securities loaned | 789,425 | |
| Total liabilities | | 1,832,499 |
| Net Assets | | $341,742,524 |
| Net Assets consist of: | | |
| Paid in capital | | $162,702,151 |
| Undistributed net investment income | | 1,375,797 |
| Accumulated undistributed net realized gain (loss) on investments and foreign currency transactions | | 37,303,748 |
| Net unrealized appreciation (depreciation) on investments and assets and liabilities in foreign currencies | | 140,360,828 |
| Net Assets, for 4,353,913 shares outstanding | | $341,742,524 |
| Net Asset Value, offering price and redemption price per share ($341,742,524 ÷ 4,353,913 shares) | | $78.49 |
See accompanying notes which are an integral part of the financial statements.
Statement of Operations
| | | Year ended February 28, 2018 |
| Investment Income | | |
| Dividends | | $10,072,625 |
| Income from Fidelity Central Funds | | 171,178 |
| Total income | | 10,243,803 |
| Expenses | | |
| Management fee | $2,652,553 | |
| Transfer agent fees | 912,973 | |
| Accounting and security lending fees | 186,223 | |
| Custodian fees and expenses | 8,576 | |
| Independent trustees' fees and expenses | 11,268 | |
| Registration fees | 35,173 | |
| Audit | 41,453 | |
| Legal | 8,433 | |
| Miscellaneous | 20,214 | |
| Total expenses before reductions | 3,876,866 | |
| Expense reductions | (13,769) | 3,863,097 |
| Net investment income (loss) | | 6,380,706 |
| Realized and Unrealized Gain (Loss) | | |
| Net realized gain (loss) on: | | |
| Investment securities: | | |
| Unaffiliated issuers | 104,202,691 | |
| Fidelity Central Funds | 992 | |
| Foreign currency transactions | (16,275) | |
| Total net realized gain (loss) | | 104,187,408 |
| Change in net unrealized appreciation (depreciation) on: | | |
| Investment securities: | | |
| Unaffiliated issuers | (62,970,857) | |
| Fidelity Central Funds | (1,013) | |
| Assets and liabilities in foreign currencies | 2,109 | |
| Total change in net unrealized appreciation (depreciation) | | (62,969,761) |
| Net gain (loss) | | 41,217,647 |
| Net increase (decrease) in net assets resulting from operations | | $47,598,353 |
See accompanying notes which are an integral part of the financial statements.
Statement of Changes in Net Assets
| | Year ended February 28, 2018 | Year ended February 28, 2017 |
| Increase (Decrease) in Net Assets | | |
| Operations | | |
| Net investment income (loss) | $6,380,706 | $7,889,074 |
| Net realized gain (loss) | 104,187,408 | 4,129,500 |
| Change in net unrealized appreciation (depreciation) | (62,969,761) | 143,124,773 |
| Net increase (decrease) in net assets resulting from operations | 47,598,353 | 155,143,347 |
| Distributions to shareholders from net investment income | (4,424,878) | (7,613,475) |
| Distributions to shareholders from net realized gain | (38,464,528) | (9,708,827) |
| Total distributions | (42,889,406) | (17,322,302) |
| Share transactions | | |
| Proceeds from sales of shares | 99,965,121 | 240,670,672 |
| Reinvestment of distributions | 40,826,311 | 16,799,725 |
| Cost of shares redeemed | (451,552,577) | (207,368,304) |
| Net increase (decrease) in net assets resulting from share transactions | (310,761,145) | 50,102,093 |
| Redemption fees | 7,580 | 9,719 |
| Total increase (decrease) in net assets | (306,044,618) | 187,932,857 |
| Net Assets | | |
| Beginning of period | 647,787,142 | 459,854,285 |
| End of period | $341,742,524 | $647,787,142 |
| Other Information | | |
| Undistributed net investment income end of period | $1,375,797 | $985,204 |
| Shares | | |
| Sold | 1,208,317 | 3,320,634 |
| Issued in reinvestment of distributions | 512,930 | 236,373 |
| Redeemed | (5,404,508) | (2,802,254) |
| Net increase (decrease) | (3,683,261) | 754,753 |
See accompanying notes which are an integral part of the financial statements.
Financial Highlights
Insurance Portfolio
| | | | | | |
| Years ended February 28, | 2018 | 2017 | 2016 A | 2015 | 2014 |
| Selected Per–Share Data | | | | | |
| Net asset value, beginning of period | $80.60 | $63.15 | $66.87 | $66.08 | $56.81 |
| Income from Investment Operations | | | | | |
| Net investment income (loss)B | 1.08 | .99 | .89 | .96 | .75 |
| Net realized and unrealized gain (loss) | 6.76 | 18.64 | (2.50) | 7.13 | 13.75 |
| Total from investment operations | 7.84 | 19.63 | (1.61) | 8.09 | 14.50 |
| Distributions from net investment income | (.96) | (.89) | (.74) | (.96) | (.61) |
| Distributions from net realized gain | (8.99) | (1.29) | (1.37) | (6.34) | (4.62) |
| Total distributions | (9.95) | (2.18) | (2.11) | (7.30) | (5.23) |
| Redemption fees added to paid in capitalB,C | – | – | – | – | – |
| Net asset value, end of period | $78.49 | $80.60 | $63.15 | $66.87 | $66.08 |
| Total ReturnD | 9.62% | 31.60% | (2.54)% | 13.01% | 25.82% |
| Ratios to Average Net AssetsE,F | | | | | |
| Expenses before reductions | .79% | .80% | .80% | .81% | .83% |
| Expenses net of fee waivers, if any | .79% | .79% | .80% | .81% | .83% |
| Expenses net of all reductions | .79% | .79% | .80% | .81% | .82% |
| Net investment income (loss) | 1.30% | 1.37% | 1.32% | 1.44% | 1.17% |
| Supplemental Data | | | | | |
| Net assets, end of period (000 omitted) | $341,743 | $647,787 | $459,854 | $401,818 | $430,482 |
| Portfolio turnover rateG | 21% | 16% | 25% | 26% | 126% |
A For the year ended February 29.
B Calculated based on average shares outstanding during the period.
C Amount represents less than $.005 per share.
D Total returns would have been lower if certain expenses had not been reduced during the applicable periods shown.
E Fees and expenses of any underlying Fidelity Central Funds are not included in the Fund's expense ratio. The Fund indirectly bears its proportionate share of the expenses of any underlying Fidelity Central Funds.
F Expense ratios reflect operating expenses of the Fund. Expenses before reductions do not reflect amounts reimbursed by the investment adviser or reductions from brokerage service arrangements or reductions from other expense offset arrangements and do not represent the amount paid by the Fund during periods when reimbursements or reductions occur. Expenses net of fee waivers reflect expenses after reimbursement by the investment adviser but prior to reductions from brokerage service arrangements or other expense offset arrangements. Expenses net of all reductions represent the net expenses paid by the Fund.
G Amount does not include the portfolio activity of any underlying Fidelity Central Funds.
See accompanying notes which are an integral part of the financial statements.
Notes to Financial Statements
For the period ended February 28, 2018
1. Organization.
Banking Portfolio, Brokerage and Investment Management Portfolio, Financial Services Portfolio, Consumer Finance Portfolio, and Insurance Portfolio (the Funds) are non-diversified funds of Fidelity Select Portfolios (the Trust). The Trust is registered under the Investment Company Act of 1940, as amended (the 1940 Act), as an open-end management investment company organized as a Massachusetts business trust. Effective January 1, 2018, the shareholders of the Banking Portfolio and Financial Services Portfolio approved to change the Funds from diversified to non-diversified. The Funds invest primarily in securities of companies whose principal business activities fall within specific industries. Each Fund is authorized to issue an unlimited number of shares. Share transactions on the Statement of Changes in Net Assets may contain exchanges between affiliated funds.
2. Investments in Fidelity Central Funds.
The Funds invest in Fidelity Central Funds, which are open-end investment companies generally available only to other investment companies and accounts managed by the investment adviser and its affiliates. The Funds' Schedules of Investments list each of the Fidelity Central Funds held as of period end, if any, as an investment of each Fund, but does not include the underlying holdings of each Fidelity Central Fund. As an Investing Fund, each Fund indirectly bears its proportionate share of the expenses of the underlying Fidelity Central Funds.
The Money Market Central Funds seek preservation of capital and current income and are managed by Fidelity Investments Money Management, Inc. (FIMM), an affiliate of the investment adviser. Annualized expenses of the Money Market Central Funds as of their most recent shareholder report date are less than .005%.
A complete unaudited list of holdings for each Fidelity Central Fund is available upon request or at the Securities and Exchange Commission (the SEC) website at www.sec.gov. In addition, the financial statements of the Fidelity Central Funds, which are not covered by the Funds' Report of Independent Registered Public Accounting Firm, are available on the SEC website or upon request.
3. Significant Accounting Policies.
Each Fund is an investment company and applies the accounting and reporting guidance of the Financial Accounting Standards Board (FASB) Accounting Standards Codification Topic 946 Financial Services – Investments Companies. The financial statements have been prepared in conformity with accounting principles generally accepted in the United States of America (GAAP), which require management to make certain estimates and assumptions at the date of the financial statements. Actual results could differ from those estimates. Subsequent events, if any, through the date that the financial statements were issued have been evaluated in the preparation of the financial statements. The following summarizes the significant accounting policies of the Funds:
Investment Valuation. Investments are valued as of 4:00 p.m. Eastern time on the last calendar day of the period. The Board of Trustees (the Board) has delegated the day to day responsibility for the valuation of each Fund's investments to the Fair Value Committee (the Committee) established by the Fund's investment adviser. In accordance with valuation policies and procedures approved by the Board, each Fund attempts to obtain prices from one or more third party pricing vendors or brokers to value its investments. When current market prices, quotations or currency exchange rates are not readily available or reliable, investments will be fair valued in good faith by the Committee, in accordance with procedures adopted by the Board. Factors used in determining fair value vary by investment type and may include market or investment specific events. The frequency with which these procedures are used cannot be predicted and they may be utilized to a significant extent. The Committee oversees each Fund's valuation policies and procedures and reports to the Board on the Committee's activities and fair value determinations. The Board monitors the appropriateness of the procedures used in valuing each Fund's investments and ratifies the fair value determinations of the Committee.
Each Fund categorizes the inputs to valuation techniques used to value its investments into a disclosure hierarchy consisting of three levels as shown below:
- Level 1 – quoted prices in active markets for identical investments
- Level 2 – other significant observable inputs (including quoted prices for similar investments, interest rates, prepayment speeds, etc.)
- Level 3 – unobservable inputs (including the Fund's own assumptions based on the best information available)
Valuation techniques used to value each Fund's investments by major category are as follows:
Equity securities, including restricted securities, for which market quotations are readily available, are valued at the last reported sale price or official closing price as reported by a third party pricing vendor on the primary market or exchange on which they are traded and are categorized as Level 1 in the hierarchy. In the event there were no sales during the day or closing prices are not available, securities are valued at the last quoted bid price or may be valued using the last available price and are generally categorized as Level 2 in the hierarchy. For foreign equity securities, when market or security specific events arise, comparisons to the valuation of American Depositary Receipts (ADRs), futures contracts, Exchange-Traded Funds (ETFs)and certain indexes as well as quoted prices for similar securities may be used and would be categorized as Level 2 in the hierarchy. Utilizing these techniques may result in transfers between Level 1 and Level 2. For equity securities, including restricted securities, where observable inputs are limited, assumptions about market activity and risk are used and these securities may be categorized as Level 3 in the hierarchy.
Investments in open-end mutual funds, including the Fidelity Central Funds, are valued at their closing net asset value (NAV) each business day and are categorized as Level 1 in the hierarchy.
Changes in valuation techniques may result in transfers in or out of an assigned level within the disclosure hierarchy. The aggregate value of investments by input level as of February 28, 2018, including information on transfers between Levels 1 and 2 is included at the end of each applicable Fund's Schedule of Investments.
Foreign Currency. The Funds may use foreign currency contracts to facilitate transactions in foreign-denominated securities. Gains and losses from these transactions may arise from changes in the value of the foreign currency or if the counterparties do not perform under the contracts' terms.
Foreign-denominated assets, including investment securities, and liabilities are translated into U.S. dollars at the exchange rates at period end. Purchases and sales of investment securities, income and dividends received and expenses denominated in foreign currencies are translated into U.S. dollars at the exchange rate in effect on the transaction date.
The effects of exchange rate fluctuations on investments are included with the net realized and unrealized gain (loss) on investment securities. Other foreign currency transactions resulting in realized and unrealized gain (loss) are disclosed separately.
Investment Transactions and Income. For financial reporting purposes, the Funds' investment holdings and NAV include trades executed through the end of the last business day of the period. The NAV per share for processing shareholder transactions is calculated as of the close of business of the New York Stock Exchange (NYSE), normally 4:00 p.m. Eastern time and includes trades executed through the end of the prior business day. Gains and losses on securities sold are determined on the basis of identified cost and includes proceeds received from litigation. Dividend income is recorded on the ex-dividend date, except for certain dividends from foreign securities where the ex-dividend date may have passed, which are recorded as soon as the Funds are informed of the ex-dividend date. Non-cash dividends included in dividend income, if any, are recorded at the fair market value of the securities received. Income and capital gain distributions from Fidelity Central Funds, if any, are recorded on the ex-dividend date. Certain distributions received by the Funds represent a return of capital or capital gain. The Funds determine the components of these distributions subsequent to the ex-dividend date, based upon receipt of tax filings or other correspondence relating to the underlying investment. These distributions are recorded as a reduction of cost of investments and/or as a realized gain. Investment income is recorded net of foreign taxes withheld where recovery of such taxes is uncertain.
Expenses. Expenses directly attributable to a fund are charged to that fund. Expenses attributable to more than one fund are allocated among the respective funds on the basis of relative net assets or other appropriate methods. Expense estimates are accrued in the period to which they relate and adjustments are made when actual amounts are known.
Deferred Trustee Compensation. Under a Deferred Compensation Plan (the Plan) for Brokerage and Investment Management Portfolio, independent Trustees may elect to defer receipt of a portion of their annual compensation. Deferred amounts are invested in a cross-section of Fidelity funds, are marked-to-market and remain in the Fund until distributed in accordance with the Plan. The investment of deferred amounts and the offsetting payable to the Trustees are included in the accompanying Statement of Assets and Liabilities.
Income Tax Information and Distributions to Shareholders. Each year, each Fund intends to qualify as a regulated investment company under Subchapter M of the Internal Revenue Code, including distributing substantially all of its taxable income and realized gains. As a result, no provision for U.S. Federal income taxes is required. As of February 28, 2018, each Fund did not have any unrecognized tax benefits in the financial statements; nor is each Fund aware of any tax positions for which it is reasonably possible that the total amounts of unrecognized tax benefits will significantly change in the next twelve months. Each Fund files a U.S. federal tax return, in addition to state and local tax returns as required. Each Fund's federal income tax returns are subject to examination by the Internal Revenue Service (IRS) for a period of three fiscal years after they are filed. State and local tax returns may be subject to examination for an additional fiscal year depending on the jurisdiction. Foreign taxes are provided for based on each Fund's understanding of the tax rules and rates that exist in the foreign markets in which it invests.
Distributions are declared and recorded on the ex-dividend date. Income and capital gain distributions are determined in accordance with income tax regulations, which may differ from GAAP. In addition, certain Funds claimed a portion of the payment made to redeeming shareholders as a distribution for income tax purposes.
Capital accounts within the financial statements are adjusted for permanent book-tax differences. These adjustments have no impact on net assets or the results of operations. Capital accounts are not adjusted for temporary book-tax differences which will reverse in a subsequent period.
Book-tax differences are primarily due to foreign currency transactions, equity-debt classifications, certain deemed dividends, partnerships, deferred trustees' compensation, capital loss carryforwards, expiring capital loss carryforwards, and losses deferred due to wash sales and excise tax regulations.
As of period end, the cost and unrealized appreciation (depreciation) in securities, and derivatives if applicable, for federal income tax purposes were as follows for each Fund:
| | Tax cost | Gross unrealized appreciation | Gross unrealized depreciation | Net unrealized appreciation (depreciation) |
| Banking Portfolio | $581,216,590 | $258,908,208 | $(7,250,177) | $251,658,031 |
| Brokerage and Investment Management Portfolio | 353,104,030 | 113,980,138 | (4,712,432) | 109,267,706 |
| Consumer Finance Portfolio | 82,388,179 | 27,538,822 | (2,049,118) | 25,489,704 |
| Financial Services Portfolio | 991,720,197 | 326,019,831 | (10,004,270) | 316,015,561 |
| Insurance Portfolio | 203,601,270 | 141,665,306 | (2,380,650) | 139,284,656 |
The tax-based components of distributable earnings as of period end were as follows for each Fund:
| | Undistributed ordinary income | Undistributed long-term capital gain | Net unrealized appreciation (depreciation) on securities and other investments |
| Banking Portfolio | $3,597,671 | $56,057,945 | $251,658,031 |
| Brokerage and Investment Management Portfolio | 3,945,209 | 17,462,990 | 109,270,028 |
| Consumer Finance Portfolio | – | 4,259,599 | 25,489,704 |
| Financial Services Portfolio | 6,905,151 | 23,270,026 | 316,014,753 |
| Insurance Portfolio | 1,375,795 | 38,378,413 | 139,286,165 |
Capital loss carryforwards are only available to offset future capital gains of the Funds to the extent provided by regulations and may be limited. Under the Regulated Investment Company Modernization Act of 2010 (the Act), the Funds are permitted to carry forward capital losses incurred in taxable years beginning after December 22, 2010 for an unlimited period and such capital losses are required to be used prior to any losses that expire. The capital loss carryforward information presented below, including any applicable limitation, is estimated as of fiscal period end and is subject to adjustment.
| | Fiscal year of expiration
2018 | Total with expiration |
| Consumer Finance Portfolio | $(1,011,664) | $(1,011,664) |
| | Short-term | Long-term | Total no expiration | Total capital loss carryforward |
| Consumer Finance Portfolio | $- | $- | $- | $( 1,011,664) |
The tax character of distributions paid was as follows:
| February 28, 2018 | | | |
| | Ordinary Income | Long-term Capital Gains | Total |
| Banking Portfolio | $7,600,446 | $13,137,423 | $20,737,869 |
| Brokerage and Investment Management Portfolio | 12,545,512 | 16,976,452 | 29,521,964 |
| Consumer Finance Portfolio | 1,603,897 | – | 1,603,897 |
| Financial Services Portfolio | 15,047,099 | 34,575,868 | 49,622,967 |
| Insurance Portfolio | 4,597,869 | 38,291,537 | 42,889,406 |
| February 28, 2017 | | | |
| | Ordinary Income | Long-term Capital Gains | Total |
| Banking Portfolio | $7,718,086 | $– | $7,718,086 |
| Brokerage and Investment Management Portfolio | 4,455,060 | – | 4,455,060 |
| Consumer Finance Portfolio | 1,693,811 | 2,140,248 | 3,834,059 |
| Financial Services Portfolio | 9,666,149 | – | 9,666,149 |
| Insurance Portfolio | 7,613,475 | 9,708,827 | 17,322,302 |
Trading (Redemption) Fees. Shares held by investors in the Funds less than 30 days may be subject to a redemption fee equal to .75% of the NAV of shares redeemed. All redemption fees, which reduce the proceeds of the shareholder redemption, are retained by the Funds and accounted for as an addition to paid in capital. In November 2017, the Board of Trustees approved the elimination of these redemption fees effective December 18, 2017.
4. Purchases and Sales of Investments.
Purchases and sales of securities, other than short-term securities, are noted in the table below.
| | Purchases ($) | Sales ($) |
| Banking Portfolio | 347,188,454 | 816,518,393 |
| Brokerage and Investment Management Portfolio | 326,774,769 | 358,014,935 |
| Consumer Finance Portfolio | 79,356,157 | 88,144,891 |
| Financial Services Portfolio | 706,355,233 | 590,655,955 |
| Insurance Portfolio | 97,831,117 | 429,347,419 |
5. Fees and Other Transactions with Affiliates.
Management Fee. Fidelity SelectCo, LLC (the investment adviser) and its affiliates provide the Funds with investment management related services for which the Funds pay a monthly management fee. The management fee is the sum of an individual fund fee rate and an annualized group fee rate. The individual fund fee rate is applied to each Fund's average net assets. The group fee rate is based upon the average net assets of all the mutual funds advised by Fidelity Management & Research Company (FMR) and the investment adviser. The group fee rate decreases as assets under management increase and increases as assets under management decrease. For the reporting period, each Fund's annual management fee rate expressed as a percentage of each Fund's average net assets was as follows:
| | Individual Rate | Group Rate | Total |
| Banking Portfolio | .30% | .24% | .54% |
| Brokerage and Investment Management Portfolio | .30% | .24% | .54% |
| Consumer Finance Portfolio | .30% | .24% | .54% |
| Financial Services Portfolio | .30% | .24% | .54% |
| Insurance Portfolio | .30% | .24% | .54% |
Transfer Agent Fees. Fidelity Investments Institutional Operations Company, Inc. (FIIOC), an affiliate of the investment adviser, is the Funds' transfer, dividend disbursing and shareholder servicing agent. FIIOC receives account fees and asset-based fees that vary according to account size and type of account. FIIOC pays for typesetting, printing and mailing of shareholder reports, except proxy statements. For the period, transfer agent fees were equivalent to the following annual rates expressed as a percentage of average net assets:
| Banking Portfolio | .18% |
| Brokerage and Investment Management Portfolio | .18% |
| Consumer Finance Portfolio | .24% |
| Financial Services Portfolio | .17% |
| Insurance Portfolio | .19% |
Accounting and Security Lending Fees. Fidelity Service Company, Inc. (FSC), an affiliate of the investment adviser, maintains each Fund's accounting records. The accounting fee is based on the level of average net assets for each month. Under a separate contract, FSC administers the security lending program. The security lending fee is based on the number and duration of lending transactions.
Brokerage Commissions. Certain Funds placed a portion of their portfolio transactions with brokerage firms which are affiliates of the investment adviser. Brokerage commissions are included in net realized gain (loss) and change in net unrealized appreciation (depreciation) in the Statement of Operations. The commissions paid to these affiliated firms were as follows:
| | Amount |
| Banking Portfolio | $12,781 |
| Brokerage and Investment Management Portfolio | 4,606 |
| Consumer Finance Portfolio | 3,046 |
| Financial Services Portfolio | 11,807 |
| Insurance Portfolio | 2,154 |
Interfund Lending Program. Pursuant to an Exemptive Order issued by the SEC, the Funds, along with other registered investment companies having management contracts with Fidelity Management & Research Company (FMR) or other affiliated entities of FMR, may participate in an interfund lending program. This program provides an alternative credit facility allowing the funds to borrow from, or lend money to, other participating affiliated funds. At period end, there were no interfund loans outstanding. Each applicable fund's activity in this program during the period for which loans were outstanding was as follows:
| | Borrower or Lender | Average Loan Balance | Weighted Average Interest Rate | Interest Expense |
| Banking Portfolio | Borrower | $6,186,846 | 1.31% | $2,928 |
| Brokerage and Investment Management Portfolio | Borrower | $12,988,750 | 1.34% | $1,937 |
Interfund Trades. The Funds may purchase from or sell securities to other Fidelity Funds under procedures adopted by the Board. The procedures have been designed to ensure these interfund trades are executed in accordance with Rule 17a-7 of the 1940 Act. Interfund trades are included within the respective purchases and sales amounts shown in the Purchases and Sales of Investments note.
Prior Fiscal Year Redemptions In-Kind. During the prior period, 3,248,246 shares of Financial Services Portfolio held by an affiliated entity were redeemed in-kind for investments and cash with a value of $276,003,424. The Fund had a net realized gain of $46,242,607 on investments delivered through in-kind redemptions. The amount of in-kind redemptions is included in share transactions in the accompanying Statement of Changes in Net Assets. Financial Services Portfolio recognized no gain or loss for federal income tax purposes.
Other. During the period, the investment adviser reimbursed Insurance Portfolio for certain losses in the amount of $9,697.
6. Committed Line of Credit.
Certain Funds participate with other funds managed by the investment adviser or an affiliate in a $4.25 billion credit facility (the "line of credit") to be utilized for temporary or emergency purposes to fund shareholder redemptions or for other short-term liquidity purposes. The participating funds have agreed to pay commitment fees on their pro-rata portion of the line of credit, which are reflected in Miscellaneous expenses on the Statement of Operations, and are as follows:
| Banking Portfolio | $3,250 |
| Brokerage and Investment Management Portfolio | 1,306 |
| Consumer Finance Portfolio | 300 |
| Financial Services Portfolio | 3,182 |
| Insurance Portfolio | 1,715 |
During the period, the Funds did not borrow on this line of credit.
7. Security Lending.
Certain Funds lend portfolio securities through a lending agent from time to time in order to earn additional income. On the settlement date of the loan, each applicable Fund receives collateral (in the form of U.S. Treasury obligations, letters of credit and/or cash) against the loaned securities and maintains collateral in an amount not less than 100% of the market value of the loaned securities during the period of the loan. The market value of the loaned securities is determined at the close of business of the Funds and any additional required collateral is delivered to the Funds on the next business day. The Funds or borrower may terminate the loan at any time, and if the borrower defaults on its obligation to return the securities loaned because of insolvency or other reasons, the Funds may apply collateral received from the borrower against the obligation. The Funds may experience delays and costs in recovering the securities loaned. Any cash collateral received is invested in the Fidelity Securities Lending Cash Central Fund. The value of loaned securities and cash collateral at period end are disclosed on each applicable Fund's Statement of Assets and Liabilities. Security lending income represents the income earned on investing cash collateral, less rebates paid to borrowers and any lending agent fees associated with the loan, plus any premium payments received for lending certain types of securities. Security lending income is presented on each applicable Fund's Statement of Operations as a component of income from Fidelity Central Funds. Security lending activity was as follows:
| | Total Security Lending Income |
| Banking Portfolio | $7,950 |
| Brokerage and Investment Management Portfolio | 44,170 |
| Consumer Finance Portfolio | 47,129 |
| Financial Services Portfolio | 3,214 |
| Insurance Portfolio | 23,054 |
8. Expense Reductions.
Commissions paid to certain brokers with whom the investment adviser, or its affiliates, places trades on behalf of Certain Funds include an amount in addition to trade execution, which may be rebated back to the Funds to offset certain expenses. In addition, through arrangements with each applicable Fund's custodian, credits realized as a result of certain uninvested cash balances were used to reduce each applicable Fund's expenses. All of the applicable expense reductions are noted in the table below.
| | Brokerage Service reduction | Custody expense reduction |
| Banking Portfolio | $41,472 | $– |
| Brokerage and Investment Management Portfolio | 30,472 | – |
| Consumer Finance Portfolio | 7,754 | – |
| Financial Services Portfolio | 35,083 | – |
| Insurance Portfolio | 8,344 | 365 |
In addition, during the period the investment adviser reimbursed and/or waived a portion of operating expenses as follows:
| | Amount |
| Banking Portfolio | $8,717 |
| Brokerage and Investment Management Portfolio | 3,799 |
| Consumer Finance Portfolio | 945 |
| Financial Services Portfolio | 10,364 |
| Insurance Portfolio | 5,060 |
9. Other.
The Funds' organizational documents provide former and current trustees and officers with a limited indemnification against liabilities arising in connection with the performance of their duties to the Funds. In the normal course of business, the Funds may also enter into contracts that provide general indemnifications. The Funds' maximum exposure under these arrangements is unknown as this would be dependent on future claims that may be made against the Funds. The risk of material loss from such claims is considered remote.
At the end of the period, the following mutual funds managed by the investment adviser or its affiliates were the owners of record of 10% or more of the total outstanding shares of the following Funds.
| | VIP FundsManager 50% Portfolio | VIP FundsManager 60% Portfolio |
| Financial Services Portfolio | 14% | 16% |
Mutual funds managed by the investment adviser or its affiliates, in aggregate, were the owners of record of more than 20% of the total outstanding shares of the following Funds.
| | % of shares held |
| Financial Services Portfolio | 39% |
Effective after the close of business on April 13, 2018, shares of Financial Services Portfolio held by the VIP FundsManager Portfolios were redeemed in-kind for investments. Financial Services Portfolio realized gain (loss) for book purposes, but did not recognize any gain or loss for federal income tax purposes. The VIP FundsManager Portfolios’ ownership in Financial Services Portfolio was reduced to 0%.
Report of Independent Registered Public Accounting Firm
To the Trustees of Fidelity Select Portfolio and the Shareholders of Banking Portfolio, Brokerage and Investment Management Portfolio, Consumer Finance Portfolio, Financial Services Portfolio and Insurance Portfolio:
Opinions on the Financial Statements
We have audited the accompanying statements of assets and liabilities, including the schedules of investments, of Banking Portfolio, Brokerage and Investment Management Portfolio, Consumer Finance Portfolio, Financial Services Portfolio and Insurance Portfolio (five of the funds constituting Fidelity Select Portfolios, hereafter collectively referred to as the "Funds") as of February 28, 2018, the related statements of operations for the year ended February 28, 2018 the statements of changes in net assets for each of the two years in the period ended February 28, 2018 including the related notes, and the financial highlights for each of the five years in the period ended February 28, 2018 (collectively referred to as the “financial statements”). In our opinion, the financial statements present fairly, in all material respects, the financial position of each of the Funds as of February 28, 2018, the results of each of their operations for the year then ended, the changes in each of their net assets for each of the two years in the period ended February 28, 2018 and each of the financial highlights for each of the five years in the period ended February 28, 2018 in conformity with accounting principles generally accepted in the United States of America.
Basis for Opinions
These financial statements are the responsibility of the Funds' management. Our responsibility is to express an opinion on the Funds' financial statements based on our audits. We are a public accounting firm registered with the Public Company Accounting Oversight Board (United States) (“PCAOB”) and are required to be independent with respect to the Fund in accordance with the U.S. federal securities laws and the applicable rules and regulations of the Securities and Exchange Commission and the PCAOB.
We conducted our audits of these financial statements in accordance with the standards of the PCAOB. Those standards require that we plan and perform the audits to obtain reasonable assurance about whether the financial statements are free of material misstatement, whether due to error or fraud.
Our audits included performing procedures to assess the risks of material misstatement of the financial statements, whether due to error or fraud, and performing procedures that respond to those risks. Such procedures included examining, on a test basis, evidence regarding the amounts and disclosures in the financial statements. Our audits also included evaluating the accounting principles used and significant estimates made by management, as well as evaluating the overall presentation of the financial statements. Our procedures included confirmation of securities owned as of February 28, 2018 by correspondence with the custodian and broker; when replies were not received from brokers, we performed other auditing procedures. We believe that our audits provide a reasonable basis for our opinions.
PricewaterhouseCoopers LLP
Boston, Massachusetts
April 16, 2018
We have served as the auditor of one or more investment companies in the Fidelity group of funds since 1932.
Trustees and Officers
The Trustees, Members of the Advisory Board (if any), and officers of the trust and funds, as applicable, are listed below. The Board of Trustees governs each fund and is responsible for protecting the interests of shareholders. The Trustees are experienced executives who meet periodically throughout the year to oversee each fund's activities, review contractual arrangements with companies that provide services to each fund, oversee management of the risks associated with such activities and contractual arrangements, and review each fund's performance. Except for Michael E. Wiley, each of the Trustees oversees 281 funds. Mr. Wiley oversees 193 funds.
The Trustees hold office without limit in time except that (a) any Trustee may resign; (b) any Trustee may be removed by written instrument, signed by at least two-thirds of the number of Trustees prior to such removal; (c) any Trustee who requests to be retired or who has become incapacitated by illness or injury may be retired by written instrument signed by a majority of the other Trustees; and (d) any Trustee may be removed at any special meeting of shareholders by a two-thirds vote of the outstanding voting securities of the trust. Each Trustee who is not an interested person (as defined in the 1940 Act) of the trust and the funds is referred to herein as an Independent Trustee. Each Independent Trustee shall retire not later than the last day of the calendar year in which his or her 75th birthday occurs. The Independent Trustees may waive this mandatory retirement age policy with respect to individual Trustees. Officers and Advisory Board Members hold office without limit in time, except that any officer or Advisory Board Member may resign or may be removed by a vote of a majority of the Trustees at any regular meeting or any special meeting of the Trustees. Except as indicated, each individual has held the office shown or other offices in the same company for the past five years.
Each fund’s Statement of Additional Information (SAI) includes more information about the Trustees. To request a free copy, call Fidelity at 1-800-544-8544.
Experience, Skills, Attributes, and Qualifications of the Trustees. The Governance and Nominating Committee has adopted a statement of policy that describes the experience, qualifications, attributes, and skills that are necessary and desirable for potential Independent Trustee candidates (Statement of Policy). The Board believes that each Trustee satisfied at the time he or she was initially elected or appointed a Trustee, and continues to satisfy, the standards contemplated by the Statement of Policy. The Governance and Nominating Committee also engages professional search firms to help identify potential Independent Trustee candidates who have the experience, qualifications, attributes, and skills consistent with the Statement of Policy. From time to time, additional criteria based on the composition and skills of the current Independent Trustees, as well as experience or skills that may be appropriate in light of future changes to board composition, business conditions, and regulatory or other developments, have also been considered by the professional search firms and the Governance and Nominating Committee. In addition, the Board takes into account the Trustees' commitment and participation in Board and committee meetings, as well as their leadership of standing and ad hoc committees throughout their tenure.
In determining that a particular Trustee was and continues to be qualified to serve as a Trustee, the Board has considered a variety of criteria, none of which, in isolation, was controlling. The Board believes that, collectively, the Trustees have balanced and diverse experience, qualifications, attributes, and skills, which allow the Board to operate effectively in governing each fund and protecting the interests of shareholders. Information about the specific experience, skills, attributes, and qualifications of each Trustee, which in each case led to the Board's conclusion that the Trustee should serve (or continue to serve) as a trustee of the funds, is provided below.
Board Structure and Oversight Function. James C. Curvey is an interested person and currently serves as Chairman. The Trustees have determined that an interested Chairman is appropriate and benefits shareholders because an interested Chairman has a personal and professional stake in the quality and continuity of services provided to the funds. Independent Trustees exercise their informed business judgment to appoint an individual of their choosing to serve as Chairman, regardless of whether the Trustee happens to be independent or a member of management. The Independent Trustees have determined that they can act independently and effectively without having an Independent Trustee serve as Chairman and that a key structural component for assuring that they are in a position to do so is for the Independent Trustees to constitute a substantial majority for the Board. The Independent Trustees also regularly meet in executive session. Ned C. Lautenbach serves as Chairman of the Independent Trustees and as such (i) acts as a liaison between the Independent Trustees and management with respect to matters important to the Independent Trustees and (ii) with management prepares agendas for Board meetings.
Fidelity® funds are overseen by different Boards of Trustees. The funds' Board oversees Fidelity's high income and certain equity funds, and other Boards oversee Fidelity's investment-grade bond, money market, asset allocation, and other equity funds. The asset allocation funds may invest in Fidelity® funds overseen by the funds' Board. The use of separate Boards, each with its own committee structure, allows the Trustees of each group of Fidelity® funds to focus on the unique issues of the funds they oversee, including common research, investment, and operational issues. On occasion, the separate Boards establish joint committees to address issues of overlapping consequences for the Fidelity® funds overseen by each Board.
The Trustees operate using a system of committees to facilitate the timely and efficient consideration of all matters of importance to the Trustees, each fund, and fund shareholders and to facilitate compliance with legal and regulatory requirements and oversight of the funds' activities and associated risks. The Board, acting through its committees, has charged SelectCo and its affiliates with (i) identifying events or circumstances the occurrence of which could have demonstrably adverse effects on the funds' business and/or reputation; (ii) implementing processes and controls to lessen the possibility that such events or circumstances occur or to mitigate the effects of such events or circumstances if they do occur; and (iii) creating and maintaining a system designed to evaluate continuously business and market conditions in order to facilitate the identification and implementation processes described in (i) and (ii) above. Because the day-to-day operations and activities of the funds are carried out by or through SelectCo, its affiliates, and other service providers, the funds' exposure to risks is mitigated but not eliminated by the processes overseen by the Trustees. While each of the Board's committees has responsibility for overseeing different aspects of the funds' activities, oversight is exercised primarily through the Operations, Audit, and Compliance Committees. In addition, the Independent Trustees have worked with Fidelity to enhance the Board's oversight of investment and financial risks, legal and regulatory risks, technology risks, and operational risks, including the development of additional risk reporting to the Board. Appropriate personnel, including but not limited to the funds' Chief Compliance Officer (CCO), SelectCo's internal auditor, the independent accountants, the funds' Treasurer and portfolio management personnel, make periodic reports to the Board's committees, as appropriate, including an annual review of Fidelity's risk management program for the Fidelity® funds. The responsibilities of each standing committee, including their oversight responsibilities, are described further under "Standing Committees of the Trustees."
Interested Trustees*:
Correspondence intended for a Trustee who is an interested person may be sent to Fidelity Investments, 245 Summer Street, Boston, Massachusetts 02210.
Name, Year of Birth; Principal Occupations and Other Relevant Experience+
James C. Curvey (1935)
Year of Election or Appointment: 2018
Trustee
Chairman of the Board of Trustees
Mr. Curvey also serves as Trustee of other Fidelity® funds. Mr. Curvey is a Director of Fidelity Research & Analysis Co. (investment adviser firm, 2009-present), and Vice Chairman (2007-present) and Director of FMR LLC (diversified financial services company). In addition, Mr. Curvey serves as an Overseer for the Boston Symphony Orchestra and a member of the board of Artis-Naples, Naples, Florida, and as a Trustee for Brewster Academy, Wolfeboro, New Hampshire. Previously, Mr. Curvey served as a Director of Fidelity Investments Money Management, Inc. (investment adviser firm, 2009-2014) and a Director of FMR and FMR Co., Inc. (investment adviser firms, 2007-2014).
Charles S. Morrison (1960)
Year of Election or Appointment: 2018
Trustee
Mr. Morrison also serves as Trustee of other funds. He serves as President of Fidelity SelectCo, LLC (investment adviser firm, 2017-present) and Fidelity Management & Research Company (FMR) (investment adviser firm, 2016-present), a Director of Fidelity Investments Money Management, Inc. (FIMM) (investment adviser firm, 2014-present), Director of Fidelity SelectCo, LLC (investment adviser firm, 2014-present), President, Asset Management (2014-present), and is an employee of Fidelity Investments. Previously, Mr. Morrison served as Vice President of Fidelity's Fixed Income and Asset Allocation Funds (2012-2014), President, Fixed Income (2011-2014), Vice President of Fidelity's Money Market Funds (2005-2009), President, Money Market Group Leader of FMR (investment adviser firm, 2009), and Senior Vice President, Money Market Group of FMR (2004-2009). Mr. Morrison also served as Vice President of Fidelity's Bond Funds (2002-2005), certain Balanced Funds (2002-2005), and certain Asset Allocation Funds (2002-2007), and as Senior Vice President (2002-2005) of Fidelity's Bond Division.
* Determined to be an "Interested Trustee" by virtue of, among other things, his or her affiliation with the trust or various entities under common control with SelectCo.
+ The information includes the Trustee's principal occupation during the last five years and other information relating to the experience, attributes, and skills relevant to the Trustee's qualifications to serve as a Trustee, which led to the conclusion that the Trustee should serve as a Trustee for each fund.
Independent Trustees:
Correspondence intended for an Independent Trustee may be sent to Fidelity Investments, P.O. Box 55235, Boston, Massachusetts 02205-5235.
Name, Year of Birth; Principal Occupations and Other Relevant Experience+
Dennis J. Dirks (1948)
Year of Election or Appointment: 2018
Trustee
Mr. Dirks also serves as Trustee of other Fidelity® funds. Prior to his retirement in May 2003, Mr. Dirks was Chief Operating Officer and a member of the Board of The Depository Trust & Clearing Corporation (DTCC). He also served as President, Chief Operating Officer, and Board member of The Depository Trust Company (DTC) and President and Board member of the National Securities Clearing Corporation (NSCC). In addition, Mr. Dirks served as Chief Executive Officer and Board member of the Government Securities Clearing Corporation, Chief Executive Officer and Board member of the Mortgage-Backed Securities Clearing Corporation, as a Trustee and a member of the Finance Committee of Manhattan College (2005-2008), as a Trustee and a member of the Finance Committee of AHRC of Nassau County (2006-2008), as a member of the Independent Directors Council (IDC) Governing Council (2010-2015), and as a member of the Board of Directors for The Brookville Center for Children’s Services, Inc. (2009-2017). Mr. Dirks is a member of the Finance Committee (2016-present) and Board of Directors (2017-present) of the Asolo Repertory Theatre.
Donald F. Donahue (1950)
Year of Election or Appointment: 2018
Trustee
Mr. Donahue also serves as a Trustee of other Fidelity® funds. Mr. Donahue is President and Chief Executive Officer of Miranda Partners, LLC (risk consulting for the financial services industry, 2012-present). Previously, Mr. Donahue served as a Member of the Advisory Board of certain Fidelity® funds (2015-2018) and Chief Executive Officer (2006-2012), Chief Operating Officer (2003-2006), and Managing Director, Customer Marketing and Development (1999-2003) of The Depository Trust & Clearing Corporation (financial markets infrastructure). Mr. Donahue serves as a Member (2007-present) and Co-Chairman (2016-present) of the Board of Directors of United Way of New York, Member of the Board of Directors of NYC Leadership Academy (2012-present) and Member of the Board of Advisors of Ripple Labs, Inc. (financial services, 2015-present). He also served as Chairman (2010-2012) and Member of the Board of Directors (2012-2013) of Omgeo, LLC (financial services), Treasurer of United Way of New York (2012-2016), and Member of the Board of Directors of XBRL US (financial services non-profit, 2009-2012) and the International Securities Services Association (2009-2012).
Alan J. Lacy (1953)
Year of Election or Appointment: 2018
Trustee
Mr. Lacy also serves as Trustee of other Fidelity® funds. Mr. Lacy serves as a Director of Bristol-Myers Squibb Company (global pharmaceuticals, 2008-present). He is a Trustee of the California Chapter of The Nature Conservancy (2015-present) and a Director of the Center for Advanced Study in the Behavioral Sciences at Stanford University (2015-present). In addition, Mr. Lacy served as Senior Adviser (2007-2014) of Oak Hill Capital Partners, L.P. (private equity) and also served as Chief Executive Officer (2005) and Vice Chairman (2005-2006) of Sears Holdings Corporation (retail) and Chief Executive Officer and Chairman of the Board of Sears, Roebuck and Co. (retail, 2000-2005). Previously, Mr. Lacy served as Chairman (2014-2017) and a member (2010-2017) of the Board of Directors of Dave & Buster’s Entertainment, Inc. (restaurant and entertainment complexes), as Chairman (2008-2011) and a member (2006-2015) of the Board of Trustees of the National Parks Conservation Association, and as a member of the Board of Directors for The Hillman Companies, Inc. (hardware wholesalers, 2010-2014), Earth Fare, Inc. (retail grocery, 2010-2014), and The Western Union Company (global money transfer, 2006-2011).
Ned C. Lautenbach (1944)
Year of Election or Appointment: 2018
Trustee
Chairman of the Independent Trustees
Mr. Lautenbach also serves as Trustee of other Fidelity® funds. Mr. Lautenbach currently serves as Vice Chair of the Board of Governors, State University System of Florida (2013-present) and is a member of the Council on Foreign Relations (1994-present). He is also a member and has most recently served as Chairman of the Board of Directors of Artis-Naples (2012-present). Previously, Mr. Lautenbach served as a member and then Lead Director of the Board of Directors of Eaton Corporation (diversified industrial, 1997-2016). He was also a Partner and Advisory Partner at Clayton, Dubilier & Rice, LLC (private equity investment, 1998-2010), as well as a Director of Sony Corporation (2006-2007). In addition, Mr. Lautenbach also had a 30-year career with IBM (technology company) during which time he served as Senior Vice President and a member of the Corporate Executive Committee (1968-1998).
Joseph Mauriello (1944)
Year of Election or Appointment: 2018
Trustee
Mr. Mauriello also serves as Trustee of other Fidelity® funds. Prior to his retirement in January 2006, Mr. Mauriello served in numerous senior management positions including Deputy Chairman and Chief Operating Officer (2004-2005), and Vice Chairman of Financial Services (2002-2004) of KPMG LLP US (professional services, 1965-2005). Mr. Mauriello currently serves as a member of the Board of Directors of XL Group plc. (global insurance and re-insurance, 2006-present) and the Independent Directors Council (IDC) Governing Council (2015-present). Previously, Mr. Mauriello served as a Director of the Hamilton Funds of the Bank of New York (2006-2007) and of Arcadia Resources Inc. (health care services and products, 2007-2012).
Cornelia M. Small (1944)
Year of Election or Appointment: 2018
Trustee
Ms. Small also serves as Trustee of other Fidelity® funds. Ms. Small is a member of the Board of Directors (2009-present) and Chair of the Investment Committee (2010-present) of the Teagle Foundation. Ms. Small also serves on the Investment Committee of the Berkshire Taconic Community Foundation (2008-present). Previously, Ms. Small served as Chairperson (2002-2008) and a member of the Investment Committee and Chairperson (2008-2012) and a member of the Board of Trustees of Smith College. In addition, Ms. Small served as Chief Investment Officer, Director of Global Equity Investments, and a member of the Board of Directors of Scudder, Stevens & Clark and Scudder Kemper Investments.
Garnett A. Smith (1947)
Year of Election or Appointment: 2013
Trustee
Mr. Smith also serves as Trustee of other Fidelity® funds. Prior to Mr. Smith's retirement, he served as Chairman and Chief Executive Officer of Inbrand Corp. (manufacturer of personal absorbent products, 1990-1997). He also served as President (1986-1990) of Inbrand Corp. Prior to his employment with Inbrand Corp., he was employed by a retail fabric chain and North Carolina National Bank. In addition, Mr. Smith served as a Member of the Advisory Board of certain Fidelity® funds (2012-2013) and as a board member of the Jackson Hole Land Trust (2009-2012).
David M. Thomas (1949)
Year of Election or Appointment: 2018
Trustee
Mr. Thomas also serves as Trustee of other Fidelity® funds. Mr. Thomas serves as Non-Executive Chairman of the Board of Directors of Fortune Brands Home and Security (home and security products, 2011-present), as a member of the Board of Directors (2004-present) and Presiding Director (2013-present) of Interpublic Group of Companies, Inc. (marketing communication), and as a member of the Board of Trustees of the University of Florida (2013-present). Previously, Mr. Thomas served as Executive Chairman (2005-2006) and Chairman and Chief Executive Officer (2000-2005) of IMS Health, Inc. (pharmaceutical and healthcare information solutions), and a Director of Fortune Brands, Inc. (consumer products, 2000-2011).
Michael E. Wiley (1950)
Year of Election or Appointment: 2008
Trustee
Mr. Wiley also serves as Trustee or Member of the Advisory Board of other Fidelity® funds. Mr. Wiley serves as a Director of Andeavor Corporation (independent oil refiner and marketer, 2005-present), a Director of Andeavor Logistics LP (natural resources logistics, 2015-present), and a Director of Bill Barrett Corporation (exploration and production, 2005-present). In addition, Mr. Wiley also serves as a Director of Post Oak Bank (privately-held bank, 2004-present). Previously, Mr. Wiley served as a Trustee of other Fidelity® funds (2008-2013), as a Director of Asia Pacific Exploration Consolidated (international oil and gas exploration and production, 2008-2013), as a member of the Board of Trustees of the University of Tulsa (2000-2006; 2007-2010), as a Senior Energy Advisor of Katzenbach Partners, LLC (consulting, 2006-2007), as an Advisory Director of Riverstone Holdings (private investment), Chairman, President, and CEO of Baker Hughes, Inc. (oilfield services, 2000-2004), and as Director of Spinnaker Exploration Company (exploration and production, 2001-2005).
+ The information includes the Trustee's principal occupation during the last five years and other information relating to the experience, attributes, and skills relevant to the Trustee's qualifications to serve as a Trustee, which led to the conclusion that the Trustee should serve as a Trustee for each fund.
Advisory Board Members and Officers:
Correspondence intended for a Member of the Advisory Board (if any) may be sent to Fidelity Investments, P.O. Box 55235, Boston, Massachusetts 02205-5235. Correspondence intended for an officer or Peter S. Lynch may be sent to Fidelity Investments, 245 Summer Street, Boston, Massachusetts 02210. Officers appear below in alphabetical order.
Name, Year of Birth; Principal Occupation
Peter S. Lynch (1944)
Year of Election or Appointment: 2018
Member of the Advisory Board
Mr. Lynch also serves as Member of the Advisory Board of other Fidelity® funds. Mr. Lynch is Vice Chairman and a Director of FMR (investment adviser firm) and FMR Co., Inc. (investment adviser firm). In addition, Mr. Lynch serves as a Trustee of Boston College and as the Chairman of the Inner-City Scholarship Fund. Previously, Mr. Lynch served on the Special Olympics International Board of Directors (1997-2006).
William S. Stavropoulos (1939)
Year of Election or Appointment: 2018
Member of the Advisory Board
Mr. Stavropoulos also serves as Member of the Advisory Board of other Fidelity® funds. Mr. Stavropoulos serves as President and Founder of the Michigan Baseball Foundation, the Great Lakes Loons (2007-present). Mr. Stavropoulos is Chairman Emeritus of the Board of Directors of The Dow Chemical Company, where he previously served in numerous senior management positions, including President, CEO (1995-2000; 2002-2004), Chairman of the Executive Committee (2000-2006), and as a member of the Board of Directors (1990-2006). Currently, Mr. Stavropoulos is Chairman of the Board of Directors of Univar Inc. (global distributor of commodity and specialty chemicals), a Director of Teradata Corporation (data warehousing and technology solutions), and a member of the Advisory Board for Metalmark Capital LLC (private equity investment, 2005-present). Mr. Stavropoulos is an operating advisor to Clayton, Dubilier & Rice, LLC (private equity investment). In addition, Mr. Stavropoulos is a member of the University of Notre Dame Advisory Council for the College of Science, a Trustee of the Rollin L. Gerstacker Foundation, and a Director of Artis-Naples in Naples, Florida. Previously, Mr. Stavropoulos served as Trustee of certain Fidelity® funds (2001-2018) and as a Director of Chemical Financial Corporation (bank holding company, 1993-2012) and Tyco International, Ltd. (multinational manufacturing and services, 2007-2012).
Carol B. Tomé (1957)
Year of Election or Appointment: 2017
Member of the Advisory Board
Ms. Tomé also serves as Member of the Advisory Board of other Fidelity® funds. Ms. Tomé is Chief Financial Officer (2001-present) and Executive Vice President of Corporate Services (2007-present) of The Home Depot, Inc. (home improvement retailer) and a Director (2003-present) and Chair of the Audit Committee (2004-present) of United Parcel Service, Inc. (package delivery and supply chain management). Previously, Ms. Tomé served as Trustee of certain Fidelity® funds (2017), Senior Vice President of Finance and Accounting/Treasurer (2000-2007) and Vice President and Treasurer (1995-2000) of The Home Depot, Inc. and Chair of the Board (2010-2012), Vice Chair of the Board (2009 and 2013), and a Director (2008-2013) of the Federal Reserve Bank of Atlanta. Ms. Tomé is also a director or trustee of many community and professional organizations.
Elizabeth Paige Baumann (1968)
Year of Election or Appointment: 2017
Anti-Money Laundering (AML) Officer
Ms. Baumann also serves as AML Officer of other funds. She is Chief AML Officer (2012-present) and Senior Vice President (2014-present) of FMR LLC (diversified financial services company) and is an employee of Fidelity Investments. Previously, Ms. Baumann served as AML Officer of the funds (2012-2016), and Vice President (2007-2014) and Deputy Anti-Money Laundering Officer (2007-2012) of FMR LLC.
Marc R. Bryant (1966)
Year of Election or Appointment: 2013
Secretary and Chief Legal Officer (CLO)
Mr. Bryant also serves as Secretary and CLO of other funds. Mr. Bryant serves as CLO, Secretary, and Senior Vice President of Fidelity Management & Research Company (investment adviser firm, 2015-present) and FMR Co., Inc. (investment adviser firm, 2015-present); Secretary of Fidelity SelectCo, LLC (investment adviser firm, 2015-present) and Fidelity Investments Money Management, Inc. (investment adviser firm, 2015-present); and CLO of Fidelity Management & Research (Hong Kong) Limited and FMR Investment Management (UK) Limited (investment adviser firms, 2015-present) and Fidelity Management & Research (Japan) Limited (investment adviser firm, 2016-present). He is Senior Vice President and Deputy General Counsel of FMR LLC (diversified financial services company). Previously, Mr. Bryant served as Secretary and CLO of Fidelity Rutland Square Trust II (2010-2014) and Assistant Secretary of Fidelity's Fixed Income and Asset Allocation Funds (2013-2015). Prior to joining Fidelity Investments, Mr. Bryant served as a Senior Vice President and the Head of Global Retail Legal for AllianceBernstein L.P. (2006-2010), and as the General Counsel for ProFund Advisors LLC (2001-2006).
William C. Coffey (1969)
Year of Election or Appointment: 2009
Assistant Secretary
Mr. Coffey also serves as Assistant Secretary of other funds. He is Senior Vice President and Deputy General Counsel of FMR LLC (diversified financial services company, 2010-present), and is an employee of Fidelity Investments. Previously, Mr. Coffey served as Vice President and Associate General Counsel of FMR LLC (2005-2009).
Jonathan Davis (1968)
Year of Election or Appointment: 2010
Assistant Treasurer
Mr. Davis also serves as Assistant Treasurer of other funds. Mr. Davis serves as Assistant Treasurer of FMR Capital, Inc. (2017-present) and is an employee of Fidelity Investments. Previously, Mr. Davis served as Vice President and Associate General Counsel of FMR LLC (diversified financial services company, 2003-2010).
Adrien E. Deberghes (1967)
Year of Election or Appointment: 2018
Assistant Treasurer
Mr. Deberghes also serves as an officer of other funds. He serves as Assistant Treasurer of FMR Capital, Inc. (2017-present), Executive Vice President of Fidelity Investments Money Management, Inc. (FIMM) (investment adviser firm, 2016-present), and is an employee of Fidelity Investments (2008-present). Previously, Mr. Deberghes served as President and Treasurer of certain Fidelity® funds (2013-2018). Prior to joining Fidelity Investments, Mr. Deberghes was Senior Vice President of Mutual Fund Administration at State Street Corporation (2007-2008), Senior Director of Mutual Fund Administration at Investors Bank & Trust (2005-2007), and Director of Finance for Dunkin' Brands (2000-2005). Previously, Mr. Deberghes served in other fund officer roles.
Joseph DeSantis (1959)
Year of Election or Appointment: 2015
Vice President
Mr. DeSantis also serves as Vice President of other funds. Mr. DeSantis serves as a Director of Fidelity Management & Research (Japan) Limited (investment adviser firm, 2016-present), Chief Investment Officer, Equities (2010-present) and is an employee of Fidelity Investments.
Stephanie J. Dorsey (1969)
Year of Election or Appointment: 2010
Assistant Treasurer
Ms. Dorsey also serves as an officer of other funds. Ms. Dorsey serves as Assistant Treasurer of FMR Capital, Inc. (2017-present), is an employee of Fidelity Investments (2008-present), and has served in other fund officer roles. Prior to joining Fidelity Investments, Ms. Dorsey served as Treasurer (2004-2008) of the JPMorgan Mutual Funds and Vice President (2004-2008) of JPMorgan Chase Bank.
Howard J. Galligan III (1966)
Year of Election or Appointment: 2014
Chief Financial Officer
Mr. Galligan also serves as Chief Financial Officer of other funds. Mr. Galligan serves as President of Fidelity Pricing and Cash Management Services (FPCMS) (2014-present) and as a Director of Strategic Advisers LLC (investment adviser firm, 2008-present). Previously, Mr. Galligan served as Chief Administrative Officer of Asset Management (2011-2014) and Chief Operating Officer and Senior Vice President of Investment Support for Strategic Advisers, Inc. (2003-2011).
Brian B. Hogan (1964)
Year of Election or Appointment: 2009
Vice President
Mr. Hogan also serves as Trustee or Vice President of other funds. Mr. Hogan serves as Head of Fidelity Investments’ Investment Solutions and Innovation organization (2018-present), and as a Director of FMR Investment Management (UK) Limited (investment adviser firm, 2015-present) and Fidelity SelectCo, LLC (investment adviser firm, 2014-present). Previously, Mr. Hogan served as Trustee of certain Fidelity® funds (2014-2018), President of the Equity Division of FMR (investment adviser firm, 2009-2018), Senior Vice President, Equity Research of FMR (2006-2009), and as a portfolio manager. Mr. Brian B. Hogan is not related to Mr. Colm A. Hogan.
Colm A. Hogan (1973)
Year of Election or Appointment: 2018
Deputy Treasurer
Mr. Hogan also serves as an officer of other funds. Mr. Hogan serves as Assistant Treasurer of FMR Capital, Inc. (2017-present) and is an employee of Fidelity Investments (2005-present). Previously, Mr. Hogan served as Assistant Treasurer of certain Fidelity® funds (2016-2018). Mr. Colm A. Hogan is not related to Mr. Brian B. Hogan.
Chris Maher (1972)
Year of Election or Appointment: 2013
Assistant Treasurer
Mr. Maher serves as Assistant Treasurer of other funds. Mr. Maher is Vice President of Valuation Oversight, serves as Assistant Treasurer of FMR Capital, Inc. (2017-present), and is an employee of Fidelity Investments. Previously, Mr. Maher served as Vice President of Asset Management Compliance (2013), Vice President of the Program Management Group of FMR (investment adviser firm, 2010-2013), and Vice President of Valuation Oversight (2008-2010).
Rieco E. Mello (1969)
Year of Election or Appointment: 2017
Assistant Treasurer
Mr. Mello also serves as Assistant Treasurer of other funds. Mr. Mello serves as Assistant Treasurer of FMR Capital, Inc. (2017-present) and is an employee of Fidelity Investments (1995-present).
Kenneth B. Robins (1969)
Year of Election or Appointment: 2018
Chief Compliance Officer
Mr. Robins also serves as an officer of other funds. Mr. Robins serves as Compliance Officer of Fidelity Management & Research Company and FMR Co., Inc. (investment adviser firms, 2016-present) and is an employee of Fidelity Investments (2004-present). Previously, Mr. Robins served as Executive Vice President of Fidelity Investments Money Management, Inc. (investment adviser firm, 2013-2016) and served in other fund officer roles.
Stacie M. Smith (1974)
Year of Election or Appointment: 2018
President and Treasurer
Ms. Smith also serves as an officer of other funds. Ms. Smith serves as Assistant Treasurer of FMR Capital, Inc. (2017-present), is an employee of Fidelity Investments (2009-present), and has served in other fund officer roles. Prior to joining Fidelity Investments, Ms. Smith served as Senior Audit Manager of Ernst & Young LLP (accounting firm, 1996-2009). Previously, Ms. Smith served as Assistant Treasurer (2013-2018) and Deputy Treasurer (2013-2016) of certain Fidelity® funds.
Marc L. Spector (1972)
Year of Election or Appointment: 2017
Assistant Treasurer
Mr. Spector also serves as an officer of other funds. Mr. Spector serves as Assistant Treasurer of FMR Capital, Inc. (2017-present) and is an employee of Fidelity Investments (2016-present). Prior to joining Fidelity Investments, Mr. Spector served as Director at the Siegfried Group (accounting firm, 2013-2016), and prior to Siegfried Group as audit senior manager at Deloitte & Touche (accounting firm, 2005-2013).
Renee Stagnone (1975)
Year of Election or Appointment: 2016
Assistant Treasurer
Ms. Stagnone also serves as an officer of other funds. Ms. Stagnone serves as Assistant Treasurer of FMR Capital, Inc. (2017-present) and is an employee of Fidelity Investments (1997-present). Previously, Ms. Stagnone served as Deputy Treasurer of certain Fidelity® funds (2013-2016).
Shareholder Expense Example
As a shareholder of a Fund, you incur two types of costs: (1) transaction costs, including redemption fees and (2) ongoing costs, including management fees and other Fund expenses. This Example is intended to help you understand your ongoing costs (in dollars) of investing in the Funds and to compare these costs with the ongoing costs of investing in other mutual funds.
The Example is based on an investment of $1,000 invested at the beginning of the period and held for the entire period (September 1, 2017 to February 28, 2018).
Actual Expenses
The first line of the accompanying table for each fund provides information about actual account values and actual expenses. You may use the information in this line, together with the amount you invested, to estimate the expenses that you paid over the period. Simply divide your account value by $1,000.00 (for example, an $8,600 account value divided by $1,000.00 = 8.6), then multiply the result by the number in the first line for a fund under the heading entitled "Expenses Paid During Period" to estimate the expenses you paid on your account during this period. A small balance maintenance fee of $12.00 that is charged once a year may apply for certain accounts with a value of less than $2,000. This fee is not included in the table below. If it was, the estimate of expenses you paid during the period would be higher, and your ending account value lower, by this amount. In addition, each Fund, as a shareholder in the underlying Fidelity Central Funds, will indirectly bear its pro-rata share of the fees and expenses incurred by the underlying Fidelity Central Funds. These fees and expenses are not included in the Fund's annualized expense ratio used to calculate the expense estimate in the table below.
Hypothetical Example for Comparison Purposes
The second line of the accompanying table for each fund provides information about hypothetical account values and hypothetical expenses based on a fund's actual expense ratio and an assumed rate of return of 5% per year before expenses, which is not the Fund's actual return. The hypothetical account values and expenses may not be used to estimate the actual ending account balance or expenses you paid for the period. You may use this information to compare the ongoing costs of investing in the Fund and other funds. To do so, compare this 5% hypothetical example with the 5% hypothetical examples that appear in the shareholder reports of the other funds. A small balance maintenance fee of $12.00 that is charged once a year may apply for certain accounts with a value of less than $2,000. This fee is not included in the table below. If it was, the estimate of expenses you paid during the period would be higher, and your ending account value lower, by this amount. In addition, each Fund, as a shareholder in the underlying Fidelity Central Funds, will indirectly bear its pro-rata share of the fees and expenses incurred by the underlying Fidelity Central Funds. These fees and expenses are not included in the Fund's annualized expense ratio used to calculate the expense estimate in the table below.
Please note that the expenses shown in the table are meant to highlight your ongoing costs only and do not reflect any transaction costs. Therefore, the second line of the table is useful in comparing ongoing costs only, and will not help you determine the relative total costs of owning different funds. In addition, if these transactional costs were included, your costs would have been higher.
| | Annualized Expense Ratio-A | Beginning
Account Value
September 1, 2017 | Ending
Account Value
February 28, 2018 | Expenses Paid
During Period-B
September 1, 2017
to February 28, 2018 |
| Banking Portfolio | .76% | | | |
| Actual | | $1,000.00 | $1,191.20 | $4.13 |
| Hypothetical-C | | $1,000.00 | 1,021.03 | $3.81 |
| Brokerage and Investment Management Portfolio | .78% | | | |
| Actual | | $1,000.00 | $1,188.20 | $4.23 |
| Hypothetical-C | | $1,000.00 | $1,020.93 | $3.91 |
| Consumer Finance Portfolio | .88% | | | |
| Actual | | $1,000.00 | $1,141.80 | $4.67 |
| Hypothetical-C | | $1,000.00 | $1,020.43 | $4.41 |
| Financial Services Portfolio | .75% | | | |
| Actual | | $1,000.00 | $1,170.60 | $4.04 |
| Hypothetical-C | | $1,000.00 | $1,021.08 | $3.76 |
| Insurance Portfolio | .80% | | | |
| Actual | | $1,000.00 | $1,058.60 | $4.08 |
| Hypothetical-C | | $1,000.00 | $1,020.83 | $4.01 |
A Annualized expense ratio reflects expenses net of applicable fee waivers.
B Expenses are equal to each Fund's annualized expense ratio, multiplied by the average account value over the period, multiplied by 181/ 365 (to reflect the one-half year period).
C 5% return per year before expenses
Distributions (Unaudited)
The Board of Trustees of each fund voted to pay to shareholders of record at the opening of business on record date, the following distributions per share derived from capital gains realized from sales of portfolio securities, and dividends derived from net investment income:
| | Pay Date | Record Date | Dividends | Capital Gains |
| Banking Portfolio | 04/09/18 | 04/06/18 | $0.159 | $2.477 |
| Brokerage and Investment Management Portfolio | 04/09/18 | 04/06/18 | $0.188 | $3.743 |
| Consumer Finance Portfolio | 04/09/18 | 04/06/18 | $0.000 | $0.681 |
| Financial Services Portfolio | 04/09/18 | 04/06/18 | $0.184 | $2.535 |
| Insurance Portfolio | 04/09/18 | 04/06/18 | $0.324 | $9.036 |
|
The funds hereby designate as capital gain dividend the amounts noted below for the taxable year ended February 28, 2018, or, if subsequently determined to be different, the net capital gain of such year.
| Banking Portfolio | $87,046,237 |
| Brokerage and Investment Management Portfolio | $27,568,884 |
| Consumer Finance Portfolio | $4,280,612 |
| Financial Services Portfolio | $44,131,526 |
| Insurance Portfolio | $96,581,783 |
|
A percentage of the dividends distributed during the fiscal year for the following funds qualify for the dividends–received deduction for corporate shareholders:
| Banking Portfolio | |
| April 2017 | 100% |
| December 2017 | 100% |
| Brokerage and Investment Management Portfolio | |
| April 2017 | 98% |
| December 2017 | 48% |
| Consumer Finance Portfolio | |
| April 2017 | 95% |
| December 2017 | 58% |
| Financial Services Portfolio | |
| April 2017 | 100% |
| December 2017 | 95% |
| Insurance Portfolio | |
| April 2017 | 100% |
| December 2017 | 100% |
|
A percentage of the dividends distributed during the fiscal year for the following funds may be taken into account as a dividend for purposes of the maximum rate under section 1(h)(11) of the Internal Revenue Code.
| Banking Portfolio | |
| April 2017 | 100% |
| December 2017 | 100% |
| Brokerage and Investment Management Portfolio | |
| April 2017 | 98% |
| December 2017 | 53% |
| Consumer Finance Portfolio | |
| April 2017 | 96% |
| December 2017 | 59% |
| Financial Services Portfolio | |
| April 2017 | 100% |
| December 2017 | 100% |
| Insurance Portfolio | |
| April 2017 | 100% |
| December 2017 | 100% |
|
The funds will notify shareholders in January 2019 of amounts for use in preparing 2018 income tax returns.
Board Approval of Investment Advisory Contracts and Management Fees
Banking Portfolio
Brokerage and Investment Management Portfolio
Consumer Finance Portfolio
Financial Services Portfolio
Insurance Portfolio
Each year, the Board of Trustees, including the Independent Trustees (together, the Board), votes on the renewal of the management contract with Fidelity SelectCo, LLC (SelectCo), an affiliate of Fidelity Management & Research Company (FMR), and the sub-advisory agreements with affiliates of FMR (together, the Advisory Contracts) for each fund. SelectCo and the sub-advisers are collectively referred to herein as the Investment Advisers. The Board, assisted by the advice of fund counsel and Independent Trustees' counsel, requests and considers a broad range of information relevant to the renewal of the Advisory Contracts throughout the year.
The Board meets regularly and, at each of its meetings, covers an extensive agenda of topics and materials and considers factors that are relevant to its annual consideration of the renewal of each fund's Advisory Contracts, including the services and support provided to each fund and its shareholders. The Board has established four standing committees (Committees) — Operations, Audit, Fair Valuation, and Governance and Nominating — each composed of and chaired by Independent Trustees with varying backgrounds, to which the Board has assigned specific subject matter responsibilities in order to enhance effective decision-making by the Board. The Operations Committee, of which all of the Independent Trustees are members, meets regularly throughout the year and considers, among other matters, information specifically related to the annual consideration of the renewal of each fund's Advisory Contracts. The Board, acting directly and through its Committees, requests and receives information concerning the annual consideration of the renewal of each fund's Advisory Contracts. The Board also meets as needed to review matters specifically related to the Board's annual consideration of the renewal of the Advisory Contracts. Members of the Board may also meet with trustees of other Fidelity funds through ad hoc joint committees to discuss certain matters relevant to all of the Fidelity funds.
At its January 2018 meeting, the Board unanimously determined to renew each fund's Advisory Contracts. In reaching its determination, the Board considered all factors it believed relevant, including (i) the nature, extent, and quality of the services to be provided to each fund and its shareholders (including the investment performance of each fund); (ii) the competitiveness of each fund's management fee and total expense ratio relative to peer funds; (iii) the total costs of the services to be provided by and the profits to be realized by Fidelity from its relationships with each fund; and (iv) the extent to which, if any, economies of scale exist and would be realized as each fund grows, and whether any economies of scale are appropriately shared with fund shareholders.
In considering whether to renew the Advisory Contracts for each fund, the Board reached a determination, with the assistance of fund counsel and Independent Trustees' counsel and through the exercise of its business judgment, that the renewal of the Advisory Contracts was in the best interests of each fund and its shareholders and that the compensation payable under the Advisory Contracts was fair and reasonable. The Board's decision to renew the Advisory Contracts was not based on any single factor, but rather was based on a comprehensive consideration of all the information provided to the Board at its meetings throughout the year. The Board, in reaching its determination to renew the Advisory Contracts, was aware that shareholders of each fund have a broad range of investment choices available to them, including a wide choice among funds offered by Fidelity's competitors, and that each fund's shareholders, who have the opportunity to review and weigh the disclosure provided by the fund in its prospectus and other public disclosures, have chosen to invest in that fund, which is part of the Fidelity family of funds.
Amendment to Group Fee Rate. The Board also ratified an amendment to the management contract for each fund to add an additional breakpoint to the group fee schedule, which was effective October 1, 2017. The Board noted that the additional breakpoint would result in lower management fee rates to the extent that assets under management that are included in group fee calculations increase above the new breakpoint.
Nature, Extent, and Quality of Services Provided. The Board considered the staffing of the Investment Advisers as it relates to the funds, including the backgrounds of investment personnel of SelectCo, and also considered the funds' investment objectives, strategies, and related investment philosophies. The Independent Trustees also had discussions with senior management of Fidelity's investment operations and investment groups. The Board considered the structure of the investment personnel compensation program and whether this structure provides appropriate incentives to act in the best interests of each fund. Additionally, the Board considered the portfolio managers' investments, if any, in the funds that they manage.
Resources Dedicated to Investment Management and Support Services. The Board reviewed the general qualifications and capabilities of the Investment Advisers' investment staffs, including their size, education, experience, and resources, as well as Fidelity's approach to recruiting, training, managing, and compensating investment personnel. The Board noted that Fidelity has continued to increase the resources devoted to non-U.S. offices, including expansion of Fidelity's global investment organization. The Board also noted that Fidelity's analysts have extensive resources, tools and capabilities that allow them to conduct sophisticated quantitative and fundamental analysis, as well as credit analysis of issuers, counterparties and guarantors. Further, the Board considered that Fidelity's investment professionals have sufficient access to global information and data so as to provide competitive investment results over time, and that those professionals also have access to sophisticated tools that permit them to assess portfolio construction and risk and performance attribution characteristics continuously, as well as to transmit new information and research conclusions rapidly around the world. Additionally, in its deliberations, the Board considered Fidelity's trading, risk management, compliance, and technology and operations capabilities and resources, which are integral parts of the investment management process.
Shareholder and Administrative Services. The Board considered (i) the nature, extent, quality, and cost of advisory, administrative, and shareholder services performed by the Investment Advisers and their affiliates under the Advisory Contracts and under separate agreements covering transfer agency, pricing and bookkeeping, and securities lending services for each fund; (ii) the nature and extent of the supervision of third party service providers, principally custodians, subcustodians, and pricing vendors; and (iii) the resources devoted to, and the record of compliance with, each fund's compliance policies and procedures. The Board also reviewed the allocation of fund brokerage, including allocations to brokers affiliated with the Investment Advisers, the use of brokerage commissions to pay fund expenses, and the use of "soft" commission dollars to pay for research services.
The Board noted that the growth of fund assets over time across the complex allows Fidelity to reinvest in the development of services designed to enhance the value or convenience of the Fidelity funds as investment vehicles. These services include 24-hour access to account information and market information through telephone representatives and over the Internet, investor education materials and asset allocation tools, and the expanded availability of Fidelity Investor Centers.
The Board noted that it and the boards of certain other Fidelity funds had formed an ad hoc Committee on Transfer Agency Fees to review the variety of transfer agency fee structures throughout the industry and Fidelity's competitive positioning with respect to industry participants.
Investment in a Large Fund Family. The Board considered the benefits to shareholders of investing in a Fidelity fund, including the benefits of investing in a fund that is part of a large family of funds offering a variety of investment disciplines and providing a large variety of mutual fund investor services. The Board noted that Fidelity had taken, or had made recommendations that resulted in the Fidelity funds taking, a number of actions over the previous year that benefited particular funds, including: (i) continuing to dedicate additional resources to Fidelity's investment research process, which includes meetings with management of issuers in which the funds invest, and to the support of the senior management team that oversees asset management; (ii) continuing efforts to enhance Fidelity's global research capabilities; (iii) launching new funds and making other enhancements to meet client needs; (iv) launching new share classes of existing funds; (v) eliminating purchase minimums and broadening eligibility requirements for certain lower-priced share classes; (vi) reducing management fees and total expenses for certain growth equity funds and index funds; (vii) lowering expense caps for certain existing funds and classes to reduce expenses borne by shareholders; (viii) eliminating short-term redemption fees for certain funds; (ix) introducing a new pricing structure for certain funds of funds that is expected to reduce overall expenses paid by shareholders; (x) rationalizing product lines and gaining increased efficiencies through proposals for fund mergers and share class consolidations; (xi) continuing to develop, acquire and implement systems and technology to improve services to the funds and shareholders, strengthen information security, and increase efficiency; and (xii) implementing enhancements to further strengthen Fidelity's product line to increase investors' probability of success in achieving their investment goals, including retirement income goals.
The Board considered whether each fund has operated in accordance with its investment objective, as well as its record of compliance with its investment restrictions and its performance history.
The Board took into account discussions with representatives of SelectCo about fund investment performance that occur at Board meetings throughout the year. In this regard the Board noted that as part of regularly scheduled fund reviews and other reports to the Board on fund performance, the Board considers annualized return information for each fund for different time periods, measured against a securities market index ("benchmark index"). In its evaluation of fund investment performance at meetings throughout the year, the Board gave particular attention to information indicating underperformance of certain Fidelity funds for specific time periods and discussed with the Investment Advisers the reasons for such underperformance. Each of Banking Portfolio, Brokerage and Investment Management Portfolio, Financial Services Portfolio, and Insurance Portfolio underperformed its benchmark for the one-, three-, and five-year periods ended June 30, 2017, and as a result, the Board will continue to discuss with SelectCo the steps it is taking to address each such fund's performance.
In addition to reviewing absolute and relative fund performance, the Independent Trustees periodically consider the appropriateness of fund performance metrics in evaluating the results achieved. In general, the Independent Trustees believe that fund performance should be evaluated based on net performance (after fees and expenses) of both the highest performing and lowest performing fund share classes, where applicable, compared to appropriate benchmark indices, over appropriate time periods that may include full market cycles, taking into account relevant factors, including the following: general market conditions; issuer-specific information; and fund cash flows and other factors. Depending on the circumstances, the Independent Trustees may be satisfied with a fund's performance notwithstanding that it lags its benchmark index for certain periods.
The Independent Trustees recognize that shareholders evaluate performance on a net basis over their own holding periods, for which one-, three-, and five-year periods are often used as a proxy. For this reason, the performance information reviewed by the Board also included net cumulative total return information for each fund and an appropriate benchmark index for the most recent one-, three-, and five-year periods ended June 30, 2017.
Based on its review, the Board concluded that the nature, extent, and quality of services provided to each fund under the Advisory Contracts should continue to benefit the shareholders of each fund.
Competitiveness of Management Fee and Total Expense Ratio. The Board considered each fund's management fee and total expense ratio compared to "mapped groups" of competitive funds and classes created for the purpose of facilitating the Trustees' analysis of the competitiveness of management fees and total expenses. Fidelity creates "mapped groups" by combining similar Lipper investment objective categories that have comparable investment mandates. For this purpose, all sector focused equity funds are grouped in the same mapped group. Combining Lipper investment objective categories aids the Board's management fee and total expense ratio comparisons by broadening the competitive group used for comparison.
Management Fee. The Board considered two proprietary management fee comparisons for the 12-month periods ended June 30 shown in basis points (BP) in the charts below. The group of Lipper funds used by the Board for management fee comparisons is referred to below as the "Total Mapped Group." The Total Mapped Group comparison focuses on a fund's standing in terms of gross management fees before expense reimbursements or caps relative to the total universe of funds with comparable investment mandates (
i.e., sector equities), regardless of whether their management fee structures also are comparable. Funds with comparable management fee structures have similar management fee contractual arrangements (
e.g., flat rate charged for advisory services, all-inclusive fee rate,
etc.). "TMG %" represents the percentage of funds in the Total Mapped Group that had management fees that were lower than a fund's. For example, a hypothetical TMG % of 20% would mean that 80% of the funds in the Total Mapped Group had higher, and 20% had lower, management fees than a fund. The funds' actual TMG %s and the number of funds in the Total Mapped Group are in the charts below. The "Asset-Size Peer Group" (ASPG) comparison focuses on a fund's standing relative to a subset of non-Fidelity funds within the Total Mapped Group that are similar in size and management fee structure. For example, if a fund is in the first quartile of the ASPG, the fund's management fee ranks in the least expensive or lowest 25% of funds in the ASPG. The ASPG represents at least 15% of the funds in the Total Mapped Group with comparable asset size and management fee structures, subject to a minimum of 50 funds (or all funds in the Total Mapped Group if fewer than 50). Additional information, such as the ASPG quartile in which a fund's management fee rate ranked, is also included in the charts and considered by the Board.
Banking Portfolio

Brokerage and Investment Management Portfolio
Consumer Finance Portfolio
Financial Services Portfolio

Insurance Portfolio

The Board noted that each fund's management fee rate ranked below the median of its Total Mapped Group and below the median of its ASPG for the 12-month period ended June 30, 2017.
The Board noted that it and the boards of other Fidelity funds formed an ad hoc Committee on Group Fee, which meets periodically, to conduct an in-depth review of the "group fee" component of the management fee of funds with such management fee structures. The Committee's focus included the mechanics of the group fee, the competitive landscape of group fee structures, Fidelity funds with no group fee component and investment products not included in group fee assets. The Board also considered that, for funds subject to the group fee, FMR agreed to voluntarily waive fees over a specified period of time in amounts designed to account for assets converted from certain funds to certain collective investment trusts.
Based on its review, the Board concluded that each fund's management fee is fair and reasonable in light of the services that each fund receives and the other factors considered.
Total Expense Ratio. In its review of each fund's total expense ratio, the Board considered the fund's management fee rate as well as other fund expenses, such as transfer agent fees, pricing and bookkeeping fees, and custodial, legal, and audit fees. The Board also noted that Fidelity may agree to waive fees and expenses from time to time, and the extent to which, if any, it has done so for each fund. As part of its review, the Board also considered the current and historical total expense ratios of each fund compared to competitive fund median expenses. Each fund is compared to those funds and classes in the Total Mapped Group (used by the Board for management fee comparisons) that have a similar sales load structure.
The Board noted that each fund's total expense ratio ranked below the competitive median for the 12-month period ended June 30, 2017.
Fees Charged to Other Fidelity Clients. The Board also considered Fidelity fee structures and other information with respect to clients of Fidelity, such as other funds advised or subadvised by Fidelity, pension plan clients, and other institutional clients with similar mandates. The Board noted that an ad hoc joint committee created by it and the boards of other Fidelity funds periodically reviews and compares Fidelity's institutional investment advisory business with its business of providing services to the Fidelity funds, including the differences in services provided, fees charged, and costs incurred, as well as competition in their respective marketplaces.
Based on its review of total expense ratios and fees charged to other Fidelity clients, the Board concluded that each fund's total expense ratio was reasonable in light of the services that each fund and its shareholders receive and the other factors considered.
Costs of the Services and Profitability. The Board considered the revenues earned and the expenses incurred by Fidelity in conducting the business of developing, marketing, distributing, managing, administering and servicing each fund and servicing each fund's shareholders. The Board also considered the level of Fidelity's profits in respect of all the Fidelity funds.
On an annual basis, Fidelity presents to the Board information about the profitability of its relationships with each fund. Fidelity calculates profitability information for each fund, as well as aggregate profitability information for groups of Fidelity funds and all Fidelity funds, using a series of detailed revenue and cost allocation methodologies which originate with the books and records of Fidelity on which Fidelity's audited financial statements are based. The Audit Committee of the Board reviews any significant changes from the prior year's methodologies.
PricewaterhouseCoopers LLP (PwC), independent registered public accounting firm and auditor to Fidelity and certain Fidelity funds, has been engaged annually by the Board as part of the Board's assessment of the profitability analysis used by Fidelity. PwC's engagement includes the review and assessment of Fidelity's methodologies used in determining the revenues and expenses attributable to Fidelity's mutual fund business, and completion of agreed-upon procedures in respect of the mathematical accuracy of the fund profitability information and its conformity to established allocation methodologies. After considering PwC's reports issued under the engagement and information provided by Fidelity, the Board concluded that while other allocation methods may also be reasonable, Fidelity's profitability methodologies are reasonable in all material respects.
The Board also reviewed Fidelity's non-fund businesses and potential fall-out benefits related to the mutual fund business as well as cases where Fidelity's affiliates may benefit from or be related to the funds' business.
The Board considered the costs of the services provided by and the profits realized by Fidelity in connection with the operation of each fund and was satisfied that the profitability was not excessive.
Economies of Scale. The Board considered whether there have been economies of scale in respect of the management of the Fidelity funds, whether the Fidelity funds (including each fund) have appropriately benefited from any such economies of scale, and whether there is potential for realization of any further economies of scale. The Board considered the extent to which each fund will benefit from economies of scale as assets grow through increased services to the fund, through waivers or reimbursements, or through fee or expense ratio reductions. The Board also noted that a committee (the Economies of Scale Committee) created by it and the boards of other Fidelity funds periodically analyzes whether Fidelity attains economies of scale in respect of the management and servicing of the Fidelity funds, whether the Fidelity funds have appropriately benefited from such economies of scale, and whether there is potential for realization of any further economies of scale.
The Board recognized that each fund's management contract incorporates a "group fee" structure, which provides for lower group fee rates as total group assets increase, and for higher group fee rates as total group assets decrease (with "group assets" defined to include fund assets under SelectCo's management plus assets under FMR's management). SelectCo calculates the group fee rates based on a tiered asset "breakpoint" schedule that varies based on asset class. The Board considered that the group fee is designed to deliver the benefits of economies of scale to fund shareholders when total group assets increase, even if assets of any particular fund are unchanged or have declined, because some portion of Fidelity's costs are attributable to services provided to all Fidelity funds, and all funds benefit if those costs can be allocated among more assets. The Board concluded that, given the group fee structure, fund shareholders will benefit from lower management fees as group assets increase at the fund complex level, regardless of whether Fidelity achieves any such economies of scale.
The Board concluded, taking into account the analysis of the Economies of Scale Committee, that economies of scale, if any, are being appropriately shared between fund shareholders and Fidelity.
Additional Information Requested by the Board. In order to develop fully the factual basis for consideration of the Fidelity funds' advisory contracts, the Board requested and received additional information on certain topics, including: (i) Fidelity's fund profitability methodology, profitability trends for certain funds, and the impact of certain factors on fund profitability results; (ii) portfolio manager changes that have occurred during the past year and the amount of the investment that each portfolio manager has made in the Fidelity fund(s) that he or she manages; (iii) Fidelity's compensation structure for portfolio managers, research analysts, and other key personnel, including its effects on fund profitability; (iv) comparisons to institutional products; (v) the arrangements with and compensation paid to certain fund sub-advisers on behalf of the Fidelity funds; (vi) the impact of proposed changes to contractual expense cap arrangements in place for certain funds; (vii) Fidelity's long-term expectations for its offerings in the workplace investing channel; (viii) the methodology with respect to evaluating competitive fund data and peer group classifications and fee comparisons; (ix) the presentation of certain fund performance information; (x) Fidelity's transfer agent fee, expense, and service structures for different funds and classes, including the increased use of omnibus accounts and lower pricing in the retirement channel; (xi) fluctuations in trading expenses; (xii) explanations regarding the relative total expense ratios of certain funds and classes; and (xiii) Fidelity's expectations regarding the future asset levels of certain funds.
Based on its evaluation of all of the conclusions noted above, and after considering all factors it believed relevant, the Board concluded that the advisory fee structures are fair and reasonable, and that each fund's Advisory Contracts should be renewed.
Proxy Voting Results
A special meeting of shareholders was held on December 8, 2017. The results of votes taken among shareholders on the proposals before them are reported below. Each vote reported represents one dollar of net asset value held on the record date for the meeting.
PROPOSAL 1
To elect a Board of Trustees.
| | # of
Votes | % of
Votes |
| James C. Curvey |
| Affirmative | 40,874,579,146.19 | 94.146 |
| Withheld | 2,541,618,753.48 | 5.854 |
| TOTAL | 43,416,197,899.67 | 100.000 |
| Dennis J. Dirks |
| Affirmative | 41,093,243,800.03 | 94.650 |
| Withheld | 2,322,954,099.64 | 5.350 |
| TOTAL | 43,416,197,899.67 | 100.000 |
| Donald F. Donahue |
| Affirmative | 41,121,116,505.64 | 94.714 |
| Withheld | 2,295,081,394.03 | 5.286 |
| TOTAL | 43,416,197,899.67 | 100.000 |
| Alan J. Lacy |
| Affirmative | 41,091,494,851.72 | 94.646 |
| Withheld | 2,324,703,047.95 | 5.354 |
| TOTAL | 43,416,197,899.67 | 100.00 |
| Ned C. Lautenbach |
| Affirmative | 40,970,733,721.42 | 94.368 |
| Withheld | 2,445,464,178.25 | 5.632 |
| TOTAL | 43,416,197,899.67 | 100.000 |
| Joseph Mauriello |
| Affirmative | 41,021,688,840.89 | 94.485 |
| Withheld | 2,394,509,058.78 | 5.515 |
| TOTAL | 43,416,197,899.67 | 100.000 |
| Charles S. Morrison |
| Affirmative | 41,163,534,997.01 | 94.812 |
| Withheld | 2,252,662,902.66 | 5.188 |
| TOTAL | 43,416,197,899.67 | 100.000 |
| Cornelia M. Small |
| Affirmative | 41,061,752,034.66 | 94.578 |
| Withheld | 2,354,445,865.01 | 5.422 |
| TOTAL | 43,416,197,899.67 | 100.000 |
| Garnett A. Smith |
| Affirmative | 41,061,939,407.02 | 94.578 |
| Withheld | 2,354,258,492.65 | 5.422 |
| TOTAL | 43,416,197,899.67 | 100.000 |
| David M. Thomas |
| Affirmative | 41,102,875,738.06 | 94.672 |
| Withheld | 2,313,322,161.61 | 5.328 |
| TOTAL | 43,416,197,899.67 | 100.000 |
| Michael E. Wiley |
| Affirmative | 41,112,279,187.11 | 94.694 |
| Withheld | 2,303,918,712.56 | 5.306 |
| TOTAL | 43,416,197,899.67 | 100.000 |
PROPOSAL 2
To eliminate a fundamental investment policy for Banking Portfolio.
| | # of
Votes | % of
Votes |
| Affirmative | 518,741,129.25 | 73.271 |
| Against | 97,664,891.66 | 13.795 |
| Abstain | 46,533,655.21 | 6.573 |
| Broker Non-Vote | 45,038,061.40 | 6.361 |
| TOTAL | 707,977,737.52 | 100.000 |
PROPOSAL 2
To eliminate a fundamental investment policy for Brokerage and Investment Management Portfolio.
| | # of
Votes | % of
Votes |
| Affirmative | 209,203,338.44 | 71.583 |
| Against | 40,421,554.86 | 13.831 |
| Abstain | 19,872,624.31 | 6.799 |
| Broker Non-Vote | 22,759,078.52 | 7.787 |
| TOTAL | 292,256,596.13 | 100.000 |
PROPOSAL 2
To eliminate a fundamental investment policy for Consumer Finance Portfolio.
| | # of
Votes | % of
Votes |
| Affirmative | 38,824,209.08 | 71.945 |
| Against | 5,076,930.99 | 9.408 |
| Abstain | 4,014,280.32 | 7.439 |
| Broker Non-Vote | 6,048,834.57 | 11.208 |
| TOTAL | 53,964,254.96 | 100.000 |
PROPOSAL 2
To eliminate a fundamental investment policy for Financial Services Portfolio.
| | # of
Votes | % of
Votes |
| Affirmative | 655,201,633.28 | 80.998 |
| Against | 88,190,228.80 | 10.902 |
| Abstain | 40,198,257.69 | 4.969 |
| Broker Non-Vote | 25,329,462.00 | 3.131 |
| TOTAL | 808,919,581.77 | 100.000 |
PROPOSAL 2
To eliminate a fundamental investment policy for Insurance Portfolio.
| | # of
Votes | % of
Votes |
| Affirmative | 261,795,605.56 | 71.919 |
| Against | 44,692,608.11 | 12.278 |
| Abstain | 32,311,311.45 | 8.876 |
| Broker Non-Vote | 25,218,000.01 | 6.927 |
| TOTAL | 364,017,525.13 | 100.000 |
PROPOSAL 3
To modify Brokerage and Investment Management Portfolio's fundamental concentration policy.
| | # of
Votes | % of
Votes |
| Affirmative | 217,169,770.01 | 74.308 |
| Against | 33,148,678.21 | 11.343 |
| Abstain | 19,179,069.39 | 6.562 |
| Broker Non-Vote | 22,759,078.52 | 7.787 |
| TOTAL | 292,256,596.13 | 100.000 |
PROPOSAL 3
To modify Financial Services Portfolio's fundamental concentration policy.
| | # of
Votes | % of
Votes |
| Affirmative | 667,301,296.49 | 82.493 |
| Against | 74,884,004.43 | 9.258 |
| Abstain | 41,404,818.85 | 5.118 |
| Broker Non-Vote | 25,329,462.00 | 3.131 |
| TOTAL | 808,919,581.77 | 100.000 |
PROPOSAL 3
To modify Insurance Portfolio's fundamental concentration policy.
| | # of
Votes | % of
Votes |
| Affirmative | 276,771,678.76 | 76.033 |
| Against | 32,272,062.54 | 8.866 |
| Abstain | 29,755,783.82 | 8.174 |
| Broker Non-Vote | 25,218,000.01 | 6.927 |
| TOTAL | 364,017,525.13 | 100.000 |
PROPOSAL 4
To change Banking Portfolio from a diversified fund to a non-diversified fund.
| | # of
Votes | % of
Votes |
| Affirmative | 489,562,536.06 | 69.150 |
| Against | 130,712,554.06 | 18.463 |
| Abstain | 42,664,586.00 | 6.026 |
| Broker Non-Vote | 45,038,061.40 | 6.361 |
| TOTAL | 707,977,737.52 | 100.000 |
PROPOSAL 4
To change Financial Services Portfolio from a diversified fund to a non-diversified fund.
| | # of
Votes | % of
Votes |
| Affirmative | 637,604,918.89 | 78.822 |
| Against | 95,884,935.85 | 11.854 |
| Abstain | 50,100,265.03 | 6.193 |
| Broker Non-Vote | 25,329,462.00 | 3.131 |
| TOTAL | 808,919,581.77 | 100.000 |
|
| Proposal 1 reflects trust wide proposal and voting results. |
SELFIN-ANN-0418
1.813663.113
Fidelity® Select Portfolios®
Health Care Sector Biotechnology Portfolio
Health Care Portfolio
Health Care Services Portfolio
Medical Technology and Devices Portfolio (formerly Medical Equipment and Systems Portfolio)
Pharmaceuticals Portfolio
Annual Report February 28, 2018 |
|
Contents
To view a fund's proxy voting guidelines and proxy voting record for the 12-month period ended June 30, visit http://www.fidelity.com/proxyvotingresults or visit the Securities and Exchange Commission's (SEC) web site at http://www.sec.gov.
You may also call 1-800-544-8544 to request a free copy of the proxy voting guidelines.
Standard & Poor's, S&P and S&P 500 are registered service marks of The McGraw-Hill Companies, Inc. and have been licensed for use by Fidelity Distributors Corporation.
Other third-party marks appearing herein are the property of their respective owners.
All other marks appearing herein are registered or unregistered trademarks or service marks of FMR LLC or an affiliated company. © 2018 FMR LLC. All rights reserved.
This report and the financial statements contained herein are submitted for the general information of the shareholders of the Funds. This report is not authorized for distribution to prospective investors in the Funds unless preceded or accompanied by an effective prospectus.
A fund files its complete schedule of portfolio holdings with the SEC for the first and third quarters of each fiscal year on Form N-Q. Forms N-Q are available on the SEC’s web site at http://www.sec.gov. A fund's Forms N-Q may be reviewed and copied at the SEC’s Public Reference Room in Washington, DC. Information regarding the operation of the SEC's Public Reference Room may be obtained by calling 1-800-SEC-0330.
For a complete list of a fund's portfolio holdings, view the most recent holdings listing, semiannual report, or annual report on Fidelity's web site at http://www.fidelity.com, http://www.institutional.fidelity.com, or http://www.401k.com, as applicable.
NOT FDIC INSURED •MAY LOSE VALUE •NO BANK GUARANTEE
Neither the Funds nor Fidelity Distributors Corporation is a bank.
Biotechnology Portfolio
Performance: The Bottom Line
Average annual total return reflects the change in the value of an investment, assuming reinvestment of distributions from dividend income and capital gains (the profits earned upon the sale of securities that have grown in value, if any) and assuming a constant rate of performance each year. The hypothetical investment and the average annual total returns do not reflect the deduction of taxes that a shareholder would pay on fund distributions or the redemption of fund shares. During periods of reimbursement by Fidelity, a fund’s total return will be greater than it would be had the reimbursement not occurred. How a fund did yesterday is no guarantee of how it will do tomorrow.
Average Annual Total Returns
| For the periods ended February 28, 2018 | Past 1 year | Past 5 years | Past 10 years |
| Biotechnology Portfolio | 17.04% | 19.33% | 17.43% |
$10,000 Over 10 Years
Let's say hypothetically that $10,000 was invested in Biotechnology Portfolio on February 29, 2008.
The chart shows how the value of your investment would have changed, and also shows how the S&P 500® Index performed over the same period.
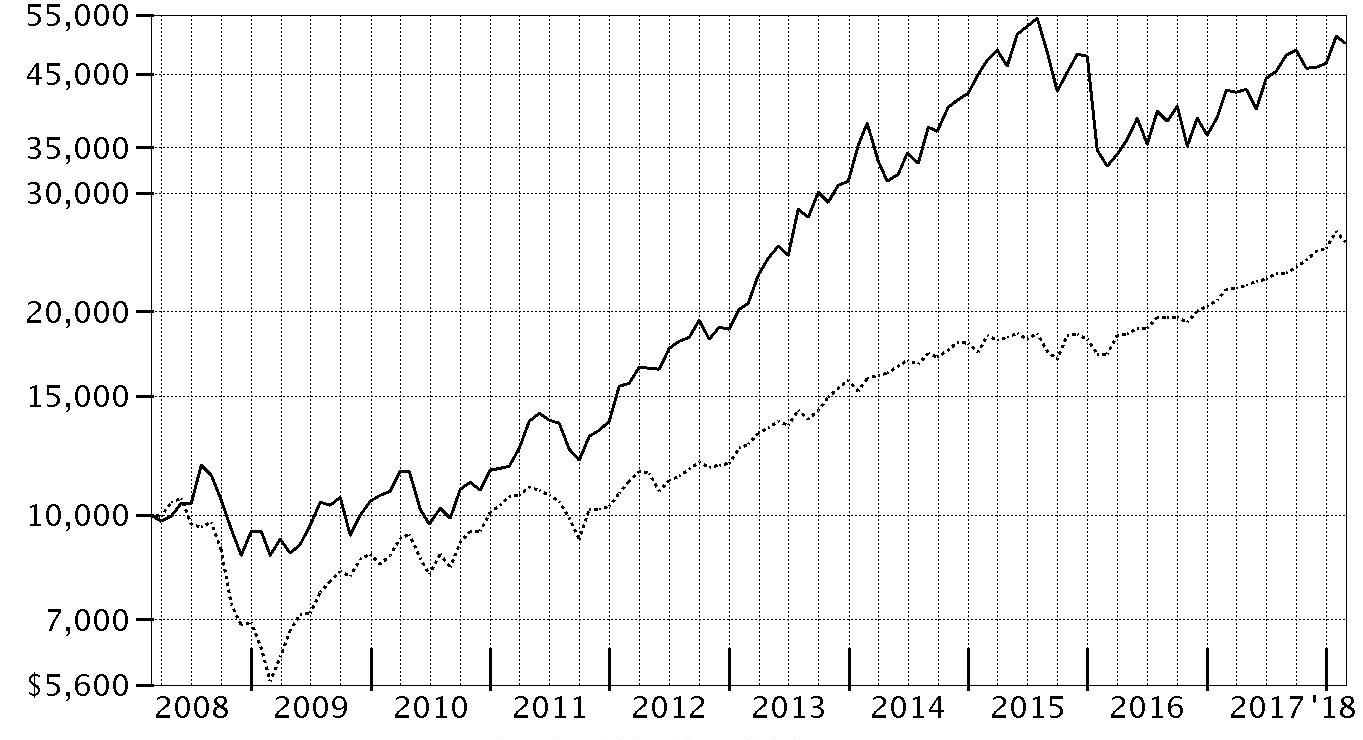
| Period Ending Values |
| $49,880 | Biotechnology Portfolio |
| $25,307 | S&P 500® Index |
Biotechnology Portfolio
Management's Discussion of Fund Performance
Market Recap: U.S. equities gained 17.10% for the 12 months ending February 28, 2018, as the S&P 500
® index moved steadily higher throughout 2017 and into 2018 until sharply reversing course in February. The drop was in stark contrast to the low volatility seen throughout 2017, along with consumer sentiment and other market indicators that stayed positive. Investors remained decidedly upbeat as the calendar turned, and the index rose 5.73% in January. February was a decidedly different story, though, as volatility spiked amid fear that rising inflation and the potential for the economy to overheat would prompt the U.S. Federal Reserve to pick up the pace of interest rate hikes. The index returned -3.69% for the month, its first negative result since October 2016. For the full 12 months, growth stocks handily topped value, while large-caps bested small-caps. By sector, information technology fared best by far, gaining 36% amid strong earnings growth from several major index constituents. Consumer discretionary (+22%) also stood out, driven by retailers. Financials added 20%, riding the uptick in bond yields. Materials and industrials rose about 16% each, boosted by higher demand, especially from China. Conversely, notable laggards included the defensive telecommunication services (-5%) and utilities (-2%) sectors, while rising rates held back real estate (-3%).
Comments from Portfolio Manager Rajiv Kaul: For the year, the fund gained 17.04% this period, trailing the 21.30% return of the MSCI U.S. IMI Biotechnology 25/50 Index, but about in line with the S&P 500
®. Versus the MSCI index, stock selection in biotechnology, the fund’s core focus, detracted this period. A non-index stake in pharmaceuticals stocks also hurt, although to a much smaller degree. The largest individual detractor by a wide margin was AbbVie (+94%), which cost us considerable relative performance due to the fund’s sizable underweighting here. Overweighting cancer-drug specialist Tesaro also worked against us, as did Ultragenyx Pharmaceutical, another overweighting that performed poorly. Conversely, the top relative contributor was an underweighted position in weak-performing index name Celgene. Shortly after hitting an all-time high at the beginning of October, shares of Celgene took a tumble. Overweighting Loxo Oncology also proved timely, and out-of-index exposure to MyoKardia also lifted the fund’s relative result.
The views expressed above reflect those of the portfolio manager(s) only through the end of the period as stated on the cover of this report and do not necessarily represent the views of Fidelity or any other person in the Fidelity organization. Any such views are subject to change at any time based upon market or other conditions and Fidelity disclaims any responsibility to update such views. These views may not be relied on as investment advice and, because investment decisions for a Fidelity fund are based on numerous factors, may not be relied on as an indication of trading intent on behalf of any Fidelity fund.
Note to shareholders: On December 8, 2017, shareholders approved proposals from the Board of Trustees to eliminate each sector/industry fund's fundamental “invests primarily” policy and to modify the fundamental concentration policy for certain funds. The changes took effect on January 1, 2018, and do not impact how the funds are managed.
Biotechnology Portfolio
Investment Summary (Unaudited)
Top Ten Stocks as of February 28, 2018
| | % of fund's net assets |
| AbbVie, Inc. | 6.1 |
| Amgen, Inc. | 5.8 |
| Biogen, Inc. | 4.1 |
| Celgene Corp. | 3.5 |
| Vertex Pharmaceuticals, Inc. | 3.3 |
| Alexion Pharmaceuticals, Inc. | 2.2 |
| Gilead Sciences, Inc. | 2.2 |
| Regeneron Pharmaceuticals, Inc. | 2.0 |
| Alnylam Pharmaceuticals, Inc. | 2.0 |
| Neurocrine Biosciences, Inc. | 2.0 |
| | 33.2 |
Top Industries (% of fund's net assets)
| As of February 28, 2018 |
| | Biotechnology | 90.3% |
| | Pharmaceuticals | 8.1% |
| | Health Care Equipment & Supplies | 0.4% |
| | Health Care Providers & Services | 0.2% |
| | Health Care Technology | 0.2% |
| | All Others* | 0.8% |

* Includes short-term investments and net other assets (liabilities).
Biotechnology Portfolio
Schedule of Investments February 28, 2018
Showing Percentage of Net Assets
| Common Stocks - 97.3% | | | |
| | | Shares | Value |
| Biotechnology - 88.5% | | | |
| Biotechnology - 88.5% | | | |
| AbbVie, Inc. | | 4,670,093 | $540,936,863 |
| Abeona Therapeutics, Inc. (a) | | 666,429 | 9,230,042 |
| AC Immune SA (a) | | 803,314 | 8,491,029 |
| ACADIA Pharmaceuticals, Inc. (a)(b) | | 2,882,880 | 71,826,955 |
| Acceleron Pharma, Inc. (a) | | 1,587,552 | 66,566,055 |
| Achaogen, Inc. (a)(b) | | 1,553,725 | 16,205,352 |
| Achillion Pharmaceuticals, Inc. (a) | | 1,171,620 | 3,807,765 |
| Acorda Therapeutics, Inc. (a) | | 1,828,214 | 43,420,083 |
| Adamas Pharmaceuticals, Inc. (a)(b) | | 891,433 | 21,795,537 |
| Adaptimmune Therapeutics PLC sponsored ADR (a) | | 2,008,625 | 15,325,809 |
| ADMA Biologics, Inc. (a) | | 183,926 | 689,723 |
| Aduro Biotech, Inc. (a)(b) | | 1,666,415 | 10,415,094 |
| Advaxis, Inc. (a)(b) | | 313,652 | 583,393 |
| Adverum Biotechnologies, Inc. (a) | | 342,257 | 2,370,130 |
| Agenus, Inc. (a)(b) | | 650,018 | 3,503,597 |
| Agios Pharmaceuticals, Inc. (a) | | 377,290 | 30,330,343 |
| Aimmune Therapeutics, Inc. (a) | | 1,473,571 | 47,891,058 |
| Akebia Therapeutics, Inc. (a) | | 674,878 | 9,650,755 |
| Albireo Pharma, Inc. (a) | | 481,000 | 16,257,800 |
| Alder Biopharmaceuticals, Inc. (a) | | 777,334 | 10,804,943 |
| Aldeyra Therapeutics, Inc. (a)(c) | | 1,076,452 | 8,880,729 |
| Alexion Pharmaceuticals, Inc. (a) | | 1,677,064 | 196,971,167 |
| Alkermes PLC (a) | | 1,588,574 | 90,675,804 |
| Allena Pharmaceuticals, Inc. (a)(c) | | 330,941 | 2,253,708 |
| Allena Pharmaceuticals, Inc. (c) | | 1,447,443 | 9,364,232 |
| Alnylam Pharmaceuticals, Inc. (a) | | 1,485,678 | 178,519,068 |
| AMAG Pharmaceuticals, Inc. (a) | | 378,377 | 7,964,836 |
| Amarin Corp. PLC ADR (a) | | 772,831 | 2,681,724 |
| Amgen, Inc. | | 2,802,852 | 515,080,112 |
| Amicus Therapeutics, Inc. (a) | | 3,953,862 | 54,405,141 |
| AnaptysBio, Inc. (a) | | 441,870 | 54,243,961 |
| Applied Genetic Technologies Corp. (a) | | 161,994 | 623,677 |
| Aptevo Therapeutics, Inc. (a) | | 101,833 | 322,811 |
| AquaBounty Technologies, Inc. (a)(b) | | 7,555 | 18,434 |
| Ardelyx, Inc. (a) | | 1,231,292 | 6,618,195 |
| Arena Pharmaceuticals, Inc. (a)(c) | | 2,267,082 | 87,894,769 |
| Argenx SE ADR | | 814,892 | 62,445,174 |
| Array BioPharma, Inc. (a) | | 9,071,503 | 157,118,432 |
| Arsanis, Inc. (a)(b) | | 681,900 | 10,058,025 |
| Ascendis Pharma A/S sponsored ADR (a) | | 265,232 | 16,494,778 |
| Asterias Biotherapeutics, Inc. (a)(b) | | 596,713 | 1,282,933 |
| Atara Biotherapeutics, Inc. (a)(b)(c) | | 1,993,860 | 76,813,457 |
| aTyr Pharma, Inc. (a)(b) | | 295,729 | 872,401 |
| aTyr Pharma, Inc. (a)(d) | | 675,659 | 1,993,194 |
| Audentes Therapeutics, Inc. (a) | | 769,214 | 25,914,820 |
| Bellicum Pharmaceuticals, Inc. (a)(b)(c) | | 1,722,617 | 11,972,188 |
| BioCryst Pharmaceuticals, Inc. (a) | | 3,155,747 | 15,684,063 |
| Biogen, Inc. (a) | | 1,254,311 | 362,483,336 |
| Biohaven Pharmaceutical Holding Co. Ltd. | | 726,123 | 24,608,308 |
| BioMarin Pharmaceutical, Inc. (a) | | 1,423,535 | 115,548,336 |
| BioTime, Inc. warrants 10/1/18 (a) | | 30,113 | 3,614 |
| Bioverativ, Inc. (a) | | 7,585 | 793,998 |
| bluebird bio, Inc. (a) | | 383,060 | 76,995,060 |
| Blueprint Medicines Corp. (a) | | 1,709,411 | 147,966,616 |
| Calithera Biosciences, Inc. (a) | | 528,522 | 4,069,619 |
| Cara Therapeutics, Inc. (a)(b) | | 534,675 | 7,474,757 |
| Celgene Corp. (a) | | 3,563,743 | 310,473,290 |
| Celldex Therapeutics, Inc. (a) | | 2,693,766 | 6,060,974 |
| Chiasma, Inc. (a)(c) | | 1,553,299 | 2,407,613 |
| Chiasma, Inc. warrants 12/16/24 (a)(c) | | 382,683 | 80,670 |
| Chimerix, Inc. (a) | | 1,871,867 | 9,097,274 |
| Cidara Therapeutics, Inc. (a)(c) | | 146,000 | 978,200 |
| Cidara Therapeutics, Inc. (a)(c)(d) | | 1,066,786 | 7,147,466 |
| Clovis Oncology, Inc. (a) | | 914,133 | 53,083,703 |
| Corbus Pharmaceuticals Holdings, Inc. (a)(b)(c) | | 3,366,167 | 24,909,636 |
| Corvus Pharmaceuticals, Inc. (a)(b) | | 1,077,786 | 8,827,067 |
| CTI BioPharma Corp. (a) | | 1,073,300 | 4,314,666 |
| Cytokinetics, Inc. (a) | | 1,216,664 | 9,429,146 |
| CytomX Therapeutics, Inc. (a)(d) | | 287,485 | 8,541,179 |
| DBV Technologies SA sponsored ADR (a) | | 144,300 | 3,082,248 |
| Deciphera Pharmaceuticals, Inc. (a) | | 376,427 | 9,418,204 |
| Denali Therapeutics, Inc. (a)(b) | | 409,791 | 9,380,116 |
| Dicerna Pharmaceuticals, Inc. (a) | | 1,122,298 | 14,320,522 |
| Dynavax Technologies Corp. (a)(b) | | 1,766,298 | 28,525,713 |
| Eagle Pharmaceuticals, Inc. (a)(b) | | 253,208 | 14,215,097 |
| Edge Therapeutics, Inc. (a)(b) | | 39,143 | 589,102 |
| Editas Medicine, Inc. (a)(b) | | 602,018 | 22,057,940 |
| Emergent BioSolutions, Inc. (a) | | 64,467 | 3,204,010 |
| Enanta Pharmaceuticals, Inc. (a) | | 284,367 | 22,356,934 |
| Epizyme, Inc. (a)(c) | | 4,010,822 | 70,991,549 |
| Esperion Therapeutics, Inc. (a) | | 993,272 | 79,869,002 |
| Exact Sciences Corp. (a) | | 1,616,900 | 72,129,909 |
| Exelixis, Inc. (a) | | 2,534,240 | 65,383,392 |
| Fate Therapeutics, Inc. (a)(c) | | 2,805,659 | 31,591,720 |
| FibroGen, Inc. (a) | | 2,005,619 | 110,509,607 |
| Five Prime Therapeutics, Inc. (a) | | 618,100 | 13,140,806 |
| Foundation Medicine, Inc. (a) | | 101,450 | 8,394,988 |
| Galapagos Genomics NV sponsored ADR (a) | | 624,949 | 65,125,935 |
| Genmab A/S (a) | | 68,861 | 14,004,306 |
| Genomic Health, Inc. (a) | | 114,023 | 3,648,736 |
| GenSight Biologics SA (a)(b)(d) | | 446,320 | 3,795,525 |
| Geron Corp. (a)(b)(c) | | 15,165,701 | 35,032,769 |
| Gilead Sciences, Inc. | | 2,492,074 | 196,200,986 |
| Global Blood Therapeutics, Inc. (a) | | 1,782,200 | 104,526,030 |
| GlycoMimetics, Inc. (a) | | 80,473 | 1,851,684 |
| GTx, Inc. (a) | | 700,200 | 11,210,202 |
| Halozyme Therapeutics, Inc. (a) | | 2,535,550 | 49,848,913 |
| Heron Therapeutics, Inc. (a) | | 929,179 | 18,908,793 |
| Histogenics Corp. (a) | | 1,132,386 | 2,921,556 |
| Idera Pharmaceuticals, Inc. (a)(b) | | 3,506,352 | 6,206,243 |
| Immune Design Corp. (a) | | 941,657 | 2,730,805 |
| ImmunoGen, Inc. (a) | | 4,099,275 | 45,542,945 |
| Immunomedics, Inc. (a)(b) | | 5,063,983 | 85,631,953 |
| Incyte Corp. (a) | | 1,514,559 | 128,979,844 |
| Infinity Pharmaceuticals, Inc. (a)(b)(c) | | 2,793,474 | 5,251,731 |
| Insmed, Inc. (a) | | 85,600 | 2,072,376 |
| Insys Therapeutics, Inc. (a)(b) | | 177,279 | 1,292,364 |
| Intellia Therapeutics, Inc. (a)(b) | | 525,261 | 13,709,312 |
| Intercept Pharmaceuticals, Inc. (a)(b) | | 753,268 | 44,992,698 |
| Intrexon Corp. (a)(b) | | 258,553 | 3,366,360 |
| Ionis Pharmaceuticals, Inc. (a) | | 2,524,877 | 133,364,003 |
| Iovance Biotherapeutics, Inc. (a) | | 1,202,700 | 20,866,845 |
| Ironwood Pharmaceuticals, Inc. Class A (a) | | 3,249,610 | 46,144,462 |
| Jounce Therapeutics, Inc. (a)(b) | | 1,042,984 | 21,986,103 |
| Karyopharm Therapeutics, Inc. (a)(c) | | 2,889,511 | 42,678,077 |
| Keryx Biopharmaceuticals, Inc. (a)(b) | | 1,045,725 | 4,799,878 |
| Krystal Biotech, Inc. (c) | | 935,400 | 8,961,132 |
| Kura Oncology, Inc. (a)(c) | | 2,380,817 | 53,806,464 |
| La Jolla Pharmaceutical Co. (a)(b) | | 1,189,798 | 36,955,126 |
| Lexicon Pharmaceuticals, Inc. (a)(b) | | 1,978,704 | 17,076,216 |
| Ligand Pharmaceuticals, Inc. Class B (a) | | 238,198 | 36,179,894 |
| Loxo Oncology, Inc. (a) | | 1,354,536 | 150,651,494 |
| Macrogenics, Inc. (a)(c) | | 2,465,797 | 61,866,847 |
| Madrigal Pharmaceuticals, Inc. (a)(b) | | 449,061 | 56,599,648 |
| MannKind Corp. (a)(b) | | 1,402,861 | 4,110,383 |
| MediciNova, Inc. (a)(b) | | 1,069,720 | 11,178,574 |
| Merrimack Pharmaceuticals, Inc. (b) | | 283,346 | 3,147,974 |
| MiMedx Group, Inc. (a)(b) | | 45,164 | 320,213 |
| Minerva Neurosciences, Inc. (a)(c) | | 3,150,614 | 16,540,724 |
| Miragen Therapeutics, Inc. (a)(c) | | 2,888,656 | 16,032,041 |
| Molecular Templates, Inc. (a) | | 33,358 | 309,562 |
| Momenta Pharmaceuticals, Inc. (a) | | 1,203,956 | 20,527,450 |
| NantKwest, Inc. (a)(b) | | 170,843 | 758,543 |
| Neurocrine Biosciences, Inc. (a) | | 2,060,351 | 173,955,435 |
| NewLink Genetics Corp. (a)(b) | | 536,364 | 3,851,094 |
| Novavax, Inc. (a)(b) | | 3,364,321 | 7,300,577 |
| Novelion Therapeutics, Inc. (a)(b) | | 462,707 | 1,915,607 |
| Opko Health, Inc. (a)(b) | | 217,967 | 738,908 |
| Oragenics, Inc. (a) | | 155,805 | 269,543 |
| OvaScience, Inc. (a) | | 368,191 | 349,671 |
| Ovid Therapeutics, Inc. | | 920,249 | 6,064,441 |
| Portola Pharmaceuticals, Inc. (a) | | 1,217,555 | 51,526,928 |
| Progenics Pharmaceuticals, Inc. (a)(b) | | 1,100,048 | 7,348,321 |
| Protagonist Therapeutics, Inc. (a) | | 622,963 | 10,559,223 |
| Proteostasis Therapeutics, Inc. (a)(b) | | 674,200 | 2,015,858 |
| Prothena Corp. PLC (a)(b) | | 769,935 | 25,939,110 |
| PTC Therapeutics, Inc. (a) | | 897,445 | 23,109,209 |
| Puma Biotechnology, Inc. (a) | | 822,723 | 53,764,948 |
| Radius Health, Inc. (a)(b) | | 1,578,215 | 60,114,209 |
| Regeneron Pharmaceuticals, Inc. (a) | | 570,263 | 182,735,076 |
| REGENXBIO, Inc. (a) | | 1,223,908 | 34,820,183 |
| Regulus Therapeutics, Inc. (a)(b) | | 4,440,151 | 4,928,568 |
| Repligen Corp. (a) | | 719,686 | 24,678,033 |
| Retrophin, Inc. (a) | | 788,810 | 19,736,026 |
| Rigel Pharmaceuticals, Inc. (a) | | 671,200 | 2,523,712 |
| Sage Therapeutics, Inc. (a) | | 926,093 | 149,434,366 |
| Sangamo Therapeutics, Inc. (a) | | 4,157,515 | 99,572,484 |
| Sarepta Therapeutics, Inc. (a) | | 960,503 | 60,290,773 |
| Seattle Genetics, Inc. (a)(b) | | 1,653,890 | 89,310,060 |
| Selecta Biosciences, Inc. (a)(b) | | 330,979 | 3,031,768 |
| Seres Therapeutics, Inc. (a)(c) | | 1,028,440 | 9,770,180 |
| Seres Therapeutics, Inc. (a)(c)(d) | | 1,292,035 | 12,274,333 |
| Sienna Biopharmaceuticals, Inc. | | 208,531 | 3,269,766 |
| Spark Therapeutics, Inc. (a)(b) | | 1,446,320 | 82,584,872 |
| Spectrum Pharmaceuticals, Inc. (a) | | 4,275,590 | 91,967,941 |
| Stemline Therapeutics, Inc. (a)(c) | | 1,795,948 | 30,800,508 |
| Syndax Pharmaceuticals, Inc. (a) | | 394,253 | 3,564,047 |
| Syros Pharmaceuticals, Inc. (a)(b) | | 617,861 | 6,512,255 |
| Syros Pharmaceuticals, Inc. (a)(d) | | 303,621 | 3,200,165 |
| TESARO, Inc. (a)(b) | | 682,107 | 37,672,770 |
| TG Therapeutics, Inc. (a)(b) | | 3,770,611 | 52,788,554 |
| Tocagen, Inc. (b) | | 619,000 | 6,747,100 |
| Trevena, Inc. (a) | | 1,105,549 | 1,978,933 |
| Ultragenyx Pharmaceutical, Inc. (a) | | 1,816,721 | 86,857,431 |
| uniQure B.V. (a) | | 120,957 | 3,074,727 |
| United Therapeutics Corp. (a) | | 153,925 | 17,832,211 |
| Vanda Pharmaceuticals, Inc. (a) | | 1,013,092 | 19,096,784 |
| Vertex Pharmaceuticals, Inc. (a) | | 1,750,208 | 290,587,034 |
| Vital Therapies, Inc. (a)(b) | | 1,549,191 | 8,288,172 |
| Voyager Therapeutics, Inc. (a)(c) | | 2,275,674 | 65,380,114 |
| vTv Therapeutics, Inc. Class A (a) | | 83,453 | 471,509 |
| Xencor, Inc. (a) | | 1,535,143 | 47,021,430 |
| Zafgen, Inc. (a)(c) | | 2,712,346 | 21,319,040 |
| Zealand Pharma A/S (a)(b) | | 400,644 | 6,176,221 |
| | | | 7,912,559,493 |
| Health Care Equipment & Supplies - 0.4% | | | |
| Health Care Equipment - 0.4% | | | |
| Bellerophon Therapeutics, Inc. (a)(b) | | 487,970 | 941,782 |
| Novocure Ltd. (a) | | 646,289 | 13,281,239 |
| Novocure Ltd. (a)(d) | | 701,713 | 14,420,202 |
| Vermillion, Inc. (a)(c) | | 3,594,573 | 5,391,860 |
| | | | 34,035,083 |
| Health Care Providers & Services - 0.2% | | | |
| Health Care Services - 0.2% | | | |
| G1 Therapeutics, Inc. | | 748,700 | 16,913,133 |
| OptiNose, Inc. (b) | | 153,915 | 2,725,835 |
| | | | 19,638,968 |
| Health Care Technology - 0.0% | | | |
| Health Care Technology - 0.0% | | | |
| NantHealth, Inc. (a)(b) | | 107,400 | 324,348 |
| Life Sciences Tools & Services - 0.1% | | | |
| Life Sciences Tools & Services - 0.1% | | | |
| Morphosys AG (a)(b) | | 106,900 | 10,639,502 |
| Personal Products - 0.0% | | | |
| Personal Products - 0.0% | | | |
| MYOS Corp. (a) | | 33,334 | 45,001 |
| Pharmaceuticals - 8.1% | | | |
| Pharmaceuticals - 8.1% | | | |
| Aclaris Therapeutics, Inc. (a) | | 585,786 | 11,680,573 |
| Adimab LLC (e)(f)(g) | | 1,954,526 | 74,956,072 |
| Afferent Pharmaceuticals, Inc. rights 12/31/24 (a)(g) | | 8,274,568 | 8,605,551 |
| Akcea Therapeutics, Inc. | | 610,000 | 10,351,700 |
| Aradigm Corp. (a) | | 148,009 | 167,250 |
| Aradigm Corp. (a)(b) | | 11,945 | 13,498 |
| Avexis, Inc. (a) | | 565,781 | 70,004,083 |
| Axsome Therapeutics, Inc. (a)(b) | | 470,252 | 1,199,143 |
| Clementia Pharmaceuticals, Inc. | | 390,500 | 6,224,570 |
| Corcept Therapeutics, Inc. (a)(b) | | 185,022 | 2,810,484 |
| CymaBay Therapeutics, Inc. (a) | | 497,336 | 7,405,333 |
| Dermira, Inc. (a)(b) | | 677,591 | 17,420,865 |
| Dova Pharmaceuticals, Inc. (b) | | 1,308,850 | 39,605,801 |
| Egalet Corp. (a)(b) | | 297,205 | 224,687 |
| GW Pharmaceuticals PLC ADR (a)(b) | | 268,540 | 30,516,886 |
| Horizon Pharma PLC (a) | | 314,040 | 4,578,703 |
| InflaRx NV (a) | | 2,500 | 65,225 |
| Intra-Cellular Therapies, Inc. (a) | | 721,948 | 13,984,133 |
| Jazz Pharmaceuticals PLC (a) | | 68,813 | 9,964,122 |
| Kala Pharmaceuticals, Inc. | | 468,500 | 6,582,425 |
| Kolltan Pharmaceuticals, Inc. rights (a)(g) | | 10,639,609 | 1,383,149 |
| Melinta Therapeutics, Inc. (a) | | 780,974 | 9,723,126 |
| MyoKardia, Inc. (a) | | 1,152,901 | 67,098,838 |
| Nektar Therapeutics (a) | | 858,558 | 74,316,780 |
| NeurogesX, Inc. (a)(c)(g) | | 2,550,000 | 26 |
| Ocular Therapeutix, Inc. (a)(b)(c) | | 2,394,399 | 12,522,707 |
| Odonate Therapeutics, Inc. (a) | | 655,700 | 17,697,343 |
| Pacira Pharmaceuticals, Inc. (a) | | 111,835 | 3,500,436 |
| Paratek Pharmaceuticals, Inc. (a) | | 984,132 | 12,892,129 |
| Reata Pharmaceuticals, Inc. (a) | | 343,197 | 8,267,616 |
| resTORbio, Inc. (a)(b) | | 454,257 | 8,858,012 |
| Rhythm Pharmaceuticals, Inc. (b) | | 264,945 | 6,848,828 |
| RPI International Holdings LP (a)(f)(g) | | 54,958 | 7,820,523 |
| scPharmaceuticals, Inc. (a) | | 154,500 | 2,470,455 |
| Spero Therapeutics, Inc. (a)(b) | | 622,000 | 6,580,760 |
| Stemcentrx, Inc. rights 12/31/21 (a)(g) | | 876,163 | 2,672,297 |
| The Medicines Company (a)(b) | | 977,308 | 29,925,171 |
| TherapeuticsMD, Inc. (a) | | 3,196,642 | 15,983,210 |
| Theravance Biopharma, Inc. (a)(b) | | 416,300 | 10,973,668 |
| UroGen Pharma Ltd. | | 727,332 | 38,301,303 |
| WAVE Life Sciences (a)(b) | | 730,461 | 37,216,988 |
| Zogenix, Inc. (a) | | 762,002 | 32,308,885 |
| | | | 723,723,354 |
| Software - 0.0% | | | |
| Application Software - 0.0% | | | |
| Precipio, Inc. (f) | | 7,883 | 5,045 |
| TOTAL COMMON STOCKS | | | |
| (Cost $5,564,221,189) | | | 8,700,970,794 |
|
| Preferred Stocks - 2.0% | | | |
| Convertible Preferred Stocks - 1.9% | | | |
| Biotechnology - 1.7% | | | |
| Biotechnology - 1.7% | | | |
| 23andMe, Inc. Series E (a)(f)(g) | | 1,505,457 | 20,902,066 |
| Axcella Health, Inc. Series C (a)(f)(g) | | 1,642,272 | 21,218,154 |
| Immunocore Ltd. Series A (a)(f)(g) | | 73,318 | 26,467,672 |
| Moderna Therapeutics, Inc.: | | | |
| Series D (a)(f)(g) | | 2,074,940 | 20,873,896 |
| Series E (a)(f)(g) | | 2,698,970 | 27,151,638 |
| Scholar Rock LLC Series B (f)(g) | | 4,276,340 | 15,394,824 |
| Translate Bio Series B (a)(f)(g) | | 5,634,091 | 11,155,500 |
| Twist Bioscience Corp.: | | | |
| Series C (a)(f)(g) | | 8,133,875 | 10,818,054 |
| Series D (a)(f)(g) | | 1,976,343 | 2,628,536 |
| | | | 156,610,340 |
| Health Care Technology - 0.2% | | | |
| Health Care Technology - 0.2% | | | |
| Codiak Biosciences, Inc.: | | | |
| Series A (a)(f)(g) | | 856,366 | 3,243,572 |
| Series B (a)(f)(g) | | 2,783,187 | 10,541,599 |
| | | | 13,785,171 |
| Pharmaceuticals - 0.0% | | | |
| Pharmaceuticals - 0.0% | | | |
| Afferent Pharmaceuticals, Inc. Series C (a)(f)(g) | | 8,274,568 | 83 |
|
| TOTAL CONVERTIBLE PREFERRED STOCKS | | | 170,395,594 |
|
| Nonconvertible Preferred Stocks - 0.1% | | | |
| Biotechnology - 0.1% | | | |
| Biotechnology - 0.1% | | | |
| Yumanity Holdings LLC Class A (a)(f)(g) | | 588,700 | 8,124,060 |
| TOTAL PREFERRED STOCKS | | | |
| (Cost $116,260,659) | | | 178,519,654 |
|
| Money Market Funds - 8.1% | | | |
| Fidelity Cash Central Fund, 1.41% (h) | | 53,991,667 | 54,002,465 |
| Fidelity Securities Lending Cash Central Fund 1.42% (h)(i) | | 668,255,777 | 668,322,602 |
| TOTAL MONEY MARKET FUNDS | | | |
| (Cost $722,275,592) | | | 722,325,067 |
| TOTAL INVESTMENT IN SECURITIES - 107.4% | | | |
| (Cost $6,402,757,440) | | | 9,601,815,515 |
| NET OTHER ASSETS (LIABILITIES) - (7.4)% | | | (661,048,627) |
| NET ASSETS - 100% | | | $8,940,766,888 |
Legend
(a) Non-income producing
(b) Security or a portion of the security is on loan at period end.
(c) Affiliated company
(d) Security exempt from registration under Rule 144A of the Securities Act of 1933. These securities may be resold in transactions exempt from registration, normally to qualified institutional buyers. At the end of the period, the value of these securities amounted to $51,372,064 or 0.6% of net assets.
(e) Investment is owned by a wholly-owned subsidiary (Subsidiary) that is treated as a corporation for U.S. tax purposes.
(f) Restricted securities - Investment in securities not registered under the Securities Act of 1933 (excluding 144A issues). At the end of the period, the value of restricted securities (excluding 144A issues) amounted to $261,301,294 or 2.9% of net assets.
(g) Level 3 security
(h) Affiliated fund that is generally available only to investment companies and other accounts managed by Fidelity Investments. The rate quoted is the annualized seven-day yield of the fund at period end. A complete unaudited listing of the fund's holdings as of its most recent quarter end is available upon request. In addition, each Fidelity Central Fund's financial statements, which are not covered by the Fund's Report of Independent Registered Public Accounting Firm, are available on the SEC's website or upon request.
(i) Investment made with cash collateral received from securities on loan.
Additional information on each restricted holding is as follows:
| Security | Acquisition Date | Acquisition Cost |
| 23andMe, Inc. Series E | 6/18/15 | $16,299,991 |
| Adimab LLC | 9/17/14 - 6/5/15 | $31,094,459 |
| Afferent Pharmaceuticals, Inc. Series C | 7/1/15 | $0 |
| Axcella Health, Inc. Series C | 1/30/15 | $16,554,102 |
| Codiak Biosciences, Inc. Series A | 11/12/15 | $856,366 |
| Codiak Biosciences, Inc. Series B | 11/12/15 | $8,349,561 |
| Immunocore Ltd. Series A | 7/27/15 | $13,796,921 |
| Moderna Therapeutics, Inc. Series D | 11/6/13 | $9,158,071 |
| Moderna Therapeutics, Inc. Series E | 12/18/14 | $11,912,324 |
| Precipio, Inc. | 2/3/12 | $2,828,200 |
| RPI International Holdings LP | 5/21/15 | $6,479,548 |
| Scholar Rock LLC Series B | 12/17/15 | $12,829,020 |
| Translate Bio Series B | 7/17/15 | $6,084,818 |
| Twist Bioscience Corp. Series C | 5/29/15 | $12,199,999 |
| Twist Bioscience Corp. Series D | 1/8/16 | $4,240,639 |
| Yumanity Holdings LLC Class A | 2/8/16 | $3,978,847 |
Affiliated Central Funds
Information regarding fiscal year to date income earned by the Fund from investments in Fidelity Central Funds is as follows:
| Fund | Income earned |
| Fidelity Cash Central Fund | $549,105 |
| Fidelity Securities Lending Cash Central Fund | 10,896,293 |
| Total | $11,445,398 |
Amounts in the income column in the above table include any capital gain distributions from underlying funds, which are presented in the corresponding line-item in the Statement of Operations if applicable.
Other Affiliated Issuers
An affiliated company is a company in which the Fund has ownership of at least 5% of the voting securities. Fiscal year to date transactions with companies which are or were affiliates are as follows:
| Affiliate | Value, beginning of period | Purchases | Sales Proceeds | Dividend Income | Realized Gain (loss) | Change in Unrealized appreciation (depreciation) | Value, end of period |
| Acceleron Pharma, Inc. | $98,051,765 | $-- | $73,984,709 | $-- | $(4,992,694) | $47,491,693 | $-- |
| Acorda Therapeutics, Inc. | 62,530,736 | -- | 13,701,996 | -- | (3,409,880) | (1,998,777) | -- |
| Adamas Pharmaceuticals, Inc. | 32,978,322 | 6,640,000 | 23,098,473 | -- | 4,892,064 | 383,624 | -- |
| Alder Biopharmaceuticals, Inc. | 67,312,513 | 3,848,000 | 31,494,862 | -- | (50,464,264) | 21,603,556 | -- |
| Aldeyra Therapeutics, Inc. | 5,663,057 | -- | 325,291 | -- | (215,509) | 3,758,472 | 8,880,729 |
| Allena Pharmaceuticals, Inc. | -- | 8,606,360 | 2,485,459 | -- | (1,487,727) | (2,379,466) | 2,253,708 |
| Allena Pharmaceuticals, Inc. | -- | -- | -- | -- | -- | (6,646,090) | 9,364,232 |
| Arena Pharmaceuticals, Inc. | -- | 57,852,518 | -- | -- | -- | 30,042,251 | 87,894,769 |
| Atara Biotherapeutics, Inc. | 28,569,877 | 16,778,501 | 8,650,464 | -- | (13,606,408) | 53,721,951 | 76,813,457 |
| Avexis, Inc. | 89,004,815 | -- | 75,870,585 | -- | 44,355,533 | 12,514,320 | -- |
| Axsome Therapeutics, Inc. | 6,093,929 | -- | 4,006,037 | -- | (3,815,620) | 2,926,871 | -- |
| Bellicum Pharmaceuticals, Inc. | 12,222,396 | 13,883,147 | 2,875,864 | -- | (3,509,363) | (7,748,128) | 11,972,188 |
| Blueprint Medicines Corp. | 55,635,200 | 20,993,071 | 19,470,578 | -- | 4,457,794 | 86,351,129 | -- |
| Chiasma, Inc. | 2,641,278 | -- | 163,602 | -- | (1,826,742) | 1,756,679 | 2,407,613 |
| Chiasma, Inc. warrants 12/16/24 | 105,173 | -- | -- | -- | -- | (24,503) | 80,670 |
| Cidara Therapeutics, Inc. | 1,051,200 | -- | -- | -- | -- | (73,000) | 978,200 |
| Cidara Therapeutics, Inc. | 7,680,859 | -- | -- | -- | -- | (533,393) | 7,147,466 |
| Corbus Pharmaceuticals Holdings, Inc. | 6,378,300 | 20,962,308 | 1,488,908 | -- | (856,036) | (86,028) | 24,909,636 |
| Cytokinetics, Inc. | 23,813,727 | 3,369,062 | 20,863,409 | -- | 7,010,551 | (3,900,785) | -- |
| Cytokinetics, Inc. warrants 6/25/17 | 3,409,874 | -- | -- | -- | -- | (3,409,874) | -- |
| Egalet Corp. | 10,675,696 | -- | 5,383,982 | -- | (16,733,888) | 11,666,861 | -- |
| Epizyme, Inc. | 81,256,291 | -- | 25,896,420 | -- | (28,327,565) | 43,959,243 | 70,991,549 |
| Fate Therapeutics, Inc. | 7,551,970 | 4,492,872 | -- | -- | -- | 19,546,878 | 31,591,720 |
| Fibrocell Science, Inc. | -- | -- | 1,544,905 | -- | (4,535,695) | -- | -- |
| Fibrocell Science, Inc. | 1,702,568 | -- | -- | -- | -- | 4,378,032 | -- |
| Geron Corp. | 33,988,815 | -- | 1,281,818 | -- | (2,359,101) | 4,684,873 | 35,032,769 |
| Global Blood Therapeutics, Inc. | 68,660,137 | 23,858,821 | 33,748,314 | -- | 23,806,125 | 21,949,261 | -- |
| Histogenics Corp. | 1,891,085 | -- | -- | -- | -- | 1,030,471 | -- |
| Infinity Pharmaceuticals, Inc. | -- | 7,961,514 | -- | -- | -- | (2,709,783) | 5,251,731 |
| Jounce Therapeutics, Inc. | -- | 3,399,730 | 15,352,686 | -- | 6,450,373 | 11,086,105 | -- |
| Jounce Therapeutics, Inc. | 35,864,035 | -- | -- | -- | -- | (19,461,455) | -- |
| Karyopharm Therapeutics, Inc. | 32,829,502 | -- | 2,579,121 | -- | (7,481,444) | 19,909,140 | 42,678,077 |
| Krystal Biotech, Inc. | -- | 9,354,000 | -- | -- | -- | (392,868) | 8,961,132 |
| Kura Oncology, Inc. | 15,816,712 | 21,339,676 | 8,520,044 | -- | 3,819,106 | 21,351,014 | 53,806,464 |
| La Jolla Pharmaceutical Co. | 38,332,223 | 1,652,643 | -- | -- | -- | (3,029,740) | -- |
| Loxo Oncology, Inc. | 86,708,884 | 140,955 | 45,901,667 | -- | 28,880,539 | 80,822,783 | -- |
| Macrogenics, Inc. | 62,162,107 | -- | 8,756,958 | -- | (8,249,340) | 16,711,038 | 61,866,847 |
| Melinta Therapeutics, Inc. | 14,107,872 | -- | 866,620 | -- | (7,516,642) | 3,998,516 | -- |
| Minerva Neurosciences, Inc. | 29,051,873 | 4,115,250 | 3,949,036 | -- | (4,591,866) | (8,085,497) | 16,540,724 |
| Miragen Therapeutics, Inc. | 32,333,809 | 2,322,700 | -- | -- | -- | (18,624,468) | 16,032,041 |
| MyoKardia, Inc. | 32,129,339 | 3,135,912 | 25,531,069 | -- | 9,613,752 | 47,750,904 | -- |
| NeurogesX, Inc. | 26 | -- | -- | -- | -- | -- | 26 |
| Ocular Therapeutix, Inc. | 9,286,824 | 7,527,258 | 1,171,506 | -- | (3,944,376) | 824,507 | 12,522,707 |
| Paratek Pharmaceuticals, Inc. | 19,671,688 | 1,920,730 | 10,151,041 | -- | 4,952,270 | (3,501,518) | -- |
| Radius Health, Inc. | 133,725,306 | -- | 54,430,613 | -- | (9,087,193) | (10,093,291) | -- |
| Seres Therapeutics, Inc. | 9,955,299 | -- | -- | -- | -- | (185,119) | 9,770,180 |
| Seres Therapeutics, Inc. | 12,506,899 | -- | -- | -- | -- | (232,566) | 12,274,333 |
| Stemline Therapeutics, Inc. | 14,228,893 | 5,277,999 | 6,897,257 | -- | (1,895,157) | 20,086,030 | 30,800,508 |
| Syndax Pharmaceuticals, Inc. | 11,352,881 | 930,086 | 7,190,427 | -- | (2,181,480) | 652,987 | -- |
| TG Therapeutics, Inc. | 16,717,918 | 21,596,708 | 10,498,901 | -- | (10,701,766) | 35,674,595 | -- |
| UroGen Pharma Ltd. | -- | 15,505,572 | 2,578,443 | -- | 1,769,843 | 23,604,331 | -- |
| Vermillion, Inc. | 9,842,132 | -- | 1,015,137 | -- | (290,399) | (3,144,736) | 5,391,860 |
| Versartis, Inc. | 58,725,590 | -- | 14,194,539 | -- | (41,519,699) | (3,011,352) | -- |
| Vital Therapies, Inc. | 5,541,828 | 4,712,000 | 4,375,781 | -- | (137,519) | 2,547,644 | -- |
| Voyager Therapeutics, Inc. | 34,640,913 | -- | 5,414,404 | -- | (187,213) | 36,340,818 | 65,380,114 |
| WAVE Life Sciences | 42,795,006 | -- | 17,321,632 | -- | 7,223,542 | 4,520,072 | -- |
| Zafgen, Inc. | 10,768,014 | -- | -- | -- | -- | 10,551,026 | 21,319,040 |
| Zosano Pharma Corp. | 3,155,743 | -- | 791,661 | -- | (9,222,398) | 6,858,316 | -- |
| Total | $1,481,120,899 | $292,177,393 | $593,824,219 | $-- | $(95,915,492) | $611,783,554 | $732,914,490 |
Investment Valuation
The following is a summary of the inputs used, as of February 28, 2018, involving the Fund's assets and liabilities carried at fair value. The inputs or methodology used for valuing securities may not be an indication of the risk associated with investing in those securities. For more information on valuation inputs, and their aggregation into the levels used below, please refer to the Investment Valuation section in the accompanying Notes to Financial Statements.
| | Valuation Inputs at Reporting Date: |
| Description | Total | Level 1 | Level 2 | Level 3 |
| Investments in Securities: | | | | |
| Common Stocks | $8,700,970,794 | $8,561,472,720 | $44,060,456 | $95,437,618 |
| Preferred Stocks | 178,519,654 | -- | -- | 178,519,654 |
| Money Market Funds | 722,325,067 | 722,325,067 | -- | -- |
| Total Investments in Securities: | $9,601,815,515 | $9,283,797,787 | $44,060,456 | $273,957,272 |
The following is a summary of transfers between Level 1 and Level 2 for the period ended February 28, 2018. Transfers are assumed to have occurred at the beginning of the period, and are primarily attributable to the valuation techniques used for foreign equity securities, as discussed in the accompanying Notes to Financial Statements:
| Transfers | Total |
| Level 1 to Level 2 | $77,956,600 |
| Level 2 to Level 1 | $60,311,512 |
The following is a reconciliation of Investments in Securities and Derivative Instruments for which Level 3 inputs were used in determining value:
| Investments in Securities: | |
| Other Investments in Securities | |
| Beginning Balance | $67,962,514 |
| Total Realized Gain (Loss) | -- |
| Total Unrealized Gain (Loss) | 27,456,275 |
| Cost of Purchases | 18,829 |
| Proceeds of Sales | -- |
| Amortization/Accretion | -- |
| Transfers in to Level 3 | -- |
| Transfers out of Level 3 | -- |
| Ending Balance | $95,437,618 |
| The change in unrealized gain (loss) for the period attributable to Level 3 securities held at February 28, 2018 | $27,456,276 |
| Preferred Stocks | |
| Beginning Balance | $178,837,945 |
| Total Realized Gain (Loss) | 792,131 |
| Total Unrealized Gain (Loss) | 25,889,809 |
| Cost of Purchases | 12,829,020 |
| Proceeds of Sales | (39,829,251) |
| Amortization/Accretion | -- |
| Transfers in to Level 3 | -- |
| Transfers out of Level 3 | -- |
| Ending Balance | $178,519,654 |
| The change in unrealized gain (loss) for the period attributable to Level 3 securities held at February 28, 2018 | $21,673,733 |
The information used in the above reconciliations represents fiscal year to date activity for any Investments in Securities identified as using Level 3 inputs at either the beginning or the end of the current fiscal period. Transfers in or out of Level 3 represent the beginning value of any Security or Instrument where a change in the pricing level occurred from the beginning to the end of the period. The cost of purchases and the proceeds of sales may include securities received or delivered through corporate actions or exchanges.
See accompanying notes which are an integral part of the financial statements.
Biotechnology Portfolio
Financial Statements
Statement of Assets and Liabilities
| | | February 28, 2018 |
| Assets | | |
Investment in securities, at value (including securities loaned of $623,660,149) — See accompanying schedule:
Unaffiliated issuers (cost $4,942,510,701) | $8,146,575,958 | |
| Fidelity Central Funds (cost $722,275,592) | 722,325,067 | |
| Other affiliated issuers (cost $737,971,147) | 732,914,490 | |
| Total Investment in Securities (cost $6,402,757,440) | | $9,601,815,515 |
| Cash | | 1,040,191 |
| Restricted cash | | 15,576 |
| Receivable for investments sold | | 20,492,073 |
| Receivable for fund shares sold | | 4,467,411 |
| Dividends receivable | | 3,993,590 |
| Distributions receivable from Fidelity Central Funds | | 865,156 |
| Prepaid expenses | | 31,791 |
| Other receivables | | 845,064 |
| Total assets | | 9,633,566,367 |
| Liabilities | | |
| Payable for investments purchased | $11,360,163 | |
| Payable for fund shares redeemed | 6,864,707 | |
| Accrued management fee | 4,036,344 | |
| Other affiliated payables | 1,277,117 | |
| Other payables and accrued expenses | 1,076,116 | |
| Collateral on securities loaned | 668,185,032 | |
| Total liabilities | | 692,799,479 |
| Net Assets | | $8,940,766,888 |
| Net Assets consist of: | | |
| Paid in capital | | $5,434,534,530 |
| Accumulated net investment loss | | (2,099,767) |
| Accumulated undistributed net realized gain (loss) on investments and foreign currency transactions | | 309,264,998 |
| Net unrealized appreciation (depreciation) on investments and assets and liabilities in foreign currencies | | 3,199,067,127 |
| Net Assets, for 38,130,517 shares outstanding | | $8,940,766,888 |
| Net Asset Value, offering price and redemption price per share ($8,940,766,888 ÷ 38,130,517 shares) | | $234.48 |
See accompanying notes which are an integral part of the financial statements.
Statement of Operations
| | | Year ended February 28, 2018 |
| Investment Income | | |
| Dividends | | $33,500,675 |
| Income from Fidelity Central Funds (including $10,896,293 from security lending) | | 11,445,398 |
| Total income | | 44,946,073 |
| Expenses | | |
| Management fee | $50,165,571 | |
| Transfer agent fees | 15,327,982 | |
| Accounting and security lending fees | 1,475,112 | |
| Custodian fees and expenses | 225,741 | |
| Independent trustees' fees and expenses | 201,239 | |
| Registration fees | 108,117 | |
| Audit | 107,841 | |
| Legal | 122,109 | |
| Miscellaneous | 347,903 | |
| Total expenses before reductions | 68,081,615 | |
| Expense reductions | (388,617) | 67,692,998 |
| Net investment income (loss) | | (22,746,925) |
| Realized and Unrealized Gain (Loss) | | |
| Net realized gain (loss) on: | | |
| Investment securities: | | |
| Unaffiliated issuers | 735,176,699 | |
| Fidelity Central Funds | 54,287 | |
| Other affiliated issuers | (95,915,492) | |
| Foreign currency transactions | 25,850 | |
| Total net realized gain (loss) | | 639,341,344 |
| Change in net unrealized appreciation (depreciation) on: | | |
| Investment securities: | | |
| Unaffiliated issuers | 189,567,634 | |
| Fidelity Central Funds | (155,310) | |
| Other affiliated issuers | 611,783,554 | |
| Assets and liabilities in foreign currencies | (4,654) | |
| Total change in net unrealized appreciation (depreciation) | | 801,191,224 |
| Net gain (loss) | | 1,440,532,568 |
| Net increase (decrease) in net assets resulting from operations | | $1,417,785,643 |
See accompanying notes which are an integral part of the financial statements.
Statement of Changes in Net Assets
| | Year ended February 28, 2018 | Year ended February 28, 2017 |
| Increase (Decrease) in Net Assets | | |
| Operations | | |
| Net investment income (loss) | $(22,746,925) | $(42,688,123) |
| Net realized gain (loss) | 639,341,344 | (142,401,947) |
| Change in net unrealized appreciation (depreciation) | 801,191,224 | 2,691,756,572 |
| Net increase (decrease) in net assets resulting from operations | 1,417,785,643 | 2,506,666,502 |
| Distributions to shareholders from net realized gain | (123,724,434) | (351,244,588) |
| Share transactions | | |
| Proceeds from sales of shares | 1,080,604,327 | 1,517,002,797 |
| Reinvestment of distributions | 117,018,605 | 335,307,225 |
| Cost of shares redeemed | (3,124,598,001) | (4,158,007,769) |
| Net increase (decrease) in net assets resulting from share transactions | (1,926,975,069) | (2,305,697,747) |
| Redemption fees | – | 358,003 |
| Total increase (decrease) in net assets | (632,913,860) | (149,917,830) |
| Net Assets | | |
| Beginning of period | 9,573,680,748 | 9,723,598,578 |
| End of period | $8,940,766,888 | $9,573,680,748 |
| Other Information | | |
| Accumulated net investment loss end of period | $(2,099,767) | $(3,400,876) |
| Shares | | |
| Sold | 4,983,293 | 8,341,359 |
| Issued in reinvestment of distributions | 541,402 | 1,903,424 |
| Redeemed | (14,506,475) | (23,151,337) |
| Net increase (decrease) | (8,981,780) | (12,906,554) |
See accompanying notes which are an integral part of the financial statements.
Financial Highlights
Biotechnology Portfolio
| | | | | | |
| Years ended February 28, | 2018 | 2017 | 2016 A | 2015 | 2014 |
| Selected Per–Share Data | | | | | |
| Net asset value, beginning of period | $203.21 | $162.01 | $248.00 | $221.45 | $120.51 |
| Income from Investment Operations | | | | | |
| Net investment income (loss)B | (.53) | (.78) | (.95) | (.87) | (.54) |
| Net realized and unrealized gain (loss) | 34.90 | 47.93 | (69.22) | 51.24 | 101.91 |
| Total from investment operations | 34.37 | 47.15 | (70.17) | 50.37 | 101.37 |
| Distributions from net realized gain | (3.10) | (5.96) | (15.84) | (23.84) | (.46) |
| Total distributions | (3.10) | (5.96) | (15.84) | (23.84) | (.46) |
| Redemption fees added to paid in capital | – | .01B | .02B | .02B | .03B |
| Net asset value, end of period | $234.48 | $203.21 | $162.01 | $248.00 | $221.45 |
| Total ReturnC | 17.04% | 29.67% | (30.35)% | 24.21% | 84.25% |
| Ratios to Average Net AssetsD,E | | | | | |
| Expenses before reductions | .74% | .75% | .73% | .74% | .76% |
| Expenses net of fee waivers, if any | .74% | .75% | .73% | .74% | .76% |
| Expenses net of all reductions | .73% | .74% | .73% | .74% | .75% |
| Net investment income (loss) | (.25)% | (.43)% | (.39)% | (.41)% | (.32)% |
| Supplemental Data | | | | | |
| Net assets, end of period (000 omitted) | $8,940,767 | $9,573,681 | $9,723,599 | $13,277,052 | $11,033,313 |
| Portfolio turnover rateF | 26% | 28% | 35% | 61% | 35% |
A For the year ended February 29.
B Calculated based on average shares outstanding during the period.
C Total returns would have been lower if certain expenses had not been reduced during the applicable periods shown.
D Fees and expenses of any underlying Fidelity Central Funds are not included in the Fund's expense ratio. The Fund indirectly bears its proportionate share of the expenses of any underlying Fidelity Central Funds.
E Expense ratios reflect operating expenses of the Fund. Expenses before reductions do not reflect amounts reimbursed by the investment adviser or reductions from brokerage service arrangements or reductions from other expense offset arrangements and do not represent the amount paid by the Fund during periods when reimbursements or reductions occur. Expenses net of fee waivers reflect expenses after reimbursement by the investment adviser but prior to reductions from brokerage service arrangements or other expense offset arrangements. Expenses net of all reductions represent the net expenses paid by the Fund.
F Amount does not include the portfolio activity of any underlying Fidelity Central Funds.
See accompanying notes which are an integral part of the financial statements.
Health Care Portfolio
Performance: The Bottom Line
Average annual total return reflects the change in the value of an investment, assuming reinvestment of distributions from dividend income and capital gains (the profits earned upon the sale of securities that have grown in value, if any) and assuming a constant rate of performance each year. The hypothetical investment and the average annual total returns do not reflect the deduction of taxes that a shareholder would pay on fund distributions or the redemption of fund shares. During periods of reimbursement by Fidelity, a fund’s total return will be greater than it would be had the reimbursement not occurred. How a fund did yesterday is no guarantee of how it will do tomorrow.
Average Annual Total Returns
| For the periods ended February 28, 2018 | Past 1 year | Past 5 years | Past 10 years |
| Health Care Portfolio | 15.49% | 19.13% | 14.53% |
$10,000 Over 10 Years
Let's say hypothetically that $10,000 was invested in Health Care Portfolio on February 29, 2008.
The chart shows how the value of your investment would have changed, and also shows how the S&P 500® Index performed over the same period.
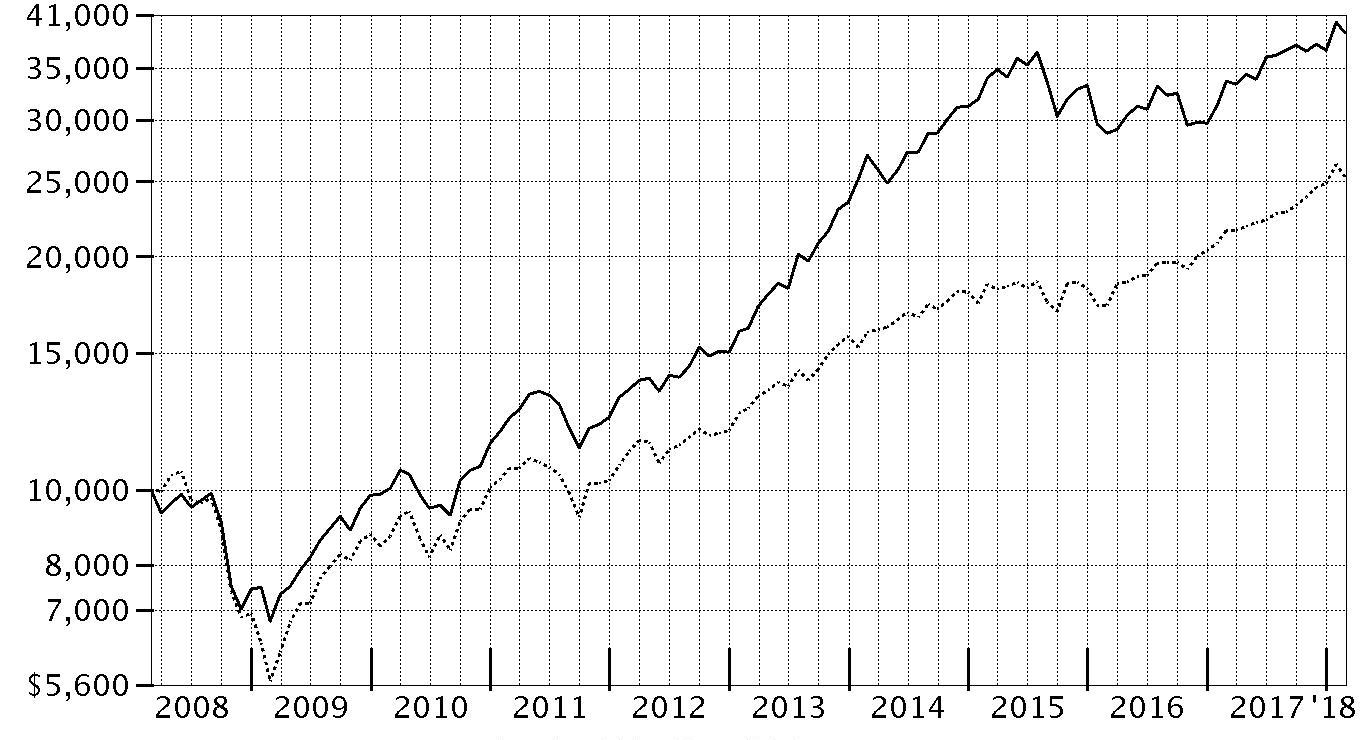
| Period Ending Values |
| $38,835 | Health Care Portfolio |
| $25,307 | S&P 500® Index |
Health Care Portfolio
Management's Discussion of Fund Performance
Market Recap: U.S. equities gained 17.10% for the 12 months ending February 28, 2018, as the S&P 500
® index moved steadily higher throughout 2017 and into 2018 until sharply reversing course in February. The drop was in stark contrast to the low volatility seen throughout 2017, along with consumer sentiment and other market indicators that stayed positive. Investors remained decidedly upbeat as the calendar turned, and the index rose 5.73% in January. February was a decidedly different story, though, as volatility spiked amid fear that rising inflation and the potential for the economy to overheat would prompt the U.S. Federal Reserve to pick up the pace of interest rate hikes. The index returned -3.69% for the month, its first negative result since October 2016. For the full 12 months, growth stocks handily topped value, while large-caps bested small-caps. By sector, information technology fared best by far, gaining 36% amid strong earnings growth from several major index constituents. Consumer discretionary (+22%) also stood out, driven by retailers. Financials added 20%, riding the uptick in bond yields. Materials and industrials rose about 16% each, boosted by higher demand, especially from China. Conversely, notable laggards included the defensive telecommunication services (-5%) and utilities (-2%) sectors, while rising rates held back real estate (-3%).
Comments from Portfolio Manager Eddie Yoon: For the year, the fund gained 15.49%, in line with the 15.48% result of the MSCI U.S. IMI Health Care 25/50 Index but behind the broader S&P 500
®. The sector lagged the broad market, weighed down in part by the largest MSCI index segment, pharmaceuticals, as focus shifted again to drug pricing after President Trump made critical remarks about prescription-drug costs. Still, health care firms generally exhibited solid balance sheets, fair stock valuations and rising demand for their products and services. Versus the MSCI sector index, positive sub-industry allocations largely were counterbalanced by negative stock selection. Our top individual contribution came from largely avoiding Merck, as large-cap pharma firms generally underperformed. Conversely, it hurt most to not own global biotech and index constituent AbbVie, which was lifted by good news related to its rheumatoid arthritis blockbuster Humira
®.
The views expressed above reflect those of the portfolio manager(s) only through the end of the period as stated on the cover of this report and do not necessarily represent the views of Fidelity or any other person in the Fidelity organization. Any such views are subject to change at any time based upon market or other conditions and Fidelity disclaims any responsibility to update such views. These views may not be relied on as investment advice and, because investment decisions for a Fidelity fund are based on numerous factors, may not be relied on as an indication of trading intent on behalf of any Fidelity fund.
Note to shareholders: On December 8, 2017, shareholders approved proposals from the Board of Trustees to eliminate each sector/industry fund's fundamental “invests primarily” policy and to modify the fundamental concentration policy for certain funds. The changes took effect on January 1, 2018, and do not impact how the funds are managed.
Health Care Portfolio
Investment Summary (Unaudited)
Top Ten Stocks as of February 28, 2018
| | % of fund's net assets |
| UnitedHealth Group, Inc. | 8.7 |
| Becton, Dickinson & Co. | 6.4 |
| Amgen, Inc. | 5.9 |
| Boston Scientific Corp. | 5.1 |
| Humana, Inc. | 4.7 |
| Cigna Corp. | 3.6 |
| AstraZeneca PLC (United Kingdom) | 2.8 |
| Vertex Pharmaceuticals, Inc. | 2.8 |
| Biogen, Inc. | 2.6 |
| Roche Holding AG (participation certificate) | 2.4 |
| | 45.0 |
Top Industries (% of fund's net assets)
| As of February 28, 2018 |
| | Biotechnology | 32.0% |
| | Health Care Equipment & Supplies | 24.0% |
| | Health Care Providers & Services | 20.5% |
| | Pharmaceuticals | 15.9% |
| | Health Care Technology | 3.9% |
| | All Others* | 3.7% |
* Includes short-term investments and net other assets (liabilities).
Health Care Portfolio
Schedule of Investments February 28, 2018
Showing Percentage of Net Assets
| Common Stocks - 98.2% | | | |
| | | Shares | Value |
| Biotechnology - 31.5% | | | |
| Biotechnology - 31.5% | | | |
| Abeona Therapeutics, Inc. (a)(b) | | 1,400,000 | $19,390,000 |
| Ablynx NV (a)(b) | | 909,711 | 48,377,959 |
| AC Immune SA (a)(b) | | 1,000,000 | 10,570,000 |
| Acceleron Pharma, Inc. (a) | | 550,000 | 23,061,500 |
| Acorda Therapeutics, Inc. (a) | | 1,050,000 | 24,937,500 |
| Alexion Pharmaceuticals, Inc. (a) | | 1,280,000 | 150,336,000 |
| Alnylam Pharmaceuticals, Inc. (a) | | 650,000 | 78,104,000 |
| Amgen, Inc. | | 2,229,270 | 409,672,948 |
| AnaptysBio, Inc. (a) | | 480,000 | 58,924,800 |
| Argenx SE ADR | | 500,000 | 38,315,000 |
| Ascendis Pharma A/S sponsored ADR (a) | | 900,000 | 55,971,000 |
| Atara Biotherapeutics, Inc. (a) | | 1,040,000 | 40,066,000 |
| Audentes Therapeutics, Inc. (a) | | 690,000 | 23,246,100 |
| BeiGene Ltd. ADR (a) | | 500,000 | 71,735,000 |
| Biogen, Inc. (a) | | 625,000 | 180,618,750 |
| BioMarin Pharmaceutical, Inc. (a) | | 400,288 | 32,491,377 |
| bluebird bio, Inc. (a) | | 248,454 | 49,939,254 |
| Blueprint Medicines Corp. (a) | | 913,400 | 79,063,904 |
| Cellectis SA sponsored ADR (a) | | 688,500 | 21,494,970 |
| CytomX Therapeutics, Inc. (a) | | 445,477 | 13,235,122 |
| Five Prime Therapeutics, Inc. (a) | | 478,900 | 10,181,414 |
| Global Blood Therapeutics, Inc. (a) | | 330,000 | 19,354,500 |
| GlycoMimetics, Inc. (a)(b) | | 791,527 | 18,213,036 |
| Heron Therapeutics, Inc. (a)(b) | | 842,100 | 17,136,735 |
| Insmed, Inc. (a) | | 2,722,226 | 65,905,091 |
| Intercept Pharmaceuticals, Inc. (a) | | 356,200 | 21,275,826 |
| La Jolla Pharmaceutical Co. (a) | | 441,617 | 13,716,624 |
| Loxo Oncology, Inc. (a) | | 340,000 | 37,814,800 |
| Momenta Pharmaceuticals, Inc. (a) | | 72,907 | 1,243,064 |
| Neurocrine Biosciences, Inc. (a) | | 1,120,397 | 94,595,119 |
| Prothena Corp. PLC (a) | | 418,350 | 14,094,212 |
| Sage Therapeutics, Inc. (a) | | 13,400 | 2,162,224 |
| Sarepta Therapeutics, Inc. (a)(b) | | 1,500,000 | 94,155,000 |
| Spark Therapeutics, Inc. (a) | | 720,000 | 41,112,000 |
| TESARO, Inc. (a)(b) | | 900,000 | 49,707,000 |
| uniQure B.V. (a) | | 475,704 | 12,092,396 |
| Vertex Pharmaceuticals, Inc. (a) | | 1,160,000 | 192,594,800 |
| Xencor, Inc. (a) | | 1,096,512 | 33,586,163 |
| Zai Lab Ltd. ADR (b) | | 660,000 | 14,619,000 |
| | | | 2,183,110,188 |
| Diversified Consumer Services - 0.3% | | | |
| Specialized Consumer Services - 0.3% | | | |
| Carriage Services, Inc. | | 708,400 | 19,282,648 |
| Food & Staples Retailing - 1.4% | | | |
| Drug Retail - 1.4% | | | |
| CVS Health Corp. | | 1,400,000 | 94,822,000 |
| Health Care Equipment & Supplies - 23.9% | | | |
| Health Care Equipment - 23.9% | | | |
| Atricure, Inc. (a) | | 1,630,000 | 28,802,100 |
| Baxter International, Inc. | | 1,900,000 | 128,801,000 |
| Becton, Dickinson & Co. | | 2,000,000 | 444,040,000 |
| Boston Scientific Corp. (a) | | 12,980,000 | 353,834,800 |
| Danaher Corp. | | 640,000 | 62,579,200 |
| DexCom, Inc. (a)(b) | | 1,147,600 | 64,426,264 |
| Genmark Diagnostics, Inc. (a) | | 2,697,037 | 11,111,792 |
| Insulet Corp. (a) | | 1,183,494 | 88,868,564 |
| Integra LifeSciences Holdings Corp. (a) | | 1,500,000 | 79,095,000 |
| Intuitive Surgical, Inc. (a) | | 320,000 | 136,464,000 |
| Penumbra, Inc. (a) | | 700,000 | 75,740,000 |
| Stryker Corp. | | 750,000 | 121,620,000 |
| Wright Medical Group NV (a) | | 3,000,000 | 61,050,000 |
| | | | 1,656,432,720 |
| Health Care Providers & Services - 20.4% | | | |
| Health Care Distributors & Services - 0.8% | | | |
| Amplifon SpA | | 1,200,000 | 19,067,611 |
| EBOS Group Ltd. | | 3,049,520 | 39,037,820 |
| | | | 58,105,431 |
| Health Care Facilities - 1.3% | | | |
| HCA Holdings, Inc. | | 880,000 | 87,340,000 |
| Health Care Services - 1.3% | | | |
| Diplomat Pharmacy, Inc. (a) | | 400,000 | 8,336,000 |
| G1 Therapeutics, Inc. | | 800,000 | 18,072,000 |
| Premier, Inc. (a) | | 1,000,000 | 33,150,000 |
| United Drug PLC (United Kingdom) | | 2,720,000 | 31,137,218 |
| | | | 90,695,218 |
| Managed Health Care - 17.0% | | | |
| Cigna Corp. | | 1,280,000 | 250,739,200 |
| Humana, Inc. | | 1,200,000 | 326,184,000 |
| UnitedHealth Group, Inc. | | 2,640,000 | 597,062,401 |
| | | | 1,173,985,601 |
|
| TOTAL HEALTH CARE PROVIDERS & SERVICES | | | 1,410,126,250 |
|
| Health Care Technology - 3.9% | | | |
| Health Care Technology - 3.9% | | | |
| athenahealth, Inc. (a) | | 250,000 | 34,935,000 |
| Castlight Health, Inc. (a) | | 1,875,650 | 6,658,558 |
| Castlight Health, Inc. Class B (a)(b) | | 3,024,077 | 10,735,473 |
| Cerner Corp. (a) | | 1,500,000 | 96,240,000 |
| Medidata Solutions, Inc. (a) | | 350,000 | 22,981,000 |
| Teladoc, Inc. (a)(b) | | 2,400,000 | 96,240,000 |
| | | | 267,790,031 |
| Internet Software & Services - 0.6% | | | |
| Internet Software & Services - 0.6% | | | |
| Benefitfocus, Inc. (a)(b)(c) | | 1,794,000 | 43,414,800 |
| Life Sciences Tools & Services - 0.3% | | | |
| Life Sciences Tools & Services - 0.3% | | | |
| Agilent Technologies, Inc. | | 280,000 | 19,205,200 |
| Pharmaceuticals - 15.9% | | | |
| Pharmaceuticals - 15.9% | | | |
| Allergan PLC | | 500,000 | 77,110,000 |
| AstraZeneca PLC (United Kingdom) | | 3,000,000 | 196,356,789 |
| Avexis, Inc. (a) | | 130,000 | 16,084,900 |
| Bristol-Myers Squibb Co. | | 2,100,000 | 139,020,000 |
| CymaBay Therapeutics, Inc. (a) | | 1,743,000 | 25,953,270 |
| Dechra Pharmaceuticals PLC | | 2,151,100 | 74,130,428 |
| Impax Laboratories, Inc. (a) | | 330,000 | 6,732,000 |
| Indivior PLC (a) | | 6,600,000 | 34,272,745 |
| Jazz Pharmaceuticals PLC (a) | | 145,000 | 20,996,000 |
| Jiangsu Hengrui Medicine Co. Ltd. (A Shares) | | 4,400,000 | 50,316,370 |
| Mylan NV (a) | | 500,000 | 20,160,000 |
| MyoKardia, Inc. (a) | | 300,000 | 17,460,000 |
| Nektar Therapeutics (a) | | 1,430,000 | 123,780,800 |
| Roche Holding AG (participation certificate) | | 720,000 | 166,305,600 |
| RPI International Holdings LP (a)(d)(e) | | 199,753 | 28,424,852 |
| The Medicines Company (a)(b) | | 1,083,600 | 33,179,832 |
| TherapeuticsMD, Inc. (a)(b) | | 3,000,000 | 15,000,000 |
| Theravance Biopharma, Inc. (a)(b) | | 1,337,166 | 35,247,696 |
| Tonghua Dongbao Pharmaceutical Co. Ltd. Class A | | 5,999,957 | 22,136,245 |
| | | | 1,102,667,527 |
| TOTAL COMMON STOCKS | | | |
| (Cost $4,957,434,125) | | | 6,796,851,364 |
|
| Convertible Preferred Stocks - 1.2% | | | |
| Biotechnology - 0.5% | | | |
| Biotechnology - 0.5% | | | |
| 10X Genomics, Inc. Series C (a)(d)(e) | | 2,958,778 | 18,817,828 |
| BioNTech AG Series A (d)(e) | | 78,748 | 17,536,124 |
| | | | 36,353,952 |
| Health Care Equipment & Supplies - 0.1% | | | |
| Health Care Equipment - 0.1% | | | |
| Shockwave Medical, Inc. Series C (d)(e) | | 7,425,890 | 7,500,000 |
| Health Care Providers & Services - 0.1% | | | |
| Health Care Services - 0.1% | | | |
| 1Life Healthcare, Inc. Series G (a)(d)(e) | | 1,639,892 | 10,642,899 |
| Software - 0.3% | | | |
| Application Software - 0.3% | | | |
| Outset Medical, Inc. Series B (a)(d)(e) | | 8,159,125 | 18,602,805 |
| Textiles, Apparel & Luxury Goods - 0.2% | | | |
| Textiles - 0.2% | | | |
| Generation Bio Series B (d)(e) | | 130,800 | 1,196,258 |
| Harmony Biosciences II, Inc. Series A (d)(e) | | 10,935,215 | 10,935,215 |
| | | | 12,131,473 |
| TOTAL CONVERTIBLE PREFERRED STOCKS | | | |
| (Cost $79,427,965) | | | 85,231,129 |
|
| Money Market Funds - 4.5% | | | |
| Fidelity Cash Central Fund, 1.41% (f) | | 66,088,332 | 66,101,550 |
| Fidelity Securities Lending Cash Central Fund 1.42% (f)(g) | | 245,849,537 | 245,874,122 |
| TOTAL MONEY MARKET FUNDS | | | |
| (Cost $311,971,288) | | | 311,975,672 |
| TOTAL INVESTMENT IN SECURITIES - 103.9% | | | |
| (Cost $5,348,833,378) | | | 7,194,058,165 |
| NET OTHER ASSETS (LIABILITIES) - (3.9)% | | | (270,653,728) |
| NET ASSETS - 100% | | | $6,923,404,437 |
Legend
(a) Non-income producing
(b) Security or a portion of the security is on loan at period end.
(c) Affiliated company
(d) Level 3 security
(e) Restricted securities - Investment in securities not registered under the Securities Act of 1933 (excluding 144A issues). At the end of the period, the value of restricted securities (excluding 144A issues) amounted to $113,655,981 or 1.6% of net assets.
(f) Affiliated fund that is generally available only to investment companies and other accounts managed by Fidelity Investments. The rate quoted is the annualized seven-day yield of the fund at period end. A complete unaudited listing of the fund's holdings as of its most recent quarter end is available upon request. In addition, each Fidelity Central Fund's financial statements, which are not covered by the Fund's Report of Independent Registered Public Accounting Firm, are available on the SEC's website or upon request.
(g) Investment made with cash collateral received from securities on loan.
Additional information on each restricted holding is as follows:
| Security | Acquisition Date | Acquisition Cost |
| 10X Genomics, Inc. Series C | 2/23/16 - 4/3/17 | $13,250,000 |
| 1Life Healthcare, Inc. Series G | 4/10/14 | $10,800,001 |
| BioNTech AG Series A | 12/29/17 | $17,246,491 |
| Generation Bio Series B | 2/21/18 | $1,196,258 |
| Harmony Biosciences II, Inc. Series A | 9/22/17 | $10,935,215 |
| Outset Medical, Inc. Series B | 5/5/15 | $18,500,000 |
| RPI International Holdings LP | 5/21/15 - 3/23/16 | $26,504,031 |
| Shockwave Medical, Inc. Series C | 9/27/17 | $7,500,000 |
Affiliated Central Funds
Information regarding fiscal year to date income earned by the Fund from investments in Fidelity Central Funds is as follows:
| Fund | Income earned |
| Fidelity Cash Central Fund | $894,391 |
| Fidelity Securities Lending Cash Central Fund | 3,016,199 |
| Total | $3,910,590 |
Amounts in the income column in the above table include any capital gain distributions from underlying funds, which are presented in the corresponding line-item in the Statement of Operations if applicable.
Other Affiliated Issuers
An affiliated company is a company in which the Fund has ownership of at least 5% of the voting securities. Fiscal year to date transactions with companies which are or were affiliates are as follows:
| Affiliate | Value, beginning of period | Purchases | Sales Proceeds | Dividend Income | Realized Gain (loss) | Change in Unrealized appreciation (depreciation) | Value, end of period |
| Benefitfocus, Inc. | $26,550,000 | $23,720,560 | $-- | $-- | $-- | $(6,855,760) | $43,414,800 |
| Genmark Diagnostics, Inc. | 28,300,000 | 2,299,258 | -- | -- | -- | (19,487,466) | -- |
| Total | $54,850,000 | $26,019,818 | $-- | $-- | $-- | $(26,343,226) | $43,414,800 |
Investment Valuation
The following is a summary of the inputs used, as of February 28, 2018, involving the Fund's assets and liabilities carried at fair value. The inputs or methodology used for valuing securities may not be an indication of the risk associated with investing in those securities. For more information on valuation inputs, and their aggregation into the levels used below, please refer to the Investment Valuation section in the accompanying Notes to Financial Statements.
| | Valuation Inputs at Reporting Date: |
| Description | Total | Level 1 | Level 2 | Level 3 |
| Investments in Securities: | | | | |
| Common Stocks | $6,796,851,364 | $6,126,325,547 | $642,100,965 | $28,424,852 |
| Convertible Preferred Stocks | 85,231,129 | -- | -- | 85,231,129 |
| Money Market Funds | 311,975,672 | 311,975,672 | -- | -- |
| Total Investments in Securities: | $7,194,058,165 | $6,438,301,219 | $642,100,965 | $113,655,981 |
The following is a summary of transfers between Level 1 and Level 2 for the period ended February 28, 2018. Transfers are assumed to have occurred at the beginning of the period, and are primarily attributable to the valuation techniques used for foreign equity securities, as discussed in the accompanying Notes to Financial Statements:
| Transfers | Total |
| Level 1 to Level 2 | $135,215,175 |
| Level 2 to Level 1 | $0 |
The following is a reconciliation of Investments in Securities and Derivative Instruments for which Level 3 inputs were used in determining value:
| Investments in Securities: | |
| Other Investments in Securities | |
| Beginning Balance | $26,262,526 |
| Total Realized Gain (Loss) | -- |
| Total Unrealized Gain (Loss) | 2,162,326 |
| Cost of Purchases | -- |
| Proceeds of Sales | -- |
| Amortization/Accretion | -- |
| Transfers in to Level 3 | -- |
| Transfers out of Level 3 | -- |
| Ending Balance | $28,424,852 |
| The change in unrealized gain (loss) for the period attributable to Level 3 securities held at February 28, 2018 | $2,162,326 |
| Convertible Preferred Stocks | |
| Beginning Balance | $40,759,905 |
| Total Realized Gain (Loss) | -- |
| Total Unrealized Gain (Loss) | 4,343,260 |
| Cost of Purchases | 40,127,964 |
| Proceeds of Sales | -- |
| Amortization/Accretion | -- |
| Transfers in to Level 3 | -- |
| Transfers out of Level 3 | -- |
| Ending Balance | $85,231,129 |
| The change in unrealized gain (loss) for the period attributable to Level 3 securities held at February 28, 2018 | $4,343,260 |
The information used in the above reconciliations represents fiscal year to date activity for any Investments in Securities identified as using Level 3 inputs at either the beginning or the end of the current fiscal period includes securities. Transfers in or out of Level 3 represent the beginning value of any Security or Instrument where a change in the pricing level occurred from the beginning to the end of the period. The cost of purchases and the proceeds of sales may include securities received or delivered through corporate actions or exchanges.
Other Information
Distribution of investments by country or territory of incorporation, as a percentage of Total Net Assets, is as follows (Unaudited):
| United States of America | 84.1% |
| United Kingdom | 4.4% |
| Switzerland | 2.6% |
| Ireland | 2.0% |
| Cayman Islands | 1.7% |
| Netherlands | 1.4% |
| China | 1.0% |
| Others (Individually Less Than 1%) | 2.8% |
| | 100.0% |
See accompanying notes which are an integral part of the financial statements.
Health Care Portfolio
Financial Statements
Statement of Assets and Liabilities
| | | February 28, 2018 |
| Assets | | |
Investment in securities, at value (including securities loaned of $234,037,845) — See accompanying schedule:
Unaffiliated issuers (cost $4,984,893,081) | $6,838,667,693 | |
| Fidelity Central Funds (cost $311,971,288) | 311,975,672 | |
| Other affiliated issuers (cost $51,969,009) | 43,414,800 | |
| Total Investment in Securities (cost $5,348,833,378) | | $7,194,058,165 |
| Receivable for investments sold | | 20,520,935 |
| Receivable for fund shares sold | | 3,726,510 |
| Dividends receivable | | 9,422,618 |
| Distributions receivable from Fidelity Central Funds | | 318,478 |
| Prepaid expenses | | 22,941 |
| Other receivables | | 768,222 |
| Total assets | | 7,228,837,869 |
| Liabilities | | |
| Payable for investments purchased | $51,702,302 | |
| Payable for fund shares redeemed | 3,024,965 | |
| Accrued management fee | 3,100,739 | |
| Other affiliated payables | 958,027 | |
| Other payables and accrued expenses | 793,181 | |
| Collateral on securities loaned | 245,854,218 | |
| Total liabilities | | 305,433,432 |
| Net Assets | | $6,923,404,437 |
| Net Assets consist of: | | |
| Paid in capital | | $4,898,906,278 |
| Undistributed net investment income | | 4,015,387 |
| Accumulated undistributed net realized gain (loss) on investments and foreign currency transactions | | 175,258,616 |
| Net unrealized appreciation (depreciation) on investments and assets and liabilities in foreign currencies | | 1,845,224,156 |
| Net Assets, for 29,391,708 shares outstanding | | $6,923,404,437 |
| Net Asset Value, offering price and redemption price per share ($6,923,404,437 ÷ 29,391,708 shares) | | $235.56 |
See accompanying notes which are an integral part of the financial statements.
Statement of Operations
| | | Year ended February 28, 2018 |
| Investment Income | | |
| Dividends | | $60,728,055 |
| Income from Fidelity Central Funds (including $3,016,199 from security lending) | | 3,910,590 |
| Total income | | 64,638,645 |
| Expenses | | |
| Management fee | $36,817,883 | |
| Transfer agent fees | 10,625,568 | |
| Accounting and security lending fees | 1,200,085 | |
| Custodian fees and expenses | 191,534 | |
| Independent trustees' fees and expenses | 146,286 | |
| Registration fees | 96,452 | |
| Audit | 55,048 | |
| Legal | 86,738 | |
| Interest | 2,252 | |
| Miscellaneous | 223,808 | |
| Total expenses before reductions | 49,445,654 | |
| Expense reductions | (495,502) | 48,950,152 |
| Net investment income (loss) | | 15,688,493 |
| Realized and Unrealized Gain (Loss) | | |
| Net realized gain (loss) on: | | |
| Investment securities: | | |
| Unaffiliated issuers | 477,809,383 | |
| Fidelity Central Funds | 7,919 | |
| Foreign currency transactions | (82,884) | |
| Total net realized gain (loss) | | 477,734,418 |
| Change in net unrealized appreciation (depreciation) on: | | |
| Investment securities: | | |
| Unaffiliated issuers | 499,097,133 | |
| Fidelity Central Funds | (18,740) | |
| Other affiliated issuers | (26,343,226) | |
| Assets and liabilities in foreign currencies | 12,751 | |
| Total change in net unrealized appreciation (depreciation) | | 472,747,918 |
| Net gain (loss) | | 950,482,336 |
| Net increase (decrease) in net assets resulting from operations | | $966,170,829 |
See accompanying notes which are an integral part of the financial statements.
Statement of Changes in Net Assets
| | Year ended February 28, 2018 | Year ended February 28, 2017 |
| Increase (Decrease) in Net Assets | | |
| Operations | | |
| Net investment income (loss) | $15,688,493 | $8,645,658 |
| Net realized gain (loss) | 477,734,418 | 4,497,783 |
| Change in net unrealized appreciation (depreciation) | 472,747,918 | 1,003,557,704 |
| Net increase (decrease) in net assets resulting from operations | 966,170,829 | 1,016,701,145 |
| Distributions to shareholders from net investment income | (11,041,879) | (7,826,452) |
| Distributions to shareholders from net realized gain | (148,657,217) | (36,346,185) |
| Total distributions | (159,699,096) | (44,172,637) |
| Share transactions | | |
| Proceeds from sales of shares | 830,480,092 | 982,508,524 |
| Reinvestment of distributions | 150,559,655 | 41,828,930 |
| Cost of shares redeemed | (1,492,988,701) | (2,807,128,925) |
| Net increase (decrease) in net assets resulting from share transactions | (511,948,954) | (1,782,791,471) |
| Redemption fees | – | 59,517 |
| Total increase (decrease) in net assets | 294,522,779 | (810,203,446) |
| Net Assets | | |
| Beginning of period | 6,628,881,658 | 7,439,085,104 |
| End of period | $6,923,404,437 | $6,628,881,658 |
| Other Information | | |
| Undistributed net investment income end of period | $4,015,387 | $– |
| Accumulated net investment loss end of period | $– | $(353,910) |
| Shares | | |
| Sold | 3,686,424 | 5,048,731 |
| Issued in reinvestment of distributions | 670,376 | 224,110 |
| Redeemed | (6,695,388) | (14,749,861) |
| Net increase (decrease) | (2,338,588) | (9,477,020) |
See accompanying notes which are an integral part of the financial statements.
Financial Highlights
Health Care Portfolio
| | | | | | |
| Years ended February 28, | 2018 | 2017 | 2016 A | 2015 | 2014 |
| Selected Per–Share Data | | | | | |
| Net asset value, beginning of period | $208.91 | $180.53 | $236.43 | $216.88 | $144.20 |
| Income from Investment Operations | | | | | |
| Net investment income (loss)B | .52 | .23 | (.07) | (.38) | (.20) |
| Net realized and unrealized gain (loss) | 31.58 | 29.29 | (31.64) | 50.00 | 92.44 |
| Total from investment operations | 32.10 | 29.52 | (31.71) | 49.62 | 92.24 |
| Distributions from net investment income | (.38) | (.23) | – | – | (.03) |
| Distributions from net realized gain | (5.08) | (.90) | (24.20) | (30.08) | (19.53) |
| Total distributions | (5.45)C | (1.14)D | (24.20) | (30.08) | (19.57)E |
| Redemption fees added to paid in capital | – | –B,F | .01B | .01B | .01B |
| Net asset value, end of period | $235.56 | $208.91 | $180.53 | $236.43 | $216.88 |
| Total ReturnG | 15.49% | 16.43% | (14.90)% | 25.44% | 67.13% |
| Ratios to Average Net AssetsH,I | | | | | |
| Expenses before reductions | .73% | .74% | .73% | .74% | .77% |
| Expenses net of fee waivers, if any | .73% | .73% | .73% | .74% | .77% |
| Expenses net of all reductions | .72% | .73% | .72% | .74% | .76% |
| Net investment income (loss) | .23% | .12% | (.03)% | (.18)% | (.11)% |
| Supplemental Data | | | | | |
| Net assets, end of period (000 omitted) | $6,923,404 | $6,628,882 | $7,439,085 | $9,831,808 | $6,180,280 |
| Portfolio turnover rateJ | 75% | 49%K | 76% | 98%K | 99% |
A For the year ended February 29.
B Calculated based on average shares outstanding during the period.
C Total distributions of $5.45 per share is comprised of distributions from net investment income of $.377 and distributions from net realized gain of $5.076 per share.
D Total distributions of $1.14 per share is comprised of distributions from net investment income of $.234 and distributions from net realized gain of $.904 per share.
E Total distributions of $19.57 per share is comprised of distributions from net investment income of $.034 and distributions from net realized gain of $19.532 per share.
F Amount represents less than $.005 per share.
G Total returns would have been lower if certain expenses had not been reduced during the applicable periods shown.
H Fees and expenses of any underlying Fidelity Central Funds are not included in the Fund's expense ratio. The Fund indirectly bears its proportionate share of the expenses of any underlying Fidelity Central Funds.
I Expense ratios reflect operating expenses of the Fund. Expenses before reductions do not reflect amounts reimbursed by the investment adviser or reductions from brokerage service arrangements or reductions from other expense offset arrangements and do not represent the amount paid by the Fund during periods when reimbursements or reductions occur. Expenses net of fee waivers reflect expenses after reimbursement by the investment adviser but prior to reductions from brokerage service arrangements or other expense offset arrangements. Expenses net of all reductions represent the net expenses paid by the Fund.
J Amount does not include the portfolio activity of any underlying Fidelity Central Funds.
K Portfolio turnover rate excludes securities received or delivered in-kind.
See accompanying notes which are an integral part of the financial statements.
Health Care Services Portfolio
Performance: The Bottom Line
Average annual total return reflects the change in the value of an investment, assuming reinvestment of distributions from dividend income and capital gains (the profits earned upon the sale of securities that have grown in value, if any) and assuming a constant rate of performance each year. The hypothetical investment and the average annual total returns do not reflect the deduction of taxes that a shareholder would pay on fund distributions or the redemption of fund shares. During periods of reimbursement by Fidelity, a fund’s total return will be greater than it would be had the reimbursement not occurred. How a fund did yesterday is no guarantee of how it will do tomorrow.
Average Annual Total Returns
| For the periods ended February 28, 2018 | Past 1 year | Past 5 years | Past 10 years |
| Health Care Services Portfolio | 17.03% | 17.45% | 12.16% |
$10,000 Over 10 Years
Let's say hypothetically that $10,000 was invested in Health Care Services Portfolio on February 29, 2008.
The chart shows how the value of your investment would have changed, and also shows how the S&P 500® Index performed over the same period.
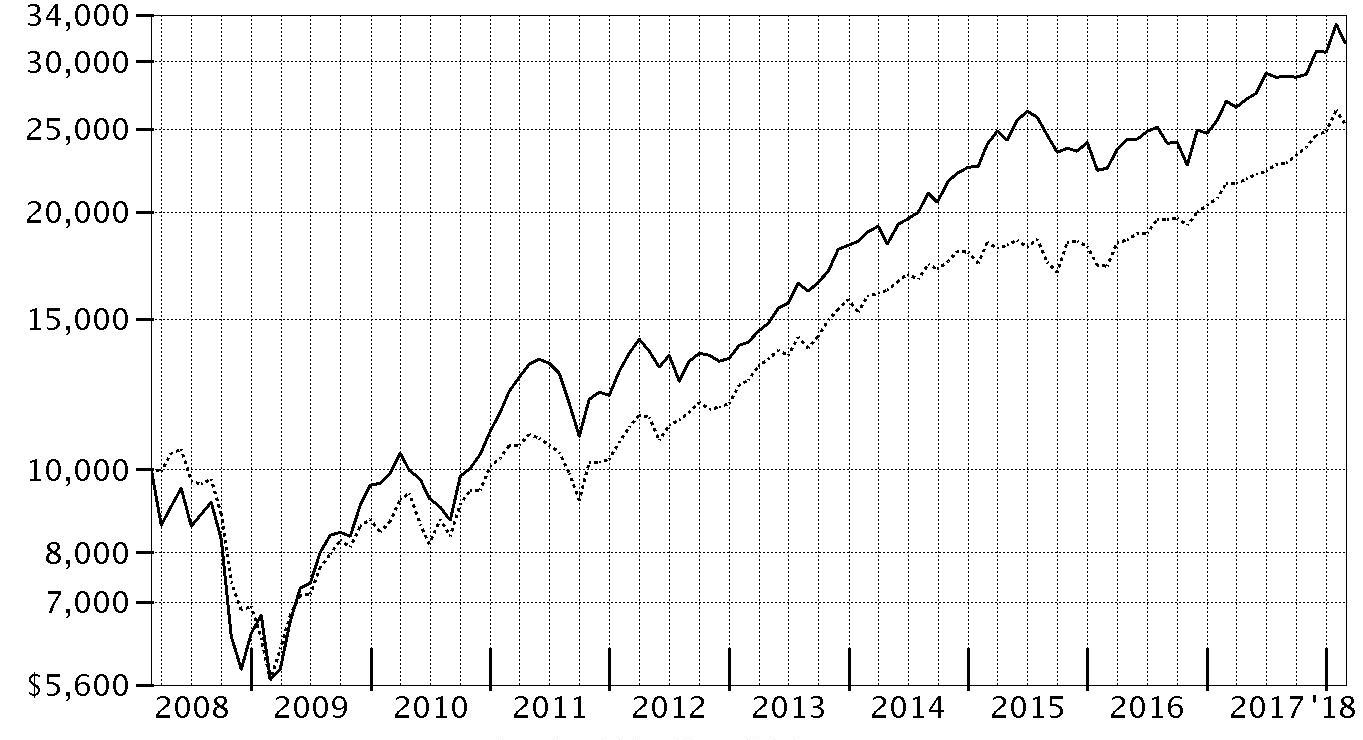
| Period Ending Values |
| $31,513 | Health Care Services Portfolio |
| $25,307 | S&P 500® Index |
Health Care Services Portfolio
Management's Discussion of Fund Performance
Market Recap: U.S. equities gained 17.10% for the 12 months ending February 28, 2018, as the S&P 500
® index moved steadily higher throughout 2017 and into 2018 until sharply reversing course in February. The drop was in stark contrast to the low volatility seen throughout 2017, along with consumer sentiment and other market indicators that stayed positive. Investors remained decidedly upbeat as the calendar turned, and the index rose 5.73% in January. February was a decidedly different story, though, as volatility spiked amid fear that rising inflation and the potential for the economy to overheat would prompt the U.S. Federal Reserve to pick up the pace of interest rate hikes. The index returned -3.69% for the month, its first negative result since October 2016. For the full 12 months, growth stocks handily topped value, while large-caps bested small-caps. By sector, information technology fared best by far, gaining 36% amid strong earnings growth from several major index constituents. Consumer discretionary (+22%) also stood out, driven by retailers. Financials added 20%, riding the uptick in bond yields. Materials and industrials rose about 16% each, boosted by higher demand, especially from China. Conversely, notable laggards included the defensive telecommunication services (-5%) and utilities (-2%) sectors, while rising rates held back real estate (-3%).
Comments from Portfolio Manager Justin Segalini: For the fiscal year, the fund gained 17.03%, behind the 20.13% result of the MSCI U.S. IMI Custom Health Care Providers & Services 25/50 Index, but about in line with the S&P 500
®. Managed health care companies, which gained roughly 38% within the MSCI index, benefited from expanded gross margins and earnings, proposed health care and tax reforms, and industry consolidation. Versus the MSCI index, the largest detractor by a wide margin was positioning in health care facilities. Notable relative individual detractors from this group included untimely positioning in Acadia Healthcare, a network of addiction and mental health treatment facilities, and an overweighting in Universal Health Services, one of the largest hospital management firms in the United States. I reduced the fund’s stake in Acadia the past 12 months, ending the period with a lower-than-index stake. Conversely, positioning in health care distributors helped the most. In particular, timely positioning in pharmaceuticals and medical products distributor Cardinal Health boosted relative performance. I increased our investments here the past 12 months, but nonetheless ended the period with a modest overweighting. Elsewhere, the fund’s largest relative contributor was Teladoc, provider of online, on-demand remote medical care. Our sizable investments in Teladoc gained roughly 82% the past 12 months.
The views expressed above reflect those of the portfolio manager(s) only through the end of the period as stated on the cover of this report and do not necessarily represent the views of Fidelity or any other person in the Fidelity organization. Any such views are subject to change at any time based upon market or other conditions and Fidelity disclaims any responsibility to update such views. These views may not be relied on as investment advice and, because investment decisions for a Fidelity fund are based on numerous factors, may not be relied on as an indication of trading intent on behalf of any Fidelity fund.
Notes to shareholders: On May 1, 2017, Justin Segalini became sole Portfolio Manager of the fund, after having served as Co-Manager with Eddie Yoon since January 2016. On December 8, 2017, shareholders approved proposals from the Board of Trustees to eliminate each sector/industry fund's fundamental “invests primarily” policy and to modify the fundamental concentration policy for certain funds. The changes took effect on January 1, 2018, and do not impact how the funds are managed.
Health Care Services Portfolio
Investment Summary (Unaudited)
Top Ten Stocks as of February 28, 2018
| | % of fund's net assets |
| UnitedHealth Group, Inc. | 24.5 |
| Cigna Corp. | 10.4 |
| Humana, Inc. | 8.9 |
| AmerisourceBergen Corp. | 5.0 |
| Anthem, Inc. | 4.8 |
| McKesson Corp. | 4.8 |
| Aetna, Inc. | 4.2 |
| Universal Health Services, Inc. Class B | 3.8 |
| Centene Corp. | 3.8 |
| Cardinal Health, Inc. | 3.4 |
| | 73.6 |
Top Industries (% of fund's net assets)
| As of February 28, 2018 |
| | Health Care Providers & Services | 93.2% |
| | Health Care Technology | 2.7% |
| | Food & Staples Retailing | 1.2% |
| | Health Care Equipment & Supplies | 0.6% |
| | Professional Services | 0.6% |
| | All Others* | 1.7% |

* Includes short-term investments and net other assets (liabilities).
Health Care Services Portfolio
Schedule of Investments February 28, 2018
Showing Percentage of Net Assets
| Common Stocks - 98.8% | | | |
| | | Shares | Value |
| Diversified Consumer Services - 0.5% | | | |
| Specialized Consumer Services - 0.5% | | | |
| Service Corp. International | | 111,300 | $4,165,959 |
| Food & Staples Retailing - 1.2% | | | |
| Drug Retail - 1.2% | | | |
| CVS Health Corp. | | 149,100 | 10,098,543 |
| Health Care Equipment & Supplies - 0.6% | | | |
| Health Care Supplies - 0.6% | | | |
| Sartorius Stedim Biotech | | 61,000 | 5,406,495 |
| Health Care Providers & Services - 93.2% | | | |
| Health Care Distributors & Services - 14.0% | | | |
| AmerisourceBergen Corp. | | 436,600 | 41,546,856 |
| Cardinal Health, Inc. | | 406,200 | 28,113,102 |
| Henry Schein, Inc. (a) | | 99,600 | 6,592,524 |
| McKesson Corp. | | 269,065 | 40,152,570 |
| | | | 116,405,052 |
| Health Care Facilities - 7.9% | | | |
| Acadia Healthcare Co., Inc. (a) | | 54,000 | 2,057,400 |
| Brookdale Senior Living, Inc. (a) | | 646,500 | 4,221,645 |
| HCA Holdings, Inc. | | 82,100 | 8,148,425 |
| Surgery Partners, Inc. (a)(b) | | 751,100 | 11,904,935 |
| U.S. Physical Therapy, Inc. | | 94,100 | 7,292,750 |
| Universal Health Services, Inc. Class B | | 278,800 | 31,838,960 |
| | | | 65,464,115 |
| Health Care Services - 11.7% | | | |
| Almost Family, Inc. (a) | | 78,300 | 4,615,785 |
| Amedisys, Inc. (a) | | 128,600 | 7,614,406 |
| American Renal Associates Holdings, Inc. (a) | | 637,171 | 12,628,729 |
| Chemed Corp. | | 45,600 | 11,839,128 |
| DaVita HealthCare Partners, Inc. (a) | | 45,400 | 3,269,708 |
| Envision Healthcare Corp. (a) | | 188,000 | 7,238,000 |
| Express Scripts Holding Co. (a) | | 178,400 | 13,460,280 |
| Laboratory Corp. of America Holdings (a) | | 99,800 | 17,235,460 |
| LHC Group, Inc. (a) | | 84,400 | 5,433,672 |
| Premier, Inc. (a) | | 232,000 | 7,690,800 |
| Providence Service Corp. (a) | | 98,800 | 6,279,728 |
| | | | 97,305,696 |
| Managed Health Care - 59.6% | | | |
| Aetna, Inc. | | 197,200 | 34,916,232 |
| Anthem, Inc. | | 171,452 | 40,356,372 |
| Centene Corp. (a) | | 308,700 | 31,308,354 |
| Cigna Corp. | | 441,300 | 86,446,257 |
| Humana, Inc. | | 271,000 | 73,663,220 |
| Molina Healthcare, Inc. (a) | | 343,500 | 24,835,050 |
| UnitedHealth Group, Inc. | | 897,500 | 202,978,600 |
| | | | 494,504,085 |
|
| TOTAL HEALTH CARE PROVIDERS & SERVICES | | | 773,678,948 |
|
| Health Care Technology - 2.7% | | | |
| Health Care Technology - 2.7% | | | |
| Castlight Health, Inc. Class B (a) | | 22,018 | 78,164 |
| Evolent Health, Inc. (a)(b) | | 289,100 | 4,235,315 |
| Teladoc, Inc. (a)(b) | | 443,855 | 17,798,586 |
| | | | 22,112,065 |
| Professional Services - 0.6% | | | |
| Human Resource & Employment Services - 0.6% | | | |
| WageWorks, Inc. (a) | | 91,700 | 4,809,665 |
| TOTAL COMMON STOCKS | | | |
| (Cost $483,297,454) | | | 820,271,675 |
|
| Money Market Funds - 4.7% | | | |
| Fidelity Cash Central Fund, 1.41% (c) | | 8,354,002 | 8,355,673 |
| Fidelity Securities Lending Cash Central Fund 1.42% (c)(d) | | 30,404,321 | 30,407,361 |
| TOTAL MONEY MARKET FUNDS | | | |
| (Cost $38,763,034) | | | 38,763,034 |
| TOTAL INVESTMENT IN SECURITIES - 103.5% | | | |
| (Cost $522,060,488) | | | 859,034,709 |
| NET OTHER ASSETS (LIABILITIES) - (3.5)% | | | (29,342,636) |
| NET ASSETS - 100% | | | $829,692,073 |
Legend
(a) Non-income producing
(b) Security or a portion of the security is on loan at period end.
(c) Affiliated fund that is generally available only to investment companies and other accounts managed by Fidelity Investments. The rate quoted is the annualized seven-day yield of the fund at period end. A complete unaudited listing of the fund's holdings as of its most recent quarter end is available upon request. In addition, each Fidelity Central Fund's financial statements, which are not covered by the Fund's Report of Independent Registered Public Accounting Firm, are available on the SEC's website or upon request.
(d) Investment made with cash collateral received from securities on loan.
Affiliated Central Funds
Information regarding fiscal year to date income earned by the Fund from investments in Fidelity Central Funds is as follows:
| Fund | Income earned |
| Fidelity Cash Central Fund | $151,458 |
| Fidelity Securities Lending Cash Central Fund | 303,722 |
| Total | $455,180 |
Amounts in the income column in the above table include any capital gain distributions from underlying funds, which are presented in the corresponding line-item in the Statement of Operations if applicable.
Investment Valuation
The following is a summary of the inputs used, as of February 28, 2018, involving the Fund's assets and liabilities carried at fair value. The inputs or methodology used for valuing securities may not be an indication of the risk associated with investing in those securities. For more information on valuation inputs, and their aggregation into the levels used below, please refer to the Investment Valuation section in the accompanying Notes to Financial Statements.
| | Valuation Inputs at Reporting Date: |
| Description | Total | Level 1 | Level 2 | Level 3 |
| Investments in Securities: | | | | |
| Common Stocks | $820,271,675 | $814,865,180 | $5,406,495 | $-- |
| Money Market Funds | 38,763,034 | 38,763,034 | -- | -- |
| Total Investments in Securities: | $859,034,709 | $853,628,214 | $5,406,495 | $-- |
See accompanying notes which are an integral part of the financial statements.
Health Care Services Portfolio
Financial Statements
Statement of Assets and Liabilities
| | | February 28, 2018 |
| Assets | | |
Investment in securities, at value (including securities loaned of $31,011,633) — See accompanying schedule:
Unaffiliated issuers (cost $483,297,454) | $820,271,675 | |
| Fidelity Central Funds (cost $38,763,034) | 38,763,034 | |
| Total Investment in Securities (cost $522,060,488) | | $859,034,709 |
| Receivable for investments sold | | 6,363,254 |
| Receivable for fund shares sold | | 282,577 |
| Dividends receivable | | 331,718 |
| Distributions receivable from Fidelity Central Funds | | 73,474 |
| Prepaid expenses | | 2,786 |
| Other receivables | | 75,504 |
| Total assets | | 866,164,022 |
| Liabilities | | |
| Payable for investments purchased | $3,520,032 | |
| Payable for fund shares redeemed | 1,917,225 | |
| Accrued management fee | 378,578 | |
| Other affiliated payables | 137,045 | |
| Other payables and accrued expenses | 111,495 | |
| Collateral on securities loaned | 30,407,574 | |
| Total liabilities | | 36,471,949 |
| Net Assets | | $829,692,073 |
| Net Assets consist of: | | |
| Paid in capital | | $453,785,515 |
| Accumulated net investment loss | | (251,495) |
| Accumulated undistributed net realized gain (loss) on investments and foreign currency transactions | | 39,184,768 |
| Net unrealized appreciation (depreciation) on investments and assets and liabilities in foreign currencies | | 336,973,285 |
| Net Assets, for 8,998,135 shares outstanding | | $829,692,073 |
| Net Asset Value, offering price and redemption price per share ($829,692,073 ÷ 8,998,135 shares) | | $92.21 |
See accompanying notes which are an integral part of the financial statements.
Statement of Operations
| | | Year ended February 28, 2018 |
| Investment Income | | |
| Dividends | | $6,643,211 |
| Income from Fidelity Central Funds (including $303,722 from security lending) | | 455,180 |
| Total income | | 7,098,391 |
| Expenses | | |
| Management fee | $4,344,697 | |
| Transfer agent fees | 1,358,182 | |
| Accounting and security lending fees | 285,963 | |
| Custodian fees and expenses | 10,983 | |
| Independent trustees' fees and expenses | 17,204 | |
| Registration fees | 36,376 | |
| Audit | 40,862 | |
| Legal | 10,059 | |
| Miscellaneous | 32,349 | |
| Total expenses before reductions | 6,136,675 | |
| Expense reductions | (36,740) | 6,099,935 |
| Net investment income (loss) | | 998,456 |
| Realized and Unrealized Gain (Loss) | | |
| Net realized gain (loss) on: | | |
| Investment securities: | | |
| Unaffiliated issuers | 117,941,603 | |
| Fidelity Central Funds | (547) | |
| Foreign currency transactions | 2,694 | |
| Total net realized gain (loss) | | 117,943,750 |
| Change in net unrealized appreciation (depreciation) on: | | |
| Investment securities: | | |
| Unaffiliated issuers | 1,357,663 | |
| Fidelity Central Funds | (2,170) | |
| Assets and liabilities in foreign currencies | 719 | |
| Total change in net unrealized appreciation (depreciation) | | 1,356,212 |
| Net gain (loss) | | 119,299,962 |
| Net increase (decrease) in net assets resulting from operations | | $120,298,418 |
See accompanying notes which are an integral part of the financial statements.
Statement of Changes in Net Assets
| | Year ended February 28, 2018 | Year ended February 28, 2017 |
| Increase (Decrease) in Net Assets | | |
| Operations | | |
| Net investment income (loss) | $998,456 | $1,200,397 |
| Net realized gain (loss) | 117,943,750 | 67,674,608 |
| Change in net unrealized appreciation (depreciation) | 1,356,212 | 71,121,457 |
| Net increase (decrease) in net assets resulting from operations | 120,298,418 | 139,996,462 |
| Distributions to shareholders from net investment income | (817,273) | (1,101,426) |
| Distributions to shareholders from net realized gain | (99,374,269) | (32,459,112) |
| Total distributions | (100,191,542) | (33,560,538) |
| Share transactions | | |
| Proceeds from sales of shares | 183,784,680 | 98,741,730 |
| Reinvestment of distributions | 94,963,099 | 31,971,028 |
| Cost of shares redeemed | (229,288,607) | (314,570,674) |
| Net increase (decrease) in net assets resulting from share transactions | 49,459,172 | (183,857,916) |
| Redemption fees | 18,350 | 11,242 |
| Total increase (decrease) in net assets | 69,584,398 | (77,410,750) |
| Net Assets | | |
| Beginning of period | 760,107,675 | 837,518,425 |
| End of period | $829,692,073 | $760,107,675 |
| Other Information | | |
| Accumulated net investment loss end of period | $(251,495) | $(437,618) |
| Shares | | |
| Sold | 1,992,122 | 1,169,971 |
| Issued in reinvestment of distributions | 1,078,902 | 384,552 |
| Redeemed | (2,525,002) | (3,759,703) |
| Net increase (decrease) | 546,022 | (2,205,180) |
See accompanying notes which are an integral part of the financial statements.
Financial Highlights
Health Care Services Portfolio
| | | | | | |
| Years ended February 28, | 2018 | 2017 | 2016 A | 2015 | 2014 |
| Selected Per–Share Data | | | | | |
| Net asset value, beginning of period | $89.93 | $78.59 | $87.26 | $75.55 | $59.90 |
| Income from Investment Operations | | | | | |
| Net investment income (loss)B | .11 | .12 | (.03) | (.09) | (.07) |
| Net realized and unrealized gain (loss) | 14.23 | 15.03 | (5.21) | 19.25 | 20.08 |
| Total from investment operations | 14.34 | 15.15 | (5.24) | 19.16 | 20.01 |
| Distributions from net investment income | (.10) | (.13) | (.02) | – | – |
| Distributions from net realized gain | (11.96) | (3.68) | (3.41) | (7.45) | (4.36) |
| Total distributions | (12.06) | (3.81) | (3.43) | (7.45) | (4.36) |
| Redemption fees added to paid in capitalB,C | – | – | – | – | – |
| Net asset value, end of period | $92.21 | $89.93 | $78.59 | $87.26 | $75.55 |
| Total ReturnD | 17.03% | 19.71% | (6.30)% | 26.88% | 34.22% |
| Ratios to Average Net AssetsE,F | | | | | |
| Expenses before reductions | .77% | .78% | .77% | .79% | .82% |
| Expenses net of fee waivers, if any | .77% | .78% | .77% | .79% | .82% |
| Expenses net of all reductions | .76% | .78% | .77% | .79% | .82% |
| Net investment income (loss) | .12% | .15% | (.03)% | (.12)% | (.10)% |
| Supplemental Data | | | | | |
| Net assets, end of period (000 omitted) | $829,692 | $760,108 | $837,518 | $878,416 | $692,486 |
| Portfolio turnover rateG | 65% | 26% | 39% | 44% | 65% |
A For the year ended February 29.
B Calculated based on average shares outstanding during the period.
C Amount represents less than $.005 per share.
D Total returns would have been lower if certain expenses had not been reduced during the applicable periods shown.
E Fees and expenses of any underlying Fidelity Central Funds are not included in the Fund's expense ratio. The Fund indirectly bears its proportionate share of the expenses of any underlying Fidelity Central Funds.
F Expense ratios reflect operating expenses of the Fund. Expenses before reductions do not reflect amounts reimbursed by the investment adviser or reductions from brokerage service arrangements or reductions from other expense offset arrangements and do not represent the amount paid by the Fund during periods when reimbursements or reductions occur. Expenses net of fee waivers reflect expenses after reimbursement by the investment adviser but prior to reductions from brokerage service arrangements or other expense offset arrangements. Expenses net of all reductions represent the net expenses paid by the Fund.
G Amount does not include the portfolio activity of any underlying Fidelity Central Funds.
See accompanying notes which are an integral part of the financial statements.
Medical Technology and Devices Portfolio
Performance: The Bottom Line
Average annual total return reflects the change in the value of an investment, assuming reinvestment of distributions from dividend income and capital gains (the profits earned upon the sale of securities that have grown in value, if any) and assuming a constant rate of performance each year. The hypothetical investment and the average annual total returns do not reflect the deduction of taxes that a shareholder would pay on fund distributions or the redemption of fund shares. During periods of reimbursement by Fidelity, a fund’s total return will be greater than it would be had the reimbursement not occurred. How a fund did yesterday is no guarantee of how it will do tomorrow.
Average Annual Total Returns
| For the periods ended February 28, 2018 | Past 1 year | Past 5 years | Past 10 years |
| Medical Technology and Devices Portfolio | 18.01% | 20.35% | 13.70% |
Prior to January 1, 2018, the fund was named Medical Equipment and Systems Portfolio, and the fund operated under certain different investment policies and compared its performance to a different index. The fund's historical performance may not represent its current investment policies.
$10,000 Over 10 Years
Let's say hypothetically that $10,000 was invested in Medical Technology and Devices Portfolio on February 29, 2008.
The chart shows how the value of your investment would have changed, and also shows how the S&P 500® Index performed over the same period.

| Period Ending Values |
| $36,103 | Medical Technology and Devices Portfolio |
| $25,307 | S&P 500® Index |
Medical Technology and Devices Portfolio
Management's Discussion of Fund Performance
Market Recap: U.S. equities gained 17.10% for the 12 months ending February 28, 2018, as the S&P 500
® index moved steadily higher throughout 2017 and into 2018 until sharply reversing course in February. The drop was in stark contrast to the low volatility seen throughout 2017, along with consumer sentiment and other market indicators that stayed positive. Investors remained decidedly upbeat as the calendar turned, and the index rose 5.73% in January. February was a decidedly different story, though, as volatility spiked amid fear that rising inflation and the potential for the economy to overheat would prompt the U.S. Federal Reserve to pick up the pace of interest rate hikes. The index returned -3.69% for the month, its first negative result since October 2016. For the full 12 months, growth stocks handily topped value, while large-caps bested small-caps. By sector, information technology fared best by far, gaining 36% amid strong earnings growth from several major index constituents. Consumer discretionary (+22%) also stood out, driven by retailers. Financials added 20%, riding the uptick in bond yields. Materials and industrials rose about 16% each, boosted by higher demand, especially from China. Conversely, notable laggards included the defensive telecommunication services (-5%) and utilities (-2%) sectors, while rising rates held back real estate (-3%).
Comments from Portfolio Manager Eddie Yoon: For the fiscal year, the fund gained 18.01%, trailing the 23.92% result of the MSCI U.S. IMI Custom Health Care Technology and Equipment 25/50 Linked Index, but ahead of the S&P 500
®. The industry benefited from solid fundamentals, continued innovation, and rising demand for its products and services the past 12 months. Versus the MSCI industry index, stock picks in the health care equipment segment was the biggest detractor. This was by far the largest area of investment for the fund and the industry index this period. Here, an overweighting in DexCom (-28%), maker of a blood sugar-monitoring system for diabetes, was a significant relative detractor. Elsewhere, our underweighting in the strong health care supplies industry also held back the fund’s relative result. Notably, sizable underexposure to Align Technology (+155%), manufacturer of 3D digital scanners and clear dental aligners, hurt the most. Align was not held in the fund until November, and a high valuation kept me from owning more. Conversely, Intuitive Surgical was the fund’s largest individual contributor and a big fund holding. Our position in the maker of robotic surgical systems gained 74% the past 12 months.
The views expressed above reflect those of the portfolio manager(s) only through the end of the period as stated on the cover of this report and do not necessarily represent the views of Fidelity or any other person in the Fidelity organization. Any such views are subject to change at any time based upon market or other conditions and Fidelity disclaims any responsibility to update such views. These views may not be relied on as investment advice and, because investment decisions for a Fidelity fund are based on numerous factors, may not be relied on as an indication of trading intent on behalf of any Fidelity fund.
Note to shareholders: On December 8, 2017, shareholders approved proposals from the Board of Trustees to eliminate each sector/industry fund's fundamental “invests primarily” policy and to modify the fundamental concentration policy for certain funds. The changes took effect on January 1, 2018, and do not impact how the funds are managed. Additionally, Select Medical Technology and Devices Portfolio, formerly Select Medical Equipment and Systems Portfolio, broadened its investment focus to include companies engaged in life sciences and health care technology, resulting in a change to the fund’s name and supplemental benchmark. These changes took effect on January 1, 2018.
Medical Technology and Devices Portfolio
Investment Summary (Unaudited)
Top Ten Stocks as of February 28, 2018
| | % of fund's net assets |
| Becton, Dickinson & Co. | 13.5 |
| Boston Scientific Corp. | 9.8 |
| Stryker Corp. | 7.2 |
| Intuitive Surgical, Inc. | 5.3 |
| Thermo Fisher Scientific, Inc. | 4.8 |
| Medtronic PLC | 4.8 |
| Baxter International, Inc. | 4.3 |
| Danaher Corp. | 4.2 |
| Cerner Corp. | 2.9 |
| Humana, Inc. | 2.6 |
| | 59.4 |
Top Industries (% of fund's net assets)
| As of February 28, 2018 |
| | Health Care Equipment & Supplies | 75.3% |
| | Life Sciences Tools & Services | 10.2% |
| | Health Care Technology | 6.9% |
| | Health Care Providers & Services | 5.2% |
| | Internet Software & Services | 0.6% |
| | All Others* | 1.8% |

* Includes short-term investments and net other assets (liabilities).
Medical Technology and Devices Portfolio
Schedule of Investments February 28, 2018
Showing Percentage of Net Assets
| Common Stocks - 97.1% | | | |
| | | Shares | Value |
| Biotechnology - 0.2% | | | |
| Biotechnology - 0.2% | | | |
| Calyxt, Inc. (a) | | 440,000 | $8,082,800 |
| Food & Staples Retailing - 0.3% | | | |
| Drug Retail - 0.3% | | | |
| CVS Health Corp. | | 200,000 | 13,546,000 |
| Health Care Equipment & Supplies - 73.8% | | | |
| Health Care Equipment - 70.1% | | | |
| Abbott Laboratories | | 550,000 | 33,181,500 |
| Atricure, Inc. (b)(c) | | 1,962,000 | 34,668,540 |
| Baxter International, Inc. | | 2,550,000 | 172,864,500 |
| Becton, Dickinson & Co. | | 2,470,000 | 548,389,401 |
| Boston Scientific Corp. (b) | | 14,550,000 | 396,633,000 |
| Danaher Corp. | | 1,750,000 | 171,115,000 |
| DexCom, Inc. (a)(b) | | 1,247,600 | 70,040,264 |
| Edwards Lifesciences Corp. (b) | | 600,000 | 80,202,000 |
| Fisher & Paykel Healthcare Corp. | | 4,000,000 | 39,810,240 |
| Genmark Diagnostics, Inc. (b) | | 1,965,510 | 8,097,901 |
| Hologic, Inc. (b) | | 550,000 | 21,356,500 |
| Inogen, Inc. (b) | | 300,000 | 36,246,000 |
| Insulet Corp. (b) | | 1,080,000 | 81,097,200 |
| Integra LifeSciences Holdings Corp. (b) | | 1,900,000 | 100,187,000 |
| Intuitive Surgical, Inc. (b) | | 508,000 | 216,636,600 |
| LivaNova PLC (b) | | 220,700 | 19,805,618 |
| Medtronic PLC | | 2,420,000 | 193,333,800 |
| Nakanishi, Inc. | | 400,000 | 22,191,138 |
| Nevro Corp. (b) | | 200,000 | 16,224,000 |
| Penumbra, Inc. (b) | | 530,000 | 57,346,000 |
| ResMed, Inc. | | 960,000 | 91,459,200 |
| Steris PLC | | 500,000 | 45,650,000 |
| Stryker Corp. | | 1,800,000 | 291,888,000 |
| Varian Medical Systems, Inc. (b) | | 130,000 | 15,514,200 |
| Wright Medical Group NV (b) | | 4,090,000 | 83,231,500 |
| | | | 2,847,169,102 |
| Health Care Supplies - 3.7% | | | |
| Align Technology, Inc. (b) | | 134,000 | 35,177,680 |
| Dentsply Sirona, Inc. | | 1,180,000 | 66,150,800 |
| Nanosonics Ltd. (b) | | 10,250,600 | 20,912,757 |
| Sartorius Stedim Biotech | | 330,000 | 29,248,252 |
| | | | 151,489,489 |
|
| TOTAL HEALTH CARE EQUIPMENT & SUPPLIES | | | 2,998,658,591 |
|
| Health Care Providers & Services - 5.1% | | | |
| Managed Health Care - 5.1% | | | |
| Humana, Inc. | | 385,000 | 104,650,700 |
| UnitedHealth Group, Inc. | | 450,000 | 101,772,000 |
| | | | 206,422,700 |
| Health Care Technology - 6.9% | | | |
| Health Care Technology - 6.9% | | | |
| athenahealth, Inc. (b) | | 210,000 | 29,345,400 |
| Castlight Health, Inc. (b) | | 999,300 | 3,547,515 |
| Castlight Health, Inc. Class B (b) | | 1,281,102 | 4,547,912 |
| Cerner Corp. (b) | | 1,800,000 | 115,488,000 |
| HTG Molecular Diagnostics (a)(b)(c) | | 2,392,976 | 10,983,760 |
| Medidata Solutions, Inc. (b) | | 200,000 | 13,132,000 |
| Teladoc, Inc. (a)(b) | | 1,500,000 | 60,150,000 |
| Veeva Systems, Inc. Class A (b) | | 600,000 | 41,820,000 |
| | | | 279,014,587 |
| Internet Software & Services - 0.6% | | | |
| Internet Software & Services - 0.6% | | | |
| Benefitfocus, Inc. (a)(b) | | 1,089,394 | 26,363,335 |
| Life Sciences Tools & Services - 10.2% | | | |
| Life Sciences Tools & Services - 10.2% | | | |
| Agilent Technologies, Inc. | | 860,000 | 58,987,400 |
| Bruker Corp. | | 1,500,000 | 45,975,000 |
| Hangzhou Tigermed Consulting Co. Ltd. Class A | | 1,999,936 | 12,373,755 |
| Lonza Group AG | | 194,000 | 49,151,756 |
| PerkinElmer, Inc. | | 670,000 | 51,147,800 |
| Thermo Fisher Scientific, Inc. | | 940,000 | 196,065,200 |
| | | | 413,700,911 |
| TOTAL COMMON STOCKS | | | |
| (Cost $3,076,016,246) | | | 3,945,788,924 |
|
| Preferred Stocks - 1.8% | | | |
| Convertible Preferred Stocks - 0.5% | | | |
| Health Care Equipment & Supplies - 0.2% | | | |
| Health Care Equipment - 0.2% | | | |
| Shockwave Medical, Inc. Series C (d)(e) | | 7,425,890 | 7,500,000 |
| Health Care Providers & Services - 0.1% | | | |
| Health Care Services - 0.1% | | | |
| 1Life Healthcare, Inc. Series G (b)(d)(e) | | 455,526 | 2,956,364 |
| Software - 0.2% | | | |
| Application Software - 0.2% | | | |
| Outset Medical, Inc. Series B (b)(d)(e) | | 3,307,754 | 7,541,679 |
|
| TOTAL CONVERTIBLE PREFERRED STOCKS | | | 17,998,043 |
|
| Nonconvertible Preferred Stocks - 1.3% | | | |
| Health Care Equipment & Supplies - 1.3% | | | |
| Health Care Equipment - 1.3% | | | |
| Sartorius AG (non-vtg.) | | 400,000 | 53,940,115 |
| TOTAL PREFERRED STOCKS | | | |
| (Cost $34,060,473) | | | 71,938,158 |
|
| Money Market Funds - 2.6% | | | |
| Fidelity Cash Central Fund, 1.41% (f) | | 36,053,038 | 36,060,248 |
| Fidelity Securities Lending Cash Central Fund 1.42% (f)(g) | | 71,535,630 | 71,542,784 |
| TOTAL MONEY MARKET FUNDS | | | |
| (Cost $107,603,032) | | | 107,603,032 |
| TOTAL INVESTMENT IN SECURITIES - 101.5% | | | |
| (Cost $3,217,679,751) | | | 4,125,330,114 |
| NET OTHER ASSETS (LIABILITIES) - (1.5)% | | | (61,404,185) |
| NET ASSETS - 100% | | | $4,063,925,929 |
Legend
(a) Security or a portion of the security is on loan at period end.
(b) Non-income producing
(c) Affiliated company
(d) Level 3 security
(e) Restricted securities - Investment in securities not registered under the Securities Act of 1933 (excluding 144A issues). At the end of the period, the value of restricted securities (excluding 144A issues) amounted to $17,998,043 or 0.4% of net assets.
(f) Affiliated fund that is generally available only to investment companies and other accounts managed by Fidelity Investments. The rate quoted is the annualized seven-day yield of the fund at period end. A complete unaudited listing of the fund's holdings as of its most recent quarter end is available upon request. In addition, each Fidelity Central Fund's financial statements, which are not covered by the Fund's Report of Independent Registered Public Accounting Firm, are available on the SEC's website or upon request.
(g) Investment made with cash collateral received from securities on loan.
Additional information on each restricted holding is as follows:
| Security | Acquisition Date | Acquisition Cost |
| 1Life Healthcare, Inc. Series G | 4/10/14 | $3,000,003 |
| Outset Medical, Inc. Series B | 5/5/15 - 6/5/15 | $7,500,001 |
| Shockwave Medical, Inc. Series C | 9/27/17 | $7,500,000 |
Affiliated Central Funds
Information regarding fiscal year to date income earned by the Fund from investments in Fidelity Central Funds is as follows:
| Fund | Income earned |
| Fidelity Cash Central Fund | $396,473 |
| Fidelity Securities Lending Cash Central Fund | 1,110,159 |
| Total | $1,506,632 |
Amounts in the income column in the above table include any capital gain distributions from underlying funds, which are presented in the corresponding line-item in the Statement of Operations if applicable.
Other Affiliated Issuers
An affiliated company is a company in which the Fund has ownership of at least 5% of the voting securities. Fiscal year to date transactions with companies which are or were affiliates are as follows:
| Affiliate | Value, beginning of period | Purchases | Sales Proceeds | Dividend Income | Realized Gain (loss) | Change in Unrealized appreciation (depreciation) | Value, end of period |
| Atricure, Inc. | $27,375,000 | $9,592,690 | $-- | $-- | $-- | $(2,299,150) | $34,668,540 |
| Avinger, Inc. | 3,570,000 | -- | 1,157,059 | -- | (5,486,292) | 3,073,351 | -- |
| HTG Molecular Diagnostics | 1,838,549 | 4,986,593 | -- | -- | -- | 4,158,618 | 10,983,760 |
| Total | $32,783,549 | $14,579,283 | $1,157,059 | $-- | $(5,486,292) | $4,932,819 | $45,652,300 |
Investment Valuation
The following is a summary of the inputs used, as of February 28, 2018, involving the Fund's assets and liabilities carried at fair value. The inputs or methodology used for valuing securities may not be an indication of the risk associated with investing in those securities. For more information on valuation inputs, and their aggregation into the levels used below, please refer to the Investment Valuation section in the accompanying Notes to Financial Statements.
| | Valuation Inputs at Reporting Date: |
| Description | Total | Level 1 | Level 2 | Level 3 |
| Investments in Securities: | | | | |
| Common Stocks | $3,945,788,924 | $3,811,911,266 | $133,877,658 | $-- |
| Preferred Stocks | 71,938,158 | -- | 53,940,115 | 17,998,043 |
| Money Market Funds | 107,603,032 | 107,603,032 | -- | -- |
| Total Investments in Securities: | $4,125,330,114 | $3,919,514,298 | $187,817,773 | $17,998,043 |
The following is a summary of transfers between Level 1 and Level 2 for the period ended February 28, 2018. Transfers are assumed to have occurred at the beginning of the period, and are primarily attributable to the valuation techniques used for foreign equity securities, as discussed in the accompanying Notes to Financial Statements:
| Transfers | Total |
| Level 1 to Level 2 | $53,444,216 |
| Level 2 to Level 1 | $0 |
Other Information
Distribution of investments by country or territory of incorporation, as a percentage of Total Net Assets, is as follows (Unaudited):
| United States of America | 86.1% |
| Ireland | 4.8% |
| Netherlands | 2.0% |
| United Kingdom | 1.6% |
| Germany | 1.3% |
| Switzerland | 1.2% |
| New Zealand | 1.0% |
| Others (Individually Less Than 1%) | 2.0% |
| | 100.0% |
See accompanying notes which are an integral part of the financial statements.
Medical Technology and Devices Portfolio
Financial Statements
Statement of Assets and Liabilities
| | | February 28, 2018 |
| Assets | | |
Investment in securities, at value (including securities loaned of $70,557,389) — See accompanying schedule:
Unaffiliated issuers (cost $3,064,584,015) | $3,972,074,782 | |
| Fidelity Central Funds (cost $107,603,032) | 107,603,032 | |
| Other affiliated issuers (cost $45,492,704) | 45,652,300 | |
| Total Investment in Securities (cost $3,217,679,751) | | $4,125,330,114 |
| Receivable for investments sold | | 42,734,145 |
| Receivable for fund shares sold | | 4,090,596 |
| Dividends receivable | | 674,297 |
| Distributions receivable from Fidelity Central Funds | | 141,719 |
| Prepaid expenses | | 13,601 |
| Other receivables | | 244,595 |
| Total assets | | 4,173,229,067 |
| Liabilities | | |
| Payable for investments purchased | $30,807,129 | |
| Payable for fund shares redeemed | 4,136,505 | |
| Accrued management fee | 1,814,447 | |
| Other affiliated payables | 645,782 | |
| Other payables and accrued expenses | 370,679 | |
| Collateral on securities loaned | 71,528,596 | |
| Total liabilities | | 109,303,138 |
| Net Assets | | $4,063,925,929 |
| Net Assets consist of: | | |
| Paid in capital | | $2,996,767,339 |
| Distributions in excess of net investment income | | (2,470,902) |
| Accumulated undistributed net realized gain (loss) on investments and foreign currency transactions | | 161,970,871 |
| Net unrealized appreciation (depreciation) on investments and assets and liabilities in foreign currencies | | 907,658,621 |
| Net Assets, for 88,164,499 shares outstanding | | $4,063,925,929 |
| Net Asset Value, offering price and redemption price per share ($4,063,925,929 ÷ 88,164,499 shares) | | $46.09 |
See accompanying notes which are an integral part of the financial statements.
Statement of Operations
| | | Year ended February 28, 2018 |
| Investment Income | | |
| Dividends | | $31,840,524 |
| Income from Fidelity Central Funds (including $1,110,159 from security lending) | | 1,506,632 |
| Total income | | 33,347,156 |
| Expenses | | |
| Management fee | $20,950,131 | |
| Transfer agent fees | 6,593,693 | |
| Accounting and security lending fees | 1,041,723 | |
| Custodian fees and expenses | 70,191 | |
| Independent trustees' fees and expenses | 81,079 | |
| Registration fees | 214,593 | |
| Audit | 42,473 | |
| Legal | 44,038 | |
| Interest | 884 | |
| Miscellaneous | 210,487 | |
| Total expenses before reductions | 29,249,292 | |
| Expense reductions | (210,168) | 29,039,124 |
| Net investment income (loss) | | 4,308,032 |
| Realized and Unrealized Gain (Loss) | | |
| Net realized gain (loss) on: | | |
| Investment securities: | | |
| Unaffiliated issuers | 435,521,109 | |
| Fidelity Central Funds | 8,930 | |
| Other affiliated issuers | (5,486,292) | |
| Foreign currency transactions | 90,213 | |
| Total net realized gain (loss) | | 430,133,960 |
| Change in net unrealized appreciation (depreciation) on: | | |
| Investment securities: | | |
| Unaffiliated issuers | 172,700,935 | |
| Fidelity Central Funds | (13,630) | |
| Other affiliated issuers | 4,932,819 | |
| Assets and liabilities in foreign currencies | 5,788 | |
| Total change in net unrealized appreciation (depreciation) | | 177,625,912 |
| Net gain (loss) | | 607,759,872 |
| Net increase (decrease) in net assets resulting from operations | | $612,067,904 |
See accompanying notes which are an integral part of the financial statements.
Statement of Changes in Net Assets
| | Year ended February 28, 2018 | Year ended February 28, 2017 |
| Increase (Decrease) in Net Assets | | |
| Operations | | |
| Net investment income (loss) | $4,308,032 | $357,634 |
| Net realized gain (loss) | 430,133,960 | 168,649,269 |
| Change in net unrealized appreciation (depreciation) | 177,625,912 | 424,009,904 |
| Net increase (decrease) in net assets resulting from operations | 612,067,904 | 593,016,807 |
| Distributions to shareholders from net investment income | (6,689,760) | – |
| Distributions to shareholders from net realized gain | (221,756,409) | (146,067,746) |
| Total distributions | (228,446,169) | (146,067,746) |
| Share transactions | | |
| Proceeds from sales of shares | 1,701,778,731 | 1,466,793,197 |
| Reinvestment of distributions | 218,219,113 | 140,204,873 |
| Cost of shares redeemed | (1,374,069,760) | (835,443,267) |
| Net increase (decrease) in net assets resulting from share transactions | 545,928,084 | 771,554,803 |
| Redemption fees | – | 100,741 |
| Total increase (decrease) in net assets | 929,549,819 | 1,218,604,605 |
| Net Assets | | |
| Beginning of period | 3,134,376,110 | 1,915,771,505 |
| End of period | $4,063,925,929 | $3,134,376,110 |
| Other Information | | |
| Distributions in excess of net investment income end of period | $(2,470,902) | $(89,174) |
| Shares | | |
| Sold | 37,902,629 | 36,297,550 |
| Issued in reinvestment of distributions | 4,910,884 | 3,801,155 |
| Redeemed | (30,209,252) | (21,308,013) |
| Net increase (decrease) | 12,604,261 | 18,790,692 |
See accompanying notes which are an integral part of the financial statements.
Financial Highlights
Medical Technology and Devices Portfolio
| | | | | | |
| Years ended February 28, | 2018 | 2017 | 2016 A | 2015 | 2014 |
| Selected Per–Share Data | | | | | |
| Net asset value, beginning of period | $41.48 | $33.75 | $41.90 | $38.03 | $30.60 |
| Income from Investment Operations | | | | | |
| Net investment income (loss)B | .05 | .01 | (.03) | .04 | .01 |
| Net realized and unrealized gain (loss) | 7.31 | 9.87 | (2.25) | 9.86 | 10.94 |
| Total from investment operations | 7.36 | 9.88 | (2.28) | 9.90 | 10.95 |
| Distributions from net investment income | (.08) | – | (.01) | (.05) | – |
| Distributions from net realized gain | (2.67) | (2.15) | (5.86) | (5.98) | (3.52) |
| Total distributions | (2.75) | (2.15) | (5.87) | (6.03) | (3.52) |
| Redemption fees added to paid in capital | – | –B,C | –B,C | –B,C | –B,C |
| Net asset value, end of period | $46.09 | $41.48 | $33.75 | $41.90 | $38.03 |
| Total ReturnD | 18.01% | 30.13% | (6.63)% | 28.52% | 37.03% |
| Ratios to Average Net AssetsE,F | | | | | |
| Expenses before reductions | .76% | .76% | .76% | .77% | .80% |
| Expenses net of fee waivers, if any | .76% | .76% | .76% | .77% | .80% |
| Expenses net of all reductions | .75% | .76% | .75% | .77% | .79% |
| Net investment income (loss) | .11% | .01% | (.09)% | .11% | .04% |
| Supplemental Data | | | | | |
| Net assets, end of period (000 omitted) | $4,063,926 | $3,134,376 | $1,915,772 | $2,107,515 | $1,720,317 |
| Portfolio turnover rateG | 77% | 55% | 46% | 106% | 75% |
A For the year ended February 29.
B Calculated based on average shares outstanding during the period.
C Amount represents less than $.005 per share.
D Total returns would have been lower if certain expenses had not been reduced during the applicable periods shown.
E Fees and expenses of any underlying Fidelity Central Funds are not included in the Fund's expense ratio. The Fund indirectly bears its proportionate share of the expenses of any underlying Fidelity Central Funds.
F Expense ratios reflect operating expenses of the Fund. Expenses before reductions do not reflect amounts reimbursed by the investment adviser or reductions from brokerage service arrangements or reductions from other expense offset arrangements and do not represent the amount paid by the Fund during periods when reimbursements or reductions occur. Expenses net of fee waivers reflect expenses after reimbursement by the investment adviser but prior to reductions from brokerage service arrangements or other expense offset arrangements. Expenses net of all reductions represent the net expenses paid by the Fund.
G Amount does not include the portfolio activity of any underlying Fidelity Central Funds.
See accompanying notes which are an integral part of the financial statements.
Pharmaceuticals Portfolio
Performance: The Bottom Line
Average annual total return reflects the change in the value of an investment, assuming reinvestment of distributions from dividend income and capital gains (the profits earned upon the sale of securities that have grown in value, if any) and assuming a constant rate of performance each year. The hypothetical investment and the average annual total returns do not reflect the deduction of taxes that a shareholder would pay on fund distributions or the redemption of fund shares. During periods of reimbursement by Fidelity, a fund’s total return will be greater than it would be had the reimbursement not occurred. How a fund did yesterday is no guarantee of how it will do tomorrow.
Average Annual Total Returns
| For the periods ended February 28, 2018 | Past 1 year | Past 5 years | Past 10 years |
| Pharmaceuticals Portfolio | 5.61% | 10.66% | 11.18% |
$10,000 Over 10 Years
Let's say hypothetically that $10,000 was invested in Pharmaceuticals Portfolio on February 29, 2008.
The chart shows how the value of your investment would have changed, and also shows how the S&P 500® Index performed over the same period.
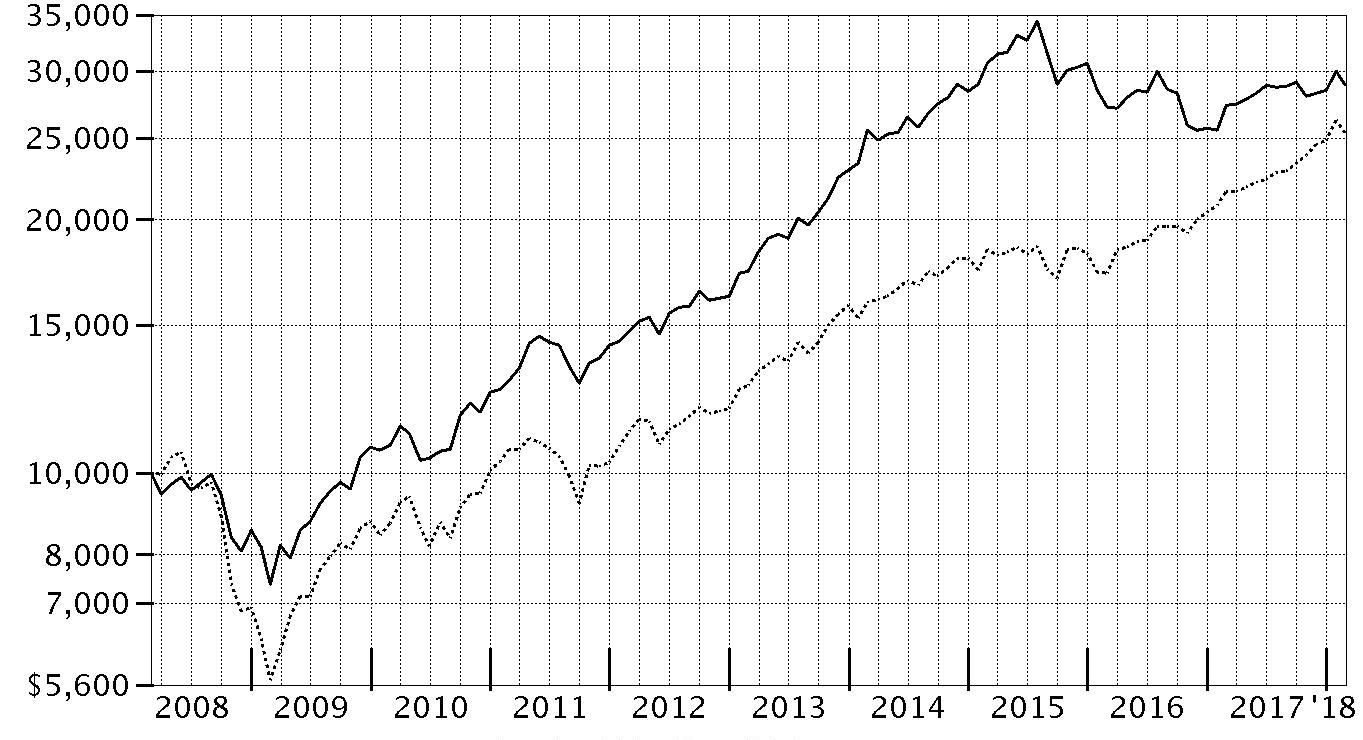
| Period Ending Values |
| $28,852 | Pharmaceuticals Portfolio |
| $25,307 | S&P 500® Index |
Pharmaceuticals Portfolio
Management's Discussion of Fund Performance
Market Recap: U.S. equities gained 17.10% for the 12 months ending February 28, 2018, as the S&P 500
® index moved steadily higher throughout 2017 and into 2018 until sharply reversing course in February. The drop was in stark contrast to the low volatility seen throughout 2017, along with consumer sentiment and other market indicators that stayed positive. Investors remained decidedly upbeat as the calendar turned, and the index rose 5.73% in January. February was a decidedly different story, though, as volatility spiked amid fear that rising inflation and the potential for the economy to overheat would prompt the U.S. Federal Reserve to pick up the pace of interest rate hikes. The index returned -3.69% for the month, its first negative result since October 2016. For the full 12 months, growth stocks handily topped value, while large-caps bested small-caps. By sector, information technology fared best by far, gaining 36% amid strong earnings growth from several major index constituents. Consumer discretionary (+22%) also stood out, driven by retailers. Financials added 20%, riding the uptick in bond yields. Materials and industrials rose about 16% each, boosted by higher demand, especially from China. Conversely, notable laggards included the defensive telecommunication services (-5%) and utilities (-2%) sectors, while rising rates held back real estate (-3%).
Comments from Portfolio Manager Karim Suwwan de Felipe: For the year, the fund returned 5.61%, trailing the combined 7.87% return of our former S&P
® industry index for the first month of the period and the fund’s new MSCI industry index for the past 11 months. Pharma stocks lagged the S&P 500
®, held back most notably by drug-pricing concerns. Versus the MSCI industry index, our sizable underweighting in Denmark-based Novo Nordisk hurt, as did an overweighting in Allergan. Meanwhile, the fund’s foreign holdings contributed, including our non-index stake in Belgium-based Ablynx.
The views expressed above reflect those of the portfolio manager(s) only through the end of the period as stated on the cover of this report and do not necessarily represent the views of Fidelity or any other person in the Fidelity organization. Any such views are subject to change at any time based upon market or other conditions and Fidelity disclaims any responsibility to update such views. These views may not be relied on as investment advice and, because investment decisions for a Fidelity fund are based on numerous factors, may not be relied on as an indication of trading intent on behalf of any Fidelity fund.
Notes to shareholders: On April 1, 2017, the fund's industry benchmark changed from the S&P
® Custom Pharmaceuticals Index to the MSCI North America IMI + ADR Custom Pharmaceuticals 25/50 Linked Index. Due to new international benchmark guidelines, S&P
® Dow Jones
® Indices stopped offering its brand on custom benchmarks, effective March 31, 2017. Fidelity believes that the new MSCI index will continue to provide shareholders with meaningful performance comparisons. On December 8, 2017, shareholders approved proposals from the Board of Trustees to eliminate each sector/industry fund's fundamental “invests primarily” policy and to modify the fundamental concentration policy for certain funds. The changes took effect on January 1, 2018, and do not impact how the funds are man.
Pharmaceuticals Portfolio
Investment Summary (Unaudited)
Top Ten Stocks as of February 28, 2018
| | % of fund's net assets |
| Johnson & Johnson | 15.0 |
| AstraZeneca PLC sponsored ADR | 8.9 |
| Pfizer, Inc. | 7.0 |
| Novartis AG sponsored ADR | 6.7 |
| Sanofi SA sponsored ADR | 6.0 |
| Allergan PLC | 5.9 |
| Bristol-Myers Squibb Co. | 4.9 |
| Roche Holding AG (participation certificate) | 4.7 |
| GlaxoSmithKline PLC sponsored ADR | 4.0 |
| Nektar Therapeutics | 2.8 |
| | 65.9 |
Top Industries (% of fund's net assets)
| As of February 28, 2018 |
| | Pharmaceuticals | 81.8% |
| | Biotechnology | 12.8% |
| | Health Care Equipment & Supplies | 4.7% |
| | All Others* | 0.7% |

* Includes short-term investments and net other assets (liabilities).
Pharmaceuticals Portfolio
Schedule of Investments February 28, 2018
Showing Percentage of Net Assets
| Common Stocks - 99.3% | | | |
| | | Shares | Value |
| Biotechnology - 12.8% | | | |
| Biotechnology - 12.8% | | | |
| Abeona Therapeutics, Inc. (a) | | 110,300 | $1,527,655 |
| AC Immune SA (a)(b) | | 175,700 | 1,857,149 |
| Acceleron Pharma, Inc. (a) | | 78,000 | 3,270,540 |
| Alexion Pharmaceuticals, Inc. (a) | | 63,700 | 7,481,565 |
| Alnylam Pharmaceuticals, Inc. (a) | | 40,100 | 4,818,416 |
| Amgen, Inc. | | 80,700 | 14,830,239 |
| AnaptysBio, Inc. (a) | | 16,700 | 2,050,092 |
| Arena Pharmaceuticals, Inc. (a) | | 46,800 | 1,814,436 |
| Argenx SE (a) | | 34,900 | 2,701,314 |
| Ascendis Pharma A/S sponsored ADR (a) | | 63,900 | 3,973,941 |
| Atara Biotherapeutics, Inc. (a) | | 75,900 | 2,924,048 |
| BeiGene Ltd. ADR (a) | | 18,800 | 2,697,236 |
| Blueprint Medicines Corp. (a) | | 69,800 | 6,041,888 |
| Cytokinetics, Inc. (a) | | 86,800 | 672,700 |
| Epizyme, Inc. (a) | | 104,600 | 1,851,420 |
| Global Blood Therapeutics, Inc. (a) | | 96,400 | 5,653,860 |
| Leap Therapeutics, Inc. (a) | | 34,100 | 225,401 |
| Loxo Oncology, Inc. (a) | | 49,400 | 5,494,268 |
| Momenta Pharmaceuticals, Inc. (a) | | 2,100 | 35,805 |
| Neurocrine Biosciences, Inc. (a) | | 46,900 | 3,959,767 |
| Olivo Labs (c)(d) | | 6,851 | 0 |
| Sage Therapeutics, Inc. (a) | | 1,700 | 274,312 |
| Sarepta Therapeutics, Inc. (a) | | 111,541 | 7,001,429 |
| uniQure B.V. (a) | | 149,018 | 3,788,038 |
| Vertex Pharmaceuticals, Inc. (a) | | 47,000 | 7,803,410 |
| Xencor, Inc. (a) | | 84,568 | 2,590,318 |
| | | | 95,339,247 |
| Health Care Equipment & Supplies - 4.7% | | | |
| Health Care Equipment - 4.7% | | | |
| Becton, Dickinson & Co. | | 77,300 | 17,162,146 |
| Boston Scientific Corp. (a) | | 544,000 | 14,829,440 |
| Insulet Corp. (a) | | 35,100 | 2,635,659 |
| | | | 34,627,245 |
| Personal Products - 0.0% | | | |
| Personal Products - 0.0% | | | |
| MYOS Corp. (a) | | 40,000 | 54,000 |
| Pharmaceuticals - 81.8% | | | |
| Pharmaceuticals - 81.8% | | | |
| Aclaris Therapeutics, Inc. (a)(b) | | 142,400 | 2,839,456 |
| Akorn, Inc. (a) | | 91,500 | 1,550,010 |
| Allergan PLC | | 285,938 | 44,097,358 |
| Amphastar Pharmaceuticals, Inc. (a) | | 139,800 | 2,566,728 |
| AstraZeneca PLC sponsored ADR | | 2,000,900 | 66,409,871 |
| Avexis, Inc. (a) | | 46,664 | 5,773,737 |
| Bristol-Myers Squibb Co. | | 554,980 | 36,739,676 |
| Endo International PLC (a) | | 50,000 | 315,250 |
| GlaxoSmithKline PLC sponsored ADR | | 826,700 | 30,017,477 |
| Impax Laboratories, Inc. (a) | | 196,600 | 4,010,640 |
| Indivior PLC (a) | | 487,900 | 2,533,587 |
| Jazz Pharmaceuticals PLC (a) | | 35,600 | 5,154,880 |
| Johnson & Johnson | | 857,450 | 111,365,606 |
| Mallinckrodt PLC (a) | | 128,200 | 2,138,376 |
| Merck & Co., Inc. | | 204,836 | 11,106,208 |
| Mithra Pharmaceuticals SA (a)(b) | | 99,600 | 2,405,998 |
| Mylan NV (a) | | 350,400 | 14,128,128 |
| MyoKardia, Inc. (a) | | 146,400 | 8,520,480 |
| Nektar Therapeutics (a) | | 243,500 | 21,077,360 |
| Novartis AG sponsored ADR | | 597,198 | 49,776,453 |
| Novo Nordisk A/S Series B sponsored ADR | | 334,800 | 17,235,504 |
| Perrigo Co. PLC | | 110,500 | 9,001,330 |
| Pfizer, Inc. | | 1,433,788 | 52,060,842 |
| Reata Pharmaceuticals, Inc. (a) | | 112,300 | 2,705,307 |
| Revance Therapeutics, Inc. (a) | | 178,800 | 5,533,860 |
| Roche Holding AG (participation certificate) | | 150,966 | 34,870,127 |
| Sanofi SA sponsored ADR | | 1,133,922 | 44,506,439 |
| Sosei Group Corp. (a)(b) | | 26,900 | 2,398,026 |
| Supernus Pharmaceuticals, Inc. (a) | | 31,700 | 1,233,130 |
| The Medicines Company (a)(b) | | 176,884 | 5,416,188 |
| TherapeuticsMD, Inc. (a) | | 197,300 | 986,500 |
| Theravance Biopharma, Inc. (a)(b) | | 68,697 | 1,810,853 |
| Tonghua Dongbao Pharmaceutical Co. Ltd. Class A | | 727,000 | 2,682,194 |
| WAVE Life Sciences (a)(b) | | 121,700 | 6,200,615 |
| | | | 609,168,194 |
| TOTAL COMMON STOCKS | | | |
| (Cost $601,221,253) | | | 739,188,686 |
|
| Money Market Funds - 2.5% | | | |
| Fidelity Cash Central Fund, 1.41% (e) | | 1,966,860 | 1,967,254 |
| Fidelity Securities Lending Cash Central Fund 1.42% (e)(f) | | 16,557,944 | 16,559,599 |
| TOTAL MONEY MARKET FUNDS | | | |
| (Cost $18,526,853) | | | 18,526,853 |
| TOTAL INVESTMENT IN SECURITIES - 101.8% | | | |
| (Cost $619,748,106) | | | 757,715,539 |
| NET OTHER ASSETS (LIABILITIES) - (1.8)% | | | (13,152,911) |
| NET ASSETS - 100% | | | $744,562,628 |
Legend
(a) Non-income producing
(b) Security or a portion of the security is on loan at period end.
(c) Level 3 security
(d) Restricted securities - Investment in securities not registered under the Securities Act of 1933 (excluding 144A issues). At the end of the period, the value of restricted securities (excluding 144A issues) amounted to $0 or 0.0% of net assets.
(e) Affiliated fund that is generally available only to investment companies and other accounts managed by Fidelity Investments. The rate quoted is the annualized seven-day yield of the fund at period end. A complete unaudited listing of the fund's holdings as of its most recent quarter end is available upon request. In addition, each Fidelity Central Fund's financial statements, which are not covered by the Fund's Report of Independent Registered Public Accounting Firm, are available on the SEC's website or upon request.
(f) Investment made with cash collateral received from securities on loan.
Additional information on each restricted holding is as follows:
| Security | Acquisition Date | Acquisition Cost |
| Olivo Labs | 2/8/17 | $8,290 |
Affiliated Central Funds
Information regarding fiscal year to date income earned by the Fund from investments in Fidelity Central Funds is as follows:
| Fund | Income earned |
| Fidelity Cash Central Fund | $45,692 |
| Fidelity Securities Lending Cash Central Fund | 647,132 |
| Total | $692,824 |
Amounts in the income column in the above table include any capital gain distributions from underlying funds, which are presented in the corresponding line-item in the Statement of Operations if applicable.
Investment Valuation
The following is a summary of the inputs used, as of February 28, 2018, involving the Fund's assets and liabilities carried at fair value. The inputs or methodology used for valuing securities may not be an indication of the risk associated with investing in those securities. For more information on valuation inputs, and their aggregation into the levels used below, please refer to the Investment Valuation section in the accompanying Notes to Financial Statements.
| | Valuation Inputs at Reporting Date: |
| Description | Total | Level 1 | Level 2 | Level 3 |
| Investments in Securities: | | | | |
| Common Stocks | $739,188,686 | $691,597,440 | $47,591,246 | $-- |
| Money Market Funds | 18,526,853 | 18,526,853 | -- | -- |
| Total Investments in Securities: | $757,715,539 | $710,124,293 | $47,591,246 | $-- |
Other Information
Distribution of investments by country or territory of incorporation, as a percentage of Total Net Assets, is as follows (Unaudited):
| United States of America | 53.0% |
| United Kingdom | 13.2% |
| Switzerland | 11.7% |
| Ireland | 8.1% |
| France | 6.0% |
| Denmark | 2.8% |
| Netherlands | 2.8% |
| Others (Individually Less Than 1%) | 2.4% |
| | 100.0% |
See accompanying notes which are an integral part of the financial statements.
Pharmaceuticals Portfolio
Financial Statements
Statement of Assets and Liabilities
| | | February 28, 2018 |
| Assets | | |
Investment in securities, at value (including securities loaned of $15,633,510) — See accompanying schedule:
Unaffiliated issuers (cost $601,221,253) | $739,188,686 | |
| Fidelity Central Funds (cost $18,526,853) | 18,526,853 | |
| Total Investment in Securities (cost $619,748,106) | | $757,715,539 |
| Receivable for investments sold | | 3,956,961 |
| Receivable for fund shares sold | | 357,485 |
| Dividends receivable | | 4,493,318 |
| Distributions receivable from Fidelity Central Funds | | 31,810 |
| Prepaid expenses | | 3,156 |
| Other receivables | | 148,921 |
| Total assets | | 766,707,190 |
| Liabilities | | |
| Payable for investments purchased | $3,893,976 | |
| Payable for fund shares redeemed | 1,027,513 | |
| Accrued management fee | 339,892 | |
| Other affiliated payables | 155,397 | |
| Other payables and accrued expenses | 177,709 | |
| Collateral on securities loaned | 16,550,075 | |
| Total liabilities | | 22,144,562 |
| Net Assets | | $744,562,628 |
| Net Assets consist of: | | |
| Paid in capital | | $634,011,893 |
| Undistributed net investment income | | 2,249,703 |
| Accumulated undistributed net realized gain (loss) on investments and foreign currency transactions | | (29,685,386) |
| Net unrealized appreciation (depreciation) on investments and assets and liabilities in foreign currencies | | 137,986,418 |
| Net Assets, for 39,561,274 shares outstanding | | $744,562,628 |
| Net Asset Value, offering price and redemption price per share ($744,562,628 ÷ 39,561,274 shares) | | $18.82 |
See accompanying notes which are an integral part of the financial statements.
Statement of Operations
| | | Year ended February 28, 2018 |
| Investment Income | | |
| Dividends | | $20,312,908 |
| Income from Fidelity Central Funds (including $647,132 from security lending) | | 692,824 |
| Income before foreign taxes withheld | | 21,005,732 |
| Less foreign taxes withheld | | (1,139,755) |
| Total income | | 19,865,977 |
| Expenses | | |
| Management fee | $4,817,188 | |
| Transfer agent fees | 1,853,501 | |
| Accounting and security lending fees | 313,120 | |
| Custodian fees and expenses | 35,215 | |
| Independent trustees' fees and expenses | 19,755 | |
| Registration fees | 34,915 | |
| Audit | 41,242 | |
| Legal | 14,548 | |
| Interest | 1,970 | |
| Miscellaneous | 50,335 | |
| Total expenses before reductions | 7,181,789 | |
| Expense reductions | (88,581) | 7,093,208 |
| Net investment income (loss) | | 12,772,769 |
| Realized and Unrealized Gain (Loss) | | |
| Net realized gain (loss) on: | | |
| Investment securities: | | |
| Unaffiliated issuers | 73,153,646 | |
| Fidelity Central Funds | 172 | |
| Foreign currency transactions | (149,008) | |
| Total net realized gain (loss) | | 73,004,810 |
| Change in net unrealized appreciation (depreciation) on: | | |
| Investment securities: | | |
| Unaffiliated issuers | (34,236,765) | |
| Fidelity Central Funds | (6,379) | |
| Assets and liabilities in foreign currencies | 58,703 | |
| Total change in net unrealized appreciation (depreciation) | | (34,184,441) |
| Net gain (loss) | | 38,820,369 |
| Net increase (decrease) in net assets resulting from operations | | $51,593,138 |
See accompanying notes which are an integral part of the financial statements.
Statement of Changes in Net Assets
| | Year ended February 28, 2018 | Year ended February 28, 2017 |
| Increase (Decrease) in Net Assets | | |
| Operations | | |
| Net investment income (loss) | $12,772,769 | $16,034,717 |
| Net realized gain (loss) | 73,004,810 | (64,388,903) |
| Change in net unrealized appreciation (depreciation) | (34,184,441) | 57,674,163 |
| Net increase (decrease) in net assets resulting from operations | 51,593,138 | 9,319,977 |
| Distributions to shareholders from net investment income | (10,710,598) | (11,379,757) |
| Distributions to shareholders from net realized gain | (2,243,362) | – |
| Total distributions | (12,953,960) | (11,379,757) |
| Share transactions | | |
| Proceeds from sales of shares | 58,835,440 | 159,355,203 |
| Reinvestment of distributions | 12,347,170 | 10,875,085 |
| Cost of shares redeemed | (366,196,350) | (860,669,026) |
| Net increase (decrease) in net assets resulting from share transactions | (295,013,740) | (690,438,738) |
| Redemption fees | – | 25,672 |
| Total increase (decrease) in net assets | (256,374,562) | (692,472,846) |
| Net Assets | | |
| Beginning of period | 1,000,937,190 | 1,693,410,036 |
| End of period | $744,562,628 | $1,000,937,190 |
| Other Information | | |
| Undistributed net investment income end of period | $2,249,703 | $1,106,382 |
| Shares | | |
| Sold | 3,133,485 | 8,712,351 |
| Issued in reinvestment of distributions | 667,263 | 637,835 |
| Redeemed | (19,523,339) | (47,134,152) |
| Net increase (decrease) | (15,722,591) | (37,783,966) |
See accompanying notes which are an integral part of the financial statements.
Financial Highlights
Pharmaceuticals Portfolio
| | | | | | |
| Years ended February 28, | 2018 | 2017 | 2016 A | 2015 | 2014 |
| Selected Per–Share Data | | | | | |
| Net asset value, beginning of period | $18.11 | $18.20 | $23.08 | $21.39 | $16.13 |
| Income from Investment Operations | | | | | |
| Net investment income (loss)B | .27 | .22 | .24 | .14 | .26 |
| Net realized and unrealized gain (loss) | .74 | (.13) | (2.52) | 3.76 | 6.96 |
| Total from investment operations | 1.01 | .09 | (2.28) | 3.90 | 7.22 |
| Distributions from net investment income | (.25) | (.18) | (.17) | (.18) | (.18) |
| Distributions from net realized gain | (.05) | – | (2.43) | (2.03) | (1.77) |
| Total distributions | (.30) | (.18) | (2.60) | (2.21) | (1.96)C |
| Redemption fees added to paid in capital | – | –B,D | –B,D | –B,D | –B,D |
| Net asset value, end of period | $18.82 | $18.11 | $18.20 | $23.08 | $21.39 |
| Total ReturnE | 5.61% | .57% | (11.33)% | 20.04% | 46.77% |
| Ratios to Average Net AssetsF,G | | | | | |
| Expenses before reductions | .81% | .80% | .78% | .79% | .82% |
| Expenses net of fee waivers, if any | .81% | .80% | .78% | .79% | .81% |
| Expenses net of all reductions | .80% | .79% | .77% | .79% | .81% |
| Net investment income (loss) | 1.44% | 1.16% | 1.09% | .66% | 1.39% |
| Supplemental Data | | | | | |
| Net assets, end of period (000 omitted) | $744,563 | $1,000,937 | $1,693,410 | $1,892,865 | $1,634,743 |
| Portfolio turnover rateH | 89% | 77% | 77% | 72%I | 95% |
A For the year ended February 29.
B Calculated based on average shares outstanding during the period.
C Total distributions of $1.96 per share is comprised of distributions from net investment income of $.182 and distributions from net realized gain of $1.773 per share.
D Amount represents less than $.005 per share.
E Total returns would have been lower if certain expenses had not been reduced during the applicable periods shown.
F Fees and expenses of any underlying Fidelity Central Funds are not included in the Fund's expense ratio. The Fund indirectly bears its proportionate share of the expenses of any underlying Fidelity Central Funds.
G Expense ratios reflect operating expenses of the Fund. Expenses before reductions do not reflect amounts reimbursed by the investment adviser or reductions from brokerage service arrangements or reductions from other expense offset arrangements and do not represent the amount paid by the Fund during periods when reimbursements or reductions occur. Expenses net of fee waivers reflect expenses after reimbursement by the investment adviser but prior to reductions from brokerage service arrangements or other expense offset arrangements. Expenses net of all reductions represent the net expenses paid by the Fund.
H Amount does not include the portfolio activity of any underlying Fidelity Central Funds.
I Portfolio turnover rate excludes securities received or delivered in-kind.
See accompanying notes which are an integral part of the financial statements.
Notes to Financial Statements
For the period ended February 28, 2018
1. Organization.
Biotechnology Portfolio, Health Care Portfolio, Health Care Services Portfolio, Medical Technology and Devices Portfolio (formerly Medical Equipment and Systems Portfolio), and Pharmaceuticals Portfolio (the Funds) are non-diversified funds of Fidelity Select Portfolios (the Trust). The Trust is registered under the Investment Company Act of 1940, as amended (the 1940 Act), as an open-end management investment company organized as a Massachusetts business trust. The Funds invest primarily in securities of companies whose principal business activities fall within specific industries. Each Fund is authorized to issue an unlimited number of shares. Share transactions on the Statement of Changes in Net Assets may contain exchanges between affiliated funds.
2. Investments in Fidelity Central Funds.
The Funds invests in Fidelity Central Funds, which are open-end investment companies generally available only to other investment companies and accounts managed by the investment adviser and its affiliates. The Funds' Schedules of Investments list each of the Fidelity Central Funds held as of period end, if any, as an investment of each Fund, but do not include the underlying holdings of each Fidelity Central Fund. As an Investing Fund, each Fund indirectly bears its proportionate share of the expenses of the underlying Fidelity Central Funds.
The Money Market Central Funds seek preservation of capital and current income and are managed by Fidelity Investments Money Management, Inc. (FIMM), an affiliate of the investment adviser. Annualized expenses of the Money Market Central Funds as of their most recent shareholder report date are less than .005%.
A complete unaudited list of holdings for each Fidelity Central Fund is available upon request or at the Securities and Exchange Commission (the SEC) website at www.sec.gov. In addition, the financial statements of the Fidelity Central Funds, which are not covered by the Funds' Report of Independent Registered Public Accounting Firm, are available on the SEC website or upon request.
3. Significant Accounting Policies.
Each Fund is an investment company and applies the accounting and reporting guidance of the Financial Accounting Standards Board (FASB) Accounting Standards Codification Topic 946 Financial Services – Investments Companies. The financial statements have been prepared in conformity with accounting principles generally accepted in the United States of America (GAAP), which require management to make certain estimates and assumptions at the date of the financial statements. Actual results could differ from those estimates. Subsequent events, if any, through the date that the financial statements were issued have been evaluated in the preparation of the financial statements. The following summarizes the significant accounting policies of the Funds:
Investment Valuation. Investments are valued as of 4:00 p.m. Eastern time on the last calendar day of the period. The Board of Trustees (the Board) has delegated the day to day responsibility for the valuation of each Fund's investments to the Fair Value Committee (the Committee) established by each Fund's investment adviser. In accordance with valuation policies and procedures approved by the Board, each Fund attempts to obtain prices from one or more third party pricing vendors or brokers to value its investments. When current market prices, quotations or currency exchange rates are not readily available or reliable, investments will be fair valued in good faith by the Committee, in accordance with procedures adopted by the Board. Factors used in determining fair value vary by investment type and may include market or investment specific events. The frequency with which these procedures are used cannot be predicted and they may be utilized to a significant extent. The Committee oversees each Fund's valuation policies and procedures and reports to the Board on the Committee's activities and fair value determinations. The Board monitors the appropriateness of the procedures used in valuing each Fund's investments and ratifies the fair value determinations of the Committee.
Each Fund categorizes the inputs to valuation techniques used to value its investments into a disclosure hierarchy consisting of three levels as shown below:
- Level 1 – quoted prices in active markets for identical investments
- Level 2 – other significant observable inputs (including quoted prices for similar investments, interest rates, prepayment speeds, etc.)
- Level 3 – unobservable inputs (including the Fund's own assumptions based on the best information available)
Valuation techniques used to value each Fund's investments by major category are as follows:
Equity securities, including restricted securities, for which market quotations are readily available, are valued at the last reported sale price or official closing price as reported by a third party pricing vendor on the primary market or exchange on which they are traded and are categorized as Level 1 in the hierarchy. In the event there were no sales during the day or closing prices are not available, securities are valued at the last quoted bid price or may be valued using the last available price and are generally categorized as Level 2 in the hierarchy. For foreign equity securities, when market or security specific events arise, comparisons to the valuation of American Depositary Receipts (ADRs), futures contracts, Exchange-Traded Funds (ETFs) and certain indexes as well as quoted prices for similar securities may be used and would be categorized as Level 2 in the hierarchy. Utilizing these techniques may result in transfers between Level 1 and Level 2. For equity securities, including restricted securities, where observable inputs are limited, assumptions about market activity and risk are used and these securities may be categorized as Level 3 in the hierarchy. Equity securities, including restricted securities, for which observable inputs are not available are valued using alternate valuation approaches, including the market approach and the income approach and are categorized as Level 3 in the hierarchy. The market approach generally consists of using comparable market transactions while the income approach generally consists of using the net present value of estimated future cash flows, adjusted as appropriate for liquidity, credit, market and/or other risk factors.
Investments in open-end mutual funds, including Fidelity Central Funds, are valued at their closing net asset value (NAV) each business day and are categorized as Level 1 in the hierarchy.
The following provides information on Level 3 securities held by the Fund that were valued at period end based on unobservable inputs. These amounts exclude valuations provided by a broker.
Biotechnology Portfolio:
| Asset Type | Fair Value | Valuation Technique(s) | Unobservable Input | Amount or Range/Weighted Average | Impact to Valuation from an Increase in Input(a) |
| Equities | $ 273,957,272 | Market approach | Transaction price | $13.88 - $142.30 / $48.85 | Increase |
| | | Market comparable | Transaction price | $1.98 - $150.00 / $33.63 | Increase |
| | | | Enterprise value/Sales multiple (EV/S) | 4.6 | Increase |
| | | | Premium rate | 2.0% - 15.0% / 10.6% | Increase |
| | | | Proxy premium | 28.2% - 217.3% / 65.4% | Increase |
| | | Recovery value | Recovery value | 0.0% | Increase |
| | | Discounted cash flow | Discount rate | 8.0% - 12.2% / 10.9% | Decrease |
| | | | Discount for lack of marketability | 10.0% | Decrease |
| | | | Probability rate | 6.3% - 68.9% / 7.4% | Increase |
(a) Represents the expected directional change in the fair value of the Level 3 investments that would result from an increase in the corresponding input. A decrease to the unobservable input would have the opposite effect. Significant changes in these inputs could result in significantly higher or lower fair value measurements.
Health Care Portfolio:
| Asset Type | Fair Value | Valuation Technique(s) | Unobservable Input | Amount or Range/Weighted Average | Impact to Valuation from an Increase in Input(a) |
| Equities | $ 113,655,981 | Market approach | Transaction price | $1.01- $142.30 / $112.80 | Increase |
| | | Market comparable | Transaction price | $1.00- $222.69 / $132.36 | Increase |
| | | | Enterprise value/Sales multiple (EV/S) | 3.4 - 5.3 / 4.7 | Increase |
| | | | Discount rate | 20.0% | Decrease |
| | | | Premium rate | 33.0% - 86.0% / 52.1% | Increase |
| | | | Discount for lack of marketability | 15.0% | Decrease |
| | | | Enterprise value/Revenue multiple (EV/R) | 3.9 | Increase |
(a) Represents the expected directional change in the fair value of the Level 3 investments that would result from an increase in the corresponding input. A decrease to the unobservable input would have the opposite effect. Significant changes in these inputs could result in significantly higher or lower fair value measurements.
Changes in valuation techniques may result in transfers in or out of an assigned level within the disclosure hierarchy. The aggregate value of investments by input level as of February 28, 2018, including information on transfers between Levels 1 and 2, as well as a roll forward of Level 3 investments, is included at the end of each applicable Fund's Schedule of Investments.
Foreign Currency. The Funds may use foreign currency contracts to facilitate transactions in foreign-denominated securities. Gains and losses from these transactions may arise from changes in the value of the foreign currency or if the counterparties do not perform under the contracts' terms.
Foreign-denominated assets, including investment securities, and liabilities are translated into U.S. dollars at the exchange rates at period end. Purchases and sales of investment securities, income and dividends received and expenses denominated in foreign currencies are translated into U.S. dollars at the exchange rate in effect on the transaction date.
The effects of exchange rate fluctuations on investments are included with the net realized and unrealized gain (loss) on investment securities. Other foreign currency transactions resulting in realized and unrealized gain (loss) are disclosed separately.
Investment Transactions and Income. For financial reporting purposes, the Funds' investment holdings and NAV include trades executed through the end of the last business day of the period. The NAV per share for processing shareholder transactions is calculated as of the close of business of the New York Stock Exchange (NYSE), normally 4:00 p.m. Eastern time and includes trades executed through the end of the prior business day. Gains and losses on securities sold are determined on the basis of identified cost and includes proceeds received from litigation. Dividend income is recorded on the ex-dividend date, except for certain dividends from foreign securities where the ex-dividend date may have passed, which are recorded as soon as the Funds are informed of the ex-dividend date. Non-cash dividends included in dividend income, if any, are recorded at the fair market value of the securities received. Income and capital gain distributions from Fidelity Central Funds, if any, are recorded on the ex-dividend date. Certain distributions received by the Funds represent a return of capital or capital gain. The Funds determine the components of these distributions subsequent to the ex-dividend date, based upon receipt of tax filings or other correspondence relating to the underlying investment. These distributions are recorded as a reduction of cost of investments and/or as a realized gain. Interest income is accrued as earned and includes coupon interest and amortization of premium and accretion of discount on debt securities as applicable. Investment income is recorded net of foreign taxes withheld where recovery of such taxes is uncertain.
Expenses. Expenses directly attributable to a fund are charged to that fund. Expenses attributable to more than one fund are allocated among the respective funds on the basis of relative net assets or other appropriate methods. Expense estimates are accrued in the period to which they relate and adjustments are made when actual amounts are known.
Deferred Trustee Compensation. Under a Deferred Compensation Plan (the Plan) for the Funds, independent Trustees may elect to defer receipt of a portion of their annual compensation. Deferred amounts are invested in a cross-section of Fidelity funds, are marked-to-market and remain in the Fund until distributed in accordance with the Plan. The investment of deferred amounts and the offsetting payable to the Trustees are included in the accompanying Statement of Assets and Liabilities.
Income Tax Information and Distributions to Shareholders. Each year, each Fund intends to qualify as a regulated investment company under Subchapter M of the Internal Revenue Code, including distributing substantially all of its taxable income and realized gains. As a result, no provision for U.S. Federal income taxes is required. As of February 28, 2018, each Fund did not have any unrecognized tax benefits in the financial statements; nor is each Fund aware of any tax positions for which it is reasonably possible that the total amounts of unrecognized tax benefits will significantly change in the next twelve months. Each Fund files a U.S. federal tax return, in addition to state and local tax returns as required. Each Fund's federal income tax returns are subject to examination by the Internal Revenue Service (IRS) for a period of three fiscal years after they are filed. State and local tax returns may be subject to examination for an additional fiscal year depending on the jurisdiction. Foreign taxes are provided for based on each Fund's understanding of the tax rules and rates that exist in the foreign markets in which it invests.
Distributions are declared and recorded on the ex-dividend date. Income and capital gain distributions are determined in accordance with income tax regulations, which may differ from GAAP. These differences resulted in distribution reclassifications. In addition, the Funds claimed a portion of the payment made to redeeming shareholders as a distribution for income tax purposes.
Capital accounts within the financial statements are adjusted for permanent book-tax differences. These adjustments have no impact on net assets or the results of operations. Capital accounts are not adjusted for temporary book-tax differences which will reverse in a subsequent period.
Book-tax differences are primarily due to foreign currency transactions, passive foreign investment companies (PFIC), partnerships, deferred trustees compensation, net operating losses, capital loss carryforwards and losses deferred due to wash sales and excise tax regulations.
As of period end, the cost and unrealized appreciation (depreciation) in securities, and derivatives if applicable, for federal income tax purposes were as follows for each Fund:
| | Tax cost | Gross unrealized appreciation | Gross unrealized depreciation | Net unrealized appreciation (depreciation) |
| Biotechnology Portfolio | $6,426,081,970 | $3,787,811,337 | $(612,077,792) | $3,175,733,545 |
| Health Care Portfolio | 5,410,277,368 | 1,995,919,906 | (212,139,109) | 1,783,780,797 |
| Health Care Services Portfolio | 525,831,446 | 348,052,924 | (14,849,661) | 333,203,263 |
| Medical Technology and Devices Portfolio | 3,224,462,153 | 980,270,316 | (79,402,355) | 900,867,961 |
| Pharmaceuticals Portfolio | 627,130,675 | 150,643,490 | (20,058,626) | 130,584,864 |
The tax-based components of distributable earnings as of period end were as follows for each Fund:
| | Undistributed ordinary income | Undistributed long-term capital gain | Capital loss carryforward | Net unrealized appreciation (depreciation) on securities and other investments |
| Biotechnology Portfolio | $– | $332,589,526 | $– | $3,175,742,597 |
| Health Care Portfolio | 25,463,340 | 215,808,779 | – | 1,783,780,166 |
| Health Care Services Portfolio | – | 42,955,725 | – | 333,202,327 |
| Medical Technology and Devices Portfolio | – | 168,753,273 | – | 900,876,219 |
| Pharmaceuticals Portfolio | 4,442,351 | – | (24,390,412) | 130,603,849 |
Capital loss carryforwards are only available to offset future capital gains of the Funds to the extent provided by regulations and may be limited. Under the Regulated Investment Company Modernization Act of 2010 (the Act), the Funds are permitted to carry forward capital losses incurred in taxable years beginning after December 22, 2010 for an unlimited period and such capital losses are required to be used prior to any losses that expire. The capital loss carryforward information presented below, including any applicable limitation, is estimated as of fiscal period end and is subject to adjustment.
| | No expiration | | |
| | Short-term | Total no expiration | Total capital loss carryfoward |
| Pharmaceuticals Portfolio | (24,390,412) | (24,390,412) | (24,390,412) |
Certain of the Funds intend to elect to defer to the next fiscal year ordinary losses recognized during the period January 1, 2018 to February 28, 2018. Loss deferrals were as follows:
| Biotechnology Portfolio | $1,355,899 |
| Health Care Services Portfolio | 192,826 |
| Medical Technology and Devices Portfolio | 2,294,245 |
The tax character of distributions paid was as follows:
| February 28, 2018 | | | |
| | Ordinary Income | Long-term Capital Gains | Total |
| Biotechnology Portfolio | $– | $123,724,434 | $123,724,434 |
| Health Care Portfolio | 21,379,940 | 138,319,156 | 159,699,096 |
| Health Care Services Portfolio | 817,273 | 99,374,269 | 100,191,542 |
| Medical Technology and Devices Portfolio | 6,689,760 | 221,756,409 | 228,446,169 |
| Pharmaceuticals Portfolio | 12,953,960 | – | 12,953,960 |
| February 28, 2017 | | | |
| | Ordinary Income | Long-term Capital Gains | Total |
| Biotechnology Portfolio | $– | $351,244,588 | $351,244,588 |
| Health Care Portfolio | 7,826,452 | 36,346,185 | 44,172,637 |
| Health Care Services Portfolio | 1,101,426 | 32,459,112 | 33,560,538 |
| Medical Technology and Devices Portfolio | 29,295,276 | 116,772,470 | 146,067,746 |
| Pharmaceuticals Portfolio | 11,379,757 | – | 11,379,757 |
Trading (Redemption) Fees. Shares held by investors in Health Care Services Portfolio less than 30 days may be subject to a redemption fee equal to .75% of the NAV of shares redeemed. All redemption fees, which reduce the proceeds of the shareholder redemption, are retained by the Funds and accounted for as an addition to paid in capital. In November 2017, the Board of Trustees approved the elimination of these redemption fees effective December 18, 2017.
Restricted Securities. The Funds may invest in securities that are subject to legal or contractual restrictions on resale. These securities generally may be resold in transactions exempt from registration or to the public if the securities are registered. Disposal of these securities may involve time-consuming negotiations and expense, and prompt sale at an acceptable price may be difficult. Information regarding restricted securities is included at the end of each applicable Fund's Schedule of Investments.
Consolidated Subsidiary. Biotechnology Portfolio invests in certain investments through a wholly-owned subsidiary ("Subsidiary"), which may be subject to federal and state taxes upon disposition.
As of period end, Biotechnology Portfolio held an investment of $74,971,648 in this Subsidiary, representing .84% of the Fund's net assets. The financial statements have been consolidated and include accounts of the Fund and the Subsidiary. Accordingly, all inter-company transactions and balances have been eliminated.
Any cash held by the Subsidiary is restricted as to its use and is presented as Restricted cash in the Statement of Assets and Liabilities.
4. Purchases and Sales of Investments.
Purchases and sales of securities, other than short-term securities, are noted in the table below.
| | Purchases ($) | Sales ($) |
| Biotechnology Portfolio | 2,359,167,558 | 4,402,233,661 |
| Health Care Portfolio | 5,057,912,547 | 5,700,827,836 |
| Health Care Services Portfolio | 514,902,384 | 567,103,693 |
| Medical Technology and Devices Portfolio | 3,267,136,059 | 2,921,865,906 |
| Pharmaceuticals Portfolio | 781,948,708 | 1,073,101,372 |
5. Fees and Other Transactions with Affiliates.
Management Fee. Fidelity SelectCo, LLC (the investment adviser) and its affiliates provide the Funds with investment management related services for which the Funds pay a monthly management fee. The management fee is the sum of an individual fund fee rate and an annualized group fee rate. The individual fund fee rate is applied to each Fund's average net assets. The group fee rate is based upon the average net assets of all the mutual funds advised by Fidelity Management & Research Company (FMR) and the investment adviser. The group fee rate decreases as assets under management increase and increases as assets under management decrease. For the reporting period, each Fund's annual management fee rate expressed as a percentage of each Fund's average net assets was as follows:
| | Individual Rate | Group Rate | Total |
| Biotechnology Portfolio | .30% | .24% | .54% |
| Health Care Portfolio | .30% | .24% | .54% |
| Health Care Services Portfolio | .30% | .24% | .54% |
| Medical Technology and Devices Portfolio | .30% | .24% | .54% |
| Pharmaceuticals Portfolio | .30% | .24% | .54% |
Transfer Agent Fees. Fidelity Investments Institutional Operations Company, Inc. (FIIOC), an affiliate of the investment adviser, is the Funds' transfer, dividend disbursing and shareholder servicing agent. FIIOC receives account fees and asset-based fees that vary according to account size and type of account. FIIOC pays for typesetting, printing and mailing of shareholder reports, except proxy statements. For the period, transfer agent fees were equivalent to the following annual rates expressed as a percentage of average net assets:
| Biotechnology Portfolio | .17% |
| Health Care Portfolio | .16% |
| Health Care Services Portfolio | .17% |
| Medical Technology and Devices Portfolio | .17% |
| Pharmaceuticals Portfolio | .21% |
Accounting and Security Lending Fees. Fidelity Service Company, Inc. (FSC), an affiliate of the investment adviser, maintains each Fund's accounting records. The accounting fee is based on the level of average net assets for each month. Under a separate contract, FSC administers the security lending program. The security lending fee is based on the number and duration of lending transactions.
Brokerage Commissions. Certain Funds placed a portion of their portfolio transactions with brokerage firms which are affiliates of the investment adviser. Brokerage commissions are included in net realized gain (loss) and change in net unrealized appreciation (depreciation) in the Statement of Operations. The commissions paid to these affiliated firms were as follows:
| | Amount |
| Biotechnology Portfolio | $193,803 |
| Health Care Portfolio | 134,978 |
| Health Care Services Portfolio | 10,560 |
| Medical Technology and Devices Portfolio | 61,618 |
| Pharmaceuticals Portfolio | 40,033 |
Interfund Lending Program. Pursuant to an Exemptive Order issued by the SEC, the Funds, along with other registered investment companies having management contracts with Fidelity Management & Research Company (FMR) or other affiliated entities of FMR, may participate in an interfund lending program. This program provides an alternative credit facility allowing the funds to borrow from, or lend money to, other participating affiliated funds. At period end, there were no interfund loans outstanding. Each applicable fund's activity in this program during the period for which loans were outstanding was as follows:
| | Borrower or Lender | Average Loan Balance | Weighted Average Interest Rate | Interest Expense |
| Health Care Portfolio | Borrower | $9,338,125 | 1.09% | $2,252 |
| Medical Technology and Devices Portfolio | Borrower | $7,544,000 | 1.41% | $884 |
| Pharmaceuticals Portfolio | Borrower | $8,670,714 | 1.17% | $1,970 |
Interfund Trades. The Funds may purchase from or sell securities to other Fidelity Funds under procedures adopted by the Board. The procedures have been designed to ensure these interfund trades are executed in accordance with Rule 17a-7 of the 1940 Act. Interfund trades are included within the respective purchases and sales amounts shown in the Purchases and Sales of Investments note.
Prior Fiscal Year Redemptions In-Kind. During the prior period, 1,587,958 shares of Health Care Portfolio held by an affiliated entity were redeemed in-kind for investments and cash with a value of $284,244,539. The Fund had a net realized gain of $90,840,956 on investments delivered through in-kind redemptions. The amount of in-kind redemptions is included in share transactions in the accompanying Statement of Changes in Net Assets. Health Care Portfolio recognized no gain or loss for federal income tax purposes.
Other. During the period, the investment adviser reimbursed the Funds for certain losses as follows:
| | Amount |
| Health Care Portfolio | $6,141 |
| Pharmaceuticals Portfolio | 10,087 |
6. Committed Line of Credit.
Certain Funds participate with other funds managed by the investment adviser or an affiliate in a $4.25 billion credit facility (the "line of credit") to be utilized for temporary or emergency purposes to fund shareholder redemptions or for other short-term liquidity purposes. The participating funds have agreed to pay commitment fees on their pro-rata portion of the line of credit, which are reflected in Miscellaneous expenses on the Statement of Operations, and are as follows:
| Biotechnology Portfolio | $28,355 |
| Health Care Portfolio | 20,494 |
| Health Care Services Portfolio | 2,399 |
| Medical Technology and Devices Portfolio | 11,137 |
| Pharmaceuticals Portfolio | 2,885 |
During the period, the Funds did not borrow on this line of credit.
7. Security Lending.
Certain Funds lend portfolio securities through a lending agent from time to time in order to earn additional income. On the settlement date of the loan, each applicable Fund receives collateral (in the form of U.S. Treasury obligations, letters of credit and/or cash) against the loaned securities and maintains collateral in an amount not less than 100% of the market value of the loaned securities during the period of the loan. The market value of the loaned securities is determined at the close of business of the Funds and any additional required collateral is delivered to the Funds on the next business day. The Funds or borrower may terminate the loan at any time, and if the borrower defaults on its obligation to return the securities loaned because of insolvency or other reasons, the Funds may apply collateral received from the borrower against the obligation. The Funds may experience delays and costs in recovering the securities loaned. Any cash collateral received is invested in the Fidelity Securities Lending Cash Central Fund. The value of loaned securities and cash collateral at period end are disclosed on each applicable Fund's Statement of Assets and Liabilities. Security lending income represents the income earned on investing cash collateral, less rebates paid to borrowers and any lending agent fees associated with the loan, plus any premium payments received for lending certain types of securities. Security lending income is presented on each applicable Fund's Statement of Operations as a component of income from Fidelity Central Funds.
8. Expense Reductions.
Commissions paid to certain brokers with whom the investment adviser, or its affiliates, places trades on behalf of Certain Funds include an amount in addition to trade execution, which may be rebated back to the Funds to offset certain expenses. In addition, through arrangements with each applicable Fund's custodian, credits realized as a result of certain uninvested cash balances were used to reduce each applicable Fund's expenses. All of the applicable expense reductions are noted in the table below.
| | Brokerage Service reduction | Custody expense reduction |
| Biotechnology Portfolio | $302,131 | $1,831 |
| Health Care Portfolio | 433,317 | 998 |
| Health Care Services Portfolio | 29,399 | 127 |
| Medical Technology and Devices Portfolio | 179,038 | 190 |
| Pharmaceuticals Portfolio | 79,691 | – |
In addition, during the period the investment adviser reimbursed and/or waived a portion of operating expenses as follows:
| | Amount |
| Biotechnology Portfolio | $84,655 |
| Health Care Portfolio | 61,187 |
| Health Care Services Portfolio | 7,214 |
| Medical Technology and Devices Portfolio | 30,940 |
| Pharmaceuticals Portfolio | 8,890 |
9. Other.
The Funds' organizational documents provide former and current trustees and officers with a limited indemnification against liabilities arising in connection with the performance of their duties to the Funds. In the normal course of business, the Funds may also enter into contracts that provide general indemnifications. The Funds' maximum exposure under these arrangements is unknown as this would be dependent on future claims that may be made against the Funds. The risk of material loss from such claims is considered remote.
Report of Independent Registered Public Accounting Firm
To the Board of Trustees of Fidelity Select Portfolios and Shareholders of Biotechnology Portfolio, Health Care Portfolio, Health Care Services Portfolio, Medical Technology and Devices Portfolio and Pharmaceuticals Portfolio:
Opinions on the Financial Statements
We have audited the accompanying statements of assets and liabilities, including the schedules of investments, of Biotechnology Portfolio, Health Care Portfolio, Health Care Services Portfolio, Medical Technology and Devices Portfolio and Pharmaceuticals Portfolio (all of the funds constituting Fidelity Select Portfolios, hereafter collectively referred to as the "Funds") as of February 28, 2018, the related statements of operations for the year ended February 28, 2018, the statements of changes in net assets for each of the two years in the period ended February 28, 2018, including the related notes, and the financial highlights for each of the five years in the period ended February 28, 2018 (collectively referred to as the “financial statements”). In our opinion, the financial statements present fairly, in all material respects, the financial position of each of the Funds as of February 28, 2018, the results of each of their operations for the year then ended, the changes in each of their net assets for each of the two years in the period ended February 28, 2018 and each of the financial highlights for each of the five years in the period ended February 28, 2018 in conformity with accounting principles generally accepted in the United States of America.
Basis for Opinions
These financial statements are the responsibility of the Funds' management. Our responsibility is to express an opinion on the Funds' financial statements based on our audits. We are a public accounting firm registered with the Public Company Accounting Oversight Board (United States) (“PCAOB”) and are required to be independent with respect to the Funds in accordance with the U.S. federal securities laws and the applicable rules and regulations of the Securities and Exchange Commission and the PCAOB.
We conducted our audits of these financial statements in accordance with the standards of the PCAOB. Those standards require that we plan and perform the audit to obtain reasonable assurance about whether the financial statements are free of material misstatement, whether due to error or fraud.
Our audits included performing procedures to assess the risks of material misstatement of the financial statements, whether due to error or fraud, and performing procedures that respond to those risks. Such procedures included examining, on a test basis, evidence regarding the amounts and disclosures in the financial statements. Our audits also included evaluating the accounting principles used and significant estimates made by management, as well as evaluating the overall presentation of the financial statements. Our procedures included confirmation of securities owned as of February 28, 2018 by correspondence with the custodians and brokers; when replies were not received from brokers, we performed other auditing procedures. We believe that our audits provide a reasonable basis for our opinion.
PricewaterhouseCoopers LLP
Boston, Massachusetts
April 13, 2018
We have served as the auditor of one or more investment companies in the Fidelity group of funds since 1932.
Trustees and Officers
The Trustees, Members of the Advisory Board (if any), and officers of the trust and funds, as applicable, are listed below. The Board of Trustees governs each fund and is responsible for protecting the interests of shareholders. The Trustees are experienced executives who meet periodically throughout the year to oversee each fund's activities, review contractual arrangements with companies that provide services to each fund, oversee management of the risks associated with such activities and contractual arrangements, and review each fund's performance. Except for Jonathan Chiel and Michael E. Wiley, each of the Trustees oversees 281 funds. Mr. Chiel oversees 145 funds. Mr. Wiley oversees 193 funds.
The Trustees hold office without limit in time except that (a) any Trustee may resign; (b) any Trustee may be removed by written instrument, signed by at least two-thirds of the number of Trustees prior to such removal; (c) any Trustee who requests to be retired or who has become incapacitated by illness or injury may be retired by written instrument signed by a majority of the other Trustees; and (d) any Trustee may be removed at any special meeting of shareholders by a two-thirds vote of the outstanding voting securities of the trust. Each Trustee who is not an interested person (as defined in the 1940 Act) of the trust and the funds is referred to herein as an Independent Trustee. Each Independent Trustee shall retire not later than the last day of the calendar year in which his or her 75th birthday occurs. The Independent Trustees may waive this mandatory retirement age policy with respect to individual Trustees. Officers and Advisory Board Members hold office without limit in time, except that any officer or Advisory Board Member may resign or may be removed by a vote of a majority of the Trustees at any regular meeting or any special meeting of the Trustees. Except as indicated, each individual has held the office shown or other offices in the same company for the past five years.
Each fund’s Statement of Additional Information (SAI) includes more information about the Trustees. To request a free copy, call Fidelity at 1-800-544-8544.
Experience, Skills, Attributes, and Qualifications of the Trustees. The Governance and Nominating Committee has adopted a statement of policy that describes the experience, qualifications, attributes, and skills that are necessary and desirable for potential Independent Trustee candidates (Statement of Policy). The Board believes that each Trustee satisfied at the time he or she was initially elected or appointed a Trustee, and continues to satisfy, the standards contemplated by the Statement of Policy. The Governance and Nominating Committee also engages professional search firms to help identify potential Independent Trustee candidates who have the experience, qualifications, attributes, and skills consistent with the Statement of Policy. From time to time, additional criteria based on the composition and skills of the current Independent Trustees, as well as experience or skills that may be appropriate in light of future changes to board composition, business conditions, and regulatory or other developments, have also been considered by the professional search firms and the Governance and Nominating Committee. In addition, the Board takes into account the Trustees' commitment and participation in Board and committee meetings, as well as their leadership of standing and ad hoc committees throughout their tenure.
In determining that a particular Trustee was and continues to be qualified to serve as a Trustee, the Board has considered a variety of criteria, none of which, in isolation, was controlling. The Board believes that, collectively, the Trustees have balanced and diverse experience, qualifications, attributes, and skills, which allow the Board to operate effectively in governing each fund and protecting the interests of shareholders. Information about the specific experience, skills, attributes, and qualifications of each Trustee, which in each case led to the Board's conclusion that the Trustee should serve (or continue to serve) as a trustee of the funds, is provided below.
Board Structure and Oversight Function. James C. Curvey is an interested person and currently serves as Chairman. The Trustees have determined that an interested Chairman is appropriate and benefits shareholders because an interested Chairman has a personal and professional stake in the quality and continuity of services provided to the funds. Independent Trustees exercise their informed business judgment to appoint an individual of their choosing to serve as Chairman, regardless of whether the Trustee happens to be independent or a member of management. The Independent Trustees have determined that they can act independently and effectively without having an Independent Trustee serve as Chairman and that a key structural component for assuring that they are in a position to do so is for the Independent Trustees to constitute a substantial majority for the Board. The Independent Trustees also regularly meet in executive session. Ned C. Lautenbach serves as Chairman of the Independent Trustees and as such (i) acts as a liaison between the Independent Trustees and management with respect to matters important to the Independent Trustees and (ii) with management prepares agendas for Board meetings.
Fidelity® funds are overseen by different Boards of Trustees. The funds' Board oversees Fidelity's high income and certain equity funds, and other Boards oversee Fidelity's investment-grade bond, money market, asset allocation, and other equity funds. The asset allocation funds may invest in Fidelity® funds overseen by the funds' Board. The use of separate Boards, each with its own committee structure, allows the Trustees of each group of Fidelity® funds to focus on the unique issues of the funds they oversee, including common research, investment, and operational issues. On occasion, the separate Boards establish joint committees to address issues of overlapping consequences for the Fidelity® funds overseen by each Board.
The Trustees operate using a system of committees to facilitate the timely and efficient consideration of all matters of importance to the Trustees, each fund, and fund shareholders and to facilitate compliance with legal and regulatory requirements and oversight of the funds' activities and associated risks. The Board, acting through its committees, has charged SelectCo and its affiliates with (i) identifying events or circumstances the occurrence of which could have demonstrably adverse effects on the funds' business and/or reputation; (ii) implementing processes and controls to lessen the possibility that such events or circumstances occur or to mitigate the effects of such events or circumstances if they do occur; and (iii) creating and maintaining a system designed to evaluate continuously business and market conditions in order to facilitate the identification and implementation processes described in (i) and (ii) above. Because the day-to-day operations and activities of the funds are carried out by or through SelectCo, its affiliates, and other service providers, the funds' exposure to risks is mitigated but not eliminated by the processes overseen by the Trustees. While each of the Board's committees has responsibility for overseeing different aspects of the funds' activities, oversight is exercised primarily through the Operations, Audit, and Compliance Committees. In addition, the Independent Trustees have worked with Fidelity to enhance the Board's oversight of investment and financial risks, legal and regulatory risks, technology risks, and operational risks, including the development of additional risk reporting to the Board. Appropriate personnel, including but not limited to the funds' Chief Compliance Officer (CCO), SelectCo's internal auditor, the independent accountants, the funds' Treasurer and portfolio management personnel, make periodic reports to the Board's committees, as appropriate, including an annual review of Fidelity's risk management program for the Fidelity® funds. The responsibilities of each standing committee, including their oversight responsibilities, are described further under "Standing Committees of the Trustees."
Interested Trustees*:
Correspondence intended for a Trustee who is an interested person may be sent to Fidelity Investments, 245 Summer Street, Boston, Massachusetts 02210.
Name, Year of Birth; Principal Occupations and Other Relevant Experience+
James C. Curvey (1935)
Year of Election or Appointment: 2018
Trustee
Chairman of the Board of Trustees
Mr. Curvey also serves as Trustee of other Fidelity® funds. Mr. Curvey is a Director of Fidelity Research & Analysis Co. (investment adviser firm, 2009-present), and Vice Chairman (2007-present) and Director of FMR LLC (diversified financial services company). In addition, Mr. Curvey serves as an Overseer for the Boston Symphony Orchestra and a member of the board of Artis-Naples, Naples, Florida, and as a Trustee for Brewster Academy, Wolfeboro, New Hampshire. Previously, Mr. Curvey served as a Director of Fidelity Investments Money Management, Inc. (investment adviser firm, 2009-2014) and a Director of FMR and FMR Co., Inc. (investment adviser firms, 2007-2014).
Charles S. Morrison (1960)
Year of Election or Appointment: 2018
Trustee
Mr. Morrison also serves as Trustee of other funds. He serves as President of Fidelity SelectCo, LLC (investment adviser firm, 2017-present) and Fidelity Management & Research Company (FMR) (investment adviser firm, 2016-present), a Director of Fidelity Investments Money Management, Inc. (FIMM) (investment adviser firm, 2014-present), Director of Fidelity SelectCo, LLC (investment adviser firm, 2014-present), President, Asset Management (2014-present), and is an employee of Fidelity Investments. Previously, Mr. Morrison served as Vice President of Fidelity's Fixed Income and Asset Allocation Funds (2012-2014), President, Fixed Income (2011-2014), Vice President of Fidelity's Money Market Funds (2005-2009), President, Money Market Group Leader of FMR (investment adviser firm, 2009), and Senior Vice President, Money Market Group of FMR (2004-2009). Mr. Morrison also served as Vice President of Fidelity's Bond Funds (2002-2005), certain Balanced Funds (2002-2005), and certain Asset Allocation Funds (2002-2007), and as Senior Vice President (2002-2005) of Fidelity's Bond Division.
* Determined to be an "Interested Trustee" by virtue of, among other things, his or her affiliation with the trust or various entities under common control with SelectCo.
+ The information includes the Trustee's principal occupation during the last five years and other information relating to the experience, attributes, and skills relevant to the Trustee's qualifications to serve as a Trustee, which led to the conclusion that the Trustee should serve as a Trustee for each fund.
Independent Trustees:
Correspondence intended for an Independent Trustee may be sent to Fidelity Investments, P.O. Box 55235, Boston, Massachusetts 02205-5235.
Name, Year of Birth; Principal Occupations and Other Relevant Experience+
Dennis J. Dirks (1948)
Year of Election or Appointment: 2018
Trustee
Mr. Dirks also serves as Trustee of other Fidelity® funds. Prior to his retirement in May 2003, Mr. Dirks was Chief Operating Officer and a member of the Board of The Depository Trust & Clearing Corporation (DTCC). He also served as President, Chief Operating Officer, and Board member of The Depository Trust Company (DTC) and President and Board member of the National Securities Clearing Corporation (NSCC). In addition, Mr. Dirks served as Chief Executive Officer and Board member of the Government Securities Clearing Corporation, Chief Executive Officer and Board member of the Mortgage-Backed Securities Clearing Corporation, as a Trustee and a member of the Finance Committee of Manhattan College (2005-2008), as a Trustee and a member of the Finance Committee of AHRC of Nassau County (2006-2008), as a member of the Independent Directors Council (IDC) Governing Council (2010-2015), and as a member of the Board of Directors for The Brookville Center for Children’s Services, Inc. (2009-2017). Mr. Dirks is a member of the Finance Committee (2016-present) and Board of Directors (2017-present) of the Asolo Repertory Theatre.
Donald F. Donahue (1950)
Year of Election or Appointment: 2018
Trustee
Mr. Donahue also serves as a Trustee of other Fidelity® funds. Mr. Donahue is President and Chief Executive Officer of Miranda Partners, LLC (risk consulting for the financial services industry, 2012-present). Previously, Mr. Donahue served as a Member of the Advisory Board of certain Fidelity® funds (2015-2018) and Chief Executive Officer (2006-2012), Chief Operating Officer (2003-2006), and Managing Director, Customer Marketing and Development (1999-2003) of The Depository Trust & Clearing Corporation (financial markets infrastructure). Mr. Donahue serves as a Member (2007-present) and Co-Chairman (2016-present) of the Board of Directors of United Way of New York, Member of the Board of Directors of NYC Leadership Academy (2012-present) and Member of the Board of Advisors of Ripple Labs, Inc. (financial services, 2015-present). He also served as Chairman (2010-2012) and Member of the Board of Directors (2012-2013) of Omgeo, LLC (financial services), Treasurer of United Way of New York (2012-2016), and Member of the Board of Directors of XBRL US (financial services non-profit, 2009-2012) and the International Securities Services Association (2009-2012).
Alan J. Lacy (1953)
Year of Election or Appointment: 2018
Trustee
Mr. Lacy also serves as Trustee of other Fidelity® funds. Mr. Lacy serves as a Director of Bristol-Myers Squibb Company (global pharmaceuticals, 2008-present). He is a Trustee of the California Chapter of The Nature Conservancy (2015-present) and a Director of the Center for Advanced Study in the Behavioral Sciences at Stanford University (2015-present). In addition, Mr. Lacy served as Senior Adviser (2007-2014) of Oak Hill Capital Partners, L.P. (private equity) and also served as Chief Executive Officer (2005) and Vice Chairman (2005-2006) of Sears Holdings Corporation (retail) and Chief Executive Officer and Chairman of the Board of Sears, Roebuck and Co. (retail, 2000-2005). Previously, Mr. Lacy served as Chairman (2014-2017) and a member (2010-2017) of the Board of Directors of Dave & Buster’s Entertainment, Inc. (restaurant and entertainment complexes), as Chairman (2008-2011) and a member (2006-2015) of the Board of Trustees of the National Parks Conservation Association, and as a member of the Board of Directors for The Hillman Companies, Inc. (hardware wholesalers, 2010-2014), Earth Fare, Inc. (retail grocery, 2010-2014), and The Western Union Company (global money transfer, 2006-2011).
Ned C. Lautenbach (1944)
Year of Election or Appointment: 2018
Trustee
Chairman of the Independent Trustees
Mr. Lautenbach also serves as Trustee of other Fidelity® funds. Mr. Lautenbach currently serves as Vice Chair of the Board of Governors, State University System of Florida (2013-present) and is a member of the Council on Foreign Relations (1994-present). He is also a member and has most recently served as Chairman of the Board of Directors of Artis-Naples (2012-present). Previously, Mr. Lautenbach served as a member and then Lead Director of the Board of Directors of Eaton Corporation (diversified industrial, 1997-2016). He was also a Partner and Advisory Partner at Clayton, Dubilier & Rice, LLC (private equity investment, 1998-2010), as well as a Director of Sony Corporation (2006-2007). In addition, Mr. Lautenbach also had a 30-year career with IBM (technology company) during which time he served as Senior Vice President and a member of the Corporate Executive Committee (1968-1998).
Joseph Mauriello (1944)
Year of Election or Appointment: 2018
Trustee
Mr. Mauriello also serves as Trustee of other Fidelity® funds. Prior to his retirement in January 2006, Mr. Mauriello served in numerous senior management positions including Deputy Chairman and Chief Operating Officer (2004-2005), and Vice Chairman of Financial Services (2002-2004) of KPMG LLP US (professional services, 1965-2005). Mr. Mauriello currently serves as a member of the Board of Directors of XL Group plc. (global insurance and re-insurance, 2006-present) and the Independent Directors Council (IDC) Governing Council (2015-present). Previously, Mr. Mauriello served as a Director of the Hamilton Funds of the Bank of New York (2006-2007) and of Arcadia Resources Inc. (health care services and products, 2007-2012).
Cornelia M. Small (1944)
Year of Election or Appointment: 2018
Trustee
Ms. Small also serves as Trustee of other Fidelity® funds. Ms. Small is a member of the Board of Directors (2009-present) and Chair of the Investment Committee (2010-present) of the Teagle Foundation. Ms. Small also serves on the Investment Committee of the Berkshire Taconic Community Foundation (2008-present). Previously, Ms. Small served as Chairperson (2002-2008) and a member of the Investment Committee and Chairperson (2008-2012) and a member of the Board of Trustees of Smith College. In addition, Ms. Small served as Chief Investment Officer, Director of Global Equity Investments, and a member of the Board of Directors of Scudder, Stevens & Clark and Scudder Kemper Investments.
Garnett A. Smith (1947)
Year of Election or Appointment: 2013
Trustee
Mr. Smith also serves as Trustee of other Fidelity® funds. Prior to Mr. Smith's retirement, he served as Chairman and Chief Executive Officer of Inbrand Corp. (manufacturer of personal absorbent products, 1990-1997). He also served as President (1986-1990) of Inbrand Corp. Prior to his employment with Inbrand Corp., he was employed by a retail fabric chain and North Carolina National Bank. In addition, Mr. Smith served as a Member of the Advisory Board of certain Fidelity® funds (2012-2013) and as a board member of the Jackson Hole Land Trust (2009-2012).
David M. Thomas (1949)
Year of Election or Appointment: 2018
Trustee
Mr. Thomas also serves as Trustee of other Fidelity® funds. Mr. Thomas serves as Non-Executive Chairman of the Board of Directors of Fortune Brands Home and Security (home and security products, 2011-present), as a member of the Board of Directors (2004-present) and Presiding Director (2013-present) of Interpublic Group of Companies, Inc. (marketing communication), and as a member of the Board of Trustees of the University of Florida (2013-present). Previously, Mr. Thomas served as Executive Chairman (2005-2006) and Chairman and Chief Executive Officer (2000-2005) of IMS Health, Inc. (pharmaceutical and healthcare information solutions), and a Director of Fortune Brands, Inc. (consumer products, 2000-2011).
Michael E. Wiley (1950)
Year of Election or Appointment: 2008
Trustee
Mr. Wiley also serves as Trustee or Member of the Advisory Board of other Fidelity® funds. Mr. Wiley serves as a Director of Andeavor Corporation (independent oil refiner and marketer, 2005-present), a Director of Andeavor Logistics LP (natural resources logistics, 2015-present), and a Director of Bill Barrett Corporation (exploration and production, 2005-present). In addition, Mr. Wiley also serves as a Director of Post Oak Bank (privately-held bank, 2004-present). Previously, Mr. Wiley served as a Trustee of other Fidelity® funds (2008-2013), as a Director of Asia Pacific Exploration Consolidated (international oil and gas exploration and production, 2008-2013), as a member of the Board of Trustees of the University of Tulsa (2000-2006; 2007-2010), as a Senior Energy Advisor of Katzenbach Partners, LLC (consulting, 2006-2007), as an Advisory Director of Riverstone Holdings (private investment), Chairman, President, and CEO of Baker Hughes, Inc. (oilfield services, 2000-2004), and as Director of Spinnaker Exploration Company (exploration and production, 2001-2005).
+ The information includes the Trustee's principal occupation during the last five years and other information relating to the experience, attributes, and skills relevant to the Trustee's qualifications to serve as a Trustee, which led to the conclusion that the Trustee should serve as a Trustee for each fund.
Advisory Board Members and Officers:
Correspondence intended for a Member of the Advisory Board (if any) may be sent to Fidelity Investments, P.O. Box 55235, Boston, Massachusetts 02205-5235. Correspondence intended for an officer or Peter S. Lynch may be sent to Fidelity Investments, 245 Summer Street, Boston, Massachusetts 02210. Officers appear below in alphabetical order.
Name, Year of Birth; Principal Occupation
Peter S. Lynch (1944)
Year of Election or Appointment: 2018
Member of the Advisory Board
Mr. Lynch also serves as Member of the Advisory Board of other Fidelity® funds. Mr. Lynch is Vice Chairman and a Director of FMR (investment adviser firm) and FMR Co., Inc. (investment adviser firm). In addition, Mr. Lynch serves as a Trustee of Boston College and as the Chairman of the Inner-City Scholarship Fund. Previously, Mr. Lynch served on the Special Olympics International Board of Directors (1997-2006).
William S. Stavropoulos (1939)
Year of Election or Appointment: 2018
Member of the Advisory Board
Mr. Stavropoulos also serves as Member of the Advisory Board of other Fidelity® funds. Mr. Stavropoulos serves as President and Founder of the Michigan Baseball Foundation, the Great Lakes Loons (2007-present). Mr. Stavropoulos is Chairman Emeritus of the Board of Directors of The Dow Chemical Company, where he previously served in numerous senior management positions, including President, CEO (1995-2000; 2002-2004), Chairman of the Executive Committee (2000-2006), and as a member of the Board of Directors (1990-2006). Currently, Mr. Stavropoulos is Chairman of the Board of Directors of Univar Inc. (global distributor of commodity and specialty chemicals), a Director of Teradata Corporation (data warehousing and technology solutions), and a member of the Advisory Board for Metalmark Capital LLC (private equity investment, 2005-present). Mr. Stavropoulos is an operating advisor to Clayton, Dubilier & Rice, LLC (private equity investment). In addition, Mr. Stavropoulos is a member of the University of Notre Dame Advisory Council for the College of Science, a Trustee of the Rollin L. Gerstacker Foundation, and a Director of Artis-Naples in Naples, Florida. Previously, Mr. Stavropoulos served as Trustee of certain Fidelity® funds (2001-2018) and as a Director of Chemical Financial Corporation (bank holding company, 1993-2012) and Tyco International, Ltd. (multinational manufacturing and services, 2007-2012).
Carol B. Tomé (1957)
Year of Election or Appointment: 2017
Member of the Advisory Board
Ms. Tomé also serves as Member of the Advisory Board of other Fidelity® funds. Ms. Tomé is Chief Financial Officer (2001-present) and Executive Vice President of Corporate Services (2007-present) of The Home Depot, Inc. (home improvement retailer) and a Director (2003-present) and Chair of the Audit Committee (2004-present) of United Parcel Service, Inc. (package delivery and supply chain management). Previously, Ms. Tomé served as Trustee of certain Fidelity® funds (2017), Senior Vice President of Finance and Accounting/Treasurer (2000-2007) and Vice President and Treasurer (1995-2000) of The Home Depot, Inc. and Chair of the Board (2010-2012), Vice Chair of the Board (2009 and 2013), and a Director (2008-2013) of the Federal Reserve Bank of Atlanta. Ms. Tomé is also a director or trustee of many community and professional organizations.
Elizabeth Paige Baumann (1968)
Year of Election or Appointment: 2017
Anti-Money Laundering (AML) Officer
Ms. Baumann also serves as AML Officer of other funds. She is Chief AML Officer (2012-present) and Senior Vice President (2014-present) of FMR LLC (diversified financial services company) and is an employee of Fidelity Investments. Previously, Ms. Baumann served as AML Officer of the funds (2012-2016), and Vice President (2007-2014) and Deputy Anti-Money Laundering Officer (2007-2012) of FMR LLC.
Marc R. Bryant (1966)
Year of Election or Appointment: 2013
Secretary and Chief Legal Officer (CLO)
Mr. Bryant also serves as Secretary and CLO of other funds. Mr. Bryant serves as CLO, Secretary, and Senior Vice President of Fidelity Management & Research Company (investment adviser firm, 2015-present) and FMR Co., Inc. (investment adviser firm, 2015-present); Secretary of Fidelity SelectCo, LLC (investment adviser firm, 2015-present) and Fidelity Investments Money Management, Inc. (investment adviser firm, 2015-present); and CLO of Fidelity Management & Research (Hong Kong) Limited and FMR Investment Management (UK) Limited (investment adviser firms, 2015-present) and Fidelity Management & Research (Japan) Limited (investment adviser firm, 2016-present). He is Senior Vice President and Deputy General Counsel of FMR LLC (diversified financial services company). Previously, Mr. Bryant served as Secretary and CLO of Fidelity Rutland Square Trust II (2010-2014) and Assistant Secretary of Fidelity's Fixed Income and Asset Allocation Funds (2013-2015). Prior to joining Fidelity Investments, Mr. Bryant served as a Senior Vice President and the Head of Global Retail Legal for AllianceBernstein L.P. (2006-2010), and as the General Counsel for ProFund Advisors LLC (2001-2006).
William C. Coffey (1969)
Year of Election or Appointment: 2009
Assistant Secretary
Mr. Coffey also serves as Assistant Secretary of other funds. He is Senior Vice President and Deputy General Counsel of FMR LLC (diversified financial services company, 2010-present), and is an employee of Fidelity Investments. Previously, Mr. Coffey served as Vice President and Associate General Counsel of FMR LLC (2005-2009).
Jonathan Davis (1968)
Year of Election or Appointment: 2010
Assistant Treasurer
Mr. Davis also serves as Assistant Treasurer of other funds. Mr. Davis serves as Assistant Treasurer of FMR Capital, Inc. (2017-present) and is an employee of Fidelity Investments. Previously, Mr. Davis served as Vice President and Associate General Counsel of FMR LLC (diversified financial services company, 2003-2010).
Adrien E. Deberghes (1967)
Year of Election or Appointment: 2018
Assistant Treasurer
Mr. Deberghes also serves as an officer of other funds. He serves as Assistant Treasurer of FMR Capital, Inc. (2017-present), Executive Vice President of Fidelity Investments Money Management, Inc. (FIMM) (investment adviser firm, 2016-present), and is an employee of Fidelity Investments (2008-present). Previously, Mr. Deberghes served as President and Treasurer of certain Fidelity® funds (2013-2018). Prior to joining Fidelity Investments, Mr. Deberghes was Senior Vice President of Mutual Fund Administration at State Street Corporation (2007-2008), Senior Director of Mutual Fund Administration at Investors Bank & Trust (2005-2007), and Director of Finance for Dunkin' Brands (2000-2005). Previously, Mr. Deberghes served in other fund officer roles.
Joseph DeSantis (1959)
Year of Election or Appointment: 2015
Vice President
Mr. DeSantis also serves as Vice President of other funds. Mr. DeSantis serves as a Director of Fidelity Management & Research (Japan) Limited (investment adviser firm, 2016-present), Chief Investment Officer, Equities (2010-present) and is an employee of Fidelity Investments.
Stephanie J. Dorsey (1969)
Year of Election or Appointment: 2010
Assistant Treasurer
Ms. Dorsey also serves as an officer of other funds. Ms. Dorsey serves as Assistant Treasurer of FMR Capital, Inc. (2017-present), is an employee of Fidelity Investments (2008-present), and has served in other fund officer roles. Prior to joining Fidelity Investments, Ms. Dorsey served as Treasurer (2004-2008) of the JPMorgan Mutual Funds and Vice President (2004-2008) of JPMorgan Chase Bank.
Howard J. Galligan III (1966)
Year of Election or Appointment: 2014
Chief Financial Officer
Mr. Galligan also serves as Chief Financial Officer of other funds. Mr. Galligan serves as President of Fidelity Pricing and Cash Management Services (FPCMS) (2014-present) and as a Director of Strategic Advisers LLC (investment adviser firm, 2008-present). Previously, Mr. Galligan served as Chief Administrative Officer of Asset Management (2011-2014) and Chief Operating Officer and Senior Vice President of Investment Support for Strategic Advisers, Inc. (2003-2011).
Brian B. Hogan (1964)
Year of Election or Appointment: 2009
Vice President
Mr. Hogan also serves as Trustee or Vice President of other funds. Mr. Hogan serves as Head of Fidelity Investments’ Investment Solutions and Innovation organization (2018-present), and as a Director of FMR Investment Management (UK) Limited (investment adviser firm, 2015-present) and Fidelity SelectCo, LLC (investment adviser firm, 2014-present). Previously, Mr. Hogan served as Trustee of certain Fidelity® funds (2014-2018), President of the Equity Division of FMR (investment adviser firm, 2009-2018), Senior Vice President, Equity Research of FMR (2006-2009), and as a portfolio manager. Mr. Brian B. Hogan is not related to Mr. Colm A. Hogan.
Colm A. Hogan (1973)
Year of Election or Appointment: 2018
Deputy Treasurer
Mr. Hogan also serves as an officer of other funds. Mr. Hogan serves as Assistant Treasurer of FMR Capital, Inc. (2017-present) and is an employee of Fidelity Investments (2005-present). Previously, Mr. Hogan served as Assistant Treasurer of certain Fidelity® funds (2016-2018). Mr. Colm A. Hogan is not related to Mr. Brian B. Hogan.
Chris Maher (1972)
Year of Election or Appointment: 2013
Assistant Treasurer
Mr. Maher serves as Assistant Treasurer of other funds. Mr. Maher is Vice President of Valuation Oversight, serves as Assistant Treasurer of FMR Capital, Inc. (2017-present), and is an employee of Fidelity Investments. Previously, Mr. Maher served as Vice President of Asset Management Compliance (2013), Vice President of the Program Management Group of FMR (investment adviser firm, 2010-2013), and Vice President of Valuation Oversight (2008-2010).
Rieco E. Mello (1969)
Year of Election or Appointment: 2017
Assistant Treasurer
Mr. Mello also serves as Assistant Treasurer of other funds. Mr. Mello serves as Assistant Treasurer of FMR Capital, Inc. (2017-present) and is an employee of Fidelity Investments (1995-present).
Kenneth B. Robins (1969)
Year of Election or Appointment: 2018
Chief Compliance Officer
Mr. Robins also serves as an officer of other funds. Mr. Robins serves as Compliance Officer of Fidelity Management & Research Company and FMR Co., Inc. (investment adviser firms, 2016-present) and is an employee of Fidelity Investments (2004-present). Previously, Mr. Robins served as Executive Vice President of Fidelity Investments Money Management, Inc. (investment adviser firm, 2013-2016) and served in other fund officer roles.
Stacie M. Smith (1974)
Year of Election or Appointment: 2018
President and Treasurer
Ms. Smith also serves as an officer of other funds. Ms. Smith serves as Assistant Treasurer of FMR Capital, Inc. (2017-present), is an employee of Fidelity Investments (2009-present), and has served in other fund officer roles. Prior to joining Fidelity Investments, Ms. Smith served as Senior Audit Manager of Ernst & Young LLP (accounting firm, 1996-2009). Previously, Ms. Smith served as Assistant Treasurer (2013-2018) and Deputy Treasurer (2013-2016) of certain Fidelity® funds.
Marc L. Spector (1972)
Year of Election or Appointment: 2017
Assistant Treasurer
Mr. Spector also serves as an officer of other funds. Mr. Spector serves as Assistant Treasurer of FMR Capital, Inc. (2017-present) and is an employee of Fidelity Investments (2016-present). Prior to joining Fidelity Investments, Mr. Spector served as Director at the Siegfried Group (accounting firm, 2013-2016), and prior to Siegfried Group as audit senior manager at Deloitte & Touche (accounting firm, 2005-2013).
Renee Stagnone (1975)
Year of Election or Appointment: 2016
Assistant Treasurer
Ms. Stagnone also serves as an officer of other funds. Ms. Stagnone serves as Assistant Treasurer of FMR Capital, Inc. (2017-present) and is an employee of Fidelity Investments (1997-present). Previously, Ms. Stagnone served as Deputy Treasurer of certain Fidelity® funds (2013-2016).
Shareholder Expense Example
As a shareholder of a Fund, you incur two types of costs: (1) transaction costs, including redemption fees and (2) ongoing costs, including management fees and other Fund expenses. This Example is intended to help you understand your ongoing costs (in dollars) of investing in the Funds and to compare these costs with the ongoing costs of investing in other mutual funds.
The Example is based on an investment of $1,000 invested at the beginning of the period and held for the entire period (September 1, 2017 to February 28, 2018).
Actual Expenses
The first line of the accompanying table for each fund provides information about actual account values and actual expenses. You may use the information in this line, together with the amount you invested, to estimate the expenses that you paid over the period. Simply divide your account value by $1,000.00 (for example, an $8,600 account value divided by $1,000.00 = 8.6), then multiply the result by the number in the first line for a fund under the heading entitled "Expenses Paid During Period" to estimate the expenses you paid on your account during this period. A small balance maintenance fee of $12.00 that is charged once a year may apply for certain accounts with a value of less than $2,000. This fee is not included in the table below. If it was, the estimate of expenses you paid during the period would be higher, and your ending account value lower, by this amount. In addition, each Fund, as a shareholder in the underlying Fidelity Central Funds, will indirectly bear its pro-rata share of the fees and expenses incurred by the underlying Fidelity Central Funds. These fees and expenses are not included in the Fund's annualized expense ratio used to calculate the expense estimate in the table below.
Hypothetical Example for Comparison Purposes
The second line of the accompanying table for each fund provides information about hypothetical account values and hypothetical expenses based on a fund's actual expense ratio and an assumed rate of return of 5% per year before expenses, which is not the Fund's actual return. The hypothetical account values and expenses may not be used to estimate the actual ending account balance or expenses you paid for the period. You may use this information to compare the ongoing costs of investing in the Fund and other funds. To do so, compare this 5% hypothetical example with the 5% hypothetical examples that appear in the shareholder reports of the other funds. A small balance maintenance fee of $12.00 that is charged once a year may apply for certain accounts with a value of less than $2,000. This fee is not included in the table below. If it was, the estimate of expenses you paid during the period would be higher, and your ending account value lower, by this amount. In addition, each Fund, as a shareholder in the underlying Fidelity Central Funds, will indirectly bear its pro-rata share of the fees and expenses incurred by the underlying Fidelity Central Funds. These fees and expenses are not included in the Fund's annualized expense ratio used to calculate the expense estimate in the table below.
Please note that the expenses shown in the table are meant to highlight your ongoing costs only and do not reflect any transaction costs. Therefore, the second line of the table is useful in comparing ongoing costs only, and will not help you determine the relative total costs of owning different funds. In addition, if these transactional costs were included, your costs would have been higher.
| | Annualized Expense Ratio-A | Beginning
Account Value
September 1, 2017 | Ending
Account Value
February 28, 2018 | Expenses Paid
During Period-B
September 1, 2017
to February 28, 2018 |
| Biotechnology Portfolio | .73% | | | |
| Actual | | $1,000.00 | $1,042.00 | $3.70 |
| Hypothetical-C | | $1,000.00 | $1,021.17 | $3.66 |
| Health Care Portfolio | .72% | | | |
| Actual | | $1,000.00 | $1,050.90 | $3.66 |
| Hypothetical-C | | $1,000.00 | $1,021.22 | $3.61 |
| Health Care Services Portfolio | .76% | | | |
| Actual | | $1,000.00 | $1,092.00 | $3.94 |
| Hypothetical-C | | $1,000.00 | $1,021.03 | $3.81 |
| Medical Technology and Devices Portfolio | .75% | | | |
| Actual | | $1,000.00 | $1,053.20 | $3.82 |
| Hypothetical-C | | $1,000.00 | $1,021.08 | $3.76 |
| Pharmaceuticals Portfolio | .80% | | | |
| Actual | | $1,000.00 | $1,001.10 | $3.97 |
| Hypothetical-C | | $1,000.00 | $1,020.83 | $4.01 |
A Annualized expense ratio reflects expenses net of applicable fee waivers.
B Expenses are equal to each Fund's annualized expense ratio, multiplied by the average account value over the period, multiplied by 181/ 365 (to reflect the one-half year period).
C 5% return per year before expenses
Distributions (Unaudited)
The Board of Trustees of each fund voted to pay to shareholders of record at the opening of business on record date, the following distributions per share derived from capital gains realized from sales of portfolio securities, and dividends derived from net investment income:
| | Pay Date | Record Date | Dividends | Capital Gains |
| Biotechnology Portfolio | 04/09/18 | 04/06/18 | $0.000 | $8.805 |
| Health Care Portfolio | 04/09/18 | 04/06/18 | $0.157 | $8.085 |
| Health Care Services Portfolio | 04/09/18 | 04/06/18 | $0.000 | $4.883 |
| Medical Technology and Devices Portfolio | 04/09/18 | 04/06/18 | $0.000 | $1.919 |
| Pharmaceuticals Portfolio | 04/09/18 | 04/06/18 | $0.062 | $0.054 |
|
The funds hereby designate as capital gain dividend the amounts noted below for the taxable year ended February 28, 2018, or, if subsequently determined to be different, the net capital gain of such year.
| Biotechnology Portfolio | $471,804,183 |
| Health Care Portfolio | $354,127,935 |
| Health Care Services Portfolio | $118,674,534 |
| Medical Technology and Devices Portfolio | $394,458,257 |
|
A percentage of the dividends distributed during the fiscal year for the following funds qualify for the dividends–received deduction for corporate shareholders:
| Health Care Portfolio | |
| December 2017 | 100% |
| Health Care Services Portfolio | |
| December 2017 | 100% |
| Medical Technology and Devices Portfolio | |
| December 2017 | 100% |
| Pharmaceuticals Portfolio | |
| April 2017 | 98% |
| December 2017 | 56% |
|
A percentage of the dividends distributed during the fiscal year for the following funds may be taken into account as a dividend for purposes of the maximum rate under section 1(h)(11) of the Internal Revenue Code.
| Health Care Portfolio | |
| December 2017 | 100% |
| Health Care Services Portfolio | |
| December 2017 | 100% |
| Medical Technology and Devices Portfolio | |
| December 2017 | 100% |
| Pharmaceuticals Portfolio | |
| April 2017 | 100% |
| December 2017 | 100% |
|
The funds will notify shareholders in January 2019 of amounts for use in preparing 2018 income tax returns.
Board Approval of Investment Advisory Contracts and Management Fees
Biotechnology Portfolio
Health Care Portfolio
Health Care Services Portfolio
Medical Equipment and Systems Portfolio
Pharmaceuticals Portfolio
Each year, the Board of Trustees, including the Independent Trustees (together, the Board), votes on the renewal of the management contract with Fidelity SelectCo, LLC (SelectCo), an affiliate of Fidelity Management & Research Company (FMR), and the sub-advisory agreements with affiliates of FMR (together, the Advisory Contracts) for each fund. SelectCo and the sub-advisers are collectively referred to herein as the Investment Advisers. The Board, assisted by the advice of fund counsel and Independent Trustees' counsel, requests and considers a broad range of information relevant to the renewal of the Advisory Contracts throughout the year.
The Board meets regularly and, at each of its meetings, covers an extensive agenda of topics and materials and considers factors that are relevant to its annual consideration of the renewal of each fund's Advisory Contracts, including the services and support provided to each fund and its shareholders. The Board has established four standing committees (Committees) — Operations, Audit, Fair Valuation, and Governance and Nominating — each composed of and chaired by Independent Trustees with varying backgrounds, to which the Board has assigned specific subject matter responsibilities in order to enhance effective decision-making by the Board. The Operations Committee, of which all of the Independent Trustees are members, meets regularly throughout the year and considers, among other matters, information specifically related to the annual consideration of the renewal of each fund's Advisory Contracts. The Board, acting directly and through its Committees, requests and receives information concerning the annual consideration of the renewal of each fund's Advisory Contracts. The Board also meets as needed to review matters specifically related to the Board's annual consideration of the renewal of the Advisory Contracts. Members of the Board may also meet with trustees of other Fidelity funds through ad hoc joint committees to discuss certain matters relevant to all of the Fidelity funds.
At its January 2018 meeting, the Board unanimously determined to renew each fund's Advisory Contracts. In reaching its determination, the Board considered all factors it believed relevant, including (i) the nature, extent, and quality of the services to be provided to each fund and its shareholders (including the investment performance of each fund); (ii) the competitiveness of each fund's management fee and total expense ratio relative to peer funds; (iii) the total costs of the services to be provided by and the profits to be realized by Fidelity from its relationships with each fund; and (iv) the extent to which, if any, economies of scale exist and would be realized as each fund grows, and whether any economies of scale are appropriately shared with fund shareholders.
In considering whether to renew the Advisory Contracts for each fund, the Board reached a determination, with the assistance of fund counsel and Independent Trustees' counsel and through the exercise of its business judgment, that the renewal of the Advisory Contracts was in the best interests of each fund and its shareholders and that the compensation payable under the Advisory Contracts was fair and reasonable. The Board's decision to renew the Advisory Contracts was not based on any single factor, but rather was based on a comprehensive consideration of all the information provided to the Board at its meetings throughout the year. The Board, in reaching its determination to renew the Advisory Contracts, was aware that shareholders of each fund have a broad range of investment choices available to them, including a wide choice among funds offered by Fidelity's competitors, and that each fund's shareholders, who have the opportunity to review and weigh the disclosure provided by the fund in its prospectus and other public disclosures, have chosen to invest in that fund, which is part of the Fidelity family of funds.
Amendment to Group Fee Rate. The Board also ratified an amendment to the management contract for each fund to add an additional breakpoint to the group fee schedule, which was effective October 1, 2017. The Board noted that the additional breakpoint would result in lower management fee rates to the extent that assets under management that are included in group fee calculations increase above the new breakpoint.
Nature, Extent, and Quality of Services Provided. The Board considered the staffing of the Investment Advisers as it relates to the funds, including the backgrounds of investment personnel of SelectCo, and also considered the funds' investment objectives, strategies, and related investment philosophies. The Independent Trustees also had discussions with senior management of Fidelity's investment operations and investment groups. The Board considered the structure of the investment personnel compensation program and whether this structure provides appropriate incentives to act in the best interests of each fund. Additionally, the Board considered the portfolio managers' investments, if any, in the funds that they manage.
Resources Dedicated to Investment Management and Support Services. The Board reviewed the general qualifications and capabilities of the Investment Advisers' investment staffs, including their size, education, experience, and resources, as well as Fidelity's approach to recruiting, training, managing, and compensating investment personnel. The Board noted that Fidelity has continued to increase the resources devoted to non-U.S. offices, including expansion of Fidelity's global investment organization. The Board also noted that Fidelity's analysts have extensive resources, tools and capabilities that allow them to conduct sophisticated quantitative and fundamental analysis, as well as credit analysis of issuers, counterparties and guarantors. Further, the Board considered that Fidelity's investment professionals have sufficient access to global information and data so as to provide competitive investment results over time, and that those professionals also have access to sophisticated tools that permit them to assess portfolio construction and risk and performance attribution characteristics continuously, as well as to transmit new information and research conclusions rapidly around the world. Additionally, in its deliberations, the Board considered Fidelity's trading, risk management, compliance, and technology and operations capabilities and resources, which are integral parts of the investment management process.
Shareholder and Administrative Services. The Board considered (i) the nature, extent, quality, and cost of advisory, administrative, and shareholder services performed by the Investment Advisers and their affiliates under the Advisory Contracts and under separate agreements covering transfer agency, pricing and bookkeeping, and securities lending services for each fund; (ii) the nature and extent of the supervision of third party service providers, principally custodians, subcustodians, and pricing vendors; and (iii) the resources devoted to, and the record of compliance with, each fund's compliance policies and procedures. The Board also reviewed the allocation of fund brokerage, including allocations to brokers affiliated with the Investment Advisers, the use of brokerage commissions to pay fund expenses, and the use of "soft" commission dollars to pay for research services.
The Board noted that the growth of fund assets over time across the complex allows Fidelity to reinvest in the development of services designed to enhance the value or convenience of the Fidelity funds as investment vehicles. These services include 24-hour access to account information and market information through telephone representatives and over the Internet, investor education materials and asset allocation tools, and the expanded availability of Fidelity Investor Centers.
The Board noted that it and the boards of certain other Fidelity funds had formed an ad hoc Committee on Transfer Agency Fees to review the variety of transfer agency fee structures throughout the industry and Fidelity's competitive positioning with respect to industry participants.
Investment in a Large Fund Family. The Board considered the benefits to shareholders of investing in a Fidelity fund, including the benefits of investing in a fund that is part of a large family of funds offering a variety of investment disciplines and providing a large variety of mutual fund investor services. The Board noted that Fidelity had taken, or had made recommendations that resulted in the Fidelity funds taking, a number of actions over the previous year that benefited particular funds, including: (i) continuing to dedicate additional resources to Fidelity's investment research process, which includes meetings with management of issuers in which the funds invest, and to the support of the senior management team that oversees asset management; (ii) continuing efforts to enhance Fidelity's global research capabilities; (iii) launching new funds and making other enhancements to meet client needs; (iv) launching new share classes of existing funds; (v) eliminating purchase minimums and broadening eligibility requirements for certain lower-priced share classes; (vi) reducing management fees and total expenses for certain growth equity funds and index funds; (vii) lowering expense caps for certain existing funds and classes to reduce expenses borne by shareholders; (viii) eliminating short-term redemption fees for certain funds; (ix) introducing a new pricing structure for certain funds of funds that is expected to reduce overall expenses paid by shareholders; (x) rationalizing product lines and gaining increased efficiencies through proposals for fund mergers and share class consolidations; (xi) continuing to develop, acquire and implement systems and technology to improve services to the funds and shareholders, strengthen information security, and increase efficiency; and (xii) implementing enhancements to further strengthen Fidelity's product line to increase investors' probability of success in achieving their investment goals, including retirement income goals.
Investment Performance. The Board considered whether each fund has operated in accordance with its investment objective, as well as its record of compliance with its investment restrictions and its performance history.
The Board took into account discussions with representatives of SelectCo about fund investment performance that occur at Board meetings throughout the year. In this regard the Board noted that as part of regularly scheduled fund reviews and other reports to the Board on fund performance, the Board considers annualized return information for each fund for different time periods, measured against a securities market index ("benchmark index"). In its evaluation of fund investment performance at meetings throughout the year, the Board gave particular attention to information indicating underperformance of certain Fidelity funds for specific time periods and discussed with the Investment Advisers the reasons for such underperformance. Biotechnology Portfolio underperformed its benchmark for the one-, three-, and five-year periods ended June 30, 2017, and as a result, the Board will continue to discuss with SelectCo the steps it is taking to address the fund's performance.
In addition to reviewing absolute and relative fund performance, the Independent Trustees periodically consider the appropriateness of fund performance metrics in evaluating the results achieved. In general, the Independent Trustees believe that fund performance should be evaluated based on net performance (after fees and expenses) of both the highest performing and lowest performing fund share classes, where applicable, compared to appropriate benchmark indices, over appropriate time periods that may include full market cycles, taking into account relevant factors, including the following: general market conditions; issuer-specific information; and fund cash flows and other factors. Depending on the circumstances, the Independent Trustees may be satisfied with a fund's performance notwithstanding that it lags its benchmark index for certain periods.
The Independent Trustees recognize that shareholders evaluate performance on a net basis over their own holding periods, for which one-, three-, and five-year periods are often used as a proxy. For this reason, the performance information reviewed by the Board also included net cumulative total return information for each fund and an appropriate benchmark index for the most recent one-, three-, and five-year periods ended June 30, 2017.
Based on its review, the Board concluded that the nature, extent, and quality of services provided to each fund under the Advisory Contracts should continue to benefit the shareholders of each fund.
Competitiveness of Management Fee and Total Expense Ratio. The Board considered each fund's management fee and total expense ratio compared to "mapped groups" of competitive funds and classes created for the purpose of facilitating the Trustees' analysis of the competitiveness of management fees and total expenses. Fidelity creates "mapped groups" by combining similar Lipper investment objective categories that have comparable investment mandates. For this purpose, all sector focused equity funds are grouped in the same mapped group. Combining Lipper investment objective categories aids the Board's management fee and total expense ratio comparisons by broadening the competitive group used for comparison.
Management Fee. The Board considered two proprietary management fee comparisons for the 12-month periods ended June 30 shown in basis points (BP) in the charts below. The group of Lipper funds used by the Board for management fee comparisons is referred to below as the "Total Mapped Group." The Total Mapped Group comparison focuses on a fund's standing in terms of gross management fees before expense reimbursements or caps relative to the total universe of funds with comparable investment mandates (
i.e., sector equities), regardless of whether their management fee structures also are comparable. Funds with comparable management fee structures have similar management fee contractual arrangements (
e.g., flat rate charged for advisory services, all-inclusive fee rate,
etc.). "TMG %" represents the percentage of funds in the Total Mapped Group that had management fees that were lower than a fund's. For example, a hypothetical TMG % of 20% would mean that 80% of the funds in the Total Mapped Group had higher, and 20% had lower, management fees than a fund. The funds' actual TMG %s and the number of funds in the Total Mapped Group are in the charts below. The "Asset-Size Peer Group" (ASPG) comparison focuses on a fund's standing relative to a subset of non-Fidelity funds within the Total Mapped Group that are similar in size and management fee structure. For example, if a fund is in the first quartile of the ASPG, the fund's management fee ranks in the least expensive or lowest 25% of funds in the ASPG. The ASPG represents at least 15% of the funds in the Total Mapped Group with comparable asset size and management fee structures, subject to a minimum of 50 funds (or all funds in the Total Mapped Group if fewer than 50). Additional information, such as the ASPG quartile in which a fund's management fee rate ranked, is also included in the charts and considered by the Board.
Biotechnology Portfolio

Health Care Portfolio
Health Care Services Portfolio
Medical Equipment and Systems Portfolio
Pharmaceuticals Portfolio
The Board noted that each fund's management fee rate ranked below the median of its Total Mapped Group and below the median of its ASPG for the 12-month period ended June 30, 2017.
The Board noted that it and the boards of other Fidelity funds formed an ad hoc Committee on Group Fee, which meets periodically, to conduct an in-depth review of the "group fee" component of the management fee of funds with such management fee structures. The Committee's focus included the mechanics of the group fee, the competitive landscape of group fee structures, Fidelity funds with no group fee component and investment products not included in group fee assets. The Board also considered that, for funds subject to the group fee, FMR agreed to voluntarily waive fees over a specified period of time in amounts designed to account for assets converted from certain funds to certain collective investment trusts.
Based on its review, the Board concluded that each fund's management fee is fair and reasonable in light of the services that each fund receives and the other factors considered.
Total Expense Ratio. In its review of each fund's total expense ratio, the Board considered the fund's management fee rate as well as other fund expenses, such as transfer agent fees, pricing and bookkeeping fees, and custodial, legal, and audit fees. The Board also noted that Fidelity may agree to waive fees and expenses from time to time, and the extent to which, if any, it has done so for each fund. As part of its review, the Board also considered the current and historical total expense ratios of each fund compared to competitive fund median expenses. Each fund is compared to those funds and classes in the Total Mapped Group (used by the Board for management fee comparisons) that have a similar sales load structure.
The Board noted that each fund's total expense ratio ranked below the competitive median for the 12-month period ended June 30, 2017.
Fees Charged to Other Fidelity Clients. The Board also considered Fidelity fee structures and other information with respect to clients of Fidelity, such as other funds advised or subadvised by Fidelity, pension plan clients, and other institutional clients with similar mandates. The Board noted that an ad hoc joint committee created by it and the boards of other Fidelity funds periodically reviews and compares Fidelity's institutional investment advisory business with its business of providing services to the Fidelity funds, including the differences in services provided, fees charged, and costs incurred, as well as competition in their respective marketplaces.
Based on its review of total expense ratios and fees charged to other Fidelity clients, the Board concluded that each fund's total expense ratio was reasonable in light of the services that each fund and its shareholders receive and the other factors considered.
Costs of the Services and Profitability. The Board considered the revenues earned and the expenses incurred by Fidelity in conducting the business of developing, marketing, distributing, managing, administering and servicing each fund and servicing each fund's shareholders. The Board also considered the level of Fidelity's profits in respect of all the Fidelity funds.
On an annual basis, Fidelity presents to the Board information about the profitability of its relationships with each fund. Fidelity calculates profitability information for each fund, as well as aggregate profitability information for groups of Fidelity funds and all Fidelity funds, using a series of detailed revenue and cost allocation methodologies which originate with the books and records of Fidelity on which Fidelity's audited financial statements are based. The Audit Committee of the Board reviews any significant changes from the prior year's methodologies.
PricewaterhouseCoopers LLP (PwC), independent registered public accounting firm and auditor to Fidelity and certain Fidelity funds, has been engaged annually by the Board as part of the Board's assessment of the profitability analysis used by Fidelity. PwC's engagement includes the review and assessment of Fidelity's methodologies used in determining the revenues and expenses attributable to Fidelity's mutual fund business, and completion of agreed-upon procedures in respect of the mathematical accuracy of the fund profitability information and its conformity to established allocation methodologies. After considering PwC's reports issued under the engagement and information provided by Fidelity, the Board concluded that while other allocation methods may also be reasonable, Fidelity's profitability methodologies are reasonable in all material respects.
The Board also reviewed Fidelity's non-fund businesses and potential fall-out benefits related to the mutual fund business as well as cases where Fidelity's affiliates may benefit from or be related to the funds' business.
The Board considered the costs of the services provided by and the profits realized by Fidelity in connection with the operation of each fund and was satisfied that the profitability was not excessive.
Economies of Scale. The Board considered whether there have been economies of scale in respect of the management of the Fidelity funds, whether the Fidelity funds (including each fund) have appropriately benefited from any such economies of scale, and whether there is potential for realization of any further economies of scale. The Board considered the extent to which each fund will benefit from economies of scale as assets grow through increased services to the fund, through waivers or reimbursements, or through fee or expense ratio reductions. The Board also noted that a committee (the Economies of Scale Committee) created by it and the boards of other Fidelity funds periodically analyzes whether Fidelity attains economies of scale in respect of the management and servicing of the Fidelity funds, whether the Fidelity funds have appropriately benefited from such economies of scale, and whether there is potential for realization of any further economies of scale.
The Board recognized that each fund's management contract incorporates a "group fee" structure, which provides for lower group fee rates as total group assets increase, and for higher group fee rates as total group assets decrease (with "group assets" defined to include fund assets under SelectCo's management plus assets under FMR's management). SelectCo calculates the group fee rates based on a tiered asset "breakpoint" schedule that varies based on asset class. The Board considered that the group fee is designed to deliver the benefits of economies of scale to fund shareholders when total group assets increase, even if assets of any particular fund are unchanged or have declined, because some portion of Fidelity's costs are attributable to services provided to all Fidelity funds, and all funds benefit if those costs can be allocated among more assets. The Board concluded that, given the group fee structure, fund shareholders will benefit from lower management fees as group assets increase at the fund complex level, regardless of whether Fidelity achieves any such economies of scale.
The Board concluded, taking into account the analysis of the Economies of Scale Committee, that economies of scale, if any, are being appropriately shared between fund shareholders and Fidelity.
Additional Information Requested by the Board. In order to develop fully the factual basis for consideration of the Fidelity funds' advisory contracts, the Board requested and received additional information on certain topics, including: (i) Fidelity's fund profitability methodology, profitability trends for certain funds, and the impact of certain factors on fund profitability results; (ii) portfolio manager changes that have occurred during the past year and the amount of the investment that each portfolio manager has made in the Fidelity fund(s) that he or she manages; (iii) Fidelity's compensation structure for portfolio managers, research analysts, and other key personnel, including its effects on fund profitability; (iv) comparisons to institutional products; (v) the arrangements with and compensation paid to certain fund sub-advisers on behalf of the Fidelity funds; (vi) the impact of proposed changes to contractual expense cap arrangements in place for certain funds; (vii) Fidelity's long-term expectations for its offerings in the workplace investing channel; (viii) the methodology with respect to evaluating competitive fund data and peer group classifications and fee comparisons; (ix) the presentation of certain fund performance information; (x) Fidelity's transfer agent fee, expense, and service structures for different funds and classes, including the increased use of omnibus accounts and lower pricing in the retirement channel; (xi) fluctuations in trading expenses; (xii) explanations regarding the relative total expense ratios of certain funds and classes; and (xiii) Fidelity's expectations regarding the future asset levels of certain funds.
Based on its evaluation of all of the conclusions noted above, and after considering all factors it believed relevant, the Board concluded that the advisory fee structures are fair and reasonable, and that each fund's Advisory Contracts should be renewed.
Proxy Voting Results
A special meeting of shareholders was held on December 8, 2017. The results of votes taken among shareholders on the proposals before them are reported below. Each vote reported represents one dollar of net asset value held on the record date for the meeting.
PROPOSAL 1
To elect a Board of Trustees.
| | # of
Votes | % of
Votes |
| James C. Curvey |
| Affirmative | 40,874,579,146.19 | 94.146 |
| Withheld | 2,541,618,753.48 | 5.854 |
| TOTAL | 43,416,197,899.67 | 100.000 |
| Dennis J. Dirks |
| Affirmative | 41,093,243,800.03 | 94.650 |
| Withheld | 2,322,954,099.64 | 5.350 |
| TOTAL | 43,416,197,899.67 | 100.000 |
| Donald F. Donahue |
| Affirmative | 41,121,116,505.64 | 94.714 |
| Withheld | 2,295,081,394.03 | 5.286 |
| TOTAL | 43,416,197,899.67 | 100.000 |
| Alan J. Lacy |
| Affirmative | 41,091,494,851.72 | 94.646 |
| Withheld | 2,324,703,047.95 | 5.354 |
| TOTAL | 43,416,197,899.67 | 100.00 |
| Ned C. Lautenbach |
| Affirmative | 40,970,733,721.42 | 94.368 |
| Withheld | 2,445,464,178.25 | 5.632 |
| TOTAL | 43,416,197,899.67 | 100.000 |
| Joseph Mauriello |
| Affirmative | 41,021,688,840.89 | 94.485 |
| Withheld | 2,394,509,058.78 | 5.515 |
| TOTAL | 43,416,197,899.67 | 100.000 |
| Charles S. Morrison |
| Affirmative | 41,163,534,997.01 | 94.812 |
| Withheld | 2,252,662,902.66 | 5.188 |
| TOTAL | 43,416,197,899.67 | 100.000 |
| Cornelia M. Small |
| Affirmative | 41,061,752,034.66 | 94.578 |
| Withheld | 2,354,445,865.01 | 5.422 |
| TOTAL | 43,416,197,899.67 | 100.000 |
| Garnett A. Smith |
| Affirmative | 41,061,939,407.02 | 94.578 |
| Withheld | 2,354,258,492.65 | 5.422 |
| TOTAL | 43,416,197,899.67 | 100.000 |
| David M. Thomas |
| Affirmative | 41,102,875,738.06 | 94.672 |
| Withheld | 2,313,322,161.61 | 5.328 |
| TOTAL | 43,416,197,899.67 | 100.000 |
| Michael E. Wiley |
| Affirmative | 41,112,279,187.11 | 94.694 |
| Withheld | 2,303,918,712.56 | 5.306 |
| TOTAL | 43,416,197,899.67 | 100.000 |
PROPOSAL 2
To eliminate a fundamental investment policy for Biotechnology Portfolio.
| | # of
Votes | % of
Votes |
| Affirmative | 4,133,784,465.21 | 68.474 |
| Against | 784,908,408.61 | 13.002 |
| Abstain | 404,996,408.35 | 6.708 |
| Broker Non-Vote | 713,369,365.69 | 11.816 |
| TOTAL | 6,037,058,647.86 | 100.000 |
PROPOSAL 2
To eliminate a fundamental investment policy for Health Care Portfolio.
| | # of
Votes | % of
Votes |
| Affirmative | 3,114,316,048.32 | 70.954 |
| Against | 532,405,861.41 | 12.130 |
| Abstain | 305,180,997.11 | 6.953 |
| Broker Non-Vote | 437,325,187.10 | 9.963 |
| TOTAL | 4,389,228,093.94 | 100.000 |
PROPOSAL 2
To eliminate a fundamental investment policy for Health Care Services Portfolio.
| | # of
Votes | % of
Votes |
| Affirmative | 357,522,359.89 | 69.482 |
| Against | 67,034,177.14 | 13.028 |
| Abstain | 38,534,017.42 | 7.488 |
| Broker Non-Vote | 51,469,878.36 | 10.002 |
| TOTAL | 514,560,432.81 | 100.000 |
PROPOSAL 2
To eliminate a fundamental investment policy for Medical Equipment and Systems Portfolio.
| | # of
Votes | % of
Votes |
| Affirmative | 1,987,367,885.97 | 71.929 |
| Against | 294,059,410.78 | 10.643 |
| Abstain | 204,010,962.50 | 7.384 |
| Broker Non-Vote | 277,527,195.83 | 10.044 |
| TOTAL | 2,762,965,455.08 | 100.000 |
PROPOSAL 2
To eliminate a fundamental investment policy for Pharmaceuticals Portfolio.
| | # of
Votes | % of
Votes |
| Affirmative | 379,308,625.04 | 71.408 |
| Against | 76,944,824.97 | 14.485 |
| Abstain | 33,311,723.30 | 6.271 |
| Broker Non-Vote | 41,624,309.76 | 7.836 |
| TOTAL | 531,189,483.07 | 100.000 |
PROPOSAL 3
To modify Biotechnology Portfolio's fundamental concentration policy.
| | # of
Votes | % of
Votes |
| Affirmative | 4,303,005,001.99 | 71.277 |
| Against | 633,421,335.16 | 10.493 |
| Abstain | 387,262,945.02 | 6.414 |
| Broker Non-Vote | 713,369,365.69 | 11.816 |
| TOTAL | 6,037,058,647.86 | 100.000 |
PROPOSAL 3
To modify Health Care Portfolio's fundamental concentration policy.
| | # of
Votes | % of
Votes |
| Affirmative | 3,202,326,337.39 | 72.959 |
| Against | 456,093,688.22 | 10.392 |
| Abstain | 293,482,881.23 | 6.686 |
| Broker Non-Vote | 437,325,187.10 | 9.963 |
| TOTAL | 4,389,228,093.94 | 100.000 |
PROPOSAL 3
To modify Health Care Services Portfolio's fundamental concentration policy.
| | # of
Votes | % of
Votes |
| Affirmative | 368,928,727.47 | 71.698 |
| Against | 57,584,105.81 | 11.191 |
| Abstain | 36,577,721.17 | 7.109 |
| Broker Non-Vote | 51,469,878.36 | 10.002 |
| TOTAL | 514,560,432.81 | 100.000 |
PROPOSAL 3
To modify Medical Equipment and Systems Portfolio's fundamental concentration policy.
| | # of
Votes | % of
Votes |
| Affirmative | $2,052,526,537.26 | 74.288 |
| Against | $246,340,254.50 | 8.916 |
| Abstain | $186,571,467.49 | 6.752 |
| Broker Non-Vote | $277,527,195.83 | 10.044 |
| TOTAL | $2,762,965,455.08 | 100.000 |
PROPOSAL 3
To modify Pharmaceuticals Portfolio's fundamental concentration policy.
| | # of
Votes | % of
Votes |
| Affirmative | 392,109,686.17 | 73.818 |
| Against | 62,905,944.23 | 11.842 |
| Abstain | 34,549,542.91 | 6.504 |
| Broker Non-Vote | 41,624,309.76 | 7.836 |
| TOTAL | 531,189,483.07 | 100.000 |
PROPOSAL 5
For Health Care Portfolio, a shareholder proposal requesting that the Board of Trustees institute procedures to avoid holding investments in companies that, in management's judgement, substantially contribute to genocide or crimes against humanity.
| | # of
Votes | % of
Votes |
| Affirmative | 1,209,926,160.94 | 27.566 |
| Against | 2,373,485,952.12 | 54.076 |
| Abstain | 368,490,793.78 | 8.395 |
| Broker Non-Vote | 437,325,187.10 | 9.963 |
| TOTAL | 4,389,228,093.94 | 100.000 |
| Proposal 1 reflects trust wide proposal and voting results. |
| Proposal 5 was not approved by shareholders. |
SELHC-ANN-0418
1.813640.113
Fidelity® Select Portfolios®
Materials Sector Chemicals Portfolio
Gold Portfolio
Materials Portfolio
Annual Report February 28, 2018 |
|
Contents
To view a fund's proxy voting guidelines and proxy voting record for the 12-month period ended June 30, visit http://www.fidelity.com/proxyvotingresults or visit the Securities and Exchange Commission's (SEC) web site at http://www.sec.gov.
You may also call 1-800-544-8544 to request a free copy of the proxy voting guidelines.
Standard & Poor's, S&P and S&P 500 are registered service marks of The McGraw-Hill Companies, Inc. and have been licensed for use by Fidelity Distributors Corporation.
Other third-party marks appearing herein are the property of their respective owners.
All other marks appearing herein are registered or unregistered trademarks or service marks of FMR LLC or an affiliated company. © 2018 FMR LLC. All rights reserved.
This report and the financial statements contained herein are submitted for the general information of the shareholders of the Funds. This report is not authorized for distribution to prospective investors in the Funds unless preceded or accompanied by an effective prospectus.
A fund files its complete schedule of portfolio holdings with the SEC for the first and third quarters of each fiscal year on Form N-Q. Forms N-Q are available on the SEC’s web site at http://www.sec.gov. A fund's Forms N-Q may be reviewed and copied at the SEC’s Public Reference Room in Washington, DC. Information regarding the operation of the SEC's Public Reference Room may be obtained by calling 1-800-SEC-0330.
For a complete list of a fund's portfolio holdings, view the most recent holdings listing, semiannual report, or annual report on Fidelity's web site at http://www.fidelity.com, http://www.institutional.fidelity.com, or http://www.401k.com, as applicable.
NOT FDIC INSURED •MAY LOSE VALUE •NO BANK GUARANTEE
Neither the Funds nor Fidelity Distributors Corporation is a bank.
Chemicals Portfolio
Performance: The Bottom Line
Average annual total return reflects the change in the value of an investment, assuming reinvestment of distributions from dividend income and capital gains (the profits earned upon the sale of securities that have grown in value, if any) and assuming a constant rate of performance each year. The hypothetical investment and the average annual total returns do not reflect the deduction of taxes that a shareholder would pay on fund distributions or the redemption of fund shares. During periods of reimbursement by Fidelity, a fund’s total return will be greater than it would be had the reimbursement not occurred. How a fund did yesterday is no guarantee of how it will do tomorrow.
Average Annual Total Returns
| For the periods ended February 28, 2018 | Past 1 year | Past 5 years | Past 10 years |
| Chemicals Portfolio | 16.31% | 13.53% | 12.21% |
$10,000 Over 10 Years
Let's say hypothetically that $10,000 was invested in Chemicals Portfolio on February 29, 2008.
The chart shows how the value of your investment would have changed, and also shows how the S&P 500® Index performed over the same period.
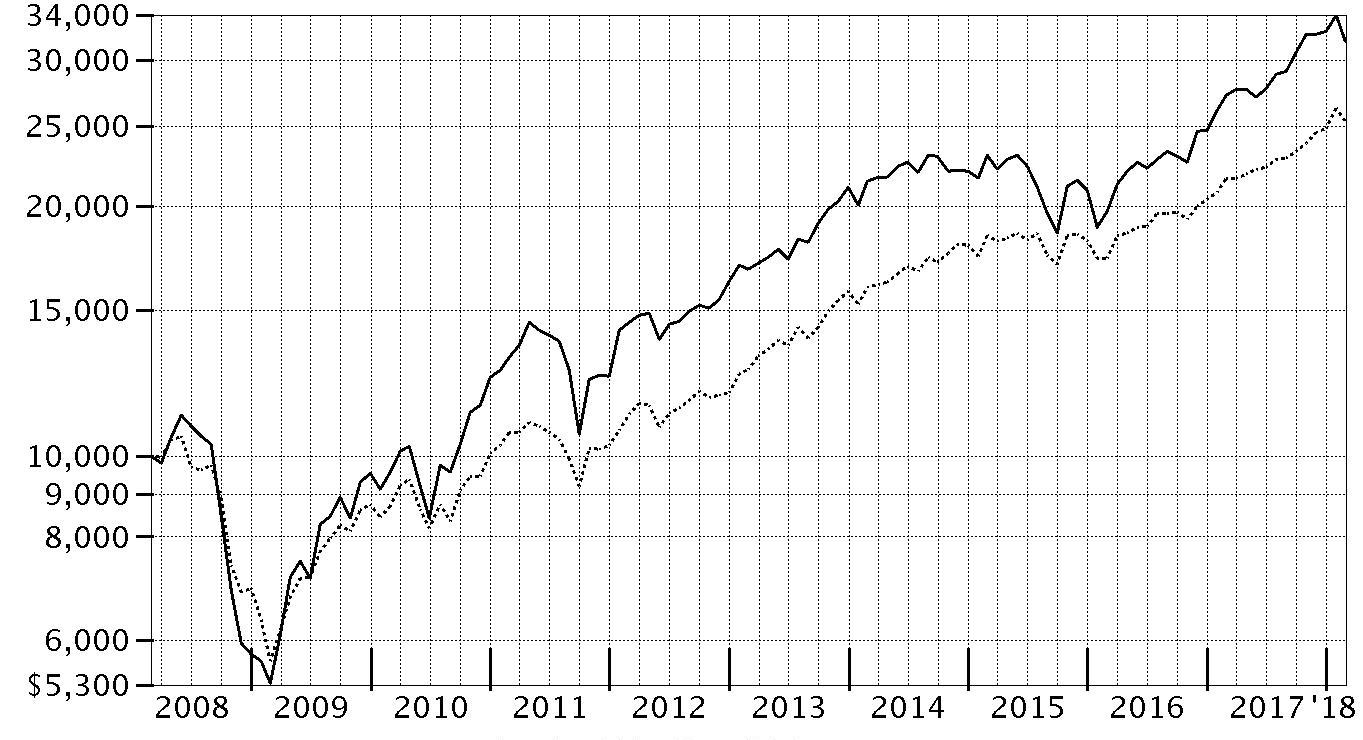
| Period Ending Values |
| $31,650 | Chemicals Portfolio |
| $25,307 | S&P 500® Index |
Chemicals Portfolio
Management's Discussion of Fund Performance
Market Recap: U.S. equities gained 17.10% for the 12 months ending February 28, 2018, as the S&P 500
® index moved steadily higher throughout 2017 and into 2018 until sharply reversing course in February. The drop was in stark contrast to the low volatility seen throughout 2017, along with consumer sentiment and other market indicators that stayed positive. Investors remained decidedly upbeat as the calendar turned, and the index rose 5.73% in January. February was a decidedly different story, though, as volatility spiked amid fear that rising inflation and the potential for the economy to overheat would prompt the U.S. Federal Reserve to pick up the pace of interest rate hikes. The index returned -3.69% for the month, its first negative result since October 2016. For the full 12 months, growth stocks handily topped value, while large-caps bested small-caps. By sector, information technology fared best by far, gaining 36% amid strong earnings growth from several major index constituents. Consumer discretionary (+22%) also stood out, driven by retailers. Financials added 20%, riding the uptick in bond yields. Materials and industrials rose about 16% each, boosted by higher demand, especially from China. Conversely, notable laggards included the defensive telecommunication services (-5%) and utilities (-2%) sectors, while rising rates held back real estate (-3%).
Comments from Portfolio Manager Rick Malnight: For the year, the fund gained 16.31%, topping the 15.71% return of the MSCI U.S. IMI Chemicals 25/50 Index but trailing the S&P 500
®. Versus the MSCI index, stock picking in commodity chemicals bolstered the fund’s performance most. Positioning in specialty chemicals and diversified chemicals also contributed meaningfully. A sizable overweighting in strong-performing Westlake Chemical was the fund’s top relative contributor. I significantly increased this position during the period. A large overweighting in Chemours, which manufactures the pigment titanium dioxide (TiO2), also bolstered our relative result, as did ethylene producer LyondellBasell Industries – the fund’s largest overweighting, and DowDuPont, its largest holding. Conversely, relative performance was hampered by stock picking in fertilizers & agricultural chemicals, a sizable non-index stake in chemicals distributor Univar, and a large underweighting in industrials gases. In the latter category, MSCI index stalwart Praxair finished as the fund’s largest relative detractor, as the stock advanced 29%, and we didn’t own it.
The views expressed above reflect those of the portfolio manager(s) only through the end of the period as stated on the cover of this report and do not necessarily represent the views of Fidelity or any other person in the Fidelity organization. Any such views are subject to change at any time based upon market or other conditions and Fidelity disclaims any responsibility to update such views. These views may not be relied on as investment advice and, because investment decisions for a Fidelity fund are based on numerous factors, may not be relied on as an indication of trading intent on behalf of any Fidelity fund.
Note to shareholders: On December 8, 2017, shareholders approved proposals from the Board of Trustees to eliminate each sector/industry fund's fundamental “invests primarily” policy and to modify the fundamental concentration policy for certain funds. The changes took effect on January 1, 2018, and do not impact how the funds are managed.
Chemicals Portfolio
Investment Summary (Unaudited)
Top Ten Stocks as of February 28, 2018
| | % of fund's net assets |
| DowDuPont, Inc. | 24.5 |
| LyondellBasell Industries NV Class A | 12.9 |
| Linde AG | 6.2 |
| The Chemours Co. LLC | 5.8 |
| Westlake Chemical Corp. | 4.8 |
| Sherwin-Williams Co. | 4.7 |
| Olin Corp. | 3.7 |
| FMC Corp. | 3.7 |
| Celanese Corp. Class A | 3.5 |
| Univar, Inc. | 3.1 |
| | 72.9 |
Top Industries (% of fund's net assets)
| As of February 28, 2018 |
| | Chemicals | 93.8% |
| | Trading Companies & Distributors | 3.1% |
| | Biotechnology | 0.2% |
| | All Others* | 2.9% |

* Includes short-term investments and net other assets (liabilities).
Chemicals Portfolio
Schedule of Investments February 28, 2018
Showing Percentage of Net Assets
| Common Stocks - 95.1% | | | |
| | | Shares | Value |
| Biotechnology - 0.2% | | | |
| Biotechnology - 0.2% | | | |
| Calyxt, Inc. | | 128,500 | $2,360,545 |
| Chemicals - 91.8% | | | |
| Commodity Chemicals - 28.1% | | | |
| Alpek SA de CV | | 4,880,400 | 6,322,295 |
| Cabot Corp. | | 225,400 | 13,564,572 |
| Ciner Resources LP | | 301,818 | 8,351,304 |
| LG Chemical Ltd. | | 49,729 | 17,527,956 |
| LyondellBasell Industries NV Class A | | 2,126,398 | 230,118,792 |
| Olin Corp. | | 2,027,147 | 65,882,278 |
| Orion Engineered Carbons SA | | 781,600 | 21,533,080 |
| Tronox Ltd. Class A | | 2,879,866 | 52,643,950 |
| Westlake Chemical Corp. | | 794,403 | 86,002,069 |
| | | | 501,946,296 |
| Diversified Chemicals - 35.2% | | | |
| Ashland Global Holdings, Inc. | | 344,095 | 24,368,808 |
| DowDuPont, Inc. | | 6,237,180 | 438,473,751 |
| Eastman Chemical Co. | | 467,357 | 47,240,446 |
| Huntsman Corp. | | 401,100 | 12,943,497 |
| LSB Industries, Inc. (a)(b) | | 462,200 | 3,452,634 |
| The Chemours Co. LLC | | 2,188,800 | 103,989,888 |
| | | | 630,469,024 |
| Fertilizers & Agricultural Chemicals - 8.7% | | | |
| AgroFresh Solutions, Inc. (a)(b) | | 392,967 | 3,041,565 |
| CF Industries Holdings, Inc. | | 758,100 | 31,264,044 |
| CVR Partners LP | | 1,058,200 | 3,650,790 |
| FMC Corp. | | 834,000 | 65,452,320 |
| Nutrien Ltd. | | 391,588 | 19,240,667 |
| The Scotts Miracle-Gro Co. Class A | | 369,212 | 33,170,006 |
| | | | 155,819,392 |
| Industrial Gases - 7.2% | | | |
| Air Products & Chemicals, Inc. | | 112,700 | 18,121,033 |
| Linde AG (a) | | 502,000 | 111,393,266 |
| | | | 129,514,299 |
| Specialty Chemicals - 12.6% | | | |
| Axalta Coating Systems Ltd. (a) | | 571,300 | 17,596,040 |
| Celanese Corp. Class A | | 616,400 | 62,170,104 |
| Frutarom Industries Ltd. | | 131,100 | 12,062,625 |
| Kraton Performance Polymers, Inc. (a) | | 74,148 | 3,144,617 |
| Platform Specialty Products Corp. (a) | | 3,420,090 | 35,705,740 |
| Sherwin-Williams Co. | | 212,253 | 85,236,560 |
| W.R. Grace & Co. | | 147,700 | 9,774,786 |
| | | | 225,690,472 |
|
| TOTAL CHEMICALS | | | 1,643,439,483 |
|
| Trading Companies & Distributors - 3.1% | | | |
| Trading Companies & Distributors - 3.1% | | | |
| Univar, Inc. (a) | | 1,938,194 | 55,839,369 |
| TOTAL COMMON STOCKS | | | |
| (Cost $1,213,071,958) | | | 1,701,639,397 |
|
| Nonconvertible Preferred Stocks - 2.0% | | | |
| Chemicals - 2.0% | | | |
| Commodity Chemicals - 2.0% | | | |
| Braskem SA (PN-A) | | | |
| (Cost $38,159,424) | | 2,538,700 | 36,310,705 |
|
| Money Market Funds - 4.3% | | | |
| Fidelity Cash Central Fund, 1.41% (c) | | 72,559,157 | 72,573,669 |
| Fidelity Securities Lending Cash Central Fund 1.42% (c)(d) | | 4,657,380 | 4,657,845 |
| TOTAL MONEY MARKET FUNDS | | | |
| (Cost $77,231,514) | | | 77,231,514 |
| TOTAL INVESTMENT IN SECURITIES - 101.4% | | | |
| (Cost $1,328,462,896) | | | 1,815,181,616 |
| NET OTHER ASSETS (LIABILITIES) - (1.4)% | | | (24,960,877) |
| NET ASSETS - 100% | | | $1,790,220,739 |
Legend
(a) Non-income producing
(b) Security or a portion of the security is on loan at period end.
(c) Affiliated fund that is generally available only to investment companies and other accounts managed by Fidelity Investments. The rate quoted is the annualized seven-day yield of the fund at period end. A complete unaudited listing of the fund's holdings as of its most recent quarter end is available upon request. In addition, each Fidelity Central Fund's financial statements, which are not covered by the Fund's Report of Independent Registered Public Accounting Firm, are available on the SEC's website or upon request.
(d) Investment made with cash collateral received from securities on loan.
Affiliated Central Funds
Information regarding fiscal year to date income earned by the Fund from investments in Fidelity Central Funds is as follows:
| Fund | Income earned |
| Fidelity Cash Central Fund | $253,631 |
| Fidelity Securities Lending Cash Central Fund | 34,387 |
| Total | $288,018 |
Amounts in the income column in the above table include any capital gain distributions from underlying funds, which are presented in the corresponding line-item in the Statement of Operations if applicable.
Investment Valuation
The following is a summary of the inputs used, as of February 28, 2018, involving the Fund's assets and liabilities carried at fair value. The inputs or methodology used for valuing securities may not be an indication of the risk associated with investing in those securities. For more information on valuation inputs, and their aggregation into the levels used below, please refer to the Investment Valuation section in the accompanying Notes to Financial Statements.
| | Valuation Inputs at Reporting Date: |
| Description | Total | Level 1 | Level 2 | Level 3 |
| Investments in Securities: | | | | |
| Common Stocks | $1,701,639,397 | $1,572,718,175 | $128,921,222 | $-- |
| Nonconvertible Preferred Stocks | 36,310,705 | 36,310,705 | -- | -- |
| Money Market Funds | 77,231,514 | 77,231,514 | -- | -- |
| Total Investments in Securities: | $1,815,181,616 | $1,686,260,394 | $128,921,222 | $-- |
Other Information
Distribution of investments by country or territory of incorporation, as a percentage of Total Net Assets, is as follows (Unaudited):
| United States of America | 70.7% |
| Netherlands | 12.9% |
| Germany | 6.2% |
| Australia | 2.9% |
| Brazil | 2.0% |
| Luxembourg | 1.2% |
| Canada | 1.1% |
| Bermuda | 1.0% |
| Korea (South) | 1.0% |
| Others (Individually Less Than 1%) | 1.0% |
| | 100.0% |
See accompanying notes which are an integral part of the financial statements.
Chemicals Portfolio
Financial Statements
Statement of Assets and Liabilities
| | | February 28, 2018 |
| Assets | | |
Investment in securities, at value (including securities loaned of $4,337,154) — See accompanying schedule:
Unaffiliated issuers (cost $1,251,231,382) | $1,737,950,102 | |
| Fidelity Central Funds (cost $77,231,514) | 77,231,514 | |
| Total Investment in Securities (cost $1,328,462,896) | | $1,815,181,616 |
| Receivable for investments sold | | 21,257,030 |
| Receivable for fund shares sold | | 2,037,639 |
| Dividends receivable | | 4,261,119 |
| Distributions receivable from Fidelity Central Funds | | 35,346 |
| Prepaid expenses | | 5,654 |
| Other receivables | | 179,676 |
| Total assets | | 1,842,958,080 |
| Liabilities | | |
| Payable for investments purchased | $35,659,547 | |
| Payable for fund shares redeemed | 11,049,706 | |
| Accrued management fee | 825,016 | |
| Other affiliated payables | 318,126 | |
| Other payables and accrued expenses | 225,496 | |
| Collateral on securities loaned | 4,659,450 | |
| Total liabilities | | 52,737,341 |
| Net Assets | | $1,790,220,739 |
| Net Assets consist of: | | |
| Paid in capital | | $1,200,914,441 |
| Undistributed net investment income | | 1,118,316 |
| Accumulated undistributed net realized gain (loss) on investments and foreign currency transactions | | 101,461,411 |
| Net unrealized appreciation (depreciation) on investments and assets and liabilities in foreign currencies | | 486,726,571 |
| Net Assets, for 10,321,594 shares outstanding | | $1,790,220,739 |
| Net Asset Value, offering price and redemption price per share ($1,790,220,739 ÷ 10,321,594 shares) | | $173.44 |
See accompanying notes which are an integral part of the financial statements.
Statement of Operations
| | | Year ended February 28, 2018 |
| Investment Income | | |
| Dividends | | $33,377,800 |
| Income from Fidelity Central Funds | | 288,018 |
| Total income | | 33,665,818 |
| Expenses | | |
| Management fee | $9,705,066 | |
| Transfer agent fees | 3,239,475 | |
| Accounting and security lending fees | 549,353 | |
| Custodian fees and expenses | 36,599 | |
| Independent trustees' fees and expenses | 38,091 | |
| Registration fees | 97,253 | |
| Audit | 49,061 | |
| Legal | 20,981 | |
| Miscellaneous | 97,389 | |
| Total expenses before reductions | 13,833,268 | |
| Expense reductions | (140,665) | 13,692,603 |
| Net investment income (loss) | | 19,973,215 |
| Realized and Unrealized Gain (Loss) | | |
| Net realized gain (loss) on: | | |
| Investment securities: | | |
| Unaffiliated issuers | 192,764,856 | |
| Fidelity Central Funds | 718 | |
| Foreign currency transactions | (152,304) | |
| Total net realized gain (loss) | | 192,613,270 |
| Change in net unrealized appreciation (depreciation) on: | | |
| Investment securities: | | |
| Unaffiliated issuers | 56,787,385 | |
| Fidelity Central Funds | (1,293) | |
| Assets and liabilities in foreign currencies | 7,851 | |
| Total change in net unrealized appreciation (depreciation) | | 56,793,943 |
| Net gain (loss) | | 249,407,213 |
| Net increase (decrease) in net assets resulting from operations | | $269,380,428 |
See accompanying notes which are an integral part of the financial statements.
Statement of Changes in Net Assets
| | Year ended February 28, 2018 | Year ended February 28, 2017 |
| Increase (Decrease) in Net Assets | | |
| Operations | | |
| Net investment income (loss) | $19,973,215 | $16,769,365 |
| Net realized gain (loss) | 192,613,270 | 137,965,075 |
| Change in net unrealized appreciation (depreciation) | 56,793,943 | 267,026,378 |
| Net increase (decrease) in net assets resulting from operations | 269,380,428 | 421,760,818 |
| Distributions to shareholders from net investment income | (15,828,578) | (15,876,012) |
| Distributions to shareholders from net realized gain | (130,959,179) | (50,330,730) |
| Total distributions | (146,787,757) | (66,206,742) |
| Share transactions | | |
| Proceeds from sales of shares | 708,415,147 | 556,232,815 |
| Reinvestment of distributions | 140,010,917 | 63,676,065 |
| Cost of shares redeemed | (807,440,266) | (395,662,133) |
| Net increase (decrease) in net assets resulting from share transactions | 40,985,798 | 224,246,747 |
| Redemption fees | – | 14,379 |
| Total increase (decrease) in net assets | 163,578,469 | 579,815,202 |
| Net Assets | | |
| Beginning of period | 1,626,642,270 | 1,046,827,068 |
| End of period | $1,790,220,739 | $1,626,642,270 |
| Other Information | | |
| Undistributed net investment income end of period | $1,118,316 | $761,893 |
| Shares | | |
| Sold | 4,139,132 | 3,811,949 |
| Issued in reinvestment of distributions | 846,268 | 426,812 |
| Redeemed | (4,679,686) | (2,719,518) |
| Net increase (decrease) | 305,714 | 1,519,243 |
See accompanying notes which are an integral part of the financial statements.
Financial Highlights
Chemicals Portfolio
| | | | | | |
| Years ended February 28, | 2018 | 2017 | 2016A | 2015 | 2014 |
| Selected Per–Share Data | | | | | |
| Net asset value, beginning of period | $162.41 | $123.20 | $153.34 | $148.23 | $122.98 |
| Income from Investment Operations | | | | | |
| Net investment income (loss)B | 1.91 | 1.82 | 1.87 | 1.64 | 1.23 |
| Net realized and unrealized gain (loss) | 23.56 | 44.40 | (23.41) | 9.09 | 32.11 |
| Total from investment operations | 25.47 | 46.22 | (21.54) | 10.73 | 33.34 |
| Distributions from net investment income | (1.56) | (1.68) | (1.81) | (1.42) | (1.18) |
| Distributions from net realized gain | (12.88) | (5.33) | (6.80) | (4.20) | (6.92) |
| Total distributions | (14.44) | (7.01) | (8.60)C | (5.62) | (8.10) |
| Redemption fees added to paid in capitalB | – | –D | –D | –D | .01 |
| Net asset value, end of period | $173.44 | $162.41 | $123.20 | $153.34 | $148.23 |
| Total ReturnE | 16.31% | 38.02% | (14.46)% | 7.52% | 27.77% |
| Ratios to Average Net AssetsF,G | | | | | |
| Expenses before reductions | .77% | .80% | .80% | .79% | .81% |
| Expenses net of fee waivers, if any | .77% | .80% | .80% | .79% | .81% |
| Expenses net of all reductions | .77% | .79% | .79% | .79% | .80% |
| Net investment income (loss) | 1.12% | 1.26% | 1.36% | 1.10% | .91% |
| Supplemental Data | | | | | |
| Net assets, end of period (000 omitted) | $1,790,221 | $1,626,642 | $1,046,827 | $1,625,067 | $1,429,434 |
| Portfolio turnover rateH | 62% | 85% | 79% | 80%I | 109% |
A For the year ended February 29.
B Calculated based on average shares outstanding during the period.
C Total distributions of $8.60 per share is comprised of distributions from net investment income of $1.806 and distributions from net realized gain of $6.795 per share.
D Amount represents less than $.005 per share.
E Total returns would have been lower if certain expenses had not been reduced during the applicable periods shown.
F Fees and expenses of any underlying Fidelity Central Funds are not included in the Fund's expense ratio. The Fund indirectly bears its proportionate share of the expenses of any underlying Fidelity Central Funds.
G Expense ratios reflect operating expenses of the Fund. Expenses before reductions do not reflect amounts reimbursed by the investment adviser or reductions from brokerage service arrangements or reductions from other expense offset arrangements and do not represent the amount paid by the Fund during periods when reimbursements or reductions occur. Expenses net of fee waivers reflect expenses after reimbursement by the investment adviser but prior to reductions from brokerage service arrangements or other expense offset arrangements. Expenses net of all reductions represent the net expenses paid by the Fund.
H Amount does not include the portfolio activity of any underlying Fidelity Central Funds.
I Portfolio turnover rate excludes securities received or delivered in-kind.
See accompanying notes which are an integral part of the financial statements.
Notes to Financial Statements
For the period ended February 28, 2018
1. Organization.
Chemicals Portfolio (the Fund) is a non-diversified fund of Fidelity Select Portfolios (the Trust) and is authorized to issue an unlimited number of shares. Share transactions on the Statement of Changes in Net Assets may contain exchanges between affiliated funds. The Trust is registered under the Investment Company Act of 1940, as amended (the 1940 Act), as an open-end management investment company organized as a Massachusetts business trust. The Fund invests primarily in securities of companies whose principal business activities fall within specific industries.
2. Investments in Fidelity Central Funds.
The Fund invests in Fidelity Central Funds, which are open-end investment companies generally available only to other investment companies and accounts managed by the investment adviser and its affiliates. The Fund's Schedule of Investments lists each of the Fidelity Central Funds held as of period end, if any, as an investment of the Fund, but does not include the underlying holdings of each Fidelity Central Fund. As an Investing Fund, the Fund indirectly bears its proportionate share of the expenses of the underlying Fidelity Central Funds.
The Money Market Central Funds seek preservation of capital and current income and are managed by Fidelity Investments Money Management, Inc. (FIMM), an affiliate of the investment adviser. Annualized expenses of the Money Market Central Funds as of their most recent shareholder report date are less than .005%.
A complete unaudited list of holdings for each Fidelity Central Fund is available upon request or at the Securities and Exchange Commission (the SEC) website at www.sec.gov. In addition, the financial statements of the Fidelity Central Funds, which are not covered by the Fund's Report of Independent Registered Public Accounting Firm, are available on the SEC website or upon request.
3. Significant Accounting Policies.
The Fund is an investment company and applies the accounting and reporting guidance of the Financial Accounting Standards Board (FASB) Accounting Standards Codification Topic 946 Financial Services – Investments Companies. The financial statements have been prepared in conformity with accounting principles generally accepted in the United States of America (GAAP), which require management to make certain estimates and assumptions at the date of the financial statements. Actual results could differ from those estimates. Subsequent events, if any, through the date that the financial statements were issued have been evaluated in the preparation of the financial statements. The following summarizes the significant accounting policies of the Fund:
Investment Valuation. Investments are valued as of 4:00 p.m. Eastern time on the last calendar day of the period. The Board of Trustees (the Board) has delegated the day to day responsibility for the valuation of the Fund's investments to the Fair Value Committee (the Committee) established by the Fund's investment adviser. In accordance with valuation policies and procedures approved by the Board, the Fund attempts to obtain prices from one or more third party pricing vendors or brokers to value its investments. When current market prices, quotations or currency exchange rates are not readily available or reliable, investments will be fair valued in good faith by the Committee, in accordance with procedures adopted by the Board. Factors used in determining fair value vary by investment type and may include market or investment specific events. The frequency with which these procedures are used cannot be predicted and they may be utilized to a significant extent. The Committee oversees the Fund's valuation policies and procedures and reports to the Board on the Committee's activities and fair value determinations. The Board monitors the appropriateness of the procedures used in valuing the Fund's investments and ratifies the fair value determinations of the Committee.
The Fund categorizes the inputs to valuation techniques used to value its investments into a disclosure hierarchy consisting of three levels as shown below:
- Level 1 – quoted prices in active markets for identical investments
- Level 2 – other significant observable inputs (including quoted prices for similar investments, interest rates, prepayment speeds, etc.)
- Level 3– unobservable inputs (including the Fund's own assumptions based on the best information available)
Valuation techniques used to value the Fund's investments by major category are as follows:
Equity securities, including restricted securities, for which market quotations are readily available, are valued at the last reported sale price or official closing price as reported by a third party pricing vendor on the primary market or exchange on which they are traded and are categorized as Level 1 in the hierarchy. In the event there were no sales during the day or closing prices are not available, securities are valued at the last quoted bid price or may be valued using the last available price and are generally categorized as Level 2 in the hierarchy. For foreign equity securities, when market or security specific events arise, comparisons to the valuation of American Depositary Receipts (ADRs), futures contracts, Exchange-Traded Funds (ETFs) and certain indexes as well as quoted prices for similar securities may be used and would be categorized as Level 2 in the hierarchy. Utilizing these techniques may result in transfers between Level 1 and Level 2. For equity securities, including restricted securities, where observable inputs are limited, assumptions about market activity and risk are used and these securities may be categorized as Level 3 in the hierarchy.
Investments in open-end mutual funds, including the Fidelity Central Funds, are valued at their closing net asset value (NAV) each business day and are categorized as Level 1 in the hierarchy.
Changes in valuation techniques may result in transfers in or out of an assigned level within the disclosure hierarchy. The aggregate value of investments by input level as of February 28, 2018 is included at the end of the Fund's Schedule of Investments.
Foreign Currency. The Fund may use foreign currency contracts to facilitate transactions in foreign-denominated securities. Gains and losses from these transactions may arise from changes in the value of the foreign currency or if the counterparties do not perform under the contracts' terms.
Foreign-denominated assets, including investment securities, and liabilities are translated into U.S. dollars at the exchange rates at period end. Purchases and sales of investment securities, income and dividends received and expenses denominated in foreign currencies are translated into U.S. dollars at the exchange rate in effect on the transaction date.
The effects of exchange rate fluctuations on investments are included with the net realized and unrealized gain (loss) on investment securities. Other foreign currency transactions resulting in realized and unrealized gain (loss) are disclosed separately.
Investment Transactions and Income. For financial reporting purposes, the Fund's investment holdings and NAV include trades executed through the end of the last business day of the period. The NAV per share for processing shareholder transactions is calculated as of the close of business of the New York Stock Exchange (NYSE), normally 4:00 p.m. Eastern time and includes trades executed through the end of the prior business day. Gains and losses on securities sold are determined on the basis of identified cost. Dividend income is recorded on the ex-dividend date, except for certain dividends from foreign securities where the ex-dividend date may have passed, which are recorded as soon as the Fund is informed of the ex-dividend date. Non-cash dividends included in dividend income, if any, are recorded at the fair market value of the securities received. Income and capital gain distributions from Fidelity Central Funds, if any, are recorded on the ex-dividend date. Certain distributions received by the Fund represent a return of capital or capital gain. The Fund determines the components of these distributions subsequent to the ex-dividend date, based upon receipt of tax filings or other correspondence relating to the underlying investment. These distributions are recorded as a reduction of cost of investments and/or as a realized gain. Investment income is recorded net of foreign taxes withheld where recovery of such taxes is uncertain.
Expenses. Expenses directly attributable to a fund are charged to that fund. Expenses attributable to more than one fund are allocated among the respective funds on the basis of relative net assets or other appropriate methods. Expense estimates are accrued in the period to which they relate and adjustments are made when actual amounts are known.
Deferred Trustee Compensation. Under a Deferred Compensation Plan (the Plan), independent Trustees may elect to defer receipt of a portion of their annual compensation. Deferred amounts are invested in a cross-section of Fidelity funds, are marked-to-market and remain in the Fund until distributed in accordance with the Plan. The investment of deferred amounts and the offsetting payable to the Trustees are included in the accompanying Statement of Assets and Liabilities.
Income Tax Information and Distributions to Shareholders. Each year, the Fund intends to qualify as a regulated investment company under Subchapter M of the Internal Revenue Code, including distributing substantially all of its taxable income and realized gains. As a result, no provision for U.S. Federal income taxes is required. As of February 28, 2018, the Fund did not have any unrecognized tax benefits in the financial statements; nor is the Fund aware of any tax positions for which it is reasonably possible that the total amounts of unrecognized tax benefits will significantly change in the next twelve months. The Fund files a U.S. federal tax return, in addition to state and local tax returns as required. The Fund's federal income tax returns are subject to examination by the Internal Revenue Service (IRS) for a period of three fiscal years after they are filed. State and local tax returns may be subject to examination for an additional fiscal year depending on the jurisdiction. Foreign taxes are provided for based on the Fund's understanding of the tax rules and rates that exist in the foreign markets in which it invests.
Distributions are declared and recorded on the ex-dividend date. Income and capital gain distributions are determined in accordance with income tax regulations, which may differ from GAAP. In addition, the Fund claimed a portion of the payment made to redeeming shareholders as a distribution for income tax purposes.
Capital accounts within the financial statements are adjusted for permanent book-tax differences. These adjustments have no impact on net assets or the results of operations. Capital accounts are not adjusted for temporary book-tax differences which will reverse in a subsequent period.
Book-tax differences are primarily due to foreign currency transactions, partnerships, deferred trustees compensation and losses deferred due to wash sales.
As of period end, the cost and unrealized appreciation (depreciation) in securities, and derivatives if applicable, for federal income tax purposes were as follows:
| Gross unrealized appreciation | $507,702,542 |
| Gross unrealized depreciation | (19,979,070) |
| Net unrealized appreciation (depreciation) | $487,723,472 |
| Tax Cost | $1,327,458,144 |
The tax-based components of distributable earnings as of period end were as follows:
| Undistributed ordinary income | $4,077,145 |
| Undistributed long-term capital gain | $100,456,659 |
| Net unrealized appreciation (depreciation) on securities and other investments | $484,878,552 |
The tax character of distributions paid was as follows:
| | February 28, 2018 | February 28, 2017 |
| Ordinary Income | $82,124,537 | $ 40,880,727 |
| Long-term Capital Gains | 64,663,220 | 25,326,015 |
| Total | $146,787,757 | $ 66,206,742 |
4. Purchases and Sales of Investments.
Purchases and sales of securities, other than short-term securities, aggregated $1,091,323,508 and $1,204,600,530, respectively.
5. Fees and Other Transactions with Affiliates.
Management Fee. Fidelity SelectCo, LLC (the investment adviser) and its affiliates provide the Fund with investment management related services for which the Fund pays a monthly management fee. The management fee is the sum of an individual fund fee rate that is based on an annual rate of .30% of the Fund's average net assets and an annualized group fee rate that averaged .24% during the period. The group fee rate is based upon the average net assets of all the mutual funds advised by Fidelity Management & Research Company (FMR) and the investment adviser. The group fee rate decreases as assets under management increase and increases as assets under management decrease. For the reporting period, the total annual management fee rate was .54% of the Fund's average net assets.
Transfer Agent Fees. Fidelity Investments Institutional Operations Company, Inc. (FIIOC), an affiliate of the investment adviser, is the Fund's transfer, dividend disbursing and shareholder servicing agent. FIIOC receives account fees and asset-based fees that vary according to account size and type of account. FIIOC pays for typesetting, printing and mailing of shareholder reports, except proxy statements. For the period, the transfer agent fees were equivalent to an annual rate of .18% of average net assets.
Accounting and Security Lending Fees. Fidelity Service Company, Inc. (FSC), an affiliate of the investment adviser, maintains the Fund's accounting records. The accounting fee is based on the level of average net assets for each month. Under a separate contract, FSC administers the security lending program. The security lending fee is based on the number and duration of lending transactions.
Brokerage Commissions. The Fund placed a portion of its portfolio transactions with brokerage firms which are affiliates of the investment adviser. Brokerage commissions are included in net realized gain (loss) and change in net unrealized appreciation (depreciation) in the Statement of Operations. The commissions paid to these affiliated firms were $30,088 for the period.
Interfund Trades. The Fund may purchase from or sell securities to other Fidelity Funds under procedures adopted by the Board. The procedures have been designed to ensure these interfund trades are executed in accordance with Rule 17a-7 of the 1940 Act. Interfund trades are included within the respective purchases and sales amounts shown in the Purchases and Sales of Investments note.
6. Committed Line of Credit.
The Fund participates with other funds managed by the investment adviser or an affiliate in a $4.25 billion credit facility (the "line of credit") to be utilized for temporary or emergency purposes to fund shareholder redemptions or for other short-term liquidity purposes. The Fund has agreed to pay commitment fees on its pro-rata portion of the line of credit, which amounted to $5,264 and is reflected in Miscellaneous expenses on the Statement of Operations. During the period, the Fund did not borrow on this line of credit.
7. Security Lending.
The Fund lends portfolio securities through a lending agent from time to time in order to earn additional income. On the settlement date of the loan, the Fund receives collateral (in the form of U.S. Treasury obligations, letters of credit and/or cash) against the loaned securities and maintains collateral in an amount not less than 100% of the market value of the loaned securities during the period of the loan. The market value of the loaned securities is determined at the close of business of the Fund and any additional required collateral is delivered to the Fund on the next business day. The Fund or borrower may terminate the loan at any time, and if the borrower defaults on its obligation to return the securities loaned because of insolvency or other reasons, the Fund may apply collateral received from the borrower against the obligation. The Fund may experience delays and costs in recovering the securities loaned. Any cash collateral received is invested in the Fidelity Securities Lending Cash Central Fund. The value of loaned securities and cash collateral at period end are disclosed on the Fund's Statement of Assets and Liabilities. Security lending income represents the income earned on investing cash collateral, less rebates paid to borrowers and any lending agent fees associated with the loan, plus any premium payments received for lending certain types of securities. Security lending income is presented in the Statement of Operations as a component of income from Fidelity Central Funds. Total security lending income during the period amounted to $34,387.
8. Expense Reductions.
Commissions paid to certain brokers with whom the investment adviser, or its affiliates, places trades on behalf of the Fund include an amount in addition to trade execution, which may be rebated back to the Fund to offset certain expenses. This amount totaled $124,945 for the period.
In addition, during the period the investment adviser reimbursed and/or waived a portion of operating expenses in the amount of $15,720.
9. Other.
The Fund's organizational documents provide former and current trustees and officers with a limited indemnification against liabilities arising in connection with the performance of their duties to the Fund. In the normal course of business, the Fund may also enter into contracts that provide general indemnifications. The Fund's maximum exposure under these arrangements is unknown as this would be dependent on future claims that may be made against the Fund. The risk of material loss from such claims is considered remote.
Gold Portfolio
Performance: The Bottom Line
Average annual total return reflects the change in the value of an investment, assuming reinvestment of distributions from dividend income and capital gains (the profits earned upon the sale of securities that have grown in value, if any) and assuming a constant rate of performance each year. The hypothetical investment and the average annual total returns do not reflect the deduction of taxes that a shareholder would pay on fund distributions or the redemption of fund shares. During periods of reimbursement by Fidelity, a fund’s total return will be greater than it would be had the reimbursement not occurred. How a fund did yesterday is no guarantee of how it will do tomorrow.
Average Annual Total Returns
| For the periods ended February 28, 2018 | Past 1 year | Past 5 years | Past 10 years |
| Gold Portfolio | (10.47)% | (8.66)% | (6.81)% |
$10,000 Over 10 Years
Let's say hypothetically that $10,000 was invested in Gold Portfolio, a class of the fund, on February 29, 2008.
The chart shows how the value of your investment would have changed, and also shows how the S&P 500® Index performed over the same period.
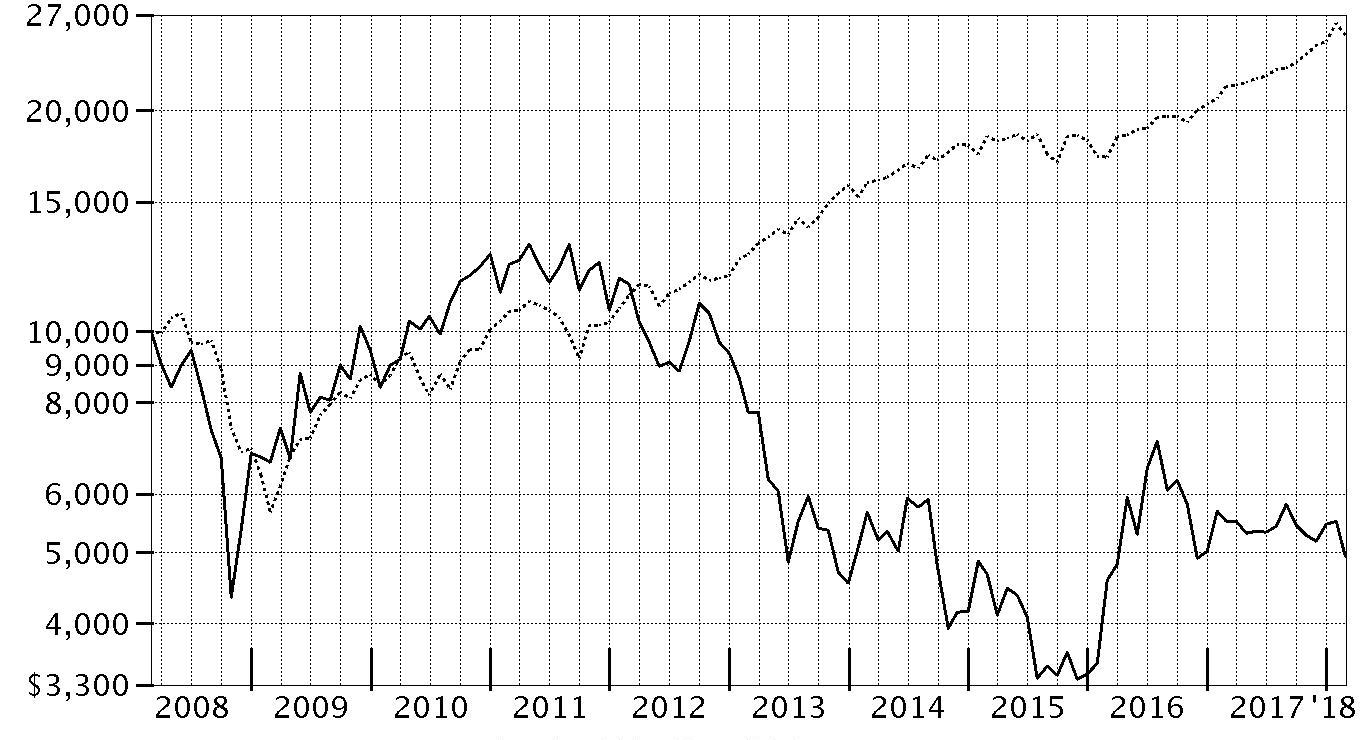
| Period Ending Values |
| $4,937 | Gold Portfolio |
| $25,307 | S&P 500® Index |
Gold Portfolio
Management's Discussion of Fund Performance
Market Recap: U.S. equities gained 17.10% for the 12 months ending February 28, 2018, as the S&P 500
® index moved steadily higher throughout 2017 and into 2018 until sharply reversing course in February. The drop was in stark contrast to the low volatility seen throughout 2017, along with consumer sentiment and other market indicators that stayed positive. Investors remained decidedly upbeat as the calendar turned, and the index rose 5.73% in January. February was a decidedly different story, though, as volatility spiked amid fear that rising inflation and the potential for the economy to overheat would prompt the U.S. Federal Reserve to pick up the pace of interest rate hikes. The index returned -3.69% for the month, its first negative result since October 2016. For the full 12 months, growth stocks handily topped value, while large-caps bested small-caps. By sector, information technology fared best by far, gaining 36% amid strong earnings growth from several major index constituents. Consumer discretionary (+22%) also stood out, driven by retailers. Financials added 20%, riding the uptick in bond yields. Materials and industrials rose about 16% each, boosted by higher demand, especially from China. Conversely, notable laggards included the defensive telecommunication services (-5%) and utilities (-2%) sectors, while rising rates held back real estate (-3%).
Comments from Portfolio Manager S. Joseph Wickwire II, CFA: For the fiscal year, the fund's share classes (excluding sales charges, if applicable) returned roughly -10% to -11%, trailing the combined -7.04% return of the S&P
® Global BMI Gold Capped Index for the first month of the period and the S&P
® Global BMI Gold Capped 20/45 Linked Index for the past 11 months. The fund also lagged the 17.10% gain of the broad market S&P 500
® index. Although the price of gold bullion rose more than 5% this period, gold stocks – which conceptually are viewed by many investors as a financial asset insurance policy and outperform when stocks, bonds and currencies decline –by and large were met with skepticism amid the strong equity-market rally. The fund was positioned for a more favorable gold market, represented by its emphasis on stocks with a higher beta due to positive fundamental factors, including macroeconomic imbalances, geopolitical tension and a favorable supply-and-demand profile. This positioning generally detracted from performance versus the S&P gold index because investors lacked conviction in the gold asset class, which caused lower-beta gold stocks to outperform higher-beta stocks. Among individual stocks, the biggest relative detractor was an overweighting in Torex Gold Resources, as its mining assets in Mexico suffered from local problems that hindered development. In addition, the fund's foreign holdings detracted overall, despite the tailwind from a broadly weaker U.S. dollar. Conversely, among the largest relative contributors were underweightings in poor-performers Barrick Gold and Canada's Goldcorp.
The views expressed above reflect those of the portfolio manager(s) only through the end of the period as stated on the cover of this report and do not necessarily represent the views of Fidelity or any other person in the Fidelity organization. Any such views are subject to change at any time based upon market or other conditions and Fidelity disclaims any responsibility to update such views. These views may not be relied on as investment advice and, because investment decisions for a Fidelity fund are based on numerous factors, may not be relied on as an indication of trading intent on behalf of any Fidelity fund.
Notes to Shareholders: On April 1, 2017, the fund’s industry benchmark changed from the S&P
® Global BMI Gold Capped Index (a custom index developed for Fidelity) to the S&P
® Global BMI Gold Capped 20/45 Linked Index (a public benchmark that became available more recently). Due to new international benchmark guidelines, S&P
® Dow Jones
® Indices stopped offering its brand on custom benchmarks, effective March 31, 2017. Fidelity believes that the new S&P
® index will continue to provide shareholders with meaningful performance comparisons. On December 8, 2017, shareholders approved proposals from the Board of Trustees to eliminate each sector/industry fund's fundamental “invests primarily” policy and to modify the fundamental concentration policy for certain funds. The changes took effect on January 1, 2018, and do not impact how the funds are managed.
Gold Portfolio
Consolidated Investment Summary (Unaudited)
The information in the following tables is based on the consolidated investments of the Fund.
Top Ten Holdings as of February 28, 2018
| | % of fund's net assets |
| Newmont Mining Corp. | 9.4 |
| Randgold Resources Ltd. sponsored ADR | 6.9 |
| B2Gold Corp. | 6.8 |
| Silver Bullion | 5.8 |
| Barrick Gold Corp. | 5.5 |
| Agnico Eagle Mines Ltd. (Canada) | 5.5 |
| Franco-Nevada Corp. | 4.6 |
| Premier Gold Mines Ltd. | 3.3 |
| Goldcorp, Inc. | 3.2 |
| Newcrest Mining Ltd. | 3.0 |
| | 54.0 |
Top Industries (% of fund's net assets)
| As of February 28, 2018 |
| | Gold | 89.2% |
| | Commodities & Related Investments* | 6.9% |
| | Silver | 1.4% |
| | Diversified Metals & Mining | 0.9% |
| | Copper | 0.6% |
| | Precious Metals & Minerals | 0.4% |
| | All Others** | 0.6% |

* Includes gold bullion and/or silver bullion.
** Includes Short-Term investments and Net Other Assets (Liabilities).
Geographic Diversification (% of fund's net assets)
| As of February 28, 2018 |
| | Canada | 59.8% |
| | United States of America* | 19.8% |
| | Bailiwick of Jersey | 6.9% |
| | South Africa | 4.7% |
| | Australia | 4.6% |
| | Cayman Islands | 1.8% |
| | Peru | 1.7% |
| | United Kingdom | 0.5% |
| | China | 0.2% |

* Includes Short-Term investments and Net Other Assets (Liabilities).
Percentages are based on country or territory of incorporation and are adjusted for the effect of futures contracts, if applicable.
Gold Portfolio
Consolidated Schedule of Investments February 28, 2018
Showing Percentage of Net Assets
| Common Stocks - 92.5% | | | |
| | | Shares | Value |
| Australia - 4.6% | | | |
| Metals & Mining - 4.6% | | | |
| Gold - 4.6% | | | |
| Dacian Gold Ltd. (a) | | 72,596 | $147,626 |
| Evolution Mining Ltd. | | 1,766,243 | 3,913,579 |
| Gold Road Resources Ltd. (a) | | 1,080,000 | 668,227 |
| Newcrest Mining Ltd. | | 2,284,162 | 37,484,437 |
| Northern Star Resources Ltd. | | 543,118 | 2,636,760 |
| Perseus Mining Ltd.: | | | |
| (Australia) (a) | | 1,717,134 | 527,507 |
| (Canada) (a) | | 1,300,000 | 395,106 |
| Resolute Mng Ltd. | | 4,701,949 | 4,044,000 |
| Saracen Mineral Holdings Ltd. (a) | | 3,087,787 | 3,866,216 |
| Silver Lake Resources Ltd. (a) | | 2,840,985 | 769,899 |
| St Barbara Ltd. | | 832,257 | 2,639,728 |
| | | | 57,093,085 |
| Bailiwick of Jersey - 6.9% | | | |
| Metals & Mining - 6.9% | | | |
| Gold - 6.9% | | | |
| Randgold Resources Ltd. sponsored ADR | | 1,062,895 | 86,115,753 |
| Canada - 59.8% | | | |
| Metals & Mining - 59.8% | | | |
| Copper - 0.5% | | | |
| First Quantum Minerals Ltd. | | 356,300 | 5,805,980 |
| Lundin Mining Corp. | | 20,000 | 130,143 |
| | | | 5,936,123 |
| Diversified Metals & Mining - 0.9% | | | |
| Arizona Mining, Inc. (a) | | 1,195,122 | 3,781,324 |
| Ivanhoe Mines Ltd. (a) | | 3,070,000 | 7,727,634 |
| Sabina Gold & Silver Corp. (a) | | 65,500 | 89,327 |
| | | | 11,598,285 |
| Gold - 56.7% | | | |
| Agnico Eagle Mines Ltd. (Canada) | | 1,798,101 | 68,507,760 |
| Alacer Gold Corp. (a) | | 2,604,063 | 4,099,289 |
| Alamos Gold, Inc. | | 4,795,512 | 24,366,224 |
| Argonaut Gold, Inc. (a) | | 5,931,462 | 11,001,309 |
| B2Gold Corp. (a) | | 28,645,793 | 85,053,360 |
| Barrick Gold Corp. | | 5,988,569 | 68,976,816 |
| Belo Sun Mining Corp. (a) | | 40,800 | 10,810 |
| Centerra Gold, Inc. (a) | | 457,500 | 2,395,885 |
| Continental Gold, Inc. (a)(b) | | 9,561,700 | 28,390,023 |
| Detour Gold Corp. (a) | | 2,665,600 | 24,304,489 |
| Detour Gold Corp. (a)(c) | | 785,900 | 7,165,703 |
| Eldorado Gold Corp. | | 8,480,935 | 9,120,706 |
| First Mining Finance Corp. (a) | | 170,000 | 61,604 |
| Franco-Nevada Corp. | | 816,900 | 57,244,115 |
| Gold Standard Ventures Corp. (a) | | 3,114,300 | 5,096,657 |
| Goldcorp, Inc. | | 3,212,100 | 40,201,314 |
| Guyana Goldfields, Inc. (a) | | 4,785,800 | 18,573,320 |
| Guyana Goldfields, Inc. (a)(c) | | 155,000 | 601,543 |
| IAMGOLD Corp. (a) | | 1,614,000 | 8,490,103 |
| Kinross Gold Corp. (a) | | 4,549,391 | 16,344,056 |
| Kirkland Lake Gold Ltd. | | 668,119 | 10,486,219 |
| Klondex Mines Ltd. (a) | | 1,834,478 | 2,544,709 |
| Liberty Gold Corp. (a) | | 1,418,150 | 436,541 |
| Lundin Gold, Inc. (a) | | 13,800 | 54,310 |
| New Gold, Inc. (a) | | 5,696,375 | 14,338,600 |
| Novagold Resources, Inc. (a) | | 2,014,500 | 8,006,507 |
| OceanaGold Corp. | | 9,871,932 | 26,310,791 |
| Osisko Gold Royalties Ltd. | | 1,220,293 | 11,830,147 |
| Premier Gold Mines Ltd. (a)(b) | | 16,645,522 | 40,731,717 |
| Pretium Resources, Inc. (a) | | 1,802,683 | 11,533,687 |
| Pretium Resources, Inc. (a)(c) | | 225,000 | 1,439,565 |
| Rubicon Minerals Corp. (a) | | 1,000 | 974 |
| Sandstorm Gold Ltd. (a) | | 1,855,475 | 8,516,792 |
| Seabridge Gold, Inc. (a) | | 1,449,090 | 15,432,809 |
| SEMAFO, Inc. (a) | | 7,590,000 | 20,228,959 |
| Ssr Mining, Inc. (a) | | 1,338,700 | 11,111,210 |
| Tahoe Resources, Inc. | | 3,099,438 | 15,168,696 |
| Teranga Gold Corp. (a) | | 1,220,814 | 3,510,601 |
| Torex Gold Resources, Inc. (a) | | 2,697,600 | 21,022,444 |
| Wesdome Gold Mines, Inc. (a) | | 140,000 | 204,021 |
| Yamana Gold, Inc. | | 1,190,620 | 3,460,889 |
| | | | 706,375,274 |
| Precious Metals & Minerals - 0.3% | | | |
| Dalradian Resources, Inc. (a) | | 784,500 | 666,385 |
| Osisko Mining, Inc. (a) | | 1,464,800 | 3,082,107 |
| | | | 3,748,492 |
| Silver - 1.4% | | | |
| MAG Silver Corp. (a) | | 584,500 | 6,112,835 |
| Pan American Silver Corp. | | 19,300 | 292,202 |
| Wheaton Precious Metals Corp. | | 611,800 | 11,676,264 |
| | | | 18,081,301 |
| TOTAL METALS & MINING | | | 745,739,475 |
| Cayman Islands - 1.8% | | | |
| Metals & Mining - 1.8% | | | |
| Gold - 1.8% | | | |
| Endeavour Mining Corp. (a) | | 1,200,040 | 22,631,677 |
| China - 0.2% | | | |
| Metals & Mining - 0.2% | | | |
| Gold - 0.2% | | | |
| Zijin Mng Group Co. Ltd. (H Shares) | | 4,947,000 | 2,256,024 |
| Peru - 1.7% | | | |
| Metals & Mining - 1.7% | | | |
| Gold - 1.7% | | | |
| Compania de Minas Buenaventura SA sponsored ADR | | 1,403,397 | 21,822,823 |
| South Africa - 4.7% | | | |
| Metals & Mining - 4.7% | | | |
| Gold - 4.7% | | | |
| AngloGold Ashanti Ltd. sponsored ADR | | 3,580,808 | 33,444,747 |
| Gold Fields Ltd. sponsored ADR | | 3,299,426 | 12,933,750 |
| Harmony Gold Mining Co. Ltd. | | 1,484,000 | 2,979,005 |
| Harmony Gold Mining Co. Ltd. sponsored ADR | | 1,460,400 | 3,037,632 |
| Sibanye-Stillwater ADR | | 1,448,712 | 5,635,490 |
| | | | 58,030,624 |
| United Kingdom - 0.5% | | | |
| Metals & Mining - 0.5% | | | |
| Gold - 0.4% | | | |
| Acacia Mining PLC | | 1,896,536 | 3,665,031 |
| Pan African Resources PLC | | 550,000 | 53,065 |
| Solgold PLC (a) | | 4,152,758 | 1,294,137 |
| | | | 5,012,233 |
| Precious Metals & Minerals - 0.1% | | | |
| Fresnillo PLC | | 36,000 | 601,474 |
| TOTAL METALS & MINING | | | 5,613,707 |
| United States of America - 12.3% | | | |
| Metals & Mining - 12.3% | | | |
| Copper - 0.1% | | | |
| Freeport-McMoRan, Inc. (a) | | 71,200 | 1,324,320 |
| Gold - 12.2% | | | |
| McEwen Mining, Inc. | | 1,096,410 | 2,138,000 |
| Newmont Mining Corp. | | 3,065,078 | 117,085,980 |
| Royal Gold, Inc. | | 408,867 | 33,024,188 |
| | | | 152,248,168 |
| TOTAL METALS & MINING | | | 153,572,488 |
| TOTAL COMMON STOCKS | | | |
| (Cost $1,203,012,880) | | | 1,152,875,656 |
| | | Troy Ounces | |
|
| Commodities - 6.9% | | | |
| Gold Bullion (a) | | 10,510 | 13,852,180 |
| Silver Bullion (a) | | 4,372,000 | 71,692,056 |
| TOTAL COMMODITIES | | | |
| (Cost $84,177,257) | | | 85,544,236 |
| | | Shares | |
|
| Money Market Funds - 0.6% | | | |
| Fidelity Cash Central Fund, 1.41% (d) | | 7,877,259 | 7,878,834 |
| Fidelity Securities Lending Cash Central Fund 1.42% (d)(e) | | 44,597 | 44,601 |
| TOTAL MONEY MARKET FUNDS | | | |
| (Cost $7,923,431) | | | 7,923,435 |
| TOTAL INVESTMENT IN SECURITIES - 100.0% | | | |
| (Cost $1,295,113,568) | | | 1,246,343,327 |
| NET OTHER ASSETS (LIABILITIES) - 0.0% | | | 528,155 |
| NET ASSETS - 100% | | | $1,246,871,482 |
Legend
(a) Non-income producing
(b) Affiliated company
(c) Security exempt from registration under Rule 144A of the Securities Act of 1933. These securities may be resold in transactions exempt from registration, normally to qualified institutional buyers. At the end of the period, the value of these securities amounted to $9,206,811 or 0.7% of net assets.
(d) Affiliated fund that is generally available only to investment companies and other accounts managed by Fidelity Investments. The rate quoted is the annualized seven-day yield of the fund at period end. A complete unaudited listing of the fund's holdings as of its most recent quarter end is available upon request. In addition, each Fidelity Central Fund's financial statements, which are not covered by the Fund's Report of Independent Registered Public Accounting Firm, are available on the SEC's website or upon request.
(e) Investment made with cash collateral received from securities on loan.
Affiliated Central Funds
Information regarding fiscal year to date income earned by the Fund from investments in Fidelity Central Funds is as follows:
| Fund | Income earned |
| Fidelity Cash Central Fund | $71,353 |
| Fidelity Securities Lending Cash Central Fund | 30,724 |
| Total | $102,077 |
Amounts in the income column in the above table include any capital gain distributions from underlying funds, which are presented in the corresponding line-item in the Consolidated Statement of Operations if applicable.
Consolidated Subsidiary
| Affiliate | Value, beginning of period | Purchases | Sales Proceeds | Dividend Income | Realized Gain (loss) | Change in Unrealized appreciation (depreciation) | Value, end of period |
| Fidelity Select Cayman Gold Ltd. | $87,787,763 | $17,930,933 | $13,452,900 | $ -- | $(342,822) | $(6,445,854) | $85,477,120 |
Other Affiliated Issuers
An affiliated company is a company in which the Fund has ownership of at least 5% of the voting securities. Fiscal year to date transactions with companies which are or were affiliates are as follows:
| Affiliate | Value, beginning of period | Purchases | Sales Proceeds | Dividend Income | Realized Gain (loss) | Change in Unrealized appreciation (depreciation) | Value, end of period |
| Continental Gold, Inc. | $26,033,941 | $4,588,834 | $-- | $-- | $-- | $(2,232,752) | $28,390,023 |
| Premier Gold Mines Ltd. | 29,885,078 | 2,666,090 | 72,855 | -- | (70,838) | 8,324,242 | 40,731,717 |
| Total | $55,919,019 | $7,254,924 | $72,855 | $-- | $(70,838) | $6,091,490 | $69,121,740 |
Investment Valuation
The following is a summary of the inputs used, as of February 28, 2018, involving the Fund's assets and liabilities carried at fair value. The inputs or methodology used for valuing securities may not be an indication of the risk associated with investing in those securities. For more information on valuation inputs, and their aggregation into the levels used below, please refer to the Investment Valuation section in the accompanying Notes to Consolidated Financial Statements.
| | Valuation Inputs at Reporting Date: |
| Description | Total | Level 1 | Level 2 | Level 3 |
| Investments in Securities: | | | | |
| Common Stocks | $1,152,875,656 | $1,085,328,941 | $67,546,715 | $-- |
| Commodities | 85,544,236 | 85,544,236 | -- | -- |
| Money Market Funds | 7,923,435 | 7,923,435 | -- | -- |
| Total Investments in Securities: | $1,246,343,327 | $1,178,796,612 | $67,546,715 | $-- |
The following is a summary of transfers between Level 1 and Level 2 for the period ended February 28, 2018. Transfers are assumed to have occurred at the beginning of the period, and are primarily attributable to the valuation techniques used for foreign equity securities, as discussed in the accompanying Notes to Consolidated Financial Statements:
| Transfers | Total |
| Level 1 to Level 2 | $128,252,118 |
| Level 2 to Level 1 | $0 |
See accompanying notes which are an integral part of the consolidated financial statements.
Gold Portfolio
Consolidated Financial Statements
Consolidated Statement of Assets and Liabilities
| | | February 28, 2018 |
| Assets | | |
Investment in securities, at value — See accompanying schedule:
Unaffiliated issuers (cost $1,126,825,246) | $1,083,753,916 | |
| Fidelity Central Funds (cost $7,923,431) | 7,923,435 | |
| Commodities (cost $84,177,257) | 85,544,236 | |
| Other affiliated issuers (cost $76,187,634) | 69,121,740 | |
| Total Investment in Securities (cost $1,295,113,568) | | $1,246,343,327 |
| Cash | | 22,174 |
| Foreign currency held at value (cost $118,637) | | 118,027 |
| Receivable for fund shares sold | | 2,909,206 |
| Dividends receivable | | 401,265 |
| Distributions receivable from Fidelity Central Funds | | 7,207 |
| Prepaid expenses | | 4,742 |
| Other receivables | | 109,275 |
| Total assets | | 1,249,915,223 |
| Liabilities | | |
| Payable for fund shares redeemed | $1,711,639 | |
| Accrued management fee | 585,359 | |
| Transfer agent fee payable | 243,128 | |
| Distribution and service plan fees payable | 103,210 | |
| Other affiliated payables | 49,286 | |
| Other payables and accrued expenses | 306,441 | |
| Collateral on securities loaned | 44,678 | |
| Total liabilities | | 3,043,741 |
| Net Assets | | $1,246,871,482 |
| Net Assets consist of: | | |
| Paid in capital | | $2,676,918,722 |
| Accumulated net investment loss | | (6,965,927) |
| Accumulated undistributed net realized gain (loss) on investments and foreign currency transactions | | (1,374,310,048) |
| Net unrealized appreciation (depreciation) on investments and assets and liabilities in foreign currencies | | (48,771,265) |
| Net Assets | | $1,246,871,482 |
| Calculation of Maximum Offering Price | | |
| Class A: | | |
| Net Asset Value and redemption price per share ($61,703,022 ÷ 3,371,731 shares) | | $18.30 |
| Maximum offering price per share (100/94.25 of $18.30) | | $19.42 |
| Class M: | | |
| Net Asset Value and redemption price per share ($19,354,931 ÷ 1,078,619 shares) | | $17.94 |
| Maximum offering price per share (100/96.50 of $17.94) | | $18.59 |
| Class C: | | |
| Net Asset Value and offering price per share ($92,724,331 ÷ 5,407,975 shares)(a) | | $17.15 |
| Gold: | | |
| Net Asset Value, offering price and redemption price per share ($1,011,412,484 ÷ 53,861,287 shares) | | $18.78 |
| Class I: | | |
| Net Asset Value, offering price and redemption price per share ($61,676,714 ÷ 3,284,926 shares) | | $18.78 |
(a) Redemption price per share is equal to net asset value less any applicable contingent deferred sales charge.
See accompanying notes which are an integral part of the consolidated financial statements.
Consolidated Statement of Operations
| | | Year ended February 28, 2018 |
| Investment Income | | |
| Dividends | | $9,065,413 |
| Income from Fidelity Central Funds | | 102,077 |
| Income before foreign taxes withheld | | 9,167,490 |
| Less foreign taxes withheld | | (770,759) |
| Total income | | 8,396,731 |
| Expenses | | |
| Management fee | $8,057,489 | |
| Transfer agent fees | 3,166,111 | |
| Distribution and service plan fees | 1,323,699 | |
| Accounting and security lending fees | 648,333 | |
| Custodian fees and expenses | 285,314 | |
| Independent trustees' fees and expenses | 31,871 | |
| Registration fees | 127,041 | |
| Audit | 69,707 | |
| Legal | 18,937 | |
| Miscellaneous | 90,618 | |
| Total expenses before reductions | 13,819,120 | |
| Expense reductions | (286,035) | 13,533,085 |
| Net investment income (loss) | | (5,136,354) |
| Realized and Unrealized Gain (Loss) | | |
| Net realized gain (loss) on: | | |
| Investments: | | |
| Unaffiliated issuers | (19,779,519) | |
| Fidelity Central Funds | (81) | |
| Other affiliated issuers | (70,838) | |
| Commodities | 48,173 | |
| Foreign currency transactions | 4,306 | |
| Total net realized gain (loss) | | (19,797,959) |
| Change in net unrealized appreciation (depreciation) on: | | |
| Investments: | | |
| Investments | (128,347,231) | |
| Fidelity Central Funds | (8) | |
| Other affiliated issuers | 6,091,490 | |
| Assets and liabilities in foreign currencies | 408 | |
| Commodities | (6,394,763) | |
| Total change in net unrealized appreciation (depreciation) | | (128,650,104) |
| Net gain (loss) | | (148,448,063) |
| Net increase (decrease) in net assets resulting from operations | | $(153,584,417) |
See accompanying notes which are an integral part of the consolidated financial statements.
Consolidated Statement of Changes in Net Assets
| | Year ended February 28, 2018 | Year ended February 28, 2017 |
| Increase (Decrease) in Net Assets | | |
| Operations | | |
| Net investment income (loss) | $(5,136,354) | $(8,049,958) |
| Net realized gain (loss) | (19,797,959) | (56,558,933) |
| Change in net unrealized appreciation (depreciation) | (128,650,104) | 282,432,875 |
| Net increase (decrease) in net assets resulting from operations | (153,584,417) | 217,823,984 |
| Distributions to shareholders from net realized gain | (3,130,282) | (47,051,891) |
| Share transactions - net increase (decrease) | (136,518,156) | 114,767,885 |
| Redemption fees | – | 402,160 |
| Total increase (decrease) in net assets | (293,232,855) | 285,942,138 |
| Net Assets | | |
| Beginning of period | 1,540,104,337 | 1,254,162,199 |
| End of period | $1,246,871,482 | $1,540,104,337 |
| Other Information | | |
| Accumulated net investment loss end of period | $(6,965,927) | $(49,672) |
See accompanying notes which are an integral part of the consolidated financial statements.
Consolidated Financial Highlights
Gold Portfolio Class A
| Years ended February 28, | 2018 | 2017 | 2016A | 2015 | 2014 |
| Selected Per–Share Data | | | | | |
| Net asset value, beginning of period | $20.54 | $17.70 | $18.11 | $22.01 | $30.25 |
| Income from Investment Operations | | | | | |
| Net investment income (loss)B | (.12) | (.16) | (.06) | (.10) | –C |
| Net realized and unrealized gain (loss) | (2.09) | 3.59 | (.35) | (3.80) | (8.25) |
| Total from investment operations | (2.21) | 3.43 | (.41) | (3.90) | (8.25) |
| Distributions from net realized gain | (.03) | (.60) | – | – | – |
| Total distributions | (.03) | (.60) | – | – | – |
| Redemption fees added to paid in capitalB | – | .01 | –C | –C | .01 |
| Net asset value, end of period | $18.30 | $20.54 | $17.70 | $18.11 | $22.01 |
| Total ReturnD,E | (10.77)% | 19.97% | (2.26)% | (17.72)% | (27.24)% |
| Ratios to Average Net AssetsF,G | | | | | |
| Expenses before reductions | 1.18% | 1.19% | 1.23% | 1.23% | 1.21% |
| Expenses net of fee waivers, if any | 1.16% | 1.16% | 1.20% | 1.19% | 1.19% |
| Expenses net of all reductions | 1.16% | 1.16% | 1.20% | 1.19% | 1.18% |
| Net investment income (loss) | (.58)% | (.71)% | (.44)% | (.51)% | - %H |
| Supplemental Data | | | | | |
| Net assets, end of period (000 omitted) | $61,703 | $83,589 | $53,509 | $46,898 | $60,270 |
| Portfolio turnover rateI | 13% | 28% | 20% | 20% | 56% |
A For the year ended February 29.
B Calculated based on average shares outstanding during the period.
C Amount represents less than $.005 per share.
D Total returns would have been lower if certain expenses had not been reduced during the applicable periods shown.
E Total returns do not include the effect of the sales charges.
F Fees and expenses of any underlying Fidelity Central Funds are not included in the Fund's expense ratio. The Fund indirectly bears its proportionate share of the expenses of any underlying Fidelity Central Funds.
G Expense ratios reflect operating expenses of the class. Expenses before reductions do not reflect amounts reimbursed by the investment adviser or reductions from brokerage service arrangements or reductions from other expense offset arrangements and do not represent the amount paid by the class during periods when reimbursements or reductions occur. Expenses net of fee waivers reflect expenses after reimbursement by the investment adviser but prior to reductions from brokerage service arrangements or other expense offset arrangements. Expenses net of all reductions represent the net expenses paid by the class.
H Amount represents less than .005%.
I Amount does not include the portfolio activity of any underlying Fidelity Central Funds.
See accompanying notes which are an integral part of the consolidated financial statements.
Gold Portfolio Class M
| Years ended February 28, | 2018 | 2017 | 2016A | 2015 | 2014 |
| Selected Per–Share Data | | | | | |
| Net asset value, beginning of period | $20.19 | $17.37 | $17.83 | $21.73 | $29.95 |
| Income from Investment Operations | | | | | |
| Net investment income (loss)B | (.17) | (.22) | (.11) | (.15) | (.06) |
| Net realized and unrealized gain (loss) | (2.05) | 3.54 | (.35) | (3.75) | (8.17) |
| Total from investment operations | (2.22) | 3.32 | (.46) | (3.90) | (8.23) |
| Distributions from net realized gain | (.03) | (.51) | – | – | – |
| Total distributions | (.03) | (.51) | – | – | – |
| Redemption fees added to paid in capitalB | – | .01 | –C | –C | .01 |
| Net asset value, end of period | $17.94 | $20.19 | $17.37 | $17.83 | $21.73 |
| Total ReturnD,E | (11.04)% | 19.62% | (2.58)% | (17.95)% | (27.45)% |
| Ratios to Average Net AssetsF,G | | | | | |
| Expenses before reductions | 1.48% | 1.49% | 1.52% | 1.50% | 1.49% |
| Expenses net of fee waivers, if any | 1.47% | 1.46% | 1.48% | 1.46% | 1.47% |
| Expenses net of all reductions | 1.47% | 1.46% | 1.48% | 1.46% | 1.46% |
| Net investment income (loss) | (.88)% | (1.01)% | (.72)% | (.79)% | (.28)% |
| Supplemental Data | | | | | |
| Net assets, end of period (000 omitted) | $19,355 | $25,170 | $17,720 | $16,200 | $18,402 |
| Portfolio turnover rateH | 13% | 28% | 20% | 20% | 56% |
A For the year ended February 29.
B Calculated based on average shares outstanding during the period.
C Amount represents less than $.005 per share.
D Total returns would have been lower if certain expenses had not been reduced during the applicable periods shown.
E Total returns do not include the effect of the sales charges.
F Fees and expenses of any underlying Fidelity Central Funds are not included in the Fund's expense ratio. The Fund indirectly bears its proportionate share of the expenses of any underlying Fidelity Central Funds.
G Expense ratios reflect operating expenses of the class. Expenses before reductions do not reflect amounts reimbursed by the investment adviser or reductions from brokerage service arrangements or reductions from other expense offset arrangements and do not represent the amount paid by the class during periods when reimbursements or reductions occur. Expenses net of fee waivers reflect expenses after reimbursement by the investment adviser but prior to reductions from brokerage service arrangements or other expense offset arrangements. Expenses net of all reductions represent the net expenses paid by the class.
H Amount does not include the portfolio activity of any underlying Fidelity Central Funds.
See accompanying notes which are an integral part of the consolidated financial statements.
Gold Portfolio Class C
| Years ended February 28, | 2018 | 2017 | 2016A | 2015 | 2014 |
| Selected Per–Share Data | | | | | |
| Net asset value, beginning of period | $19.36 | $16.68 | $17.20 | $21.06 | $29.15 |
| Income from Investment Operations | | | | | |
| Net investment income (loss)B | (.24) | (.29) | (.16) | (.23) | (.16) |
| Net realized and unrealized gain (loss) | (1.95) | 3.42 | (.36) | (3.63) | (7.94) |
| Total from investment operations | (2.19) | 3.13 | (.52) | (3.86) | (8.10) |
| Distributions from net realized gain | (.02) | (.45) | – | – | – |
| Total distributions | (.02) | (.45) | – | – | – |
| Redemption fees added to paid in capitalB | – | –C | –C | –C | .01 |
| Net asset value, end of period | $17.15 | $19.36 | $16.68 | $17.20 | $21.06 |
| Total ReturnD,E | (11.35)% | 19.19% | (3.02)% | (18.33)% | (27.75)% |
| Ratios to Average Net AssetsF,G | | | | | |
| Expenses before reductions | 1.85% | 1.88% | 1.97% | 1.96% | 1.96% |
| Expenses net of fee waivers, if any | 1.83% | 1.85% | 1.93% | 1.92% | 1.94% |
| Expenses net of all reductions | 1.83% | 1.84% | 1.93% | 1.92% | 1.93% |
| Net investment income (loss) | (1.25)% | (1.40)% | (1.17)% | (1.25)% | (.76)% |
| Supplemental Data | | | | | |
| Net assets, end of period (000 omitted) | $92,724 | $101,215 | $52,732 | $39,429 | $33,811 |
| Portfolio turnover rateH | 13% | 28% | 20% | 20% | 56% |
A For the year ended February 29.
B Calculated based on average shares outstanding during the period.
C Amount represents less than $.005 per share.
D Total returns would have been lower if certain expenses had not been reduced during the applicable periods shown.
E Total returns do not include the effect of the contingent deferred sales charge.
F Fees and expenses of any underlying Fidelity Central Funds are not included in the Fund's expense ratio. The Fund indirectly bears its proportionate share of the expenses of any underlying Fidelity Central Funds.
G Expense ratios reflect operating expenses of the class. Expenses before reductions do not reflect amounts reimbursed by the investment adviser or reductions from brokerage service arrangements or reductions from other expense offset arrangements and do not represent the amount paid by the class during periods when reimbursements or reductions occur. Expenses net of fee waivers reflect expenses after reimbursement by the investment adviser but prior to reductions from brokerage service arrangements or other expense offset arrangements. Expenses net of all reductions represent the net expenses paid by the class.
H Amount does not include the portfolio activity of any underlying Fidelity Central Funds.
See accompanying notes which are an integral part of the consolidated financial statements.
Gold Portfolio
| Years ended February 28, | 2018 | 2017 | 2016A | 2015 | 2014 |
| Selected Per–Share Data | | | | | |
| Net asset value, beginning of period | $21.02 | $18.12 | $18.50 | $22.41 | $30.72 |
| Income from Investment Operations | | | | | |
| Net investment income (loss)B | (.05) | (.09) | (.03) | (.04) | .06 |
| Net realized and unrealized gain (loss) | (2.14) | 3.66 | (.35) | (3.87) | (8.38) |
| Total from investment operations | (2.19) | 3.57 | (.38) | (3.91) | (8.32) |
| Distributions from net realized gain | (.05) | (.68) | – | – | – |
| Total distributions | (.05) | (.68) | – | – | – |
| Redemption fees added to paid in capitalB | – | .01 | –C | –C | .01 |
| Net asset value, end of period | $18.78 | $21.02 | $18.12 | $18.50 | $22.41 |
| Total ReturnD | (10.47)% | 20.38% | (2.05)% | (17.45)% | (27.05)% |
| Ratios to Average Net AssetsE,F | | | | | |
| Expenses before reductions | .86% | .87% | .97% | .94% | .94% |
| Expenses net of fee waivers, if any | .85% | .84% | .93% | .90% | .92% |
| Expenses net of all reductions | .84% | .84% | .93% | .90% | .91% |
| Net investment income (loss) | (.26)% | (.39)% | (.17)% | (.22)% | .27% |
| Supplemental Data | | | | | |
| Net assets, end of period (000 omitted) | $1,011,412 | $1,271,458 | $1,076,206 | $992,944 | $1,275,913 |
| Portfolio turnover rateG | 13% | 28% | 20% | 20% | 56% |
A For the year ended February 29.
B Calculated based on average shares outstanding during the period.
C Amount represents less than $.005 per share.
D Total returns would have been lower if certain expenses had not been reduced during the applicable periods shown.
E Fees and expenses of any underlying Fidelity Central Funds are not included in the Fund's expense ratio. The Fund indirectly bears its proportionate share of the expenses of any underlying Fidelity Central Funds.
F Expense ratios reflect operating expenses of the class. Expenses before reductions do not reflect amounts reimbursed by the investment adviser or reductions from brokerage service arrangements or reductions from other expense offset arrangements and do not represent the amount paid by the class during periods when reimbursements or reductions occur. Expenses net of fee waivers reflect expenses after reimbursement by the investment adviser but prior to reductions from brokerage service arrangements or other expense offset arrangements. Expenses net of all reductions represent the net expenses paid by the class.
G Amount does not include the portfolio activity of any underlying Fidelity Central Funds.
See accompanying notes which are an integral part of the consolidated financial statements.
Gold Portfolio Class I
| Years ended February 28, | 2018 | 2017 | 2016A | 2015 | 2014 |
| Selected Per–Share Data | | | | | |
| Net asset value, beginning of period | $21.02 | $18.13 | $18.50 | $22.41 | $30.69 |
| Income from Investment Operations | | | | | |
| Net investment income (loss)B | (.05) | (.09) | (.02) | (.04) | .07 |
| Net realized and unrealized gain (loss) | (2.14) | 3.67 | (.35) | (3.87) | (8.36) |
| Total from investment operations | (2.19) | 3.58 | (.37) | (3.91) | (8.29) |
| Distributions from net realized gain | (.05) | (.70) | – | – | – |
| Total distributions | (.05) | (.70) | – | – | – |
| Redemption fees added to paid in capitalB | – | .01 | –C | –C | .01 |
| Net asset value, end of period | $18.78 | $21.02 | $18.13 | $18.50 | $22.41 |
| Total ReturnD | (10.47)% | 20.41% | (2.00)% | (17.45)% | (26.98)% |
| Ratios to Average Net AssetsE,F | | | | | |
| Expenses before reductions | .85% | .87% | .92% | .90% | .87% |
| Expenses net of fee waivers, if any | .83% | .84% | .88% | .86% | .85% |
| Expenses net of all reductions | .83% | .84% | .88% | .86% | .84% |
| Net investment income (loss) | (.24)% | (.39)% | (.12)% | (.18)% | .34% |
| Supplemental Data | | | | | |
| Net assets, end of period (000 omitted) | $61,677 | $58,673 | $52,607 | $23,667 | $107,830 |
| Portfolio turnover rateG | 13% | 28% | 20% | 20% | 56% |
A For the year ended February 29.
B Calculated based on average shares outstanding during the period.
C Amount represents less than $.005 per share.
D Total returns would have been lower if certain expenses had not been reduced during the applicable periods shown.
E Fees and expenses of any underlying Fidelity Central Funds are not included in the Fund's expense ratio. The Fund indirectly bears its proportionate share of the expenses of any underlying Fidelity Central Funds.
F Expense ratios reflect operating expenses of the class. Expenses before reductions do not reflect amounts reimbursed by the investment adviser or reductions from brokerage service arrangements or reductions from other expense offset arrangements and do not represent the amount paid by the class during periods when reimbursements or reductions occur. Expenses net of fee waivers reflect expenses after reimbursement by the investment adviser but prior to reductions from brokerage service arrangements or other expense offset arrangements. Expenses net of all reductions represent the net expenses paid by the class.
G Amount does not include the portfolio activity of any underlying Fidelity Central Funds.
See accompanying notes which are an integral part of the consolidated financial statements.
Notes to Consolidated Financial Statements
For the period ended February 28, 2018
1. Organization.
Gold Portfolio (the Fund) is a non-diversified fund of Fidelity Select Portfolios (the Trust) and is authorized to issue an unlimited number of shares. The Trust is registered under the Investment Company Act of 1940, as amended (the 1940 Act), as an open-end management investment company organized as a Massachusetts business trust. The Fund invests primarily in securities of companies whose principal business activities fall within specific industries. The Fund offers Class A, Class M (formerly Class T), Class C, Gold and Class I shares, each of which has equal rights as to assets and voting privileges. Each class has exclusive voting rights with respect to matters that affect that class.
After the close of business on June 24, 2016, all outstanding Class B shares were converted to Class A shares. All prior fiscal period dollar and share amounts for Class B presented in the Notes to Consolidated Financial Statements are for the period March 1, 2016 through June 24, 2016.
2. Consolidated Subsidiary.
The Fund invests in certain commodity-related investments through Fidelity Select Gold Cayman Ltd, a wholly owned subsidiary (the "Subsidiary"). As of period end, the Fund held an investment of $85,477,120 in the Subsidiary, representing 6.9% of the Fund's net assets.
The financial statements have been consolidated and include accounts of the Fund and the Subsidiary. Accordingly, all inter-company transactions and balances have been eliminated.
3. Investments in Fidelity Central Funds.
The Fund invests in Fidelity Central Funds, which are open-end investment companies generally available only to other investment companies and accounts managed by the investment adviser and its affiliates. The Fund's Consolidated Schedule of Investments lists each of the Fidelity Central Funds held as of period end, if any, as an investment of the Fund, but does not include the underlying holdings of each Fidelity Central Fund. As an Investing Fund, the Fund indirectly bears its proportionate share of the expenses of the underlying Fidelity Central Funds.
The Money Market Central Funds seek preservation of capital and current income and are managed by Fidelity Investments Money Management, Inc. (FIMM), an affiliate of the investment adviser. Annualized expenses of the Money Market Central Funds as of their most recent shareholder report date are less than .005%.
A complete unaudited list of holdings for each Fidelity Central Fund is available upon request or at the Securities and Exchange Commission (the SEC) website at www.sec.gov. In addition, the financial statements of the Fidelity Central Funds, which are not covered by the Fund's Report of Independent Registered Public Accounting Firm, are available on the SEC website or upon request.
4. Significant Accounting Policies.
The Fund is an investment company and applies the accounting and reporting guidance of the Financial Accounting Standards Board (FASB) Accounting Standards Codification Topic 946 Financial Services – Investments Companies. The consolidated financial statements have been prepared in conformity with accounting principles generally accepted in the United States of America (GAAP), which require management to make certain estimates and assumptions at the date of the consolidated financial statements. Actual results could differ from those estimates. Subsequent events, if any, through the date that the consolidated financial statements were issued have been evaluated in the preparation of the consolidated financial statements. The following summarizes the significant accounting policies of the Fund:
Investment Valuation. Investments are valued as of 4:00 p.m. Eastern time on the last calendar day of the period. The Board of Trustees (the Board) has delegated the day to day responsibility for the valuation of the Fund's investments to the Fair Value Committee (the Committee) established by the Fund's investment adviser. In accordance with valuation policies and procedures approved by the Board, the Fund attempts to obtain prices from one or more third party pricing vendors or brokers to value its investments. When current market prices, quotations or currency exchange rates are not readily available or reliable, investments will be fair valued in good faith by the Committee, in accordance with procedures adopted by the Board. Factors used in determining fair value vary by investment type and may include market or investment specific events. The frequency with which these procedures are used cannot be predicted and they may be utilized to a significant extent. The Committee oversees the Fund's valuation policies and procedures and reports to the Board on the Committee's activities and fair value determinations. The Board monitors the appropriateness of the procedures used in valuing the Fund's investments and ratifies the fair value determinations of the Committee.
The Fund categorizes the inputs to valuation techniques used to value its investments into a disclosure hierarchy consisting of three levels as shown below:
- Level 1 – quoted prices in active markets for identical investments
- Level 2 – other significant observable inputs (including quoted prices for similar investments, interest rates, prepayment speeds, etc.)
- Level 3 – unobservable inputs (including the Fund's own assumptions based on the best information available)
Valuation techniques used to value the Fund's investments by major category are as follows:
Equity securities, including restricted securities, for which market quotations are readily available, are valued at the last reported sale price or official closing price as reported by a third party pricing vendor on the primary market or exchange on which they are traded and are categorized as Level 1 in the hierarchy. In the event there were no sales during the day or closing prices are not available, securities are valued at the last quoted bid price or may be valued using the last available price and are generally categorized as Level 2 in the hierarchy. For foreign equity securities, when market or security specific events arise, comparisons to the valuation of American Depositary Receipts (ADRs), futures contracts, Exchange-Traded Funds (ETFs) and certain indexes as well as quoted prices for similar securities may be used and would be categorized as Level 2 in the hierarchy. Utilizing these techniques may result in transfers between Level 1 and Level 2. For equity securities, including restricted securities, where observable inputs are limited, assumptions about market activity and risk are used and these securities may be categorized as Level 3 in the hierarchy.
Investments in commodities are valued at their last traded price at 4:00 p.m. Eastern time each business day and are categorized as Level 1 in the hierarchy. Investments in open-end mutual funds, including the Fidelity Central Funds, are valued at their closing net asset value (NAV) each business day and are categorized as Level 1 in the hierarchy.
Changes in valuation techniques may result in transfers in or out of an assigned level within the disclosure hierarchy. The aggregate value of investments by input level as of February 28, 2018, information on transfers between Levels 1 and 2 is included at the end of the Fund's Consolidated Schedule of Investments.
Foreign Currency. The Fund may use foreign currency contracts to facilitate transactions in foreign-denominated securities. Gains and losses from these transactions may arise from changes in the value of the foreign currency or if the counterparties do not perform under the contracts' terms.
Foreign-denominated assets, including investment securities, and liabilities are translated into U.S. dollars at the exchange rates at period end. Purchases and sales of investment securities, income and dividends received and expenses denominated in foreign currencies are translated into U.S. dollars at the exchange rate in effect on the transaction date.
The effects of exchange rate fluctuations on investments are included with the net realized and unrealized gain (loss) on investment securities. Other foreign currency transactions resulting in realized and unrealized gain (loss) are disclosed separately.
Investment Transactions and Income. For financial reporting purposes, the Fund's investment holdings and NAV include trades executed through the end of the last business day of the period. The NAV per share for processing shareholder transactions is calculated as of the close of business of the New York Stock Exchange (NYSE), normally 4:00 p.m. Eastern time and includes trades executed through the end of the prior business day. Gains and losses on securities sold are determined on the basis of identified cost and includes proceeds received from litigation. Dividend income is recorded on the ex-dividend date, except for certain dividends from foreign securities where the ex-dividend date may have passed, which are recorded as soon as the Fund is informed of the ex-dividend date. Non-cash dividends included in dividend income, if any, are recorded at the fair market value of the securities received. Income and capital gain distributions from Fidelity Central Funds, if any, are recorded on the ex-dividend date. Certain distributions received by the Fund represent a return of capital or capital gain. The Fund determines the components of these distributions subsequent to the ex-dividend date, based upon receipt of tax filings or other correspondence relating to the underlying investment. These distributions are recorded as a reduction of cost of investments and/or as a realized gain. Investment income is recorded net of foreign taxes withheld where recovery of such taxes is uncertain.
Class Allocations and Expenses. Investment income, realized and unrealized capital gains and losses, common expenses of the Fund, and certain fund-level expense reductions, if any, are allocated daily on a pro-rata basis to each class based on the relative net assets of each class to the total net assets of the Fund. Each class differs with respect to transfer agent and distribution and service plan fees incurred. Certain expense reductions may also differ by class. For the reporting period, the allocated portion of income and expenses to each class as a percent of its average net assets may vary due to the timing of recording these transactions in relation to fluctuating net assets of the classes. Expenses directly attributable to a fund are charged to that fund. Expenses attributable to more than one fund are allocated among the respective funds on the basis of relative net assets or other appropriate methods. Expense estimates are accrued in the period to which they relate and adjustments are made when actual amounts are known.
Deferred Trustee Compensation. Under a Deferred Compensation Plan (the Plan), independent Trustees may elect to defer receipt of a portion of their annual compensation. Deferred amounts are invested in a cross-section of Fidelity funds, are marked-to-market and remain in the Fund until distributed in accordance with the Plan. The investment of deferred amounts and the offsetting payable to the Trustees are included in the accompanying Statement of Assets and Liabilities.
Income Tax Information and Distributions to Shareholders. Each year, the Fund intends to qualify as a regulated investment company under Subchapter M of the Internal Revenue Code, including distributing substantially all of its taxable income and realized gains. As a result, no provision for U.S. Federal income taxes is required. As of February 28, 2018, the Fund did not have any unrecognized tax benefits in the consolidated financial statements; nor is the Fund aware of any tax positions for which it is reasonably possible that the total amounts of unrecognized tax benefits will significantly change in the next twelve months. The Fund files a U.S. federal tax return, in addition to state and local tax returns as required. The Fund's federal income tax returns are subject to examination by the Internal Revenue Service (IRS) for a period of three fiscal years after they are filed. State and local tax returns may be subject to examination for an additional fiscal year depending on the jurisdiction. Foreign taxes are provided for based on the Fund's understanding of the tax rules and rates that exist in the foreign markets in which it invests.
The Subsidiary is classified as a controlled foreign corporation under Subchapter N of the Internal Revenue Code. Therefore, the Fund is required to increase its taxable income by its share of the Subsidiary's income. Net investment losses of the Subsidiary cannot be deducted by the Fund in the current period nor carried forward to offset taxable income in future periods.
Distributions are declared and recorded on the ex-dividend date. Income dividends and capital gain distributions are declared separately for each class. Income and capital gain distributions are determined in accordance with income tax regulations, which may differ from GAAP.
Capital accounts within the consolidated financial statements are adjusted for permanent book-tax differences. These adjustments have no impact on net assets or the results of operations. Capital accounts are not adjusted for temporary book-tax differences which will reverse in a subsequent period.
Book-tax differences are primarily due to foreign currency transactions, passive foreign investment companies (PFIC), controlled foreign corporations, deferred trustees compensation, net operating losses, capital loss carryforwards and losses deferred due to wash sales and excise tax regulations.
As of period end, the cost and unrealized appreciation (depreciation) in securities, and derivatives if applicable, for federal income tax purposes on an unconsolidated basis were as follows:
| Gross unrealized appreciation | $241,909,637 |
| Gross unrealized depreciation | (442,632,944) |
| Net unrealized appreciation (depreciation) | $(200,723,307) |
| Tax Cost | $1,446,999,518 |
The tax-based components of distributable earnings as of period end were as follows:
| Capital loss carryforward | $(1,264,055,651) |
| Net unrealized appreciation (depreciation) on securities and other investments | $(200,721,875) |
Capital loss carryforwards are only available to offset future capital gains of the Fund to the extent provided by regulations and may be limited. Under the Regulated Investment Company Modernization Act of 2010 (the Act), the Fund is permitted to carry forward capital losses incurred in taxable years beginning after December 22, 2010 for an unlimited period and such capital losses are required to be used prior to any losses that expire. The capital loss carryforward information presented below, including any applicable limitation, is estimated as of fiscal period end and is subject to adjustment.
| No expiration | |
| Short-term | $(141,667,626) |
| Long-term | (1,122,388,025) |
| Total capital loss carryforward | $(1,264,055,651) |
The Fund intends to elect to defer to its next fiscal year $6,867,607 of ordinary losses recognized during the period January 1, 2018 to February 28, 2018.
The tax character of distributions paid was as follows:
| | February 28, 2018 | February 28, 2017 |
| Ordinary Income | $3,130,282 | $ 47,051,891 |
Restricted Securities. The Fund may invest in securities that are subject to legal or contractual restrictions on resale. These securities generally may be resold in transactions exempt from registration or to the public if the securities are registered. Disposal of these securities may involve time-consuming negotiations and expense, and prompt sale at an acceptable price may be difficult. Information regarding restricted securities is included at the end of the Fund's Consolidated Schedule of Investments.
5. Purchases and Sales of Investments.
Purchases and sales of securities, other than short-term securities, aggregated $188,488,420 and $329,808,540, respectively.
6. Fees and Other Transactions with Affiliates.
Management Fee. Fidelity SelectCo, LLC (the investment adviser) and its affiliates provide the Fund with investment management related services for which the Fund pays a monthly management fee. The management fee is the sum of an individual fund fee rate that is based on an annual rate of .30% of the Fund's average net assets and an annualized group fee rate that averaged .24% during the period. The group fee rate is based upon the average net assets of all the mutual funds advised by Fidelity Management & Research Company (FMR) and the investment adviser. The group fee rate decreases as assets under management increase and increases as assets under management decrease.
FMR, either through itself or through an affiliate provides investment management related services to the Subsidiary for which the Subsidiary pays a monthly management fee at the annual rate of .30% of its net assets. Under the management contract with the subsidiary, FMR pays all other expenses of the Subsidiary, except custodian fees.
For the reporting period, the total consolidated annual management fee rate which includes the management fee of the Fund and the Subsidiary was .56% of the Fund's average net assets.
During the period, the investment adviser waived a portion of the Fund's management fee representing the amount of the management fee paid by the Subsidiary to FMR as described in the Expense Reductions note.
Distribution and Service Plan Fees. In accordance with Rule 12b-1 of the 1940 Act, the Fund has adopted separate Distribution and Service Plans for each class of shares. Certain classes pay Fidelity Distributors Corporation (FDC), an affiliate of the investment adviser, separate Distribution and Service Fees, each of which is based on an annual percentage of each class' average net assets. In addition, FDC may pay financial intermediaries for selling shares of the Fund and providing shareholder support services. For the period, the Distribution and Service Fee rates, total fees and amounts retained by FDC were as follows:
| | Distribution Fee | Service Fee | Total Fees | Retained by FDC |
| Class A | -% | .25% | $182,210 | $7,154 |
| Class M | .25% | .25% | 116,752 | 10 |
| Class C | .75% | .25% | 1,024,737 | 245,159 |
| | | | $1,323,699 | $252,323 |
Sales Load. FDC may receive a front-end sales charge of up to 5.75% for selling Class A shares and 3.50% for selling Class M shares, some of which is paid to financial intermediaries for selling shares of the Fund. Depending on the holding period, FDC may receive contingent deferred sales charges levied on Class A, Class M and Class C redemptions. The deferred sales charges are 1.00% for Class C shares, 1.00% for certain purchases of Class A shares and .25% for certain purchases of Class M shares.
For the period, sales charge amounts retained by FDC were as follows:
| | Retained by FDC |
| Class A | $30,750 |
| Class M | 6,668 |
| Class C(a) | 13,328 |
| | $50,746 |
(a) When Class C shares are initially sold, FDC pays commissions from its own resources to financial intermediaries through which the sales are made.
Transfer Agent Fees. Fidelity Investments Institutional Operations Company, Inc., (FIIOC), an affiliate of the investment adviser, is the transfer, dividend disbursing and shareholder servicing agent for each class of the Fund. FIIOC receives account fees and asset-based fees that vary according to the account size and type of account of the shareholders of the respective classes of the Fund. FIIOC pays for typesetting, printing and mailing of shareholder reports, except proxy statements.
For the period, transfer agent fees for each class were as follows:
| | Amount | % of Class-Level Average Net Assets |
| Class A | $206,820 | .28 |
| Class M | 78,845 | .34 |
| Class C | 209,550 | .20 |
| Gold | 2,539,863 | .22 |
| Class I | 131,033 | .20 |
| | $3,166,111 | |
Accounting and Security Lending Fees. Fidelity Service Company, Inc. (FSC), an affiliate of the investment adviser, maintains the Fund's accounting records. The accounting fee is based on the level of average net assets for each month. Under a separate contract, FSC administers the security lending program. The security lending fee is based on the number and duration of lending transactions.
Brokerage Commissions. The Fund placed a portion of its portfolio transactions with brokerage firms which are affiliates of the investment adviser. Brokerage commissions are included in net realized gain (loss) and change in net unrealized appreciation (depreciation) in the Consolidated Statement of Operations. The commissions paid to these affiliated firms were $6,705 for the period.
Interfund Trades. The Fund may purchase from or sell securities to other Fidelity Funds under procedures adopted by the Board. The procedures have been designed to ensure these interfund trades are executed in accordance with Rule 17a-7 of the 1940 Act. Interfund trades are included within the respective purchases and sales amounts shown in the Purchases and Sales of Investments note.
Other. During the period, the investment adviser reimbursed the Fund for certain losses in the amount of $1,500.
7. Committed Line of Credit.
The Fund participates with other funds managed by the investment adviser or an affiliate in a $4.25 billion credit facility (the "line of credit") to be utilized for temporary or emergency purposes to fund shareholder redemptions or for other short-term liquidity purposes. The Fund has agreed to pay commitment fees on its pro-rata portion of the line of credit, which amounted to $4,369 and is reflected in Miscellaneous expenses on the Consolidated Statement of Operations. During the period, the Fund did not borrow on this line of credit.
8. Security Lending.
The Fund lends portfolio securities through a lending agent from time to time in order to earn additional income. On the settlement date of the loan, the Fund receives collateral (in the form of U.S. Treasury obligations, letters of credit and/or cash) against the loaned securities and maintains collateral in an amount not less than 100% of the market value of the loaned securities during the period of the loan. The market value of the loaned securities is determined at the close of business of the Fund and any additional required collateral is delivered to the Fund on the next business day. The Fund or borrower may terminate the loan at any time, and if the borrower defaults on its obligation to return the securities loaned because of insolvency or other reasons, the Fund may apply collateral received from the borrower against the obligation. The Fund may experience delays and costs in recovering the securities loaned. Any cash collateral received is invested in the Fidelity Securities Lending Cash Central Fund. The value of loaned securities and cash collateral at period end are disclosed on the Fund's Consolidated Statement of Assets and Liabilities. Security lending income represents the income earned on investing cash collateral, less rebates paid to borrowers and any lending agent fees associated with the loan, plus any premium payments received for lending certain types of securities. Security lending income is presented in the Consolidated Statement of Operations as a component of income from Fidelity Central Funds. Total security lending income during the period amounted to $30,724.
9. Expense Reductions.
The investment adviser has contractually agreed to waive the Fund's management fee in an amount equal to the management fee paid by the Subsidiary to FMR. During the period, this waiver reduced the Fund's management fee by $249,612.
Commissions paid to certain brokers with whom the investment adviser, or its affiliates, places trades on behalf of the Fund include an amount in addition to trade execution, which may be rebated back to the Fund to offset certain expenses. This amount totaled $23,857 for the period.
In addition, during the period the investment adviser reimbursed and/or waived a portion of fund-level operating expenses in the amount of $12,566.
10. Distributions to Shareholders.
Distributions to shareholders of each class were as follows:
| | Year ended
February 28, 2018 | Year ended
February 28, 2017 |
| From net realized gain | | |
| Class A | $127,654 | $2,221,326 |
| Class M | 32,220 | 587,030 |
| Class C | 80,827 | 2,039,868 |
| Gold | 2,740,284 | 40,224,766 |
| Class I | 149,297 | 1,978,901 |
| Total | $3,130,282 | $47,051,891 |
11. Share Transactions.
Share transactions for each class were as follows and may contain automatic conversions between classes or exchanges between affiliated funds:
| | Shares | Shares | Dollars | Dollars |
| | Year ended February 28, 2018 | Year ended February 28, 2017 | Year ended February 28, 2018 | Year ended February 28, 2017 |
| Class A | | | | |
| Shares sold | 960,171 | 3,164,607 | $19,302,127 | $69,537,871 |
| Reinvestment of distributions | 5,732 | 120,564 | 125,534 | 2,146,978 |
| Shares redeemed | (1,663,786) | (2,238,855) | (33,274,700) | (48,377,613) |
| Net increase (decrease) | (697,883) | 1,046,316 | $(13,847,039) | $23,307,236 |
| Class M | | | | |
| Shares sold | 233,072 | 712,177 | $4,622,741 | $15,561,760 |
| Reinvestment of distributions | 1,488 | 32,071 | 32,029 | 560,038 |
| Shares redeemed | (402,307) | (517,783) | (7,900,562) | (11,004,318) |
| Net increase (decrease) | (167,747) | 226,465 | $(3,245,792) | $5,117,480 |
| Class B | | | | |
| Shares sold | – | 7,043 | $– | $134,526 |
| Shares redeemed | – | (89,907) | – | (1,923,575) |
| Net increase (decrease) | – | (82,864) | $– | $(1,789,049) |
| Class C | | | | |
| Shares sold | 1,214,001 | 3,277,150 | $22,977,515 | $68,100,712 |
| Reinvestment of distributions | 3,724 | 115,019 | 76,868 | 1,909,405 |
| Shares redeemed | (1,038,456) | (1,324,351) | (19,487,828) | (26,570,952) |
| Net increase (decrease) | 179,269 | 2,067,818 | $3,566,555 | $43,439,165 |
| Gold | | | | |
| Shares sold | 17,998,314 | 44,152,495 | $372,447,330 | $998,832,934 |
| Reinvestment of distributions | 117,013 | 2,098,203 | 2,622,272 | 38,476,693 |
| Shares redeemed | (24,743,063) | (45,146,079) | (508,056,164) | (990,273,602) |
| Net increase (decrease) | (6,627,736) | 1,104,619 | $(132,986,562) | $47,036,025 |
| Class I | | | | |
| Shares sold | 1,883,552 | 2,033,849 | $38,579,606 | $45,606,027 |
| Reinvestment of distributions | 6,152 | 97,474 | 137,796 | 1,788,422 |
| Shares redeemed | (1,396,712) | (2,240,667) | (28,722,720) | (49,737,421) |
| Net increase (decrease) | 492,992 | (109,344) | $9,994,682 | $(2,342,972) |
12. Other.
The Fund's organizational documents provide former and current trustees and officers with a limited indemnification against liabilities arising in connection with the performance of their duties to the Fund. In the normal course of business, the Fund may also enter into contracts that provide general indemnifications. The Fund's maximum exposure under these arrangements is unknown as this would be dependent on future claims that may be made against the Fund. The risk of material loss from such claims is considered remote.
Materials Portfolio
Performance: The Bottom Line
Average annual total return reflects the change in the value of an investment, assuming reinvestment of distributions from dividend income and capital gains (the profits earned upon the sale of securities that have grown in value, if any) and assuming a constant rate of performance each year. The hypothetical investment and the average annual total returns do not reflect the deduction of taxes that a shareholder would pay on fund distributions or the redemption of fund shares. During periods of reimbursement by Fidelity, a fund’s total return will be greater than it would be had the reimbursement not occurred. How a fund did yesterday is no guarantee of how it will do tomorrow.
Average Annual Total Returns
| For the periods ended February 28, 2018 | Past 1 year | Past 5 years | Past 10 years |
| Materials Portfolio | 14.96% | 8.29% | 7.64% |
$10,000 Over 10 Years
Let's say hypothetically that $10,000 was invested in Materials Portfolio, a class of the fund, on February 29, 2008.
The chart shows how the value of your investment would have changed, and also shows how the S&P 500® Index performed over the same period.
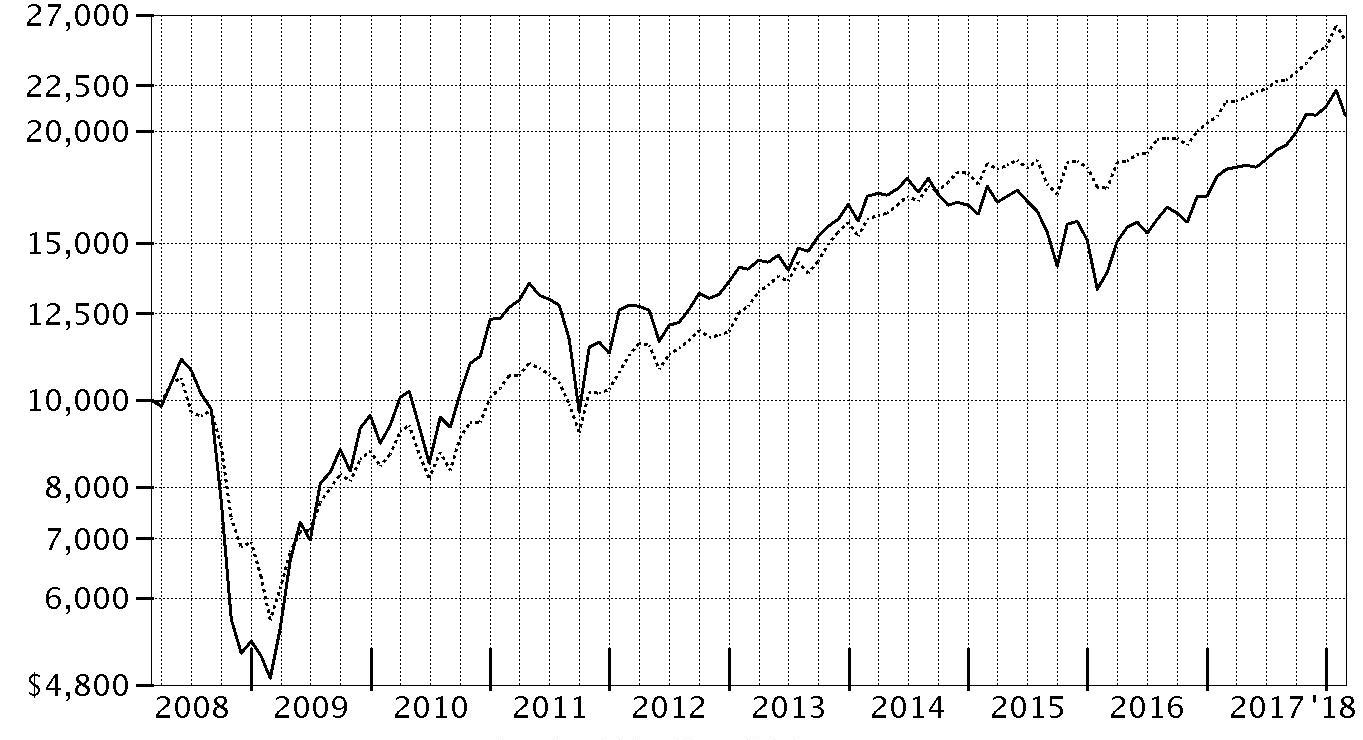
| Period Ending Values |
| $20,873 | Materials Portfolio |
| $25,307 | S&P 500® Index |
Materials Portfolio
Management's Discussion of Fund Performance
Market Recap: U.S. equities gained 17.10% for the 12 months ending February 28, 2018, as the S&P 500
® index moved steadily higher throughout 2017 and into 2018 until sharply reversing course in February. The drop was in stark contrast to the low volatility seen throughout 2017, along with consumer sentiment and other market indicators that stayed positive. Investors remained decidedly upbeat as the calendar turned, and the index rose 5.73% in January. February was a decidedly different story, though, as volatility spiked amid fear that rising inflation and the potential for the economy to overheat would prompt the U.S. Federal Reserve to pick up the pace of interest rate hikes. The index returned -3.69% for the month, its first negative result since October 2016. For the full 12 months, growth stocks handily topped value, while large-caps bested small-caps. By sector, information technology fared best by far, gaining 36% amid strong earnings growth from several major index constituents. Consumer discretionary (+22%) also stood out, driven by retailers. Financials added 20%, riding the uptick in bond yields. Materials and industrials rose about 16% each, boosted by higher demand, especially from China. Conversely, notable laggards included the defensive telecommunication services (-5%) and utilities (-2%) sectors, while rising rates held back real estate (-3%).
Comments from Portfolio Manager Rick Malnight: For the year, the fund’s share classes (excluding sales charges, if applicable) finished roughly in line with the 14.70% return of the MSCI U.S. IMI Materials 25/50 Index, but trailed the S&P 500
®. Versus the MSCI sector index, our sizable underweighting in the steel segment, plus good stock picking in commodity chemicals and paper packaging, bolstered fund performance. A large overweighting in strong-performing Westlake Chemical was the fund’s top relative contributor. I significantly increased this position during the period. Ethylene producer LyondellBasell Industries, the fund’s largest overweighting at period end, also contributed, as did Steel Dynamics, one of the U.S. steel producers we bought this period. Conversely, an underweighting and weak picks in industrial gases dampened the fund’s relative performance, as did positioning in fertilizers & agricultural chemicals and out-of-index exposure to trading companies and distributors. MSCI index stalwart Praxair finished as the fund’s largest relative detractor, as the stock advanced 29% this period, and we didn’t own it. Another relative detractor was strong-performing agricultural chemical supplier FMC, which we didn’t own early in the period.
The views expressed above reflect those of the portfolio manager(s) only through the end of the period as stated on the cover of this report and do not necessarily represent the views of Fidelity or any other person in the Fidelity organization. Any such views are subject to change at any time based upon market or other conditions and Fidelity disclaims any responsibility to update such views. These views may not be relied on as investment advice and, because investment decisions for a Fidelity fund are based on numerous factors, may not be relied on as an indication of trading intent on behalf of any Fidelity fund.
Notes to Shareholders: On November 17, 2017, Rick Malnight succeeded Tobias Welo as Portfolio Manager of the fund.
On December 8, 2017, shareholders approved proposals from the Board of Trustees to eliminate each sector/industry fund's fundamental “invests primarily” policy and to modify the fundamental concentration policy for certain funds. The changes took effect on January 1, 2018, and do not impact how the funds are managed.
Materials Portfolio
Investment Summary (Unaudited)
Top Ten Stocks as of February 28, 2018
| | % of fund's net assets |
| DowDuPont, Inc. | 22.3 |
| LyondellBasell Industries NV Class A | 9.8 |
| The Chemours Co. LLC | 5.4 |
| Linde AG | 5.1 |
| WestRock Co. | 4.2 |
| Sherwin-Williams Co. | 3.6 |
| Westlake Chemical Corp. | 3.1 |
| Steel Dynamics, Inc. | 3.1 |
| Freeport-McMoRan, Inc. | 3.0 |
| FMC Corp. | 2.2 |
| | 61.8 |
Top Industries (% of fund's net assets)
| As of February 28, 2018 |
| | Chemicals | 68.2% |
| | Metals & Mining | 14.6% |
| | Containers & Packaging | 10.4% |
| | Construction Materials | 4.4% |
| | Trading Companies & Distributors | 1.6% |
| | All Others* | 0.8% |

* Includes short-term investments and net other assets (liabilities).
Materials Portfolio
Schedule of Investments February 28, 2018
Showing Percentage of Net Assets
| Common Stocks - 98.2% | | | |
| | | Shares | Value |
| Chemicals - 66.7% | | | |
| Commodity Chemicals - 18.2% | | | |
| Alpek SA de CV | | 3,308,900 | $4,286,501 |
| Cabot Corp. | | 132,800 | 7,991,904 |
| Ciner Resources LP | | 147,200 | 4,073,024 |
| LG Chemical Ltd. | | 33,922 | 11,956,471 |
| LyondellBasell Industries NV Class A | | 1,704,915 | 184,505,901 |
| Olin Corp. | | 1,045,900 | 33,991,750 |
| Orion Engineered Carbons SA | | 447,200 | 12,320,360 |
| Tronox Ltd. Class A | | 1,355,803 | 24,784,079 |
| Westlake Chemical Corp. | | 536,380 | 58,068,499 |
| | | | 341,978,489 |
| Diversified Chemicals - 30.6% | | | |
| Ashland Global Holdings, Inc. | | 218,600 | 15,481,252 |
| DowDuPont, Inc. | | 5,983,883 | 420,666,976 |
| Eastman Chemical Co. | | 300,748 | 30,399,608 |
| Huntsman Corp. | | 266,900 | 8,612,863 |
| The Chemours Co. LLC | | 2,125,631 | 100,988,729 |
| | | | 576,149,428 |
| Fertilizers & Agricultural Chemicals - 4.9% | | | |
| CF Industries Holdings, Inc. | | 504,010 | 20,785,372 |
| FMC Corp. | | 537,500 | 42,183,000 |
| Nutrien Ltd. | | 272,427 | 13,385,694 |
| The Scotts Miracle-Gro Co. Class A | | 187,131 | 16,811,849 |
| | | | 93,165,915 |
| Industrial Gases - 5.1% | | | |
| Linde AG (a) | | 436,111 | 96,772,567 |
| Specialty Chemicals - 7.9% | | | |
| Axalta Coating Systems Ltd. (a) | | 445,000 | 13,706,000 |
| Celanese Corp. Class A | | 289,600 | 29,209,056 |
| Frutarom Industries Ltd. | | 115,796 | 10,654,491 |
| Platform Specialty Products Corp. (a) | | 1,973,900 | 20,607,516 |
| Sherwin-Williams Co. | | 169,800 | 68,188,284 |
| W.R. Grace & Co. | | 84,702 | 5,605,578 |
| | | | 147,970,925 |
|
| TOTAL CHEMICALS | | | 1,256,037,324 |
|
| Construction Materials - 4.4% | | | |
| Construction Materials - 4.4% | | | |
| CRH PLC sponsored ADR (b) | | 239,200 | 7,917,520 |
| Eagle Materials, Inc. | | 344,115 | 34,490,646 |
| Summit Materials, Inc. | | 1,288,728 | 40,762,467 |
| | | | 83,170,633 |
| Containers & Packaging - 10.4% | | | |
| Metal & Glass Containers - 1.6% | | | |
| Aptargroup, Inc. | | 182,800 | 16,345,976 |
| Berry Global Group, Inc. (a) | | 261,200 | 14,209,280 |
| | | | 30,555,256 |
| Paper Packaging - 8.8% | | | |
| Avery Dennison Corp. | | 182,100 | 21,515,115 |
| Graphic Packaging Holding Co. | | 2,717,095 | 41,598,724 |
| Packaging Corp. of America | | 189,800 | 22,624,160 |
| WestRock Co. | | 1,202,819 | 79,097,377 |
| | | | 164,835,376 |
|
| TOTAL CONTAINERS & PACKAGING | | | 195,390,632 |
|
| Energy Equipment & Services - 0.5% | | | |
| Oil & Gas Equipment & Services - 0.5% | | | |
| Tenaris SA sponsored ADR (b) | | 298,700 | 10,302,163 |
| Metals & Mining - 14.6% | | | |
| Copper - 3.5% | | | |
| Freeport-McMoRan, Inc. (a) | | 3,059,700 | 56,910,420 |
| Lundin Mining Corp. | | 1,442,500 | 9,386,592 |
| | | | 66,297,012 |
| Diversified Metals & Mining - 2.2% | | | |
| Alcoa Corp. (a) | | 427,300 | 19,215,681 |
| Glencore Xstrata PLC | | 3,613,113 | 19,000,118 |
| Ivanhoe Mines Ltd. (a) | | 1,260,100 | 3,171,854 |
| | | | 41,387,653 |
| Gold - 2.7% | | | |
| Franco-Nevada Corp. | | 75,100 | 5,261,506 |
| Newmont Mining Corp. | | 1,076,100 | 41,107,020 |
| Randgold Resources Ltd. sponsored ADR | | 59,900 | 4,853,098 |
| | | | 51,221,624 |
| Steel - 6.2% | | | |
| Allegheny Technologies, Inc. (a) | | 250,700 | 6,495,637 |
| Nucor Corp. | | 292,100 | 19,103,340 |
| Reliance Steel & Aluminum Co. | | 211,600 | 19,079,972 |
| Ryerson Holding Corp. (a) | | 541,100 | 5,465,110 |
| Steel Dynamics, Inc. | | 1,248,900 | 57,761,625 |
| United States Steel Corp. | | 188,255 | 8,190,975 |
| | | | 116,096,659 |
|
| TOTAL METALS & MINING | | | 275,002,948 |
|
| Trading Companies & Distributors - 1.6% | | | |
| Trading Companies & Distributors - 1.6% | | | |
| Univar, Inc. (a) | | 1,040,733 | 29,983,518 |
| TOTAL COMMON STOCKS | | | |
| (Cost $1,467,654,984) | | | 1,849,887,218 |
|
| Nonconvertible Preferred Stocks - 1.5% | | | |
| Chemicals - 1.5% | | | |
| Commodity Chemicals - 1.5% | | | |
| Braskem SA (PN-A) | | | |
| (Cost $30,933,362) | | 1,982,400 | 28,354,016 |
|
| Money Market Funds - 1.5% | | | |
| Fidelity Cash Central Fund, 1.41% (c) | | 20,056,467 | 20,060,478 |
| Fidelity Securities Lending Cash Central Fund 1.42% (c)(d) | | 7,755,046 | 7,755,822 |
| TOTAL MONEY MARKET FUNDS | | | |
| (Cost $27,816,300) | | | 27,816,300 |
| TOTAL INVESTMENT IN SECURITIES - 101.2% | | | |
| (Cost $1,526,404,646) | | | 1,906,057,534 |
| NET OTHER ASSETS (LIABILITIES) - (1.2)% | | | (23,459,758) |
| NET ASSETS - 100% | | | $1,882,597,776 |
Legend
(a) Non-income producing
(b) Security or a portion of the security is on loan at period end.
(c) Affiliated fund that is generally available only to investment companies and other accounts managed by Fidelity Investments. The rate quoted is the annualized seven-day yield of the fund at period end. A complete unaudited listing of the fund's holdings as of its most recent quarter end is available upon request. In addition, each Fidelity Central Fund's financial statements, which are not covered by the Fund's Report of Independent Registered Public Accounting Firm, are available on the SEC's website or upon request.
(d) Investment made with cash collateral received from securities on loan.
Affiliated Central Funds
Information regarding fiscal year to date income earned by the Fund from investments in Fidelity Central Funds is as follows:
| Fund | Income earned |
| Fidelity Cash Central Fund | $193,465 |
| Fidelity Securities Lending Cash Central Fund | 58,427 |
| Total | $251,892 |
Amounts in the income column in the above table include any capital gain distributions from underlying funds, which are presented in the corresponding line-item in the Statement of Operations if applicable.
Investment Valuation
The following is a summary of the inputs used, as of February 28, 2018, involving the Fund's assets and liabilities carried at fair value. The inputs or methodology used for valuing securities may not be an indication of the risk associated with investing in those securities. For more information on valuation inputs, and their aggregation into the levels used below, please refer to the Investment Valuation section in the accompanying Notes to Financial Statements.
| | Valuation Inputs at Reporting Date: |
| Description | Total | Level 1 | Level 2 | Level 3 |
| Investments in Securities: | | | | |
| Common Stocks | $1,849,887,218 | $1,722,158,062 | $127,729,156 | $-- |
| Nonconvertible Preferred Stocks | 28,354,016 | 28,354,016 | -- | -- |
| Money Market Funds | 27,816,300 | 27,816,300 | -- | -- |
| Total Investments in Securities: | $1,906,057,534 | $1,778,328,378 | $127,729,156 | $-- |
Other Information
Distribution of investments by country or territory of incorporation, as a percentage of Total Net Assets, is as follows (Unaudited):
| United States of America | 75.6% |
| Netherlands | 9.8% |
| Germany | 5.1% |
| Canada | 1.7% |
| Brazil | 1.5% |
| Australia | 1.3% |
| Bailiwick of Jersey | 1.2% |
| Luxembourg | 1.2% |
| Others (Individually Less Than 1%) | 2.6% |
| | 100.0% |
See accompanying notes which are an integral part of the financial statements.
Materials Portfolio
Financial Statements
Statement of Assets and Liabilities
| | | February 28, 2018 |
| Assets | | |
Investment in securities, at value (including securities loaned of $7,427,930) — See accompanying schedule:
Unaffiliated issuers (cost $1,498,588,346) | $1,878,241,234 | |
| Fidelity Central Funds (cost $27,816,300) | 27,816,300 | |
| Total Investment in Securities (cost $1,526,404,646) | | $1,906,057,534 |
| Foreign currency held at value (cost $20,678) | | 20,068 |
| Receivable for fund shares sold | | 2,130,082 |
| Dividends receivable | | 3,493,889 |
| Distributions receivable from Fidelity Central Funds | | 21,085 |
| Prepaid expenses | | 5,327 |
| Other receivables | | 150,425 |
| Total assets | | 1,911,878,410 |
| Liabilities | | |
| Payable for investments purchased | $17,477,642 | |
| Payable for fund shares redeemed | 2,470,957 | |
| Accrued management fee | 857,894 | |
| Distribution and service plan fees payable | 132,028 | |
| Other affiliated payables | 356,102 | |
| Other payables and accrued expenses | 233,411 | |
| Collateral on securities loaned | 7,752,600 | |
| Total liabilities | | 29,280,634 |
| Net Assets | | $1,882,597,776 |
| Net Assets consist of: | | |
| Paid in capital | | $1,415,875,624 |
| Undistributed net investment income | | 2,045,516 |
| Accumulated undistributed net realized gain (loss) on investments and foreign currency transactions | | 85,026,036 |
| Net unrealized appreciation (depreciation) on investments and assets and liabilities in foreign currencies | | 379,650,600 |
| Net Assets | | $1,882,597,776 |
| Calculation of Maximum Offering Price | | |
| Class A: | | |
| Net Asset Value and redemption price per share ($201,933,218 ÷ 2,281,837 shares) | | $88.50 |
| Maximum offering price per share (100/94.25 of $88.50) | | $93.90 |
| Class M: | | |
| Net Asset Value and redemption price per share ($40,106,737 ÷ 456,823 shares) | | $87.79 |
| Maximum offering price per share (100/96.50 of $87.79) | | $90.97 |
| Class C: | | |
| Net Asset Value and offering price per share ($85,792,215 ÷ 1,003,158 shares)(a) | | $85.52 |
| Materials: | | |
| Net Asset Value, offering price and redemption price per share ($1,043,703,839 ÷ 11,739,884 shares) | | $88.90 |
| Class I: | | |
| Net Asset Value, offering price and redemption price per share ($511,061,767 ÷ 5,759,805 shares) | | $88.73 |
(a) Redemption price per share is equal to net asset value less any applicable contingent deferred sales charge.
See accompanying notes which are an integral part of the financial statements.
Statement of Operations
| | | Year ended February 28, 2018 |
| Investment Income | | |
| Dividends | | $28,739,191 |
| Income from Fidelity Central Funds | | 251,892 |
| Total income | | 28,991,083 |
| Expenses | | |
| Management fee | $9,263,034 | |
| Transfer agent fees | 3,402,060 | |
| Distribution and service plan fees | 1,535,038 | |
| Accounting and security lending fees | 529,164 | |
| Custodian fees and expenses | 35,786 | |
| Independent trustees' fees and expenses | 35,989 | |
| Registration fees | 147,869 | |
| Audit | 54,328 | |
| Legal | 20,307 | |
| Interest | 570 | |
| Miscellaneous | 90,300 | |
| Total expenses before reductions | 15,114,445 | |
| Expense reductions | (66,975) | 15,047,470 |
| Net investment income (loss) | | 13,943,613 |
| Realized and Unrealized Gain (Loss) | | |
| Net realized gain (loss) on: | | |
| Investment securities: | | |
| Unaffiliated issuers | 168,685,493 | |
| Fidelity Central Funds | 564 | |
| Foreign currency transactions | (70,430) | |
| Total net realized gain (loss) | | 168,615,627 |
| Change in net unrealized appreciation (depreciation) on: | | |
| Investment securities: | | |
| Unaffiliated issuers | 43,200,972 | |
| Fidelity Central Funds | (2,498) | |
| Assets and liabilities in foreign currencies | 7,401 | |
| Total change in net unrealized appreciation (depreciation) | | 43,205,875 |
| Net gain (loss) | | 211,821,502 |
| Net increase (decrease) in net assets resulting from operations | | $225,765,115 |
See accompanying notes which are an integral part of the financial statements.
Statement of Changes in Net Assets
| | Year ended February 28, 2018 | Year ended February 28, 2017 |
| Increase (Decrease) in Net Assets | | |
| Operations | | |
| Net investment income (loss) | $13,943,613 | $16,237,847 |
| Net realized gain (loss) | 168,615,627 | 64,095,613 |
| Change in net unrealized appreciation (depreciation) | 43,205,875 | 293,420,932 |
| Net increase (decrease) in net assets resulting from operations | 225,765,115 | 373,754,392 |
| Distributions to shareholders from net investment income | (13,925,069) | (13,547,763) |
| Distributions to shareholders from net realized gain | (80,094,510) | – |
| Total distributions | (94,019,579) | (13,547,763) |
| Share transactions - net increase (decrease) | 182,977,431 | (113,259,980) |
| Redemption fees | – | 17,097 |
| Total increase (decrease) in net assets | 314,722,967 | 246,963,746 |
| Net Assets | | |
| Beginning of period | 1,567,874,809 | 1,320,911,063 |
| End of period | $1,882,597,776 | $1,567,874,809 |
| Other Information | | |
| Undistributed net investment income end of period | $2,045,516 | $2,492,054 |
See accompanying notes which are an integral part of the financial statements.
Financial Highlights
Materials Portfolio Class A
| Years ended February 28, | 2018 | 2017 | 2016A | 2015 | 2014 |
| Selected Per–Share Data | | | | | |
| Net asset value, beginning of period | $81.27 | $62.94 | $80.43 | $86.46 | $73.44 |
| Income from Investment Operations | | | | | |
| Net investment income (loss)B | .55 | .70 | .79 | .51 | .36 |
| Net realized and unrealized gain (loss) | 11.18 | 18.26 | (16.80) | 1.05 | 14.56 |
| Total from investment operations | 11.73 | 18.96 | (16.01) | 1.56 | 14.92 |
| Distributions from net investment income | (.50) | (.63) | (.58) | (.43) | (.30) |
| Distributions from net realized gain | (4.00) | – | (.91) | (7.17) | (1.60) |
| Total distributions | (4.50) | (.63) | (1.48)C | (7.59)D | (1.90) |
| Redemption fees added to paid in capitalB | – | –E | –E | –E | –E |
| Net asset value, end of period | $88.50 | $81.27 | $62.94 | $80.43 | $86.46 |
| Total ReturnF,G | 14.65% | 30.18% | (20.01)% | 2.20% | 20.46% |
| Ratios to Average Net AssetsH,I | | | | | |
| Expenses before reductions | 1.07% | 1.08% | 1.06% | 1.06% | 1.10% |
| Expenses net of fee waivers, if any | 1.07% | 1.08% | 1.06% | 1.06% | 1.10% |
| Expenses net of all reductions | 1.06% | 1.07% | 1.06% | 1.06% | 1.09% |
| Net investment income (loss) | .64% | .96% | 1.09% | .61% | .45% |
| Supplemental Data | | | | | |
| Net assets, end of period (000 omitted) | $201,933 | $229,086 | $202,747 | $319,740 | $336,777 |
| Portfolio turnover rateJ | 67% | 49%K | 64% | 76%K | 53% |
A For the year ended February 29.
B Calculated based on average shares outstanding during the period.
C Total distributions of $1.48 per share is comprised of distributions from net investment income of $.575 and distributions from net realized gain of $.906 per share.
D Total distributions of $7.59 per share is comprised of distributions from net investment income of $.425 and distributions from net realized gain of $7.167 per share.
E Amount represents less than $.005 per share.
F Total returns would have been lower if certain expenses had not been reduced during the applicable periods shown.
G Total returns do not include the effect of the sales charges.
H Fees and expenses of any underlying Fidelity Central Funds are not included in the Fund's expense ratio. The Fund indirectly bears its proportionate share of the expenses of any underlying Fidelity Central Funds.
I Expense ratios reflect operating expenses of the class. Expenses before reductions do not reflect amounts reimbursed by the investment adviser or reductions from brokerage service arrangements or reductions from other expense offset arrangements and do not represent the amount paid by the class during periods when reimbursements or reductions occur. Expenses net of fee waivers reflect expenses after reimbursement by the investment adviser but prior to reductions from brokerage service arrangements or other expense offset arrangements. Expenses net of all reductions represent the net expenses paid by the class.
J Amount does not include the portfolio activity of any underlying Fidelity Central Funds.
K Portfolio turnover rate excludes securities received or delivered in-kind.
See accompanying notes which are an integral part of the financial statements.
Materials Portfolio Class M
| Years ended February 28, | 2018 | 2017 | 2016A | 2015 | 2014 |
| Selected Per–Share Data | | | | | |
| Net asset value, beginning of period | $80.66 | $62.52 | $79.95 | $85.99 | $73.05 |
| Income from Investment Operations | | | | | |
| Net investment income (loss)B | .30 | .47 | .56 | .25 | .12 |
| Net realized and unrealized gain (loss) | 11.08 | 18.12 | (16.69) | 1.06 | 14.48 |
| Total from investment operations | 11.38 | 18.59 | (16.13) | 1.31 | 14.60 |
| Distributions from net investment income | (.25) | (.45) | (.40) | (.18) | (.06) |
| Distributions from net realized gain | (4.00) | – | (.91) | (7.17) | (1.60) |
| Total distributions | (4.25) | (.45) | (1.30)C | (7.35) | (1.66) |
| Redemption fees added to paid in capitalB | – | –D | –D | –D | –D |
| Net asset value, end of period | $87.79 | $80.66 | $62.52 | $79.95 | $85.99 |
| Total ReturnE,F | 14.30% | 29.78% | (20.27)% | 1.90% | 20.10% |
| Ratios to Average Net AssetsG,H | | | | | |
| Expenses before reductions | 1.36% | 1.39% | 1.38% | 1.37% | 1.40% |
| Expenses net of fee waivers, if any | 1.36% | 1.39% | 1.37% | 1.37% | 1.40% |
| Expenses net of all reductions | 1.35% | 1.38% | 1.37% | 1.37% | 1.39% |
| Net investment income (loss) | .35% | .65% | .77% | .31% | .15% |
| Supplemental Data | | | | | |
| Net assets, end of period (000 omitted) | $40,107 | $40,935 | $30,118 | $45,252 | $45,223 |
| Portfolio turnover rateI | 67% | 49%J | 64% | 76%J | 53% |
A For the year ended February 29.
B Calculated based on average shares outstanding during the period.
C Total distributions of $1.30 per share is comprised of distributions from net investment income of $.395 and distributions from net realized gain of $.906 per share.
D Amount represents less than $.005 per share.
E Total returns would have been lower if certain expenses had not been reduced during the applicable periods shown.
F Total returns do not include the effect of the sales charges.
G Fees and expenses of any underlying Fidelity Central Funds are not included in the Fund's expense ratio. The Fund indirectly bears its proportionate share of the expenses of any underlying Fidelity Central Funds.
H Expense ratios reflect operating expenses of the class. Expenses before reductions do not reflect amounts reimbursed by the investment adviser or reductions from brokerage service arrangements or reductions from other expense offset arrangements and do not represent the amount paid by the class during periods when reimbursements or reductions occur. Expenses net of fee waivers reflect expenses after reimbursement by the investment adviser but prior to reductions from brokerage service arrangements or other expense offset arrangements. Expenses net of all reductions represent the net expenses paid by the class.
I Amount does not include the portfolio activity of any underlying Fidelity Central Funds.
J Portfolio turnover rate excludes securities received or delivered in-kind.
See accompanying notes which are an integral part of the financial statements.
Materials Portfolio Class C
| Years ended February 28, | 2018 | 2017 | 2016A | 2015 | 2014 |
| Selected Per–Share Data | | | | | |
| Net asset value, beginning of period | $78.72 | $61.09 | $78.12 | $84.38 | $71.96 |
| Income from Investment Operations | | | | | |
| Net investment income (loss)B | (.09) | .15 | .24 | (.12) | (.23) |
| Net realized and unrealized gain (loss) | 10.80 | 17.68 | (16.28) | 1.03 | 14.23 |
| Total from investment operations | 10.71 | 17.83 | (16.04) | .91 | 14.00 |
| Distributions from net investment income | (.02) | (.20) | (.08) | – | – |
| Distributions from net realized gain | (3.89) | – | (.91) | (7.17) | (1.58) |
| Total distributions | (3.91) | (.20) | (.99) | (7.17) | (1.58) |
| Redemption fees added to paid in capitalB | – | –C | –C | –C | –C |
| Net asset value, end of period | $85.52 | $78.72 | $61.09 | $78.12 | $84.38 |
| Total ReturnD,E | 13.78% | 29.21% | (20.61)% | 1.43% | 19.56% |
| Ratios to Average Net AssetsF,G | | | | | |
| Expenses before reductions | 1.82% | 1.83% | 1.81% | 1.82% | 1.85% |
| Expenses net of fee waivers, if any | 1.82% | 1.82% | 1.81% | 1.82% | 1.85% |
| Expenses net of all reductions | 1.82% | 1.82% | 1.81% | 1.82% | 1.84% |
| Net investment income (loss) | (.11)% | .21% | .34% | (.14)% | (.30)% |
| Supplemental Data | | | | | |
| Net assets, end of period (000 omitted) | $85,792 | $80,225 | $66,896 | $107,697 | $106,879 |
| Portfolio turnover rateH | 67% | 49%I | 64% | 76%I | 53% |
A For the year ended February 29.
B Calculated based on average shares outstanding during the period.
C Amount represents less than $.005 per share.
D Total returns would have been lower if certain expenses had not been reduced during the applicable periods shown.
E Total returns do not include the effect of the contingent deferred sales charge.
F Fees and expenses of any underlying Fidelity Central Funds are not included in the Fund's expense ratio. The Fund indirectly bears its proportionate share of the expenses of any underlying Fidelity Central Funds.
G Expense ratios reflect operating expenses of the class. Expenses before reductions do not reflect amounts reimbursed by the investment adviser or reductions from brokerage service arrangements or reductions from other expense offset arrangements and do not represent the amount paid by the class during periods when reimbursements or reductions occur. Expenses net of fee waivers reflect expenses after reimbursement by the investment adviser but prior to reductions from brokerage service arrangements or other expense offset arrangements. Expenses net of all reductions represent the net expenses paid by the class.
H Amount does not include the portfolio activity of any underlying Fidelity Central Funds.
I Portfolio turnover rate excludes securities received or delivered in-kind.
See accompanying notes which are an integral part of the financial statements.
Materials Portfolio
| Years ended February 28, | 2018 | 2017 | 2016A | 2015 | 2014 |
| Selected Per–Share Data | | | | | |
| Net asset value, beginning of period | $81.64 | $63.20 | $80.77 | $86.81 | $73.68 |
| Income from Investment Operations | | | | | |
| Net investment income (loss)B | .79 | .90 | .98 | .73 | .58 |
| Net realized and unrealized gain (loss) | 11.24 | 18.34 | (16.89) | 1.05 | 14.63 |
| Total from investment operations | 12.03 | 19.24 | (15.91) | 1.78 | 15.21 |
| Distributions from net investment income | (.77) | (.80) | (.76) | (.65) | (.48) |
| Distributions from net realized gain | (4.00) | – | (.91) | (7.17) | (1.60) |
| Total distributions | (4.77) | (.80) | (1.66)C | (7.82) | (2.08) |
| Redemption fees added to paid in capitalB | – | –D | –D | –D | –D |
| Net asset value, end of period | $88.90 | $81.64 | $63.20 | $80.77 | $86.81 |
| Total ReturnE | 14.96% | 30.52% | (19.81)% | 2.46% | 20.80% |
| Ratios to Average Net AssetsF,G | | | | | |
| Expenses before reductions | .79% | .81% | .81% | .80% | .82% |
| Expenses net of fee waivers, if any | .79% | .81% | .81% | .80% | .82% |
| Expenses net of all reductions | .79% | .81% | .80% | .80% | .82% |
| Net investment income (loss) | .91% | 1.22% | 1.34% | .87% | .73% |
| Supplemental Data | | | | | |
| Net assets, end of period (000 omitted) | $1,043,704 | $882,504 | $711,985 | $1,107,689 | $1,231,942 |
| Portfolio turnover rateH | 67% | 49%I | 64% | 76%I | 53% |
A For the year ended February 29.
B Calculated based on average shares outstanding during the period.
C Total distributions of $1.66 per share is comprised of distributions from net investment income of $.756 and distributions from net realized gain of $.906 per share.
D Amount represents less than $.005 per share.
E Total returns would have been lower if certain expenses had not been reduced during the applicable periods shown.
F Fees and expenses of any underlying Fidelity Central Funds are not included in the Fund's expense ratio. The Fund indirectly bears its proportionate share of the expenses of any underlying Fidelity Central Funds.
G Expense ratios reflect operating expenses of the class. Expenses before reductions do not reflect amounts reimbursed by the investment adviser or reductions from brokerage service arrangements or reductions from other expense offset arrangements and do not represent the amount paid by the class during periods when reimbursements or reductions occur. Expenses net of fee waivers reflect expenses after reimbursement by the investment adviser but prior to reductions from brokerage service arrangements or other expense offset arrangements. Expenses net of all reductions represent the net expenses paid by the class.
H Amount does not include the portfolio activity of any underlying Fidelity Central Funds.
I Portfolio turnover rate excludes securities received or delivered in-kind.
See accompanying notes which are an integral part of the financial statements.
Materials Portfolio Class I
| Years ended February 28, | 2018 | 2017 | 2016A | 2015 | 2014 |
| Selected Per–Share Data | | | | | |
| Net asset value, beginning of period | $81.49 | $63.07 | $80.60 | $86.66 | $73.57 |
| Income from Investment Operations | | | | | |
| Net investment income (loss)B | .80 | .91 | 1.00 | .74 | .59 |
| Net realized and unrealized gain (loss) | 11.22 | 18.31 | (16.86) | 1.05 | 14.60 |
| Total from investment operations | 12.02 | 19.22 | (15.86) | 1.79 | 15.19 |
| Distributions from net investment income | (.78) | (.80) | (.77) | (.68) | (.50) |
| Distributions from net realized gain | (4.00) | – | (.91) | (7.17) | (1.60) |
| Total distributions | (4.78) | (.80) | (1.67)C | (7.85) | (2.10) |
| Redemption fees added to paid in capitalB | – | –D | –D | –D | –D |
| Net asset value, end of period | $88.73 | $81.49 | $63.07 | $80.60 | $86.66 |
| Total ReturnE | 14.97% | 30.55% | (19.79)% | 2.49% | 20.81% |
| Ratios to Average Net AssetsF,G | | | | | |
| Expenses before reductions | .79% | .79% | .78% | .78% | .81% |
| Expenses net of fee waivers, if any | .79% | .79% | .78% | .78% | .81% |
| Expenses net of all reductions | .78% | .78% | .78% | .78% | .81% |
| Net investment income (loss) | .92% | 1.25% | 1.37% | .89% | .74% |
| Supplemental Data | | | | | |
| Net assets, end of period (000 omitted) | $511,062 | $335,124 | $306,145 | $468,371 | $333,963 |
| Portfolio turnover rateH | 67% | 49%I | 64% | 76%I | 53% |
A For the year ended February 29.
B Calculated based on average shares outstanding during the period.
C Total distributions of $1.67 per share is comprised of distributions from net investment income of $.767 and distributions from net realized gain of $.906 per share.
D Amount represents less than $.005 per share.
E Total returns would have been lower if certain expenses had not been reduced during the applicable periods shown.
F Fees and expenses of any underlying Fidelity Central Funds are not included in the Fund's expense ratio. The Fund indirectly bears its proportionate share of the expenses of any underlying Fidelity Central Funds.
G Expense ratios reflect operating expenses of the class. Expenses before reductions do not reflect amounts reimbursed by the investment adviser or reductions from brokerage service arrangements or reductions from other expense offset arrangements and do not represent the amount paid by the class during periods when reimbursements or reductions occur. Expenses net of fee waivers reflect expenses after reimbursement by the investment adviser but prior to reductions from brokerage service arrangements or other expense offset arrangements. Expenses net of all reductions represent the net expenses paid by the class.
H Amount does not include the portfolio activity of any underlying Fidelity Central Funds.
I Portfolio turnover rate excludes securities received or delivered in-kind.
See accompanying notes which are an integral part of the financial statements.
Notes to Financial Statements
For the period ended February 28, 2018
1. Organization.
Materials Portfolio (the Fund) is a non-diversified fund of Fidelity Select Portfolios (the Trust) and is authorized to issue an unlimited number of shares. The Trust is registered under the Investment Company Act of 1940, as amended (the 1940 Act), as an open-end management investment company organized as a Massachusetts business trust. The Fund invests primarily in securities of companies whose principal business activities fall within specific industries. The Fund offers Class A, Class M (formerly Class T), Class C, Materials and Class I shares, each of which has equal rights as to assets and voting privileges. Each class has exclusive voting rights with respect to matters that affect that class.
After the close of business on June 24, 2016, all outstanding Class B shares were converted to Class A shares. All prior fiscal period dollar and share amounts for Class B presented in the Notes to Financial Statements are for the period March 1, 2016 through June 24, 2016.
2. Investments in Fidelity Central Funds.
The Fund invests in Fidelity Central Funds, which are open-end investment companies generally available only to other investment companies and accounts managed by the investment adviser and its affiliates. The Fund's Schedule of Investments lists each of the Fidelity Central Funds held as of period end, if any, as an investment of the Fund, but does not include the underlying holdings of each Fidelity Central Fund. As an Investing Fund, the Fund indirectly bears its proportionate share of the expenses of the underlying Fidelity Central Funds.
The Money Market Central Funds seek preservation of capital and current income and are managed by Fidelity Investments Money Management, Inc. (FIMM), an affiliate of the investment adviser. Annualized expenses of the Money Market Central Funds as of their most recent shareholder report date are less than .005%.
A complete unaudited list of holdings for each Fidelity Central Fund is available upon request or at the Securities and Exchange Commission (the SEC) website at www.sec.gov. In addition, the financial statements of the Fidelity Central Funds, which are not covered by the Fund's Report of Independent Registered Public Accounting Firm, are available on the SEC website or upon request.
3. Significant Accounting Policies.
The Fund is an investment company and applies the accounting and reporting guidance of the Financial Accounting Standards Board (FASB) Accounting Standards Codification Topic 946 Financial Services – Investments Companies. The financial statements have been prepared in conformity with accounting principles generally accepted in the United States of America (GAAP), which require management to make certain estimates and assumptions at the date of the financial statements. Actual results could differ from those estimates. Subsequent events, if any, through the date that the financial statements were issued have been evaluated in the preparation of the financial statements. The following summarizes the significant accounting policies of the Fund:
Investment Valuation. Investments are valued as of 4:00 p.m. Eastern time on the last calendar day of the period. The Board of Trustees (the Board) has delegated the day to day responsibility for the valuation of the Fund's investments to the Fair Value Committee (the Committee) established by the Fund's investment adviser. In accordance with valuation policies and procedures approved by the Board, the Fund attempts to obtain prices from one or more third party pricing vendors or brokers to value its investments. When current market prices, quotations or currency exchange rates are not readily available or reliable, investments will be fair valued in good faith by the Committee, in accordance with procedures adopted by the Board. Factors used in determining fair value vary by investment type and may include market or investment specific events. The frequency with which these procedures are used cannot be predicted and they may be utilized to a significant extent. The Committee oversees the Fund's valuation policies and procedures and reports to the Board on the Committee's activities and fair value determinations. The Board monitors the appropriateness of the procedures used in valuing the Fund's investments and ratifies the fair value determinations of the Committee.
The Fund categorizes the inputs to valuation techniques used to value its investments into a disclosure hierarchy consisting of three levels as shown below:
- Level 1 – quoted prices in active markets for identical investments
- Level 2 – other significant observable inputs (including quoted prices for similar investments, interest rates, prepayment speeds, etc.)
- Level 3 – unobservable inputs (including the Fund's own assumptions based on the best information available)
Valuation techniques used to value the Fund's investments by major category are as follows:
Equity securities, including restricted securities, for which market quotations are readily available, are valued at the last reported sale price or official closing price as reported by a third party pricing vendor on the primary market or exchange on which they are traded and are categorized as Level 1 in the hierarchy. In the event there were no sales during the day or closing prices are not available, securities are valued at the last quoted bid price or may be valued using the last available price and are generally categorized as Level 2 in the hierarchy. For foreign equity securities, when market or security specific events arise, comparisons to the valuation of American Depositary Receipts (ADRs), futures contracts, Exchange-Traded Funds (ETFs) and certain indexes as well as quoted prices for similar securities may be used and would be categorized as Level 2 in the hierarchy. Utilizing these techniques may result in transfers between Level 1 and Level 2. For equity securities, including restricted securities, where observable inputs are limited, assumptions about market activity and risk are used and these securities may be categorized as Level 3 in the hierarchy.
Investments in open-end mutual funds, including the Fidelity Central Funds, are valued at their closing net asset value (NAV) each business day and are categorized as Level 1 in the hierarchy.
Changes in valuation techniques may result in transfers in or out of an assigned level within the disclosure hierarchy. The aggregate value of investments by input level as of February 28, 2018 is included at the end of the Fund's Schedule of Investments.
Foreign Currency. The Fund may use foreign currency contracts to facilitate transactions in foreign-denominated securities. Gains and losses from these transactions may arise from changes in the value of the foreign currency or if the counterparties do not perform under the contracts' terms.
Foreign-denominated assets, including investment securities, and liabilities are translated into U.S. dollars at the exchange rates at period end. Purchases and sales of investment securities, income and dividends received and expenses denominated in foreign currencies are translated into U.S. dollars at the exchange rate in effect on the transaction date.
The effects of exchange rate fluctuations on investments are included with the net realized and unrealized gain (loss) on investment securities. Other foreign currency transactions resulting in realized and unrealized gain (loss) are disclosed separately.
Investment Transactions and Income. For financial reporting purposes, the Fund's investment holdings and NAV include trades executed through the end of the last business day of the period. The NAV per share for processing shareholder transactions is calculated as of the close of business of the New York Stock Exchange (NYSE), normally 4:00 p.m. Eastern time and includes trades executed through the end of the prior business day. Gains and losses on securities sold are determined on the basis of identified cost and includes proceeds received from litigation. Dividend income is recorded on the ex-dividend date, except for certain dividends from foreign securities where the ex-dividend date may have passed, which are recorded as soon as the Fund is informed of the ex-dividend date. Non-cash dividends included in dividend income, if any, are recorded at the fair market value of the securities received. Income and capital gain distributions from Fidelity Central Funds, if any, are recorded on the ex-dividend date. Certain distributions received by the Fund represent a return of capital or capital gain. The Fund determines the components of these distributions subsequent to the ex-dividend date, based upon receipt of tax filings or other correspondence relating to the underlying investment. These distributions are recorded as a reduction of cost of investments and/or as a realized gain. Investment income is recorded net of foreign taxes withheld where recovery of such taxes is uncertain.
Class Allocations and Expenses. Investment income, realized and unrealized capital gains and losses, common expenses of the Fund, and certain fund-level expense reductions, if any, are allocated daily on a pro-rata basis to each class based on the relative net assets of each class to the total net assets of the Fund. Each class differs with respect to transfer agent and distribution and service plan fees incurred. Certain expense reductions may also differ by class. For the reporting period, the allocated portion of income and expenses to each class as a percent of its average net assets may vary due to the timing of recording these transactions in relation to fluctuating net assets of the classes. Expenses directly attributable to a fund are charged to that fund. Expenses attributable to more than one fund are allocated among the respective funds on the basis of relative net assets or other appropriate methods. Expense estimates are accrued in the period to which they relate and adjustments are made when actual amounts are known.
Deferred Trustee Compensation. Under a Deferred Compensation Plan (the Plan), independent Trustees may elect to defer receipt of a portion of their annual compensation. Deferred amounts are invested in a cross-section of Fidelity funds, are marked-to-market and remain in the Fund until distributed in accordance with the Plan. The investment of deferred amounts and the offsetting payable to the Trustees are included in the accompanying Statement of Assets and Liabilities.
Income Tax Information and Distributions to Shareholders. Each year, the Fund intends to qualify as a regulated investment company under Subchapter M of the Internal Revenue Code, including distributing substantially all of its taxable income and realized gains. As a result, no provision for U.S. Federal income taxes is required. As of February 28, 2018, the Fund did not have any unrecognized tax benefits in the financial statements; nor is the Fund aware of any tax positions for which it is reasonably possible that the total amounts of unrecognized tax benefits will significantly change in the next twelve months. The Fund files a U.S. federal tax return, in addition to state and local tax returns as required. The Fund's federal income tax returns are subject to examination by the Internal Revenue Service (IRS) for a period of three fiscal years after they are filed. State and local tax returns may be subject to examination for an additional fiscal year depending on the jurisdiction. Foreign taxes are provided for based on the Fund's understanding of the tax rules and rates that exist in the foreign markets in which it invests.
Distributions are declared and recorded on the ex-dividend date. Income dividends and capital gain distributions are declared separately for each class. Income and capital gain distributions are determined in accordance with income tax regulations, which may differ from GAAP. In addition, the Fund claimed a portion of the payment made to redeeming shareholders as a distribution for income tax purposes.
Capital accounts within the financial statements are adjusted for permanent book-tax differences. These adjustments have no impact on net assets or the results of operations. Capital accounts are not adjusted for temporary book-tax differences which will reverse in a subsequent period.
Book-tax differences are primarily due to foreign currency transactions, deferred trustees compensation, partnerships, capital loss carryforwards and losses deferred due to wash sales.
As of period end, the cost and unrealized appreciation (depreciation) in securities, and derivatives if applicable, for federal income tax purposes were as follows:
| Gross unrealized appreciation | $412,959,681 |
| Gross unrealized depreciation | (34,010,031) |
| Net unrealized appreciation (depreciation) | $378,949,650 |
| Tax Cost | $1,527,107,884 |
The tax-based components of distributable earnings as of period end were as follows:
| Undistributed ordinary income | $2,171,471 |
| Undistributed long-term capital gain | $85,810,060 |
| Net unrealized appreciation (depreciation) on securities and other investments | $378,947,362 |
Capital loss carryforwards are only available to offset future capital gains of the Fund to the extent provided by regulations and may be limited. Under the Regulated Investment Company Modernization Act of 2010 (the Act), the Fund is permitted to carry forward capital losses incurred in taxable years beginning after December 22, 2010 for an unlimited period and such capital losses are required to be used prior to any losses that expire. The capital loss carryforward information presented below, including any applicable limitation, is estimated as of fiscal period end and is subject to adjustment.
| Fiscal year of expiration | |
| 2019 | $(80,787) |
The tax character of distributions paid was as follows:
| | February 28, 2018 | February 28, 2017 |
| Ordinary Income | $18,045,341 | $ 13,547,763 |
| Long-term Capital Gains | 75,974,238 | – |
| Total | $94,019,579 | $ 13,547,763 |
4. Purchases and Sales of Investments.
Purchases and sales of securities, other than short-term securities, aggregated $1,239,934,125 and $1,125,370,092, respectively.
5. Fees and Other Transactions with Affiliates.
Management Fee. Fidelity SelectCo, LLC (the investment adviser) and its affiliates provide the Fund with investment management related services for which the Fund pays a monthly management fee. The management fee is the sum of an individual fund fee rate that is based on an annual rate of .30% of the Fund's average net assets and an annualized group fee rate that averaged .24% during the period. The group fee rate is based upon the average net assets of all the mutual funds advised by Fidelity Management & Research Company (FMR) and the investment adviser. The group fee rate decreases as assets under management increase and increases as assets under management decrease. For the reporting period, the total annual management fee rate was .54% of the Fund's average net assets.
Distribution and Service Plan Fees. In accordance with Rule 12b-1 of the 1940 Act, the Fund has adopted separate Distribution and Service Plans for each class of shares. Certain classes pay Fidelity Distributors Corporation (FDC), an affiliate of the investment adviser, separate Distribution and Service Fees, each of which is based on an annual percentage of each class' average net assets. In addition, FDC may pay financial intermediaries for selling shares of the Fund and providing shareholder support services. For the period, the Distribution and Service Fee rates, total fees and amounts retained by FDC were as follows:
| | Distribution Fee | Service Fee | Total Fees | Retained by FDC |
| Class A | -% | .25% | $496,804 | $8,089 |
| Class M | .25% | .25% | 196,406 | – |
| Class C | .75% | .25% | 841,828 | 108,388 |
| | | | $1,535,038 | $116,477 |
Sales Load. FDC may receive a front-end sales charge of up to 5.75% for selling Class A shares and 3.50% for selling Class M shares, some of which is paid to financial intermediaries for selling shares of the Fund. Depending on the holding period, FDC may receive contingent deferred sales charges levied on Class A, Class M and Class C redemptions. The deferred sales charges are 1.00% for Class C shares, 1.00% for certain purchases of Class A shares and .25% for certain purchases of Class M shares.
For the period, sales charge amounts retained by FDC were as follows:
| | Retained by FDC |
| Class A | $90,137 |
| Class M | 9,649 |
| Class C(a) | 8,057 |
| | $107,843 |
(a) When Class C shares are initially sold, FDC pays commissions from its own resources to financial intermediaries through which the sales are made.
Transfer Agent Fees. Fidelity Investments Institutional Operations Company, Inc., (FIIOC), an affiliate of the investment adviser, is the transfer, dividend disbursing and shareholder servicing agent for each class of the Fund. FIIOC receives account fees and asset-based fees that vary according to the account size and type of account of the shareholders of the respective classes of the Fund. FIIOC pays for typesetting, printing and mailing of shareholder reports, except proxy statements.
For the period, transfer agent fees for each class were as follows:
| | Amount | % of Class-Level Average Net Assets |
| Class A | $436,003 | .22 |
| Class M | 101,499 | .26 |
| Class C | 186,332 | .22 |
| Materials | 1,835,081 | .20 |
| Class I | 843,145 | .19 |
| | $3,402,060 | |
Accounting and Security Lending Fees. Fidelity Service Company, Inc. (FSC), an affiliate of the investment adviser, maintains the Fund's accounting records. The accounting fee is based on the level of average net assets for each month. Under a separate contract, FSC administers the security lending program. The security lending fee is based on the number and duration of lending transactions.
Brokerage Commissions. The Fund placed a portion of its portfolio transactions with brokerage firms which are affiliates of the investment adviser. Brokerage commissions are included in net realized gain (loss) and change in net unrealized appreciation (depreciation) in the Statement of Operations. The commissions paid to these affiliated firms were $35,962 for the period.
Interfund Lending Program. Pursuant to an Exemptive Order issued by the SEC, the Fund, along with other registered investment companies having management contracts with Fidelity Management & Research Company (FMR) or other affiliated entities of FMR, may participate in an interfund lending program. This program provides an alternative credit facility allowing the funds to borrow from, or lend money to, other participating affiliated funds. At period end, there were no interfund loans outstanding. The Fund's activity in this program during the period for which loans were outstanding was as follows:
| Borrower or Lender | Average Loan Balance | Weighted Average Interest Rate | Interest Expense |
| Borrower | $7,691,000 | 1.34% | $570 |
Interfund Trades. The Fund may purchase from or sell securities to other Fidelity Funds under procedures adopted by the Board. The procedures have been designed to ensure these interfund trades are executed in accordance with Rule 17a-7 of the 1940 Act. Interfund trades are included within the respective purchases and sales amounts shown in the Purchases and Sales of Investments note.
Prior Fiscal Year Redemptions In-Kind. During the prior period, 845,013 shares of Materials Portfolio held by an affiliated entity were redeemed in-kind for investments and cash with a value of $60,325,459. The Fund had a net realized gain of $17,720,821 on investments delivered through in-kind redemptions. The amount of the in-kind redemptions is included in share transactions in the accompanying Statement of Changes in Net Assets as well as the Notes to Financial Statements. Materials Portfolio recognized no gain or loss for federal income tax purposes.
6. Committed Line of Credit.
The Fund participates with other funds managed by the investment adviser or an affiliate in a $4.25 billion credit facility (the "line of credit") to be utilized for temporary or emergency purposes to fund shareholder redemptions or for other short-term liquidity purposes. The Fund has agreed to pay commitment fees on its pro-rata portion of the line of credit, which amounted to $4,956 and is reflected in Miscellaneous expenses on the Statement of Operations. During the period, the Fund did not borrow on this line of credit.
7. Security Lending.
The Fund lends portfolio securities through a lending agent from time to time in order to earn additional income. On the settlement date of the loan, the Fund receives collateral (in the form of U.S. Treasury obligations, letters of credit and/or cash) against the loaned securities and maintains collateral in an amount not less than 100% of the market value of the loaned securities during the period of the loan. The market value of the loaned securities is determined at the close of business of the Fund and any additional required collateral is delivered to the Fund on the next business day. The Fund or borrower may terminate the loan at any time, and if the borrower defaults on its obligation to return the securities loaned because of insolvency or other reasons, the Fund may apply collateral received from the borrower against the obligation. The Fund may experience delays and costs in recovering the securities loaned. Any cash collateral received is invested in the Fidelity Securities Lending Cash Central Fund. The value of loaned securities and cash collateral at period end are disclosed on the Fund's Statement of Assets and Liabilities. Security lending income represents the income earned on investing cash collateral, less rebates paid to borrowers and any lending agent fees associated with the loan, plus any premium payments received for lending certain types of securities. Security lending income is presented in the Statement of Operations as a component of income from Fidelity Central Funds. Total security lending income during the period amounted to $58,427.
8. Expense Reductions.
Commissions paid to certain brokers with whom the investment adviser, or its affiliates, places trades on behalf of the Fund include an amount in addition to trade execution, which may be rebated back to the Fund to offset certain expenses. This amount totaled $51,367 for the period.
In addition, during the period the investment adviser reimbursed and/or waived a portion of fund-level operating expenses in the amount of $15,608.
9. Distributions to Shareholders.
Distributions to shareholders of each class were as follows:
| | Year ended
February 28, 2018 | Year ended
February 28, 2017 |
| From net investment income | | |
| Class A | $1,122,417 | $1,672,756 |
| Class M | 111,276 | 205,222 |
| Class C | 21,712 | 195,843 |
| Materials | 8,651,332 | 8,304,133 |
| Class I | 4,018,332 | 3,169,809 |
| Total | $13,925,069 | $13,547,763 |
| From net realized gain | | |
| Class A | $8,907,618 | $– |
| Class M | 1,755,252 | – |
| Class C | 3,835,607 | – |
| Materials | 44,912,504 | – |
| Class I | 20,683,529 | – |
| Total | $80,094,510 | $– |
10. Share Transactions.
Share transactions for each class were as follows and may contain automatic conversions between classes or exchanges between affiliated funds:
| | Shares | Shares | Dollars | Dollars |
| | Year ended February 28, 2018 | Year ended February 28, 2017 | Year ended February 28, 2018 | Year ended February 28, 2017 |
| Class A | | | | |
| Shares sold | 680,092 | 902,923 | $58,507,834 | $67,495,419 |
| Reinvestment of distributions | 113,874 | 20,549 | 9,780,873 | 1,575,920 |
| Shares redeemed | (1,331,034) | (1,326,009) | (112,075,163) | (96,308,599) |
| Net increase (decrease) | (537,068) | (402,537) | $(43,786,456) | $(27,237,260) |
| Class M | | | | |
| Shares sold | 208,725 | 158,674 | $17,686,478 | $11,939,333 |
| Reinvestment of distributions | 21,925 | 2,663 | 1,863,640 | 202,830 |
| Shares redeemed | (281,358) | (135,543) | (23,392,261) | (9,849,995) |
| Net increase (decrease) | (50,708) | 25,794 | $(3,842,143) | $2,292,168 |
| Class B | | | | |
| Shares sold | – | 325 | $– | $22,444 |
| Shares redeemed | – | (49,631) | – | (3,403,614) |
| Net increase (decrease) | – | (49,306) | $– | $(3,381,170) |
| Class C | | | | |
| Shares sold | 181,208 | 197,093 | $15,047,250 | $14,487,205 |
| Reinvestment of distributions | 44,268 | 2,419 | 3,679,464 | 179,992 |
| Shares redeemed | (241,477) | (275,454) | (20,012,880) | (19,415,602) |
| Net increase (decrease) | (16,001) | (75,942) | $(1,286,166) | $(4,748,405) |
| Materials | | | | |
| Shares sold | 3,151,404 | 2,367,980 | $281,933,571 | $176,958,165 |
| Reinvestment of distributions | 582,560 | 100,563 | 50,400,849 | 7,743,369 |
| Shares redeemed | (2,803,708) | (2,924,430) | (242,311,502) | (214,559,584) |
| Net increase (decrease) | 930,256 | (455,887) | $90,022,918 | $(29,858,050) |
| Class I | | | | |
| Shares sold | 2,807,810 | 1,754,029 | $243,189,109 | $130,244,335 |
| Reinvestment of distributions | 269,534 | 37,780 | 23,282,439 | 2,903,738 |
| Shares redeemed | (1,429,768) | (2,533,375)(a) | (124,602,270) | (183,475,336)(a) |
| Net increase (decrease) | 1,647,576 | (741,566) | $141,869,278 | $(50,327,263) |
(a) Amount includes in-kind redemptions (see the Prior Fiscal Year Redemptions In-Kind note for additional details).
11. Other.
The Fund's organizational documents provide former and current trustees and officers with a limited indemnification against liabilities arising in connection with the performance of their duties to the Fund. In the normal course of business, the Fund may also enter into contracts that provide general indemnifications. The Fund's maximum exposure under these arrangements is unknown as this would be dependent on future claims that may be made against the Fund. The risk of material loss from such claims is considered remote.
Report of Independent Registered Public Accounting Firm
To the Trustees of Fidelity Select Portfolios and the Shareholders of Chemicals Portfolio, Gold Portfolio and Materials Portfolio:
Opinions on the Financial Statements
We have audited the accompanying statements of assets and liabilities, including the schedules of investments, of Chemicals Portfolio, Gold Portfolio and Materials Portfolio (three of the funds constituting Fidelity Select Portfolios, hereafter collectively referred to as the "Funds") as of February 28, 2018, the related statements of operations for the year ended February 28, 2018 the statements of changes in net assets for each of the two years in the period ended February 28, 2018 including the related notes, and the financial highlights for each of the five years in the period ended February 28, 2018 (collectively referred to as the “financial statements”). In our opinion, the financial statements present fairly, in all material respects, the financial position of each of the Funds as of February 28, 2018, the results of each of their operations for the year then ended, the changes in each of their net assets for each of the two years in the period ended February 28, 2018 and each of the financial highlights for each of the five years in the period ended February 28, 2018 in conformity with accounting principles generally accepted in the United States of America.
Basis for Opinions
These financial statements are the responsibility of the Funds' management. Our responsibility is to express an opinion on the Funds' financial statements based on our audits. We are a public accounting firm registered with the Public Company Accounting Oversight Board (United States) (“PCAOB”) and are required to be independent with respect to the Funds in accordance with the U.S. federal securities laws and the applicable rules and regulations of the Securities and Exchange Commission and the PCAOB.
We conducted our audits of these financial statements in accordance with the standards of the PCAOB. Those standards require that we plan and perform the audits to obtain reasonable assurance about whether the financial statements are free of material misstatement, whether due to error or fraud.
Our audits included performing procedures to assess the risks of material misstatement of the financial statements, whether due to error or fraud, and performing procedures that respond to those risks. Such procedures included examining, on a test basis, evidence regarding the amounts and disclosures in the financial statements. Our audits also included evaluating the accounting principles used and significant estimates made by management, as well as evaluating the overall presentation of the financial statements. Our procedures included confirmation of securities owned as of February 28, 2018 by correspondence with the custodians and brokers; when replies were not received from brokers, we performed other auditing procedures. We believe that our audits provide a reasonable basis for our opinions.
PricewaterhouseCoopers LLP
Boston, Massachusetts
April 17, 2018
We have served as the auditor of one or more investment companies in the Fidelity group of funds since 1932.
Trustees and Officers
The Trustees, Members of the Advisory Board (if any), and officers of the trust and funds, as applicable, are listed below. The Board of Trustees governs each fund and is responsible for protecting the interests of shareholders. The Trustees are experienced executives who meet periodically throughout the year to oversee each fund's activities, review contractual arrangements with companies that provide services to each fund, oversee management of the risks associated with such activities and contractual arrangements, and review each fund's performance. Except for Michael E. Wiley, each of the Trustees oversees 281 funds. Mr. Wiley oversees 193 funds.
The Trustees hold office without limit in time except that (a) any Trustee may resign; (b) any Trustee may be removed by written instrument, signed by at least two-thirds of the number of Trustees prior to such removal; (c) any Trustee who requests to be retired or who has become incapacitated by illness or injury may be retired by written instrument signed by a majority of the other Trustees; and (d) any Trustee may be removed at any special meeting of shareholders by a two-thirds vote of the outstanding voting securities of the trust. Each Trustee who is not an interested person (as defined in the 1940 Act) of the trust and the funds is referred to herein as an Independent Trustee. Each Independent Trustee shall retire not later than the last day of the calendar year in which his or her 75th birthday occurs. The Independent Trustees may waive this mandatory retirement age policy with respect to individual Trustees. Officers and Advisory Board Members hold office without limit in time, except that any officer or Advisory Board Member may resign or may be removed by a vote of a majority of the Trustees at any regular meeting or any special meeting of the Trustees. Except as indicated, each individual has held the office shown or other offices in the same company for the past five years.
Each fund’s Statement of Additional Information (SAI) includes more information about the Trustees. To request a free copy, call Fidelity at 1-800-544-8544.
Experience, Skills, Attributes, and Qualifications of the Trustees. The Governance and Nominating Committee has adopted a statement of policy that describes the experience, qualifications, attributes, and skills that are necessary and desirable for potential Independent Trustee candidates (Statement of Policy). The Board believes that each Trustee satisfied at the time he or she was initially elected or appointed a Trustee, and continues to satisfy, the standards contemplated by the Statement of Policy. The Governance and Nominating Committee also engages professional search firms to help identify potential Independent Trustee candidates who have the experience, qualifications, attributes, and skills consistent with the Statement of Policy. From time to time, additional criteria based on the composition and skills of the current Independent Trustees, as well as experience or skills that may be appropriate in light of future changes to board composition, business conditions, and regulatory or other developments, have also been considered by the professional search firms and the Governance and Nominating Committee. In addition, the Board takes into account the Trustees' commitment and participation in Board and committee meetings, as well as their leadership of standing and ad hoc committees throughout their tenure.
In determining that a particular Trustee was and continues to be qualified to serve as a Trustee, the Board has considered a variety of criteria, none of which, in isolation, was controlling. The Board believes that, collectively, the Trustees have balanced and diverse experience, qualifications, attributes, and skills, which allow the Board to operate effectively in governing each fund and protecting the interests of shareholders. Information about the specific experience, skills, attributes, and qualifications of each Trustee, which in each case led to the Board's conclusion that the Trustee should serve (or continue to serve) as a trustee of the funds, is provided below.
Board Structure and Oversight Function. James C. Curvey is an interested person and currently serves as Chairman. The Trustees have determined that an interested Chairman is appropriate and benefits shareholders because an interested Chairman has a personal and professional stake in the quality and continuity of services provided to the funds. Independent Trustees exercise their informed business judgment to appoint an individual of their choosing to serve as Chairman, regardless of whether the Trustee happens to be independent or a member of management. The Independent Trustees have determined that they can act independently and effectively without having an Independent Trustee serve as Chairman and that a key structural component for assuring that they are in a position to do so is for the Independent Trustees to constitute a substantial majority for the Board. The Independent Trustees also regularly meet in executive session. Ned C. Lautenbach serves as Chairman of the Independent Trustees and as such (i) acts as a liaison between the Independent Trustees and management with respect to matters important to the Independent Trustees and (ii) with management prepares agendas for Board meetings.
Fidelity® funds are overseen by different Boards of Trustees. The funds' Board oversees Fidelity's high income and certain equity funds, and other Boards oversee Fidelity's investment-grade bond, money market, asset allocation, and other equity funds. The asset allocation funds may invest in Fidelity® funds overseen by the funds' Board. The use of separate Boards, each with its own committee structure, allows the Trustees of each group of Fidelity® funds to focus on the unique issues of the funds they oversee, including common research, investment, and operational issues. On occasion, the separate Boards establish joint committees to address issues of overlapping consequences for the Fidelity® funds overseen by each Board.
The Trustees operate using a system of committees to facilitate the timely and efficient consideration of all matters of importance to the Trustees, each fund, and fund shareholders and to facilitate compliance with legal and regulatory requirements and oversight of the funds' activities and associated risks. The Board, acting through its committees, has charged SelectCo and its affiliates with (i) identifying events or circumstances the occurrence of which could have demonstrably adverse effects on the funds' business and/or reputation; (ii) implementing processes and controls to lessen the possibility that such events or circumstances occur or to mitigate the effects of such events or circumstances if they do occur; and (iii) creating and maintaining a system designed to evaluate continuously business and market conditions in order to facilitate the identification and implementation processes described in (i) and (ii) above. Because the day-to-day operations and activities of the funds are carried out by or through SelectCo, its affiliates, and other service providers, the funds' exposure to risks is mitigated but not eliminated by the processes overseen by the Trustees. While each of the Board's committees has responsibility for overseeing different aspects of the funds' activities, oversight is exercised primarily through the Operations, Audit, and Compliance Committees. In addition, the Independent Trustees have worked with Fidelity to enhance the Board's oversight of investment and financial risks, legal and regulatory risks, technology risks, and operational risks, including the development of additional risk reporting to the Board. Appropriate personnel, including but not limited to the funds' Chief Compliance Officer (CCO), SelectCo's internal auditor, the independent accountants, the funds' Treasurer and portfolio management personnel, make periodic reports to the Board's committees, as appropriate, including an annual review of Fidelity's risk management program for the Fidelity® funds. The responsibilities of each standing committee, including their oversight responsibilities, are described further under "Standing Committees of the Trustees."
Interested Trustees*:
Correspondence intended for a Trustee who is an interested person may be sent to Fidelity Investments, 245 Summer Street, Boston, Massachusetts 02210.
Name, Year of Birth; Principal Occupations and Other Relevant Experience+
James C. Curvey (1935)
Year of Election or Appointment: 2018
Trustee
Chairman of the Board of Trustees
Mr. Curvey also serves as Trustee of other Fidelity® funds. Mr. Curvey is a Director of Fidelity Research & Analysis Co. (investment adviser firm, 2009-present), and Vice Chairman (2007-present) and Director of FMR LLC (diversified financial services company). In addition, Mr. Curvey serves as an Overseer for the Boston Symphony Orchestra and a member of the board of Artis-Naples, Naples, Florida, and as a Trustee for Brewster Academy, Wolfeboro, New Hampshire. Previously, Mr. Curvey served as a Director of Fidelity Investments Money Management, Inc. (investment adviser firm, 2009-2014) and a Director of FMR and FMR Co., Inc. (investment adviser firms, 2007-2014).
Charles S. Morrison (1960)
Year of Election or Appointment: 2018
Trustee
Mr. Morrison also serves as Trustee of other funds. He serves as President of Fidelity SelectCo, LLC (investment adviser firm, 2017-present) and Fidelity Management & Research Company (FMR) (investment adviser firm, 2016-present), a Director of Fidelity Investments Money Management, Inc. (FIMM) (investment adviser firm, 2014-present), Director of Fidelity SelectCo, LLC (investment adviser firm, 2014-present), President, Asset Management (2014-present), and is an employee of Fidelity Investments. Previously, Mr. Morrison served as Vice President of Fidelity's Fixed Income and Asset Allocation Funds (2012-2014), President, Fixed Income (2011-2014), Vice President of Fidelity's Money Market Funds (2005-2009), President, Money Market Group Leader of FMR (investment adviser firm, 2009), and Senior Vice President, Money Market Group of FMR (2004-2009). Mr. Morrison also served as Vice President of Fidelity's Bond Funds (2002-2005), certain Balanced Funds (2002-2005), and certain Asset Allocation Funds (2002-2007), and as Senior Vice President (2002-2005) of Fidelity's Bond Division.
* Determined to be an "Interested Trustee" by virtue of, among other things, his or her affiliation with the trust or various entities under common control with SelectCo.
+ The information includes the Trustee's principal occupation during the last five years and other information relating to the experience, attributes, and skills relevant to the Trustee's qualifications to serve as a Trustee, which led to the conclusion that the Trustee should serve as a Trustee for each fund.
Independent Trustees:
Correspondence intended for an Independent Trustee may be sent to Fidelity Investments, P.O. Box 55235, Boston, Massachusetts 02205-5235.
Name, Year of Birth; Principal Occupations and Other Relevant Experience+
Dennis J. Dirks (1948)
Year of Election or Appointment: 2018
Trustee
Mr. Dirks also serves as Trustee of other Fidelity® funds. Prior to his retirement in May 2003, Mr. Dirks was Chief Operating Officer and a member of the Board of The Depository Trust & Clearing Corporation (DTCC). He also served as President, Chief Operating Officer, and Board member of The Depository Trust Company (DTC) and President and Board member of the National Securities Clearing Corporation (NSCC). In addition, Mr. Dirks served as Chief Executive Officer and Board member of the Government Securities Clearing Corporation, Chief Executive Officer and Board member of the Mortgage-Backed Securities Clearing Corporation, as a Trustee and a member of the Finance Committee of Manhattan College (2005-2008), as a Trustee and a member of the Finance Committee of AHRC of Nassau County (2006-2008), as a member of the Independent Directors Council (IDC) Governing Council (2010-2015), and as a member of the Board of Directors for The Brookville Center for Children’s Services, Inc. (2009-2017). Mr. Dirks is a member of the Finance Committee (2016-present) and Board of Directors (2017-present) of the Asolo Repertory Theatre.
Donald F. Donahue (1950)
Year of Election or Appointment: 2018
Trustee
Mr. Donahue also serves as a Trustee of other Fidelity® funds. Mr. Donahue is President and Chief Executive Officer of Miranda Partners, LLC (risk consulting for the financial services industry, 2012-present). Previously, Mr. Donahue served as a Member of the Advisory Board of certain Fidelity® funds (2015-2018) and Chief Executive Officer (2006-2012), Chief Operating Officer (2003-2006), and Managing Director, Customer Marketing and Development (1999-2003) of The Depository Trust & Clearing Corporation (financial markets infrastructure). Mr. Donahue serves as a Member (2007-present) and Co-Chairman (2016-present) of the Board of Directors of United Way of New York, Member of the Board of Directors of NYC Leadership Academy (2012-present) and Member of the Board of Advisors of Ripple Labs, Inc. (financial services, 2015-present). He also served as Chairman (2010-2012) and Member of the Board of Directors (2012-2013) of Omgeo, LLC (financial services), Treasurer of United Way of New York (2012-2016), and Member of the Board of Directors of XBRL US (financial services non-profit, 2009-2012) and the International Securities Services Association (2009-2012).
Alan J. Lacy (1953)
Year of Election or Appointment: 2018
Trustee
Mr. Lacy also serves as Trustee of other Fidelity® funds. Mr. Lacy serves as a Director of Bristol-Myers Squibb Company (global pharmaceuticals, 2008-present). He is a Trustee of the California Chapter of The Nature Conservancy (2015-present) and a Director of the Center for Advanced Study in the Behavioral Sciences at Stanford University (2015-present). In addition, Mr. Lacy served as Senior Adviser (2007-2014) of Oak Hill Capital Partners, L.P. (private equity) and also served as Chief Executive Officer (2005) and Vice Chairman (2005-2006) of Sears Holdings Corporation (retail) and Chief Executive Officer and Chairman of the Board of Sears, Roebuck and Co. (retail, 2000-2005). Previously, Mr. Lacy served as Chairman (2014-2017) and a member (2010-2017) of the Board of Directors of Dave & Buster’s Entertainment, Inc. (restaurant and entertainment complexes), as Chairman (2008-2011) and a member (2006-2015) of the Board of Trustees of the National Parks Conservation Association, and as a member of the Board of Directors for The Hillman Companies, Inc. (hardware wholesalers, 2010-2014), Earth Fare, Inc. (retail grocery, 2010-2014), and The Western Union Company (global money transfer, 2006-2011).
Ned C. Lautenbach (1944)
Year of Election or Appointment: 2018
Trustee
Chairman of the Independent Trustees
Mr. Lautenbach also serves as Trustee of other Fidelity® funds. Mr. Lautenbach currently serves as Vice Chair of the Board of Governors, State University System of Florida (2013-present) and is a member of the Council on Foreign Relations (1994-present). He is also a member and has most recently served as Chairman of the Board of Directors of Artis-Naples (2012-present). Previously, Mr. Lautenbach served as a member and then Lead Director of the Board of Directors of Eaton Corporation (diversified industrial, 1997-2016). He was also a Partner and Advisory Partner at Clayton, Dubilier & Rice, LLC (private equity investment, 1998-2010), as well as a Director of Sony Corporation (2006-2007). In addition, Mr. Lautenbach also had a 30-year career with IBM (technology company) during which time he served as Senior Vice President and a member of the Corporate Executive Committee (1968-1998).
Joseph Mauriello (1944)
Year of Election or Appointment: 2018
Trustee
Mr. Mauriello also serves as Trustee of other Fidelity® funds. Prior to his retirement in January 2006, Mr. Mauriello served in numerous senior management positions including Deputy Chairman and Chief Operating Officer (2004-2005), and Vice Chairman of Financial Services (2002-2004) of KPMG LLP US (professional services, 1965-2005). Mr. Mauriello currently serves as a member of the Board of Directors of XL Group plc. (global insurance and re-insurance, 2006-present) and the Independent Directors Council (IDC) Governing Council (2015-present). Previously, Mr. Mauriello served as a Director of the Hamilton Funds of the Bank of New York (2006-2007) and of Arcadia Resources Inc. (health care services and products, 2007-2012).
Cornelia M. Small (1944)
Year of Election or Appointment: 2018
Trustee
Ms. Small also serves as Trustee of other Fidelity® funds. Ms. Small is a member of the Board of Directors (2009-present) and Chair of the Investment Committee (2010-present) of the Teagle Foundation. Ms. Small also serves on the Investment Committee of the Berkshire Taconic Community Foundation (2008-present). Previously, Ms. Small served as Chairperson (2002-2008) and a member of the Investment Committee and Chairperson (2008-2012) and a member of the Board of Trustees of Smith College. In addition, Ms. Small served as Chief Investment Officer, Director of Global Equity Investments, and a member of the Board of Directors of Scudder, Stevens & Clark and Scudder Kemper Investments.
Garnett A. Smith (1947)
Year of Election or Appointment: 2013
Trustee
Mr. Smith also serves as Trustee of other Fidelity® funds. Prior to Mr. Smith's retirement, he served as Chairman and Chief Executive Officer of Inbrand Corp. (manufacturer of personal absorbent products, 1990-1997). He also served as President (1986-1990) of Inbrand Corp. Prior to his employment with Inbrand Corp., he was employed by a retail fabric chain and North Carolina National Bank. In addition, Mr. Smith served as a Member of the Advisory Board of certain Fidelity® funds (2012-2013) and as a board member of the Jackson Hole Land Trust (2009-2012).
David M. Thomas (1949)
Year of Election or Appointment: 2018
Trustee
Mr. Thomas also serves as Trustee of other Fidelity® funds. Mr. Thomas serves as Non-Executive Chairman of the Board of Directors of Fortune Brands Home and Security (home and security products, 2011-present), as a member of the Board of Directors (2004-present) and Presiding Director (2013-present) of Interpublic Group of Companies, Inc. (marketing communication), and as a member of the Board of Trustees of the University of Florida (2013-present). Previously, Mr. Thomas served as Executive Chairman (2005-2006) and Chairman and Chief Executive Officer (2000-2005) of IMS Health, Inc. (pharmaceutical and healthcare information solutions), and a Director of Fortune Brands, Inc. (consumer products, 2000-2011).
Michael E. Wiley (1950)
Year of Election or Appointment: 2008
Trustee
Mr. Wiley also serves as Trustee or Member of the Advisory Board of other Fidelity® funds. Mr. Wiley serves as a Director of Andeavor Corporation (independent oil refiner and marketer, 2005-present), a Director of Andeavor Logistics LP (natural resources logistics, 2015-present), and a Director of Bill Barrett Corporation (exploration and production, 2005-present). In addition, Mr. Wiley also serves as a Director of Post Oak Bank (privately-held bank, 2004-present). Previously, Mr. Wiley served as a Trustee of other Fidelity® funds (2008-2013), as a Director of Asia Pacific Exploration Consolidated (international oil and gas exploration and production, 2008-2013), as a member of the Board of Trustees of the University of Tulsa (2000-2006; 2007-2010), as a Senior Energy Advisor of Katzenbach Partners, LLC (consulting, 2006-2007), as an Advisory Director of Riverstone Holdings (private investment), Chairman, President, and CEO of Baker Hughes, Inc. (oilfield services, 2000-2004), and as Director of Spinnaker Exploration Company (exploration and production, 2001-2005).
+ The information includes the Trustee's principal occupation during the last five years and other information relating to the experience, attributes, and skills relevant to the Trustee's qualifications to serve as a Trustee, which led to the conclusion that the Trustee should serve as a Trustee for each fund.
Advisory Board Members and Officers:
Correspondence intended for a Member of the Advisory Board (if any) may be sent to Fidelity Investments, P.O. Box 55235, Boston, Massachusetts 02205-5235. Correspondence intended for an officer or Peter S. Lynch may be sent to Fidelity Investments, 245 Summer Street, Boston, Massachusetts 02210. Officers appear below in alphabetical order.
Name, Year of Birth; Principal Occupation
Peter S. Lynch (1944)
Year of Election or Appointment: 2018
Member of the Advisory Board
Mr. Lynch also serves as Member of the Advisory Board of other Fidelity® funds. Mr. Lynch is Vice Chairman and a Director of FMR (investment adviser firm) and FMR Co., Inc. (investment adviser firm). In addition, Mr. Lynch serves as a Trustee of Boston College and as the Chairman of the Inner-City Scholarship Fund. Previously, Mr. Lynch served on the Special Olympics International Board of Directors (1997-2006).
William S. Stavropoulos (1939)
Year of Election or Appointment: 2018
Member of the Advisory Board
Mr. Stavropoulos also serves as Member of the Advisory Board of other Fidelity® funds. Mr. Stavropoulos serves as President and Founder of the Michigan Baseball Foundation, the Great Lakes Loons (2007-present). Mr. Stavropoulos is Chairman Emeritus of the Board of Directors of The Dow Chemical Company, where he previously served in numerous senior management positions, including President, CEO (1995-2000; 2002-2004), Chairman of the Executive Committee (2000-2006), and as a member of the Board of Directors (1990-2006). Currently, Mr. Stavropoulos is Chairman of the Board of Directors of Univar Inc. (global distributor of commodity and specialty chemicals), a Director of Teradata Corporation (data warehousing and technology solutions), and a member of the Advisory Board for Metalmark Capital LLC (private equity investment, 2005-present). Mr. Stavropoulos is an operating advisor to Clayton, Dubilier & Rice, LLC (private equity investment). In addition, Mr. Stavropoulos is a member of the University of Notre Dame Advisory Council for the College of Science, a Trustee of the Rollin L. Gerstacker Foundation, and a Director of Artis-Naples in Naples, Florida. Previously, Mr. Stavropoulos served as Trustee of certain Fidelity® funds (2001-2018) and as a Director of Chemical Financial Corporation (bank holding company, 1993-2012) and Tyco International, Ltd. (multinational manufacturing and services, 2007-2012).
Carol B. Tomé (1957)
Year of Election or Appointment: 2017
Member of the Advisory Board
Ms. Tomé also serves as Member of the Advisory Board of other Fidelity® funds. Ms. Tomé is Chief Financial Officer (2001-present) and Executive Vice President of Corporate Services (2007-present) of The Home Depot, Inc. (home improvement retailer) and a Director (2003-present) and Chair of the Audit Committee (2004-present) of United Parcel Service, Inc. (package delivery and supply chain management). Previously, Ms. Tomé served as Trustee of certain Fidelity® funds (2017), Senior Vice President of Finance and Accounting/Treasurer (2000-2007) and Vice President and Treasurer (1995-2000) of The Home Depot, Inc. and Chair of the Board (2010-2012), Vice Chair of the Board (2009 and 2013), and a Director (2008-2013) of the Federal Reserve Bank of Atlanta. Ms. Tomé is also a director or trustee of many community and professional organizations.
Elizabeth Paige Baumann (1968)
Year of Election or Appointment: 2017
Anti-Money Laundering (AML) Officer
Ms. Baumann also serves as AML Officer of other funds. She is Chief AML Officer (2012-present) and Senior Vice President (2014-present) of FMR LLC (diversified financial services company) and is an employee of Fidelity Investments. Previously, Ms. Baumann served as AML Officer of the funds (2012-2016), and Vice President (2007-2014) and Deputy Anti-Money Laundering Officer (2007-2012) of FMR LLC.
Marc R. Bryant (1966)
Year of Election or Appointment: 2013
Secretary and Chief Legal Officer (CLO)
Mr. Bryant also serves as Secretary and CLO of other funds. Mr. Bryant serves as CLO, Secretary, and Senior Vice President of Fidelity Management & Research Company (investment adviser firm, 2015-present) and FMR Co., Inc. (investment adviser firm, 2015-present); Secretary of Fidelity SelectCo, LLC (investment adviser firm, 2015-present) and Fidelity Investments Money Management, Inc. (investment adviser firm, 2015-present); and CLO of Fidelity Management & Research (Hong Kong) Limited and FMR Investment Management (UK) Limited (investment adviser firms, 2015-present) and Fidelity Management & Research (Japan) Limited (investment adviser firm, 2016-present). He is Senior Vice President and Deputy General Counsel of FMR LLC (diversified financial services company). Previously, Mr. Bryant served as Secretary and CLO of Fidelity Rutland Square Trust II (2010-2014) and Assistant Secretary of Fidelity's Fixed Income and Asset Allocation Funds (2013-2015). Prior to joining Fidelity Investments, Mr. Bryant served as a Senior Vice President and the Head of Global Retail Legal for AllianceBernstein L.P. (2006-2010), and as the General Counsel for ProFund Advisors LLC (2001-2006).
William C. Coffey (1969)
Year of Election or Appointment: 2009
Assistant Secretary
Mr. Coffey also serves as Assistant Secretary of other funds. He is Senior Vice President and Deputy General Counsel of FMR LLC (diversified financial services company, 2010-present), and is an employee of Fidelity Investments. Previously, Mr. Coffey served as Vice President and Associate General Counsel of FMR LLC (2005-2009).
Jonathan Davis (1968)
Year of Election or Appointment: 2010
Assistant Treasurer
Mr. Davis also serves as Assistant Treasurer of other funds. Mr. Davis serves as Assistant Treasurer of FMR Capital, Inc. (2017-present) and is an employee of Fidelity Investments. Previously, Mr. Davis served as Vice President and Associate General Counsel of FMR LLC (diversified financial services company, 2003-2010).
Adrien E. Deberghes (1967)
Year of Election or Appointment: 2018
Assistant Treasurer
Mr. Deberghes also serves as an officer of other funds. He serves as Assistant Treasurer of FMR Capital, Inc. (2017-present), Executive Vice President of Fidelity Investments Money Management, Inc. (FIMM) (investment adviser firm, 2016-present), and is an employee of Fidelity Investments (2008-present). Previously, Mr. Deberghes served as President and Treasurer of certain Fidelity® funds (2013-2018). Prior to joining Fidelity Investments, Mr. Deberghes was Senior Vice President of Mutual Fund Administration at State Street Corporation (2007-2008), Senior Director of Mutual Fund Administration at Investors Bank & Trust (2005-2007), and Director of Finance for Dunkin' Brands (2000-2005). Previously, Mr. Deberghes served in other fund officer roles.
Joseph DeSantis (1959)
Year of Election or Appointment: 2015
Vice President
Mr. DeSantis also serves as Vice President of other funds. Mr. DeSantis serves as a Director of Fidelity Management & Research (Japan) Limited (investment adviser firm, 2016-present), Chief Investment Officer, Equities (2010-present) and is an employee of Fidelity Investments.
Stephanie J. Dorsey (1969)
Year of Election or Appointment: 2010
Assistant Treasurer
Ms. Dorsey also serves as an officer of other funds. Ms. Dorsey serves as Assistant Treasurer of FMR Capital, Inc. (2017-present), is an employee of Fidelity Investments (2008-present), and has served in other fund officer roles. Prior to joining Fidelity Investments, Ms. Dorsey served as Treasurer (2004-2008) of the JPMorgan Mutual Funds and Vice President (2004-2008) of JPMorgan Chase Bank.
Howard J. Galligan III (1966)
Year of Election or Appointment: 2014
Chief Financial Officer
Mr. Galligan also serves as Chief Financial Officer of other funds. Mr. Galligan serves as President of Fidelity Pricing and Cash Management Services (FPCMS) (2014-present) and as a Director of Strategic Advisers LLC (investment adviser firm, 2008-present). Previously, Mr. Galligan served as Chief Administrative Officer of Asset Management (2011-2014) and Chief Operating Officer and Senior Vice President of Investment Support for Strategic Advisers, Inc. (2003-2011).
Brian B. Hogan (1964)
Year of Election or Appointment: 2009
Vice President
Mr. Hogan also serves as Trustee or Vice President of other funds. Mr. Hogan serves as Head of Fidelity Investments’ Investment Solutions and Innovation organization (2018-present), and as a Director of FMR Investment Management (UK) Limited (investment adviser firm, 2015-present) and Fidelity SelectCo, LLC (investment adviser firm, 2014-present). Previously, Mr. Hogan served as Trustee of certain Fidelity® funds (2014-2018), President of the Equity Division of FMR (investment adviser firm, 2009-2018), Senior Vice President, Equity Research of FMR (2006-2009), and as a portfolio manager. Mr. Brian B. Hogan is not related to Mr. Colm A. Hogan.
Colm A. Hogan (1973)
Year of Election or Appointment: 2018
Deputy Treasurer
Mr. Hogan also serves as an officer of other funds. Mr. Hogan serves as Assistant Treasurer of FMR Capital, Inc. (2017-present) and is an employee of Fidelity Investments (2005-present). Previously, Mr. Hogan served as Assistant Treasurer of certain Fidelity® funds (2016-2018). Mr. Colm A. Hogan is not related to Mr. Brian B. Hogan.
Chris Maher (1972)
Year of Election or Appointment: 2013
Assistant Treasurer
Mr. Maher serves as Assistant Treasurer of other funds. Mr. Maher is Vice President of Valuation Oversight, serves as Assistant Treasurer of FMR Capital, Inc. (2017-present), and is an employee of Fidelity Investments. Previously, Mr. Maher served as Vice President of Asset Management Compliance (2013), Vice President of the Program Management Group of FMR (investment adviser firm, 2010-2013), and Vice President of Valuation Oversight (2008-2010).
Rieco E. Mello (1969)
Year of Election or Appointment: 2017
Assistant Treasurer
Mr. Mello also serves as Assistant Treasurer of other funds. Mr. Mello serves as Assistant Treasurer of FMR Capital, Inc. (2017-present) and is an employee of Fidelity Investments (1995-present).
Kenneth B. Robins (1969)
Year of Election or Appointment: 2018
Chief Compliance Officer
Mr. Robins also serves as an officer of other funds. Mr. Robins serves as Compliance Officer of Fidelity Management & Research Company and FMR Co., Inc. (investment adviser firms, 2016-present) and is an employee of Fidelity Investments (2004-present). Previously, Mr. Robins served as Executive Vice President of Fidelity Investments Money Management, Inc. (investment adviser firm, 2013-2016) and served in other fund officer roles.
Stacie M. Smith (1974)
Year of Election or Appointment: 2018
President and Treasurer
Ms. Smith also serves as an officer of other funds. Ms. Smith serves as Assistant Treasurer of FMR Capital, Inc. (2017-present), is an employee of Fidelity Investments (2009-present), and has served in other fund officer roles. Prior to joining Fidelity Investments, Ms. Smith served as Senior Audit Manager of Ernst & Young LLP (accounting firm, 1996-2009). Previously, Ms. Smith served as Assistant Treasurer (2013-2018) and Deputy Treasurer (2013-2016) of certain Fidelity® funds.
Marc L. Spector (1972)
Year of Election or Appointment: 2017
Assistant Treasurer
Mr. Spector also serves as an officer of other funds. Mr. Spector serves as Assistant Treasurer of FMR Capital, Inc. (2017-present) and is an employee of Fidelity Investments (2016-present). Prior to joining Fidelity Investments, Mr. Spector served as Director at the Siegfried Group (accounting firm, 2013-2016), and prior to Siegfried Group as audit senior manager at Deloitte & Touche (accounting firm, 2005-2013).
Renee Stagnone (1975)
Year of Election or Appointment: 2016
Assistant Treasurer
Ms. Stagnone also serves as an officer of other funds. Ms. Stagnone serves as Assistant Treasurer of FMR Capital, Inc. (2017-present) and is an employee of Fidelity Investments (1997-present). Previously, Ms. Stagnone served as Deputy Treasurer of certain Fidelity® funds (2013-2016).
Shareholder Expense Example
As a shareholder of a Fund, you incur two types of costs: (1) transaction costs, including sales charges (loads) on purchase payments or redemption proceeds, and (2) ongoing costs, including management fees, distribution and/or service (12b-1) fees and other Fund expenses. This Example is intended to help you understand your ongoing costs (in dollars) of investing in the Funds and to compare these costs with the ongoing costs of investing in other mutual funds.
The Example is based on an investment of $1,000 invested at the beginning of the period and held for the entire period (September 1, 2017 to February 28, 2018).
Actual Expenses
The first line of the accompanying table for each Class of each fund provides information about actual account values and actual expenses. You may use the information in this line, together with the amount you invested, to estimate the expenses that you paid over the period. Simply divide your account value by $1,000.00 (for example, an $8,600 account value divided by $1,000.00 = 8.6), then multiply the result by the number in the first line for a Class of the fund under the heading entitled "Expenses Paid During Period" to estimate the expenses you paid on your account during this period. A small balance maintenance fee of $12.00 that is charged once a year may apply for certain accounts with a value of less than $2,000. This fee is not included in the table below. If it was, the estimate of expenses you paid during the period would be higher, and your ending account value lower, by this amount. In addition, each Fund, as a shareholder in the underlying Fidelity Central Funds, will indirectly bear its pro-rata share of the fees and expenses incurred by the underlying Fidelity Central Funds. These fees and expenses are not included in the Fund's annualized expense ratio used to calculate the expense estimate in the table below.
Hypothetical Example for Comparison Purposes
The second line of the accompanying table for each Class of each fund provides information about hypothetical account values and hypothetical expenses based on a Class' actual expense ratio and an assumed rate of return of 5% per year before expenses, which is not the Class' actual return. The hypothetical account values and expenses may not be used to estimate the actual ending account balance or expenses you paid for the period. You may use this information to compare the ongoing costs of investing in the Fund and other funds. To do so, compare this 5% hypothetical example with the 5% hypothetical examples that appear in the shareholder reports of the other funds. A small balance maintenance fee of $12.00 that is charged once a year may apply for certain accounts with a value of less than $2,000. This fee is not included in the table below. If it was, the estimate of expenses you paid during the period would be higher, and your ending account value lower, by this amount. In addition, each Fund, as a shareholder in the underlying Fidelity Central Funds, will indirectly bear its pro-rata share of the fees and expenses incurred by the underlying Fidelity Central Funds. These fees and expenses are not included in the Fund's annualized expense ratio used to calculate the expense estimate in the table below.
Please note that the expenses shown in the table are meant to highlight your ongoing costs only and do not reflect any transaction costs. Therefore, the second line of the table is useful in comparing ongoing costs only, and will not help you determine the relative total costs of owning different funds. In addition, if these transactional costs were included, your costs would have been higher.
| | Annualized Expense Ratio-A | Beginning
Account Value
September 1, 2017 | Ending
Account Value
February 28, 2018 | Expenses Paid
During Period-B
September 1, 2017
to February 28, 2018 |
| Chemicals Portfolio | .77% | | | |
| Actual | | $1,000.00 | $1,087.50 | $3.99 |
| Hypothetical-C | | $1,000.00 | $1,020.98 | $3.86 |
| Gold Portfolio | | | | |
| Class A | 1.17% | | | |
| Actual | | $1,000.00 | $845.70 | $5.35 |
| Hypothetical-C | | $1,000.00 | $1,018.99 | $5.86 |
| Class M | 1.47% | | | |
| Actual | | $1,000.00 | $844.20 | $6.72 |
| Hypothetical-C | | $1,000.00 | $1,017.50 | $7.35 |
| Class C | 1.83% | | | |
| Actual | | $1,000.00 | $843.20 | $8.36 |
| Hypothetical-C | | $1,000.00 | $1,015.72 | $9.15 |
| Gold | .85% | | | |
| Actual | | $1,000.00 | $847.50 | $3.89 |
| Hypothetical-C | | $1,000.00 | $1,020.58 | $4.26 |
| Class I | .83% | | | |
| Actual | | $1,000.00 | $847.50 | $3.80 |
| Hypothetical-C | | $1,000.00 | $1,020.68 | $4.16 |
| Materials Portfolio | | | | |
| Class A | 1.06% | | | |
| Actual | | $1,000.00 | $1,080.90 | $5.47 |
| Hypothetical-C | | $1,000.00 | $1,019.54 | $5.31 |
| Class M | 1.35% | | | |
| Actual | | $1,000.00 | $1,079.30 | $6.96 |
| Hypothetical-C | | $1,000.00 | $1,018.10 | $6.76 |
| Class C | 1.81% | | | |
| Actual | | $1,000.00 | $1,076.80 | $9.32 |
| Hypothetical-C | | $1,000.00 | $1,015.82 | $9.05 |
| Materials | .78% | | | |
| Actual | | $1,000.00 | $1,082.40 | $4.03 |
| Hypothetical-C | | $1,000.00 | $1,020.93 | $3.91 |
| Class I | .78% | | | |
| Actual | | $1,000.00 | $1,082.50 | $4.03 |
| Hypothetical-C | | $1,000.00 | $1,020.93 | $3.91 |
A Annualized expense ratio reflects expenses net of applicable fee waivers.
B Expenses are equal to each Class' annualized expense ratio, multiplied by the average account value over the period, multiplied by 181/ 365 (to reflect the one-half year period).
C 5% return per year before expenses
Distributions (Unaudited)
The Board of Trustees of each fund voted to pay to shareholders of record at the opening of business on record date, the following distributions per share derived from capital gains realized from sales of portfolio securities and dividends derived from net investment income:
| | Pay Date | Record Date | Dividends | Capital Gains |
| Chemicals Portfolio | 04/12/2018 | 04/11/2018 | $0.404 | $9.935 |
| Gold Portfolio | 04/12/2018 | 04/11/2018 | $0.000 | $0.000 |
| Materials Portfolio | 04/12/2018 | 04/11/2018 | $0.119 | $4.161 |
|
The funds hereby designate as capital gain dividend the amounts noted below for the taxable year ended February 28, 2018, or, if subsequently determined to be different, the net capital gain of such year.
| Chemicals Portfolio | $144,788,759
|
| Materials Portfolio | $150,893,353 |
|
A percentage of the dividends distributed during the fiscal year for the following funds qualify for the dividends–received deduction for corporate shareholders:
| | April 2017 | December 2017 |
| Chemicals Portfolio | 9% | 35% |
| Gold Portfolio | 8% | – |
| Materials | 100% | 100% |
|
A percentage of the dividends distributed during the fiscal year for the following funds may be taken into account as a dividend for purposes of the maximum rate under section 1(h)(11) of the Internal Revenue Code.
| | April 2017 | December 2017 |
| Chemicals Portfolio | 10% | 53% |
| Gold Portfolio | 29% | – |
| Materials Portfolio | 100% | 100% |
|
The amounts per share which represent income derived from sources within, and taxes paid to, foreign countries or possessions of the United States are as follows:
| | Pay Date | Income | Taxes |
| Gold Portfolio | 04/13/17 | $0.0136 | $0.0021 |
|
The funds will notify shareholders in January 2019 of amounts for use in preparing 2018 income tax returns.
Board Approval of Investment Advisory Contracts and Management Fees
Chemicals Portfolio
Gold Portfolio
Materials Portfolio
Each year, the Board of Trustees, including the Independent Trustees (together, the Board), votes on the renewal of the management contract with Fidelity SelectCo, LLC (SelectCo), an affiliate of Fidelity Management & Research Company (FMR), and the sub-advisory agreements with affiliates of FMR (together, the Advisory Contracts) for each fund. SelectCo and the sub-advisers are collectively referred to herein as the Investment Advisers. The Board, assisted by the advice of fund counsel and Independent Trustees' counsel, requests and considers a broad range of information relevant to the renewal of the Advisory Contracts throughout the year.
The Board meets regularly and, at each of its meetings, covers an extensive agenda of topics and materials and considers factors that are relevant to its annual consideration of the renewal of each fund's Advisory Contracts, including the services and support provided to each fund and its shareholders. The Board has established four standing committees (Committees) — Operations, Audit, Fair Valuation, and Governance and Nominating — each composed of and chaired by Independent Trustees with varying backgrounds, to which the Board has assigned specific subject matter responsibilities in order to enhance effective decision-making by the Board. The Operations Committee, of which all of the Independent Trustees are members, meets regularly throughout the year and considers, among other matters, information specifically related to the annual consideration of the renewal of each fund's Advisory Contracts. The Board, acting directly and through its Committees, requests and receives information concerning the annual consideration of the renewal of each fund's Advisory Contracts. The Board also meets as needed to review matters specifically related to the Board's annual consideration of the renewal of the Advisory Contracts. Members of the Board may also meet with trustees of other Fidelity funds through ad hoc joint committees to discuss certain matters relevant to all of the Fidelity funds.
At its January 2018 meeting, the Board unanimously determined to renew each fund's Advisory Contracts. In reaching its determination, the Board considered all factors it believed relevant, including (i) the nature, extent, and quality of the services to be provided to each fund and its shareholders (including the investment performance of each fund); (ii) the competitiveness of each fund's management fee and total expense ratio relative to peer funds; (iii) the total costs of the services to be provided by and the profits to be realized by Fidelity from its relationships with each fund; and (iv) the extent to which, if any, economies of scale exist and would be realized as each fund grows, and whether any economies of scale are appropriately shared with fund shareholders.
In considering whether to renew the Advisory Contracts for each fund, the Board reached a determination, with the assistance of fund counsel and Independent Trustees' counsel and through the exercise of its business judgment, that the renewal of the Advisory Contracts was in the best interests of each fund and its shareholders and that the compensation payable under the Advisory Contracts was fair and reasonable. The Board's decision to renew the Advisory Contracts was not based on any single factor, but rather was based on a comprehensive consideration of all the information provided to the Board at its meetings throughout the year. The Board, in reaching its determination to renew the Advisory Contracts, was aware that shareholders of each fund have a broad range of investment choices available to them, including a wide choice among funds offered by Fidelity's competitors, and that each fund's shareholders, who have the opportunity to review and weigh the disclosure provided by the fund in its prospectus and other public disclosures, have chosen to invest in that fund, which is part of the Fidelity family of funds.
Amendment to Group Fee Rate. The Board also ratified an amendment to the management contract for each fund to add an additional breakpoint to the group fee schedule, which was effective October 1, 2017. The Board noted that the additional breakpoint would result in lower management fee rates to the extent that assets under management that are included in group fee calculations increase above the new breakpoint.
Nature, Extent, and Quality of Services Provided. The Board considered the staffing of the Investment Advisers as it relates to the funds, including the backgrounds of investment personnel of SelectCo, and also considered the funds' investment objectives, strategies, and related investment philosophies. The Independent Trustees also had discussions with senior management of Fidelity's investment operations and investment groups. The Board considered the structure of the investment personnel compensation program and whether this structure provides appropriate incentives to act in the best interests of each fund. Additionally, the Board considered the portfolio managers' investments, if any, in the funds that they manage.
Resources Dedicated to Investment Management and Support Services. The Board reviewed the general qualifications and capabilities of the Investment Advisers' investment staffs, including their size, education, experience, and resources, as well as Fidelity's approach to recruiting, training, managing, and compensating investment personnel. The Board noted that Fidelity has continued to increase the resources devoted to non-U.S. offices, including expansion of Fidelity's global investment organization. The Board also noted that Fidelity's analysts have extensive resources, tools and capabilities that allow them to conduct sophisticated quantitative and fundamental analysis, as well as credit analysis of issuers, counterparties and guarantors. Further, the Board considered that Fidelity's investment professionals have sufficient access to global information and data so as to provide competitive investment results over time, and that those professionals also have access to sophisticated tools that permit them to assess portfolio construction and risk and performance attribution characteristics continuously, as well as to transmit new information and research conclusions rapidly around the world. Additionally, in its deliberations, the Board considered Fidelity's trading, risk management, compliance, and technology and operations capabilities and resources, which are integral parts of the investment management process.
Shareholder and Administrative Services. The Board considered (i) the nature, extent, quality, and cost of advisory, administrative, and shareholder services performed by the Investment Advisers and their affiliates under the Advisory Contracts and under separate agreements covering transfer agency, pricing and bookkeeping, and securities lending services for each fund; (ii) the nature and extent of the supervision of third party service providers, principally custodians, subcustodians, and pricing vendors; and (iii) the resources devoted to, and the record of compliance with, each fund's compliance policies and procedures. The Board also reviewed the allocation of fund brokerage, including allocations to brokers affiliated with the Investment Advisers, the use of brokerage commissions to pay fund expenses, and the use of "soft" commission dollars to pay for research services.
The Board noted that the growth of fund assets over time across the complex allows Fidelity to reinvest in the development of services designed to enhance the value or convenience of the Fidelity funds as investment vehicles. These services include 24-hour access to account information and market information through telephone representatives and over the Internet, investor education materials and asset allocation tools, and the expanded availability of Fidelity Investor Centers.
The Board noted that it and the boards of certain other Fidelity funds had formed an ad hoc Committee on Transfer Agency Fees to review the variety of transfer agency fee structures throughout the industry and Fidelity's competitive positioning with respect to industry participants.
Investment in a Large Fund Family. The Board considered the benefits to shareholders of investing in a Fidelity fund, including the benefits of investing in a fund that is part of a large family of funds offering a variety of investment disciplines and providing a large variety of mutual fund investor services. The Board noted that Fidelity had taken, or had made recommendations that resulted in the Fidelity funds taking, a number of actions over the previous year that benefited particular funds, including: (i) continuing to dedicate additional resources to Fidelity's investment research process, which includes meetings with management of issuers in which the funds invest, and to the support of the senior management team that oversees asset management; (ii) continuing efforts to enhance Fidelity's global research capabilities; (iii) launching new funds and making other enhancements to meet client needs; (iv) launching new share classes of existing funds; (v) eliminating purchase minimums and broadening eligibility requirements for certain lower-priced share classes; (vi) reducing management fees and total expenses for certain growth equity funds and index funds; (vii) lowering expense caps for certain existing funds and classes to reduce expenses borne by shareholders; (viii) eliminating short-term redemption fees for certain funds; (ix) introducing a new pricing structure for certain funds of funds that is expected to reduce overall expenses paid by shareholders; (x) rationalizing product lines and gaining increased efficiencies through proposals for fund mergers and share class consolidations; (xi) continuing to develop, acquire and implement systems and technology to improve services to the funds and shareholders, strengthen information security, and increase efficiency; and (xii) implementing enhancements to further strengthen Fidelity's product line to increase investors' probability of success in achieving their investment goals, including retirement income goals.
Investment Performance. The Board considered whether each fund has operated in accordance with its investment objective, as well as its record of compliance with its investment restrictions and its performance history.
The Board took into account discussions with representatives of SelectCo about fund investment performance that occur at Board meetings throughout the year. In this regard the Board noted that as part of regularly scheduled fund reviews and other reports to the Board on fund performance, the Board considers annualized return information for each fund for different time periods, measured against a securities market index ("benchmark index"). In its evaluation of fund investment performance at meetings throughout the year, the Board gave particular attention to information indicating underperformance of certain Fidelity funds for specific time periods and discussed with the Investment Advisers the reasons for such underperformance. Materials Portfolio underperformed its benchmark for the one-, three-, and five-year periods ended June 30, 2017, and as a result, the Board will continue to discuss with SelectCo the steps it is taking to address the fund's performance.
In addition to reviewing absolute and relative fund performance, the Independent Trustees periodically consider the appropriateness of fund performance metrics in evaluating the results achieved. In general, the Independent Trustees believe that fund performance should be evaluated based on net performance (after fees and expenses) of both the highest performing and lowest performing fund share classes, where applicable, compared to appropriate benchmark indices, over appropriate time periods that may include full market cycles, taking into account relevant factors, including the following: general market conditions; issuer-specific information; and fund cash flows and other factors. Depending on the circumstances, the Independent Trustees may be satisfied with a fund's performance notwithstanding that it lags its benchmark index for certain periods.
The Independent Trustees recognize that shareholders evaluate performance on a net basis over their own holding periods, for which one-, three-, and five-year periods are often used as a proxy. For this reason, the performance information reviewed by the Board also included net cumulative total return information for each fund and an appropriate benchmark index for the most recent one-, three-, and five-year periods ended June 30, 2017.
Based on its review, the Board concluded that the nature, extent, and quality of services provided to each fund under the Advisory Contracts should continue to benefit the shareholders of each fund.
Competitiveness of Management Fee and Total Expense Ratio. The Board considered each fund's management fee and total expense ratio compared to "mapped groups" of competitive funds and classes created for the purpose of facilitating the Trustees' analysis of the competitiveness of management fees and total expenses. Fidelity creates "mapped groups" by combining similar Lipper investment objective categories that have comparable investment mandates. For this purpose, all sector focused equity funds are grouped in the same mapped group. Combining Lipper investment objective categories aids the Board's management fee and total expense ratio comparisons by broadening the competitive group used for comparison.
Management Fee. The Board considered two proprietary management fee comparisons for the 12-month periods ended June 30 shown in basis points (BP) in the charts below. The group of Lipper funds used by the Board for management fee comparisons is referred to below as the "Total Mapped Group." The Total Mapped Group comparison focuses on a fund's standing in terms of gross management fees before expense reimbursements or caps relative to the total universe of funds with comparable investment mandates (
i.e., sector equities), regardless of whether their management fee structures also are comparable. Funds with comparable management fee structures have similar management fee contractual arrangements (
e.g., flat rate charged for advisory services, all-inclusive fee rate,
etc.). "TMG %" represents the percentage of funds in the Total Mapped Group that had management fees that were lower than a fund's. For example, a hypothetical TMG % of 20% would mean that 80% of the funds in the Total Mapped Group had higher, and 20% had lower, management fees than a fund. The funds' actual TMG %s and the number of funds in the Total Mapped Group are in the charts below. The "Asset-Size Peer Group" (ASPG) comparison focuses on a fund's standing relative to a subset of non-Fidelity funds within the Total Mapped Group that are similar in size and management fee structure. For example, if a fund is in the first quartile of the ASPG, the fund's management fee ranks in the least expensive or lowest 25% of funds in the ASPG. The ASPG represents at least 15% of the funds in the Total Mapped Group with comparable asset size and management fee structures, subject to a minimum of 50 funds (or all funds in the Total Mapped Group if fewer than 50). Additional information, such as the ASPG quartile in which a fund's management fee rate ranked, is also included in the charts and considered by the Board.
Chemicals Portfolio
Gold Portfolio
Materials Portfolio

The Board noted that each fund's management fee rate ranked below the median of its Total Mapped Group and below the median of its ASPG for the 12-month period ended June 30, 2017.
The Board noted that it and the boards of other Fidelity funds formed an ad hoc Committee on Group Fee, which meets periodically, to conduct an in-depth review of the "group fee" component of the management fee of funds with such management fee structures. The Committee's focus included the mechanics of the group fee, the competitive landscape of group fee structures, Fidelity funds with no group fee component and investment products not included in group fee assets. The Board also considered that, for funds subject to the group fee, FMR agreed to voluntarily waive fees over a specified period of time in amounts designed to account for assets converted from certain funds to certain collective investment trusts.
Based on its review, the Board concluded that each fund's management fee is fair and reasonable in light of the services that each fund receives and the other factors considered.
Total Expense Ratio. In its review of Chemicals Portfolio's total expense ratio, the Board considered the fund's management fee rate as well as other fund expenses, such as transfer agent fees, pricing and bookkeeping fees, and custodial, legal, and audit fees. The Board also noted that Fidelity may agree to waive fees and expenses from time to time, and the extent to which, if any, it has done so for the fund. As part of its review, the Board also considered the current and historical total expense ratios of the fund compared to competitive fund median expenses. The fund is compared to those funds and classes in the Total Mapped Group (used by the Board for management fee comparisons) that have a similar sales load structure.
In its review of the total expense ratio of each class of Gold Portfolio and Materials Portfolio, the Board considered the fund's management fee rate as well as other fund or class expenses, as applicable, such as transfer agent fees, pricing and bookkeeping fees, fund-paid 12b-1 fees, and custodial, legal, and audit fees. The Board also noted that Fidelity may agree to waive fees and expenses from time to time, and the extent to which, if any, it has done so for each fund. As part of its review, the Board also considered the current and historical total expense ratios of each class of each fund compared to competitive fund median expenses. Each class of each fund is compared to those funds and classes in the Total Mapped Group (used by the Board for management fee comparisons) that have a similar sales load structure.
For Chemicals Portfolio, the Board noted that the total expense ratio ranked below the competitive median for the 12-month period ended June 30, 2017.
For Materials Portfolio, the Board noted that the total expense ratio of each class ranked below the competitive median for the 12-month period ended June 30, 2017.
For Gold Portfolio, the Board noted that the total expense ratio of each of Class A, Class C, Class I, and the retail class ranked below the competitive median for the 12-month period ended June 30, 2017 and the total expense ratio of Class M (formerly Class T) ranked above the competitive median for the 12-month period ended June 30, 2017. The Board considered that, in general, various factors can affect total expense ratios. The Board noted that the total expense ratio of Class M was above the competitive median primarily because of higher 12b-1 fees on Class M as compared to most competitor funds. Class M has a higher 12b-1 fee, but a lower front-end sales charge, than traditionally priced front-end sales charge classes. The Board considered that Class M is primarily sold load-waived in the retirement plan market where its 0.50% 12b-1 fee is comparable to competing no-load, higher 12b-1 fee classes designed specifically for retirement plans. The Board noted that the fund offers multiple classes, each of which has a different sales load and 12b-1 fee structure, and that the multiple structures are intended to offer a range of pricing options for the intermediary market. The Board also noted that the total expense ratios of the classes of the fund vary primarily by the level of their 12b-1 fees, although differences in transfer agent fees may also cause expenses to vary from class to class.
Fees Charged to Other Fidelity Clients. The Board also considered Fidelity fee structures and other information with respect to clients of Fidelity, such as other funds advised or subadvised by Fidelity, pension plan clients, and other institutional clients with similar mandates. The Board noted that an ad hoc joint committee created by it and the boards of other Fidelity funds periodically reviews and compares Fidelity's institutional investment advisory business with its business of providing services to the Fidelity funds, including the differences in services provided, fees charged, and costs incurred, as well as competition in their respective marketplaces.
Based on its review of total expense ratios and fees charged to other Fidelity clients, the Board concluded that, although the expense ratio of Class M of Gold Portfolio was above the median of the universe presented for comparison, the total expense ratio of each class of each fund was reasonable in light of the services that each fund and its shareholders receive and the other factors considered.
Costs of the Services and Profitability. The Board considered the revenues earned and the expenses incurred by Fidelity in conducting the business of developing, marketing, distributing, managing, administering and servicing each fund and servicing each fund's shareholders. The Board also considered the level of Fidelity's profits in respect of all the Fidelity funds.
On an annual basis, Fidelity presents to the Board information about the profitability of its relationships with each fund. Fidelity calculates profitability information for each fund, as well as aggregate profitability information for groups of Fidelity funds and all Fidelity funds, using a series of detailed revenue and cost allocation methodologies which originate with the books and records of Fidelity on which Fidelity's audited financial statements are based. The Audit Committee of the Board reviews any significant changes from the prior year's methodologies.
PricewaterhouseCoopers LLP (PwC), independent registered public accounting firm and auditor to Fidelity and certain Fidelity funds, has been engaged annually by the Board as part of the Board's assessment of the profitability analysis used by Fidelity. PwC's engagement includes the review and assessment of Fidelity's methodologies used in determining the revenues and expenses attributable to Fidelity's mutual fund business, and completion of agreed-upon procedures in respect of the mathematical accuracy of the fund profitability information and its conformity to established allocation methodologies. After considering PwC's reports issued under the engagement and information provided by Fidelity, the Board concluded that while other allocation methods may also be reasonable, Fidelity's profitability methodologies are reasonable in all material respects.
The Board also reviewed Fidelity's non-fund businesses and potential fall-out benefits related to the mutual fund business as well as cases where Fidelity's affiliates may benefit from or be related to the funds' business.
The Board considered the costs of the services provided by and the profits realized by Fidelity in connection with the operation of each fund and was satisfied that the profitability was not excessive.
Economies of Scale. The Board considered whether there have been economies of scale in respect of the management of the Fidelity funds, whether the Fidelity funds (including each fund) have appropriately benefited from any such economies of scale, and whether there is potential for realization of any further economies of scale. The Board considered the extent to which each fund will benefit from economies of scale as assets grow through increased services to the fund, through waivers or reimbursements, or through fee or expense ratio reductions. The Board also noted that a committee (the Economies of Scale Committee) created by it and the boards of other Fidelity funds periodically analyzes whether Fidelity attains economies of scale in respect of the management and servicing of the Fidelity funds, whether the Fidelity funds have appropriately benefited from such economies of scale, and whether there is potential for realization of any further economies of scale.
The Board recognized that each fund's management contract incorporates a "group fee" structure, which provides for lower group fee rates as total group assets increase, and for higher group fee rates as total group assets decrease (with "group assets" defined to include fund assets under SelectCo's management plus assets under FMR's management). SelectCo calculates the group fee rates based on a tiered asset "breakpoint" schedule that varies based on asset class. The Board considered that the group fee is designed to deliver the benefits of economies of scale to fund shareholders when total group assets increase, even if assets of any particular fund are unchanged or have declined, because some portion of Fidelity's costs are attributable to services provided to all Fidelity funds, and all funds benefit if those costs can be allocated among more assets. The Board concluded that, given the group fee structure, fund shareholders will benefit from lower management fees as group assets increase at the fund complex level, regardless of whether Fidelity achieves any such economies of scale.
The Board concluded, taking into account the analysis of the Economies of Scale Committee, that economies of scale, if any, are being appropriately shared between fund shareholders and Fidelity.
Additional Information Requested by the Board. In order to develop fully the factual basis for consideration of the Fidelity funds' advisory contracts, the Board requested and received additional information on certain topics, including: (i) Fidelity's fund profitability methodology, profitability trends for certain funds, and the impact of certain factors on fund profitability results; (ii) portfolio manager changes that have occurred during the past year and the amount of the investment that each portfolio manager has made in the Fidelity fund(s) that he or she manages; (iii) Fidelity's compensation structure for portfolio managers, research analysts, and other key personnel, including its effects on fund profitability; (iv) comparisons to institutional products; (v) the arrangements with and compensation paid to certain fund sub-advisers on behalf of the Fidelity funds; (vi) the impact of proposed changes to contractual expense cap arrangements in place for certain funds; (vii) Fidelity's long-term expectations for its offerings in the workplace investing channel; (viii) the methodology with respect to evaluating competitive fund data and peer group classifications and fee comparisons; (ix) the presentation of certain fund performance information; (x) Fidelity's transfer agent fee, expense, and service structures for different funds and classes, including the increased use of omnibus accounts and lower pricing in the retirement channel; (xi) fluctuations in trading expenses; (xii) explanations regarding the relative total expense ratios of certain funds and classes; and (xiii) Fidelity's expectations regarding the future asset levels of certain funds.
Based on its evaluation of all of the conclusions noted above, and after considering all factors it believed relevant, the Board concluded that the advisory fee structures are fair and reasonable, and that each fund's Advisory Contracts should be renewed.
Proxy Voting Results
A special meeting of shareholders was held on December 8, 2017. The results of votes taken among shareholders on the proposals before them are reported below. Each vote reported represents one dollar of net asset value held on the record date for the meeting.
PROPOSAL 1
To elect a Board of Trustees.
| | # of
Votes | % of
Votes |
| James C. Curvey |
| Affirmative | 40,874,579,146.19 | 94.146 |
| Withheld | 2,541,618,753.48 | 5.854 |
| TOTAL | 43,416,197,899.67 | 100.000 |
| Dennis J. Dirks |
| Affirmative | 41,093,243,800.03 | 94.650 |
| Withheld | 2,322,954,099.64 | 5.350 |
| TOTAL | 43,416,197,899.67 | 100.000 |
| Donald F. Donahue |
| Affirmative | 41,121,116,505.64 | 94.714 |
| Withheld | 2,295,081,394.03 | 5.286 |
| TOTAL | 43,416,197,899.67 | 100.000 |
| Alan J. Lacy |
| Affirmative | 41,091,494,851.72 | 94.646 |
| Withheld | 2,324,703,047.95 | 5.354 |
| TOTAL | 43,416,197,899.67 | 100.00 |
| Ned C. Lautenbach |
| Affirmative | 40,970,733,721.42 | 94.368 |
| Withheld | 2,445,464,178.25 | 5.632 |
| TOTAL | 43,416,197,899.67 | 100.000 |
| Joseph Mauriello |
| Affirmative | 41,021,688,840.89 | 94.485 |
| Withheld | 2,394,509,058.78 | 5.515 |
| TOTAL | 43,416,197,899.67 | 100.000 |
| Charles S. Morrison |
| Affirmative | 41,163,534,997.01 | 94.812 |
| Withheld | 2,252,662,902.66 | 5.188 |
| TOTAL | 43,416,197,899.67 | 100.000 |
| Cornelia M. Small |
| Affirmative | 41,061,752,034.66 | 94.578 |
| Withheld | 2,354,445,865.01 | 5.422 |
| TOTAL | 43,416,197,899.67 | 100.000 |
| Garnett A. Smith |
| Affirmative | 41,061,939,407.02 | 94.578 |
| Withheld | 2,354,258,492.65 | 5.422 |
| TOTAL | 43,416,197,899.67 | 100.000 |
| David M. Thomas |
| Affirmative | 41,102,875,738.06 | 94.672 |
| Withheld | 2,313,322,161.61 | 5.328 |
| TOTAL | 43,416,197,899.67 | 100.000 |
| Michael E. Wiley |
| Affirmative | 41,112,279,187.11 | 94.694 |
| Withheld | 2,303,918,712.56 | 5.306 |
| TOTAL | 43,416,197,899.67 | 100.000 |
PROPOSAL 2
To eliminate a fundamental investment policy for Chemicals Portfolio.
| | # of
Votes | % of
Votes |
| Affirmative | 951,094,073.29 | 72.407 |
| Against | 163,475,766.11 | 12.446 |
| Abstain | 88,033,307.25 | 6.702 |
| Broker Non-Vote | 110,940,970.14 | 8.445 |
| TOTAL | 1,313,544,116.79 | 100.000 |
PROPOSAL 2
To eliminate a fundamental investment policy for Gold Portfolio.
| | # of
Votes | % of
Votes |
| Affirmative | 551,653,263.84 | 68.465 |
| Against | 97,346,103.67 | 12.082 |
| Abstain | 55,639,285.11 | 6.905 |
| Broker Non-Vote | 101,109,455.71 | 12.548 |
| TOTAL | 805,748,108.33 | 100.000 |
PROPOSAL 2
To eliminate a fundamental investment policy for Materials Portfolio.
| | # of
Votes | % of
Votes |
| Affirmative | 646,463,758.16 | 67.767 |
| Against | 104,408,119.98 | 10.945 |
| Abstain | 75,339,602.11 | 7.898 |
| Broker Non-Vote | 127,741,389.12 | 13.390 |
| TOTAL | 953,952,869.37 | 100.000 |
PROPOSAL 3
To modify Chemicals Portfolio's fundamental concentration policy.
| | # of
Votes | % of
Votes |
| Affirmative | 979,549,264.71 | 74.574 |
| Against | 139,692,083.39 | 10.635 |
| Abstain | 83,361,798.55 | 6.346 |
| Broker Non-Vote | 110,940,970.14 | 8.445 |
| TOTAL | 1,313,544,116.79 | 100.000 |
PROPOSAL 3
To modify Gold Portfolio's fundamental concentration policy.
| | # of
Votes | % of
Votes |
| Affirmative | 569,696,386.64 | 70.705 |
| Against | 80,140,442.00 | 9.946 |
| Abstain | 54,801,823.98 | 6.801 |
| Broker Non-Vote | 101,109,455.71 | 12.548 |
| TOTAL | 805,748,108.33 | 100.000 |
|
| |
SELMT-ANN-0418
1.846032.111
Fidelity® Select Portfolios®
Information Technology Sector Communications Equipment Portfolio
Computers Portfolio
IT Services Portfolio
Semiconductors Portfolio
Software and IT Services Portfolio
Technology Portfolio
Annual Report February 28, 2018 |
|
Contents
To view a fund's proxy voting guidelines and proxy voting record for the 12-month period ended June 30, visit http://www.fidelity.com/proxyvotingresults or visit the Securities and Exchange Commission's (SEC) web site at http://www.sec.gov.
You may also call 1-800-544-8544 to request a free copy of the proxy voting guidelines.
Standard & Poor's, S&P and S&P 500 are registered service marks of The McGraw-Hill Companies, Inc. and have been licensed for use by Fidelity Distributors Corporation.
Other third-party marks appearing herein are the property of their respective owners.
All other marks appearing herein are registered or unregistered trademarks or service marks of FMR LLC or an affiliated company. © 2018 FMR LLC. All rights reserved.
This report and the financial statements contained herein are submitted for the general information of the shareholders of the Funds. This report is not authorized for distribution to prospective investors in the Funds unless preceded or accompanied by an effective prospectus.
A fund files its complete schedule of portfolio holdings with the SEC for the first and third quarters of each fiscal year on Form N-Q. Forms N-Q are available on the SEC’s web site at http://www.sec.gov. A fund's Forms N-Q may be reviewed and copied at the SEC’s Public Reference Room in Washington, DC. Information regarding the operation of the SEC's Public Reference Room may be obtained by calling 1-800-SEC-0330.
For a complete list of a fund's portfolio holdings, view the most recent holdings listing, semiannual report, or annual report on Fidelity's web site at http://www.fidelity.com, http://www.institutional.fidelity.com, or http://www.401k.com, as applicable.
NOT FDIC INSURED •MAY LOSE VALUE •NO BANK GUARANTEE
Neither the Funds nor Fidelity Distributors Corporation is a bank.
Communications Equipment Portfolio
Performance: The Bottom Line
Average annual total return reflects the change in the value of an investment, assuming reinvestment of distributions from dividend income and capital gains (the profits earned upon the sale of securities that have grown in value, if any) and assuming a constant rate of performance each year. The hypothetical investment and the average annual total returns do not reflect the deduction of taxes that a shareholder would pay on fund distributions or the redemption of fund shares. During periods of reimbursement by Fidelity, a fund’s total return will be greater than it would be had the reimbursement not occurred. How a fund did yesterday is no guarantee of how it will do tomorrow.
Average Annual Total Returns
| For the periods ended February 28, 2018 | Past 1 year | Past 5 years | Past 10 years |
| Communications Equipment Portfolio | 16.71% | 12.92% | 8.82% |
$10,000 Over 10 Years
Let's say hypothetically that $10,000 was invested in Communications Equipment Portfolio on February 29, 2008.
The chart shows how the value of your investment would have changed, and also shows how the S&P 500® Index performed over the same period.
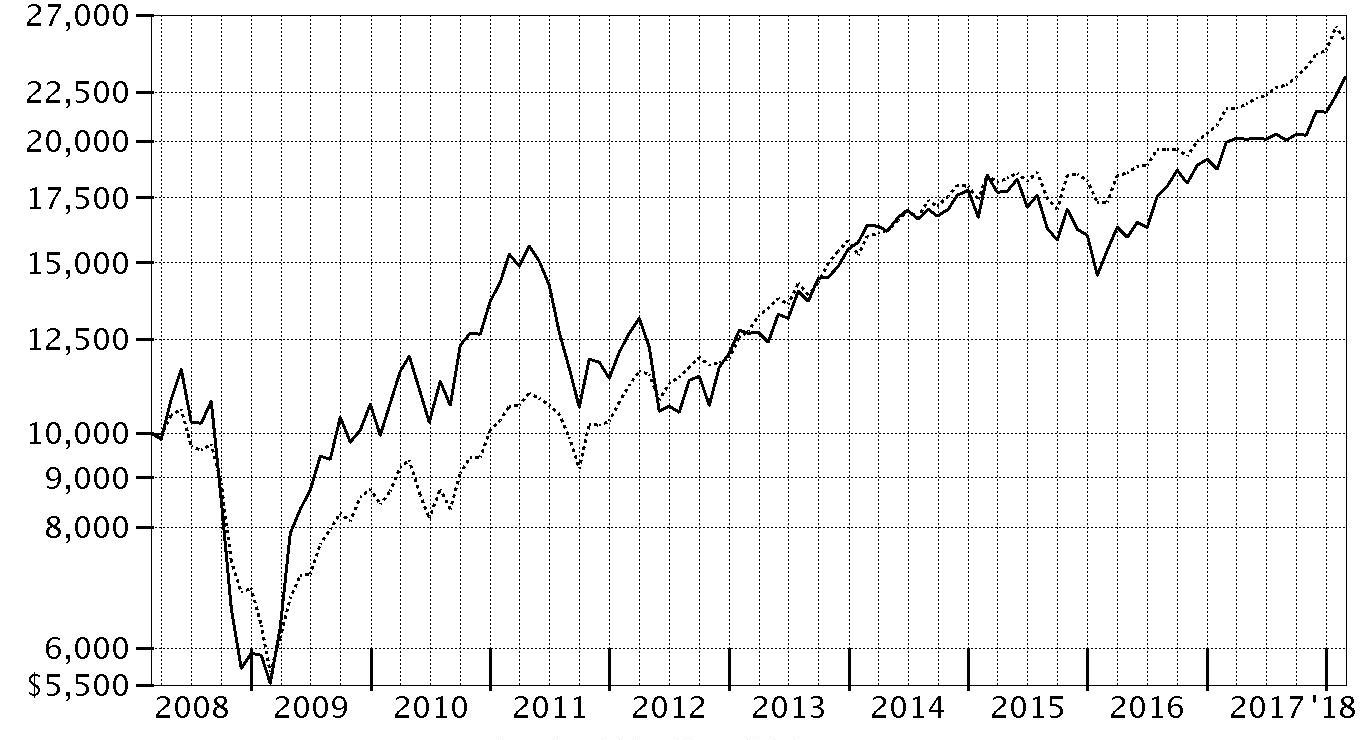
| Period Ending Values |
| $23,275 | Communications Equipment Portfolio |
| $25,307 | S&P 500® Index |
Communications Equipment Portfolio
Management's Discussion of Fund Performance
Market Recap: U.S. equities gained 17.10% for the 12 months ending February 28, 2018, as the S&P 500
® index moved steadily higher throughout 2017 and into 2018 until sharply reversing course in February. The drop was in stark contrast to the low volatility seen throughout 2017, along with consumer sentiment and other market indicators that stayed positive. Investors remained decidedly upbeat as the calendar turned, and the index rose 5.73% in January. February was a decidedly different story, though, as volatility spiked amid fear that rising inflation and the potential for the economy to overheat would prompt the U.S. Federal Reserve to pick up the pace of interest rate hikes. The index returned -3.69% for the month, its first negative result since October 2016. For the full 12 months, growth stocks handily topped value, while large-caps bested small-caps. By sector, information technology fared best by far, gaining 36% amid strong earnings growth from several major index constituents. Consumer discretionary (+22%) also stood out, driven by retailers. Financials added 20%, riding the uptick in bond yields. Materials and industrials rose about 16% each, boosted by higher demand, especially from China. Conversely, notable laggards included the defensive telecommunication services (-5%) and utilities (-2%) sectors, while rising rates held back real estate (-3%).
Comments from Portfolio Manager Colin Anderson: For the year, the fund gained 16.71%, about even with the 16.79% return of the MSCI North America IMI + ADR Custom Communications Equipment 25/50 Linked Index, but modestly behind the S&P 500
®. Versus the MSCI linked index, stock picking in communications equipment worked against us, as did a small non-index stake in electronic manufacturing services. The largest relative detractors were index names I underweighted that performed well: Arista Networks and Extreme Networks, the latter of which I sold off this period. An overweighting in optical components supplier Finisar also detracted. Conversely, an underweighting in semiconductors, as well as non-index exposure to internet software & services and other groups, lifted relative performance. Not owning weak-performing optical equipment supplier Applied Optoelectronics, an index constituent and our top relative contributor, bolstered the fund's relative results. Negligible exposure to Canada-based wireless infrastructure equipment Sierra Wireless also helped, and I eliminated the position. A large stake in military communications provider Harris Corp. also worked well, and I also reduced this position during the period.
The views expressed above reflect those of the portfolio manager(s) only through the end of the period as stated on the cover of this report and do not necessarily represent the views of Fidelity or any other person in the Fidelity organization. Any such views are subject to change at any time based upon market or other conditions and Fidelity disclaims any responsibility to update such views. These views may not be relied on as investment advice and, because investment decisions for a Fidelity fund are based on numerous factors, may not be relied on as an indication of trading intent on behalf of any Fidelity fund.
Notes to shareholders: On April 1, 2017, the fund’s industry benchmark changed from the S&P
® Custom Communications Equipment Index to the MSCI North America IMI + ADR Custom Communications Equipment 25/50 Linked Index. Due to new international benchmark guidelines, S&P
® Dow Jones
® Indices stopped offering its brand on custom benchmarks, effective March 31, 2017. Fidelity believes that the new MSCI index will continue to provide shareholders with meaningful performance comparisons.
On December 8, 2017, shareholders approved proposals from the Board of Trustees to eliminate each sector/industry fund's fundamental “invests primarily” policy and to modify the fundamental concentration policy for certain funds. The changes took effect on January 1, 2018, and do not impact how the funds are managed.
Communications Equipment Portfolio
Investment Summary (Unaudited)
Top Ten Stocks as of February 28, 2018
| | % of fund's net assets |
| Cisco Systems, Inc. | 22.7 |
| Nokia Corp. sponsored ADR | 7.3 |
| CommScope Holding Co., Inc. | 6.4 |
| F5 Networks, Inc. | 5.8 |
| Telefonaktiebolaget LM Ericsson (B Shares) sponsored ADR | 4.5 |
| Juniper Networks, Inc. | 4.5 |
| Palo Alto Networks, Inc. | 3.1 |
| Motorola Solutions, Inc. | 2.7 |
| Arista Networks, Inc. | 2.5 |
| Lumentum Holdings, Inc. | 2.1 |
| | 61.6 |
Top Industries (% of fund's net assets)
| As of February 28, 2018 |
| | Communications Equipment | 83.7% |
| | Semiconductors & Semiconductor Equipment | 4.8% |
| | Electronic Equipment & Components | 2.7% |
| | Internet Software & Services | 2.3% |
| | Software | 1.9% |
| | All Others* | 4.6% |

* Includes short-term investments and net other assets (liabilities).
Communications Equipment Portfolio
Schedule of Investments February 28, 2018
Showing Percentage of Net Assets
| Common Stocks - 98.8% | | | |
| | | Shares | Value |
| Aerospace & Defense - 0.7% | | | |
| Aerospace & Defense - 0.7% | | | |
| Harris Corp. | | 9,600 | $1,499,040 |
| Communications Equipment - 83.7% | | | |
| Communications Equipment - 83.7% | | | |
| ADTRAN, Inc. | | 223,300 | 3,494,645 |
| ADVA Optical Networking SE (a) | | 15,718 | 118,804 |
| Arista Networks, Inc. (a) | | 19,500 | 5,259,930 |
| Arris International PLC (a) | | 154,043 | 3,928,097 |
| Calix Networks, Inc. (a) | | 90,721 | 594,223 |
| Ciena Corp. (a) | | 39,000 | 903,630 |
| Cisco Systems, Inc. | | 1,061,699 | 47,542,879 |
| CommScope Holding Co., Inc. (a) | | 344,871 | 13,349,956 |
| Comtech Telecommunications Corp. | | 42,500 | 939,250 |
| EchoStar Holding Corp. Class A (a) | | 41,700 | 2,419,434 |
| F5 Networks, Inc. (a) | | 81,935 | 12,168,986 |
| Finisar Corp. (a) | | 242,800 | 4,370,400 |
| Infinera Corp. (a) | | 240,514 | 2,393,114 |
| InterDigital, Inc. | | 46,100 | 3,309,980 |
| Juniper Networks, Inc. | | 363,312 | 9,322,586 |
| Lumentum Holdings, Inc. (a)(b) | | 73,220 | 4,466,420 |
| Mitel Networks Corp. (a) | | 438,200 | 3,584,476 |
| Motorola Solutions, Inc. | | 52,359 | 5,557,908 |
| NETGEAR, Inc. (a) | | 30,150 | 1,680,863 |
| NetScout Systems, Inc. (a) | | 86,900 | 2,307,195 |
| Nokia Corp. sponsored ADR | | 2,617,803 | 15,183,257 |
| Oclaro, Inc. (a)(b) | | 164,900 | 1,182,333 |
| Palo Alto Networks, Inc. (a) | | 37,900 | 6,570,723 |
| Plantronics, Inc. | | 39,834 | 2,152,629 |
| Quantenna Communications, Inc. (a) | | 212,100 | 2,916,375 |
| Radware Ltd. (a) | | 39,491 | 816,279 |
| Sierra Wireless, Inc. (a) | | 30,800 | 492,531 |
| Sonus Networks, Inc. (a) | | 383,460 | 2,484,821 |
| Telefonaktiebolaget LM Ericsson (B Shares) sponsored ADR (b) | | 1,426,780 | 9,445,284 |
| Ubiquiti Networks, Inc. (a)(b) | | 1,200 | 76,320 |
| ViaSat, Inc. (a)(b) | | 22,400 | 1,563,296 |
| Viavi Solutions, Inc. (a) | | 458,500 | 4,410,770 |
| | | | 175,007,394 |
| Electronic Equipment & Components - 2.7% | | | |
| Electronic Manufacturing Services - 1.5% | | | |
| Fabrinet | | 45,500 | 1,371,825 |
| Jabil, Inc. | | 45,900 | 1,243,431 |
| TE Connectivity Ltd. | | 5,200 | 536,068 |
| | | | 3,151,324 |
| Technology Distributors - 1.2% | | | |
| CDW Corp. | | 17,700 | 1,290,861 |
| Dell Technologies, Inc. (a) | | 16,059 | 1,193,023 |
| | | | 2,483,884 |
|
| TOTAL ELECTRONIC EQUIPMENT & COMPONENTS | | | 5,635,208 |
|
| Internet Software & Services - 2.3% | | | |
| Internet Software & Services - 2.3% | | | |
| Akamai Technologies, Inc. (a) | | 1,600 | 107,936 |
| Alphabet, Inc.: | | | |
| Class A (a) | | 2,280 | 2,516,938 |
| Class C (a) | | 1,205 | 1,331,200 |
| LogMeIn, Inc. | | 8,308 | 959,989 |
| | | | 4,916,063 |
| IT Services - 1.5% | | | |
| Data Processing & Outsourced Services - 0.4% | | | |
| WNS Holdings Ltd. sponsored ADR (a) | | 17,500 | 787,500 |
| IT Consulting & Other Services - 1.1% | | | |
| Amdocs Ltd. | | 12,700 | 835,533 |
| Cognizant Technology Solutions Corp. Class A | | 7,950 | 652,059 |
| Presidio, Inc. | | 60,800 | 888,896 |
| | | | 2,376,488 |
|
| TOTAL IT SERVICES | | | 3,163,988 |
|
| Media - 0.4% | | | |
| Cable & Satellite - 0.4% | | | |
| Comcast Corp. Class A | | 22,100 | 800,241 |
| Semiconductors & Semiconductor Equipment - 4.8% | | | |
| Semiconductors - 4.8% | | | |
| Acacia Communications, Inc. (a)(b) | | 80,000 | 3,096,000 |
| Analog Devices, Inc. | | 6,300 | 567,945 |
| Broadcom Ltd. | | 5,023 | 1,237,969 |
| Cavium, Inc. (a) | | 2,800 | 249,312 |
| Maxim Integrated Products, Inc. | | 7,200 | 438,768 |
| ON Semiconductor Corp. (a) | | 37,500 | 897,000 |
| Qualcomm, Inc. | | 55,119 | 3,582,735 |
| | | | 10,069,729 |
| Software - 1.9% | | | |
| Application Software - 0.7% | | | |
| Citrix Systems, Inc. (a) | | 9,600 | 883,200 |
| Micro Focus International PLC | | 19,600 | 553,011 |
| SailPoint Technologies Holding, Inc. (a) | | 2,300 | 48,346 |
| | | | 1,484,557 |
| Systems Software - 1.2% | | | |
| Check Point Software Technologies Ltd. (a) | | 11,700 | 1,215,513 |
| Oracle Corp. | | 24,300 | 1,231,281 |
| | | | 2,446,794 |
|
| TOTAL SOFTWARE | | | 3,931,351 |
|
| Technology Hardware, Storage & Peripherals - 0.8% | | | |
| Technology Hardware, Storage & Peripherals - 0.8% | | | |
| HP, Inc. | | 48,111 | 1,125,316 |
| Samsung Electronics Co. Ltd. | | 288 | 624,679 |
| | | | 1,749,995 |
| TOTAL COMMON STOCKS | | | |
| (Cost $157,253,080) | | | 206,773,009 |
|
| Money Market Funds - 9.7% | | | |
| Fidelity Cash Central Fund, 1.41% (c) | | 3,074,616 | 3,075,231 |
| Fidelity Securities Lending Cash Central Fund 1.42% (c)(d) | | 17,186,573 | 17,188,292 |
| TOTAL MONEY MARKET FUNDS | | | |
| (Cost $20,263,523) | | | 20,263,523 |
| TOTAL INVESTMENT IN SECURITIES - 108.5% | | | |
| (Cost $177,516,603) | | | 227,036,532 |
| NET OTHER ASSETS (LIABILITIES) - (8.5)% | | | (17,858,600) |
| NET ASSETS - 100% | | | $209,177,932 |
Legend
(a) Non-income producing
(b) Security or a portion of the security is on loan at period end.
(c) Affiliated fund that is generally available only to investment companies and other accounts managed by Fidelity Investments. The rate quoted is the annualized seven-day yield of the fund at period end. A complete unaudited listing of the fund's holdings as of its most recent quarter end is available upon request. In addition, each Fidelity Central Fund's financial statements, which are not covered by the Fund's Report of Independent Registered Public Accounting Firm, are available on the SEC's website or upon request.
(d) Investment made with cash collateral received from securities on loan.
Affiliated Central Funds
Information regarding fiscal year to date income earned by the Fund from investments in Fidelity Central Funds is as follows:
| Fund | Income earned |
| Fidelity Cash Central Fund | $16,996 |
| Fidelity Securities Lending Cash Central Fund | 253,155 |
| Total | $270,151 |
Amounts in the income column in the above table include any capital gain distributions from underlying funds, which are presented in the corresponding line-item in the Statement of Operations if applicable.
Investment Valuation
The following is a summary of the inputs used, as of February 28, 2018, involving the Fund's assets and liabilities carried at fair value. The inputs or methodology used for valuing securities may not be an indication of the risk associated with investing in those securities. For more information on valuation inputs, and their aggregation into the levels used below, please refer to the Investment Valuation section in the accompanying Notes to Financial Statements.
| | Valuation Inputs at Reporting Date: |
| Description | Total | Level 1 | Level 2 | Level 3 |
| Investments in Securities: | | | | |
| Common Stocks | $206,773,009 | $205,476,515 | $1,296,494 | $-- |
| Money Market Funds | 20,263,523 | 20,263,523 | -- | -- |
| Total Investments in Securities: | $227,036,532 | $225,740,038 | $1,296,494 | $-- |
Other Information
Distribution of investments by country or territory of incorporation, as a percentage of Total Net Assets, is as follows (Unaudited):
| United States of America | 80.4% |
| Finland | 7.3% |
| Sweden | 4.5% |
| United Kingdom | 2.2% |
| Canada | 1.9% |
| Israel | 1.0% |
| Others (Individually Less Than 1%) | 2.7% |
| | 100.0% |
See accompanying notes which are an integral part of the financial statements.
Communications Equipment Portfolio
Financial Statements
Statement of Assets and Liabilities
| | | February 28, 2018 |
| Assets | | |
Investment in securities, at value (including securities loaned of $16,558,737) — See accompanying schedule:
Unaffiliated issuers (cost $157,253,080) | $206,773,009 | |
| Fidelity Central Funds (cost $20,263,523) | 20,263,523 | |
| Total Investment in Securities (cost $177,516,603) | | $227,036,532 |
| Receivable for investments sold | | 7,621,483 |
| Receivable for fund shares sold | | 1,503,010 |
| Dividends receivable | | 119,467 |
| Distributions receivable from Fidelity Central Funds | | 31,272 |
| Prepaid expenses | | 637 |
| Other receivables | | 2,773 |
| Total assets | | 236,315,174 |
| Liabilities | | |
| Payable for investments purchased | $9,451,653 | |
| Payable for fund shares redeemed | 325,681 | |
| Accrued management fee | 89,102 | |
| Other affiliated payables | 40,359 | |
| Other payables and accrued expenses | 42,212 | |
| Collateral on securities loaned | 17,188,235 | |
| Total liabilities | | 27,137,242 |
| Net Assets | | $209,177,932 |
| Net Assets consist of: | | |
| Paid in capital | | $150,017,229 |
| Distributions in excess of net investment income | | (422,185) |
| Accumulated undistributed net realized gain (loss) on investments and foreign currency transactions | | 10,063,034 |
| Net unrealized appreciation (depreciation) on investments and assets and liabilities in foreign currencies | | 49,519,854 |
| Net Assets, for 5,345,130 shares outstanding | | $209,177,932 |
| Net Asset Value, offering price and redemption price per share ($209,177,932 ÷ 5,345,130 shares) | | $39.13 |
See accompanying notes which are an integral part of the financial statements.
Statement of Operations
| | | Year ended February 28, 2018 |
| Investment Income | | |
| Dividends | | $2,277,436 |
| Income from Fidelity Central Funds (including $253,155 from security lending) | | 270,151 |
| Total income | | 2,547,587 |
| Expenses | | |
| Management fee | $1,042,425 | |
| Transfer agent fees | 429,864 | |
| Accounting and security lending fees | 77,151 | |
| Custodian fees and expenses | 6,037 | |
| Independent trustees' fees and expenses | 4,186 | |
| Registration fees | 20,427 | |
| Audit | 40,329 | |
| Legal | 3,396 | |
| Miscellaneous | 10,819 | |
| Total expenses before reductions | 1,634,634 | |
| Expense reductions | (8,447) | 1,626,187 |
| Net investment income (loss) | | 921,400 |
| Realized and Unrealized Gain (Loss) | | |
| Net realized gain (loss) on: | | |
| Investment securities: | | |
| Unaffiliated issuers | 12,971,015 | |
| Fidelity Central Funds | (295) | |
| Foreign currency transactions | (5,684) | |
| Total net realized gain (loss) | | 12,965,036 |
| Change in net unrealized appreciation (depreciation) on: | | |
| Investment securities: | | |
| Unaffiliated issuers | 15,655,403 | |
| Fidelity Central Funds | (1,104) | |
| Assets and liabilities in foreign currencies | (520) | |
| Total change in net unrealized appreciation (depreciation) | | 15,653,779 |
| Net gain (loss) | | 28,618,815 |
| Net increase (decrease) in net assets resulting from operations | | $29,540,215 |
See accompanying notes which are an integral part of the financial statements.
Statement of Changes in Net Assets
| | Year ended February 28, 2018 | Year ended February 28, 2017 |
| Increase (Decrease) in Net Assets | | |
| Operations | | |
| Net investment income (loss) | $921,400 | $2,383,352 |
| Net realized gain (loss) | 12,965,036 | 2,028,153 |
| Change in net unrealized appreciation (depreciation) | 15,653,779 | 43,260,949 |
| Net increase (decrease) in net assets resulting from operations | 29,540,215 | 47,672,454 |
| Distributions to shareholders from net investment income | (1,789,780) | (2,293,875) |
| Distributions to shareholders from net realized gain | (1,551,482) | – |
| Total distributions | (3,341,262) | (2,293,875) |
| Share transactions | | |
| Proceeds from sales of shares | 19,613,235 | 35,416,799 |
| Reinvestment of distributions | 3,127,012 | 2,137,643 |
| Cost of shares redeemed | (44,412,551) | (47,739,292) |
| Net increase (decrease) in net assets resulting from share transactions | (21,672,304) | (10,184,850) |
| Redemption fees | 509 | 2,519 |
| Total increase (decrease) in net assets | 4,527,158 | 35,196,248 |
| Net Assets | | |
| Beginning of period | 204,650,774 | 169,454,526 |
| End of period | $209,177,932 | $204,650,774 |
| Other Information | | |
| Undistributed net investment income end of period | $– | $455,888 |
| Distributions in excess of net investment income end of period | $(422,185) | $– |
| Shares | | |
| Sold | 523,886 | 1,146,264 |
| Issued in reinvestment of distributions | 89,704 | 68,971 |
| Redeemed | (1,266,244) | (1,562,158) |
| Net increase (decrease) | (652,654) | (346,923) |
See accompanying notes which are an integral part of the financial statements.
Financial Highlights
Communications Equipment Portfolio
| | | | | | |
| Years ended February 28, | 2018 | 2017 | 2016 A | 2015 | 2014 |
| Selected Per–Share Data | | | | | |
| Net asset value, beginning of period | $34.12 | $26.71 | $32.99 | $31.24 | $24.31 |
| Income from Investment Operations | | | | | |
| Net investment income (loss)B | .17 | .38 | .31 | .28 | .18 |
| Net realized and unrealized gain (loss) | 5.45C | 7.39 | (5.64) | 3.52 | 6.95 |
| Total from investment operations | 5.62 | 7.77 | (5.33) | 3.80 | 7.13 |
| Distributions from net investment income | (.33) | (.36) | (.30) | (.30) | (.20) |
| Distributions from net realized gain | (.28) | – | (.65) | (1.75) | – |
| Total distributions | (.61) | (.36) | (.95) | (2.05) | (.20) |
| Redemption fees added to paid in capitalB,D | – | – | – | – | – |
| Net asset value, end of period | $39.13 | $34.12 | $26.71 | $32.99 | $31.24 |
| Total ReturnE | 16.71%C | 29.24% | (16.38)% | 12.49% | 29.41% |
| Ratios to Average Net AssetsF,G | | | | | |
| Expenses before reductions | .85% | .88% | .90% | .89% | .92% |
| Expenses net of fee waivers, if any | .85% | .88% | .89% | .89% | .92% |
| Expenses net of all reductions | .85% | .88% | .89% | .89% | .90% |
| Net investment income (loss) | .48% | 1.27% | 1.04% | .89% | .69% |
| Supplemental Data | | | | | |
| Net assets, end of period (000 omitted) | $209,178 | $204,651 | $169,455 | $263,631 | $347,345 |
| Portfolio turnover rateH | 56% | 38% | 30% | 42%I | 65% |
A For the year ended February 29.
B Calculated based on average shares outstanding during the period.
C Net realized and unrealized gain (loss) per share reflects proceeds received from litigation which amounted to $.01 per share. Excluding these litigation proceeds, the total return would have been 16.67%.
D Amount represents less than $.005 per share.
E Total returns would have been lower if certain expenses had not been reduced during the applicable periods shown.
F Fees and expenses of any underlying Fidelity Central Funds are not included in the Fund's expense ratio. The Fund indirectly bears its proportionate share of the expenses of any underlying Fidelity Central Funds.
G Expense ratios reflect operating expenses of the Fund. Expenses before reductions do not reflect amounts reimbursed by the investment adviser or reductions from brokerage service arrangements or reductions from other expense offset arrangements and do not represent the amount paid by the Fund during periods when reimbursements or reductions occur. Expenses net of fee waivers reflect expenses after reimbursement by the investment adviser but prior to reductions from brokerage service arrangements or other expense offset arrangements. Expenses net of all reductions represent the net expenses paid by the Fund.
H Amount does not include the portfolio activity of any underlying Fidelity Central Funds.
I Portfolio turnover rate excludes securities received or delivered in-kind.
See accompanying notes which are an integral part of the financial statements.
Computers Portfolio
Performance: The Bottom Line
Average annual total return reflects the change in the value of an investment, assuming reinvestment of distributions from dividend income and capital gains (the profits earned upon the sale of securities that have grown in value, if any) and assuming a constant rate of performance each year. The hypothetical investment and the average annual total returns do not reflect the deduction of taxes that a shareholder would pay on fund distributions or the redemption of fund shares. During periods of reimbursement by Fidelity, a fund’s total return will be greater than it would be had the reimbursement not occurred. How a fund did yesterday is no guarantee of how it will do tomorrow.
Average Annual Total Returns
| For the periods ended February 28, 2018 | Past 1 year | Past 5 years | Past 10 years |
| Computers Portfolio | 24.82% | 14.84% | 12.36% |
$10,000 Over 10 Years
Let's say hypothetically that $10,000 was invested in Computers Portfolio on February 29, 2008.
The chart shows how the value of your investment would have changed, and also shows how the S&P 500® Index performed over the same period.
| Period Ending Values |
| $32,073 | Computers Portfolio |
| $25,307 | S&P 500® Index |
Computers Portfolio
Management's Discussion of Fund Performance
Market Recap: U.S. equities gained 17.10% for the 12 months ending February 28, 2018, as the S&P 500
® index moved steadily higher throughout 2017 and into 2018 until sharply reversing course in February. The drop was in stark contrast to the low volatility seen throughout 2017, along with consumer sentiment and other market indicators that stayed positive. Investors remained decidedly upbeat as the calendar turned, and the index rose 5.73% in January. February was a decidedly different story, though, as volatility spiked amid fear that rising inflation and the potential for the economy to overheat would prompt the U.S. Federal Reserve to pick up the pace of interest rate hikes. The index returned -3.69% for the month, its first negative result since October 2016. For the full 12 months, growth stocks handily topped value, while large-caps bested small-caps. By sector, information technology fared best by far, gaining 36% amid strong earnings growth from several major index constituents. Consumer discretionary (+22%) also stood out, driven by retailers. Financials added 20%, riding the uptick in bond yields. Materials and industrials rose about 16% each, boosted by higher demand, especially from China. Conversely, notable laggards included the defensive telecommunication services (-5%) and utilities (-2%) sectors, while rising rates held back real estate (-3%).
Comments from Lead Portfolio Manager Christopher Lin: For the year, the fund gained 24.82%, well ahead of the 21.73% result of the FactSet Computers & Peripherals Linked Index, and topping the S&P 500
® index. Versus the FactSet linked index, stock picking in IT consulting & other services lifted performance, as did avoiding the weak-performing electronic components segment. Foreign holdings contributed overall, aided in part by a broadly weaker U.S. dollar. Avoiding South Korea-based LG Display (-19%) was the fund’s largest relative contributor. Underweighting and then selling weak-performing IBM also lifted our relative result. Conversely, stock selection in systems software was a meaningful detractor. Blackberry was our largest relative detractor, as we had negligible exposure here and the stock advanced about 44%.
The views expressed above reflect those of the portfolio manager(s) only through the end of the period as stated on the cover of this report and do not necessarily represent the views of Fidelity or any other person in the Fidelity organization. Any such views are subject to change at any time based upon market or other conditions and Fidelity disclaims any responsibility to update such views. These views may not be relied on as investment advice and, because investment decisions for a Fidelity fund are based on numerous factors, may not be relied on as an indication of trading intent on behalf of any Fidelity fund.
Notes to shareholders: Due to new international benchmark guidelines, S&P
® Dow Jones
® indices stopped offering its brand on custom benchmarks, effective March 31, 2017. As a temporary solution, on April 1, 2017, the fund's industry benchmark name changed from the S&P
® Custom Computers & Peripherals Index to the Fidelity Computers & Peripherals Index. S&P
® agreed to continue calculating this index through June 30, after which the benchmark changed to the FactSet Computers & Peripherals Linked Index. Fidelity believes that the new FactSet index will continue to provide shareholders with meaningful performance comparisons.
On December 1, 2017, Caroline Tall became Co-Manager of the fund, joining Lead Manager Christopher Lin.
On December 8, 2017, shareholders approved proposals from the Board of Trustees to eliminate each sector/industry fund's fundamental “invests primarily” policy and to modify the fundamental concentration policy for certain funds. The changes took effect on January 1, 2018, and do not impact how the funds are managed.
Computers Portfolio
Investment Summary (Unaudited)
Top Ten Stocks as of February 28, 2018
| | % of fund's net assets |
| Apple, Inc. | 22.7 |
| Sony Corp. | 14.0 |
| Samsung Electronics Co. Ltd. | 12.2 |
| NetApp, Inc. | 5.0 |
| HP, Inc. | 4.9 |
| Facebook, Inc. Class A | 4.7 |
| Alphabet, Inc. Class A | 4.5 |
| Dell Technologies, Inc. | 4.4 |
| Western Digital Corp. | 3.9 |
| Quanta Computer, Inc. | 3.8 |
| | 80.1 |
Top Industries (% of fund's net assets)
| As of February 28, 2018 |
| | Technology Hardware, Storage & Peripherals | 60.3% |
| | Household Durables | 14.0% |
| | Internet Software & Services | 9.6% |
| | Semiconductors & Semiconductor Equipment | 5.9% |
| | IT Services | 4.6% |
| | All Others* | 5.6% |

* Includes short-term investments and net other assets (liabilities).
Computers Portfolio
Schedule of Investments February 28, 2018
Showing Percentage of Net Assets
| Common Stocks - 98.8% | | | |
| | | Shares | Value |
| Electronic Equipment & Components - 4.4% | | | |
| Technology Distributors - 4.4% | | | |
| Dell Technologies, Inc. (a) | | 315,104 | $23,409,076 |
| Household Durables - 14.0% | | | |
| Consumer Electronics - 14.0% | | | |
| Sony Corp. | | 1,499,106 | 75,540,192 |
| Internet Software & Services - 9.6% | | | |
| Internet Software & Services - 9.6% | | | |
| Alphabet, Inc.: | | | |
| Class A (a) | | 22,027 | 24,316,046 |
| Class C (a) | | 1,957 | 2,161,957 |
| Facebook, Inc. Class A (a) | | 139,883 | 24,943,937 |
| | | | 51,421,940 |
| IT Services - 4.6% | | | |
| Data Processing & Outsourced Services - 4.6% | | | |
| MasterCard, Inc. Class A | | 36,500 | 6,415,240 |
| PayPal Holdings, Inc. (a) | | 128,722 | 10,221,814 |
| Visa, Inc. Class A | | 67,200 | 8,261,568 |
| | | | 24,898,622 |
| Semiconductors & Semiconductor Equipment - 5.9% | | | |
| Semiconductor Equipment - 1.8% | | | |
| ASML Holding NV | | 48,966 | 9,567,467 |
| Semiconductors - 4.1% | | | |
| Mellanox Technologies Ltd. (a) | | 145,721 | 10,025,605 |
| Qualcomm, Inc. | | 188,717 | 12,266,605 |
| | | | 22,292,210 |
|
| TOTAL SEMICONDUCTORS & SEMICONDUCTOR EQUIPMENT | | | 31,859,677 |
|
| Technology Hardware, Storage & Peripherals - 60.3% | | | |
| Technology Hardware, Storage & Peripherals - 60.3% | | | |
| Apple, Inc. | | 685,415 | 122,086,120 |
| Canon, Inc. | | 110,000 | 4,191,970 |
| Cray, Inc. (a) | | 32,729 | 713,492 |
| Fujifilm Holdings Corp. | | 133,108 | 5,546,908 |
| Hewlett Packard Enterprise Co. | | 604,145 | 11,231,056 |
| HP, Inc. | | 1,138,796 | 26,636,438 |
| Lenovo Group Ltd. | | 2,016,000 | 1,046,180 |
| NCR Corp. (a) | | 124,104 | 4,095,432 |
| NetApp, Inc. | | 440,001 | 26,642,061 |
| Quanta Computer, Inc. | | 10,182,317 | 20,532,242 |
| Samsung Electronics Co. Ltd. | | 30,299 | 65,719,229 |
| Seagate Technology LLC | | 188,041 | 10,041,389 |
| Western Digital Corp. | | 243,405 | 21,185,971 |
| Xerox Corp. | | 160,869 | 4,877,548 |
| | | | 324,546,036 |
| TOTAL COMMON STOCKS | | | |
| (Cost $298,397,255) | | | 531,675,543 |
|
| Money Market Funds - 0.7% | | | |
| Fidelity Cash Central Fund, 1.41% (b) | | | |
| (Cost $4,095,189) | | 4,094,370 | 4,095,189 |
| TOTAL INVESTMENT IN SECURITIES - 99.5% | | | |
| (Cost $302,492,444) | | | 535,770,732 |
| NET OTHER ASSETS (LIABILITIES) - 0.5% | | | 2,560,778 |
| NET ASSETS - 100% | | | $538,331,510 |
Legend
(a) Non-income producing
(b) Affiliated fund that is generally available only to investment companies and other accounts managed by Fidelity Investments. The rate quoted is the annualized seven-day yield of the fund at period end. A complete unaudited listing of the fund's holdings as of its most recent quarter end is available upon request. In addition, each Fidelity Central Fund's financial statements, which are not covered by the Fund's Report of Independent Registered Public Accounting Firm, are available on the SEC's website or upon request.
Affiliated Central Funds
Information regarding fiscal year to date income earned by the Fund from investments in Fidelity Central Funds is as follows:
| Fund | Income earned |
| Fidelity Cash Central Fund | $59,398 |
| Fidelity Securities Lending Cash Central Fund | 67,396 |
| Total | $126,794 |
Amounts in the income column in the above table include any capital gain distributions from underlying funds, which are presented in the corresponding line-item in the Statement of Operations if applicable.
Investment Valuation
The following is a summary of the inputs used, as of February 28, 2018, involving the Fund's assets and liabilities carried at fair value. The inputs or methodology used for valuing securities may not be an indication of the risk associated with investing in those securities. For more information on valuation inputs, and their aggregation into the levels used below, please refer to the Investment Valuation section in the accompanying Notes to Financial Statements.
| | Valuation Inputs at Reporting Date: |
| Description | Total | Level 1 | Level 2 | Level 3 |
| Investments in Securities: | | | | |
| Common Stocks | $531,675,543 | $359,098,822 | $172,576,721 | $-- |
| Money Market Funds | 4,095,189 | 4,095,189 | -- | -- |
| Total Investments in Securities: | $535,770,732 | $363,194,011 | $172,576,721 | $-- |
The following is a summary of transfers between Level 1 and Level 2 for the period ended February 28, 2018. Transfers are assumed to have occurred at the beginning of the period, and are primarily attributable to the valuation techniques used for foreign equity securities, as discussed in the accompanying Notes to Financial Statements:
| Transfers | Total |
| Level 1 to Level 2 | $18,921,805 |
| Level 2 to Level 1 | $0 |
Other Information
Distribution of investments by country or territory of incorporation, as a percentage of Total Net Assets, is as follows (Unaudited):
| United States of America | 62.5% |
| Japan | 15.8% |
| Korea (South) | 12.2% |
| Taiwan | 3.8% |
| Ireland | 1.9% |
| Israel | 1.8% |
| Netherlands | 1.8% |
| Others (Individually Less Than 1%) | 0.2% |
| | 100.0% |
See accompanying notes which are an integral part of the financial statements.
Computers Portfolio
Financial Statements
Statement of Assets and Liabilities
| | | February 28, 2018 |
| Assets | | |
Investment in securities, at value — See accompanying schedule:
Unaffiliated issuers (cost $298,397,255) | $531,675,543 | |
| Fidelity Central Funds (cost $4,095,189) | 4,095,189 | |
| Total Investment in Securities (cost $302,492,444) | | $535,770,732 |
| Receivable for investments sold | | 2,421,285 |
| Receivable for fund shares sold | | 186,785 |
| Dividends receivable | | 706,633 |
| Distributions receivable from Fidelity Central Funds | | 6,541 |
| Prepaid expenses | | 1,736 |
| Other receivables | | 198,549 |
| Total assets | | 539,292,261 |
| Liabilities | | |
| Payable for fund shares redeemed | $531,896 | |
| Accrued management fee | 236,143 | |
| Transfer agent fee payable | 74,309 | |
| Other affiliated payables | 16,778 | |
| Other payables and accrued expenses | 101,625 | |
| Total liabilities | | 960,751 |
| Net Assets | | $538,331,510 |
| Net Assets consist of: | | |
| Paid in capital | | $304,444,189 |
| Distributions in excess of net investment income | | (40,577) |
| Accumulated undistributed net realized gain (loss) on investments and foreign currency transactions | | 740,886 |
| Net unrealized appreciation (depreciation) on investments and assets and liabilities in foreign currencies | | 233,187,012 |
| Net Assets, for 5,800,568 shares outstanding | | $538,331,510 |
| Net Asset Value, offering price and redemption price per share ($538,331,510 ÷ 5,800,568 shares) | | $92.81 |
See accompanying notes which are an integral part of the financial statements.
Statement of Operations
| | | Year ended February 28, 2018 |
| Investment Income | | |
| Dividends | | $8,431,042 |
| Income from Fidelity Central Funds (including $67,396 from security lending) | | 126,794 |
| Income before foreign taxes withheld | | 8,557,836 |
| Less foreign taxes withheld | | (478,161) |
| Total income | | 8,079,675 |
| Expenses | | |
| Management fee | $2,882,232 | |
| Transfer agent fees | 928,794 | |
| Accounting and security lending fees | 204,970 | |
| Custodian fees and expenses | 42,971 | |
| Independent trustees' fees and expenses | 11,391 | |
| Registration fees | 37,933 | |
| Audit | 41,606 | |
| Legal | 6,250 | |
| Interest | 4,973 | |
| Miscellaneous | 20,979 | |
| Total expenses before reductions | 4,182,099 | |
| Expense reductions | (58,006) | 4,124,093 |
| Net investment income (loss) | | 3,955,582 |
| Realized and Unrealized Gain (Loss) | | |
| Net realized gain (loss) on: | | |
| Investment securities: | | |
| Unaffiliated issuers | 45,092,567 | |
| Fidelity Central Funds | (1,342) | |
| Foreign currency transactions | (40,921) | |
| Total net realized gain (loss) | | 45,050,304 |
| Change in net unrealized appreciation (depreciation) on: | | |
| Investment securities: | | |
| Unaffiliated issuers | 66,097,082 | |
| Fidelity Central Funds | (682) | |
| Assets and liabilities in foreign currencies | 1,965 | |
| Total change in net unrealized appreciation (depreciation) | | 66,098,365 |
| Net gain (loss) | | 111,148,669 |
| Net increase (decrease) in net assets resulting from operations | | $115,104,251 |
See accompanying notes which are an integral part of the financial statements.
Statement of Changes in Net Assets
| | Year ended February 28, 2018 | Year ended February 28, 2017 |
| Increase (Decrease) in Net Assets | | |
| Operations | | |
| Net investment income (loss) | $3,955,582 | $4,166,033 |
| Net realized gain (loss) | 45,050,304 | 38,339,496 |
| Change in net unrealized appreciation (depreciation) | 66,098,365 | 99,919,551 |
| Net increase (decrease) in net assets resulting from operations | 115,104,251 | 142,425,080 |
| Distributions to shareholders from net investment income | (4,051,079) | (4,760,421) |
| Distributions to shareholders from net realized gain | (53,152,316) | (21,241,452) |
| Total distributions | (57,203,395) | (26,001,873) |
| Share transactions | | |
| Proceeds from sales of shares | 135,247,709 | 69,348,882 |
| Reinvestment of distributions | 54,503,094 | 24,823,963 |
| Cost of shares redeemed | (182,074,270) | (126,405,898) |
| Net increase (decrease) in net assets resulting from share transactions | 7,676,533 | (32,233,053) |
| Redemption fees | 8,857 | 1,604 |
| Total increase (decrease) in net assets | 65,586,246 | 84,191,758 |
| Net Assets | | |
| Beginning of period | 472,745,264 | 388,553,506 |
| End of period | $538,331,510 | $472,745,264 |
| Other Information | | |
| Undistributed net investment income end of period | $– | $95,841 |
| Distributions in excess of net investment income end of period | $(40,577) | $– |
| Shares | | |
| Sold | 1,547,276 | 914,204 |
| Issued in reinvestment of distributions | 617,683 | 331,793 |
| Redeemed | (2,059,450) | (1,771,351) |
| Net increase (decrease) | 105,509 | (525,354) |
See accompanying notes which are an integral part of the financial statements.
Financial Highlights
Computers Portfolio
| | | | | | |
| Years ended February 28, | 2018 | 2017 | 2016 A | 2015 | 2014 |
| Selected Per–Share Data | | | | | |
| Net asset value, beginning of period | $83.01 | $62.46 | $83.28 | $75.46 | $64.51 |
| Income from Investment Operations | | | | | |
| Net investment income (loss)B | .67 | .73 | .69 | .45 | .59 |
| Net realized and unrealized gain (loss) | 19.24 | 24.69 | (18.42) | 9.61 | 15.76 |
| Total from investment operations | 19.91 | 25.42 | (17.73) | 10.06 | 16.35 |
| Distributions from net investment income | (.73)C | (.88) | (.80) | (.47) | (.53) |
| Distributions from net realized gain | (9.38)C | (4.00) | (2.29) | (1.77) | (4.87) |
| Total distributions | (10.11) | (4.87)D | (3.09) | (2.24) | (5.40) |
| Redemption fees added to paid in capitalB,E | – | – | – | – | – |
| Net asset value, end of period | $92.81 | $83.01 | $62.46 | $83.28 | $75.46 |
| Total ReturnF | 24.82% | 41.57% | (21.56)% | 13.36% | 27.13% |
| Ratios to Average Net AssetsG,H | | | | | |
| Expenses before reductions | .79% | .81% | .80% | .80% | .82% |
| Expenses net of fee waivers, if any | .79% | .81% | .80% | .80% | .82% |
| Expenses net of all reductions | .78% | .81% | .79% | .80% | .82% |
| Net investment income (loss) | .75% | 1.01% | .91% | .57% | .86% |
| Supplemental Data | | | | | |
| Net assets, end of period (000 omitted) | $538,332 | $472,745 | $388,554 | $808,852 | $679,323 |
| Portfolio turnover rateI | 57% | 49% | 31% | 46% | 35% |
A For the year ended February 29.
B Calculated based on average shares outstanding during the period.
C The amounts shown reflect certain reclassifications related to book to tax differences that were made in the year shown.
D Total distributions of $4.87 per share is comprised of distributions from net investment income of $.879 and distributions from net realized gain of $3.995 per share.
E Amount represents less than $.005 per share.
F Total returns would have been lower if certain expenses had not been reduced during the applicable periods shown.
G Fees and expenses of any underlying Fidelity Central Funds are not included in the Fund's expense ratio. The Fund indirectly bears its proportionate share of the expenses of any underlying Fidelity Central Funds.
H Expense ratios reflect operating expenses of the Fund. Expenses before reductions do not reflect amounts reimbursed by the investment adviser or reductions from brokerage service arrangements or reductions from other expense offset arrangements and do not represent the amount paid by the Fund during periods when reimbursements or reductions occur. Expenses net of fee waivers reflect expenses after reimbursement by the investment adviser but prior to reductions from brokerage service arrangements or other expense offset arrangements. Expenses net of all reductions represent the net expenses paid by the Fund.
I Amount does not include the portfolio activity of any underlying Fidelity Central Funds.
See accompanying notes which are an integral part of the financial statements.
IT Services Portfolio
Performance: The Bottom Line
Average annual total return reflects the change in the value of an investment, assuming reinvestment of distributions from dividend income and capital gains (the profits earned upon the sale of securities that have grown in value, if any) and assuming a constant rate of performance each year. The hypothetical investment and the average annual total returns do not reflect the deduction of taxes that a shareholder would pay on fund distributions or the redemption of fund shares. During periods of reimbursement by Fidelity, a fund’s total return will be greater than it would be had the reimbursement not occurred. How a fund did yesterday is no guarantee of how it will do tomorrow.
Average Annual Total Returns
| For the periods ended February 28, 2018 | Past 1 year | Past 5 years | Past 10 years |
| IT Services Portfolio | 35.17% | 20.70% | 17.24% |
$10,000 Over 10 Years
Let's say hypothetically that $10,000 was invested in IT Services Portfolio on February 29, 2008.
The chart shows how the value of your investment would have changed, and also shows how the S&P 500® Index performed over the same period.
| Period Ending Values |
| $49,062 | IT Services Portfolio |
| $25,307 | S&P 500® Index |
IT Services Portfolio
Management's Discussion of Fund Performance
Market Recap: U.S. equities gained 17.10% for the 12 months ending February 28, 2018, as the S&P 500
® index moved steadily higher throughout 2017 and into 2018 until sharply reversing course in February. The drop was in stark contrast to the low volatility seen throughout 2017, along with consumer sentiment and other market indicators that stayed positive. Investors remained decidedly upbeat as the calendar turned, and the index rose 5.73% in January. February was a decidedly different story, though, as volatility spiked amid fear that rising inflation and the potential for the economy to overheat would prompt the U.S. Federal Reserve to pick up the pace of interest rate hikes. The index returned -3.69% for the month, its first negative result since October 2016. For the full 12 months, growth stocks handily topped value, while large-caps bested small-caps. By sector, information technology fared best by far, gaining 36% amid strong earnings growth from several major index constituents. Consumer discretionary (+22%) also stood out, driven by retailers. Financials added 20%, riding the uptick in bond yields. Materials and industrials rose about 16% each, boosted by higher demand, especially from China. Conversely, notable laggards included the defensive telecommunication services (-5%) and utilities (-2%) sectors, while rising rates held back real estate (-3%).
Comments from Portfolio Manager Daniel Sherwood: For the year, the fund gained 35.17%, considerably outpacing the 28.25% return of the MSCI U.S. IMI Information Technology Services 25/50 Index, and more than doubling the S&P 500
®. Versus the MSCI index, stock selection in IT consulting & other services – especially a large underweighting in weak-performing index constituent IBM, by far the fund's top relative contributor – bolstered fund performance, as did picks in data processing & outsourced services. With that said, I increased the fund’s share count in IBM this period, and it remains one of our largest holdings. Other relative contributors included a non-index position in web services company GoDaddy and a large overweighting in IT outsourcing provider EPAM Systems. Conversely, a non-index stake in software engineering firm Luxoft Holding was the fund’s largest relative detractor by a wide margin, as disappointing quarterly earnings results weighed on the stock. An overweighting in private-label card services provider Alliance Data Systems, another key detractor, also proved untimely. In a difficult environment for retailers, Alliance Data's stock was pressured, in my view, by investors' perception of it as a consumer retail stock, while ignoring the value in its digital marketing operations.
The views expressed above reflect those of the portfolio manager(s) only through the end of the period as stated on the cover of this report and do not necessarily represent the views of Fidelity or any other person in the Fidelity organization. Any such views are subject to change at any time based upon market or other conditions and Fidelity disclaims any responsibility to update such views. These views may not be relied on as investment advice and, because investment decisions for a Fidelity fund are based on numerous factors, may not be relied on as an indication of trading intent on behalf of any Fidelity fund.
Note to shareholders: On December 8, 2017, shareholders approved proposals from the Board of Trustees to eliminate each sector/industry fund's fundamental “invests primarily” policy and to modify the fundamental concentration policy for certain funds. The changes took effect on January 1, 2018, and do not impact how the funds are managed.
IT Services Portfolio
Investment Summary (Unaudited)
Top Ten Stocks as of February 28, 2018
| | % of fund's net assets |
| Visa, Inc. Class A | 17.9 |
| MasterCard, Inc. Class A | 13.2 |
| Cognizant Technology Solutions Corp. Class A | 8.4 |
| PayPal Holdings, Inc. | 6.2 |
| Accenture PLC Class A | 4.7 |
| IBM Corp. | 4.4 |
| GoDaddy, Inc. | 3.1 |
| EPAM Systems, Inc. | 3.0 |
| Worldpay, Inc. | 2.9 |
| FleetCor Technologies, Inc. | 2.9 |
| | 66.7 |
Top Industries (% of fund's net assets)
| As of February 28, 2018 |
| | IT Services | 89.1% |
| | Software | 4.8% |
| | Internet Software & Services | 4.4% |
| | Professional Services | 0.7% |
| | Electronic Equipment & Components | 0.4% |
| | All Others* | 0.6% |

* Includes short-term investments and net other assets (liabilities).
IT Services Portfolio
Schedule of Investments February 28, 2018
Showing Percentage of Net Assets
| Common Stocks - 99.4% | | | |
| | | Shares | Value |
| Electronic Equipment & Components - 0.4% | | | |
| Electronic Manufacturing Services - 0.4% | | | |
| Cardtronics PLC (a) | | 355,400 | $7,953,852 |
| Internet Software & Services - 4.4% | | | |
| Internet Software & Services - 4.4% | | | |
| Endurance International Group Holdings, Inc. (a) | | 1,297,058 | 9,468,523 |
| GoDaddy, Inc. (a) | | 1,196,727 | 71,576,242 |
| Wix.com Ltd. (a) | | 273,017 | 20,489,926 |
| | | | 101,534,691 |
| IT Services - 89.1% | | | |
| Data Processing & Outsourced Services - 58.9% | | | |
| Alliance Data Systems Corp. | | 265,848 | 64,058,734 |
| Amadeus IT Holding SA Class A | | 800 | 58,733 |
| Automatic Data Processing, Inc. | | 152,700 | 17,609,364 |
| Convergys Corp. | | 8,200 | 190,322 |
| CoreLogic, Inc. (a) | | 2,700 | 122,850 |
| DST Systems, Inc. | | 400 | 33,268 |
| Euronet Worldwide, Inc. (a) | | 173,000 | 14,682,510 |
| EVERTEC, Inc. | | 13,800 | 223,560 |
| ExlService Holdings, Inc. (a) | | 51,770 | 2,951,925 |
| Fidelity National Information Services, Inc. | | 615,200 | 59,785,136 |
| First Data Corp. Class A (a) | | 1,770,600 | 27,656,772 |
| Fiserv, Inc. (a) | | 200,800 | 28,792,712 |
| FleetCor Technologies, Inc. (a) | | 329,000 | 65,776,970 |
| Genpact Ltd. | | 752,200 | 23,596,514 |
| Global Payments, Inc. | | 275,481 | 31,236,791 |
| Jack Henry & Associates, Inc. | | 1,600 | 187,680 |
| MasterCard, Inc. Class A | | 1,718,200 | 301,990,832 |
| Paychex, Inc. | | 134,600 | 8,766,498 |
| PayPal Holdings, Inc. (a) | | 1,775,900 | 141,024,219 |
| Syntel, Inc. (a) | | 7,700 | 206,745 |
| The Western Union Co. | | 5,000 | 99,100 |
| Total System Services, Inc. | | 293,400 | 25,804,530 |
| Travelport Worldwide Ltd. | | 405,824 | 5,782,992 |
| Ttec Holdings, Inc. | | 2,000 | 71,300 |
| Visa, Inc. Class A | | 3,333,348 | 409,801,801 |
| WEX, Inc. (a) | | 29,300 | 4,381,815 |
| WNS Holdings Ltd. sponsored ADR (a) | | 973,092 | 43,789,140 |
| Worldpay, Inc. (a) | | 826,000 | 67,137,280 |
| | | | 1,345,820,093 |
| IT Consulting & Other Services - 30.2% | | | |
| Accenture PLC Class A | | 668,780 | 107,680,268 |
| Acxiom Corp. (a) | | 6,100 | 166,957 |
| Booz Allen Hamilton Holding Corp. Class A | | 1,083,700 | 41,104,741 |
| Capgemini SA | | 320,800 | 39,986,217 |
| Cognizant Technology Solutions Corp. Class A | | 2,337,332 | 191,707,971 |
| DXC Technology Co. | | 495,300 | 50,788,062 |
| EPAM Systems, Inc. (a) | | 612,600 | 69,297,312 |
| IBM Corp. | | 642,250 | 100,081,818 |
| Leidos Holdings, Inc. | | 128,525 | 8,136,918 |
| Luxoft Holding, Inc. (a) | | 792,392 | 34,191,715 |
| Science Applications International Corp. | | 800 | 57,912 |
| Teradata Corp. (a) | | 3,500 | 128,870 |
| Virtusa Corp. (a) | | 962,151 | 45,913,846 |
| | | | 689,242,607 |
|
| TOTAL IT SERVICES | | | 2,035,062,700 |
|
| Professional Services - 0.7% | | | |
| Research & Consulting Services - 0.7% | | | |
| ICF International, Inc. | | 287,311 | 16,376,727 |
| Software - 4.8% | | | |
| Application Software - 4.8% | | | |
| Adobe Systems, Inc. (a) | | 145,969 | 30,526,497 |
| Black Knight, Inc. (a) | | 568,900 | 27,108,085 |
| Globant SA (a)(b) | | 72,471 | 3,774,290 |
| Intuit, Inc. | | 282,900 | 47,204,694 |
| | | | 108,613,566 |
| TOTAL COMMON STOCKS | | | |
| (Cost $1,270,308,972) | | | 2,269,541,536 |
|
| Money Market Funds - 1.1% | | | |
| Fidelity Cash Central Fund, 1.41% (c) | | 22,671,394 | 22,675,928 |
| Fidelity Securities Lending Cash Central Fund 1.42% (c)(d) | | 2,521,609 | 2,521,861 |
| TOTAL MONEY MARKET FUNDS | | | |
| (Cost $25,197,789) | | | 25,197,789 |
| TOTAL INVESTMENT IN SECURITIES - 100.5% | | | |
| (Cost $1,295,506,761) | | | 2,294,739,325 |
| NET OTHER ASSETS (LIABILITIES) - (0.5)% | | | (10,587,623) |
| NET ASSETS - 100% | | | $2,284,151,702 |
Legend
(a) Non-income producing
(b) Security or a portion of the security is on loan at period end.
(c) Affiliated fund that is generally available only to investment companies and other accounts managed by Fidelity Investments. The rate quoted is the annualized seven-day yield of the fund at period end. A complete unaudited listing of the fund's holdings as of its most recent quarter end is available upon request. In addition, each Fidelity Central Fund's financial statements, which are not covered by the Fund's Report of Independent Registered Public Accounting Firm, are available on the SEC's website or upon request.
(d) Investment made with cash collateral received from securities on loan.
Affiliated Central Funds
Information regarding fiscal year to date income earned by the Fund from investments in Fidelity Central Funds is as follows:
| Fund | Income earned |
| Fidelity Cash Central Fund | $162,976 |
| Fidelity Securities Lending Cash Central Fund | 36,326 |
| Total | $199,302 |
Amounts in the income column in the above table include any capital gain distributions from underlying funds, which are presented in the corresponding line-item in the Statement of Operations if applicable.
Investment Valuation
The following is a summary of the inputs used, as of February 28, 2018, involving the Fund's assets and liabilities carried at fair value. The inputs or methodology used for valuing securities may not be an indication of the risk associated with investing in those securities. For more information on valuation inputs, and their aggregation into the levels used below, please refer to the Investment Valuation section in the accompanying Notes to Financial Statements.
| | Valuation Inputs at Reporting Date: |
| Description | Total | Level 1 | Level 2 | Level 3 |
| Investments in Securities: | | | | |
| Common Stocks | $2,269,541,536 | $2,229,496,586 | $40,044,950 | $-- |
| Money Market Funds | 25,197,789 | 25,197,789 | -- | -- |
| Total Investments in Securities: | $2,294,739,325 | $2,254,694,375 | $40,044,950 | $-- |
Other Information
Distribution of investments by country or territory of incorporation, as a percentage of Total Net Assets, is as follows (Unaudited):
| United States of America | 87.3% |
| Ireland | 4.7% |
| Bailiwick of Jersey | 1.9% |
| France | 1.8% |
| British Virgin Islands | 1.5% |
| Bermuda | 1.3% |
| Others (Individually Less Than 1%) | 1.5% |
| | 100.0% |
See accompanying notes which are an integral part of the financial statements.
IT Services Portfolio
Financial Statements
Statement of Assets and Liabilities
| | | February 28, 2018 |
| Assets | | |
Investment in securities, at value (including securities loaned of $2,486,976) — See accompanying schedule:
Unaffiliated issuers (cost $1,270,308,972) | $2,269,541,536 | |
| Fidelity Central Funds (cost $25,197,789) | 25,197,789 | |
| Total Investment in Securities (cost $1,295,506,761) | | $2,294,739,325 |
| Receivable for investments sold | | 3,698,670 |
| Receivable for fund shares sold | | 3,500,015 |
| Dividends receivable | | 1,857,587 |
| Distributions receivable from Fidelity Central Funds | | 20,013 |
| Prepaid expenses | | 5,910 |
| Other receivables | | 28,323 |
| Total assets | | 2,303,849,843 |
| Liabilities | | |
| Payable for investments purchased | $14,094,065 | |
| Payable for fund shares redeemed | 1,635,350 | |
| Accrued management fee | 1,004,046 | |
| Other affiliated payables | 359,149 | |
| Other payables and accrued expenses | 86,560 | |
| Collateral on securities loaned | 2,518,971 | |
| Total liabilities | | 19,698,141 |
| Net Assets | | $2,284,151,702 |
| Net Assets consist of: | | |
| Paid in capital | | $1,251,357,583 |
| Undistributed net investment income | | 388,251 |
| Accumulated undistributed net realized gain (loss) on investments and foreign currency transactions | | 33,180,638 |
| Net unrealized appreciation (depreciation) on investments and assets and liabilities in foreign currencies | | 999,225,230 |
| Net Assets, for 38,918,870 shares outstanding | | $2,284,151,702 |
| Net Asset Value, offering price and redemption price per share ($2,284,151,702 ÷ 38,918,870 shares) | | $58.69 |
See accompanying notes which are an integral part of the financial statements.
Statement of Operations
| | | Year ended February 28, 2018 |
| Investment Income | | |
| Dividends | | $15,704,362 |
| Income from Fidelity Central Funds (including $36,326 from security lending) | | 199,302 |
| Total income | | 15,903,664 |
| Expenses | | |
| Management fee | $10,268,051 | |
| Transfer agent fees | 3,392,398 | |
| Accounting and security lending fees | 580,815 | |
| Custodian fees and expenses | 23,025 | |
| Independent trustees' fees and expenses | 39,522 | |
| Registration fees | 63,193 | |
| Audit | 47,986 | |
| Legal | 22,283 | |
| Miscellaneous | 79,497 | |
| Total expenses before reductions | 14,516,770 | |
| Expense reductions | (47,704) | 14,469,066 |
| Net investment income (loss) | | 1,434,598 |
| Realized and Unrealized Gain (Loss) | | |
| Net realized gain (loss) on: | | |
| Investment securities: | | |
| Unaffiliated issuers | 90,664,616 | |
| Fidelity Central Funds | 269 | |
| Foreign currency transactions | (19,430) | |
| Total net realized gain (loss) | | 90,645,455 |
| Change in net unrealized appreciation (depreciation) on: | | |
| Investment securities: | | |
| Unaffiliated issuers | 484,747,522 | |
| Fidelity Central Funds | (2,680) | |
| Assets and liabilities in foreign currencies | 449 | |
| Total change in net unrealized appreciation (depreciation) | | 484,745,291 |
| Net gain (loss) | | 575,390,746 |
| Net increase (decrease) in net assets resulting from operations | | $576,825,344 |
See accompanying notes which are an integral part of the financial statements.
Statement of Changes in Net Assets
| | Year ended February 28, 2018 | Year ended February 28, 2017 |
| Increase (Decrease) in Net Assets | | |
| Operations | | |
| Net investment income (loss) | $1,434,598 | $6,007,288 |
| Net realized gain (loss) | 90,645,455 | 44,116,665 |
| Change in net unrealized appreciation (depreciation) | 484,745,291 | 293,487,758 |
| Net increase (decrease) in net assets resulting from operations | 576,825,344 | 343,611,711 |
| Distributions to shareholders from net investment income | (863,213) | (5,197,978) |
| Distributions to shareholders from net realized gain | (62,255,457) | – |
| Total distributions | (63,118,670) | (5,197,978) |
| Share transactions | | |
| Proceeds from sales of shares | 451,323,420 | 375,114,434 |
| Reinvestment of distributions | 60,224,569 | 4,954,736 |
| Cost of shares redeemed | (404,904,553) | (948,883,745) |
| Net increase (decrease) in net assets resulting from share transactions | 106,643,436 | (568,814,575) |
| Redemption fees | – | 27,362 |
| Total increase (decrease) in net assets | 620,350,110 | (230,373,480) |
| Net Assets | | |
| Beginning of period | 1,663,801,592 | 1,894,175,072 |
| End of period | $2,284,151,702 | $1,663,801,592 |
| Other Information | | |
| Undistributed net investment income end of period | $388,251 | $– |
| Accumulated net investment loss end of period | $– | $(93,249) |
| Shares | | |
| Sold | 8,580,519 | 9,254,539 |
| Issued in reinvestment of distributions | 1,157,339 | 117,858 |
| Redeemed | (7,927,102) | (23,235,605) |
| Net increase (decrease) | 1,810,756 | (13,863,208) |
See accompanying notes which are an integral part of the financial statements.
Financial Highlights
IT Services Portfolio
| | | | | | |
| Years ended February 28, | 2018 | 2017 | 2016 A | 2015 | 2014 |
| Selected Per–Share Data | | | | | |
| Net asset value, beginning of period | $44.84 | $37.16 | $38.88 | $37.86 | $27.53 |
| Income from Investment Operations | | | | | |
| Net investment income (loss)B | .04 | .13C | (.02) | (.03) | (.03) |
| Net realized and unrealized gain (loss) | 15.50 | 7.68 | (.15) | 4.06 | 11.42 |
| Total from investment operations | 15.54 | 7.81 | (.17) | 4.03 | 11.39 |
| Distributions from net investment income | (.02) | (.13) | – | (.01) | – |
| Distributions from net realized gain | (1.67) | – | (1.55) | (3.01) | (1.06) |
| Total distributions | (1.69) | (.13) | (1.55) | (3.01)D | (1.06) |
| Redemption fees added to paid in capitalB | – | –E | –E | –E | –E |
| Net asset value, end of period | $58.69 | $44.84 | $37.16 | $38.88 | $37.86 |
| Total ReturnF | 35.17% | 21.05% | (.59)% | 11.16% | 41.66% |
| Ratios to Average Net AssetsG,H | | | | | |
| Expenses before reductions | .77% | .79% | .81% | .81% | .84% |
| Expenses net of fee waivers, if any | .77% | .79% | .81% | .81% | .84% |
| Expenses net of all reductions | .77% | .79% | .80% | .81% | .83% |
| Net investment income (loss) | .08% | .33%C | (.06)% | (.07)% | (.09)% |
| Supplemental Data | | | | | |
| Net assets, end of period (000 omitted) | $2,284,152 | $1,663,802 | $1,894,175 | $941,998 | $1,653,572 |
| Portfolio turnover rateI | 26% | 27% | 24% | 56% | 74% |
A For the year ended February 29.
B Calculated based on average shares outstanding during the period.
C Net Investment income per share reflects a large, non-recurring dividend which amounted to $.13 per share. Excluding this non-recurring dividend, the ratio of net investment income (loss) to average net assets would have been .02%.
D Total distributions of $3.01 per share is comprised of distributions from net investment income of $.005 and distributions from net realized gain of $3.009 per share.
E Amount represents less than $.005 per share.
F Total returns would have been lower if certain expenses had not been reduced during the applicable periods shown.
G Fees and expenses of any underlying Fidelity Central Funds are not included in the Fund's expense ratio. The Fund indirectly bears its proportionate share of the expenses of any underlying Fidelity Central Funds.
H Expense ratios reflect operating expenses of the Fund. Expenses before reductions do not reflect amounts reimbursed by the investment adviser or reductions from brokerage service arrangements or reductions from other expense offset arrangements and do not represent the amount paid by the Fund during periods when reimbursements or reductions occur. Expenses net of fee waivers reflect expenses after reimbursement by the investment adviser but prior to reductions from brokerage service arrangements or other expense offset arrangements. Expenses net of all reductions represent the net expenses paid by the Fund.
I Amount does not include the portfolio activity of any underlying Fidelity Central Funds.
See accompanying notes which are an integral part of the financial statements.
Semiconductors Portfolio
Performance: The Bottom Line
Average annual total return reflects the change in the value of an investment, assuming reinvestment of distributions from dividend income and capital gains (the profits earned upon the sale of securities that have grown in value, if any) and assuming a constant rate of performance each year. The hypothetical investment and the average annual total returns do not reflect the deduction of taxes that a shareholder would pay on fund distributions or the redemption of fund shares. During periods of reimbursement by Fidelity, a fund’s total return will be greater than it would be had the reimbursement not occurred. How a fund did yesterday is no guarantee of how it will do tomorrow.
Average Annual Total Returns
| For the periods ended February 28, 2018 | Past 1 year | Past 5 years | Past 10 years |
| Semiconductors Portfolio | 34.20% | 27.71% | 16.67% |
$10,000 Over 10 Years
Let's say hypothetically that $10,000 was invested in Semiconductors Portfolio on February 29, 2008.
The chart shows how the value of your investment would have changed, and also shows how the S&P 500® Index performed over the same period.
| Period Ending Values |
| $46,715 | Semiconductors Portfolio |
| $25,307 | S&P 500® Index |
Semiconductors Portfolio
Management's Discussion of Fund Performance
Market Recap: U.S. equities gained 17.10% for the 12 months ending February 28, 2018, as the S&P 500
® index moved steadily higher throughout 2017 and into 2018 until sharply reversing course in February. The drop was in stark contrast to the low volatility seen throughout 2017, along with consumer sentiment and other market indicators that stayed positive. Investors remained decidedly upbeat as the calendar turned, and the index rose 5.73% in January. February was a decidedly different story, though, as volatility spiked amid fear that rising inflation and the potential for the economy to overheat would prompt the U.S. Federal Reserve to pick up the pace of interest rate hikes. The index returned -3.69% for the month, its first negative result since October 2016. For the full 12 months, growth stocks handily topped value, while large-caps bested small-caps. By sector, information technology fared best by far, gaining 36% amid strong earnings growth from several major index constituents. Consumer discretionary (+22%) also stood out, driven by retailers. Financials added 20%, riding the uptick in bond yields. Materials and industrials rose about 16% each, boosted by higher demand, especially from China. Conversely, notable laggards included the defensive telecommunication services (-5%) and utilities (-2%) sectors, while rising rates held back real estate (-3%).
Comments from Portfolio Manager Stephen Barwikowski: For the year, the fund gained 34.20%, trailing the 36.84% return of the MSCI U.S. IMI Semiconductors & Semiconductor Equipment 25/50 Index, but exactly doubling the S&P 500
®. Versus the MSCI index, a cash position averaging roughly 4% of assets was by far the biggest detractor. Exposure to technology distributors and to a number of other out-of-index groups also hindered relative results. At the stock level, underweighting strong-performing graphics chipmaker Nvidia was the largest detractor from relative performance. Macom Technology Solutions Holdings, a stock I bought for the fund beginning in October, also detracted, as did a sizable non-MSCI-index position in semiconductor distributor Avnet and an overweighting in Inphi, a seller of optical components and data-transmission semiconductors that I bought in May. Conversely, stock picking in the fund’s core semiconductors segment added value. An overweighting in strong-performing Micron Technology proved to be the fund’s top relative contributor. Mostly avoiding weak-performing index name Advanced Micro Devices also helped, as did an overweighting in ON Semiconductor.
The views expressed above reflect those of the portfolio manager(s) only through the end of the period as stated on the cover of this report and do not necessarily represent the views of Fidelity or any other person in the Fidelity organization. Any such views are subject to change at any time based upon market or other conditions and Fidelity disclaims any responsibility to update such views. These views may not be relied on as investment advice and, because investment decisions for a Fidelity fund are based on numerous factors, may not be relied on as an indication of trading intent on behalf of any Fidelity fund.
Note to shareholders: On December 8, 2017, shareholders approved proposals from the Board of Trustees to eliminate each sector/industry fund's fundamental “invests primarily” policy and to modify the fundamental concentration policy for certain funds. Additionally, Select Semiconductors Portfolio modified its name-test policy to better reflect the fund’s investment focus on manufacturers of semiconductors and related products and of semiconductor equipment. The changes took effect on January 1, 2018.
Semiconductors Portfolio
Investment Summary (Unaudited)
Top Ten Stocks as of February 28, 2018
| | % of fund's net assets |
| Intel Corp. | 20.2 |
| Broadcom Ltd. | 9.2 |
| Qualcomm, Inc. | 7.9 |
| Analog Devices, Inc. | 7.2 |
| NVIDIA Corp. | 5.2 |
| Micron Technology, Inc. | 5.0 |
| Marvell Technology Group Ltd. | 4.9 |
| Microchip Technology, Inc. | 3.6 |
| Cavium, Inc. | 3.6 |
| Samsung Electronics Co. Ltd. | 2.9 |
| | 69.7 |
Top Industries (% of fund's net assets)
| As of February 28, 2018 |
| | Semiconductors & Semiconductor Equipment | 86.8% |
| | Technology Hardware, Storage & Peripherals | 4.0% |
| | Electronic Equipment & Components | 3.5% |
| | Communications Equipment | 1.7% |
| | Internet Software & Services | 0.8% |
| | All Others* | 3.2% |

* Includes short-term investments and net other assets (liabilities).
Semiconductors Portfolio
Schedule of Investments February 28, 2018
Showing Percentage of Net Assets
| Common Stocks - 96.8% | | | |
| | | Shares | Value |
| Communications Equipment - 1.7% | | | |
| Communications Equipment - 1.7% | | | |
| Finisar Corp. (a) | | 818,900 | $14,740,200 |
| Quantenna Communications, Inc. (a)(b) | | 3,522,095 | 48,428,806 |
| | | | 63,169,006 |
| Electronic Equipment & Components - 3.5% | | | |
| Electronic Manufacturing Services - 2.6% | | | |
| Flextronics International Ltd. (a) | | 417,600 | 7,558,560 |
| Jabil, Inc. | | 1,772,237 | 48,009,900 |
| TTM Technologies, Inc. (a) | | 2,414,298 | 39,015,056 |
| | | | 94,583,516 |
| Technology Distributors - 0.9% | | | |
| Avnet, Inc. | | 768,100 | 32,797,870 |
|
| TOTAL ELECTRONIC EQUIPMENT & COMPONENTS | | | 127,381,386 |
|
| Internet Software & Services - 0.8% | | | |
| Internet Software & Services - 0.8% | | | |
| Alphabet, Inc. Class A (a) | | 25,200 | 27,818,784 |
| Semiconductors & Semiconductor Equipment - 86.8% | | | |
| Semiconductor Equipment - 2.9% | | | |
| Amkor Technology, Inc. (a) | | 482,000 | 4,844,100 |
| Applied Materials, Inc. | | 452,400 | 26,053,716 |
| Experi Corp. | | 661,800 | 14,592,690 |
| Lam Research Corp. | | 192,373 | 36,908,684 |
| PDF Solutions, Inc. (a) | | 816,320 | 9,093,805 |
| Xcerra Corp. (a) | | 1,383,800 | 13,838,000 |
| | | | 105,330,995 |
| Semiconductors - 83.9% | | | |
| Acacia Communications, Inc. (a)(c) | | 634,800 | 24,566,760 |
| Advanced Micro Devices, Inc. (a)(c) | | 604,800 | 7,324,128 |
| Alpha & Omega Semiconductor Ltd. (a) | | 983,900 | 15,122,543 |
| Analog Devices, Inc. | | 2,918,406 | 263,094,301 |
| Broadcom Ltd. | | 1,359,900 | 335,160,954 |
| Cavium, Inc. (a) | | 1,454,473 | 129,506,276 |
| Cirrus Logic, Inc. (a) | | 736,000 | 32,612,160 |
| Cree, Inc. (a) | | 521,172 | 19,715,937 |
| Cypress Semiconductor Corp. | | 1,083,900 | 18,935,733 |
| Inphi Corp. (a)(c) | | 1,549,249 | 42,991,660 |
| Integrated Device Technology, Inc. (a) | | 495,967 | 15,047,639 |
| Intel Corp. | | 14,965,571 | 737,652,994 |
| M/A-COM Technology Solutions Holdings, Inc. (a)(b)(c) | | 3,448,500 | 73,590,990 |
| Marvell Technology Group Ltd. | | 7,620,696 | 179,010,149 |
| Maxim Integrated Products, Inc. | | 800,325 | 48,771,806 |
| MaxLinear, Inc. Class A (a) | | 2,741,331 | 62,310,454 |
| Mellanox Technologies Ltd. (a) | | 201,500 | 13,863,200 |
| Microchip Technology, Inc. | | 1,462,800 | 130,086,804 |
| Micron Technology, Inc. (a) | | 3,713,340 | 181,248,125 |
| NVIDIA Corp. | | 789,592 | 191,081,264 |
| O2Micro International Ltd. sponsored ADR (a) | | 603,500 | 863,005 |
| ON Semiconductor Corp. (a) | | 4,004,646 | 95,791,132 |
| Qorvo, Inc. (a) | | 274,328 | 22,141,013 |
| Qualcomm, Inc. | | 4,413,384 | 286,869,960 |
| Semtech Corp. (a) | | 2,648,325 | 89,116,136 |
| Synaptics, Inc. (a) | | 165,700 | 7,700,079 |
| United Microelectronics Corp. sponsored ADR (c) | | 1,986,700 | 4,787,947 |
| Xilinx, Inc. | | 503,900 | 35,902,875 |
| | | | 3,064,866,024 |
|
| TOTAL SEMICONDUCTORS & SEMICONDUCTOR EQUIPMENT | | | 3,170,197,019 |
|
| Technology Hardware, Storage & Peripherals - 4.0% | | | |
| Technology Hardware, Storage & Peripherals - 4.0% | | | |
| Catcher Technology Co. Ltd. | | 166,000 | 1,959,454 |
| Samsung Electronics Co. Ltd. | | 49,449 | 107,256,020 |
| Super Micro Computer, Inc. (a) | | 875,700 | 15,850,170 |
| Western Digital Corp. | | 260,500 | 22,673,920 |
| | | | 147,739,564 |
| TOTAL COMMON STOCKS | | | |
| (Cost $2,662,319,515) | | | 3,536,305,759 |
|
| Money Market Funds - 5.3% | | | |
| Fidelity Cash Central Fund, 1.41% (d) | | 84,736,915 | 84,753,862 |
| Fidelity Securities Lending Cash Central Fund 1.42% (d)(e) | | 109,737,699 | 109,748,673 |
| TOTAL MONEY MARKET FUNDS | | | |
| (Cost $194,491,808) | | | 194,502,535 |
| TOTAL INVESTMENT IN SECURITIES - 102.1% | | | |
| (Cost $2,856,811,323) | | | 3,730,808,294 |
| NET OTHER ASSETS (LIABILITIES) - (2.1)% | | | (78,242,901) |
| NET ASSETS - 100% | | | $3,652,565,393 |
Legend
(a) Non-income producing
(b) Affiliated company
(c) Security or a portion of the security is on loan at period end.
(d) Affiliated fund that is generally available only to investment companies and other accounts managed by Fidelity Investments. The rate quoted is the annualized seven-day yield of the fund at period end. A complete unaudited listing of the fund's holdings as of its most recent quarter end is available upon request. In addition, each Fidelity Central Fund's financial statements, which are not covered by the Fund's Report of Independent Registered Public Accounting Firm, are available on the SEC's website or upon request.
(e) Investment made with cash collateral received from securities on loan.
Affiliated Central Funds
Information regarding fiscal year to date income earned by the Fund from investments in Fidelity Central Funds is as follows:
| Fund | Income earned |
| Fidelity Cash Central Fund | $1,250,578 |
| Fidelity Securities Lending Cash Central Fund | 2,982,731 |
| Total | $4,233,309 |
Amounts in the income column in the above table include any capital gain distributions from underlying funds, which are presented in the corresponding line-item in the Statement of Operations if applicable.
Other Affiliated Issuers
An affiliated company is a company in which the Fund has ownership of at least 5% of the voting securities. Fiscal year to date transactions with companies which are or were affiliates are as follows:
| Affiliate | Value, beginning of period | Purchases | Sales Proceeds | Dividend Income | Realized Gain (loss) | Change in Unrealized appreciation (depreciation) | Value, end of period |
| M/A-COM Technology Solutions Holdings, Inc. | $-- | $106,919,077 | $6,130,375 | $-- | $(174,915) | $(27,022,797) | $73,590,990 |
| Quantenna Communications, Inc. | -- | 49,356,884 | 1,479,206 | -- | (49,409) | 600,537 | 48,428,806 |
| Total | $-- | $156,275,961 | $7,609,581 | $-- | $(224,324) | $(26,422,260) | $122,019,796 |
Investment Valuation
The following is a summary of the inputs used, as of February 28, 2018, involving the Fund's assets and liabilities carried at fair value. The inputs or methodology used for valuing securities may not be an indication of the risk associated with investing in those securities. For more information on valuation inputs, and their aggregation into the levels used below, please refer to the Investment Valuation section in the accompanying Notes to Financial Statements.
| | Valuation Inputs at Reporting Date: |
| Description | Total | Level 1 | Level 2 | Level 3 |
| Investments in Securities: | | | | |
| Common Stocks | $3,536,305,759 | $3,427,090,285 | $109,215,474 | $-- |
| Money Market Funds | 194,502,535 | 194,502,535 | -- | -- |
| Total Investments in Securities: | $3,730,808,294 | $3,621,592,820 | $109,215,474 | $-- |
Other Information
Distribution of investments by country or territory of incorporation, as a percentage of Total Net Assets, is as follows (Unaudited):
| United States of America | 81.8% |
| Singapore | 9.4% |
| Bermuda | 5.3% |
| Korea (South) | 2.9% |
| Others (Individually Less Than 1%) | 0.6% |
| | 100.0% |
See accompanying notes which are an integral part of the financial statements.
Semiconductors Portfolio
Financial Statements
Statement of Assets and Liabilities
| | | February 28, 2018 |
| Assets | | |
Investment in securities, at value (including securities loaned of $106,083,998) — See accompanying schedule:
Unaffiliated issuers (cost $2,513,877,459) | $3,414,285,963 | |
| Fidelity Central Funds (cost $194,491,808) | 194,502,535 | |
| Other affiliated issuers (cost $148,442,056) | 122,019,796 | |
| Total Investment in Securities (cost $2,856,811,323) | | $3,730,808,294 |
| Receivable for investments sold | | 30,616,294 |
| Receivable for fund shares sold | | 3,408,359 |
| Dividends receivable | | 8,416,716 |
| Distributions receivable from Fidelity Central Funds | | 350,663 |
| Prepaid expenses | | 10,146 |
| Other receivables | | 321,365 |
| Total assets | | 3,773,931,837 |
| Liabilities | | |
| Payable for investments purchased | $4,434,670 | |
| Payable for fund shares redeemed | 4,720,209 | |
| Accrued management fee | 1,596,420 | |
| Other affiliated payables | 538,600 | |
| Other payables and accrued expenses | 331,695 | |
| Collateral on securities loaned | 109,744,850 | |
| Total liabilities | | 121,366,444 |
| Net Assets | | $3,652,565,393 |
| Net Assets consist of: | | |
| Paid in capital | | $2,595,798,973 |
| Distributions in excess of net investment income | | (11,289,025) |
| Accumulated undistributed net realized gain (loss) on investments and foreign currency transactions | | 194,061,118 |
| Net unrealized appreciation (depreciation) on investments and assets and liabilities in foreign currencies | | 873,994,327 |
| Net Assets, for 31,041,353 shares outstanding | | $3,652,565,393 |
| Net Asset Value, offering price and redemption price per share ($3,652,565,393 ÷ 31,041,353 shares) | | $117.67 |
See accompanying notes which are an integral part of the financial statements.
Statement of Operations
| | | Year ended February 28, 2018 |
| Investment Income | | |
| Dividends | | $35,008,249 |
| Interest | | 40,741 |
| Income from Fidelity Central Funds (including $2,982,731 from security lending) | | 4,233,309 |
| Total income | | 39,282,299 |
| Expenses | | |
| Management fee | $17,697,383 | |
| Transfer agent fees | 5,153,988 | |
| Accounting and security lending fees | 964,408 | |
| Custodian fees and expenses | 79,182 | |
| Independent trustees' fees and expenses | 69,105 | |
| Registration fees | 141,585 | |
| Audit | 43,082 | |
| Legal | 38,417 | |
| Miscellaneous | 138,852 | |
| Total expenses before reductions | 24,326,002 | |
| Expense reductions | (345,874) | 23,980,128 |
| Net investment income (loss) | | 15,302,171 |
| Realized and Unrealized Gain (Loss) | | |
| Net realized gain (loss) on: | | |
| Investment securities: | | |
| Unaffiliated issuers | 561,596,195 | |
| Fidelity Central Funds | (1,219) | |
| Other affiliated issuers | (224,324) | |
| Foreign currency transactions | (187,315) | |
| Total net realized gain (loss) | | 561,183,337 |
| Change in net unrealized appreciation (depreciation) on: | | |
| Investment securities: | | |
| Unaffiliated issuers | 389,973,967 | |
| Fidelity Central Funds | (4,025) | |
| Other affiliated issuers | (26,422,260) | |
| Assets and liabilities in foreign currencies | 1,750 | |
| Total change in net unrealized appreciation (depreciation) | | 363,549,432 |
| Net gain (loss) | | 924,732,769 |
| Net increase (decrease) in net assets resulting from operations | | $940,034,940 |
See accompanying notes which are an integral part of the financial statements.
Statement of Changes in Net Assets
| | Year ended February 28, 2018 | Year ended February 28, 2017 |
| Increase (Decrease) in Net Assets | | |
| Operations | | |
| Net investment income (loss) | $15,302,171 | $23,461,992 |
| Net realized gain (loss) | 561,183,337 | 153,404,162 |
| Change in net unrealized appreciation (depreciation) | 363,549,432 | 608,450,143 |
| Net increase (decrease) in net assets resulting from operations | 940,034,940 | 785,316,297 |
| Distributions to shareholders from net investment income | (33,424,828) | (16,885,913) |
| Distributions to shareholders from net realized gain | (438,241,980) | (60,751,043) |
| Total distributions | (471,666,808) | (77,636,956) |
| Share transactions | | |
| Proceeds from sales of shares | 1,113,948,684 | 1,421,320,708 |
| Reinvestment of distributions | 451,720,104 | 74,398,178 |
| Cost of shares redeemed | (1,393,950,572) | (529,318,580) |
| Net increase (decrease) in net assets resulting from share transactions | 171,718,216 | 966,400,306 |
| Redemption fees | 107,527 | 116,895 |
| Total increase (decrease) in net assets | 640,193,875 | 1,674,196,542 |
| Net Assets | | |
| Beginning of period | 3,012,371,518 | 1,338,174,976 |
| End of period | $3,652,565,393 | $3,012,371,518 |
| Other Information | | |
| Undistributed net investment income end of period | $– | $7,126,004 |
| Distributions in excess of net investment income end of period | $(11,289,025) | $– |
| Shares | | |
| Sold | 10,016,114 | 15,698,643 |
| Issued in reinvestment of distributions | 4,160,075 | 948,917 |
| Redeemed | (12,889,935) | (6,043,951) |
| Net increase (decrease) | 1,286,254 | 10,603,609 |
See accompanying notes which are an integral part of the financial statements.
Financial Highlights
Semiconductors Portfolio
| | | | | | |
| Years ended February 28, | 2018 | 2017 | 2016 A | 2015 | 2014 |
| Selected Per–Share Data | | | | | |
| Net asset value, beginning of period | $101.24 | $69.87 | $89.46 | $68.32 | $49.82 |
| Income from Investment Operations | | | | | |
| Net investment income (loss)B | .51 | 1.03 | .70 | .47 | .36 |
| Net realized and unrealized gain (loss) | 32.29 | 33.98 | (8.79) | 23.21 | 18.53 |
| Total from investment operations | 32.80 | 35.01 | (8.09) | 23.68 | 18.89 |
| Distributions from net investment income | (1.16) | (.68) | (.83) | (.45) | (.32) |
| Distributions from net realized gain | (15.21) | (2.98) | (10.68) | (2.10) | (.06) |
| Total distributions | (16.37) | (3.65)C | (11.50)D | (2.55) | (.39)E |
| Redemption fees added to paid in capitalB | –F | .01 | –F | .01 | –F |
| Net asset value, end of period | $117.67 | $101.24 | $69.87 | $89.46 | $68.32 |
| Total ReturnG | 34.20% | 51.79% | (10.44)% | 34.91% | 38.01% |
| Ratios to Average Net AssetsH,I | | | | | |
| Expenses before reductions | .75% | .77% | .77% | .78% | .82% |
| Expenses net of fee waivers, if any | .75% | .77% | .77% | .78% | .82% |
| Expenses net of all reductions | .74% | .75% | .74% | .77% | .79% |
| Net investment income (loss) | .47% | 1.19% | .88% | .61% | .63% |
| Supplemental Data | | | | | |
| Net assets, end of period (000 omitted) | $3,652,565 | $3,012,372 | $1,338,175 | $2,395,039 | $1,253,853 |
| Portfolio turnover rateJ | 110% | 110% | 179% | 132%K | 186% |
A For the year ended February 29.
B Calculated based on average shares outstanding during the period.
C Total distributions of $3.65 per share is comprised of distributions from net investment income of $.676 and distributions from net realized gain of $2.975 per share.
D Total distributions of $11.50 per share is comprised of distributions from net investment income of $.825 and distributions from net realized gain of $10.678 per share.
E Total distributions of $.39 per share is comprised of distributions from net investment income of $.322 and distributions from net realized gain of $.064 per share.
F Amount represents less than $.005 per share.
G Total returns would have been lower if certain expenses had not been reduced during the applicable periods shown.
H Fees and expenses of any underlying Fidelity Central Funds are not included in the Fund's expense ratio. The Fund indirectly bears its proportionate share of the expenses of any underlying Fidelity Central Funds.
I Expense ratios reflect operating expenses of the Fund. Expenses before reductions do not reflect amounts reimbursed by the investment adviser or reductions from brokerage service arrangements or reductions from other expense offset arrangements and do not represent the amount paid by the Fund during periods when reimbursements or reductions occur. Expenses net of fee waivers reflect expenses after reimbursement by the investment adviser but prior to reductions from brokerage service arrangements or other expense offset arrangements. Expenses net of all reductions represent the net expenses paid by the Fund.
J Amount does not include the portfolio activity of any underlying Fidelity Central Funds.
K Portfolio turnover rate excludes securities received or delivered in-kind.
See accompanying notes which are an integral part of the financial statements.
Software and IT Services Portfolio
Performance: The Bottom Line
Average annual total return reflects the change in the value of an investment, assuming reinvestment of distributions from dividend income and capital gains (the profits earned upon the sale of securities that have grown in value, if any) and assuming a constant rate of performance each year. The hypothetical investment and the average annual total returns do not reflect the deduction of taxes that a shareholder would pay on fund distributions or the redemption of fund shares. During periods of reimbursement by Fidelity, a fund’s total return will be greater than it would be had the reimbursement not occurred. How a fund did yesterday is no guarantee of how it will do tomorrow.
Average Annual Total Returns
| For the periods ended February 28, 2018 | Past 1 year | Past 5 years | Past 10 years |
| Software and IT Services Portfolio | 36.76% | 22.76% | 17.13% |
$10,000 Over 10 Years
Let's say hypothetically that $10,000 was invested in Software and IT Services Portfolio on February 29, 2008.
The chart shows how the value of your investment would have changed, and also shows how the S&P 500® Index performed over the same period.
| Period Ending Values |
| $48,621 | Software and IT Services Portfolio |
| $25,307 | S&P 500® Index |
Software and IT Services Portfolio
Management's Discussion of Fund Performance
Market Recap: U.S. equities gained 17.10% for the 12 months ending February 28, 2018, as the S&P 500
® index moved steadily higher throughout 2017 and into 2018 until sharply reversing course in February. The drop was in stark contrast to the low volatility seen throughout 2017, along with consumer sentiment and other market indicators that stayed positive. Investors remained decidedly upbeat as the calendar turned, and the index rose 5.73% in January. February was a decidedly different story, though, as volatility spiked amid fear that rising inflation and the potential for the economy to overheat would prompt the U.S. Federal Reserve to pick up the pace of interest rate hikes. The index returned -3.69% for the month, its first negative result since October 2016. For the full 12 months, growth stocks handily topped value, while large-caps bested small-caps. By sector, information technology fared best by far, gaining 36% amid strong earnings growth from several major index constituents. Consumer discretionary (+22%) also stood out, driven by retailers. Financials added 20%, riding the uptick in bond yields. Materials and industrials rose about 16% each, boosted by higher demand, especially from China. Conversely, notable laggards included the defensive telecommunication services (-5%) and utilities (-2%) sectors, while rising rates held back real estate (-3%).
Comments from Portfolio Manager Ali Khan: For the year, the fund gained roughly 36.76%, outpacing the 35.91% return of the sector benchmark, the MSCI U.S. IMI Software & Services 25/50 Index, and the 17.10% result of the broad-market S&P 500
®. Amid a strong economic environment, investors turned their focus to companies with solid fundamentals, which directly benefited software and related services companies that were generally on track to demonstrate strong growth. Stock selection across multiple industry segments largely drove the fund's outperformance versus the MSCI index. However, positioning within the IT consulting & other services group proved most beneficial. Here, underweighting infrastructure software & services giant IBM, which performed poorly, was the fund's biggest contributor. IBM struggled in the competitive cloud-computing market, and the stock returned -10% this period. Stock selection in application software also contributed, led by shares of Adobe Systems (77%), whose digital media and marketing software continued gaining market share. Conversely, stock selection in internet software & services detracted. Here, the fund's sizable stake in content delivery developer Akamai Technologies gained 8%, well behind the industry's benchmark.
The views expressed above reflect those of the portfolio manager(s) only through the end of the period as stated on the cover of this report and do not necessarily represent the views of Fidelity or any other person in the Fidelity organization. Any such views are subject to change at any time based upon market or other conditions and Fidelity disclaims any responsibility to update such views. These views may not be relied on as investment advice and, because investment decisions for a Fidelity fund are based on numerous factors, may not be relied on as an indication of trading intent on behalf of any Fidelity fund.
Note to shareholders: On December 8, 2017, shareholders approved proposals from the Board of Trustees to eliminate each sector/industry fund's fundamental “invests primarily” policy and to modify the fundamental concentration policy for certain funds. The changes took effect on January 1, 2018, and do not impact how the funds are managed.
Software and IT Services Portfolio
Investment Summary (Unaudited)
Top Ten Stocks as of February 28, 2018
| | % of fund's net assets |
| Microsoft Corp. | 15.9 |
| Facebook, Inc. Class A | 11.0 |
| Alphabet, Inc. Class C | 10.5 |
| Alphabet, Inc. Class A | 8.3 |
| Adobe Systems, Inc. | 4.6 |
| Visa, Inc. Class A | 4.0 |
| Salesforce.com, Inc. | 3.3 |
| Akamai Technologies, Inc. | 2.5 |
| MasterCard, Inc. Class A | 2.4 |
| PayPal Holdings, Inc. | 2.2 |
| | 64.7 |
Top Industries (% of fund's net assets)
| As of February 28, 2018 |
| | Software | 37.1% |
| | Internet Software & Services | 36.2% |
| | IT Services | 19.5% |
| | Semiconductors & Semiconductor Equipment | 1.3% |
| | Electronic Equipment & Components | 0.9% |
| | All Others* | 5.0% |

* Includes short-term investments and net other assets (liabilities).
Software and IT Services Portfolio
Schedule of Investments February 28, 2018
Showing Percentage of Net Assets
| Common Stocks - 96.9% | | | |
| | | Shares | Value |
| Communications Equipment - 0.3% | | | |
| Communications Equipment - 0.3% | | | |
| F5 Networks, Inc. (a) | | 125,400 | $18,624,408 |
| Electronic Equipment & Components - 0.9% | | | |
| Technology Distributors - 0.9% | | | |
| Dell Technologies, Inc. (a) | | 633,300 | 47,047,857 |
| Health Care Technology - 0.2% | | | |
| Health Care Technology - 0.2% | | | |
| Inovalon Holdings, Inc. Class A (a)(b) | | 960,400 | 11,524,800 |
| Household Durables - 0.2% | | | |
| Household Appliances - 0.2% | | | |
| iRobot Corp. (a)(b) | | 123,200 | 8,371,440 |
| Internet & Direct Marketing Retail - 0.3% | | | |
| Internet & Direct Marketing Retail - 0.3% | | | |
| TripAdvisor, Inc. (a) | | 426,900 | 17,110,152 |
| Internet Software & Services - 36.2% | | | |
| Internet Software & Services - 36.2% | | | |
| Actua Corp. | | 197,789 | 217,568 |
| Akamai Technologies, Inc. (a) | | 2,069,000 | 139,574,740 |
| Alibaba Group Holding Ltd. sponsored ADR (a) | | 120,700 | 22,467,098 |
| Alphabet, Inc.: | | | |
| Class A (a) | | 415,200 | 458,347,584 |
| Class C (a) | | 524,560 | 579,497,169 |
| Facebook, Inc. Class A (a) | | 3,410,100 | 608,089,032 |
| Instructure, Inc. (a) | | 282,381 | 12,255,335 |
| Mix Telematics Ltd. | | 19,957,696 | 10,505,054 |
| New Relic, Inc. (a) | | 248,600 | 17,844,508 |
| NIC, Inc. | | 2,433,800 | 32,856,300 |
| Pandora Media, Inc. (a)(b) | | 773,300 | 3,410,253 |
| Shutterstock, Inc. (a) | | 410,912 | 20,648,328 |
| SPS Commerce, Inc. (a) | | 856,400 | 51,401,128 |
| Twilio, Inc. Class A (a)(b) | | 1,067,700 | 36,472,632 |
| Twitter, Inc. (a) | | 406,200 | 12,941,532 |
| | | | 2,006,528,261 |
| IT Services - 19.5% | | | |
| Data Processing & Outsourced Services - 13.5% | | | |
| Alliance Data Systems Corp. | | 244,700 | 58,962,912 |
| EVERTEC, Inc. | | 418,700 | 6,782,940 |
| Fidelity National Information Services, Inc. | | 395,300 | 38,415,254 |
| FleetCor Technologies, Inc. (a) | | 297,500 | 59,479,175 |
| Global Payments, Inc. | | 163,700 | 18,561,943 |
| MasterCard, Inc. Class A | | 764,800 | 134,421,248 |
| PayPal Holdings, Inc. (a) | | 1,534,600 | 121,862,586 |
| Sabre Corp. | | 564,900 | 12,975,753 |
| The Western Union Co. | | 802,700 | 15,909,514 |
| Total System Services, Inc. | | 689,000 | 60,597,550 |
| Visa, Inc. Class A | | 1,784,420 | 219,376,595 |
| | | | 747,345,470 |
| IT Consulting & Other Services - 6.0% | | | |
| Capgemini SA | | 287,900 | 35,885,386 |
| Cognizant Technology Solutions Corp. Class A | | 1,408,100 | 115,492,362 |
| Conduent, Inc. (a) | | 759,600 | 14,356,440 |
| CSRA, Inc. | | 870,800 | 35,293,524 |
| Gartner, Inc. (a) | | 142,400 | 16,149,584 |
| IBM Corp. | | 690,000 | 107,522,700 |
| Leidos Holdings, Inc. | | 166,700 | 10,553,777 |
| | | | 335,253,773 |
|
| TOTAL IT SERVICES | | | 1,082,599,243 |
|
| Semiconductors & Semiconductor Equipment - 1.3% | | | |
| Semiconductors - 1.3% | | | |
| Qualcomm, Inc. | | 1,107,100 | 71,961,500 |
| Software - 37.1% | | | |
| Application Software - 15.2% | | | |
| Adobe Systems, Inc. (a) | | 1,207,800 | 252,587,214 |
| Autodesk, Inc. (a) | | 555,900 | 65,301,573 |
| Citrix Systems, Inc. (a) | | 670,350 | 61,672,200 |
| Constellation Software, Inc. | | 37,300 | 24,143,553 |
| Deem, Inc. (a)(c)(d) | | 124,895 | 62,448 |
| Micro Focus International PLC | | 1,884,200 | 53,162,382 |
| Monotype Imaging Holdings, Inc. | | 1,371,400 | 33,050,740 |
| Paylocity Holding Corp. (a) | | 323,600 | 15,134,772 |
| Salesforce.com, Inc. (a) | | 1,554,926 | 180,760,148 |
| Ultimate Software Group, Inc. (a) | | 246,200 | 58,708,852 |
| Workday, Inc. Class A (a) | | 663,700 | 84,070,879 |
| Zendesk, Inc. (a) | | 252,800 | 10,915,904 |
| | | | 839,570,665 |
| Home Entertainment Software - 2.6% | | | |
| Activision Blizzard, Inc. | | 695,900 | 50,891,167 |
| Electronic Arts, Inc. (a) | | 751,300 | 92,935,810 |
| | | | 143,826,977 |
| Systems Software - 19.3% | | | |
| Check Point Software Technologies Ltd. (a) | | 291,900 | 30,325,491 |
| Microsoft Corp. | | 9,379,200 | 879,487,583 |
| Oracle Corp. | | 966,800 | 48,987,756 |
| Red Hat, Inc. (a) | | 352,300 | 51,929,020 |
| Symantec Corp. | | 2,255,500 | 59,297,095 |
| | | | 1,070,026,945 |
|
| TOTAL SOFTWARE | | | 2,053,424,587 |
|
| Technology Hardware, Storage & Peripherals - 0.9% | | | |
| Technology Hardware, Storage & Peripherals - 0.9% | | | |
| Apple, Inc. | | 282,100 | 50,247,652 |
| TOTAL COMMON STOCKS | | | |
| (Cost $2,836,736,675) | | | 5,367,439,900 |
|
| Money Market Funds - 3.3% | | | |
| Fidelity Cash Central Fund, 1.41% (e) | | 138,321,554 | 138,349,219 |
| Fidelity Securities Lending Cash Central Fund 1.42% (e)(f) | | 43,300,649 | 43,304,979 |
| TOTAL MONEY MARKET FUNDS | | | |
| (Cost $181,641,692) | | | 181,654,198 |
| TOTAL INVESTMENT IN SECURITIES - 100.2% | | | |
| (Cost $3,018,378,367) | | | 5,549,094,098 |
| NET OTHER ASSETS (LIABILITIES) - (0.2)% | | | (9,737,423) |
| NET ASSETS - 100% | | | $5,539,356,675 |
Legend
(a) Non-income producing
(b) Security or a portion of the security is on loan at period end.
(c) Restricted securities - Investment in securities not registered under the Securities Act of 1933 (excluding 144A issues). At the end of the period, the value of restricted securities (excluding 144A issues) amounted to $62,448 or 0.0% of net assets.
(d) Level 3 security
(e) Affiliated fund that is generally available only to investment companies and other accounts managed by Fidelity Investments. The rate quoted is the annualized seven-day yield of the fund at period end. A complete unaudited listing of the fund's holdings as of its most recent quarter end is available upon request. In addition, each Fidelity Central Fund's financial statements, which are not covered by the Fund's Report of Independent Registered Public Accounting Firm, are available on the SEC's website or upon request.
(f) Investment made with cash collateral received from securities on loan.
Additional information on each restricted holding is as follows:
| Security | Acquisition Date | Acquisition Cost |
| Deem, Inc. | 9/19/13 | $8,064,516 |
Affiliated Central Funds
Information regarding fiscal year to date income earned by the Fund from investments in Fidelity Central Funds is as follows:
| Fund | Income earned |
| Fidelity Cash Central Fund | $1,579,813 |
| Fidelity Securities Lending Cash Central Fund | 488,148 |
| Total | $2,067,961 |
Amounts in the income column in the above table include any capital gain distributions from underlying funds, which are presented in the corresponding line-item in the Statement of Operations if applicable.
Investment Valuation
The following is a summary of the inputs used, as of February 28, 2018, involving the Fund's assets and liabilities carried at fair value. The inputs or methodology used for valuing securities may not be an indication of the risk associated with investing in those securities. For more information on valuation inputs, and their aggregation into the levels used below, please refer to the Investment Valuation section in the accompanying Notes to Financial Statements.
| | Valuation Inputs at Reporting Date: |
| Description | Total | Level 1 | Level 2 | Level 3 |
| Investments in Securities: | | | | |
| Common Stocks | $5,367,439,900 | $5,267,824,630 | $99,552,822 | $62,448 |
| Money Market Funds | 181,654,198 | 181,654,198 | -- | -- |
| Total Investments in Securities: | $5,549,094,098 | $5,449,478,828 | $99,552,822 | $62,448 |
See accompanying notes which are an integral part of the financial statements.
Software and IT Services Portfolio
Financial Statements
Statement of Assets and Liabilities
| | | February 28, 2018 |
| Assets | | |
Investment in securities, at value (including securities loaned of $42,023,203) — See accompanying schedule:
Unaffiliated issuers (cost $2,836,736,675) | $5,367,439,900 | |
| Fidelity Central Funds (cost $181,641,692) | 181,654,198 | |
| Total Investment in Securities (cost $3,018,378,367) | | $5,549,094,098 |
| Foreign currency held at value (cost $2,194,479) | | 2,194,521 |
| Receivable for investments sold | | 36,184,685 |
| Receivable for fund shares sold | | 13,069,432 |
| Dividends receivable | | 6,067,433 |
| Distributions receivable from Fidelity Central Funds | | 199,126 |
| Prepaid expenses | | 14,762 |
| Other receivables | | 402,503 |
| Total assets | | 5,607,226,560 |
| Liabilities | | |
| Payable for investments purchased | $17,750,627 | |
| Payable for fund shares redeemed | 3,270,236 | |
| Accrued management fee | 2,424,252 | |
| Other affiliated payables | 736,812 | |
| Other payables and accrued expenses | 386,758 | |
| Collateral on securities loaned | 43,301,200 | |
| Total liabilities | | 67,869,885 |
| Net Assets | | $5,539,356,675 |
| Net Assets consist of: | | |
| Paid in capital | | $2,905,681,887 |
| Accumulated net investment loss | | (255,934) |
| Accumulated undistributed net realized gain (loss) on investments and foreign currency transactions | | 103,288,544 |
| Net unrealized appreciation (depreciation) on investments and assets and liabilities in foreign currencies | | 2,530,642,178 |
| Net Assets, for 30,961,020 shares outstanding | | $5,539,356,675 |
| Net Asset Value, offering price and redemption price per share ($5,539,356,675 ÷ 30,961,020 shares) | | $178.91 |
See accompanying notes which are an integral part of the financial statements.
Statement of Operations
| | | Year ended February 28, 2018 |
| Investment Income | | |
| Dividends | | $27,586,662 |
| Income from Fidelity Central Funds (including $488,148 from security lending) | | 2,067,961 |
| Total income | | 29,654,623 |
| Expenses | | |
| Management fee | $25,201,651 | |
| Transfer agent fees | 7,197,345 | |
| Accounting and security lending fees | 1,077,029 | |
| Custodian fees and expenses | 47,132 | |
| Independent trustees' fees and expenses | 97,793 | |
| Registration fees | 118,883 | |
| Audit | 46,956 | |
| Legal | 56,444 | |
| Miscellaneous | 149,373 | |
| Total expenses before reductions | 33,992,606 | |
| Expense reductions | (100,412) | 33,892,194 |
| Net investment income (loss) | | (4,237,571) |
| Realized and Unrealized Gain (Loss) | | |
| Net realized gain (loss) on: | | |
| Investment securities: | | |
| Unaffiliated issuers | 371,052,999 | |
| Fidelity Central Funds | 4,833 | |
| Foreign currency transactions | (67,002) | |
| Total net realized gain (loss) | | 370,990,830 |
| Change in net unrealized appreciation (depreciation) on: | | |
| Investment securities: | | |
| Unaffiliated issuers | 1,088,681,296 | |
| Fidelity Central Funds | (8,971) | |
| Assets and liabilities in foreign currencies | 4,421 | |
| Total change in net unrealized appreciation (depreciation) | | 1,088,676,746 |
| Net gain (loss) | | 1,459,667,576 |
| Net increase (decrease) in net assets resulting from operations | | $1,455,430,005 |
See accompanying notes which are an integral part of the financial statements.
Statement of Changes in Net Assets
| | Year ended February 28, 2018 | Year ended February 28, 2017 |
| Increase (Decrease) in Net Assets | | |
| Operations | | |
| Net investment income (loss) | $(4,237,571) | $(4,060,383) |
| Net realized gain (loss) | 370,990,830 | 254,286,047 |
| Change in net unrealized appreciation (depreciation) | 1,088,676,746 | 730,057,967 |
| Net increase (decrease) in net assets resulting from operations | 1,455,430,005 | 980,283,631 |
| Distributions to shareholders from net investment income | – | (1,211,235) |
| Distributions to shareholders from net realized gain | (340,316,912) | (146,887,357) |
| Total distributions | (340,316,912) | (148,098,592) |
| Share transactions | | |
| Proceeds from sales of shares | 1,063,695,918 | 1,075,769,868 |
| Reinvestment of distributions | 323,675,323 | 141,773,881 |
| Cost of shares redeemed | (1,118,562,434) | (865,722,579) |
| Net increase (decrease) in net assets resulting from share transactions | 268,808,807 | 351,821,170 |
| Redemption fees | – | 59,005 |
| Total increase (decrease) in net assets | 1,383,921,900 | 1,184,065,214 |
| Net Assets | | |
| Beginning of period | 4,155,434,775 | 2,971,369,561 |
| End of period | $5,539,356,675 | $4,155,434,775 |
| Other Information | | |
| Accumulated net investment loss end of period | $(255,934) | $(142,311) |
| Shares | | |
| Sold | 6,590,178 | 8,292,367 |
| Issued in reinvestment of distributions | 2,058,957 | 1,094,880 |
| Redeemed | (7,189,366) | (6,629,721) |
| Net increase (decrease) | 1,459,769 | 2,757,526 |
See accompanying notes which are an integral part of the financial statements.
Financial Highlights
Software and IT Services Portfolio
| | | | | | |
| Years ended February 28, | 2018 | 2017 | 2016 A | 2015 | 2014 |
| Selected Per–Share Data | | | | | |
| Net asset value, beginning of period | $140.86 | $111.11 | $119.38 | $124.38 | $87.97 |
| Income from Investment Operations | | | | | |
| Net investment income (loss)B | (.15) | (.14) | .12 | (.17) | .06 |
| Net realized and unrealized gain (loss) | 50.06 | 35.02 | (2.05) | 7.26 | 41.95 |
| Total from investment operations | 49.91 | 34.88 | (1.93) | 7.09 | 42.01 |
| Distributions from net investment income | – | (.05) | (.05) | – | – |
| Distributions from net realized gain | (11.86) | (5.08) | (6.29) | (12.09) | (5.60) |
| Total distributions | (11.86) | (5.13) | (6.34) | (12.09) | (5.60) |
| Redemption fees added to paid in capitalB,C | – | – | – | – | – |
| Net asset value, end of period | $178.91 | $140.86 | $111.11 | $119.38 | $124.38 |
| Total ReturnD | 36.76% | 31.83% | (1.84)% | 6.33% | 48.18% |
| Ratios to Average Net AssetsE,F | | | | | |
| Expenses before reductions | .73% | .76% | .77% | .77% | .79% |
| Expenses net of fee waivers, if any | .73% | .76% | .76% | .77% | .79% |
| Expenses net of all reductions | .73% | .75% | .76% | .77% | .78% |
| Net investment income (loss) | (.09)% | (.11)% | .10% | (.15)% | .06% |
| Supplemental Data | | | | | |
| Net assets, end of period (000 omitted) | $5,539,357 | $4,155,435 | $2,971,370 | $3,012,792 | $3,844,505 |
| Portfolio turnover rateG | 31% | 44% | 36% | 53% | 87% |
A For the year ended February 29.
B Calculated based on average shares outstanding during the period.
C Amount represents less than $.005 per share.
D Total returns would have been lower if certain expenses had not been reduced during the applicable periods shown.
E Fees and expenses of any underlying Fidelity Central Funds are not included in the Fund's expense ratio. The Fund indirectly bears its proportionate share of the expenses of any underlying Fidelity Central Funds.
F Expense ratios reflect operating expenses of the Fund. Expenses before reductions do not reflect amounts reimbursed by the investment adviser or reductions from brokerage service arrangements or reductions from other expense offset arrangements and do not represent the amount paid by the Fund during periods when reimbursements or reductions occur. Expenses net of fee waivers reflect expenses after reimbursement by the investment adviser but prior to reductions from brokerage service arrangements or other expense offset arrangements. Expenses net of all reductions represent the net expenses paid by the Fund.
G Amount does not include the portfolio activity of any underlying Fidelity Central Funds.
See accompanying notes which are an integral part of the financial statements.
Technology Portfolio
Performance: The Bottom Line
Average annual total return reflects the change in the value of an investment, assuming reinvestment of distributions from dividend income and capital gains (the profits earned upon the sale of securities that have grown in value, if any) and assuming a constant rate of performance each year. The hypothetical investment and the average annual total returns do not reflect the deduction of taxes that a shareholder would pay on fund distributions or the redemption of fund shares. During periods of reimbursement by Fidelity, a fund’s total return will be greater than it would be had the reimbursement not occurred. How a fund did yesterday is no guarantee of how it will do tomorrow.
Average Annual Total Returns
| For the periods ended February 28, 2018 | Past 1 year | Past 5 years | Past 10 years |
| Technology Portfolio | 43.71% | 22.59% | 15.80% |
$10,000 Over 10 Years
Let's say hypothetically that $10,000 was invested in Technology Portfolio on February 29, 2008.
The chart shows how the value of your investment would have changed, and also shows how the S&P 500® Index performed over the same period.
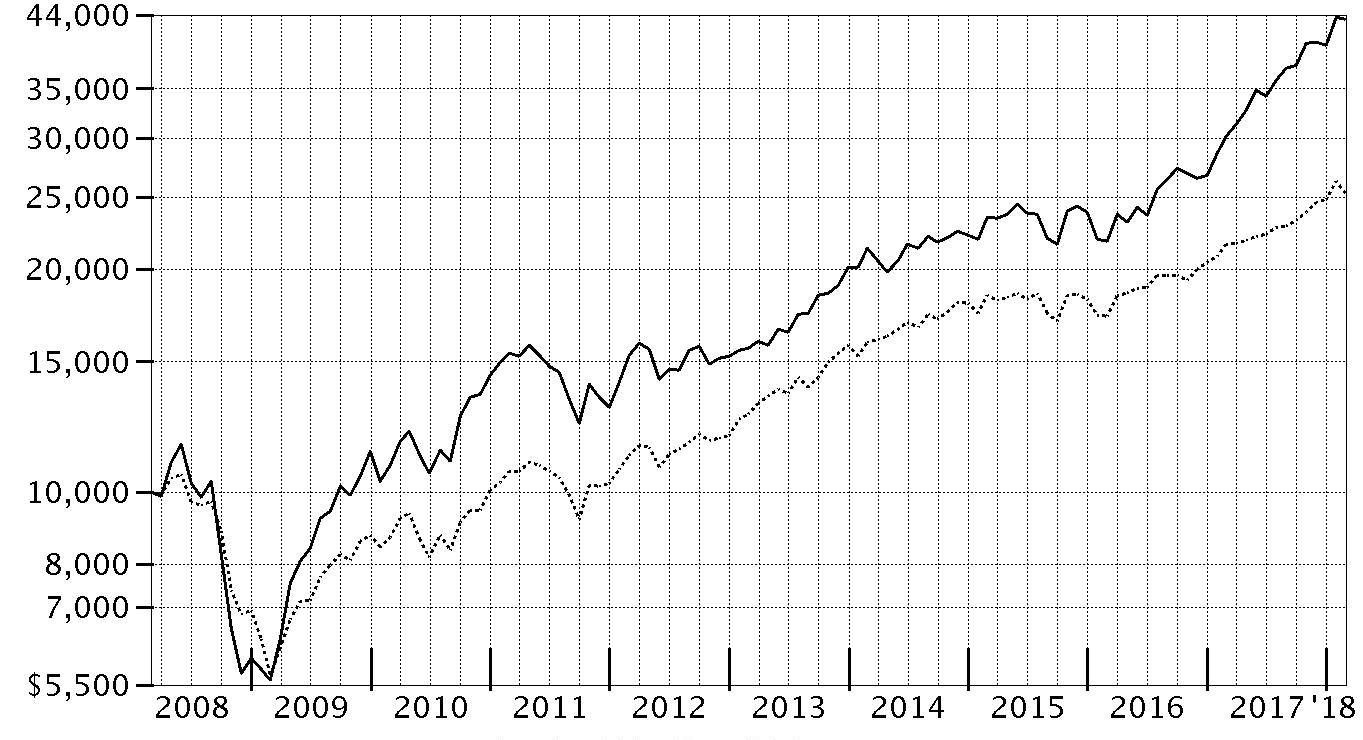
| Period Ending Values |
| $43,363 | Technology Portfolio |
| $25,307 | S&P 500® Index |
Technology Portfolio
Management's Discussion of Fund Performance
Market Recap: U.S. equities gained 17.10% for the 12 months ending February 28, 2018, as the S&P 500
® index moved steadily higher throughout 2017 and into 2018 until sharply reversing course in February. The drop was in stark contrast to the low volatility seen throughout 2017, along with consumer sentiment and other market indicators that stayed positive. Investors remained decidedly upbeat as the calendar turned, and the index rose 5.73% in January. February was a decidedly different story, though, as volatility spiked amid fear that rising inflation and the potential for the economy to overheat would prompt the U.S. Federal Reserve to pick up the pace of interest rate hikes. The index returned -3.69% for the month, its first negative result since October 2016. For the full 12 months, growth stocks handily topped value, while large-caps bested small-caps. By sector, information technology fared best by far, gaining 36% amid strong earnings growth from several major index constituents. Consumer discretionary (+22%) also stood out, driven by retailers. Financials added 20%, riding the uptick in bond yields. Materials and industrials rose about 16% each, boosted by higher demand, especially from China. Conversely, notable laggards included the defensive telecommunication services (-5%) and utilities (-2%) sectors, while rising rates held back real estate (-3%).
Comments from Portfolio Manager Charlie Chai: For the year, the fund gained 43.71%, considerably outpacing the 34.90% return of the MSCI U.S. IMI Information Technology 25/50 Index, and more than doubling the S&P 500
®. Versus the MSCI sector index, stock selection and a large overweighting in semiconductor equipment meaningfully contributed to fund performance, as did positioning in IT consulting & other services and non-index exposure to internet & direct marketing retail, among a long list of positives. Foreign holdings contributed overall, aided in part by a broadly weaker U.S. dollar. IBM, a weak-performing index component I avoided, was the fund’s largest relative contributor. An out-of-benchmark stake in GlobalWafers, a Taiwan-based firm specializing in silicon-wafer manufacturing, also contributed, as did our stake in another non-index, chip-equipment holding, Austria-based AMS. Conversely, stock selection in semiconductors detracted, along with a sizable underweighting in the strong-performing systems software segment. A cash position averaging roughly 2% also dragged on performance in such a strong market. A large underweighting in strong-performing Microsoft penalized us. In addition, Macom Technology Solutions Holdings, a new stock I bought for the fund this period, also detracted.
The views expressed above reflect those of the portfolio manager(s) only through the end of the period as stated on the cover of this report and do not necessarily represent the views of Fidelity or any other person in the Fidelity organization. Any such views are subject to change at any time based upon market or other conditions and Fidelity disclaims any responsibility to update such views. These views may not be relied on as investment advice and, because investment decisions for a Fidelity fund are based on numerous factors, may not be relied on as an indication of trading intent on behalf of any Fidelity fund.
Note to shareholders: On December 8, 2017, shareholders approved proposals from the Board of Trustees to eliminate each sector/industry fund's fundamental “invests primarily” policy and to modify the fundamental concentration policy for certain funds. The changes took effect on January 1, 2018, and do not impact how the funds are managed.
Technology Portfolio
Investment Summary (Unaudited)
Top Ten Stocks as of February 28, 2018
| | % of fund's net assets |
| Apple, Inc. | 8.6 |
| Microsoft Corp. | 7.1 |
| Tesla, Inc. | 4.4 |
| NVIDIA Corp. | 3.8 |
| Qualcomm, Inc. | 2.9 |
| Alphabet, Inc. Class A | 2.9 |
| Salesforce.com, Inc. | 2.9 |
| Alphabet, Inc. Class C | 2.8 |
| Alibaba Group Holding Ltd. sponsored ADR | 2.6 |
| Parametric Technology Corp. | 2.5 |
| | 40.5 |
Top Industries (% of fund's net assets)
| As of February 28, 2018 |
| | Software | 30.4% |
| | Semiconductors & Semiconductor Equipment | 20.5% |
| | Internet Software & Services | 16.1% |
| | Technology Hardware, Storage & Peripherals | 8.9% |
| | IT Services | 6.7% |
| | All Others* | 17.4% |
* Includes short-term investments and net other assets (liabilities).
Technology Portfolio
Schedule of Investments February 28, 2018
Showing Percentage of Net Assets
| Common Stocks - 97.5% | | | |
| | | Shares | Value |
| Air Freight & Logistics - 0.2% | | | |
| Air Freight & Logistics - 0.2% | | | |
| Best, Inc. ADR (a) | | 1,167,200 | $11,356,856 |
| Automobiles - 4.4% | | | |
| Automobile Manufacturers - 4.4% | | | |
| Tesla, Inc. (a)(b) | | 923,356 | 316,766,509 |
| Biotechnology - 0.2% | | | |
| Biotechnology - 0.2% | | | |
| BeiGene Ltd. ADR (b) | | 107,300 | 15,394,331 |
| Zai Lab Ltd. ADR | | 49,600 | 1,098,640 |
| | | | 16,492,971 |
| Communications Equipment - 0.8% | | | |
| Communications Equipment - 0.8% | | | |
| Applied Optoelectronics, Inc. (a)(b) | | 144,700 | 4,041,471 |
| CommScope Holding Co., Inc. (b) | | 646,700 | 25,033,757 |
| Hytera Communications Corp. Ltd. Class A | | 12,182,500 | 25,357,731 |
| | | | 54,432,959 |
| Diversified Consumer Services - 1.3% | | | |
| Education Services - 1.3% | | | |
| China Online Education Group sponsored ADR (a)(b) | | 7,115 | 70,154 |
| New Oriental Education & Technology Group, Inc. sponsored ADR | | 230,195 | 21,037,521 |
| TAL Education Group ADR | | 1,852,484 | 69,949,796 |
| | | | 91,057,471 |
| Diversified Financial Services - 0.2% | | | |
| Other Diversified Financial Services - 0.2% | | | |
| GDS Holdings Ltd. ADR (b) | | 952 | 24,942 |
| Jianpu Technology, Inc. ADR (a)(b) | | 2,122,800 | 14,201,532 |
| | | | 14,226,474 |
| Electrical Equipment - 0.1% | | | |
| Electrical Components & Equipment - 0.1% | | | |
| BizLink Holding, Inc. | | 806,505 | 7,071,257 |
| Electronic Equipment & Components - 3.5% | | | |
| Electronic Components - 0.2% | | | |
| E Ink Holdings, Inc. | | 8,900,000 | 14,007,101 |
| Ledlink Optics, Inc. | | 1,728,624 | 2,568,018 |
| | | | 16,575,119 |
| Electronic Equipment & Instruments - 2.2% | | | |
| Chroma ATE, Inc. | | 14,500,644 | 78,225,594 |
| Topcon Corp. | | 1,351,000 | 30,026,438 |
| Trimble, Inc. (b) | | 1,356,321 | 51,445,256 |
| | | | 159,697,288 |
| Technology Distributors - 1.1% | | | |
| Dell Technologies, Inc. (b) | | 1,003,152 | 74,524,162 |
|
| TOTAL ELECTRONIC EQUIPMENT & COMPONENTS | | | 250,796,569 |
|
| Health Care Equipment & Supplies - 0.1% | | | |
| Health Care Supplies - 0.1% | | | |
| Hoya Corp. | | 168,100 | 8,837,889 |
| Hotels, Restaurants & Leisure - 0.0% | | | |
| Casinos & Gaming - 0.0% | | | |
| Sea Ltd. ADR (a) | | 108,500 | 1,189,160 |
| Hotels, Resorts & Cruise Lines - 0.0% | | | |
| Tuniu Corp. Class A sponsored ADR (a)(b) | | 154,807 | 1,193,562 |
|
| TOTAL HOTELS, RESTAURANTS & LEISURE | | | 2,382,722 |
|
| Internet & Direct Marketing Retail - 2.0% | | | |
| Internet & Direct Marketing Retail - 2.0% | | | |
| Amazon.com, Inc. (b) | | 36,500 | 55,204,425 |
| China Internet Plus Holdings Ltd. Class B (b)(c)(d) | | 759,582 | 4,245,349 |
| JD.com, Inc. sponsored ADR (b) | | 231,300 | 10,905,795 |
| Netflix, Inc. (b) | | 192,100 | 55,974,098 |
| Vipshop Holdings Ltd. ADR (b) | | 1,273,267 | 22,142,113 |
| | | | 148,471,780 |
| Internet Software & Services - 15.8% | | | |
| Internet Software & Services - 15.8% | | | |
| Akamai Technologies, Inc. (b) | | 211,600 | 14,274,536 |
| Alibaba Group Holding Ltd. sponsored ADR (b) | | 1,012,100 | 188,392,294 |
| Alphabet, Inc.: | | | |
| Class A (b) | | 191,903 | 211,845,560 |
| Class C (b) | | 182,368 | 201,467,401 |
| Benefitfocus, Inc. (b) | | 93,600 | 2,265,120 |
| Endurance International Group Holdings, Inc. (b) | | 1,193,620 | 8,713,426 |
| Envestnet, Inc. (b) | | 434 | 23,913 |
| Facebook, Inc. Class A (b) | | 527,574 | 94,076,996 |
| GoDaddy, Inc. (b) | | 920,700 | 55,067,067 |
| LogMeIn, Inc. | | 527,469 | 60,949,043 |
| MercadoLibre, Inc. | | 104,263 | 40,450,916 |
| NetEase, Inc. ADR | | 181,900 | 53,360,365 |
| New Relic, Inc. (b) | | 252,300 | 18,110,094 |
| Nutanix, Inc.: | | | |
| Class A (b) | | 668,300 | 24,359,535 |
| Class B (e) | | 72,872 | 2,656,184 |
| SMS Co., Ltd. | | 1,011,900 | 41,688,398 |
| Tencent Holdings Ltd. | | 613,500 | 33,563,678 |
| Xunlei Ltd. sponsored ADR (a)(b) | | 3,044,605 | 38,879,606 |
| Yandex NV Series A (b) | | 1,236,200 | 50,795,458 |
| | | | 1,140,939,590 |
| IT Services - 6.7% | | | |
| Data Processing & Outsourced Services - 3.6% | | | |
| FleetCor Technologies, Inc. (b) | | 456,900 | 91,348,017 |
| Global Payments, Inc. | | 223,300 | 25,319,987 |
| PayPal Holdings, Inc. (b) | | 1,864,700 | 148,075,827 |
| | | | 264,743,831 |
| IT Consulting & Other Services - 3.1% | | | |
| Cognizant Technology Solutions Corp. Class A | | 2,122,206 | 174,063,336 |
| DXC Technology Co. | | 487,900 | 50,029,266 |
| | | | 224,092,602 |
|
| TOTAL IT SERVICES | | | 488,836,433 |
|
| Life Sciences Tools & Services - 0.0% | | | |
| Life Sciences Tools & Services - 0.0% | | | |
| JHL Biotech, Inc. (b)(c) | | 1,015,442 | 2,127,975 |
| Machinery - 1.0% | | | |
| Industrial Machinery - 1.0% | | | |
| Minebea Mitsumi, Inc. | | 3,149,419 | 71,233,748 |
| Media - 1.3% | | | |
| Advertising - 0.0% | | | |
| iCar Asia Ltd. (b) | | 4,234,308 | 750,370 |
| iCar Asia Ltd. warrants 6/12/19 (b) | | 622,692 | 32,274 |
| | | | 782,644 |
| Cable & Satellite - 1.2% | | | |
| Naspers Ltd. Class N | | 326,100 | 88,520,459 |
| Publishing - 0.1% | | | |
| China Literature Ltd.(b)(e) | | 596,996 | 5,820,845 |
|
| TOTAL MEDIA | | | 95,123,948 |
|
| Real Estate Management & Development - 0.1% | | | |
| Real Estate Services - 0.1% | | | |
| Relo Holdings Corp. | | 277,300 | 7,773,488 |
| Semiconductors & Semiconductor Equipment - 20.5% | | | |
| Semiconductor Equipment - 5.0% | | | |
| ASM Pacific Technology Ltd. | | 7,440,900 | 105,837,381 |
| ASML Holding NV | | 162,100 | 31,672,719 |
| Ferrotec Holdings Corp. | | 888,900 | 22,126,560 |
| GlobalWafers Co. Ltd. | | 4,507,200 | 64,201,729 |
| KLA-Tencor Corp. | | 299,100 | 33,891,021 |
| Screen Holdings Co. Ltd. | | 280,500 | 26,004,613 |
| Sino-American Silicon Products, Inc. | | 26,169,000 | 77,871,767 |
| | | | 361,605,790 |
| Semiconductors - 15.5% | | | |
| Acacia Communications, Inc.(a)(b) | | 104,200 | 4,032,540 |
| Advanced Micro Devices, Inc. (a)(b) | | 4,547,200 | 55,066,592 |
| ams AG | | 1,071,859 | 126,343,286 |
| ASPEED Tech, Inc. | | 399,000 | 10,317,441 |
| ChipMOS TECHNOLOGIES, Inc. sponsored ADR (a) | | 344,518 | 5,901,593 |
| Cree, Inc. (b) | | 1,687,700 | 63,845,691 |
| Global Unichip Corp. | | 975,000 | 9,948,241 |
| Himax Technologies, Inc. sponsored ADR (a) | | 6,871,391 | 56,139,264 |
| Inphi Corp. (b) | | 493,607 | 13,697,594 |
| International Quantum Epitaxy PLC (a)(b) | | 12,949,870 | 22,639,768 |
| M/A-COM Technology Solutions Holdings, Inc. (a)(b) | | 1,920,900 | 40,992,006 |
| Marvell Technology Group Ltd. | | 764,654 | 17,961,722 |
| Monolithic Power Systems, Inc. | | 90,595 | 10,605,051 |
| Nanya Technology Corp. | | 50,664,000 | 137,488,764 |
| NVIDIA Corp. | | 1,134,850 | 274,633,700 |
| Qorvo, Inc. (b) | | 89,400 | 7,215,474 |
| Qualcomm, Inc. | | 3,281,100 | 213,271,500 |
| Renesas Electronics Corp. (b) | | 395,800 | 4,526,274 |
| Semtech Corp. (b) | | 410,576 | 13,815,882 |
| Silergy Corp. | | 233,000 | 5,113,385 |
| Silicon Laboratories, Inc. (b) | | 141,200 | 13,202,200 |
| Silicon Motion Technology Corp. sponsored ADR (a) | | 256,000 | 11,998,720 |
| Skyworks Solutions, Inc. | | 60,200 | 6,576,850 |
| | | | 1,125,333,538 |
|
| TOTAL SEMICONDUCTORS & SEMICONDUCTOR EQUIPMENT | | | 1,486,939,328 |
|
| Software - 30.4% | | | |
| Application Software - 15.5% | | | |
| Adobe Systems, Inc. (b) | | 602,739 | 126,050,807 |
| Autodesk, Inc. (b) | | 1,239,600 | 145,615,812 |
| Citrix Systems, Inc. (b) | | 1,489,548 | 137,038,416 |
| Ellie Mae, Inc. (b) | | 394,500 | 34,980,315 |
| HubSpot, Inc. (b) | | 20,100 | 2,232,105 |
| Intuit, Inc. | | 211,200 | 35,240,832 |
| Parametric Technology Corp. (b) | | 2,445,283 | 180,364,074 |
| Paylocity Holding Corp. (b) | | 66,028 | 3,088,130 |
| RealPage, Inc. (b) | | 16,400 | 856,900 |
| Salesforce.com, Inc. (b) | | 1,778,092 | 206,703,195 |
| Snap, Inc. Class A (a)(b) | | 1,165,900 | 20,193,388 |
| SS&C Technologies Holdings, Inc. | | 142,800 | 7,071,456 |
| Ultimate Software Group, Inc. (b) | | 620,063 | 147,860,223 |
| Workday, Inc. Class A (b) | | 364,700 | 46,196,549 |
| Zendesk, Inc. (b) | | 758,275 | 32,742,315 |
| | | | 1,126,234,517 |
| Home Entertainment Software - 6.2% | | | |
| Activision Blizzard, Inc. | | 2,023,000 | 147,941,990 |
| Electronic Arts, Inc. (b) | | 1,074,500 | 132,915,650 |
| Nintendo Co. Ltd. | | 199,800 | 91,080,778 |
| Nintendo Co. Ltd. ADR | | 673,700 | 38,434,585 |
| Take-Two Interactive Software, Inc. (b) | | 319,100 | 35,697,717 |
| | | | 446,070,720 |
| Systems Software - 8.7% | | | |
| Microsoft Corp. | | 5,485,840 | 514,407,217 |
| Oracle Corp. | | 605,151 | 30,663,001 |
| Red Hat, Inc. (b) | | 384,000 | 56,601,600 |
| Tableau Software, Inc. (b) | | 337,400 | 27,555,458 |
| | | | 629,227,276 |
|
| TOTAL SOFTWARE | | | 2,201,532,513 |
|
| Technology Hardware, Storage & Peripherals - 8.9% | | | |
| Technology Hardware, Storage & Peripherals - 8.9% | | | |
| Apple, Inc. | | 3,505,897 | 624,470,374 |
| Primax Electronics Ltd. | | 9,123,000 | 22,927,378 |
| | | | 647,397,752 |
| TOTAL COMMON STOCKS | | | |
| (Cost $4,998,158,072) | | | 7,063,798,232 |
|
| Convertible Preferred Stocks - 1.0% | | | |
| Food & Staples Retailing - 0.2% | | | |
| Food Retail - 0.2% | | | |
| Roofoods Ltd. Series F (c)(d) | | 41,041 | 14,510,890 |
| Internet & Direct Marketing Retail - 0.5% | | | |
| Internet & Direct Marketing Retail - 0.5%�� | | | |
| China Internet Plus Holdings Ltd.: | | | |
| Series A-11 (b)(c)(d) | | 2,802,162 | 15,661,452 |
| Series B (b)(c)(d) | | 3,918,573 | 21,901,140 |
| | | | 37,562,592 |
| Internet Software & Services - 0.3% | | | |
| Internet Software & Services - 0.3% | | | |
| Uber Technologies, Inc. Series D, 8.00% (b)(c)(d) | | 515,696 | 18,100,930 |
| TOTAL CONVERTIBLE PREFERRED STOCKS | | | |
| (Cost $46,496,557) | | | 70,174,412 |
|
| Money Market Funds - 8.2% | | | |
| Fidelity Cash Central Fund, 1.41% (f) | | 169,041,856 | 169,075,664 |
| Fidelity Securities Lending Cash Central Fund 1.42% (f)(g) | | 427,810,129 | 427,852,910 |
| TOTAL MONEY MARKET FUNDS | | | |
| (Cost $596,928,574) | | | 596,928,574 |
| TOTAL INVESTMENT IN SECURITIES - 106.7% | | | |
| (Cost $5,641,583,203) | | | 7,730,901,218 |
| NET OTHER ASSETS (LIABILITIES) - (6.7)% | | | (488,601,059) |
| NET ASSETS - 100% | | | $7,242,300,159 |
Legend
(a) Security or a portion of the security is on loan at period end.
(b) Non-income producing
(c) Level 3 security
(d) Restricted securities - Investment in securities not registered under the Securities Act of 1933 (excluding 144A issues). At the end of the period, the value of restricted securities (excluding 144A issues) amounted to $74,419,761 or 1.0% of net assets.
(e) Security exempt from registration under Rule 144A of the Securities Act of 1933. These securities may be resold in transactions exempt from registration, normally to qualified institutional buyers. At the end of the period, the value of these securities amounted to $8,477,029 or 0.1% of net assets.
(f) Affiliated fund that is generally available only to investment companies and other accounts managed by Fidelity Investments. The rate quoted is the annualized seven-day yield of the fund at period end. A complete unaudited listing of the fund's holdings as of its most recent quarter end is available upon request. In addition, each Fidelity Central Fund's financial statements, which are not covered by the Fund's Report of Independent Registered Public Accounting Firm, are available on the SEC's website or upon request.
(g) Investment made with cash collateral received from securities on loan.
Additional information on each restricted holding is as follows:
| Security | Acquisition Date | Acquisition Cost |
| China Internet Plus Holdings Ltd. Class B | 11/16/16 | $2,140,730 |
| China Internet Plus Holdings Ltd. Series A-11 | 1/26/15 | $8,857,214 |
| China Internet Plus Holdings Ltd. Series B | 12/11/15 | $15,128,435 |
| Roofoods Ltd. Series F | 9/12/17 | $14,510,890 |
| Uber Technologies, Inc. Series D, 8.00% | 6/6/14 | $8,000,018 |
Affiliated Central Funds
Information regarding fiscal year to date income earned by the Fund from investments in Fidelity Central Funds is as follows:
| Fund | Income earned |
| Fidelity Cash Central Fund | $1,253,100 |
| Fidelity Securities Lending Cash Central Fund | 4,905,258 |
| Total | $6,158,358 |
Amounts in the income column in the above table include any capital gain distributions from underlying funds, which are presented in the corresponding line-item in the Statement of Operations if applicable.
Investment Valuation
The following is a summary of the inputs used, as of February 28, 2018, involving the Fund's assets and liabilities carried at fair value. The inputs or methodology used for valuing securities may not be an indication of the risk associated with investing in those securities. For more information on valuation inputs, and their aggregation into the levels used below, please refer to the Investment Valuation section in the accompanying Notes to Financial Statements.
| | Valuation Inputs at Reporting Date: |
| Description | Total | Level 1 | Level 2 | Level 3 |
| Investments in Securities: | | | | |
| Common Stocks | $7,063,798,232 | $5,915,520,255 | $1,141,904,653 | $6,373,324 |
| Convertible Preferred Stocks | 70,174,412 | -- | -- | 70,174,412 |
| Money Market Funds | 596,928,574 | 596,928,574 | -- | -- |
| Total Investments in Securities: | $7,730,901,218 | $6,512,448,829 | $1,141,904,653 | $76,547,736 |
The following is a summary of transfers between Level 1 and Level 2 for the period ended February 28, 2018. Transfers are assumed to have occurred at the beginning of the period, and are primarily attributable to the valuation techniques used for foreign equity securities, as discussed in the accompanying Notes to Financial Statements:
| Transfers | Total |
| Level 1 to Level 2 | $217,418,086 |
| Level 2 to Level 1 | $0 |
Other Information
Distribution of investments by country or territory of incorporation, as a percentage of Total Net Assets, is as follows (Unaudited):
| United States of America | 75.0% |
| Cayman Islands | 9.5% |
| Taiwan | 5.7% |
| Japan | 4.7% |
| Austria | 1.7% |
| South Africa | 1.2% |
| Netherlands | 1.1% |
| Others (Individually Less Than 1%) | 1.1% |
| | 100.0% |
See accompanying notes which are an integral part of the financial statements.
Technology Portfolio
Financial Statements
Statement of Assets and Liabilities
| | | February 28, 2018 |
| Assets | | |
Investment in securities, at value (including securities loaned of $406,741,815) — See accompanying schedule:
Unaffiliated issuers (cost $5,044,654,629) | $7,133,972,644 | |
| Fidelity Central Funds (cost $596,928,574) | 596,928,574 | |
| Total Investment in Securities (cost $5,641,583,203) | | $7,730,901,218 |
| Receivable for fund shares sold | | 15,552,030 |
| Dividends receivable | | 4,596,740 |
| Distributions receivable from Fidelity Central Funds | | 814,921 |
| Prepaid expenses | | 18,628 |
| Other receivables | | 412,907 |
| Total assets | | 7,752,296,444 |
| Liabilities | | |
| Payable for investments purchased | $72,358,465 | |
| Payable for fund shares redeemed | 5,017,380 | |
| Accrued management fee | 3,146,976 | |
| Other affiliated payables | 941,781 | |
| Other payables and accrued expenses | 673,913 | |
| Collateral on securities loaned | 427,857,770 | |
| Total liabilities | | 509,996,285 |
| Net Assets | | $7,242,300,159 |
| Net Assets consist of: | | |
| Paid in capital | | $4,484,994,305 |
| Distributions in excess of net investment income | | (247,344) |
| Accumulated undistributed net realized gain (loss) on investments and foreign currency transactions | | 668,232,097 |
| Net unrealized appreciation (depreciation) on investments and assets and liabilities in foreign currencies | | 2,089,321,101 |
| Net Assets, for 37,416,103 shares outstanding | | $7,242,300,159 |
| Net Asset Value, offering price and redemption price per share ($7,242,300,159 ÷ 37,416,103 shares) | | $193.56 |
See accompanying notes which are an integral part of the financial statements.
Statement of Operations
| | | Year ended February 28, 2018 |
| Investment Income | | |
| Dividends | | $37,808,930 |
| Income from Fidelity Central Funds (including $4,905,258 from security lending) | | 6,158,358 |
| Total income | | 43,967,288 |
| Expenses | | |
| Management fee | $31,858,646 | |
| Transfer agent fees | 9,130,039 | |
| Accounting and security lending fees | 1,193,169 | |
| Custodian fees and expenses | 872,013 | |
| Independent trustees' fees and expenses | 120,128 | |
| Registration fees | 275,612 | |
| Audit | 54,995 | |
| Legal | 62,997 | |
| Interest | 3,949 | |
| Miscellaneous | 146,747 | |
| Total expenses before reductions | 43,718,295 | |
| Expense reductions | (325,926) | 43,392,369 |
| Net investment income (loss) | | 574,919 |
| Realized and Unrealized Gain (Loss) | | |
| Net realized gain (loss) on: | | |
| Investment securities: | | |
| Unaffiliated issuers | 1,013,043,421 | |
| Fidelity Central Funds | (5,284) | |
| Foreign currency transactions | (201,794) | |
| Total net realized gain (loss) | | 1,012,836,343 |
| Change in net unrealized appreciation (depreciation) on: | | |
| Investment securities: | | |
| Unaffiliated issuers | 1,037,591,923 | |
| Fidelity Central Funds | (24,076) | |
| Assets and liabilities in foreign currencies | (54,266) | |
| Total change in net unrealized appreciation (depreciation) | | 1,037,513,581 |
| Net gain (loss) | | 2,050,349,924 |
| Net increase (decrease) in net assets resulting from operations | | $2,050,924,843 |
See accompanying notes which are an integral part of the financial statements.
Statement of Changes in Net Assets
| | Year ended February 28, 2018 | Year ended February 28, 2017 |
| Increase (Decrease) in Net Assets | | |
| Operations | | |
| Net investment income (loss) | $574,919 | $3,650,721 |
| Net realized gain (loss) | 1,012,836,343 | 261,066,743 |
| Change in net unrealized appreciation (depreciation) | 1,037,513,581 | 806,087,128 |
| Net increase (decrease) in net assets resulting from operations | 2,050,924,843 | 1,070,804,592 |
| Distributions to shareholders from net investment income | (272,638) | (1,878,708) |
| Distributions to shareholders from net realized gain | (484,814,934) | (51,148,484) |
| Total distributions | (485,087,572) | (53,027,192) |
| Share transactions | | |
| Proceeds from sales of shares | 3,144,473,009 | 875,621,785 |
| Reinvestment of distributions | 464,201,228 | 50,893,756 |
| Cost of shares redeemed | (2,051,700,173) | (602,177,811) |
| Net increase (decrease) in net assets resulting from share transactions | 1,556,974,064 | 324,337,730 |
| Redemption fees | – | 28,097 |
| Total increase (decrease) in net assets | 3,122,811,335 | 1,342,143,227 |
| Net Assets | | |
| Beginning of period | 4,119,488,824 | 2,777,345,597 |
| End of period | $7,242,300,159 | $4,119,488,824 |
| Other Information | | |
| Distributions in excess of net investment income end of period | $(247,344) | $(121,462) |
| Shares | | |
| Sold | 18,136,869 | 6,614,908 |
| Issued in reinvestment of distributions | 2,768,312 | 402,895 |
| Redeemed | (11,521,427) | (4,756,350) |
| Net increase (decrease) | 9,383,754 | 2,261,453 |
See accompanying notes which are an integral part of the financial statements.
Financial Highlights
Technology Portfolio
| | | | | | |
| Years ended February 28, | 2018 | 2017 | 2016 A | 2015 | 2014 |
| Selected Per–Share Data | | | | | |
| Net asset value, beginning of period | $146.95 | $107.77 | $120.85 | $130.70 | $104.11 |
| Income from Investment Operations | | | | | |
| Net investment income (loss)B | .02 | .14 | .13 | .16 | .06 |
| Net realized and unrealized gain (loss) | 61.46 | 41.04 | (8.26) | 10.26 | 36.34 |
| Total from investment operations | 61.48 | 41.18 | (8.13) | 10.42 | 36.40 |
| Distributions from net investment income | (.01) | (.07) | (.10) | (.17) | (.09)C |
| Distributions from net realized gain | (14.86) | (1.93) | (4.85) | (20.10) | (9.72)C |
| Total distributions | (14.87) | (2.00) | (4.95) | (20.27) | (9.81) |
| Redemption fees added to paid in capitalB | – | –D | –D | –D | –D |
| Net asset value, end of period | $193.56 | $146.95 | $107.77 | $120.85 | $130.70 |
| Total ReturnE | 43.71% | 38.52% | (7.16)% | 9.97% | 36.20% |
| Ratios to Average Net AssetsF,G | | | | | |
| Expenses before reductions | .75% | .77% | .78% | .78% | .80% |
| Expenses net of fee waivers, if any | .75% | .77% | .77% | .78% | .80% |
| Expenses net of all reductions | .74% | .76% | .76% | .78% | .77% |
| Net investment income (loss) | .01% | .11% | .11% | .13% | .05% |
| Supplemental Data | | | | | |
| Net assets, end of period (000 omitted) | $7,242,300 | $4,119,489 | $2,777,346 | $2,824,848 | $2,411,391 |
| Portfolio turnover rateH | 71% | 82% | 130% | 144% | 181% |
A For the year ended February 29.
B Calculated based on average shares outstanding during the period.
C The amounts shown reflect certain reclassifications related to book to tax differences that were made in the year shown.
D Amount represents less than $.005 per share.
E Total returns would have been lower if certain expenses had not been reduced during the applicable periods shown.
F Fees and expenses of any underlying Fidelity Central Funds are not included in the Fund's expense ratio. The Fund indirectly bears its proportionate share of the expenses of any underlying Fidelity Central Funds.
G Expense ratios reflect operating expenses of the Fund. Expenses before reductions do not reflect amounts reimbursed by the investment adviser or reductions from brokerage service arrangements or reductions from other expense offset arrangements and do not represent the amount paid by the Fund during periods when reimbursements or reductions occur. Expenses net of fee waivers reflect expenses after reimbursement by the investment adviser but prior to reductions from brokerage service arrangements or other expense offset arrangements. Expenses net of all reductions represent the net expenses paid by the Fund.
H Amount does not include the portfolio activity of any underlying Fidelity Central Funds.
See accompanying notes which are an integral part of the financial statements.
Notes to Financial Statements
For the period ended February 28, 2018
1. Organization.
Communications Equipment Portfolio, Computers Portfolio, IT Services Portfolio, Semiconductors Portfolio, Software and IT Services Portfolio, and Technology Portfolio (the Funds) are non-diversified funds of Fidelity Select Portfolios (the Trust). The Trust is registered under the Investment Company Act of 1940, as amended (the 1940 Act), as an open-end management investment company organized as a Massachusetts business trust. The Funds invest primarily in securities of companies whose principal business activities fall within specific industries. Each Fund is authorized to issue an unlimited number of shares. Share transactions on the Statement of Changes in Net Assets may contain exchanges between affiliated funds. Certain Funds' investments in emerging markets can be subject to social, economic, regulatory, and political uncertainties and can be extremely volatile.
2. Investments in Fidelity Central Funds.
The Funds invest in Fidelity Central Funds, which are open-end investment companies generally available only to other investment companies and accounts managed by the investment adviser and its affiliates. The Funds' Schedules of Investments list each of the Fidelity Central Funds held as of period end, if any, as an investment of each Fund, but do not include the underlying holdings of each Fidelity Central Fund. As an Investing Fund, each Fund indirectly bears its proportionate share of the expenses of the underlying Fidelity Central Funds.
The Money Market Central Funds seek preservation of capital and current income and are managed by Fidelity Investments Money Management, Inc. (FIMM), an affiliate of the investment adviser. Annualized expenses of the Money Market Central Funds as of their most recent shareholder report date are less than .005%.
A complete unaudited list of holdings for each Fidelity Central Fund is available upon request or at the Securities and Exchange Commission (the SEC) website at www.sec.gov. In addition, the financial statements of the Fidelity Central Funds, which are not covered by the Funds' Report of Independent Registered Public Accounting Firm, are available on the SEC website or upon request.
3. Significant Accounting Policies.
Each Fund is an investment company and applies the accounting and reporting guidance of the Financial Accounting Standards Board (FASB) Accounting Standards Codification Topic 946 Financial Services – Investments Companies. The financial statements have been prepared in conformity with accounting principles generally accepted in the United States of America (GAAP), which require management to make certain estimates and assumptions at the date of the financial statements. Actual results could differ from those estimates. Subsequent events, if any, through the date that the financial statements were issued have been evaluated in the preparation of the financial statements. The following summarizes the significant accounting policies of the Funds:
Investment Valuation. Investments are valued as of 4:00 p.m. Eastern time on the last calendar day of the period. The Board of Trustees (the Board) has delegated the day to day responsibility for the valuation of each Fund's investments to the Fair Value Committee (the Committee) established by each Fund's investment adviser. In accordance with valuation policies and procedures approved by the Board, each Fund attempts to obtain prices from one or more third party pricing vendors or brokers to value its investments. When current market prices, quotations or currency exchange rates are not readily available or reliable, investments will be fair valued in good faith by the Committee, in accordance with procedures adopted by the Board. Factors used in determining fair value vary by investment type and may include market or investment specific events. The frequency with which these procedures are used cannot be predicted and they may be utilized to a significant extent. The Committee oversees each Fund's valuation policies and procedures and reports to the Board on the Committee's activities and fair value determinations. The Board monitors the appropriateness of the procedures used in valuing each Fund's investments and ratifies the fair value determinations of the Committee.
Each Fund categorizes the inputs to valuation techniques used to value its investments into a disclosure hierarchy consisting of three levels as shown below:
- Level 1 – quoted prices in active markets for identical investments
- Level 2 – other significant observable inputs (including quoted prices for similar investments, interest rates, prepayment speeds, etc.)
- Level 3 – unobservable inputs (including the Fund's own assumptions based on the best information available)
Valuation techniques used to value each Fund's investments by major category are as follows:
Equity securities, including restricted securities, for which market quotations are readily available, are valued at the last reported sale price or official closing price as reported by a third party pricing vendor on the primary market or exchange on which they are traded and are categorized as Level 1 in the hierarchy. In the event there were no sales during the day or closing prices are not available, securities are valued at the last quoted bid price or may be valued using the last available price and are generally categorized as Level 2 in the hierarchy. For foreign equity securities, when market or security specific events arise, comparisons to the valuation of American Depositary Receipts (ADRs), futures contracts, Exchange-Traded Funds (ETFs) and certain indexes as well as quoted prices for similar securities may be used and would be categorized as Level 2 in the hierarchy. Utilizing these techniques may result in transfers between Level 1 and Level 2. For equity securities, including restricted securities, where observable inputs are limited, assumptions about market activity and risk are used and these securities may be categorized as Level 3 in the hierarchy.
Investments in open-end mutual funds, including the Fidelity Central Funds, are valued at their closing net asset value (NAV) each business day and are categorized as Level 1 in the hierarchy.
Changes in valuation techniques may result in transfers in or out of an assigned level within the disclosure hierarchy. The aggregate value of investments by input level as of February 28, 2018, including information on transfers between Levels 1 and 2 is included at the end of each applicable Fund's Schedule of Investments.
Foreign Currency. The Funds may use foreign currency contracts to facilitate transactions in foreign-denominated securities. Gains and losses from these transactions may arise from changes in the value of the foreign currency or if the counterparties do not perform under the contracts' terms.
Foreign-denominated assets, including investment securities, and liabilities are translated into U.S. dollars at the exchange rates at period end. Purchases and sales of investment securities, income and dividends received and expenses denominated in foreign currencies are translated into U.S. dollars at the exchange rate in effect on the transaction date.
The effects of exchange rate fluctuations on investments are included with the net realized and unrealized gain (loss) on investment securities. Other foreign currency transactions resulting in realized and unrealized gain (loss) are disclosed separately.
Investment Transactions and Income. For financial reporting purposes, the Funds' investment holdings and NAV include trades executed through the end of the last business day of the period. The NAV per share for processing shareholder transactions is calculated as of the close of business of the New York Stock Exchange (NYSE), normally 4:00 p.m. Eastern time and includes trades executed through the end of the prior business day. Gains and losses on securities sold are determined on the basis of identified cost and includes proceeds received from litigation. Dividend income is recorded on the ex-dividend date, except for certain dividends from foreign securities where the ex-dividend date may have passed, which are recorded as soon as the Funds are informed of the ex-dividend date. Non-cash dividends included in dividend income, if any, are recorded at the fair market value of the securities received. Income and capital gain distributions from Fidelity Central Funds, if any, are recorded on the ex-dividend date. Certain distributions received by the Funds represent a return of capital or capital gain. The Funds determine the components of these distributions subsequent to the ex-dividend date, based upon receipt of tax filings or other correspondence relating to the underlying investment. These distributions are recorded as a reduction of cost of investments and/or as a realized gain. During the period, dividend income has been reduced $683,379 for Communications Equipment Portfolio and reduced $7,831,475 for Semiconductors Portfolio, with a corresponding increase to net unrealized appreciation (depreciation) as a result of a change in the prior period estimate, which had no impact on the total net assets or total return of the Funds. Interest income is accrued as earned and includes coupon interest and amortization of premium and accretion of discount on debt securities as applicable. Investment income is recorded net of foreign taxes withheld where recovery of such taxes is uncertain.
Expenses. Expenses directly attributable to a fund are charged to that fund. Expenses attributable to more than one fund are allocated among the respective funds on the basis of relative net assets or other appropriate methods. Expense estimates are accrued in the period to which they relate and adjustments are made when actual amounts are known.
Deferred Trustee Compensation. Under a Deferred Compensation Plan (the Plan) for Computers Portfolio, Semiconductors Portfolio, Software and IT Services Portfolio and Technology Portfolio, independent Trustees may elect to defer receipt of a portion of their annual compensation. Deferred amounts are invested in a cross-section of Fidelity funds, are marked-to-market and remain in the Fund until distributed in accordance with the Plan. The investment of deferred amounts and the offsetting payable to the Trustees are included in the accompanying Statement of Assets and Liabilities.
Income Tax Information and Distributions to Shareholders. Each year, each Fund intends to qualify as a regulated investment company under Subchapter M of the Internal Revenue Code, including distributing substantially all of its taxable income and realized gains. As a result, no provision for U.S. Federal income taxes is required. As of February 28, 2018, each Fund did not have any unrecognized tax benefits in the financial statements; nor is each Fund aware of any tax positions for which it is reasonably possible that the total amounts of unrecognized tax benefits will significantly change in the next twelve months. Each Fund files a U.S. federal tax return, in addition to state and local tax returns as required. Each Fund's federal income tax returns are subject to examination by the Internal Revenue Service (IRS) for a period of three fiscal years after they are filed. State and local tax returns may be subject to examination for an additional fiscal year depending on the jurisdiction. Foreign taxes are provided for based on each Fund's understanding of the tax rules and rates that exist in the foreign markets in which it invests.
Distributions are declared and recorded on the ex-dividend date. Income and capital gain distributions are determined in accordance with income tax regulations, which may differ from GAAP. These differences resulted in distribution reclassifications. In addition, certain Funds claimed a portion of the payment made to redeeming shareholders as a distribution for income tax purposes.
Capital accounts within the financial statements are adjusted for permanent book-tax differences. These adjustments have no impact on net assets or the results of operations. Capital accounts are not adjusted for temporary book-tax differences which will reverse in a subsequent period.
Book-tax differences are primarily due to foreign currency transactions, market discount, passive foreign investment companies (PFIC), deferred trustees compensation, net operating losses, and losses deferred due to wash sales and excise tax regulations.
As of period end, the cost and unrealized appreciation (depreciation) in securities, and derivatives if applicable, for federal income tax purposes were as follows for each Fund:
| | Tax cost | Gross unrealized appreciation | Gross unrealized depreciation | Net unrealized appreciation (depreciation) |
| Communications Equipment Portfolio | $180,326,445 | $52,611,817 | $(5,901,730) | $46,710,087 |
| Computers Portfolio | 302,673,800 | 237,591,601 | (4,494,669) | 233,096,932 |
| IT Services Portfolio | 1,297,429,801 | 1,017,928,917 | (20,619,393) | 997,309,524 |
| Semiconductors Portfolio | 2,864,673,286 | 941,256,110 | (75,121,102) | 866,135,008 |
| Software and IT Services Portfolio | 3,019,913,484 | 2,572,838,209 | (43,657,595) | 2,529,180,614 |
| Technology Portfolio | 5,662,956,342 | 2,170,485,411 | (102,540,535) | 2,067,944,876 |
The tax-based components of distributable earnings as of period end were as follows for each Fund:
| | Undistributed ordinary income | Undistributed long-term capital gain | Net unrealized appreciation (depreciation) on securities and other investments |
| Communications Equipment Portfolio | $2,694,423 | $10,178,453 | $46,710,012 |
| Computers Portfolio | 1,801,451 | – | 233,005,656 |
| IT Services Portfolio | 388,251 | 35,103,678 | 997,302,190 |
| Semiconductors Portfolio | 98,458,783 | 103,464,299 | 866,132,364 |
| Software and IT Services Portfolio | 22,353,704 | 82,469,957 | 2,529,107,061 |
| Technology Portfolio | 226,338,161 | 463,267,076 | 2,067,947,962 |
In addition, certain of the Funds intend to elect to defer to the next fiscal year capital losses recognized during the period November 1, 2017 to February 28, 2018, and ordinary losses recognized during the period January 1, 2018 to February 28, 2018. Loss deferrals were as follows:
| | Capital losses | Ordinary losses |
| Communications Equipment Portfolio | $– | $(422,185) |
| Computers Portfolio | (879,210) | – |
| Semiconductors Portfolio | – | (11,103,403) |
The tax character of distributions paid was as follows:
| February 28, 2018 | | | |
| | Ordinary Income | Long-term Capital Gains | Total |
| Communications Equipment Portfolio | $2,537,101 | $804,161 | $3,341,262 |
| Computers Portfolio | 10,201,254 | 47,002,141 | 57,203,395 |
| IT Services Portfolio | 2,702,217 | 60,416,453 | 63,118,670 |
| Semiconductors Portfolio | 236,050,759 | 235,616,049 | 471,666,808 |
| Software and IT Services Portfolio | 77,868,471 | 262,448,441 | 340,316,912 |
| Technology Portfolio | 243,491,935 | 241,595,637 | 485,087,572 |
| February 28, 2017 | | | |
| | Ordinary Income | Long-term Capital Gains | Total |
| Communications Equipment Portfolio | $2,293,875 | $– | $2,293,875 |
| Computers Portfolio | 4,778,571 | 21,223,303 | 26,001,874 |
| IT Services Portfolio | 5,197,978 | – | 5,197,978 |
| Semiconductors Portfolio | 20,336,461 | 57,300,495 | 77,636,956 |
| Software and IT Services Portfolio | 50,482,973 | 97,615,618 | 148,098,591 |
| Technology Portfolio | 11,616,237 | 41,410,956 | 53,027,193 |
Trading (Redemption) Fees. Shares held by investors in the Communications Equipment Portfolio, Computers Portfolio, and Semiconductors Portfolio less than 30 days may be subject to a redemption fee equal to .75% of the NAV of shares redeemed. All redemption fees, which reduce the proceeds of the shareholder redemption, are retained by the Funds and accounted for as an addition to paid in capital. In November 2017, the Board of Trustees approved the elimination of these redemption fees effective December 18, 2017.
Restricted Securities. The Funds may invest in securities that are subject to legal or contractual restrictions on resale. These securities generally may be resold in transactions exempt from registration or to the public if the securities are registered. Disposal of these securities may involve time-consuming negotiations and expense, and prompt sale at an acceptable price may be difficult. Information regarding restricted securities is included at the end of each applicable Fund's Schedule of Investments.
4. Purchases and Sales of Investments.
Purchases and sales of securities, other than short-term securities, are noted in the table below.
| | Purchases ($) | Sales ($) |
| Communications Equipment Portfolio | 107,963,460 | 122,269,323 |
| Computers Portfolio | 298,796,058 | 335,094,645 |
| IT Services Portfolio | 524,196,042 | 481,257,716 |
| Semiconductors Portfolio | 3,467,552,245 | 3,752,621,686 |
| Software and IT Services Portfolio | 1,416,102,616 | 1,478,198,561 |
| Technology Portfolio | 5,144,688,892 | 4,081,571,774 |
5. Fees and Other Transactions with Affiliates.
Management Fee. Fidelity SelectCo, LLC (the investment adviser) and its affiliates provide the Funds with investment management related services for which the Funds pay a monthly management fee. The management fee is the sum of an individual fund fee rate and an annualized group fee rate. The individual fund fee rate is applied to each Fund's average net assets. The group fee rate is based upon the average net assets of all the mutual funds advised by Fidelity Management & Research Company (FMR) and the investment adviser. The group fee rate decreases as assets under management increase and increases as assets under management decrease. For the reporting period, each Fund's annual management fee rate expressed as a percentage of each Fund's average net assets was as follows:
| | Individual Rate | Group Rate | Total |
| Communications Equipment Portfolio | .30% | .24% | .54% |
| Computers Portfolio | .30% | .24% | .54% |
| IT Services Portfolio | .30% | .24% | .54% |
| Semiconductors Portfolio | .30% | .24% | .54% |
| Software and IT Services Portfolio | .30% | .24% | .54% |
| Technology Portfolio | .30% | .24% | .54% |
Transfer Agent Fees. Fidelity Investments Institutional Operations Company, Inc. (FIIOC), an affiliate of the investment adviser, is the Funds' transfer, dividend disbursing and shareholder servicing agent. FIIOC receives account fees and asset-based fees that vary according to account size and type of account. FIIOC pays for typesetting, printing and mailing of shareholder reports, except proxy statements. For the period, transfer agent fees were equivalent to the following annual rates expressed as a percentage of average net assets:
| Communications Equipment Portfolio | .22% |
| Computers Portfolio | .18% |
| IT Services Portfolio | .18% |
| Semiconductors Portfolio | .16% |
| Software and IT Services Portfolio | .16% |
| Technology Portfolio | .16% |
Accounting and Security Lending Fees. Fidelity Service Company, Inc. (FSC), an affiliate of the investment adviser, maintains each Fund's accounting records. The accounting fee is based on the level of average net assets for each month. Under a separate contract, FSC administers the security lending program. The security lending fee is based on the number and duration of lending transactions.
Brokerage Commissions. Certain Funds placed a portion of their portfolio transactions with brokerage firms which are affiliates of the investment adviser. Brokerage commissions are included in net realized gain (loss) and change in net unrealized appreciation (depreciation) in the Statement of Operations. The commissions paid to these affiliated firms were as follows:
| | Amount |
| Communications Equipment Portfolio | $6,716 |
| Computers Portfolio | 9,920 |
| IT Services Portfolio | 11,263 |
| Semiconductors Portfolio | 174,706 |
| Software and IT Services Portfolio | 42,377 |
| Technology Portfolio | 138,912 |
Interfund Lending Program. Pursuant to an Exemptive Order issued by the SEC, the Funds, along with other registered investment companies having management contracts with Fidelity Management & Research Company (FMR) or other affiliated entities of FMR, may participate in an interfund lending program. This program provides an alternative credit facility allowing the funds to borrow from, or lend money to, other participating affiliated funds. At period end, there were no interfund loans outstanding. Each applicable fund's activity in this program during the period for which loans were outstanding was as follows:
| | Borrower or Lender | Average Loan Balance | Weighted Average Interest Rate | Interest Expense |
| Computers Portfolio | Borrower | $9,728,714 | 1.31% | $4,973 |
| Technology Portfolio | Borrower | 19,664,200 | 1.45% | $3,949 |
Interfund Trades. The Funds may purchase from or sell securities to other Fidelity Funds under procedures adopted by the Board. The procedures have been designed to ensure these interfund trades are executed in accordance with Rule 17a-7 of the 1940 Act. Interfund trades are included within the respective purchases and sales amounts shown in the Purchases and Sales of Investments note.
Other. During the period, the investment adviser reimbursed Software and IT Services Portfolio for certain losses in the amount of $2,455.
6. Committed Line of Credit.
Certain Funds participate with other funds managed by the investment adviser or an affiliate in a $4.25 billion credit facility (the "line of credit") to be utilized for temporary or emergency purposes to fund shareholder redemptions or for other short-term liquidity purposes. The participating funds have agreed to pay commitment fees on their pro-rata portion of the line of credit, which are reflected in Miscellaneous expenses on the Statement of Operations, and are as follows:
| Communications Equipment Portfolio | $596 |
| Computers Portfolio | 1,563 |
| IT Services Portfolio | 5,460 |
| Semiconductors Portfolio | 9,523 |
| Software and IT Services Portfolio | 13,536 |
| Technology Portfolio | 16,072 |
During the period, the Funds did not borrow on this line of credit.
7. Security Lending.
Certain Funds lend portfolio securities through a lending agent from time to time in order to earn additional income. On the settlement date of the loan, each applicable Fund receives collateral (in the form of U.S. Treasury obligations, letters of credit and/or cash) against the loaned securities and maintains collateral in an amount not less than 100% of the market value of the loaned securities during the period of the loan. The market value of the loaned securities is determined at the close of business of the Funds and any additional required collateral is delivered to the Funds on the next business day. The Funds or borrower may terminate the loan at any time, and if the borrower defaults on its obligation to return the securities loaned because of insolvency or other reasons, the Funds may apply collateral received from the borrower against the obligation. The Funds may experience delays and costs in recovering the securities loaned. Any cash collateral received is invested in the Fidelity Securities Lending Cash Central Fund. The value of loaned securities and cash collateral at period end are disclosed on each applicable Fund's Statement of Assets and Liabilities. Security lending income represents the income earned on investing cash collateral, less rebates paid to borrowers and any lending agent fees associated with the loan, plus any premium payments received for lending certain types of securities. Security lending income is presented on each applicable Fund's Statement of Operations as a component of income from Fidelity Central Funds.
8. Expense Reductions.
Commissions paid to certain brokers with whom the investment adviser, or its affiliates, places trades on behalf of Certain Funds include an amount in addition to trade execution, which may be rebated back to the Funds to offset certain expenses. In addition, through arrangements with each applicable Fund's custodian, credits realized as a result of certain uninvested cash balances were used to reduce each applicable Fund's expenses. All of the applicable expense reductions are noted in the table below.
| | Brokerage Service reduction | Custody expense reduction |
| Communications Equipment Portfolio | $6,558 | $– |
| Computers Portfolio | 53,488 | – |
| IT Services Portfolio | 30,134 | – |
| Semiconductors Portfolio | 317,371 | 129 |
| Software and IT Services Portfolio | 57,503 | 845 |
| Technology Portfolio | 279,749 | 83 |
In addition, during the period the investment adviser reimbursed and/or waived a portion of operating expenses as follows:
| | Amount |
| Communications Equipment Portfolio | $1,889 |
| Computers Portfolio | 4,518 |
| IT Services Portfolio | 17,570 |
| Semiconductors Portfolio | 28,374 |
| Software and IT Services Portfolio | 42,064 |
| Technology Portfolio | 46,094 |
9. Other.
The Funds' organizational documents provide former and current trustees and officers with a limited indemnification against liabilities arising in connection with the performance of their duties to the Funds. In the normal course of business, the Funds may also enter into contracts that provide general indemnifications. The Funds' maximum exposure under these arrangements is unknown as this would be dependent on future claims that may be made against the Funds. The risk of material loss from such claims is considered remote.
Report of Independent Registered Public Accounting Firm
To the Trustees of Fidelity Select Portfolios and the Shareholders of Communications Equipment Portfolio, Computers Portfolio, IT Services Portfolio, Semiconductors Portfolio, Software and IT Services Portfolio and Technology Portfolio:
Opinions on the Financial Statements
We have audited the accompanying statements of assets and liabilities, including the schedules of investments, of Communications Equipment Portfolio, Computers Portfolio, IT Services Portfolio, Semiconductors Portfolio, Software and IT Services Portfolio and Technology Portfolio (six of the funds constituting Fidelity Select Portfolios, hereafter collectively referred to as the "Funds") as of February 28, 2018, the related statements of operations for the year ended February 28, 2018, the statements of changes in net assets for each of the two years in the period ended February 28, 2018, including the related notes, and the financial highlights for each of the five years in the period ended February 28, 2018 (collectively referred to as the “financial statements”). In our opinion, the financial statements present fairly, in all material respects, the financial position of each of the Funds as of February 28, 2018, the results of each of their operations for the year then ended, the changes in each of their net assets for each of the two years in the period ended February 28, 2018 and each of the financial highlights for each of the five years in the period ended February 28, 2018 in conformity with accounting principles generally accepted in the United States of America.
Basis for Opinions
These financial statements are the responsibility of the Funds' management. Our responsibility is to express an opinion on the Funds' financial statements based on our audits. We are a public accounting firm registered with the Public Company Accounting Oversight Board (United States) (“PCAOB”) and are required to be independent with respect to the Funds in accordance with the U.S. federal securities laws and the applicable rules and regulations of the Securities and Exchange Commission and the PCAOB.
We conducted our audits of these financial statements in accordance with the standards of the PCAOB. Those standards require that we plan and perform the audit to obtain reasonable assurance about whether the financial statements are free of material misstatement, whether due to error or fraud.
Our audits included performing procedures to assess the risks of material misstatement of the financial statements, whether due to error or fraud, and performing procedures that respond to those risks. Such procedures included examining, on a test basis, evidence regarding the amounts and disclosures in the financial statements. Our audits also included evaluating the accounting principles used and significant estimates made by management, as well as evaluating the overall presentation of the financial statements. Our procedures included confirmation of securities owned as of February 28, 2018 by correspondence with the custodian and brokers; when replies were not received from brokers, we performed other auditing procedures. We believe that our audits provide a reasonable basis for our opinions.
PricewaterhouseCoopers LLP
Boston, Massachusetts
April 17, 2018
We have served as the auditor of one or more investment companies in the Fidelity group of funds since 1932.
Trustees and Officers
The Trustees, Members of the Advisory Board (if any), and officers of the trust and funds, as applicable, are listed below. The Board of Trustees governs each fund and is responsible for protecting the interests of shareholders. The Trustees are experienced executives who meet periodically throughout the year to oversee each fund's activities, review contractual arrangements with companies that provide services to each fund, oversee management of the risks associated with such activities and contractual arrangements, and review each fund's performance. Except for Michael E. Wiley, each of the Trustees oversees 281 funds. Mr. Wiley oversees 193 funds.
The Trustees hold office without limit in time except that (a) any Trustee may resign; (b) any Trustee may be removed by written instrument, signed by at least two-thirds of the number of Trustees prior to such removal; (c) any Trustee who requests to be retired or who has become incapacitated by illness or injury may be retired by written instrument signed by a majority of the other Trustees; and (d) any Trustee may be removed at any special meeting of shareholders by a two-thirds vote of the outstanding voting securities of the trust. Each Trustee who is not an interested person (as defined in the 1940 Act) of the trust and the funds is referred to herein as an Independent Trustee. Each Independent Trustee shall retire not later than the last day of the calendar year in which his or her 75th birthday occurs. The Independent Trustees may waive this mandatory retirement age policy with respect to individual Trustees. Officers and Advisory Board Members hold office without limit in time, except that any officer or Advisory Board Member may resign or may be removed by a vote of a majority of the Trustees at any regular meeting or any special meeting of the Trustees. Except as indicated, each individual has held the office shown or other offices in the same company for the past five years.
Each fund’s Statement of Additional Information (SAI) includes more information about the Trustees. To request a free copy, call Fidelity at 1-800-544-8544.
Experience, Skills, Attributes, and Qualifications of the Trustees. The Governance and Nominating Committee has adopted a statement of policy that describes the experience, qualifications, attributes, and skills that are necessary and desirable for potential Independent Trustee candidates (Statement of Policy). The Board believes that each Trustee satisfied at the time he or she was initially elected or appointed a Trustee, and continues to satisfy, the standards contemplated by the Statement of Policy. The Governance and Nominating Committee also engages professional search firms to help identify potential Independent Trustee candidates who have the experience, qualifications, attributes, and skills consistent with the Statement of Policy. From time to time, additional criteria based on the composition and skills of the current Independent Trustees, as well as experience or skills that may be appropriate in light of future changes to board composition, business conditions, and regulatory or other developments, have also been considered by the professional search firms and the Governance and Nominating Committee. In addition, the Board takes into account the Trustees' commitment and participation in Board and committee meetings, as well as their leadership of standing and ad hoc committees throughout their tenure.
In determining that a particular Trustee was and continues to be qualified to serve as a Trustee, the Board has considered a variety of criteria, none of which, in isolation, was controlling. The Board believes that, collectively, the Trustees have balanced and diverse experience, qualifications, attributes, and skills, which allow the Board to operate effectively in governing each fund and protecting the interests of shareholders. Information about the specific experience, skills, attributes, and qualifications of each Trustee, which in each case led to the Board's conclusion that the Trustee should serve (or continue to serve) as a trustee of the funds, is provided below.
Board Structure and Oversight Function. James C. Curvey is an interested person and currently serves as Chairman. The Trustees have determined that an interested Chairman is appropriate and benefits shareholders because an interested Chairman has a personal and professional stake in the quality and continuity of services provided to the funds. Independent Trustees exercise their informed business judgment to appoint an individual of their choosing to serve as Chairman, regardless of whether the Trustee happens to be independent or a member of management. The Independent Trustees have determined that they can act independently and effectively without having an Independent Trustee serve as Chairman and that a key structural component for assuring that they are in a position to do so is for the Independent Trustees to constitute a substantial majority for the Board. The Independent Trustees also regularly meet in executive session. Ned C. Lautenbach serves as Chairman of the Independent Trustees and as such (i) acts as a liaison between the Independent Trustees and management with respect to matters important to the Independent Trustees and (ii) with management prepares agendas for Board meetings.
Fidelity® funds are overseen by different Boards of Trustees. The funds' Board oversees Fidelity's high income and certain equity funds, and other Boards oversee Fidelity's investment-grade bond, money market, asset allocation, and other equity funds. The asset allocation funds may invest in Fidelity® funds overseen by the funds' Board. The use of separate Boards, each with its own committee structure, allows the Trustees of each group of Fidelity® funds to focus on the unique issues of the funds they oversee, including common research, investment, and operational issues. On occasion, the separate Boards establish joint committees to address issues of overlapping consequences for the Fidelity® funds overseen by each Board.
The Trustees operate using a system of committees to facilitate the timely and efficient consideration of all matters of importance to the Trustees, each fund, and fund shareholders and to facilitate compliance with legal and regulatory requirements and oversight of the funds' activities and associated risks. The Board, acting through its committees, has charged SelectCo and its affiliates with (i) identifying events or circumstances the occurrence of which could have demonstrably adverse effects on the funds' business and/or reputation; (ii) implementing processes and controls to lessen the possibility that such events or circumstances occur or to mitigate the effects of such events or circumstances if they do occur; and (iii) creating and maintaining a system designed to evaluate continuously business and market conditions in order to facilitate the identification and implementation processes described in (i) and (ii) above. Because the day-to-day operations and activities of the funds are carried out by or through SelectCo, its affiliates, and other service providers, the funds' exposure to risks is mitigated but not eliminated by the processes overseen by the Trustees. While each of the Board's committees has responsibility for overseeing different aspects of the funds' activities, oversight is exercised primarily through the Operations, Audit, and Compliance Committees. In addition, the Independent Trustees have worked with Fidelity to enhance the Board's oversight of investment and financial risks, legal and regulatory risks, technology risks, and operational risks, including the development of additional risk reporting to the Board. Appropriate personnel, including but not limited to the funds' Chief Compliance Officer (CCO), SelectCo's internal auditor, the independent accountants, the funds' Treasurer and portfolio management personnel, make periodic reports to the Board's committees, as appropriate, including an annual review of Fidelity's risk management program for the Fidelity® funds. The responsibilities of each standing committee, including their oversight responsibilities, are described further under "Standing Committees of the Trustees."
Interested Trustees*:
Correspondence intended for a Trustee who is an interested person may be sent to Fidelity Investments, 245 Summer Street, Boston, Massachusetts 02210.
Name, Year of Birth; Principal Occupations and Other Relevant Experience+
James C. Curvey (1935)
Year of Election or Appointment: 2018
Trustee
Chairman of the Board of Trustees
Mr. Curvey also serves as Trustee of other Fidelity® funds. Mr. Curvey is a Director of Fidelity Research & Analysis Co. (investment adviser firm, 2009-present), and Vice Chairman (2007-present) and Director of FMR LLC (diversified financial services company). In addition, Mr. Curvey serves as an Overseer for the Boston Symphony Orchestra and a member of the board of Artis-Naples, Naples, Florida, and as a Trustee for Brewster Academy, Wolfeboro, New Hampshire. Previously, Mr. Curvey served as a Director of Fidelity Investments Money Management, Inc. (investment adviser firm, 2009-2014) and a Director of FMR and FMR Co., Inc. (investment adviser firms, 2007-2014).
Charles S. Morrison (1960)
Year of Election or Appointment: 2018
Trustee
Mr. Morrison also serves as Trustee of other funds. He serves as President of Fidelity SelectCo, LLC (investment adviser firm, 2017-present) and Fidelity Management & Research Company (FMR) (investment adviser firm, 2016-present), a Director of Fidelity Investments Money Management, Inc. (FIMM) (investment adviser firm, 2014-present), Director of Fidelity SelectCo, LLC (investment adviser firm, 2014-present), President, Asset Management (2014-present), and is an employee of Fidelity Investments. Previously, Mr. Morrison served as Vice President of Fidelity's Fixed Income and Asset Allocation Funds (2012-2014), President, Fixed Income (2011-2014), Vice President of Fidelity's Money Market Funds (2005-2009), President, Money Market Group Leader of FMR (investment adviser firm, 2009), and Senior Vice President, Money Market Group of FMR (2004-2009). Mr. Morrison also served as Vice President of Fidelity's Bond Funds (2002-2005), certain Balanced Funds (2002-2005), and certain Asset Allocation Funds (2002-2007), and as Senior Vice President (2002-2005) of Fidelity's Bond Division.
* Determined to be an "Interested Trustee" by virtue of, among other things, his or her affiliation with the trust or various entities under common control with SelectCo.
+ The information includes the Trustee's principal occupation during the last five years and other information relating to the experience, attributes, and skills relevant to the Trustee's qualifications to serve as a Trustee, which led to the conclusion that the Trustee should serve as a Trustee for each fund.
Independent Trustees:
Correspondence intended for an Independent Trustee may be sent to Fidelity Investments, P.O. Box 55235, Boston, Massachusetts 02205-5235.
Name, Year of Birth; Principal Occupations and Other Relevant Experience+
Dennis J. Dirks (1948)
Year of Election or Appointment: 2018
Trustee
Mr. Dirks also serves as Trustee of other Fidelity® funds. Prior to his retirement in May 2003, Mr. Dirks was Chief Operating Officer and a member of the Board of The Depository Trust & Clearing Corporation (DTCC). He also served as President, Chief Operating Officer, and Board member of The Depository Trust Company (DTC) and President and Board member of the National Securities Clearing Corporation (NSCC). In addition, Mr. Dirks served as Chief Executive Officer and Board member of the Government Securities Clearing Corporation, Chief Executive Officer and Board member of the Mortgage-Backed Securities Clearing Corporation, as a Trustee and a member of the Finance Committee of Manhattan College (2005-2008), as a Trustee and a member of the Finance Committee of AHRC of Nassau County (2006-2008), as a member of the Independent Directors Council (IDC) Governing Council (2010-2015), and as a member of the Board of Directors for The Brookville Center for Children’s Services, Inc. (2009-2017). Mr. Dirks is a member of the Finance Committee (2016-present) and Board of Directors (2017-present) of the Asolo Repertory Theatre.
Donald F. Donahue (1950)
Year of Election or Appointment: 2018
Trustee
Mr. Donahue also serves as a Trustee of other Fidelity® funds. Mr. Donahue is President and Chief Executive Officer of Miranda Partners, LLC (risk consulting for the financial services industry, 2012-present). Previously, Mr. Donahue served as a Member of the Advisory Board of certain Fidelity® funds (2015-2018) and Chief Executive Officer (2006-2012), Chief Operating Officer (2003-2006), and Managing Director, Customer Marketing and Development (1999-2003) of The Depository Trust & Clearing Corporation (financial markets infrastructure). Mr. Donahue serves as a Member (2007-present) and Co-Chairman (2016-present) of the Board of Directors of United Way of New York, Member of the Board of Directors of NYC Leadership Academy (2012-present) and Member of the Board of Advisors of Ripple Labs, Inc. (financial services, 2015-present). He also served as Chairman (2010-2012) and Member of the Board of Directors (2012-2013) of Omgeo, LLC (financial services), Treasurer of United Way of New York (2012-2016), and Member of the Board of Directors of XBRL US (financial services non-profit, 2009-2012) and the International Securities Services Association (2009-2012).
Alan J. Lacy (1953)
Year of Election or Appointment: 2018
Trustee
Mr. Lacy also serves as Trustee of other Fidelity® funds. Mr. Lacy serves as a Director of Bristol-Myers Squibb Company (global pharmaceuticals, 2008-present). He is a Trustee of the California Chapter of The Nature Conservancy (2015-present) and a Director of the Center for Advanced Study in the Behavioral Sciences at Stanford University (2015-present). In addition, Mr. Lacy served as Senior Adviser (2007-2014) of Oak Hill Capital Partners, L.P. (private equity) and also served as Chief Executive Officer (2005) and Vice Chairman (2005-2006) of Sears Holdings Corporation (retail) and Chief Executive Officer and Chairman of the Board of Sears, Roebuck and Co. (retail, 2000-2005). Previously, Mr. Lacy served as Chairman (2014-2017) and a member (2010-2017) of the Board of Directors of Dave & Buster’s Entertainment, Inc. (restaurant and entertainment complexes), as Chairman (2008-2011) and a member (2006-2015) of the Board of Trustees of the National Parks Conservation Association, and as a member of the Board of Directors for The Hillman Companies, Inc. (hardware wholesalers, 2010-2014), Earth Fare, Inc. (retail grocery, 2010-2014), and The Western Union Company (global money transfer, 2006-2011).
Ned C. Lautenbach (1944)
Year of Election or Appointment: 2018
Trustee
Chairman of the Independent Trustees
Mr. Lautenbach also serves as Trustee of other Fidelity® funds. Mr. Lautenbach currently serves as Vice Chair of the Board of Governors, State University System of Florida (2013-present) and is a member of the Council on Foreign Relations (1994-present). He is also a member and has most recently served as Chairman of the Board of Directors of Artis-Naples (2012-present). Previously, Mr. Lautenbach served as a member and then Lead Director of the Board of Directors of Eaton Corporation (diversified industrial, 1997-2016). He was also a Partner and Advisory Partner at Clayton, Dubilier & Rice, LLC (private equity investment, 1998-2010), as well as a Director of Sony Corporation (2006-2007). In addition, Mr. Lautenbach also had a 30-year career with IBM (technology company) during which time he served as Senior Vice President and a member of the Corporate Executive Committee (1968-1998).
Joseph Mauriello (1944)
Year of Election or Appointment: 2018
Trustee
Mr. Mauriello also serves as Trustee of other Fidelity® funds. Prior to his retirement in January 2006, Mr. Mauriello served in numerous senior management positions including Deputy Chairman and Chief Operating Officer (2004-2005), and Vice Chairman of Financial Services (2002-2004) of KPMG LLP US (professional services, 1965-2005). Mr. Mauriello currently serves as a member of the Board of Directors of XL Group plc. (global insurance and re-insurance, 2006-present) and the Independent Directors Council (IDC) Governing Council (2015-present). Previously, Mr. Mauriello served as a Director of the Hamilton Funds of the Bank of New York (2006-2007) and of Arcadia Resources Inc. (health care services and products, 2007-2012).
Cornelia M. Small (1944)
Year of Election or Appointment: 2018
Trustee
Ms. Small also serves as Trustee of other Fidelity® funds. Ms. Small is a member of the Board of Directors (2009-present) and Chair of the Investment Committee (2010-present) of the Teagle Foundation. Ms. Small also serves on the Investment Committee of the Berkshire Taconic Community Foundation (2008-present). Previously, Ms. Small served as Chairperson (2002-2008) and a member of the Investment Committee and Chairperson (2008-2012) and a member of the Board of Trustees of Smith College. In addition, Ms. Small served as Chief Investment Officer, Director of Global Equity Investments, and a member of the Board of Directors of Scudder, Stevens & Clark and Scudder Kemper Investments.
Garnett A. Smith (1947)
Year of Election or Appointment: 2013
Trustee
Mr. Smith also serves as Trustee of other Fidelity® funds. Prior to Mr. Smith's retirement, he served as Chairman and Chief Executive Officer of Inbrand Corp. (manufacturer of personal absorbent products, 1990-1997). He also served as President (1986-1990) of Inbrand Corp. Prior to his employment with Inbrand Corp., he was employed by a retail fabric chain and North Carolina National Bank. In addition, Mr. Smith served as a Member of the Advisory Board of certain Fidelity® funds (2012-2013) and as a board member of the Jackson Hole Land Trust (2009-2012).
David M. Thomas (1949)
Year of Election or Appointment: 2018
Trustee
Mr. Thomas also serves as Trustee of other Fidelity® funds. Mr. Thomas serves as Non-Executive Chairman of the Board of Directors of Fortune Brands Home and Security (home and security products, 2011-present), as a member of the Board of Directors (2004-present) and Presiding Director (2013-present) of Interpublic Group of Companies, Inc. (marketing communication), and as a member of the Board of Trustees of the University of Florida (2013-present). Previously, Mr. Thomas served as Executive Chairman (2005-2006) and Chairman and Chief Executive Officer (2000-2005) of IMS Health, Inc. (pharmaceutical and healthcare information solutions), and a Director of Fortune Brands, Inc. (consumer products, 2000-2011).
Michael E. Wiley (1950)
Year of Election or Appointment: 2008
Trustee
Mr. Wiley also serves as Trustee or Member of the Advisory Board of other Fidelity® funds. Mr. Wiley serves as a Director of Andeavor Corporation (independent oil refiner and marketer, 2005-present), a Director of Andeavor Logistics LP (natural resources logistics, 2015-present), and a Director of Bill Barrett Corporation (exploration and production, 2005-present). In addition, Mr. Wiley also serves as a Director of Post Oak Bank (privately-held bank, 2004-present). Previously, Mr. Wiley served as a Trustee of other Fidelity® funds (2008-2013), as a Director of Asia Pacific Exploration Consolidated (international oil and gas exploration and production, 2008-2013), as a member of the Board of Trustees of the University of Tulsa (2000-2006; 2007-2010), as a Senior Energy Advisor of Katzenbach Partners, LLC (consulting, 2006-2007), as an Advisory Director of Riverstone Holdings (private investment), Chairman, President, and CEO of Baker Hughes, Inc. (oilfield services, 2000-2004), and as Director of Spinnaker Exploration Company (exploration and production, 2001-2005).
+ The information includes the Trustee's principal occupation during the last five years and other information relating to the experience, attributes, and skills relevant to the Trustee's qualifications to serve as a Trustee, which led to the conclusion that the Trustee should serve as a Trustee for each fund.
Advisory Board Members and Officers:
Correspondence intended for a Member of the Advisory Board (if any) may be sent to Fidelity Investments, P.O. Box 55235, Boston, Massachusetts 02205-5235. Correspondence intended for an officer or Peter S. Lynch may be sent to Fidelity Investments, 245 Summer Street, Boston, Massachusetts 02210. Officers appear below in alphabetical order.
Name, Year of Birth; Principal Occupation
Peter S. Lynch (1944)
Year of Election or Appointment: 2018
Member of the Advisory Board
Mr. Lynch also serves as Member of the Advisory Board of other Fidelity® funds. Mr. Lynch is Vice Chairman and a Director of FMR (investment adviser firm) and FMR Co., Inc. (investment adviser firm). In addition, Mr. Lynch serves as a Trustee of Boston College and as the Chairman of the Inner-City Scholarship Fund. Previously, Mr. Lynch served on the Special Olympics International Board of Directors (1997-2006).
William S. Stavropoulos (1939)
Year of Election or Appointment: 2018
Member of the Advisory Board
Mr. Stavropoulos also serves as Member of the Advisory Board of other Fidelity® funds. Mr. Stavropoulos serves as President and Founder of the Michigan Baseball Foundation, the Great Lakes Loons (2007-present). Mr. Stavropoulos is Chairman Emeritus of the Board of Directors of The Dow Chemical Company, where he previously served in numerous senior management positions, including President, CEO (1995-2000; 2002-2004), Chairman of the Executive Committee (2000-2006), and as a member of the Board of Directors (1990-2006). Currently, Mr. Stavropoulos is Chairman of the Board of Directors of Univar Inc. (global distributor of commodity and specialty chemicals), a Director of Teradata Corporation (data warehousing and technology solutions), and a member of the Advisory Board for Metalmark Capital LLC (private equity investment, 2005-present). Mr. Stavropoulos is an operating advisor to Clayton, Dubilier & Rice, LLC (private equity investment). In addition, Mr. Stavropoulos is a member of the University of Notre Dame Advisory Council for the College of Science, a Trustee of the Rollin L. Gerstacker Foundation, and a Director of Artis-Naples in Naples, Florida. Previously, Mr. Stavropoulos served as Trustee of certain Fidelity® funds (2001-2018) and as a Director of Chemical Financial Corporation (bank holding company, 1993-2012) and Tyco International, Ltd. (multinational manufacturing and services, 2007-2012).
Carol B. Tomé (1957)
Year of Election or Appointment: 2017
Member of the Advisory Board
Ms. Tomé also serves as Member of the Advisory Board of other Fidelity® funds. Ms. Tomé is Chief Financial Officer (2001-present) and Executive Vice President of Corporate Services (2007-present) of The Home Depot, Inc. (home improvement retailer) and a Director (2003-present) and Chair of the Audit Committee (2004-present) of United Parcel Service, Inc. (package delivery and supply chain management). Previously, Ms. Tomé served as Trustee of certain Fidelity® funds (2017), Senior Vice President of Finance and Accounting/Treasurer (2000-2007) and Vice President and Treasurer (1995-2000) of The Home Depot, Inc. and Chair of the Board (2010-2012), Vice Chair of the Board (2009 and 2013), and a Director (2008-2013) of the Federal Reserve Bank of Atlanta. Ms. Tomé is also a director or trustee of many community and professional organizations.
Elizabeth Paige Baumann (1968)
Year of Election or Appointment: 2017
Anti-Money Laundering (AML) Officer
Ms. Baumann also serves as AML Officer of other funds. She is Chief AML Officer (2012-present) and Senior Vice President (2014-present) of FMR LLC (diversified financial services company) and is an employee of Fidelity Investments. Previously, Ms. Baumann served as AML Officer of the funds (2012-2016), and Vice President (2007-2014) and Deputy Anti-Money Laundering Officer (2007-2012) of FMR LLC.
Marc R. Bryant (1966)
Year of Election or Appointment: 2013
Secretary and Chief Legal Officer (CLO)
Mr. Bryant also serves as Secretary and CLO of other funds. Mr. Bryant serves as CLO, Secretary, and Senior Vice President of Fidelity Management & Research Company (investment adviser firm, 2015-present) and FMR Co., Inc. (investment adviser firm, 2015-present); Secretary of Fidelity SelectCo, LLC (investment adviser firm, 2015-present) and Fidelity Investments Money Management, Inc. (investment adviser firm, 2015-present); and CLO of Fidelity Management & Research (Hong Kong) Limited and FMR Investment Management (UK) Limited (investment adviser firms, 2015-present) and Fidelity Management & Research (Japan) Limited (investment adviser firm, 2016-present). He is Senior Vice President and Deputy General Counsel of FMR LLC (diversified financial services company). Previously, Mr. Bryant served as Secretary and CLO of Fidelity Rutland Square Trust II (2010-2014) and Assistant Secretary of Fidelity's Fixed Income and Asset Allocation Funds (2013-2015). Prior to joining Fidelity Investments, Mr. Bryant served as a Senior Vice President and the Head of Global Retail Legal for AllianceBernstein L.P. (2006-2010), and as the General Counsel for ProFund Advisors LLC (2001-2006).
William C. Coffey (1969)
Year of Election or Appointment: 2009
Assistant Secretary
Mr. Coffey also serves as Assistant Secretary of other funds. He is Senior Vice President and Deputy General Counsel of FMR LLC (diversified financial services company, 2010-present), and is an employee of Fidelity Investments. Previously, Mr. Coffey served as Vice President and Associate General Counsel of FMR LLC (2005-2009).
Jonathan Davis (1968)
Year of Election or Appointment: 2010
Assistant Treasurer
Mr. Davis also serves as Assistant Treasurer of other funds. Mr. Davis serves as Assistant Treasurer of FMR Capital, Inc. (2017-present) and is an employee of Fidelity Investments. Previously, Mr. Davis served as Vice President and Associate General Counsel of FMR LLC (diversified financial services company, 2003-2010).
Adrien E. Deberghes (1967)
Year of Election or Appointment: 2018
Assistant Treasurer
Mr. Deberghes also serves as an officer of other funds. He serves as Assistant Treasurer of FMR Capital, Inc. (2017-present), Executive Vice President of Fidelity Investments Money Management, Inc. (FIMM) (investment adviser firm, 2016-present), and is an employee of Fidelity Investments (2008-present). Previously, Mr. Deberghes served as President and Treasurer of certain Fidelity® funds (2013-2018). Prior to joining Fidelity Investments, Mr. Deberghes was Senior Vice President of Mutual Fund Administration at State Street Corporation (2007-2008), Senior Director of Mutual Fund Administration at Investors Bank & Trust (2005-2007), and Director of Finance for Dunkin' Brands (2000-2005). Previously, Mr. Deberghes served in other fund officer roles.
Joseph DeSantis (1959)
Year of Election or Appointment: 2015
Vice President
Mr. DeSantis also serves as Vice President of other funds. Mr. DeSantis serves as a Director of Fidelity Management & Research (Japan) Limited (investment adviser firm, 2016-present), Chief Investment Officer, Equities (2010-present) and is an employee of Fidelity Investments.
Stephanie J. Dorsey (1969)
Year of Election or Appointment: 2010
Assistant Treasurer
Ms. Dorsey also serves as an officer of other funds. Ms. Dorsey serves as Assistant Treasurer of FMR Capital, Inc. (2017-present), is an employee of Fidelity Investments (2008-present), and has served in other fund officer roles. Prior to joining Fidelity Investments, Ms. Dorsey served as Treasurer (2004-2008) of the JPMorgan Mutual Funds and Vice President (2004-2008) of JPMorgan Chase Bank.
Howard J. Galligan III (1966)
Year of Election or Appointment: 2014
Chief Financial Officer
Mr. Galligan also serves as Chief Financial Officer of other funds. Mr. Galligan serves as President of Fidelity Pricing and Cash Management Services (FPCMS) (2014-present) and as a Director of Strategic Advisers LLC (investment adviser firm, 2008-present). Previously, Mr. Galligan served as Chief Administrative Officer of Asset Management (2011-2014) and Chief Operating Officer and Senior Vice President of Investment Support for Strategic Advisers, Inc. (2003-2011).
Brian B. Hogan (1964)
Year of Election or Appointment: 2009
Vice President
Mr. Hogan also serves as Trustee or Vice President of other funds. Mr. Hogan serves as Head of Fidelity Investments’ Investment Solutions and Innovation organization (2018-present), and as a Director of FMR Investment Management (UK) Limited (investment adviser firm, 2015-present) and Fidelity SelectCo, LLC (investment adviser firm, 2014-present). Previously, Mr. Hogan served as Trustee of certain Fidelity® funds (2014-2018), President of the Equity Division of FMR (investment adviser firm, 2009-2018), Senior Vice President, Equity Research of FMR (2006-2009), and as a portfolio manager. Mr. Brian B. Hogan is not related to Mr. Colm A. Hogan.
Colm A. Hogan (1973)
Year of Election or Appointment: 2018
Deputy Treasurer
Mr. Hogan also serves as an officer of other funds. Mr. Hogan serves as Assistant Treasurer of FMR Capital, Inc. (2017-present) and is an employee of Fidelity Investments (2005-present). Previously, Mr. Hogan served as Assistant Treasurer of certain Fidelity® funds (2016-2018). Mr. Colm A. Hogan is not related to Mr. Brian B. Hogan.
Chris Maher (1972)
Year of Election or Appointment: 2013
Assistant Treasurer
Mr. Maher serves as Assistant Treasurer of other funds. Mr. Maher is Vice President of Valuation Oversight, serves as Assistant Treasurer of FMR Capital, Inc. (2017-present), and is an employee of Fidelity Investments. Previously, Mr. Maher served as Vice President of Asset Management Compliance (2013), Vice President of the Program Management Group of FMR (investment adviser firm, 2010-2013), and Vice President of Valuation Oversight (2008-2010).
Rieco E. Mello (1969)
Year of Election or Appointment: 2017
Assistant Treasurer
Mr. Mello also serves as Assistant Treasurer of other funds. Mr. Mello serves as Assistant Treasurer of FMR Capital, Inc. (2017-present) and is an employee of Fidelity Investments (1995-present).
Kenneth B. Robins (1969)
Year of Election or Appointment: 2018
Chief Compliance Officer
Mr. Robins also serves as an officer of other funds. Mr. Robins serves as Compliance Officer of Fidelity Management & Research Company and FMR Co., Inc. (investment adviser firms, 2016-present) and is an employee of Fidelity Investments (2004-present). Previously, Mr. Robins served as Executive Vice President of Fidelity Investments Money Management, Inc. (investment adviser firm, 2013-2016) and served in other fund officer roles.
Stacie M. Smith (1974)
Year of Election or Appointment: 2018
President and Treasurer
Ms. Smith also serves as an officer of other funds. Ms. Smith serves as Assistant Treasurer of FMR Capital, Inc. (2017-present), is an employee of Fidelity Investments (2009-present), and has served in other fund officer roles. Prior to joining Fidelity Investments, Ms. Smith served as Senior Audit Manager of Ernst & Young LLP (accounting firm, 1996-2009). Previously, Ms. Smith served as Assistant Treasurer (2013-2018) and Deputy Treasurer (2013-2016) of certain Fidelity® funds.
Marc L. Spector (1972)
Year of Election or Appointment: 2017
Assistant Treasurer
Mr. Spector also serves as an officer of other funds. Mr. Spector serves as Assistant Treasurer of FMR Capital, Inc. (2017-present) and is an employee of Fidelity Investments (2016-present). Prior to joining Fidelity Investments, Mr. Spector served as Director at the Siegfried Group (accounting firm, 2013-2016), and prior to Siegfried Group as audit senior manager at Deloitte & Touche (accounting firm, 2005-2013).
Renee Stagnone (1975)
Year of Election or Appointment: 2016
Assistant Treasurer
Ms. Stagnone also serves as an officer of other funds. Ms. Stagnone serves as Assistant Treasurer of FMR Capital, Inc. (2017-present) and is an employee of Fidelity Investments (1997-present). Previously, Ms. Stagnone served as Deputy Treasurer of certain Fidelity® funds (2013-2016).
Shareholder Expense Example
As a shareholder of a Fund, you incur two types of costs: (1) transaction costs, including redemption fees and (2) ongoing costs, including management fees and other Fund expenses. This Example is intended to help you understand your ongoing costs (in dollars) of investing in the Funds and to compare these costs with the ongoing costs of investing in other mutual funds.
The Example is based on an investment of $1,000 invested at the beginning of the period and held for the entire period (September 1, 2017 to February 28, 2018).
Actual Expenses
The first line of the accompanying table for each fund provides information about actual account values and actual expenses. You may use the information in this line, together with the amount you invested, to estimate the expenses that you paid over the period. Simply divide your account value by $1,000.00 (for example, an $8,600 account value divided by $1,000.00 = 8.6), then multiply the result by the number in the first line for a fund under the heading entitled "Expenses Paid During Period" to estimate the expenses you paid on your account during this period. A small balance maintenance fee of $12.00 that is charged once a year may apply for certain accounts with a value of less than $2,000. This fee is not included in the table below. If it was, the estimate of expenses you paid during the period would be higher, and your ending account value lower, by this amount. In addition, each Fund, as a shareholder in the underlying Fidelity Central Funds, will indirectly bear its pro-rata share of the fees and expenses incurred by the underlying Fidelity Central Funds. These fees and expenses are not included in the Fund's annualized expense ratio used to calculate the expense estimate in the table below.
Hypothetical Example for Comparison Purposes
The second line of the accompanying table for each fund provides information about hypothetical account values and hypothetical expenses based on a fund's actual expense ratio and an assumed rate of return of 5% per year before expenses, which is not the Fund's actual return. The hypothetical account values and expenses may not be used to estimate the actual ending account balance or expenses you paid for the period. You may use this information to compare the ongoing costs of investing in the Fund and other funds. To do so, compare this 5% hypothetical example with the 5% hypothetical examples that appear in the shareholder reports of the other funds. A small balance maintenance fee of $12.00 that is charged once a year may apply for certain accounts with a value of less than $2,000. This fee is not included in the table below. If it was, the estimate of expenses you paid during the period would be higher, and your ending account value lower, by this amount. In addition, each Fund, as a shareholder in the underlying Fidelity Central Funds, will indirectly bear its pro-rata share of the fees and expenses incurred by the underlying Fidelity Central Funds. These fees and expenses are not included in the Fund's annualized expense ratio used to calculate the expense estimate in the table below.
Please note that the expenses shown in the table are meant to highlight your ongoing costs only and do not reflect any transaction costs. Therefore, the second line of the table is useful in comparing ongoing costs only, and will not help you determine the relative total costs of owning different funds. In addition, if these transactional costs were included, your costs would have been higher.
| | Annualized Expense Ratio-A | Beginning
Account Value
September 1, 2017 | Ending
Account Value
February 28, 2018 | Expenses Paid
During Period-B
September 1, 2017
to February 28, 2018 |
| Communications Equipment Portfolio | .85% | | | |
| Actual | | $1,000.00 | $1,162.00 | $4.56 |
| Hypothetical-C | | $1,000.00 | $1,020.58 | $4.26 |
| Computers Portfolio | .78% | | | |
| Actual | | $1,000.00 | $1,137.20 | $4.13 |
| Hypothetical-C | | $1,000.00 | $1,020.93 | $3.91 |
| IT Services Portfolio | .76% | | | |
| Actual | | $1,000.00 | $1,198.80 | $4.14 |
| Hypothetical-C | | $1,000.00 | $1,021.03 | $3.81 |
| Semiconductors Portfolio | .74% | | | |
| Actual | | $1,000.00 | $1,223.50 | $4.08 |
| Hypothetical-C | | $1,000.00 | $1,021.12 | $3.71 |
| Software and IT Services Portfolio | .72% | | | |
| Actual | | $1,000.00 | $1,186.60 | $3.90 |
| Hypothetical-C | | $1,000.00 | $1,021.22 | $3.61 |
| Technology Portfolio | .74% | | | |
| Actual | | $1,000.00 | $1,162.80 | $3.97 |
| Hypothetical-C | | $1,000.00 | $1,021.12 | $3.71 |
A Annualized expense ratio reflects expenses net of applicable fee waivers.
B Expenses are equal to each Fund's annualized expense ratio, multiplied by the average account value over the period, multiplied by 181/ 365 (to reflect the one-half year period).
C 5% return per year before expenses
Distributions (Unaudited)
The Board of Trustees of each fund voted to pay to shareholders of record at the opening of business on record date, the following distributions per share derived from capital gains realized from sales of portfolio securities, and dividends derived from net investment income:
| | Pay Date | Record Date | Dividends | Capital Gains |
| Communications Equipment Portfolio | 04/12/18 | 04/11/18 | $0.00 | $2.357 |
| Computers Portfolio | 04/12/18 | 04/11/18 | $0.00 | $0.315 |
| IT Services Portfolio | 04/12/18 | 04/11/18 | $0.01 | $0.898 |
| Semiconductors Portfolio | 04/12/18 | 04/11/18 | $0.00 | $6.533 |
| Software and IT Services Portfolio | 04/12/18 | 04/11/18 | $0.00 | $3.358 |
| Technology Portfolio | 04/12/18 | 04/11/18 | $0.00 | $18.275 |
|
The funds hereby designate as capital gain dividend the amounts noted below for the taxable year ended February 28, 2018, or, if subsequently determined to be different, the net capital gain of such year.
| Communications Equipment Portfolio | $10,183,865 |
| Computers Portfolio | $36,445,857 |
| IT Services Portfolio | $83,489,514 |
| Semiconductors Portfolio | $338,841,598 |
| Software and IT Services Portfolio | $297,991,195 |
| Technology Portfolio | $620,258,374 |
|
A percentage of the dividends distributed during the fiscal year for the following funds qualify for the dividends–received deduction for corporate shareholders:
| | April 2017 | December 2017 |
| Communications Equipment Portfolio | 100% | 93% |
| Computers Portfolio | 98% | 45% |
| IT Services Portfolio | – | 100% |
| Semiconductors Portfolio | 11% | 25% |
| Software and IT Services Portfolio | 9% | 100% |
| Technology Portfolio | 6% | 10% |
| | | |
A percentage of the dividends distributed during the fiscal year for the following funds may be taken into account as a dividend for purposes of the maximum rate under section 1(h)(11) of the Internal Revenue Code.
| | April 2017 | December 2017 |
| Communications Equipment Portfolio | 100% | 100% |
| Computers Portfolio | 99% | 61% |
| IT Services Portfolio | – | 100% |
| Semiconductors Portfolio | 16% | 32% |
| Software and IT Services Portfolio | 9% | 100% |
| Technology Portfolio | 15% | 14% |
| | | |
The funds will notify shareholders in January 2019 of amounts for use in preparing 2018 income tax returns.
Board Approval of Investment Advisory Contracts and Management Fees
Communications Equipment Portfolio
Computers Portfolio
IT Services Portfolio
Semiconductors Portfolio
Software and IT Services Portfolio
Technology Portfolio
Each year, the Board of Trustees, including the Independent Trustees (together, the Board), votes on the renewal of the management contract with Fidelity SelectCo, LLC (SelectCo), an affiliate of Fidelity Management & Research Company (FMR), and the sub-advisory agreements with affiliates of FMR (together, the Advisory Contracts) for each fund. SelectCo and the sub-advisers are collectively referred to herein as the Investment Advisers. The Board, assisted by the advice of fund counsel and Independent Trustees' counsel, requests and considers a broad range of information relevant to the renewal of the Advisory Contracts throughout the year.
The Board meets regularly and, at each of its meetings, covers an extensive agenda of topics and materials and considers factors that are relevant to its annual consideration of the renewal of each fund's Advisory Contracts, including the services and support provided to each fund and its shareholders. The Board has established four standing committees (Committees) — Operations, Audit, Fair Valuation, and Governance and Nominating — each composed of and chaired by Independent Trustees with varying backgrounds, to which the Board has assigned specific subject matter responsibilities in order to enhance effective decision-making by the Board. The Operations Committee, of which all of the Independent Trustees are members, meets regularly throughout the year and considers, among other matters, information specifically related to the annual consideration of the renewal of each fund's Advisory Contracts. The Board, acting directly and through its Committees, requests and receives information concerning the annual consideration of the renewal of each fund's Advisory Contracts. The Board also meets as needed to review matters specifically related to the Board's annual consideration of the renewal of the Advisory Contracts. Members of the Board may also meet with trustees of other Fidelity funds through ad hoc joint committees to discuss certain matters relevant to all of the Fidelity funds.
At its January 2018 meeting, the Board unanimously determined to renew each fund's Advisory Contracts. In reaching its determination, the Board considered all factors it believed relevant, including (i) the nature, extent, and quality of the services to be provided to each fund and its shareholders (including the investment performance of each fund); (ii) the competitiveness of each fund's management fee and total expense ratio relative to peer funds; (iii) the total costs of the services to be provided by and the profits to be realized by Fidelity from its relationships with each fund; and (iv) the extent to which, if any, economies of scale exist and would be realized as each fund grows, and whether any economies of scale are appropriately shared with fund shareholders.
In considering whether to renew the Advisory Contracts for each fund, the Board reached a determination, with the assistance of fund counsel and Independent Trustees' counsel and through the exercise of its business judgment, that the renewal of the Advisory Contracts was in the best interests of each fund and its shareholders and that the compensation payable under the Advisory Contracts was fair and reasonable. The Board's decision to renew the Advisory Contracts was not based on any single factor, but rather was based on a comprehensive consideration of all the information provided to the Board at its meetings throughout the year. The Board, in reaching its determination to renew the Advisory Contracts, was aware that shareholders of each fund have a broad range of investment choices available to them, including a wide choice among funds offered by Fidelity's competitors, and that each fund's shareholders, who have the opportunity to review and weigh the disclosure provided by the fund in its prospectus and other public disclosures, have chosen to invest in that fund, which is part of the Fidelity family of funds.
Amendment to Group Fee Rate. The Board also ratified an amendment to the management contract for each fund to add an additional breakpoint to the group fee schedule, which was effective October 1, 2017. The Board noted that the additional breakpoint would result in lower management fee rates to the extent that assets under management that are included in group fee calculations increase above the new breakpoint.
Nature, Extent, and Quality of Services Provided. The Board considered the staffing of the Investment Advisers as it relates to the funds, including the backgrounds of investment personnel of SelectCo, and also considered the funds' investment objectives, strategies, and related investment philosophies. The Independent Trustees also had discussions with senior management of Fidelity's investment operations and investment groups. The Board considered the structure of the investment personnel compensation program and whether this structure provides appropriate incentives to act in the best interests of each fund. Additionally, the Board considered the portfolio managers' investments, if any, in the funds that they manage.
Resources Dedicated to Investment Management and Support Services. The Board reviewed the general qualifications and capabilities of the Investment Advisers' investment staffs, including their size, education, experience, and resources, as well as Fidelity's approach to recruiting, training, managing, and compensating investment personnel. The Board noted that Fidelity has continued to increase the resources devoted to non-U.S. offices, including expansion of Fidelity's global investment organization. The Board also noted that Fidelity's analysts have extensive resources, tools and capabilities that allow them to conduct sophisticated quantitative and fundamental analysis, as well as credit analysis of issuers, counterparties and guarantors. Further, the Board considered that Fidelity's investment professionals have sufficient access to global information and data so as to provide competitive investment results over time, and that those professionals also have access to sophisticated tools that permit them to assess portfolio construction and risk and performance attribution characteristics continuously, as well as to transmit new information and research conclusions rapidly around the world. Additionally, in its deliberations, the Board considered Fidelity's trading, risk management, compliance, and technology and operations capabilities and resources, which are integral parts of the investment management process.
Shareholder and Administrative Services. The Board considered (i) the nature, extent, quality, and cost of advisory, administrative, and shareholder services performed by the Investment Advisers and their affiliates under the Advisory Contracts and under separate agreements covering transfer agency, pricing and bookkeeping, and securities lending services for each fund; (ii) the nature and extent of the supervision of third party service providers, principally custodians, subcustodians, and pricing vendors; and (iii) the resources devoted to, and the record of compliance with, each fund's compliance policies and procedures. The Board also reviewed the allocation of fund brokerage, including allocations to brokers affiliated with the Investment Advisers, the use of brokerage commissions to pay fund expenses, and the use of "soft" commission dollars to pay for research services.
The Board noted that the growth of fund assets over time across the complex allows Fidelity to reinvest in the development of services designed to enhance the value or convenience of the Fidelity funds as investment vehicles. These services include 24-hour access to account information and market information through telephone representatives and over the Internet, investor education materials and asset allocation tools, and the expanded availability of Fidelity Investor Centers.
The Board noted that it and the boards of certain other Fidelity funds had formed an ad hoc Committee on Transfer Agency Fees to review the variety of transfer agency fee structures throughout the industry and Fidelity's competitive positioning with respect to industry participants.
Investment in a Large Fund Family. The Board considered the benefits to shareholders of investing in a Fidelity fund, including the benefits of investing in a fund that is part of a large family of funds offering a variety of investment disciplines and providing a large variety of mutual fund investor services. The Board noted that Fidelity had taken, or had made recommendations that resulted in the Fidelity funds taking, a number of actions over the previous year that benefited particular funds, including: (i) continuing to dedicate additional resources to Fidelity's investment research process, which includes meetings with management of issuers in which the funds invest, and to the support of the senior management team that oversees asset management; (ii) continuing efforts to enhance Fidelity's global research capabilities; (iii) launching new funds and making other enhancements to meet client needs; (iv) launching new share classes of existing funds; (v) eliminating purchase minimums and broadening eligibility requirements for certain lower-priced share classes; (vi) reducing management fees and total expenses for certain growth equity funds and index funds; (vii) lowering expense caps for certain existing funds and classes to reduce expenses borne by shareholders; (viii) eliminating short-term redemption fees for certain funds; (ix) introducing a new pricing structure for certain funds of funds that is expected to reduce overall expenses paid by shareholders; (x) rationalizing product lines and gaining increased efficiencies through proposals for fund mergers and share class consolidations; (xi) continuing to develop, acquire and implement systems and technology to improve services to the funds and shareholders, strengthen information security, and increase efficiency; and (xii) implementing enhancements to further strengthen Fidelity's product line to increase investors' probability of success in achieving their investment goals, including retirement income goals.
Investment Performance. The Board considered whether each fund has operated in accordance with its investment objective, as well as its record of compliance with its investment restrictions and its performance history.
The Board took into account discussions with representatives of SelectCo about fund investment performance that occur at Board meetings throughout the year. In this regard the Board noted that as part of regularly scheduled fund reviews and other reports to the Board on fund performance, the Board considers annualized return information for each fund for different time periods, measured against a securities market index ("benchmark index"). In its evaluation of fund investment performance at meetings throughout the year, the Board gave particular attention to information indicating underperformance of certain Fidelity funds for specific time periods and discussed with the Investment Advisers the reasons for such underperformance.
In addition to reviewing absolute and relative fund performance, the Independent Trustees periodically consider the appropriateness of fund performance metrics in evaluating the results achieved. In general, the Independent Trustees believe that fund performance should be evaluated based on net performance (after fees and expenses) of both the highest performing and lowest performing fund share classes, where applicable, compared to appropriate benchmark indices, over appropriate time periods that may include full market cycles, taking into account relevant factors, including the following: general market conditions; issuer-specific information; and fund cash flows and other factors. Depending on the circumstances, the Independent Trustees may be satisfied with a fund's performance notwithstanding that it lags its benchmark index for certain periods.
The Independent Trustees recognize that shareholders evaluate performance on a net basis over their own holding periods, for which one-, three-, and five-year periods are often used as a proxy. For this reason, the performance information reviewed by the Board also included net cumulative total return information for each fund and an appropriate benchmark index for the most recent one-, three-, and five-year periods ended June 30, 2017.
Based on its review, the Board concluded that the nature, extent, and quality of services provided to each fund under the Advisory Contracts should continue to benefit the shareholders of each fund.
Competitiveness of Management Fee and Total Expense Ratio. The Board considered each fund's management fee and total expense ratio compared to "mapped groups" of competitive funds and classes created for the purpose of facilitating the Trustees' analysis of the competitiveness of management fees and total expenses. Fidelity creates "mapped groups" by combining similar Lipper investment objective categories that have comparable investment mandates. For this purpose, all sector focused equity funds are grouped in the same mapped group. Combining Lipper investment objective categories aids the Board's management fee and total expense ratio comparisons by broadening the competitive group used for comparison.
Management Fee. The Board considered two proprietary management fee comparisons for the 12-month periods ended June 30 shown in basis points (BP) in the charts below. The group of Lipper funds used by the Board for management fee comparisons is referred to below as the "Total Mapped Group." The Total Mapped Group comparison focuses on a fund's standing in terms of gross management fees before expense reimbursements or caps relative to the total universe of funds with comparable investment mandates (
i.e., sector equities), regardless of whether their management fee structures also are comparable. Funds with comparable management fee structures have similar management fee contractual arrangements (
e.g., flat rate charged for advisory services, all-inclusive fee rate,
etc.). "TMG %" represents the percentage of funds in the Total Mapped Group that had management fees that were lower than a fund's. For example, a hypothetical TMG % of 20% would mean that 80% of the funds in the Total Mapped Group had higher, and 20% had lower, management fees than a fund. The funds' actual TMG %s and the number of funds in the Total Mapped Group are in the charts below. The "Asset-Size Peer Group" (ASPG) comparison focuses on a fund's standing relative to a subset of non-Fidelity funds within the Total Mapped Group that are similar in size and management fee structure. For example, if a fund is in the first quartile of the ASPG, the fund's management fee ranks in the least expensive or lowest 25% of funds in the ASPG. The ASPG represents at least 15% of the funds in the Total Mapped Group with comparable asset size and management fee structures, subject to a minimum of 50 funds (or all funds in the Total Mapped Group if fewer than 50). Additional information, such as the ASPG quartile in which a fund's management fee rate ranked, is also included in the charts and considered by the Board.
Communications Equipment Portfolio
Computers Portfolio
IT Services Portfolio

Semiconductors Portfolio
Software and IT Services Portfolio
Technology Portfolio

The Board noted that each fund's management fee rate ranked below the median of its Total Mapped Group and below the median of its ASPG for the 12-month period ended June 30, 2017.
The Board noted that it and the boards of other Fidelity funds formed an ad hoc Committee on Group Fee, which meets periodically, to conduct an in-depth review of the "group fee" component of the management fee of funds with such management fee structures. The Committee's focus included the mechanics of the group fee, the competitive landscape of group fee structures, Fidelity funds with no group fee component and investment products not included in group fee assets. The Board also considered that, for funds subject to the group fee, FMR agreed to voluntarily waive fees over a specified period of time in amounts designed to account for assets converted from certain funds to certain collective investment trusts.
Based on its review, the Board concluded that each fund's management fee is fair and reasonable in light of the services that each fund receives and the other factors considered.
Total Expense Ratio. In its review of each fund's total expense ratio, the Board considered the fund's management fee rate as well as other fund expenses, such as transfer agent fees, pricing and bookkeeping fees, and custodial, legal, and audit fees. The Board also noted that Fidelity may agree to waive fees and expenses from time to time, and the extent to which, if any, it has done so for each fund. As part of its review, the Board also considered the current and historical total expense ratios of each fund compared to competitive fund median expenses. Each fund is compared to those funds and classes in the Total Mapped Group (used by the Board for management fee comparisons) that have a similar sales load structure.
The Board noted that each fund's total expense ratio ranked below the competitive median for the 12-month period ended June 30, 2017.
Fees Charged to Other Fidelity Clients. The Board also considered Fidelity fee structures and other information with respect to clients of Fidelity, such as other funds advised or subadvised by Fidelity, pension plan clients, and other institutional clients with similar mandates. The Board noted that an ad hoc joint committee created by it and the boards of other Fidelity funds periodically reviews and compares Fidelity's institutional investment advisory business with its business of providing services to the Fidelity funds, including the differences in services provided, fees charged, and costs incurred, as well as competition in their respective marketplaces.
Based on its review of total expense ratios and fees charged to other Fidelity clients, the Board concluded that each fund's total expense ratio was reasonable in light of the services that each fund and its shareholders receive and the other factors considered.
Costs of the Services and Profitability. The Board considered the revenues earned and the expenses incurred by Fidelity in conducting the business of developing, marketing, distributing, managing, administering and servicing each fund and servicing each fund's shareholders. The Board also considered the level of Fidelity's profits in respect of all the Fidelity funds.
On an annual basis, Fidelity presents to the Board information about the profitability of its relationships with each fund. Fidelity calculates profitability information for each fund, as well as aggregate profitability information for groups of Fidelity funds and all Fidelity funds, using a series of detailed revenue and cost allocation methodologies which originate with the books and records of Fidelity on which Fidelity's audited financial statements are based. The Audit Committee of the Board reviews any significant changes from the prior year's methodologies.
PricewaterhouseCoopers LLP (PwC), independent registered public accounting firm and auditor to Fidelity and certain Fidelity funds, has been engaged annually by the Board as part of the Board's assessment of the profitability analysis used by Fidelity. PwC's engagement includes the review and assessment of Fidelity's methodologies used in determining the revenues and expenses attributable to Fidelity's mutual fund business, and completion of agreed-upon procedures in respect of the mathematical accuracy of the fund profitability information and its conformity to established allocation methodologies. After considering PwC's reports issued under the engagement and information provided by Fidelity, the Board concluded that while other allocation methods may also be reasonable, Fidelity's profitability methodologies are reasonable in all material respects.
The Board also reviewed Fidelity's non-fund businesses and potential fall-out benefits related to the mutual fund business as well as cases where Fidelity's affiliates may benefit from or be related to the funds' business.
The Board considered the costs of the services provided by and the profits realized by Fidelity in connection with the operation of each fund and was satisfied that the profitability was not excessive.
Economies of Scale. The Board considered whether there have been economies of scale in respect of the management of the Fidelity funds, whether the Fidelity funds (including each fund) have appropriately benefited from any such economies of scale, and whether there is potential for realization of any further economies of scale. The Board considered the extent to which each fund will benefit from economies of scale as assets grow through increased services to the fund, through waivers or reimbursements, or through fee or expense ratio reductions. The Board also noted that a committee (the Economies of Scale Committee) created by it and the boards of other Fidelity funds periodically analyzes whether Fidelity attains economies of scale in respect of the management and servicing of the Fidelity funds, whether the Fidelity funds have appropriately benefited from such economies of scale, and whether there is potential for realization of any further economies of scale.
The Board recognized that each fund's management contract incorporates a "group fee" structure, which provides for lower group fee rates as total group assets increase, and for higher group fee rates as total group assets decrease (with "group assets" defined to include fund assets under SelectCo's management plus assets under FMR's management). SelectCo calculates the group fee rates based on a tiered asset "breakpoint" schedule that varies based on asset class. The Board considered that the group fee is designed to deliver the benefits of economies of scale to fund shareholders when total group assets increase, even if assets of any particular fund are unchanged or have declined, because some portion of Fidelity's costs are attributable to services provided to all Fidelity funds, and all funds benefit if those costs can be allocated among more assets. The Board concluded that, given the group fee structure, fund shareholders will benefit from lower management fees as group assets increase at the fund complex level, regardless of whether Fidelity achieves any such economies of scale.
The Board concluded, taking into account the analysis of the Economies of Scale Committee, that economies of scale, if any, are being appropriately shared between fund shareholders and Fidelity.
Additional Information Requested by the Board. In order to develop fully the factual basis for consideration of the Fidelity funds' advisory contracts, the Board requested and received additional information on certain topics, including: (i) Fidelity's fund profitability methodology, profitability trends for certain funds, and the impact of certain factors on fund profitability results; (ii) portfolio manager changes that have occurred during the past year and the amount of the investment that each portfolio manager has made in the Fidelity fund(s) that he or she manages; (iii) Fidelity's compensation structure for portfolio managers, research analysts, and other key personnel, including its effects on fund profitability; (iv) comparisons to institutional products; (v) the arrangements with and compensation paid to certain fund sub-advisers on behalf of the Fidelity funds; (vi) the impact of proposed changes to contractual expense cap arrangements in place for certain funds; (vii) Fidelity's long-term expectations for its offerings in the workplace investing channel; (viii) the methodology with respect to evaluating competitive fund data and peer group classifications and fee comparisons; (ix) the presentation of certain fund performance information; (x) Fidelity's transfer agent fee, expense, and service structures for different funds and classes, including the increased use of omnibus accounts and lower pricing in the retirement channel; (xi) fluctuations in trading expenses; (xii) explanations regarding the relative total expense ratios of certain funds and classes; and (xiii) Fidelity's expectations regarding the future asset levels of certain funds.
Based on its evaluation of all of the conclusions noted above, and after considering all factors it believed relevant, the Board concluded that the advisory fee structures are fair and reasonable, and that each fund's Advisory Contracts should be renewed.
Proxy Voting Results
A special meeting of shareholders was held on December 8, 2017. The results of votes taken among shareholders on the proposals before them are reported below. Each vote reported represents one dollar of net asset value held on the record date for the meeting.
PROPOSAL 1
To elect a Board of Trustees.
| | # of
Votes | % of
Votes |
| James C. Curvey |
| Affirmative | 40,874,579,146.19 | 94.146 |
| Withheld | 2,541,618,753.48 | 5.854 |
| TOTAL | 43,416,197,899.67 | 100.000 |
| Dennis J. Dirks |
| Affirmative | 41,093,243,800.03 | 94.650 |
| Withheld | 2,322,954,099.64 | 5.350 |
| TOTAL | 43,416,197,899.67 | 100.000 |
| Donald F. Donahue |
| Affirmative | 41,121,116,505.64 | 94.714 |
| Withheld | 2,295,081,394.03 | 5.286 |
| TOTAL | 43,416,197,899.67 | 100.000 |
| Alan J. Lacy |
| Affirmative | 41,091,494,851.72 | 94.646 |
| Withheld | 2,324,703,047.95 | 5.354 |
| TOTAL | 43,416,197,899.67 | 100.00 |
| Ned C. Lautenbach |
| Affirmative | 40,970,733,721.42 | 94.368 |
| Withheld | 2,445,464,178.25 | 5.632 |
| TOTAL | 43,416,197,899.67 | 100.000 |
| Joseph Mauriello |
| Affirmative | 41,021,688,840.89 | 94.485 |
| Withheld | 2,394,509,058.78 | 5.515 |
| TOTAL | 43,416,197,899.67 | 100.000 |
| Charles S. Morrison |
| Affirmative | 41,163,534,997.01 | 94.812 |
| Withheld | 2,252,662,902.66 | 5.188 |
| TOTAL | 43,416,197,899.67 | 100.000 |
| Cornelia M. Small |
| Affirmative | 41,061,752,034.66 | 94.578 |
| Withheld | 2,354,445,865.01 | 5.422 |
| TOTAL | 43,416,197,899.67 | 100.000 |
| Garnett A. Smith |
| Affirmative | 41,061,939,407.02 | 94.578 |
| Withheld | 2,354,258,492.65 | 5.422 |
| TOTAL | 43,416,197,899.67 | 100.000 |
| David M. Thomas |
| Affirmative | 41,102,875,738.06 | 94.672 |
| Withheld | 2,313,322,161.61 | 5.328 |
| TOTAL | 43,416,197,899.67 | 100.000 |
| Michael E. Wiley |
| Affirmative | 41,112,279,187.11 | 94.694 |
| Withheld | 2,303,918,712.56 | 5.306 |
| TOTAL | 43,416,197,899.67 | 100.000 |
PROPOSAL 2
To eliminate a fundamental investment policy for Communications Equipment Portfolio.
| | # of
Votes | % of
Votes |
| Affirmative | 70,635,407.81 | 70.332 |
| Against | 13,144,542.88 | 13.089 |
| Abstain | 7,192,593.03 | 7.161 |
| Broker Non-Vote | 9,459,137.77 | 9.418 |
| TOTAL | 100,431,681.49 | 100.000 |
PROPOSAL 2
To eliminate a fundamental investment policy for Computers Portfolio.
| | # of
Votes | % of
Votes |
| Affirmative | 212,893,553.47 | 73.162 |
| Against | 30,446,116.92 | 10.463 |
| Abstain | 18,942,025.75 | 6.509 |
| Broker Non-Vote | 28,710,782.97 | 9.866 |
| TOTAL | 290,992,479.11 | 100.000 |
PROPOSAL 2
To eliminate a fundamental investment policy for IT Services Portfolio.
| | # of
Votes | % of
Votes |
| Affirmative | 861,072,890.55 | 70.143 |
| Against | 139,097,126.86 | 11.331 |
| Abstain | 85,974,803.66 | 7.004 |
| Broker Non-Vote | 141,452,262.40 | 11.522 |
| TOTAL | 1,227,597,083.47 | 100.000 |
PROPOSAL 2
To eliminate a fundamental investment policy for Semiconductors Portfolio.
| | # of
Votes | % of
Votes |
| Affirmative | 1,372,844,725.78 | 70.730 |
| Against | 222,516,130.89 | 11.464 |
| Abstain | 156,340,523.67 | 8.054 |
| Broker Non-Vote | 189,289,930.49 | 9.752 |
| TOTAL | 1,940,991,310.83 | 100.000 |
PROPOSAL 2
To eliminate a fundamental investment policy for Software and IT Services Portfolio.
| | # of
Votes | % of
Votes |
| Affirmative | 2,011,784,557.09 | 67.790 |
| Against | 356,095,754.26 | 12.000 |
| Abstain | 207,003,657.62 | 6.975 |
| Broker Non-Vote | 392,794,045.66 | 13.235 |
| TOTAL | 2,967,678,014.63 | 100.000 |
PROPOSAL 2
To eliminate a fundamental investment policy for Technology Portfolio.
| | # of
Votes | % of
Votes |
| Affirmative | 3,156,083,806.72 | 75.860 |
| Against | 440,719,061.82 | 10.593 |
| Abstain | 305,181,343.95 | 7.335 |
| Broker Non-Vote | 258,454,990.07 | 6.212 |
| TOTAL | 4,160,439,202.56 | 100.000 |
PROPOSAL 3
To modify Computers Portfolio's fundamental concentration policy.
| | # of
Votes | % of
Votes |
| Affirmative | 212,264,519.10 | 72.946 |
| Against | 32,006,383.52 | 10.999 |
| Abstain | 18,010,793.52 | 6.189 |
| Broker Non-Vote | 28,710,782.97 | 9.866 |
| TOTAL | 290,992,479.11 | 100.000 |
PROPOSAL 3
To modify Semiconductors Portfolio's fundamental concentration policy.
| | # of
Votes | of
Votes |
| Affirmative | 1,447,237,155.52 | 74.562 |
| Against | 171,804,691.46 | 8.852 |
| Abstain | 132,659,533.36 | 6.834 |
| Broker Non-Vote | 189,289,930.49 | 9.752 |
| TOTAL | 1,940,991,310.83 | 100.000 |
PROPOSAL 3
To modify Software and IT Services Portfolio's fundamental concentration policy.
| | # of
Votes | of
Votes |
| Affirmative | 2,077,937,890.77 | 70.019 |
| Against | 292,734,775.13 | 9.865 |
| Abstain | 204,211,303.07 | 6.881 |
| Broker Non-Vote | 392,794,045.66 | 13.235 |
| TOTAL | 2,967,678,014.63 | 100.000 |
PROPOSAL 3
To modify Technology Portfolio's fundamental concentration policy.
| | # of
Votes | of
Votes |
| Affirmative | 3,233,704,646.04 | 77.726 |
| Against | 398,492,850.82 | 9.578 |
| Abstain | 269,786,697.41 | 6.484 |
| Broker Non-Vote | 258,455,008.29 | 6.212 |
| TOTAL | 4,160,439,202.56 | 100.000 |
PROPOSAL 5
For Computers Portfolio, a shareholder proposal requesting that the Board of Trustees institute procedures to avoid holding investments in companies that, in management's judgement, substantially contribute to genocide or crimes against humanity.
| | # of
Votes | of
Votes |
| Affirmative | 93,114,127.00 | 31.999 |
| Against | 140,700,446.91 | 48.352 |
| Abstain | 28,467,122.23 | 9.783 |
| Broker Non-Vote | 28,710,782.97 | 9.866 |
| TOTAL | 290,992,479.11 | 100.000 |
| Proposal 1 reflects trust wide proposal and voting results. |
| Proposal 5 was not approved by shareholders. |
SELTEC-ANN-0418
1.813669.113
Fidelity Advisor Focus Funds®
Class A, Class M (formerly Class T), Class C and Class I Fidelity Advisor® Consumer Staples Fund
Fidelity Advisor® Gold Fund
Fidelity Advisor® Materials Fund
Fidelity Advisor® Telecommunications Fund
Annual Report February 28, 2018 Each Advisor fund listed above is a class of the Fidelity® Select Portfolios® |
|
Contents
To view a fund's proxy voting guidelines and proxy voting record for the 12-month period ended June 30, visit http://www.fidelity.com/proxyvotingresults or visit the Securities and Exchange Commission's (SEC) web site at http://www.sec.gov.
You may also call 1-877-208-0098 to request a free copy of the proxy voting guidelines.
Standard & Poor's, S&P and S&P 500 are registered service marks of The McGraw-Hill Companies, Inc. and have been licensed for use by Fidelity Distributors Corporation.
Other third-party marks appearing herein are the property of their respective owners.
All other marks appearing herein are registered or unregistered trademarks or service marks of FMR LLC or an affiliated company. © 2018 FMR LLC. All rights reserved.
This report and the financial statements contained herein are submitted for the general information of the shareholders of the Funds. This report is not authorized for distribution to prospective investors in the Funds unless preceded or accompanied by an effective prospectus.
A fund files its complete schedule of portfolio holdings with the SEC for the first and third quarters of each fiscal year on Form N-Q. Forms N-Q are available on the SEC’s web site at http://www.sec.gov. A fund's Forms N-Q may be reviewed and copied at the SEC’s Public Reference Room in Washington, DC. Information regarding the operation of the SEC's Public Reference Room may be obtained by calling 1-800-SEC-0330.
For a complete list of a fund's portfolio holdings, view the most recent holdings listing, semiannual report, or annual report on Fidelity's web site at http://www.fidelity.com, http://www.institutional.fidelity.com, or http://www.401k.com, as applicable.
NOT FDIC INSURED •MAY LOSE VALUE •NO BANK GUARANTEE
Neither the Funds nor Fidelity Distributors Corporation is a bank.
Fidelity Advisor® Consumer Staples Fund
Performance: The Bottom Line
Average annual total return reflects the change in the value of an investment, assuming reinvestment of distributions from dividend income and capital gains (the profits earned upon the sale of securities that have grown in value, if any) and assuming a constant rate of performance each year. The hypothetical investment and the average annual total returns do not reflect the deduction of taxes that a shareholder would pay on fund distributions or the redemption of fund shares. During periods of reimbursement by Fidelity, a fund’s total return will be greater than it would be had the reimbursement not occurred. How a fund did yesterday is no guarantee of how it will do tomorrow.
Average Annual Total Returns
| For the periods ended February 28, 2018 | Past 1 year | Past 5 years | Past 10 years |
| Class A (incl. 5.75% sales charge) | (7.33)% | 6.17% | 7.45% |
| Class M (incl. 3.50% sales charge) | (5.38)% | 6.38% | 7.40% |
| Class C (incl. contingent deferred sales charge) | (3.31)% | 6.63% | 7.28% |
| Class I | (1.41)% | 7.71% | 8.36% |
Class C shares' contingent deferred sales charges included in the past one year, past five years and past ten years total return figures are 1%, 0% and 0%, respectively.
$10,000 Over 10 Years
Let's say hypothetically that $10,000 was invested in Fidelity Advisor® Consumer Staples Fund - Class A on February 29, 2008, and the current 5.75% sales charge was paid.
The chart shows how the value of your investment would have changed, and also shows how the S&P 500® Index performed over the same period.

| Period Ending Values |
| $20,510 | Fidelity Advisor® Consumer Staples Fund - Class A |
| $25,307 | S&P 500® Index |
Fidelity Advisor® Consumer Staples Fund
Management's Discussion of Fund Performance
Market Recap: U.S. equities gained 17.10% for the 12 months ending February 28, 2018, as the S&P 500
® index moved steadily higher throughout 2017 and into 2018 until sharply reversing course in February. The drop was in stark contrast to the low volatility seen throughout 2017, along with consumer sentiment and other market indicators that stayed positive. Investors remained decidedly upbeat as the calendar turned, and the index rose 5.73% in January. February was a decidedly different story, though, as volatility spiked amid fear that rising inflation and the potential for the economy to overheat would prompt the U.S. Federal Reserve to pick up the pace of interest rate hikes. The index returned -3.69% for the month, its first negative result since October 2016. For the full 12 months, growth stocks handily topped value, while large-caps bested small-caps. By sector, information technology fared best by far, gaining 36% amid strong earnings growth from several major index constituents. Consumer discretionary (+22%) also stood out, driven by retailers. Financials added 20%, riding the uptick in bond yields. Materials and industrials rose about 16% each, boosted by higher demand, especially from China. Conversely, notable laggards included the defensive telecommunication services (-5%) and utilities (-2%) sectors, while rising rates held back real estate (-3%).
Comments from Portfolio Manager James McElligott: For the fiscal year, the fund’s share classes (excluding sales charges, if applicable) returned roughly between -1% and -3%, trailing the -0.37% result of the MSCI U.S. IMI Consumer Staples 25/50 Index and well behind the S&P 500
®. Consumer staples lagged the broader equity market, as investors favored more economically sensitive sectors. Versus the MSCI sector index, the fund’s sizable underexposure to the hypermarkets & super centers segment hurt. Most notable was our large underweighting in discount retailer Walmart, which saw its stock climb 30% as investors grew more confident in the company’s ability to compete with e-commerce juggernaut Amazon.com (not in the fund). An overweighting in the weak-performing tobacco segment and stock picks in the food retail group also detracted. In particular, shares of Kroger (-13%) fell as increased competition led to an earnings shortfall. Investor disappointment with the grocer’s decision to use its savings from tax reform to boost employee wages and lower prices also pressured the stock. By contrast, a sizable overweighting in the strong-performing personal products category and stock picks in the tobacco and soft drinks groups helped relative performance. Standouts included beauty products company Estee Lauder (+69%), which benefited from strong growth overseas, new products and the acquisition of some faster-growing brands. Foreign holdings also contributed overall, aided in part by a broadly weaker U.S. dollar.
The views expressed above reflect those of the portfolio manager(s) only through the end of the period as stated on the cover of this report and do not necessarily represent the views of Fidelity or any other person in the Fidelity organization. Any such views are subject to change at any time based upon market or other conditions and Fidelity disclaims any responsibility to update such views. These views may not be relied on as investment advice and, because investment decisions for a Fidelity fund are based on numerous factors, may not be relied on as an indication of trading intent on behalf of any Fidelity fund.
Note to shareholders: On November 17, 2017, James McElligott became Portfolio Manager of the fund, succeeding Robert Lee. On December 8, 2017, shareholders approved proposals from the Board of Trustees to eliminate each sector/industry fund’s fundamental “invests primarily” policy and to modify the fundamental concentration policy for certain funds. The changes took effect on January 1, 2018, and do not impact how the funds are managed.
Consumer Staples Portfolio
Investment Summary (Unaudited)
Top Ten Stocks as of February 28, 2018
| | % of fund's net assets |
| The Coca-Cola Co. | 8.6 |
| Procter & Gamble Co. | 8.0 |
| Philip Morris International, Inc. | 7.7 |
| PepsiCo, Inc. | 7.1 |
| Monster Beverage Corp. | 4.4 |
| CVS Health Corp. | 4.1 |
| Mondelez International, Inc. | 3.8 |
| Altria Group, Inc. | 3.7 |
| Costco Wholesale Corp. | 3.3 |
| Spectrum Brands Holdings, Inc. | 3.0 |
| | 53.7 |
Top Industries (% of fund's net assets)
| As of February 28, 2018 |
| | Beverages | 27.8% |
| | Food Products | 19.5% |
| | Household Products | 14.4% |
| | Food & Staples Retailing | 13.7% |
| | Tobacco | 13.4% |
| | All Others* | 11.2% |

* Includes short-term investments and net other assets (liabilities).
Consumer Staples Portfolio
Schedule of Investments February 28, 2018
Showing Percentage of Net Assets
| Common Stocks - 99.8% | | | |
| | | Shares | Value |
| Beverages - 27.8% | | | |
| Brewers - 1.2% | | | |
| Beijing Yanjing Brewery Co. Ltd. Class A | | 14,437,040 | $16,241,964 |
| China Resources Beer Holdings Co. Ltd. | | 162,000 | 623,910 |
| Molson Coors Brewing Co. Class B | | 108,900 | 8,303,625 |
| | | | 25,169,499 |
| Distillers & Vintners - 1.9% | | | |
| Constellation Brands, Inc. Class A (sub. vtg.) | | 190,000 | 40,941,200 |
| Kweichow Moutai Co. Ltd. (A Shares) | | 13,453 | 1,531,664 |
| | | | 42,472,864 |
| Soft Drinks - 24.7% | | | |
| Britvic PLC | | 525,074 | 4,882,222 |
| Coca-Cola Bottling Co. Consolidated | | 101,344 | 18,911,804 |
| Coca-Cola European Partners PLC | | 848,453 | 32,258,183 |
| Coca-Cola HBC AG | | 58,450 | 1,910,856 |
| Coca-Cola West Co. Ltd. | | 100,500 | 3,804,667 |
| Dr. Pepper Snapple Group, Inc. | | 293,300 | 34,096,125 |
| Fever-Tree Drinks PLC | | 92,513 | 3,159,063 |
| Monster Beverage Corp. (a) | | 1,535,302 | 97,292,088 |
| PepsiCo, Inc. | | 1,423,200 | 156,167,736 |
| The Coca-Cola Co. | | 4,366,218 | 188,707,942 |
| | | | 541,190,686 |
|
| TOTAL BEVERAGES | | | 608,833,049 |
|
| Chemicals - 0.3% | | | |
| Specialty Chemicals - 0.3% | | | |
| Frutarom Industries Ltd. | | 70,500 | 6,486,766 |
| Food & Staples Retailing - 13.7% | | | |
| Drug Retail - 6.4% | | | |
| CVS Health Corp. | | 1,318,003 | 89,268,343 |
| Rite Aid Corp. (a)(b) | | 1,582,170 | 3,116,875 |
| Walgreens Boots Alliance, Inc. | | 704,824 | 48,555,325 |
| | | | 140,940,543 |
| Food Distributors - 1.5% | | | |
| Sysco Corp. | | 479,300 | 28,590,245 |
| United Natural Foods, Inc. (a) | | 106,100 | 4,527,287 |
| | | | 33,117,532 |
| Food Retail - 1.5% | | | |
| Kroger Co. | | 859,770 | 23,316,962 |
| Sprouts Farmers Market LLC (a) | | 357,500 | 9,209,200 |
| | | | 32,526,162 |
| Hypermarkets & Super Centers - 4.3% | | | |
| Costco Wholesale Corp. | | 379,500 | 72,446,550 |
| Walmart, Inc. | | 236,600 | 21,296,366 |
| | | | 93,742,916 |
|
| TOTAL FOOD & STAPLES RETAILING | | | 300,327,153 |
|
| Food Products - 19.5% | | | |
| Agricultural Products - 1.7% | | | |
| Bunge Ltd. | | 223,635 | 16,868,788 |
| Darling International, Inc. (a) | | 701,000 | 12,751,190 |
| Ingredion, Inc. | | 51,300 | 6,701,832 |
| | | | 36,321,810 |
| Packaged Foods & Meats - 17.8% | | | |
| ConAgra Foods, Inc. | | 818,100 | 29,557,953 |
| Danone SA | | 180,600 | 14,404,018 |
| JBS SA | | 4,970,800 | 15,171,588 |
| Kellogg Co. | | 481,900 | 31,901,780 |
| Mondelez International, Inc. | | 1,916,658 | 84,141,286 |
| Post Holdings, Inc. (a) | | 203,300 | 15,406,074 |
| The Hain Celestial Group, Inc. (a) | | 707,599 | 24,610,293 |
| The Hershey Co. | | 156,800 | 15,407,168 |
| The J.M. Smucker Co. | | 354,100 | 44,722,830 |
| The Kraft Heinz Co. | | 785,400 | 52,661,070 |
| The Simply Good Foods Co. | | 2,495,700 | 33,716,907 |
| TreeHouse Foods, Inc. (a) | | 763,359 | 29,022,909 |
| | | | 390,723,876 |
|
| TOTAL FOOD PRODUCTS | | | 427,045,686 |
|
| Hotels, Restaurants & Leisure - 1.3% | | | |
| Restaurants - 1.3% | | | |
| Compass Group PLC | | 57,711 | 1,226,082 |
| U.S. Foods Holding Corp. (a) | | 789,716 | 26,368,617 |
| | | | 27,594,699 |
| Household Durables - 0.1% | | | |
| Housewares & Specialties - 0.1% | | | |
| Newell Brands, Inc. | | 91,400 | 2,348,066 |
| Household Products - 14.4% | | | |
| Household Products - 14.4% | | | |
| Colgate-Palmolive Co. | | 552,080 | 38,076,958 |
| Essity AB Class B | | 1,107,000 | 30,298,347 |
| Procter & Gamble Co. | | 2,221,150 | 174,404,698 |
| Reckitt Benckiser Group PLC | | 94,500 | 7,501,072 |
| Spectrum Brands Holdings, Inc. (b) | | 657,899 | 64,941,210 |
| | | | 315,222,285 |
| Internet & Direct Marketing Retail - 0.3% | | | |
| Internet & Direct Marketing Retail - 0.3% | | | |
| Amazon.com, Inc. (a) | | 3,800 | 5,747,310 |
| Multiline Retail - 0.1% | | | |
| General Merchandise Stores - 0.1% | | | |
| Dollar Tree, Inc. (a) | | 21,200 | 2,175,968 |
| Paper & Forest Products - 0.2% | | | |
| Forest Products - 0.2% | | | |
| Svenska Cellulosa AB (SCA) (B Shares) | | 408,800 | 4,051,212 |
| Personal Products - 8.7% | | | |
| Personal Products - 8.7% | | | |
| Avon Products, Inc. (a) | | 10,658,435 | 28,031,684 |
| Coty, Inc. Class A | | 2,939,597 | 56,793,014 |
| Estee Lauder Companies, Inc. Class A | | 198,539 | 27,485,739 |
| Herbalife Ltd. (a) | | 217,510 | 20,032,671 |
| Ontex Group NV | | 281,400 | 8,125,905 |
| Unilever NV (Certificaten Van Aandelen) (Bearer) | | 979,430 | 51,259,595 |
| | | | 191,728,608 |
| Tobacco - 13.4% | | | |
| Tobacco - 13.4% | | | |
| Altria Group, Inc. | | 1,288,345 | 81,101,318 |
| British American Tobacco PLC sponsored ADR | | 768,426 | 45,383,240 |
| Philip Morris International, Inc. | | 1,626,591 | 168,433,498 |
| | | | 294,918,056 |
| TOTAL COMMON STOCKS | | | |
| (Cost $1,894,934,580) | | | 2,186,478,858 |
|
| Money Market Funds - 0.2% | | | |
| Fidelity Securities Lending Cash Central Fund 1.42% (c)(d) | | | |
| (Cost $4,717,386) | | 4,716,914 | 4,717,386 |
| TOTAL INVESTMENT IN SECURITIES - 100.0% | | | |
| (Cost $1,899,651,966) | | | 2,191,196,244 |
| NET OTHER ASSETS (LIABILITIES) - 0.0% | | | 916,003 |
| NET ASSETS - 100% | | | $2,192,112,247 |
Legend
(a) Non-income producing
(b) Security or a portion of the security is on loan at period end.
(c) Affiliated fund that is generally available only to investment companies and other accounts managed by Fidelity Investments. The rate quoted is the annualized seven-day yield of the fund at period end. A complete unaudited listing of the fund's holdings as of its most recent quarter end is available upon request. In addition, each Fidelity Central Fund's financial statements, which are not covered by the Fund's Report of Independent Registered Public Accounting Firm, are available on the SEC's website or upon request.
(d) Investment made with cash collateral received from securities on loan.
Affiliated Central Funds
Information regarding fiscal year to date income earned by the Fund from investments in Fidelity Central Funds is as follows:
| Fund | Income earned |
| Fidelity Cash Central Fund | $390,447 |
| Fidelity Securities Lending Cash Central Fund | 4,589,676 |
| Total | $4,980,123 |
Amounts in the income column in the above table include any capital gain distributions from underlying funds, which are presented in the corresponding line-item in the Statement of Operations if applicable.
Investment Valuation
The following is a summary of the inputs used, as of February 28, 2018, involving the Fund's assets and liabilities carried at fair value. The inputs or methodology used for valuing securities may not be an indication of the risk associated with investing in those securities. For more information on valuation inputs, and their aggregation into the levels used below, please refer to the Investment Valuation section in the accompanying Notes to Financial Statements.
| | Valuation Inputs at Reporting Date: |
| Description | Total | Level 1 | Level 2 | Level 3 |
| Investments in Securities: | | | | |
| Common Stocks | $2,186,478,858 | $2,037,458,281 | $149,020,577 | $-- |
| Money Market Funds | 4,717,386 | 4,717,386 | -- | -- |
| Total Investments in Securities: | $2,191,196,244 | $2,042,175,667 | $149,020,577 | $-- |
The following is a summary of transfers between Level 1 and Level 2 for the period ended February 28, 2018. Transfers are assumed to have occurred at the beginning of the period, and are primarily attributable to the valuation techniques used for foreign equity securities, as discussed in the accompanying Notes to Financial Statements:
| Transfers | Total |
| Level 1 to Level 2 | $39,433,161 |
| Level 2 to Level 1 | $0 |
Other Information
Distribution of investments by country or territory of incorporation, as a percentage of Total Net Assets, is as follows (Unaudited):
| United States of America | 88.9% |
| Netherlands | 2.3% |
| United Kingdom | 2.2% |
| Sweden | 1.6% |
| Others (Individually Less Than 1%) | 5.0% |
| | 100.0% |
See accompanying notes which are an integral part of the financial statements.
Consumer Staples Portfolio
Financial Statements
Statement of Assets and Liabilities
| | | February 28, 2018 |
| Assets | | |
Investment in securities, at value (including securities loaned of $4,394,057) — See accompanying schedule:
Unaffiliated issuers (cost $1,894,934,580) | $2,186,478,858 | |
| Fidelity Central Funds (cost $4,717,386) | 4,717,386 | |
| Total Investment in Securities (cost $1,899,651,966) | | $2,191,196,244 |
| Foreign currency held at value (cost $70,608) | | 70,251 |
| Receivable for investments sold | | 13,813,876 |
| Receivable for fund shares sold | | 1,032,001 |
| Dividends receivable | | 3,999,432 |
| Distributions receivable from Fidelity Central Funds | | 6,000 |
| Prepaid expenses | | 9,349 |
| Other receivables | | 278,452 |
| Total assets | | 2,210,405,605 |
| Liabilities | | |
| Payable to custodian bank | $1,846,679 | |
| Payable for investments purchased | 5,604,674 | |
| Payable for fund shares redeemed | 4,024,795 | |
| Accrued management fee | 1,018,703 | |
| Distribution and service plan fees payable | 299,567 | |
| Other affiliated payables | 412,196 | |
| Other payables and accrued expenses | 350,863 | |
| Collateral on securities loaned | 4,735,881 | |
| Total liabilities | | 18,293,358 |
| Net Assets | | $2,192,112,247 |
| Net Assets consist of: | | |
| Paid in capital | | $1,773,739,580 |
| Undistributed net investment income | | 5,261,183 |
| Accumulated undistributed net realized gain (loss) on investments and foreign currency transactions | | 121,513,199 |
| Net unrealized appreciation (depreciation) on investments and assets and liabilities in foreign currencies | | 291,598,285 |
| Net Assets | | $2,192,112,247 |
| Calculation of Maximum Offering Price | | |
| Class A: | | |
| Net Asset Value and redemption price per share ($317,365,757 ÷ 3,644,956 shares) | | $87.07 |
| Maximum offering price per share (100/94.25 of $87.07) | | $92.38 |
| Class M: | | |
| Net Asset Value and redemption price per share ($76,571,538 ÷ 887,281 shares) | | $86.30 |
| Maximum offering price per share (100/96.50 of $86.30) | | $89.43 |
| Class C: | | |
| Net Asset Value and offering price per share ($228,873,523 ÷ 2,697,381 shares)(a) | | $84.85 |
| Consumer Staples: | | |
| Net Asset Value, offering price and redemption price per share ($1,328,696,456 ÷ 15,124,744 shares) | | $87.85 |
| Class I: | | |
| Net Asset Value, offering price and redemption price per share ($240,604,973 ÷ 2,744,225 shares) | | $87.68 |
(a) Redemption price per share is equal to net asset value less any applicable contingent deferred sales charge.
See accompanying notes which are an integral part of the financial statements.
Statement of Operations
| | | Year ended February 28, 2018 |
| Investment Income | | |
| Dividends | | $65,418,862 |
| Income from Fidelity Central Funds (including $4,589,676 from security lending) | | 4,980,123 |
| Total income | | 70,398,985 |
| Expenses | | |
| Management fee | $14,425,413 | |
| Transfer agent fees | 4,851,634 | |
| Distribution and service plan fees | 4,214,872 | |
| Accounting and security lending fees | 817,137 | |
| Custodian fees and expenses | 69,334 | |
| Independent trustees' fees and expenses | 58,794 | |
| Registration fees | 153,387 | |
| Audit | 61,585 | |
| Legal | 36,471 | |
| Interest | 16,749 | |
| Miscellaneous | 143,372 | |
| Total expenses before reductions | 24,848,748 | |
| Expense reductions | (173,345) | 24,675,403 |
| Net investment income (loss) | | 45,723,582 |
| Realized and Unrealized Gain (Loss) | | |
| Net realized gain (loss) on: | | |
| Investment securities: | | |
| Unaffiliated issuers | 299,702,774 | |
| Fidelity Central Funds | (9,191) | |
| Foreign currency transactions | 287,386 | |
| Total net realized gain (loss) | | 299,980,969 |
| Change in net unrealized appreciation (depreciation) on: | | |
| Unaffiliated issuers (net of decrease in deferred foreign taxes of $618,798) | (369,386,234) | |
| Fidelity Central Funds | (29,590) | |
| Assets and liabilities in foreign currencies | 100,702 | |
| Total change in net unrealized appreciation (depreciation) | | (369,315,122) |
| Net gain (loss) | | (69,334,153) |
| Net increase (decrease) in net assets resulting from operations | | $(23,610,571) |
See accompanying notes which are an integral part of the financial statements.
Statement of Changes in Net Assets
| | Year ended February 28, 2018 | Year ended February 28, 2017 |
| Increase (Decrease) in Net Assets | | |
| Operations | | |
| Net investment income (loss) | $45,723,582 | $47,285,744 |
| Net realized gain (loss) | 299,980,969 | 217,332,500 |
| Change in net unrealized appreciation (depreciation) | (369,315,122) | 57,308,049 |
| Net increase (decrease) in net assets resulting from operations | (23,610,571) | 321,926,293 |
| Distributions to shareholders from net investment income | (43,177,465) | (44,327,157) |
| Distributions to shareholders from net realized gain | (165,062,987) | (82,139,579) |
| Total distributions | (208,240,452) | (126,466,736) |
| Share transactions - net increase (decrease) | (437,546,127) | (395,070,237) |
| Redemption fees | – | 44,026 |
| Total increase (decrease) in net assets | (669,397,150) | (199,566,654) |
| Net Assets | | |
| Beginning of period | 2,861,509,397 | 3,061,076,051 |
| End of period | $2,192,112,247 | $2,861,509,397 |
| Other Information | | |
| Undistributed net investment income end of period | $5,261,183 | $4,801,401 |
See accompanying notes which are an integral part of the financial statements.
Financial Highlights
Consumer Staples Portfolio Class A
| Years ended February 28, | 2018 | 2017 | 2016A | 2015 | 2014 |
| Selected Per–Share Data | | | | | |
| Net asset value, beginning of period | $96.18 | $89.78 | $101.33 | $87.93 | $85.67 |
| Income from Investment Operations | | | | | |
| Net investment income (loss)B | 1.54 | 1.28 | 1.34 | 1.37 | 1.43 |
| Net realized and unrealized gain (loss) | (2.80) | 9.12 | (4.86) | 17.28 | 7.51 |
| Total from investment operations | (1.26) | 10.40 | (3.52) | 18.65 | 8.94 |
| Distributions from net investment income | (1.55) | (1.37) | (1.31) | (1.28) | (1.44) |
| Distributions from net realized gain | (6.30) | (2.64) | (6.72) | (3.98) | (5.24) |
| Total distributions | (7.85) | (4.00)C | (8.03) | (5.25)D | (6.68) |
| Redemption fees added to paid in capitalB | – | –E | –E | –E | –E |
| Net asset value, end of period | $87.07 | $96.18 | $89.78 | $101.33 | $87.93 |
| Total ReturnF,G | (1.68)% | 11.91% | (3.51)% | 21.95% | 10.53% |
| Ratios to Average Net AssetsH,I | | | | | |
| Expenses before reductions | 1.05% | 1.04% | 1.04% | 1.05% | 1.06% |
| Expenses net of fee waivers, if any | 1.05% | 1.04% | 1.04% | 1.05% | 1.06% |
| Expenses net of all reductions | 1.04% | 1.03% | 1.04% | 1.05% | 1.06% |
| Net investment income (loss) | 1.60% | 1.37% | 1.45% | 1.45% | 1.61% |
| Supplemental Data | | | | | |
| Net assets, end of period (000 omitted) | $317,366 | $522,014 | $470,249 | $414,151 | $329,459 |
| Portfolio turnover rateJ | 76% | 56%K | 63% | 42%K | 31% |
A For the year ended February 29.
B Calculated based on average shares outstanding during the period.
C Total distributions of $4.00 per share is comprised of distributions from net investment income of $1.365 and distributions from net realized gain of $2.636 per share.
D Total distributions of $5.25 per share is comprised of distributions from net investment income of $1.275 and distributions from net realized gain of $3.976 per share.
E Amount represents less than $.005 per share.
F Total returns would have been lower if certain expenses had not been reduced during the applicable periods shown.
G Total returns do not include the effect of the sales charges.
H Fees and expenses of any underlying Fidelity Central Funds are not included in the Fund's expense ratio. The Fund indirectly bears its proportionate share of the expenses of any underlying Fidelity Central Funds.
I Expense ratios reflect operating expenses of the class. Expenses before reductions do not reflect amounts reimbursed by the investment adviser or reductions from brokerage service arrangements or reductions from other expense offset arrangements and do not represent the amount paid by the class during periods when reimbursements or reductions occur. Expenses net of fee waivers reflect expenses after reimbursement by the investment adviser but prior to reductions from brokerage service arrangements or other expense offset arrangements. Expenses net of all reductions represent the net expenses paid by the class.
J Amount does not include the portfolio activity of any underlying Fidelity Central Funds.
K Portfolio turnover rate excludes securities received or delivered in-kind.
See accompanying notes which are an integral part of the financial statements.
Consumer Staples Portfolio Class M
| Years ended February 28, | 2018 | 2017 | 2016A | 2015 | 2014 |
| Selected Per–Share Data | | | | | |
| Net asset value, beginning of period | $95.42 | $89.10 | $100.61 | $87.37 | $85.18 |
| Income from Investment Operations | | | | | |
| Net investment income (loss)B | 1.27 | 1.01 | 1.08 | 1.10 | 1.18 |
| Net realized and unrealized gain (loss) | (2.78) | 9.07 | (4.83) | 17.15 | 7.46 |
| Total from investment operations | (1.51) | 10.08 | (3.75) | 18.25 | 8.64 |
| Distributions from net investment income | (1.31) | (1.12) | (1.04) | (1.04) | (1.21) |
| Distributions from net realized gain | (6.30) | (2.64) | (6.72) | (3.98) | (5.24) |
| Total distributions | (7.61) | (3.76) | (7.76) | (5.01)C | (6.45) |
| Redemption fees added to paid in capitalB | – | –D | –D | –D | –D |
| Net asset value, end of period | $86.30 | $95.42 | $89.10 | $100.61 | $87.37 |
| Total ReturnE,F | (1.94)% | 11.61% | (3.78)% | 21.60% | 10.23% |
| Ratios to Average Net AssetsG,H | | | | | |
| Expenses before reductions | 1.32% | 1.32% | 1.32% | 1.32% | 1.33% |
| Expenses net of fee waivers, if any | 1.32% | 1.32% | 1.32% | 1.32% | 1.33% |
| Expenses net of all reductions | 1.31% | 1.31% | 1.31% | 1.32% | 1.33% |
| Net investment income (loss) | 1.33% | 1.09% | 1.17% | 1.18% | 1.34% |
| Supplemental Data | | | | | |
| Net assets, end of period (000 omitted) | $76,572 | $89,925 | $76,586 | $81,489 | $61,421 |
| Portfolio turnover rateI | 76% | 56%J | 63% | 42%J | 31% |
A For the year ended February 29.
B Calculated based on average shares outstanding during the period.
C Total distributions of $5.01 per share is comprised of distributions from net investment income of $1.036 and distributions from net realized gain of $3.976 per share.
D Amount represents less than $.005 per share.
E Total returns would have been lower if certain expenses had not been reduced during the applicable periods shown.
F Total returns do not include the effect of the sales charges.
G Fees and expenses of any underlying Fidelity Central Funds are not included in the Fund's expense ratio. The Fund indirectly bears its proportionate share of the expenses of any underlying Fidelity Central Funds.
H Expense ratios reflect operating expenses of the class. Expenses before reductions do not reflect amounts reimbursed by the investment adviser or reductions from brokerage service arrangements or reductions from other expense offset arrangements and do not represent the amount paid by the class during periods when reimbursements or reductions occur. Expenses net of fee waivers reflect expenses after reimbursement by the investment adviser but prior to reductions from brokerage service arrangements or other expense offset arrangements. Expenses net of all reductions represent the net expenses paid by the class.
I Amount does not include the portfolio activity of any underlying Fidelity Central Funds.
J Portfolio turnover rate excludes securities received or delivered in-kind.
See accompanying notes which are an integral part of the financial statements.
Consumer Staples Portfolio Class C
| Years ended February 28, | 2018 | 2017 | 2016A | 2015 | 2014 |
| Selected Per–Share Data | | | | | |
| Net asset value, beginning of period | $93.89 | $87.77 | $99.27 | $86.32 | $84.28 |
| Income from Investment Operations | | | | | |
| Net investment income (loss)B | .81 | .56 | .63 | .65 | .75 |
| Net realized and unrealized gain (loss) | (2.73) | 8.92 | (4.75) | 16.93 | 7.36 |
| Total from investment operations | (1.92) | 9.48 | (4.12) | 17.58 | 8.11 |
| Distributions from net investment income | (.82) | (.73) | (.65) | (.65) | (.84) |
| Distributions from net realized gain | (6.30) | (2.64) | (6.72) | (3.98) | (5.24) |
| Total distributions | (7.12) | (3.36)C | (7.38)D | (4.63) | (6.07)E |
| Redemption fees added to paid in capitalB | – | –F | –F | –F | –F |
| Net asset value, end of period | $84.85 | $93.89 | $87.77 | $99.27 | $86.32 |
| Total ReturnG,H | (2.41)% | 11.07% | (4.23)% | 21.03% | 9.70% |
| Ratios to Average Net AssetsI,J | | | | | |
| Expenses before reductions | 1.79% | 1.80% | 1.80% | 1.80% | 1.82% |
| Expenses net of fee waivers, if any | 1.79% | 1.79% | 1.80% | 1.80% | 1.82% |
| Expenses net of all reductions | 1.78% | 1.79% | 1.79% | 1.80% | 1.81% |
| Net investment income (loss) | .86% | .61% | .69% | .70% | .85% |
| Supplemental Data | | | | | |
| Net assets, end of period (000 omitted) | $228,874 | $308,350 | $250,576 | $228,151 | $164,669 |
| Portfolio turnover rateK | 76% | 56%L | 63% | 42%L | 31% |
A For the year ended February 29.
B Calculated based on average shares outstanding during the period.
C Total distributions of $3.36 per share is comprised of distributions from net investment income of $.726 and distributions from net realized gain of $2.636 per share.
D Total distributions of $7.38 per share is comprised of distributions from net investment income of $.651 and distributions from net realized gain of $6.724 per share.
E Total distributions of $6.07 per share is comprised of distributions from net investment income of $.837 and distributions from net realized gain of $5.237 per share.
F Amount represents less than $.005 per share.
G Total returns would have been lower if certain expenses had not been reduced during the applicable periods shown.
H Total returns do not include the effect of the contingent deferred sales charge.
I Fees and expenses of any underlying Fidelity Central Funds are not included in the Fund's expense ratio. The Fund indirectly bears its proportionate share of the expenses of any underlying Fidelity Central Funds.
J Expense ratios reflect operating expenses of the class. Expenses before reductions do not reflect amounts reimbursed by the investment adviser or reductions from brokerage service arrangements or reductions from other expense offset arrangements and do not represent the amount paid by the class during periods when reimbursements or reductions occur. Expenses net of fee waivers reflect expenses after reimbursement by the investment adviser but prior to reductions from brokerage service arrangements or other expense offset arrangements. Expenses net of all reductions represent the net expenses paid by the class.
K Amount does not include the portfolio activity of any underlying Fidelity Central Funds.
L Portfolio turnover rate excludes securities received or delivered in-kind.
See accompanying notes which are an integral part of the financial statements.
Consumer Staples Portfolio
| Years ended February 28, | 2018 | 2017 | 2016A | 2015 | 2014 |
| Selected Per–Share Data | | | | | |
| Net asset value, beginning of period | $97.01 | $90.48 | $102.03 | $88.51 | $86.17 |
| Income from Investment Operations | | | | | |
| Net investment income (loss)B | 1.82 | 1.56 | 1.61 | 1.64 | 1.69 |
| Net realized and unrealized gain (loss) | (2.82) | 9.20 | (4.89) | 17.40 | 7.55 |
| Total from investment operations | (1.00) | 10.76 | (3.28) | 19.04 | 9.24 |
| Distributions from net investment income | (1.86) | (1.60) | (1.55) | (1.54) | (1.66) |
| Distributions from net realized gain | (6.30) | (2.64) | (6.72) | (3.98) | (5.24) |
| Total distributions | (8.16) | (4.23)C | (8.27) | (5.52) | (6.90) |
| Redemption fees added to paid in capitalB | – | –D | –D | –D | –D |
| Net asset value, end of period | $87.85 | $97.01 | $90.48 | $102.03 | $88.51 |
| Total ReturnE | (1.40)% | 12.24% | (3.25)% | 22.27% | 10.82% |
| Ratios to Average Net AssetsF,G | | | | | |
| Expenses before reductions | .76% | .76% | .77% | .77% | .79% |
| Expenses net of fee waivers, if any | .76% | .76% | .77% | .77% | .79% |
| Expenses net of all reductions | .76% | .76% | .76% | .77% | .79% |
| Net investment income (loss) | 1.89% | 1.64% | 1.72% | 1.73% | 1.88% |
| Supplemental Data | | | | | |
| Net assets, end of period (000 omitted) | $1,328,696 | $1,665,604 | $2,039,983 | $2,173,970 | $1,328,594 |
| Portfolio turnover rateH | 76% | 56%I | 63% | 42%I | 31% |
A For the year ended February 29.
B Calculated based on average shares outstanding during the period.
C Total distributions of $4.23 per share is comprised of distributions from net investment income of $1.596 and distributions from net realized gain of $2.636 per share.
D Amount represents less than $.005 per share.
E Total returns would have been lower if certain expenses had not been reduced during the applicable periods shown.
F Fees and expenses of any underlying Fidelity Central Funds are not included in the Fund's expense ratio. The Fund indirectly bears its proportionate share of the expenses of any underlying Fidelity Central Funds.
G Expense ratios reflect operating expenses of the class. Expenses before reductions do not reflect amounts reimbursed by the investment adviser or reductions from brokerage service arrangements or reductions from other expense offset arrangements and do not represent the amount paid by the class during periods when reimbursements or reductions occur. Expenses net of fee waivers reflect expenses after reimbursement by the investment adviser but prior to reductions from brokerage service arrangements or other expense offset arrangements. Expenses net of all reductions represent the net expenses paid by the class.
H Amount does not include the portfolio activity of any underlying Fidelity Central Funds.
I Portfolio turnover rate excludes securities received or delivered in-kind.
See accompanying notes which are an integral part of the financial statements.
Consumer Staples Portfolio Class I
| Years ended February 28, | 2018 | 2017 | 2016A | 2015 | 2014 |
| Selected Per–Share Data | | | | | |
| Net asset value, beginning of period | $96.82 | $90.34 | $101.91 | $88.33 | $85.92 |
| Income from Investment Operations | | | | | |
| Net investment income (loss)B | 1.81 | 1.54 | 1.60 | 1.59 | 1.66 |
| Net realized and unrealized gain (loss) | (2.82) | 9.19 | (4.89) | 17.40 | 7.53 |
| Total from investment operations | (1.01) | 10.73 | (3.29) | 18.99 | 9.19 |
| Distributions from net investment income | (1.83) | (1.61) | (1.55) | (1.44) | (1.54) |
| Distributions from net realized gain | (6.30) | (2.64) | (6.72) | (3.98) | (5.24) |
| Total distributions | (8.13) | (4.25) | (8.28)C | (5.41)D | (6.78) |
| Redemption fees added to paid in capitalB | – | –E | –E | –E | –E |
| Net asset value, end of period | $87.68 | $96.82 | $90.34 | $101.91 | $88.33 |
| Total ReturnF | (1.41)% | 12.22% | (3.26)% | 22.26% | 10.80% |
| Ratios to Average Net AssetsG,H | | | | | |
| Expenses before reductions | .78% | .78% | .78% | .80% | .82% |
| Expenses net of fee waivers, if any | .78% | .78% | .77% | .80% | .82% |
| Expenses net of all reductions | .77% | .77% | .77% | .80% | .82% |
| Net investment income (loss) | 1.88% | 1.63% | 1.71% | 1.70% | 1.85% |
| Supplemental Data | | | | | |
| Net assets, end of period (000 omitted) | $240,605 | $275,616 | $216,836 | $198,538 | $154,271 |
| Portfolio turnover rateI | 76% | 56%J | 63% | 42%J | 31% |
A For the year ended February 29.
B Calculated based on average shares outstanding during the period.
C Total distributions of $8.28 per share is comprised of distributions from net investment income of $1.553 and distributions from net realized gain of $6.724 per share.
D Total distributions of $5.41 per share is comprised of distributions from net investment income of $1.436 and distributions from net realized gain of $3.976 per share.
E Amount represents less than $.005 per share.
F Total returns would have been lower if certain expenses had not been reduced during the applicable periods shown.
G Fees and expenses of any underlying Fidelity Central Funds are not included in the Fund's expense ratio. The Fund indirectly bears its proportionate share of the expenses of any underlying Fidelity Central Funds.
H Expense ratios reflect operating expenses of the class. Expenses before reductions do not reflect amounts reimbursed by the investment adviser or reductions from brokerage service arrangements or reductions from other expense offset arrangements and do not represent the amount paid by the class during periods when reimbursements or reductions occur. Expenses net of fee waivers reflect expenses after reimbursement by the investment adviser but prior to reductions from brokerage service arrangements or other expense offset arrangements. Expenses net of all reductions represent the net expenses paid by the class.
I Amount does not include the portfolio activity of any underlying Fidelity Central Funds.
J Portfolio turnover rate excludes securities received or delivered in-kind.
See accompanying notes which are an integral part of the financial statements.
Notes to Financial Statements
For the period ended February 28, 2018
1. Organization.
Consumer Staples Portfolio (the Fund) is a non-diversified fund of Fidelity Select Portfolios (the Trust) and is authorized to issue an unlimited number of shares. The Trust is registered under the Investment Company Act of 1940, as amended (the 1940 Act), as an open-end management investment company organized as a Massachusetts business trust. The Fund invests primarily in securities of companies whose principal business activities fall within specific industries. The Fund offers Class A, Class M (formerly Class T), Class C, Consumer Staples and Class I shares, each of which has equal rights as to assets and voting privileges. Each class has exclusive voting rights with respect to matters that affect that class.
After the close of business on June 24, 2016, all outstanding Class B shares were converted to Class A shares. All prior fiscal period dollar and share amounts for Class B presented in the Notes to Financial Statements are for the period March 1, 2016 through June 24, 2016.
2. Investments in Fidelity Central Funds.
The Fund invests in Fidelity Central Funds, which are open-end investment companies generally available only to other investment companies and accounts managed by the investment adviser and its affiliates. The Fund's Schedule of Investments lists each of the Fidelity Central Funds held as of period end, if any, as an investment of the Fund, but does not include the underlying holdings of each Fidelity Central Fund. As an Investing Fund, the Fund indirectly bears its proportionate share of the expenses of the underlying Fidelity Central Funds.
The Money Market Central Funds seek preservation of capital and current income and are managed by Fidelity Investments Money Management, Inc. (FIMM), an affiliate of the investment adviser. Annualized expenses of the Money Market Central Funds as of their most recent shareholder report date are less than .005%.
A complete unaudited list of holdings for each Fidelity Central Fund is available upon request or at the Securities and Exchange Commission (the SEC) website at www.sec.gov. In addition, the financial statements of the Fidelity Central Funds, which are not covered by the Fund's Report of Independent Registered Public Accounting Firm, are available on the SEC website or upon request.
3. Significant Accounting Policies.
The Fund is an investment company and applies the accounting and reporting guidance of the Financial Accounting Standards Board (FASB) Accounting Standards Codification Topic 946 Financial Services – Investments Companies. The financial statements have been prepared in conformity with accounting principles generally accepted in the United States of America (GAAP), which require management to make certain estimates and assumptions at the date of the financial statements. Actual results could differ from those estimates. Subsequent events, if any, through the date that the financial statements were issued have been evaluated in the preparation of the financial statements. The following summarizes the significant accounting policies of the Fund:
Investment Valuation. Investments are valued as of 4:00 p.m. Eastern time on the last calendar day of the period. The Board of Trustees (the Board) has delegated the day to day responsibility for the valuation of the Fund's investments to the Fair Value Committee (the Committee) established by the Fund's investment adviser. In accordance with valuation policies and procedures approved by the Board, the Fund attempts to obtain prices from one or more third party pricing vendors or brokers to value its investments. When current market prices, quotations or currency exchange rates are not readily available or reliable, investments will be fair valued in good faith by the Committee, in accordance with procedures adopted by the Board. Factors used in determining fair value vary by investment type and may include market or investment specific events. The frequency with which these procedures are used cannot be predicted and they may be utilized to a significant extent. The Committee oversees the Fund's valuation policies and procedures and reports to the Board on the Committee's activities and fair value determinations. The Board monitors the appropriateness of the procedures used in valuing the Fund's investments and ratifies the fair value determinations of the Committee.
The Fund categorizes the inputs to valuation techniques used to value its investments into a disclosure hierarchy consisting of three levels as shown below:
- Level 1 – quoted prices in active markets for identical investments
- Level 2 – other significant observable inputs (including quoted prices for similar investments, interest rates, prepayment speeds, etc.)
- Level 3 – unobservable inputs (including the Fund's own assumptions based on the best information available)
Valuation techniques used to value the Fund's investments by major category are as follows:
Equity securities, including restricted securities, for which market quotations are readily available, are valued at the last reported sale price or official closing price as reported by a third party pricing vendor on the primary market or exchange on which they are traded and are categorized as Level 1 in the hierarchy. In the event there were no sales during the day or closing prices are not available, securities are valued at the last quoted bid price or may be valued using the last available price and are generally categorized as Level 2 in the hierarchy. For foreign equity securities, when market or security specific events arise, comparisons to the valuation of American Depositary Receipts (ADRs), futures contracts, Exchange-Traded Funds (ETFs) and certain indexes as well as quoted prices for similar securities may be used and would be categorized as Level 2 in the hierarchy. Utilizing these techniques may result in transfers between Level 1 and Level 2. For equity securities, including restricted securities, where observable inputs are limited, assumptions about market activity and risk are used and these securities may be categorized as Level 3 in the hierarchy.
Investments in open-end mutual funds, including the Fidelity Central Funds, are valued at their closing net asset value (NAV) each business day and are categorized as Level 1 in the hierarchy.
Changes in valuation techniques may result in transfers in or out of an assigned level within the disclosure hierarchy. The aggregate value of investments by input level as of February 28, 2018 including information on transfers between Levels 1 and 2 is included at the end of the Fund's Schedule of Investments.
Foreign Currency. The Fund may use foreign currency contracts to facilitate transactions in foreign-denominated securities. Gains and losses from these transactions may arise from changes in the value of the foreign currency or if the counterparties do not perform under the contracts' terms.
Foreign-denominated assets, including investment securities, and liabilities are translated into U.S. dollars at the exchange rates at period end. Purchases and sales of investment securities, income and dividends received and expenses denominated in foreign currencies are translated into U.S. dollars at the exchange rate in effect on the transaction date.
The effects of exchange rate fluctuations on investments are included with the net realized and unrealized gain (loss) on investment securities. Other foreign currency transactions resulting in realized and unrealized gain (loss) are disclosed separately.
Investment Transactions and Income. For financial reporting purposes, the Fund's investment holdings and NAV include trades executed through the end of the last business day of the period. The NAV per share for processing shareholder transactions is calculated as of the close of business of the New York Stock Exchange (NYSE), normally 4:00 p.m. Eastern time and includes trades executed through the end of the prior business day. Gains and losses on securities sold are determined on the basis of identified cost and includes proceeds received from litigation. Dividend income is recorded on the ex-dividend date, except for certain dividends from foreign securities where the ex-dividend date may have passed, which are recorded as soon as the Fund is informed of the ex-dividend date. Non-cash dividends included in dividend income, if any, are recorded at the fair market value of the securities received. Income and capital gain distributions from Fidelity Central Funds, if any, are recorded on the ex-dividend date. Certain distributions received by the Fund represent a return of capital or capital gain. The Fund determines the components of these distributions subsequent to the ex-dividend date, based upon receipt of tax filings or other correspondence relating to the underlying investment. These distributions are recorded as a reduction of cost of investments and/or as a realized gain. Investment income is recorded net of foreign taxes withheld where recovery of such taxes is uncertain.
Class Allocations and Expenses. Investment income, realized and unrealized capital gains and losses, common expenses of the Fund, and certain fund-level expense reductions, if any, are allocated daily on a pro-rata basis to each class based on the relative net assets of each class to the total net assets of the Fund. Each class differs with respect to transfer agent and distribution and service plan fees incurred. Certain expense reductions may also differ by class. For the reporting period, the allocated portion of income and expenses to each class as a percent of its average net assets may vary due to the timing of recording these transactions in relation to fluctuating net assets of the classes. Expenses directly attributable to a fund are charged to that fund. Expenses attributable to more than one fund are allocated among the respective funds on the basis of relative net assets or other appropriate methods. Expense estimates are accrued in the period to which they relate and adjustments are made when actual amounts are known.
Deferred Trustee Compensation. Under a Deferred Compensation Plan (the Plan), independent Trustees may elect to defer receipt of a portion of their annual compensation. Deferred amounts are invested in a cross-section of Fidelity funds, are marked-to-market and remain in the Fund until distributed in accordance with the Plan. The investment of deferred amounts and the offsetting payable to the Trustees are included in the accompanying Statement of Assets and Liabilities.
Income Tax Information and Distributions to Shareholders. Each year, the Fund intends to qualify as a regulated investment company under Subchapter M of the Internal Revenue Code, including distributing substantially all of its taxable income and realized gains. As a result, no provision for U.S. Federal income taxes is required. As of February 28, 2018, the Fund did not have any unrecognized tax benefits in the financial statements; nor is the Fund aware of any tax positions for which it is reasonably possible that the total amounts of unrecognized tax benefits will significantly change in the next twelve months. The Fund files a U.S. federal tax return, in addition to state and local tax returns as required. The Fund's federal income tax returns are subject to examination by the Internal Revenue Service (IRS) for a period of three fiscal years after they are filed. State and local tax returns may be subject to examination for an additional fiscal year depending on the jurisdiction. Foreign taxes are provided for based on the Fund's understanding of the tax rules and rates that exist in the foreign markets in which it invests.
Distributions are declared and recorded on the ex-dividend date. Income dividends and capital gain distributions are declared separately for each class. Income and capital gain distributions are determined in accordance with income tax regulations, which may differ from GAAP. In addition, the Fund claimed a portion of the payment made to redeeming shareholders as a distribution for income tax purposes.
Capital accounts within the financial statements are adjusted for permanent book-tax differences. These adjustments have no impact on net assets or the results of operations. Capital accounts are not adjusted for temporary book-tax differences which will reverse in a subsequent period.
Book-tax differences are primarily due to foreign currency transactions, deferred trustees compensation and losses deferred due to wash sales.
As of period end, the cost and unrealized appreciation (depreciation) in securities, and derivatives if applicable, for federal income tax purposes were as follows:
| Gross unrealized appreciation | $387,126,400 |
| Gross unrealized depreciation | (98,497,007) |
| Net unrealized appreciation (depreciation) | $288,629,393 |
| Tax Cost | $1,902,566,851 |
The tax-based components of distributable earnings as of period end were as follows:
| Undistributed ordinary income | $5,462,244 |
| Undistributed long-term capital gain | $124,428,083 |
| Net unrealized appreciation (depreciation) on securities and other investments | $288,683,400 |
The tax character of distributions paid was as follows:
| | February 28, 2018 | February 28, 2017 |
| Ordinary Income | $43,177,465 | $ 67,916,475 |
| Long-term Capital Gains | 165,062,987 | 58,550,261 |
| Total | $208,240,452 | $ 126,466,736 |
4. Purchases and Sales of Investments.
Purchases and sales of securities, other than short-term securities, aggregated $1,965,840,225 and $2,509,410,359, respectively.
5. Fees and Other Transactions with Affiliates.
Management Fee. Fidelity SelectCo, LLC (the investment adviser) and its affiliates provide the Fund with investment management related services for which the Fund pays a monthly management fee. The management fee is the sum of an individual fund fee rate that is based on an annual rate of .30% of the Fund's average net assets and an annualized group fee rate that averaged .24% during the period. The group fee rate is based upon the average net assets of all the mutual funds advised by Fidelity Management & Research Company (FMR) and the investment adviser. The group fee rate decreases as assets under management increase and increases as assets under management decrease. For the reporting period, the total annual management fee rate was .54% of the Fund's average net assets.
Distribution and Service Plan Fees. In accordance with Rule 12b-1 of the 1940 Act, the Fund has adopted separate Distribution and Service Plans for each class of shares. Certain classes pay Fidelity Distributors Corporation (FDC), an affiliate of the investment adviser, separate Distribution and Service Fees, each of which is based on an annual percentage of each class' average net assets. In addition, FDC may pay financial intermediaries for selling shares of the Fund and providing shareholder support services. For the period, the Distribution and Service Fee rates, total fees and amounts retained by FDC were as follows:
| | Distribution Fee | Service Fee | Total Fees | Retained by FDC |
| Class A | -% | .25% | $917,644 | $2,440 |
| Class M | .25% | .25% | 436,644 | – |
| Class C | .75% | .25% | 2,860,584 | 395,349 |
| | | | $4,214,872 | $397,789 |
Sales Load. FDC may receive a front-end sales charge of up to 5.75% for selling Class A shares and 3.50% for selling Class M shares, some of which is paid to financial intermediaries for selling shares of the Fund. Depending on the holding period, FDC may receive contingent deferred sales charges levied on Class A, Class M and Class C redemptions. The deferred sales charges are 1.00% for Class C shares, 1.00% for certain purchases of Class A shares and .25% for certain purchases of Class M shares.
For the period, sales charge amounts retained by FDC were as follows:
| | Retained by FDC |
| Class A | $198,511 |
| Class M | 22,666 |
| Class C(a) | 46,661 |
| | $267,838 |
(a) When Class C shares are initially sold, FDC pays commissions from its own resources to financial intermediaries through which the sales are made.
Transfer Agent Fees. Fidelity Investments Institutional Operations Company, Inc., (FIIOC), an affiliate of the investment adviser, is the transfer, dividend disbursing and shareholder servicing agent for each class of the Fund. FIIOC receives account fees and asset-based fees that vary according to the account size and type of account of the shareholders of the respective classes of the Fund. FIIOC pays for typesetting, printing and mailing of shareholder reports, except proxy statements.
For the period, transfer agent fees for each class were as follows:
| | Amount | % of Class-Level Average Net Assets |
| Class A | $757,447 | .21 |
| Class M | 196,881 | .23 |
| Class C | 569,799 | .20 |
| Consumer Staples | 2,676,898 | .17 |
| Class I | 650,609 | .18 |
| | $4,851,634 | |
Accounting and Security Lending Fees. Fidelity Service Company, Inc. (FSC), an affiliate of the investment adviser, maintains the Fund's accounting records. The accounting fee is based on the level of average net assets for each month. Under a separate contract, FSC administers the security lending program. The security lending fee is based on the number and duration of lending transactions.
Brokerage Commissions. The Fund placed a portion of its portfolio transactions with brokerage firms which are affiliates of the investment adviser. Brokerage commissions are included in net realized gain (loss) and change in net unrealized appreciation (depreciation) in the Statement of Operations. The commissions paid to these affiliated firms were $68,312 for the period.
Interfund Lending Program. Pursuant to an Exemptive Order issued by the SEC, the Fund, along with other registered investment companies having management contracts with Fidelity Management & Research Company (FMR) or other affiliated entities of FMR, may participate in an interfund lending program. This program provides an alternative credit facility allowing the funds to borrow from, or lend money to, other participating affiliated funds. At period end, there were no interfund loans outstanding. The Fund's activity in this program during the period for which loans were outstanding was as follows:
| Borrower or Lender | Average Loan Balance | Weighted Average Interest Rate | Interest Expense |
| Borrower | $11,534,242 | 1.55% | $16,347 |
Interfund Trades. The Fund may purchase from or sell securities to other Fidelity Funds under procedures adopted by the Board. The procedures have been designed to ensure these interfund trades are executed in accordance with Rule 17a-7 of the 1940 Act. Interfund trades are included within the respective purchases and sales amounts shown in the Purchases and Sales of Investments note.
Prior Fiscal Year Redemptions In-Kind. During the prior period, 2,230,314 shares of Consumer Staples Portfolio held by an affiliated entity were redeemed in-kind for investments and cash with a value of $205,991,818. The Fund had a net realized gain of $85,065,706 on investments delivered through in-kind redemptions. The amount of the in-kind redemptions is included in share transactions in the accompanying Statement of Changes in Net Assets as well as the Notes to Financial Statements. Consumer Staples Portfolio recognized no gain or loss for federal income tax purposes.
Other. During the period, the investment adviser reimbursed the Fund for certain losses in the amount of $7,646.
6. Committed Line of Credit.
The Fund participates with other funds managed by the investment adviser or an affiliate in a $4.25 billion credit facility (the "line of credit") to be utilized for temporary or emergency purposes to fund shareholder redemptions or for other short-term liquidity purposes. The Fund has agreed to pay commitment fees on its pro-rata portion of the line of credit, which amounted to $8,453 and is reflected in Miscellaneous expenses on the Statement of Operations. During the period, the Fund did not borrow on this line of credit.
7. Security Lending.
The Fund lends portfolio securities through a lending agent from time to time in order to earn additional income. On the settlement date of the loan, the Fund receives collateral (in the form of U.S. Treasury obligations, letters of credit and/or cash) against the loaned securities and maintains collateral in an amount not less than 100% of the market value of the loaned securities during the period of the loan. The market value of the loaned securities is determined at the close of business of the Fund and any additional required collateral is delivered to the Fund on the next business day. The Fund or borrower may terminate the loan at any time, and if the borrower defaults on its obligation to return the securities loaned because of insolvency or other reasons, the Fund may apply collateral received from the borrower against the obligation. The Fund may experience delays and costs in recovering the securities loaned. Any cash collateral received is invested in the Fidelity Securities Lending Cash Central Fund. The value of loaned securities and cash collateral at period end are disclosed on the Fund's Statement of Assets and Liabilities. Security lending income represents the income earned on investing cash collateral, less rebates paid to borrowers and any lending agent fees associated with the loan, plus any premium payments received for lending certain types of securities. Security lending income is presented in the Statement of Operations as a component of income from Fidelity Central Funds.
8. Bank Borrowings.
The Fund is permitted to have bank borrowings for temporary or emergency purposes to fund shareholder redemptions or for other short-term liquidity requirements. The Fund has established borrowing arrangements with certain banks. The interest rate on the borrowings is the bank's base rate, as revised from time to time. The average loan balance during the period for which loans were outstanding amounted to $2,511,333. The weighted average interest rate was 1.92%. The interest expense amounted to $402 under the bank borrowing program. At period end, there were no bank borrowings outstanding.
9. Expense Reductions.
Commissions paid to certain brokers with whom the investment adviser, or its affiliates, places trades on behalf of the Fund include an amount in addition to trade execution, which may be rebated back to the Fund to offset certain expenses. This amount totaled $148,330 for the period. Through arrangements with the Fund's custodian, credits realized as a result of certain uninvested cash balances were used to reduce the Fund's expenses.
In addition, during the period the investment adviser reimbursed and/or waived a portion of fund-level operating expenses in the amount of $25,015.
10. Distributions to Shareholders.
Distributions to shareholders of each class were as follows:
| | Year ended
February 28, 2018 | Year ended
February 28, 2017 |
| From net investment income | | |
| Class A | $5,661,958 | $7,577,410 |
| Class M | 1,157,943 | 1,043,893 |
| Class C | 2,342,161 | 2,453,649 |
| Consumer Staples | 28,193,421 | 28,450,076 |
| Class I | 5,821,982 | 4,802,129 |
| Total | $43,177,465 | $44,327,157 |
| From net realized gain | | |
| Class A | $23,291,142 | $14,585,099 |
| Class M | 5,598,245 | 2,440,856 |
| Class B | – | 38,559 |
| Class C | 18,434,923 | 8,724,413 |
| Consumer Staples | 96,942,698 | 48,589,839 |
| Class I | 20,795,979 | 7,760,813 |
| Total | $165,062,987 | $82,139,579 |
11. Share Transactions.
Share transactions for each class were as follows and may contain automatic conversions between classes or exchanges between affiliated funds:
| | Shares | Shares | Dollars | Dollars |
| | Year ended February 28, 2018 | Year ended February 28, 2017 | Year ended February 28, 2018 | Year ended February 28, 2017 |
| Class A | | | | |
| Shares sold | 878,413 | 2,074,631 | $84,134,789 | $195,949,659 |
| Reinvestment of distributions | 304,910 | 237,892 | 28,169,668 | 21,465,950 |
| Shares redeemed | (2,965,599) | (2,123,267) | (284,396,390) | (197,828,865) |
| Net increase (decrease) | (1,782,276) | 189,256 | $(172,091,933) | $19,586,744 |
| Class M | | | | |
| Shares sold | 105,204 | 258,361 | $10,021,877 | $24,169,768 |
| Reinvestment of distributions | 73,231 | 37,389 | 6,708,282 | 3,349,216 |
| Shares redeemed | (233,572) | (212,844) | (22,022,226) | (19,792,973) |
| Net increase (decrease) | (55,137) | 82,906 | $(5,292,067) | $7,726,011 |
| Class B | | | | |
| Shares sold | – | 1,629 | $– | $151,958 |
| Reinvestment of distributions | – | 379 | – | 35,399 |
| Shares redeemed | – | (78,913) | – | (7,397,851) |
| Net increase (decrease) | – | (76,905) | $– | $(7,210,494) |
| Class C | | | | |
| Shares sold | 324,616 | 1,245,446 | $30,510,004 | $115,155,143 |
| Reinvestment of distributions | 218,231 | 115,157 | 19,684,994 | 10,152,865 |
| Shares redeemed | (1,129,562) | (931,585) | (104,331,925) | (84,513,838) |
| Net increase (decrease) | (586,715) | 429,018 | $(54,136,927) | $40,794,170 |
| Consumer Staples | | | | |
| Shares sold | 1,946,234 | 4,086,473 | $188,435,249 | $389,479,615 |
| Reinvestment of distributions | 1,262,390 | 801,941 | 117,653,205 | 73,103,322 |
| Shares redeemed | (5,253,889) | (10,263,589)(a) | (504,239,846) | (963,924,332)(a) |
| Net increase (decrease) | (2,045,265) | (5,375,175) | $(198,151,392) | $(501,341,395) |
| Class I | | | | |
| Shares sold | 2,545,385 | 2,282,645 | $246,802,163 | $217,344,361 |
| Reinvestment of distributions | 261,308 | 121,641 | 24,362,082 | 11,031,386 |
| Shares redeemed | (2,909,251) | (1,957,632) | (279,038,053) | (183,001,020) |
| Net increase (decrease) | (102,558) | 446,654 | $(7,873,808) | $45,374,727 |
(a) Amount includes in-kind redemptions (see the Prior Fiscal Year Redemptions In-Kind note for additional details).
12. Other.
The Fund's organizational documents provide former and current trustees and officers with a limited indemnification against liabilities arising in connection with the performance of their duties to the Fund. In the normal course of business, the Fund may also enter into contracts that provide general indemnifications. The Fund's maximum exposure under these arrangements is unknown as this would be dependent on future claims that may be made against the Fund. The risk of material loss from such claims is considered remote.
Fidelity Advisor® Gold Fund
Performance: The Bottom Line
Average annual total return reflects the change in the value of an investment, assuming reinvestment of distributions from dividend income and capital gains (the profits earned upon the sale of securities that have grown in value, if any) and assuming a constant rate of performance each year. The hypothetical investment and the average annual total returns do not reflect the deduction of taxes that a shareholder would pay on fund distributions or the redemption of fund shares. During periods of reimbursement by Fidelity, a fund’s total return will be greater than it would be had the reimbursement not occurred. How a fund did yesterday is no guarantee of how it will do tomorrow.
Average Annual Total Returns
| For the periods ended February 28, 2018 | Past 1 year | Past 5 years | Past 10 years |
| Class A (incl. 5.75% sales charge) | (15.90)% | (10.00)% | (7.63)% |
| Class M (incl. 3.50% sales charge) | (14.15)% | (9.85)% | (7.67)% |
| Class C (incl. contingent deferred sales charge) | (12.24)% | (9.57)% | (7.75)% |
| Class I | (10.47)% | (8.63)% | (6.78)% |
Class C shares' contingent deferred sales charges included in the past one year, past five years and past ten years total return figures are 1%, 0% and 0%, respectively.
$10,000 Over 10 Years
Let's say hypothetically that $10,000 was invested in Fidelity Advisor® Gold Fund - Class A on February 29, 2008, and the current 5.75% sales charge was paid.
The chart shows how the value of your investment would have changed, and also shows how the S&P 500® Index performed over the same period.
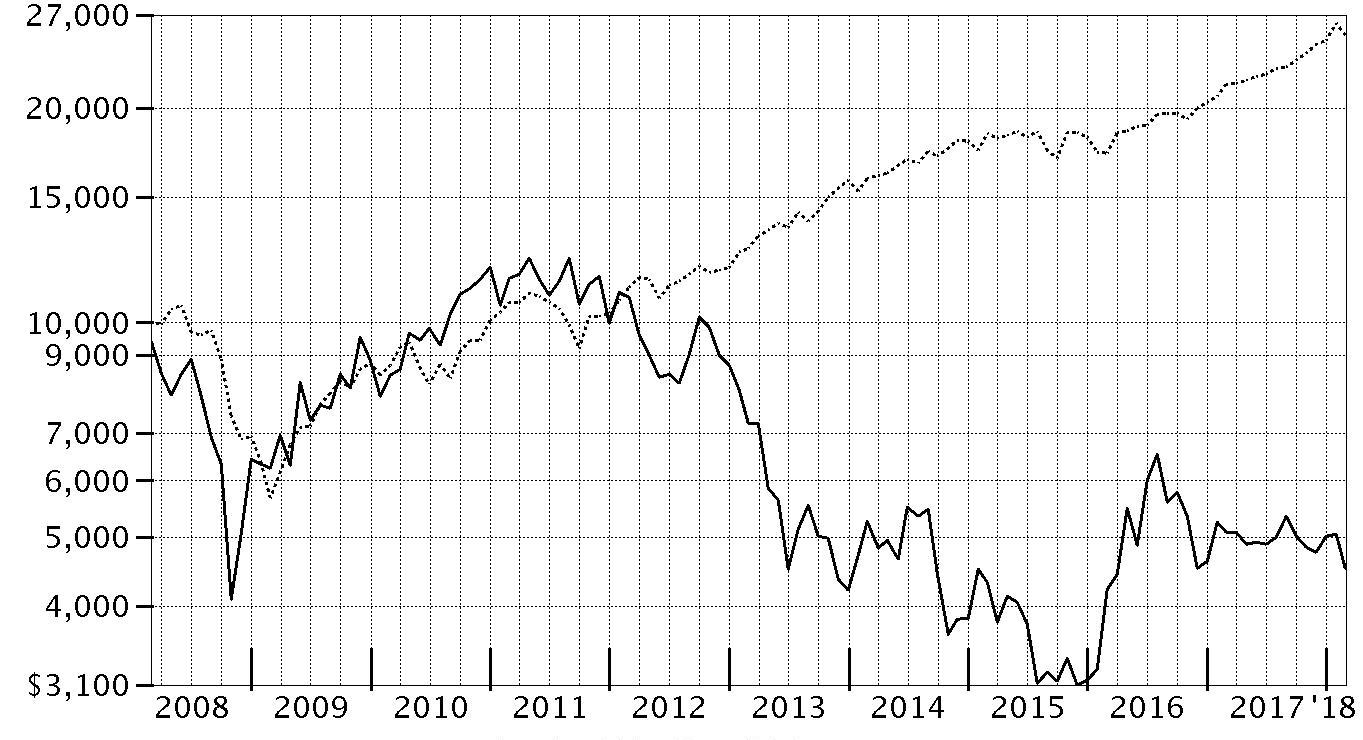
| Period Ending Values |
| $4,524 | Fidelity Advisor® Gold Fund - Class A |
| $25,307 | S&P 500® Index |
Fidelity Advisor® Gold Fund
Management's Discussion of Fund Performance
Market Recap: U.S. equities gained 17.10% for the 12 months ending February 28, 2018, as the S&P 500
® index moved steadily higher throughout 2017 and into 2018 until sharply reversing course in February. The drop was in stark contrast to the low volatility seen throughout 2017, along with consumer sentiment and other market indicators that stayed positive. Investors remained decidedly upbeat as the calendar turned, and the index rose 5.73% in January. February was a decidedly different story, though, as volatility spiked amid fear that rising inflation and the potential for the economy to overheat would prompt the U.S. Federal Reserve to pick up the pace of interest rate hikes. The index returned -3.69% for the month, its first negative result since October 2016. For the full 12 months, growth stocks handily topped value, while large-caps bested small-caps. By sector, information technology fared best by far, gaining 36% amid strong earnings growth from several major index constituents. Consumer discretionary (+22%) also stood out, driven by retailers. Financials added 20%, riding the uptick in bond yields. Materials and industrials rose about 16% each, boosted by higher demand, especially from China. Conversely, notable laggards included the defensive telecommunication services (-5%) and utilities (-2%) sectors, while rising rates held back real estate (-3%).
Comments from Portfolio Manager S. Joseph Wickwire II, CFA: For the fiscal year, the fund's share classes (excluding sales charges, if applicable) returned roughly -10% to -11%, trailing the combined -7.04% return of the S&P
® Global BMI Gold Capped Index for the first month of the period and the S&P
® Global BMI Gold Capped 20/45 Linked Index for the past 11 months. The fund also lagged the 17.10% gain of the broad market S&P 500
® index. Although the price of gold bullion rose more than 5% this period, gold stocks – which conceptually are viewed by many investors as a financial asset insurance policy and outperform when stocks, bonds and currencies decline –by and large were met with skepticism amid the strong equity-market rally. The fund was positioned for a more favorable gold market, represented by its emphasis on stocks with a higher beta due to positive fundamental factors, including macroeconomic imbalances, geopolitical tension and a favorable supply-and-demand profile. This positioning generally detracted from performance versus the S&P gold index because investors lacked conviction in the gold asset class, which caused lower-beta gold stocks to outperform higher-beta stocks. Among individual stocks, the biggest relative detractor was an overweighting in Torex Gold Resources, as its mining assets in Mexico suffered from local problems that hindered development. In addition, the fund's foreign holdings detracted overall, despite the tailwind from a broadly weaker U.S. dollar. Conversely, among the largest relative contributors were underweightings in poor-performers Barrick Gold and Canada's Goldcorp.
The views expressed above reflect those of the portfolio manager(s) only through the end of the period as stated on the cover of this report and do not necessarily represent the views of Fidelity or any other person in the Fidelity organization. Any such views are subject to change at any time based upon market or other conditions and Fidelity disclaims any responsibility to update such views. These views may not be relied on as investment advice and, because investment decisions for a Fidelity fund are based on numerous factors, may not be relied on as an indication of trading intent on behalf of any Fidelity fund.
Notes to Shareholders: On April 1, 2017, the fund’s industry benchmark changed from the S&P
® Global BMI Gold Capped Index (a custom index developed for Fidelity) to the S&P
® Global BMI Gold Capped 20/45 Linked Index (a public benchmark that became available more recently). Due to new international benchmark guidelines, S&P
® Dow Jones
® Indices stopped offering its brand on custom benchmarks, effective March 31, 2017. Fidelity believes that the new S&P
® index will continue to provide shareholders with meaningful performance comparisons. On December 8, 2017, shareholders approved proposals from the Board of Trustees to eliminate each sector/industry fund's fundamental “invests primarily” policy and to modify the fundamental concentration policy for certain funds. The changes took effect on January 1, 2018, and do not impact how the funds are managed.
Gold Portfolio
Consolidated Investment Summary (Unaudited)
The information in the following tables is based on the consolidated investments of the Fund.
Top Ten Holdings as of February 28, 2018
| | % of fund's net assets |
| Newmont Mining Corp. | 9.4 |
| Randgold Resources Ltd. sponsored ADR | 6.9 |
| B2Gold Corp. | 6.8 |
| Silver Bullion | 5.8 |
| Barrick Gold Corp. | 5.5 |
| Agnico Eagle Mines Ltd. (Canada) | 5.5 |
| Franco-Nevada Corp. | 4.6 |
| Premier Gold Mines Ltd. | 3.3 |
| Goldcorp, Inc. | 3.2 |
| Newcrest Mining Ltd. | 3.0 |
| | 54.0 |
Top Industries (% of fund's net assets)
| As of February 28, 2018 |
| | Gold | 89.2% |
| | Commodities & Related Investments* | 6.9% |
| | Silver | 1.4% |
| | Diversified Metals & Mining | 0.9% |
| | Copper | 0.6% |
| | Precious Metals & Minerals | 0.4% |
| | All Others** | 0.6% |

* Includes gold bullion and/or silver bullion.
** Includes Short-Term investments and Net Other Assets (Liabilities).
Geographic Diversification (% of fund's net assets)
| As of February 28, 2018 |
| | Canada | 59.8% |
| | United States of America* | 19.8% |
| | Bailiwick of Jersey | 6.9% |
| | South Africa | 4.7% |
| | Australia | 4.6% |
| | Cayman Islands | 1.8% |
| | Peru | 1.7% |
| | United Kingdom | 0.5% |
| | China | 0.2% |

* Includes Short-Term investments and Net Other Assets (Liabilities).
Percentages are based on country or territory of incorporation and are adjusted for the effect of futures contracts, if applicable.
Gold Portfolio
Consolidated Schedule of Investments February 28, 2018
Showing Percentage of Net Assets
| Common Stocks - 92.5% | | | |
| | | Shares | Value |
| Australia - 4.6% | | | |
| Metals & Mining - 4.6% | | | |
| Gold - 4.6% | | | |
| Dacian Gold Ltd. (a) | | 72,596 | $147,626 |
| Evolution Mining Ltd. | | 1,766,243 | 3,913,579 |
| Gold Road Resources Ltd. (a) | | 1,080,000 | 668,227 |
| Newcrest Mining Ltd. | | 2,284,162 | 37,484,437 |
| Northern Star Resources Ltd. | | 543,118 | 2,636,760 |
| Perseus Mining Ltd.: | | | |
| (Australia) (a) | | 1,717,134 | 527,507 |
| (Canada) (a) | | 1,300,000 | 395,106 |
| Resolute Mng Ltd. | | 4,701,949 | 4,044,000 |
| Saracen Mineral Holdings Ltd. (a) | | 3,087,787 | 3,866,216 |
| Silver Lake Resources Ltd. (a) | | 2,840,985 | 769,899 |
| St Barbara Ltd. | | 832,257 | 2,639,728 |
| | | | 57,093,085 |
| Bailiwick of Jersey - 6.9% | | | |
| Metals & Mining - 6.9% | | | |
| Gold - 6.9% | | | |
| Randgold Resources Ltd. sponsored ADR | | 1,062,895 | 86,115,753 |
| Canada - 59.8% | | | |
| Metals & Mining - 59.8% | | | |
| Copper - 0.5% | | | |
| First Quantum Minerals Ltd. | | 356,300 | 5,805,980 |
| Lundin Mining Corp. | | 20,000 | 130,143 |
| | | | 5,936,123 |
| Diversified Metals & Mining - 0.9% | | | |
| Arizona Mining, Inc. (a) | | 1,195,122 | 3,781,324 |
| Ivanhoe Mines Ltd. (a) | | 3,070,000 | 7,727,634 |
| Sabina Gold & Silver Corp. (a) | | 65,500 | 89,327 |
| | | | 11,598,285 |
| Gold - 56.7% | | | |
| Agnico Eagle Mines Ltd. (Canada) | | 1,798,101 | 68,507,760 |
| Alacer Gold Corp. (a) | | 2,604,063 | 4,099,289 |
| Alamos Gold, Inc. | | 4,795,512 | 24,366,224 |
| Argonaut Gold, Inc. (a) | | 5,931,462 | 11,001,309 |
| B2Gold Corp. (a) | | 28,645,793 | 85,053,360 |
| Barrick Gold Corp. | | 5,988,569 | 68,976,816 |
| Belo Sun Mining Corp. (a) | | 40,800 | 10,810 |
| Centerra Gold, Inc. (a) | | 457,500 | 2,395,885 |
| Continental Gold, Inc. (a)(b) | | 9,561,700 | 28,390,023 |
| Detour Gold Corp. (a) | | 2,665,600 | 24,304,489 |
| Detour Gold Corp. (a)(c) | | 785,900 | 7,165,703 |
| Eldorado Gold Corp. | | 8,480,935 | 9,120,706 |
| First Mining Finance Corp. (a) | | 170,000 | 61,604 |
| Franco-Nevada Corp. | | 816,900 | 57,244,115 |
| Gold Standard Ventures Corp. (a) | | 3,114,300 | 5,096,657 |
| Goldcorp, Inc. | | 3,212,100 | 40,201,314 |
| Guyana Goldfields, Inc. (a) | | 4,785,800 | 18,573,320 |
| Guyana Goldfields, Inc. (a)(c) | | 155,000 | 601,543 |
| IAMGOLD Corp. (a) | | 1,614,000 | 8,490,103 |
| Kinross Gold Corp. (a) | | 4,549,391 | 16,344,056 |
| Kirkland Lake Gold Ltd. | | 668,119 | 10,486,219 |
| Klondex Mines Ltd. (a) | | 1,834,478 | 2,544,709 |
| Liberty Gold Corp. (a) | | 1,418,150 | 436,541 |
| Lundin Gold, Inc. (a) | | 13,800 | 54,310 |
| New Gold, Inc. (a) | | 5,696,375 | 14,338,600 |
| Novagold Resources, Inc. (a) | | 2,014,500 | 8,006,507 |
| OceanaGold Corp. | | 9,871,932 | 26,310,791 |
| Osisko Gold Royalties Ltd. | | 1,220,293 | 11,830,147 |
| Premier Gold Mines Ltd. (a)(b) | | 16,645,522 | 40,731,717 |
| Pretium Resources, Inc. (a) | | 1,802,683 | 11,533,687 |
| Pretium Resources, Inc. (a)(c) | | 225,000 | 1,439,565 |
| Rubicon Minerals Corp. (a) | | 1,000 | 974 |
| Sandstorm Gold Ltd. (a) | | 1,855,475 | 8,516,792 |
| Seabridge Gold, Inc. (a) | | 1,449,090 | 15,432,809 |
| SEMAFO, Inc. (a) | | 7,590,000 | 20,228,959 |
| Ssr Mining, Inc. (a) | | 1,338,700 | 11,111,210 |
| Tahoe Resources, Inc. | | 3,099,438 | 15,168,696 |
| Teranga Gold Corp. (a) | | 1,220,814 | 3,510,601 |
| Torex Gold Resources, Inc. (a) | | 2,697,600 | 21,022,444 |
| Wesdome Gold Mines, Inc. (a) | | 140,000 | 204,021 |
| Yamana Gold, Inc. | | 1,190,620 | 3,460,889 |
| | | | 706,375,274 |
| Precious Metals & Minerals - 0.3% | | | |
| Dalradian Resources, Inc. (a) | | 784,500 | 666,385 |
| Osisko Mining, Inc. (a) | | 1,464,800 | 3,082,107 |
| | | | 3,748,492 |
| Silver - 1.4% | | | |
| MAG Silver Corp. (a) | | 584,500 | 6,112,835 |
| Pan American Silver Corp. | | 19,300 | 292,202 |
| Wheaton Precious Metals Corp. | | 611,800 | 11,676,264 |
| | | | 18,081,301 |
| TOTAL METALS & MINING | | | 745,739,475 |
| Cayman Islands - 1.8% | | | |
| Metals & Mining - 1.8% | | | |
| Gold - 1.8% | | | |
| Endeavour Mining Corp. (a) | | 1,200,040 | 22,631,677 |
| China - 0.2% | | | |
| Metals & Mining - 0.2% | | | |
| Gold - 0.2% | | | |
| Zijin Mng Group Co. Ltd. (H Shares) | | 4,947,000 | 2,256,024 |
| Peru - 1.7% | | | |
| Metals & Mining - 1.7% | | | |
| Gold - 1.7% | | | |
| Compania de Minas Buenaventura SA sponsored ADR | | 1,403,397 | 21,822,823 |
| South Africa - 4.7% | | | |
| Metals & Mining - 4.7% | | | |
| Gold - 4.7% | | | |
| AngloGold Ashanti Ltd. sponsored ADR | | 3,580,808 | 33,444,747 |
| Gold Fields Ltd. sponsored ADR | | 3,299,426 | 12,933,750 |
| Harmony Gold Mining Co. Ltd. | | 1,484,000 | 2,979,005 |
| Harmony Gold Mining Co. Ltd. sponsored ADR | | 1,460,400 | 3,037,632 |
| Sibanye-Stillwater ADR | | 1,448,712 | 5,635,490 |
| | | | 58,030,624 |
| United Kingdom - 0.5% | | | |
| Metals & Mining - 0.5% | | | |
| Gold - 0.4% | | | |
| Acacia Mining PLC | | 1,896,536 | 3,665,031 |
| Pan African Resources PLC | | 550,000 | 53,065 |
| Solgold PLC (a) | | 4,152,758 | 1,294,137 |
| | | | 5,012,233 |
| Precious Metals & Minerals - 0.1% | | | |
| Fresnillo PLC | | 36,000 | 601,474 |
| TOTAL METALS & MINING | | | 5,613,707 |
| United States of America - 12.3% | | | |
| Metals & Mining - 12.3% | | | |
| Copper - 0.1% | | | |
| Freeport-McMoRan, Inc. (a) | | 71,200 | 1,324,320 |
| Gold - 12.2% | | | |
| McEwen Mining, Inc. | | 1,096,410 | 2,138,000 |
| Newmont Mining Corp. | | 3,065,078 | 117,085,980 |
| Royal Gold, Inc. | | 408,867 | 33,024,188 |
| | | | 152,248,168 |
| TOTAL METALS & MINING | | | 153,572,488 |
| TOTAL COMMON STOCKS | | | |
| (Cost $1,203,012,880) | | | 1,152,875,656 |
| | | Troy Ounces | |
|
| Commodities - 6.9% | | | |
| Gold Bullion (a) | | 10,510 | 13,852,180 |
| Silver Bullion (a) | | 4,372,000 | 71,692,056 |
| TOTAL COMMODITIES | | | |
| (Cost $84,177,257) | | | 85,544,236 |
| | | Shares | |
|
| Money Market Funds - 0.6% | | | |
| Fidelity Cash Central Fund, 1.41% (d) | | 7,877,259 | 7,878,834 |
| Fidelity Securities Lending Cash Central Fund 1.42% (d)(e) | | 44,597 | 44,601 |
| TOTAL MONEY MARKET FUNDS | | | |
| (Cost $7,923,431) | | | 7,923,435 |
| TOTAL INVESTMENT IN SECURITIES - 100.0% | | | |
| (Cost $1,295,113,568) | | | 1,246,343,327 |
| NET OTHER ASSETS (LIABILITIES) - 0.0% | | | 528,155 |
| NET ASSETS - 100% | | | $1,246,871,482 |
Legend
(a) Non-income producing
(b) Affiliated company
(c) Security exempt from registration under Rule 144A of the Securities Act of 1933. These securities may be resold in transactions exempt from registration, normally to qualified institutional buyers. At the end of the period, the value of these securities amounted to $9,206,811 or 0.7% of net assets.
(d) Affiliated fund that is generally available only to investment companies and other accounts managed by Fidelity Investments. The rate quoted is the annualized seven-day yield of the fund at period end. A complete unaudited listing of the fund's holdings as of its most recent quarter end is available upon request. In addition, each Fidelity Central Fund's financial statements, which are not covered by the Fund's Report of Independent Registered Public Accounting Firm, are available on the SEC's website or upon request.
(e) Investment made with cash collateral received from securities on loan.
Affiliated Central Funds
Information regarding fiscal year to date income earned by the Fund from investments in Fidelity Central Funds is as follows:
| Fund | Income earned |
| Fidelity Cash Central Fund | $71,353 |
| Fidelity Securities Lending Cash Central Fund | 30,724 |
| Total | $102,077 |
Amounts in the income column in the above table include any capital gain distributions from underlying funds, which are presented in the corresponding line-item in the Consolidated Statement of Operations if applicable.
Consolidated Subsidiary
| Affiliate | Value, beginning of period | Purchases | Sales Proceeds | Dividend Income | Realized Gain (loss) | Change in Unrealized appreciation (depreciation) | Value, end of period |
| Fidelity Select Cayman Gold Ltd. | $87,787,763 | $17,930,933 | $13,452,900 | $ -- | $(342,822) | $(6,445,854) | $85,477,120 |
Other Affiliated Issuers
An affiliated company is a company in which the Fund has ownership of at least 5% of the voting securities. Fiscal year to date transactions with companies which are or were affiliates are as follows:
| Affiliate | Value, beginning of period | Purchases | Sales Proceeds | Dividend Income | Realized Gain (loss) | Change in Unrealized appreciation (depreciation) | Value, end of period |
| Continental Gold, Inc. | $26,033,941 | $4,588,834 | $-- | $-- | $-- | $(2,232,752) | $28,390,023 |
| Premier Gold Mines Ltd. | 29,885,078 | 2,666,090 | 72,855 | -- | (70,838) | 8,324,242 | 40,731,717 |
| Total | $55,919,019 | $7,254,924 | $72,855 | $-- | $(70,838) | $6,091,490 | $69,121,740 |
Investment Valuation
The following is a summary of the inputs used, as of February 28, 2018, involving the Fund's assets and liabilities carried at fair value. The inputs or methodology used for valuing securities may not be an indication of the risk associated with investing in those securities. For more information on valuation inputs, and their aggregation into the levels used below, please refer to the Investment Valuation section in the accompanying Notes to Consolidated Financial Statements.
| | Valuation Inputs at Reporting Date: |
| Description | Total | Level 1 | Level 2 | Level 3 |
| Investments in Securities: | | | | |
| Common Stocks | $1,152,875,656 | $1,085,328,941 | $67,546,715 | $-- |
| Commodities | 85,544,236 | 85,544,236 | -- | -- |
| Money Market Funds | 7,923,435 | 7,923,435 | -- | -- |
| Total Investments in Securities: | $1,246,343,327 | $1,178,796,612 | $67,546,715 | $-- |
The following is a summary of transfers between Level 1 and Level 2 for the period ended February 28, 2018. Transfers are assumed to have occurred at the beginning of the period, and are primarily attributable to the valuation techniques used for foreign equity securities, as discussed in the accompanying Notes to Consolidated Financial Statements:
| Transfers | Total |
| Level 1 to Level 2 | $128,252,118 |
| Level 2 to Level 1 | $0 |
See accompanying notes which are an integral part of the consolidated financial statements.
Gold Portfolio
Consolidated Financial Statements
Consolidated Statement of Assets and Liabilities
| | | February 28, 2018 |
| Assets | | |
Investment in securities, at value — See accompanying schedule:
Unaffiliated issuers (cost $1,126,825,246) | $1,083,753,916 | |
| Fidelity Central Funds (cost $7,923,431) | 7,923,435 | |
| Commodities (cost $84,177,257) | 85,544,236 | |
| Other affiliated issuers (cost $76,187,634) | 69,121,740 | |
| Total Investment in Securities (cost $1,295,113,568) | | $1,246,343,327 |
| Cash | | 22,174 |
| Foreign currency held at value (cost $118,637) | | 118,027 |
| Receivable for fund shares sold | | 2,909,206 |
| Dividends receivable | | 401,265 |
| Distributions receivable from Fidelity Central Funds | | 7,207 |
| Prepaid expenses | | 4,742 |
| Other receivables | | 109,275 |
| Total assets | | 1,249,915,223 |
| Liabilities | | |
| Payable for fund shares redeemed | $1,711,639 | |
| Accrued management fee | 585,359 | |
| Transfer agent fee payable | 243,128 | |
| Distribution and service plan fees payable | 103,210 | |
| Other affiliated payables | 49,286 | |
| Other payables and accrued expenses | 306,441 | |
| Collateral on securities loaned | 44,678 | |
| Total liabilities | | 3,043,741 |
| Net Assets | | $1,246,871,482 |
| Net Assets consist of: | | |
| Paid in capital | | $2,676,918,722 |
| Accumulated net investment loss | | (6,965,927) |
| Accumulated undistributed net realized gain (loss) on investments and foreign currency transactions | | (1,374,310,048) |
| Net unrealized appreciation (depreciation) on investments and assets and liabilities in foreign currencies | | (48,771,265) |
| Net Assets | | $1,246,871,482 |
| Calculation of Maximum Offering Price | | |
| Class A: | | |
| Net Asset Value and redemption price per share ($61,703,022 ÷ 3,371,731 shares) | | $18.30 |
| Maximum offering price per share (100/94.25 of $18.30) | | $19.42 |
| Class M: | | |
| Net Asset Value and redemption price per share ($19,354,931 ÷ 1,078,619 shares) | | $17.94 |
| Maximum offering price per share (100/96.50 of $17.94) | | $18.59 |
| Class C: | | |
| Net Asset Value and offering price per share ($92,724,331 ÷ 5,407,975 shares)(a) | | $17.15 |
| Gold: | | |
| Net Asset Value, offering price and redemption price per share ($1,011,412,484 ÷ 53,861,287 shares) | | $18.78 |
| Class I: | | |
| Net Asset Value, offering price and redemption price per share ($61,676,714 ÷ 3,284,926 shares) | | $18.78 |
(a) Redemption price per share is equal to net asset value less any applicable contingent deferred sales charge.
See accompanying notes which are an integral part of the consolidated financial statements.
Consolidated Statement of Operations
| | | Year ended February 28, 2018 |
| Investment Income | | |
| Dividends | | $9,065,413 |
| Income from Fidelity Central Funds | | 102,077 |
| Income before foreign taxes withheld | | 9,167,490 |
| Less foreign taxes withheld | | (770,759) |
| Total income | | 8,396,731 |
| Expenses | | |
| Management fee | $8,057,489 | |
| Transfer agent fees | 3,166,111 | |
| Distribution and service plan fees | 1,323,699 | |
| Accounting and security lending fees | 648,333 | |
| Custodian fees and expenses | 285,314 | |
| Independent trustees' fees and expenses | 31,871 | |
| Registration fees | 127,041 | |
| Audit | 69,707 | |
| Legal | 18,937 | |
| Miscellaneous | 90,618 | |
| Total expenses before reductions | 13,819,120 | |
| Expense reductions | (286,035) | 13,533,085 |
| Net investment income (loss) | | (5,136,354) |
| Realized and Unrealized Gain (Loss) | | |
| Net realized gain (loss) on: | | |
| Investments: | | |
| Unaffiliated issuers | (19,779,519) | |
| Fidelity Central Funds | (81) | |
| Other affiliated issuers | (70,838) | |
| Commodities | 48,173 | |
| Foreign currency transactions | 4,306 | |
| Total net realized gain (loss) | | (19,797,959) |
| Change in net unrealized appreciation (depreciation) on: | | |
| Investments: | | |
| Investments | (128,347,231) | |
| Fidelity Central Funds | (8) | |
| Other affiliated issuers | 6,091,490 | |
| Assets and liabilities in foreign currencies | 408 | |
| Commodities | (6,394,763) | |
| Total change in net unrealized appreciation (depreciation) | | (128,650,104) |
| Net gain (loss) | | (148,448,063) |
| Net increase (decrease) in net assets resulting from operations | | $(153,584,417) |
See accompanying notes which are an integral part of the consolidated financial statements.
Consolidated Statement of Changes in Net Assets
| | Year ended February 28, 2018 | Year ended February 28, 2017 |
| Increase (Decrease) in Net Assets | | |
| Operations | | |
| Net investment income (loss) | $(5,136,354) | $(8,049,958) |
| Net realized gain (loss) | (19,797,959) | (56,558,933) |
| Change in net unrealized appreciation (depreciation) | (128,650,104) | 282,432,875 |
| Net increase (decrease) in net assets resulting from operations | (153,584,417) | 217,823,984 |
| Distributions to shareholders from net realized gain | (3,130,282) | (47,051,891) |
| Share transactions - net increase (decrease) | (136,518,156) | 114,767,885 |
| Redemption fees | – | 402,160 |
| Total increase (decrease) in net assets | (293,232,855) | 285,942,138 |
| Net Assets | | |
| Beginning of period | 1,540,104,337 | 1,254,162,199 |
| End of period | $1,246,871,482 | $1,540,104,337 |
| Other Information | | |
| Accumulated net investment loss end of period | $(6,965,927) | $(49,672) |
See accompanying notes which are an integral part of the consolidated financial statements.
Consolidated Financial Highlights
Gold Portfolio Class A
| Years ended February 28, | 2018 | 2017 | 2016A | 2015 | 2014 |
| Selected Per–Share Data | | | | | |
| Net asset value, beginning of period | $20.54 | $17.70 | $18.11 | $22.01 | $30.25 |
| Income from Investment Operations | | | | | |
| Net investment income (loss)B | (.12) | (.16) | (.06) | (.10) | –C |
| Net realized and unrealized gain (loss) | (2.09) | 3.59 | (.35) | (3.80) | (8.25) |
| Total from investment operations | (2.21) | 3.43 | (.41) | (3.90) | (8.25) |
| Distributions from net realized gain | (.03) | (.60) | – | – | – |
| Total distributions | (.03) | (.60) | – | – | – |
| Redemption fees added to paid in capitalB | – | .01 | –C | –C | .01 |
| Net asset value, end of period | $18.30 | $20.54 | $17.70 | $18.11 | $22.01 |
| Total ReturnD,E | (10.77)% | 19.97% | (2.26)% | (17.72)% | (27.24)% |
| Ratios to Average Net AssetsF,G | | | | | |
| Expenses before reductions | 1.18% | 1.19% | 1.23% | 1.23% | 1.21% |
| Expenses net of fee waivers, if any | 1.16% | 1.16% | 1.20% | 1.19% | 1.19% |
| Expenses net of all reductions | 1.16% | 1.16% | 1.20% | 1.19% | 1.18% |
| Net investment income (loss) | (.58)% | (.71)% | (.44)% | (.51)% | - %H |
| Supplemental Data | | | | | |
| Net assets, end of period (000 omitted) | $61,703 | $83,589 | $53,509 | $46,898 | $60,270 |
| Portfolio turnover rateI | 13% | 28% | 20% | 20% | 56% |
A For the year ended February 29.
B Calculated based on average shares outstanding during the period.
C Amount represents less than $.005 per share.
D Total returns would have been lower if certain expenses had not been reduced during the applicable periods shown.
E Total returns do not include the effect of the sales charges.
F Fees and expenses of any underlying Fidelity Central Funds are not included in the Fund's expense ratio. The Fund indirectly bears its proportionate share of the expenses of any underlying Fidelity Central Funds.
G Expense ratios reflect operating expenses of the class. Expenses before reductions do not reflect amounts reimbursed by the investment adviser or reductions from brokerage service arrangements or reductions from other expense offset arrangements and do not represent the amount paid by the class during periods when reimbursements or reductions occur. Expenses net of fee waivers reflect expenses after reimbursement by the investment adviser but prior to reductions from brokerage service arrangements or other expense offset arrangements. Expenses net of all reductions represent the net expenses paid by the class.
H Amount represents less than .005%.
I Amount does not include the portfolio activity of any underlying Fidelity Central Funds.
See accompanying notes which are an integral part of the consolidated financial statements.
Gold Portfolio Class M
| Years ended February 28, | 2018 | 2017 | 2016A | 2015 | 2014 |
| Selected Per–Share Data | | | | | |
| Net asset value, beginning of period | $20.19 | $17.37 | $17.83 | $21.73 | $29.95 |
| Income from Investment Operations | | | | | |
| Net investment income (loss)B | (.17) | (.22) | (.11) | (.15) | (.06) |
| Net realized and unrealized gain (loss) | (2.05) | 3.54 | (.35) | (3.75) | (8.17) |
| Total from investment operations | (2.22) | 3.32 | (.46) | (3.90) | (8.23) |
| Distributions from net realized gain | (.03) | (.51) | – | – | – |
| Total distributions | (.03) | (.51) | – | – | – |
| Redemption fees added to paid in capitalB | – | .01 | –C | –C | .01 |
| Net asset value, end of period | $17.94 | $20.19 | $17.37 | $17.83 | $21.73 |
| Total ReturnD,E | (11.04)% | 19.62% | (2.58)% | (17.95)% | (27.45)% |
| Ratios to Average Net AssetsF,G | | | | | |
| Expenses before reductions | 1.48% | 1.49% | 1.52% | 1.50% | 1.49% |
| Expenses net of fee waivers, if any | 1.47% | 1.46% | 1.48% | 1.46% | 1.47% |
| Expenses net of all reductions | 1.47% | 1.46% | 1.48% | 1.46% | 1.46% |
| Net investment income (loss) | (.88)% | (1.01)% | (.72)% | (.79)% | (.28)% |
| Supplemental Data | | | | | |
| Net assets, end of period (000 omitted) | $19,355 | $25,170 | $17,720 | $16,200 | $18,402 |
| Portfolio turnover rateH | 13% | 28% | 20% | 20% | 56% |
A For the year ended February 29.
B Calculated based on average shares outstanding during the period.
C Amount represents less than $.005 per share.
D Total returns would have been lower if certain expenses had not been reduced during the applicable periods shown.
E Total returns do not include the effect of the sales charges.
F Fees and expenses of any underlying Fidelity Central Funds are not included in the Fund's expense ratio. The Fund indirectly bears its proportionate share of the expenses of any underlying Fidelity Central Funds.
G Expense ratios reflect operating expenses of the class. Expenses before reductions do not reflect amounts reimbursed by the investment adviser or reductions from brokerage service arrangements or reductions from other expense offset arrangements and do not represent the amount paid by the class during periods when reimbursements or reductions occur. Expenses net of fee waivers reflect expenses after reimbursement by the investment adviser but prior to reductions from brokerage service arrangements or other expense offset arrangements. Expenses net of all reductions represent the net expenses paid by the class.
H Amount does not include the portfolio activity of any underlying Fidelity Central Funds.
See accompanying notes which are an integral part of the consolidated financial statements.
Gold Portfolio Class C
| Years ended February 28, | 2018 | 2017 | 2016A | 2015 | 2014 |
| Selected Per–Share Data | | | | | |
| Net asset value, beginning of period | $19.36 | $16.68 | $17.20 | $21.06 | $29.15 |
| Income from Investment Operations | | | | | |
| Net investment income (loss)B | (.24) | (.29) | (.16) | (.23) | (.16) |
| Net realized and unrealized gain (loss) | (1.95) | 3.42 | (.36) | (3.63) | (7.94) |
| Total from investment operations | (2.19) | 3.13 | (.52) | (3.86) | (8.10) |
| Distributions from net realized gain | (.02) | (.45) | – | – | – |
| Total distributions | (.02) | (.45) | – | – | – |
| Redemption fees added to paid in capitalB | – | –C | –C | –C | .01 |
| Net asset value, end of period | $17.15 | $19.36 | $16.68 | $17.20 | $21.06 |
| Total ReturnD,E | (11.35)% | 19.19% | (3.02)% | (18.33)% | (27.75)% |
| Ratios to Average Net AssetsF,G | | | | | |
| Expenses before reductions | 1.85% | 1.88% | 1.97% | 1.96% | 1.96% |
| Expenses net of fee waivers, if any | 1.83% | 1.85% | 1.93% | 1.92% | 1.94% |
| Expenses net of all reductions | 1.83% | 1.84% | 1.93% | 1.92% | 1.93% |
| Net investment income (loss) | (1.25)% | (1.40)% | (1.17)% | (1.25)% | (.76)% |
| Supplemental Data | | | | | |
| Net assets, end of period (000 omitted) | $92,724 | $101,215 | $52,732 | $39,429 | $33,811 |
| Portfolio turnover rateH | 13% | 28% | 20% | 20% | 56% |
A For the year ended February 29.
B Calculated based on average shares outstanding during the period.
C Amount represents less than $.005 per share.
D Total returns would have been lower if certain expenses had not been reduced during the applicable periods shown.
E Total returns do not include the effect of the contingent deferred sales charge.
F Fees and expenses of any underlying Fidelity Central Funds are not included in the Fund's expense ratio. The Fund indirectly bears its proportionate share of the expenses of any underlying Fidelity Central Funds.
G Expense ratios reflect operating expenses of the class. Expenses before reductions do not reflect amounts reimbursed by the investment adviser or reductions from brokerage service arrangements or reductions from other expense offset arrangements and do not represent the amount paid by the class during periods when reimbursements or reductions occur. Expenses net of fee waivers reflect expenses after reimbursement by the investment adviser but prior to reductions from brokerage service arrangements or other expense offset arrangements. Expenses net of all reductions represent the net expenses paid by the class.
H Amount does not include the portfolio activity of any underlying Fidelity Central Funds.
See accompanying notes which are an integral part of the consolidated financial statements.
Gold Portfolio
| Years ended February 28, | 2018 | 2017 | 2016A | 2015 | 2014 |
| Selected Per–Share Data | | | | | |
| Net asset value, beginning of period | $21.02 | $18.12 | $18.50 | $22.41 | $30.72 |
| Income from Investment Operations | | | | | |
| Net investment income (loss)B | (.05) | (.09) | (.03) | (.04) | .06 |
| Net realized and unrealized gain (loss) | (2.14) | 3.66 | (.35) | (3.87) | (8.38) |
| Total from investment operations | (2.19) | 3.57 | (.38) | (3.91) | (8.32) |
| Distributions from net realized gain | (.05) | (.68) | – | – | – |
| Total distributions | (.05) | (.68) | – | – | – |
| Redemption fees added to paid in capitalB | – | .01 | –C | –C | .01 |
| Net asset value, end of period | $18.78 | $21.02 | $18.12 | $18.50 | $22.41 |
| Total ReturnD | (10.47)% | 20.38% | (2.05)% | (17.45)% | (27.05)% |
| Ratios to Average Net AssetsE,F | | | | | |
| Expenses before reductions | .86% | .87% | .97% | .94% | .94% |
| Expenses net of fee waivers, if any | .85% | .84% | .93% | .90% | .92% |
| Expenses net of all reductions | .84% | .84% | .93% | .90% | .91% |
| Net investment income (loss) | (.26)% | (.39)% | (.17)% | (.22)% | .27% |
| Supplemental Data | | | | | |
| Net assets, end of period (000 omitted) | $1,011,412 | $1,271,458 | $1,076,206 | $992,944 | $1,275,913 |
| Portfolio turnover rateG | 13% | 28% | 20% | 20% | 56% |
A For the year ended February 29.
B Calculated based on average shares outstanding during the period.
C Amount represents less than $.005 per share.
D Total returns would have been lower if certain expenses had not been reduced during the applicable periods shown.
E Fees and expenses of any underlying Fidelity Central Funds are not included in the Fund's expense ratio. The Fund indirectly bears its proportionate share of the expenses of any underlying Fidelity Central Funds.
F Expense ratios reflect operating expenses of the class. Expenses before reductions do not reflect amounts reimbursed by the investment adviser or reductions from brokerage service arrangements or reductions from other expense offset arrangements and do not represent the amount paid by the class during periods when reimbursements or reductions occur. Expenses net of fee waivers reflect expenses after reimbursement by the investment adviser but prior to reductions from brokerage service arrangements or other expense offset arrangements. Expenses net of all reductions represent the net expenses paid by the class.
G Amount does not include the portfolio activity of any underlying Fidelity Central Funds.
See accompanying notes which are an integral part of the consolidated financial statements.
Gold Portfolio Class I
| Years ended February 28, | 2018 | 2017 | 2016A | 2015 | 2014 |
| Selected Per–Share Data | | | | | |
| Net asset value, beginning of period | $21.02 | $18.13 | $18.50 | $22.41 | $30.69 |
| Income from Investment Operations | | | | | |
| Net investment income (loss)B | (.05) | (.09) | (.02) | (.04) | .07 |
| Net realized and unrealized gain (loss) | (2.14) | 3.67 | (.35) | (3.87) | (8.36) |
| Total from investment operations | (2.19) | 3.58 | (.37) | (3.91) | (8.29) |
| Distributions from net realized gain | (.05) | (.70) | – | – | – |
| Total distributions | (.05) | (.70) | – | – | – |
| Redemption fees added to paid in capitalB | – | .01 | –C | –C | .01 |
| Net asset value, end of period | $18.78 | $21.02 | $18.13 | $18.50 | $22.41 |
| Total ReturnD | (10.47)% | 20.41% | (2.00)% | (17.45)% | (26.98)% |
| Ratios to Average Net AssetsE,F | | | | | |
| Expenses before reductions | .85% | .87% | .92% | .90% | .87% |
| Expenses net of fee waivers, if any | .83% | .84% | .88% | .86% | .85% |
| Expenses net of all reductions | .83% | .84% | .88% | .86% | .84% |
| Net investment income (loss) | (.24)% | (.39)% | (.12)% | (.18)% | .34% |
| Supplemental Data | | | | | |
| Net assets, end of period (000 omitted) | $61,677 | $58,673 | $52,607 | $23,667 | $107,830 |
| Portfolio turnover rateG | 13% | 28% | 20% | 20% | 56% |
A For the year ended February 29.
B Calculated based on average shares outstanding during the period.
C Amount represents less than $.005 per share.
D Total returns would have been lower if certain expenses had not been reduced during the applicable periods shown.
E Fees and expenses of any underlying Fidelity Central Funds are not included in the Fund's expense ratio. The Fund indirectly bears its proportionate share of the expenses of any underlying Fidelity Central Funds.
F Expense ratios reflect operating expenses of the class. Expenses before reductions do not reflect amounts reimbursed by the investment adviser or reductions from brokerage service arrangements or reductions from other expense offset arrangements and do not represent the amount paid by the class during periods when reimbursements or reductions occur. Expenses net of fee waivers reflect expenses after reimbursement by the investment adviser but prior to reductions from brokerage service arrangements or other expense offset arrangements. Expenses net of all reductions represent the net expenses paid by the class.
G Amount does not include the portfolio activity of any underlying Fidelity Central Funds.
See accompanying notes which are an integral part of the consolidated financial statements.
Notes to Consolidated Financial Statements
For the period ended February 28, 2018
1. Organization.
Gold Portfolio (the Fund) is a non-diversified fund of Fidelity Select Portfolios (the Trust) and is authorized to issue an unlimited number of shares. The Trust is registered under the Investment Company Act of 1940, as amended (the 1940 Act), as an open-end management investment company organized as a Massachusetts business trust. The Fund invests primarily in securities of companies whose principal business activities fall within specific industries. The Fund offers Class A, Class M (formerly Class T), Class C, Gold and Class I shares, each of which has equal rights as to assets and voting privileges. Each class has exclusive voting rights with respect to matters that affect that class.
After the close of business on June 24, 2016, all outstanding Class B shares were converted to Class A shares. All prior fiscal period dollar and share amounts for Class B presented in the Notes to Consolidated Financial Statements are for the period March 1, 2016 through June 24, 2016.
2. Consolidated Subsidiary.
The Fund invests in certain commodity-related investments through Fidelity Select Gold Cayman Ltd, a wholly owned subsidiary (the "Subsidiary"). As of period end, the Fund held an investment of $85,477,120 in the Subsidiary, representing 6.9% of the Fund's net assets.
The financial statements have been consolidated and include accounts of the Fund and the Subsidiary. Accordingly, all inter-company transactions and balances have been eliminated.
3. Investments in Fidelity Central Funds.
The Fund invests in Fidelity Central Funds, which are open-end investment companies generally available only to other investment companies and accounts managed by the investment adviser and its affiliates. The Fund's Consolidated Schedule of Investments lists each of the Fidelity Central Funds held as of period end, if any, as an investment of the Fund, but does not include the underlying holdings of each Fidelity Central Fund. As an Investing Fund, the Fund indirectly bears its proportionate share of the expenses of the underlying Fidelity Central Funds.
The Money Market Central Funds seek preservation of capital and current income and are managed by Fidelity Investments Money Management, Inc. (FIMM), an affiliate of the investment adviser. Annualized expenses of the Money Market Central Funds as of their most recent shareholder report date are less than .005%.
A complete unaudited list of holdings for each Fidelity Central Fund is available upon request or at the Securities and Exchange Commission (the SEC) website at www.sec.gov. In addition, the financial statements of the Fidelity Central Funds, which are not covered by the Fund's Report of Independent Registered Public Accounting Firm, are available on the SEC website or upon request.
4. Significant Accounting Policies.
The Fund is an investment company and applies the accounting and reporting guidance of the Financial Accounting Standards Board (FASB) Accounting Standards Codification Topic 946 Financial Services – Investments Companies. The consolidated financial statements have been prepared in conformity with accounting principles generally accepted in the United States of America (GAAP), which require management to make certain estimates and assumptions at the date of the consolidated financial statements. Actual results could differ from those estimates. Subsequent events, if any, through the date that the consolidated financial statements were issued have been evaluated in the preparation of the consolidated financial statements. The following summarizes the significant accounting policies of the Fund:
Investment Valuation. Investments are valued as of 4:00 p.m. Eastern time on the last calendar day of the period. The Board of Trustees (the Board) has delegated the day to day responsibility for the valuation of the Fund's investments to the Fair Value Committee (the Committee) established by the Fund's investment adviser. In accordance with valuation policies and procedures approved by the Board, the Fund attempts to obtain prices from one or more third party pricing vendors or brokers to value its investments. When current market prices, quotations or currency exchange rates are not readily available or reliable, investments will be fair valued in good faith by the Committee, in accordance with procedures adopted by the Board. Factors used in determining fair value vary by investment type and may include market or investment specific events. The frequency with which these procedures are used cannot be predicted and they may be utilized to a significant extent. The Committee oversees the Fund's valuation policies and procedures and reports to the Board on the Committee's activities and fair value determinations. The Board monitors the appropriateness of the procedures used in valuing the Fund's investments and ratifies the fair value determinations of the Committee.
The Fund categorizes the inputs to valuation techniques used to value its investments into a disclosure hierarchy consisting of three levels as shown below:
- Level 1 – quoted prices in active markets for identical investments
- Level 2 – other significant observable inputs (including quoted prices for similar investments, interest rates, prepayment speeds, etc.)
- Level 3 – unobservable inputs (including the Fund's own assumptions based on the best information available)
Valuation techniques used to value the Fund's investments by major category are as follows:
Equity securities, including restricted securities, for which market quotations are readily available, are valued at the last reported sale price or official closing price as reported by a third party pricing vendor on the primary market or exchange on which they are traded and are categorized as Level 1 in the hierarchy. In the event there were no sales during the day or closing prices are not available, securities are valued at the last quoted bid price or may be valued using the last available price and are generally categorized as Level 2 in the hierarchy. For foreign equity securities, when market or security specific events arise, comparisons to the valuation of American Depositary Receipts (ADRs), futures contracts, Exchange-Traded Funds (ETFs) and certain indexes as well as quoted prices for similar securities may be used and would be categorized as Level 2 in the hierarchy. Utilizing these techniques may result in transfers between Level 1 and Level 2. For equity securities, including restricted securities, where observable inputs are limited, assumptions about market activity and risk are used and these securities may be categorized as Level 3 in the hierarchy.
Investments in commodities are valued at their last traded price at 4:00 p.m. Eastern time each business day and are categorized as Level 1 in the hierarchy. Investments in open-end mutual funds, including the Fidelity Central Funds, are valued at their closing net asset value (NAV) each business day and are categorized as Level 1 in the hierarchy.
Changes in valuation techniques may result in transfers in or out of an assigned level within the disclosure hierarchy. The aggregate value of investments by input level as of February 28, 2018, information on transfers between Levels 1 and 2 is included at the end of the Fund's Consolidated Schedule of Investments.
Foreign Currency. The Fund may use foreign currency contracts to facilitate transactions in foreign-denominated securities. Gains and losses from these transactions may arise from changes in the value of the foreign currency or if the counterparties do not perform under the contracts' terms.
Foreign-denominated assets, including investment securities, and liabilities are translated into U.S. dollars at the exchange rates at period end. Purchases and sales of investment securities, income and dividends received and expenses denominated in foreign currencies are translated into U.S. dollars at the exchange rate in effect on the transaction date.
The effects of exchange rate fluctuations on investments are included with the net realized and unrealized gain (loss) on investment securities. Other foreign currency transactions resulting in realized and unrealized gain (loss) are disclosed separately.
Investment Transactions and Income. For financial reporting purposes, the Fund's investment holdings and NAV include trades executed through the end of the last business day of the period. The NAV per share for processing shareholder transactions is calculated as of the close of business of the New York Stock Exchange (NYSE), normally 4:00 p.m. Eastern time and includes trades executed through the end of the prior business day. Gains and losses on securities sold are determined on the basis of identified cost and includes proceeds received from litigation. Dividend income is recorded on the ex-dividend date, except for certain dividends from foreign securities where the ex-dividend date may have passed, which are recorded as soon as the Fund is informed of the ex-dividend date. Non-cash dividends included in dividend income, if any, are recorded at the fair market value of the securities received. Income and capital gain distributions from Fidelity Central Funds, if any, are recorded on the ex-dividend date. Certain distributions received by the Fund represent a return of capital or capital gain. The Fund determines the components of these distributions subsequent to the ex-dividend date, based upon receipt of tax filings or other correspondence relating to the underlying investment. These distributions are recorded as a reduction of cost of investments and/or as a realized gain. Investment income is recorded net of foreign taxes withheld where recovery of such taxes is uncertain.
Class Allocations and Expenses. Investment income, realized and unrealized capital gains and losses, common expenses of the Fund, and certain fund-level expense reductions, if any, are allocated daily on a pro-rata basis to each class based on the relative net assets of each class to the total net assets of the Fund. Each class differs with respect to transfer agent and distribution and service plan fees incurred. Certain expense reductions may also differ by class. For the reporting period, the allocated portion of income and expenses to each class as a percent of its average net assets may vary due to the timing of recording these transactions in relation to fluctuating net assets of the classes. Expenses directly attributable to a fund are charged to that fund. Expenses attributable to more than one fund are allocated among the respective funds on the basis of relative net assets or other appropriate methods. Expense estimates are accrued in the period to which they relate and adjustments are made when actual amounts are known.
Deferred Trustee Compensation. Under a Deferred Compensation Plan (the Plan), independent Trustees may elect to defer receipt of a portion of their annual compensation. Deferred amounts are invested in a cross-section of Fidelity funds, are marked-to-market and remain in the Fund until distributed in accordance with the Plan. The investment of deferred amounts and the offsetting payable to the Trustees are included in the accompanying Statement of Assets and Liabilities.
Income Tax Information and Distributions to Shareholders. Each year, the Fund intends to qualify as a regulated investment company under Subchapter M of the Internal Revenue Code, including distributing substantially all of its taxable income and realized gains. As a result, no provision for U.S. Federal income taxes is required. As of February 28, 2018, the Fund did not have any unrecognized tax benefits in the consolidated financial statements; nor is the Fund aware of any tax positions for which it is reasonably possible that the total amounts of unrecognized tax benefits will significantly change in the next twelve months. The Fund files a U.S. federal tax return, in addition to state and local tax returns as required. The Fund's federal income tax returns are subject to examination by the Internal Revenue Service (IRS) for a period of three fiscal years after they are filed. State and local tax returns may be subject to examination for an additional fiscal year depending on the jurisdiction. Foreign taxes are provided for based on the Fund's understanding of the tax rules and rates that exist in the foreign markets in which it invests.
The Subsidiary is classified as a controlled foreign corporation under Subchapter N of the Internal Revenue Code. Therefore, the Fund is required to increase its taxable income by its share of the Subsidiary's income. Net investment losses of the Subsidiary cannot be deducted by the Fund in the current period nor carried forward to offset taxable income in future periods.
Distributions are declared and recorded on the ex-dividend date. Income dividends and capital gain distributions are declared separately for each class. Income and capital gain distributions are determined in accordance with income tax regulations, which may differ from GAAP.
Capital accounts within the consolidated financial statements are adjusted for permanent book-tax differences. These adjustments have no impact on net assets or the results of operations. Capital accounts are not adjusted for temporary book-tax differences which will reverse in a subsequent period.
Book-tax differences are primarily due to foreign currency transactions, passive foreign investment companies (PFIC), controlled foreign corporations, deferred trustees compensation, net operating losses, capital loss carryforwards and losses deferred due to wash sales and excise tax regulations.
As of period end, the cost and unrealized appreciation (depreciation) in securities, and derivatives if applicable, for federal income tax purposes on an unconsolidated basis were as follows:
| Gross unrealized appreciation | $241,909,637 |
| Gross unrealized depreciation | (442,632,944) |
| Net unrealized appreciation (depreciation) | $(200,723,307) |
| Tax Cost | $1,446,999,518 |
The tax-based components of distributable earnings as of period end were as follows:
| Capital loss carryforward | $(1,264,055,651) |
| Net unrealized appreciation (depreciation) on securities and other investments | $(200,721,875) |
Capital loss carryforwards are only available to offset future capital gains of the Fund to the extent provided by regulations and may be limited. Under the Regulated Investment Company Modernization Act of 2010 (the Act), the Fund is permitted to carry forward capital losses incurred in taxable years beginning after December 22, 2010 for an unlimited period and such capital losses are required to be used prior to any losses that expire. The capital loss carryforward information presented below, including any applicable limitation, is estimated as of fiscal period end and is subject to adjustment.
| No expiration | |
| Short-term | $(141,667,626) |
| Long-term | (1,122,388,025) |
| Total capital loss carryforward | $(1,264,055,651) |
The Fund intends to elect to defer to its next fiscal year $6,867,607 of ordinary losses recognized during the period January 1, 2018 to February 28, 2018.
The tax character of distributions paid was as follows:
| | February 28, 2018 | February 28, 2017 |
| Ordinary Income | $3,130,282 | $ 47,051,891 |
Restricted Securities. The Fund may invest in securities that are subject to legal or contractual restrictions on resale. These securities generally may be resold in transactions exempt from registration or to the public if the securities are registered. Disposal of these securities may involve time-consuming negotiations and expense, and prompt sale at an acceptable price may be difficult. Information regarding restricted securities is included at the end of the Fund's Consolidated Schedule of Investments.
5. Purchases and Sales of Investments.
Purchases and sales of securities, other than short-term securities, aggregated $188,488,420 and $329,808,540, respectively.
6. Fees and Other Transactions with Affiliates.
Management Fee. Fidelity SelectCo, LLC (the investment adviser) and its affiliates provide the Fund with investment management related services for which the Fund pays a monthly management fee. The management fee is the sum of an individual fund fee rate that is based on an annual rate of .30% of the Fund's average net assets and an annualized group fee rate that averaged .24% during the period. The group fee rate is based upon the average net assets of all the mutual funds advised by Fidelity Management & Research Company (FMR) and the investment adviser. The group fee rate decreases as assets under management increase and increases as assets under management decrease.
FMR, either through itself or through an affiliate provides investment management related services to the Subsidiary for which the Subsidiary pays a monthly management fee at the annual rate of .30% of its net assets. Under the management contract with the subsidiary, FMR pays all other expenses of the Subsidiary, except custodian fees.
For the reporting period, the total consolidated annual management fee rate which includes the management fee of the Fund and the Subsidiary was .56% of the Fund's average net assets.
During the period, the investment adviser waived a portion of the Fund's management fee representing the amount of the management fee paid by the Subsidiary to FMR as described in the Expense Reductions note.
Distribution and Service Plan Fees. In accordance with Rule 12b-1 of the 1940 Act, the Fund has adopted separate Distribution and Service Plans for each class of shares. Certain classes pay Fidelity Distributors Corporation (FDC), an affiliate of the investment adviser, separate Distribution and Service Fees, each of which is based on an annual percentage of each class' average net assets. In addition, FDC may pay financial intermediaries for selling shares of the Fund and providing shareholder support services. For the period, the Distribution and Service Fee rates, total fees and amounts retained by FDC were as follows:
| | Distribution Fee | Service Fee | Total Fees | Retained by FDC |
| Class A | -% | .25% | $182,210 | $7,154 |
| Class M | .25% | .25% | 116,752 | 10 |
| Class C | .75% | .25% | 1,024,737 | 245,159 |
| | | | $1,323,699 | $252,323 |
Sales Load. FDC may receive a front-end sales charge of up to 5.75% for selling Class A shares and 3.50% for selling Class M shares, some of which is paid to financial intermediaries for selling shares of the Fund. Depending on the holding period, FDC may receive contingent deferred sales charges levied on Class A, Class M and Class C redemptions. The deferred sales charges are 1.00% for Class C shares, 1.00% for certain purchases of Class A shares and .25% for certain purchases of Class M shares.
For the period, sales charge amounts retained by FDC were as follows:
| | Retained by FDC |
| Class A | $30,750 |
| Class M | 6,668 |
| Class C(a) | 13,328 |
| | $50,746 |
(a) When Class C shares are initially sold, FDC pays commissions from its own resources to financial intermediaries through which the sales are made.
Transfer Agent Fees. Fidelity Investments Institutional Operations Company, Inc., (FIIOC), an affiliate of the investment adviser, is the transfer, dividend disbursing and shareholder servicing agent for each class of the Fund. FIIOC receives account fees and asset-based fees that vary according to the account size and type of account of the shareholders of the respective classes of the Fund. FIIOC pays for typesetting, printing and mailing of shareholder reports, except proxy statements.
For the period, transfer agent fees for each class were as follows:
| | Amount | % of Class-Level Average Net Assets |
| Class A | $206,820 | .28 |
| Class M | 78,845 | .34 |
| Class C | 209,550 | .20 |
| Gold | 2,539,863 | .22 |
| Class I | 131,033 | .20 |
| | $3,166,111 | |
Accounting and Security Lending Fees. Fidelity Service Company, Inc. (FSC), an affiliate of the investment adviser, maintains the Fund's accounting records. The accounting fee is based on the level of average net assets for each month. Under a separate contract, FSC administers the security lending program. The security lending fee is based on the number and duration of lending transactions.
Brokerage Commissions. The Fund placed a portion of its portfolio transactions with brokerage firms which are affiliates of the investment adviser. Brokerage commissions are included in net realized gain (loss) and change in net unrealized appreciation (depreciation) in the Consolidated Statement of Operations. The commissions paid to these affiliated firms were $6,705 for the period.
Interfund Trades. The Fund may purchase from or sell securities to other Fidelity Funds under procedures adopted by the Board. The procedures have been designed to ensure these interfund trades are executed in accordance with Rule 17a-7 of the 1940 Act. Interfund trades are included within the respective purchases and sales amounts shown in the Purchases and Sales of Investments note.
Other. During the period, the investment adviser reimbursed the Fund for certain losses in the amount of $1,500.
7. Committed Line of Credit.
The Fund participates with other funds managed by the investment adviser or an affiliate in a $4.25 billion credit facility (the "line of credit") to be utilized for temporary or emergency purposes to fund shareholder redemptions or for other short-term liquidity purposes. The Fund has agreed to pay commitment fees on its pro-rata portion of the line of credit, which amounted to $4,369 and is reflected in Miscellaneous expenses on the Consolidated Statement of Operations. During the period, the Fund did not borrow on this line of credit.
8. Security Lending.
The Fund lends portfolio securities through a lending agent from time to time in order to earn additional income. On the settlement date of the loan, the Fund receives collateral (in the form of U.S. Treasury obligations, letters of credit and/or cash) against the loaned securities and maintains collateral in an amount not less than 100% of the market value of the loaned securities during the period of the loan. The market value of the loaned securities is determined at the close of business of the Fund and any additional required collateral is delivered to the Fund on the next business day. The Fund or borrower may terminate the loan at any time, and if the borrower defaults on its obligation to return the securities loaned because of insolvency or other reasons, the Fund may apply collateral received from the borrower against the obligation. The Fund may experience delays and costs in recovering the securities loaned. Any cash collateral received is invested in the Fidelity Securities Lending Cash Central Fund. The value of loaned securities and cash collateral at period end are disclosed on the Fund's Consolidated Statement of Assets and Liabilities. Security lending income represents the income earned on investing cash collateral, less rebates paid to borrowers and any lending agent fees associated with the loan, plus any premium payments received for lending certain types of securities. Security lending income is presented in the Consolidated Statement of Operations as a component of income from Fidelity Central Funds. Total security lending income during the period amounted to $30,724.
9. Expense Reductions.
The investment adviser has contractually agreed to waive the Fund's management fee in an amount equal to the management fee paid by the Subsidiary to FMR. During the period, this waiver reduced the Fund's management fee by $249,612.
Commissions paid to certain brokers with whom the investment adviser, or its affiliates, places trades on behalf of the Fund include an amount in addition to trade execution, which may be rebated back to the Fund to offset certain expenses. This amount totaled $23,857 for the period.
In addition, during the period the investment adviser reimbursed and/or waived a portion of fund-level operating expenses in the amount of $12,566.
10. Distributions to Shareholders.
Distributions to shareholders of each class were as follows:
| | Year ended
February 28, 2018 | Year ended
February 28, 2017 |
| From net realized gain | | |
| Class A | $127,654 | $2,221,326 |
| Class M | 32,220 | 587,030 |
| Class C | 80,827 | 2,039,868 |
| Gold | 2,740,284 | 40,224,766 |
| Class I | 149,297 | 1,978,901 |
| Total | $3,130,282 | $47,051,891 |
11. Share Transactions.
Share transactions for each class were as follows and may contain automatic conversions between classes or exchanges between affiliated funds:
| | Shares | Shares | Dollars | Dollars |
| | Year ended February 28, 2018 | Year ended February 28, 2017 | Year ended February 28, 2018 | Year ended February 28, 2017 |
| Class A | | | | |
| Shares sold | 960,171 | 3,164,607 | $19,302,127 | $69,537,871 |
| Reinvestment of distributions | 5,732 | 120,564 | 125,534 | 2,146,978 |
| Shares redeemed | (1,663,786) | (2,238,855) | (33,274,700) | (48,377,613) |
| Net increase (decrease) | (697,883) | 1,046,316 | $(13,847,039) | $23,307,236 |
| Class M | | | | |
| Shares sold | 233,072 | 712,177 | $4,622,741 | $15,561,760 |
| Reinvestment of distributions | 1,488 | 32,071 | 32,029 | 560,038 |
| Shares redeemed | (402,307) | (517,783) | (7,900,562) | (11,004,318) |
| Net increase (decrease) | (167,747) | 226,465 | $(3,245,792) | $5,117,480 |
| Class B | | | | |
| Shares sold | – | 7,043 | $– | $134,526 |
| Shares redeemed | – | (89,907) | – | (1,923,575) |
| Net increase (decrease) | – | (82,864) | $– | $(1,789,049) |
| Class C | | | | |
| Shares sold | 1,214,001 | 3,277,150 | $22,977,515 | $68,100,712 |
| Reinvestment of distributions | 3,724 | 115,019 | 76,868 | 1,909,405 |
| Shares redeemed | (1,038,456) | (1,324,351) | (19,487,828) | (26,570,952) |
| Net increase (decrease) | 179,269 | 2,067,818 | $3,566,555 | $43,439,165 |
| Gold | | | | |
| Shares sold | 17,998,314 | 44,152,495 | $372,447,330 | $998,832,934 |
| Reinvestment of distributions | 117,013 | 2,098,203 | 2,622,272 | 38,476,693 |
| Shares redeemed | (24,743,063) | (45,146,079) | (508,056,164) | (990,273,602) |
| Net increase (decrease) | (6,627,736) | 1,104,619 | $(132,986,562) | $47,036,025 |
| Class I | | | | |
| Shares sold | 1,883,552 | 2,033,849 | $38,579,606 | $45,606,027 |
| Reinvestment of distributions | 6,152 | 97,474 | 137,796 | 1,788,422 |
| Shares redeemed | (1,396,712) | (2,240,667) | (28,722,720) | (49,737,421) |
| Net increase (decrease) | 492,992 | (109,344) | $9,994,682 | $(2,342,972) |
12. Other.
The Fund's organizational documents provide former and current trustees and officers with a limited indemnification against liabilities arising in connection with the performance of their duties to the Fund. In the normal course of business, the Fund may also enter into contracts that provide general indemnifications. The Fund's maximum exposure under these arrangements is unknown as this would be dependent on future claims that may be made against the Fund. The risk of material loss from such claims is considered remote.
Fidelity Advisor® Materials Fund
Performance: The Bottom Line
Average annual total return reflects the change in the value of an investment, assuming reinvestment of distributions from dividend income and capital gains (the profits earned upon the sale of securities that have grown in value, if any) and assuming a constant rate of performance each year. The hypothetical investment and the average annual total returns do not reflect the deduction of taxes that a shareholder would pay on fund distributions or the redemption of fund shares. During periods of reimbursement by Fidelity, a fund’s total return will be greater than it would be had the reimbursement not occurred. How a fund did yesterday is no guarantee of how it will do tomorrow.
Average Annual Total Returns
| For the periods ended February 28, 2018 | Past 1 year | Past 5 years | Past 10 years |
| Class A (incl. 5.75% sales charge) | 8.06% | 6.74% | 6.71% |
| Class M (incl. 3.50% sales charge) | 10.30% | 6.91% | 6.65% |
| Class C (incl. contingent deferred sales charge) | 12.78% | 7.20% | 6.54% |
| Class I | 14.97% | 8.31% | 7.65% |
Class C shares' contingent deferred sales charges included in the past one year, past five years and past ten years total return figures are 1%, 0% and 0%, respectively.
$10,000 Over 10 Years
Let's say hypothetically that $10,000 was invested in Fidelity Advisor® Materials Fund - Class A on February 29, 2008, and the current 5.75% sales charge was paid.
The chart shows how the value of your investment would have changed, and also shows how the S&P 500® Index performed over the same period.
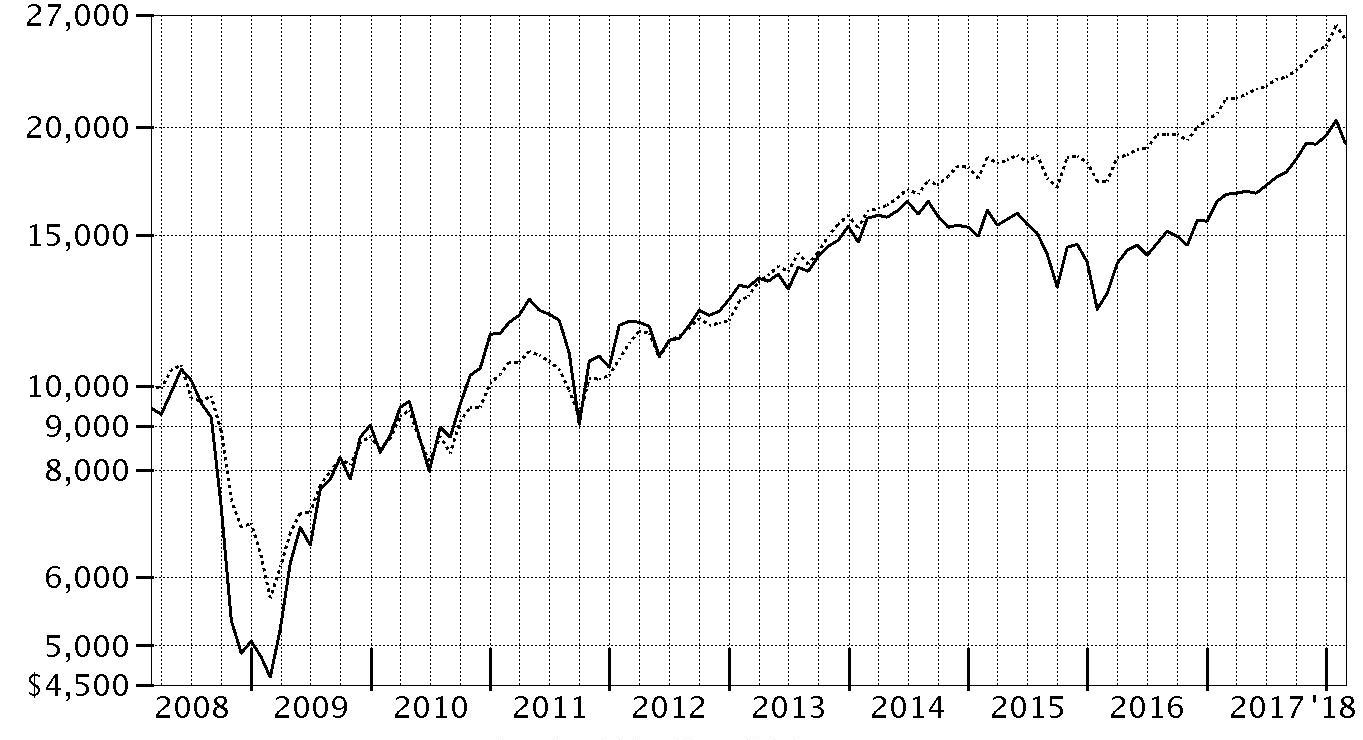
| Period Ending Values |
| $19,144 | Fidelity Advisor® Materials Fund - Class A |
| $25,307 | S&P 500® Index |
Fidelity Advisor® Materials Fund
Management's Discussion of Fund Performance
Market Recap: U.S. equities gained 17.10% for the 12 months ending February 28, 2018, as the S&P 500
® index moved steadily higher throughout 2017 and into 2018 until sharply reversing course in February. The drop was in stark contrast to the low volatility seen throughout 2017, along with consumer sentiment and other market indicators that stayed positive. Investors remained decidedly upbeat as the calendar turned, and the index rose 5.73% in January. February was a decidedly different story, though, as volatility spiked amid fear that rising inflation and the potential for the economy to overheat would prompt the U.S. Federal Reserve to pick up the pace of interest rate hikes. The index returned -3.69% for the month, its first negative result since October 2016. For the full 12 months, growth stocks handily topped value, while large-caps bested small-caps. By sector, information technology fared best by far, gaining 36% amid strong earnings growth from several major index constituents. Consumer discretionary (+22%) also stood out, driven by retailers. Financials added 20%, riding the uptick in bond yields. Materials and industrials rose about 16% each, boosted by higher demand, especially from China. Conversely, notable laggards included the defensive telecommunication services (-5%) and utilities (-2%) sectors, while rising rates held back real estate (-3%).
Comments from Portfolio Manager Rick Malnight: For the year, the fund’s share classes (excluding sales charges, if applicable) finished roughly in line with the 14.70% return of the MSCI U.S. IMI Materials 25/50 Index, but trailed the S&P 500
®. Versus the MSCI sector index, our sizable underweighting in the steel segment, plus good stock picking in commodity chemicals and paper packaging, bolstered fund performance. A large overweighting in strong-performing Westlake Chemical was the fund’s top relative contributor. I significantly increased this position during the period. Ethylene producer LyondellBasell Industries, the fund’s largest overweighting at period end, also contributed, as did Steel Dynamics, one of the U.S. steel producers we bought this period. Conversely, an underweighting and weak picks in industrial gases dampened the fund’s relative performance, as did positioning in fertilizers & agricultural chemicals and out-of-index exposure to trading companies and distributors. MSCI index stalwart Praxair finished as the fund’s largest relative detractor, as the stock advanced 29% this period, and we didn’t own it. Another relative detractor was strong-performing agricultural chemical supplier FMC, which we didn’t own early in the period.
The views expressed above reflect those of the portfolio manager(s) only through the end of the period as stated on the cover of this report and do not necessarily represent the views of Fidelity or any other person in the Fidelity organization. Any such views are subject to change at any time based upon market or other conditions and Fidelity disclaims any responsibility to update such views. These views may not be relied on as investment advice and, because investment decisions for a Fidelity fund are based on numerous factors, may not be relied on as an indication of trading intent on behalf of any Fidelity fund.
Notes to Shareholders: On November 17, 2017, Rick Malnight succeeded Tobias Welo as Portfolio Manager of the fund.
On December 8, 2017, shareholders approved proposals from the Board of Trustees to eliminate each sector/industry fund's fundamental “invests primarily” policy and to modify the fundamental concentration policy for certain funds. The changes took effect on January 1, 2018, and do not impact how the funds are managed.
Materials Portfolio
Investment Summary (Unaudited)
Top Ten Stocks as of February 28, 2018
| | % of fund's net assets |
| DowDuPont, Inc. | 22.3 |
| LyondellBasell Industries NV Class A | 9.8 |
| The Chemours Co. LLC | 5.4 |
| Linde AG | 5.1 |
| WestRock Co. | 4.2 |
| Sherwin-Williams Co. | 3.6 |
| Westlake Chemical Corp. | 3.1 |
| Steel Dynamics, Inc. | 3.1 |
| Freeport-McMoRan, Inc. | 3.0 |
| FMC Corp. | 2.2 |
| | 61.8 |
Top Industries (% of fund's net assets)
| As of February 28, 2018 |
| | Chemicals | 68.2% |
| | Metals & Mining | 14.6% |
| | Containers & Packaging | 10.4% |
| | Construction Materials | 4.4% |
| | Trading Companies & Distributors | 1.6% |
| | All Others* | 0.8% |

* Includes short-term investments and net other assets (liabilities).
Materials Portfolio
Schedule of Investments February 28, 2018
Showing Percentage of Net Assets
| Common Stocks - 98.2% | | | |
| | | Shares | Value |
| Chemicals - 66.7% | | | |
| Commodity Chemicals - 18.2% | | | |
| Alpek SA de CV | | 3,308,900 | $4,286,501 |
| Cabot Corp. | | 132,800 | 7,991,904 |
| Ciner Resources LP | | 147,200 | 4,073,024 |
| LG Chemical Ltd. | | 33,922 | 11,956,471 |
| LyondellBasell Industries NV Class A | | 1,704,915 | 184,505,901 |
| Olin Corp. | | 1,045,900 | 33,991,750 |
| Orion Engineered Carbons SA | | 447,200 | 12,320,360 |
| Tronox Ltd. Class A | | 1,355,803 | 24,784,079 |
| Westlake Chemical Corp. | | 536,380 | 58,068,499 |
| | | | 341,978,489 |
| Diversified Chemicals - 30.6% | | | |
| Ashland Global Holdings, Inc. | | 218,600 | 15,481,252 |
| DowDuPont, Inc. | | 5,983,883 | 420,666,976 |
| Eastman Chemical Co. | | 300,748 | 30,399,608 |
| Huntsman Corp. | | 266,900 | 8,612,863 |
| The Chemours Co. LLC | | 2,125,631 | 100,988,729 |
| | | | 576,149,428 |
| Fertilizers & Agricultural Chemicals - 4.9% | | | |
| CF Industries Holdings, Inc. | | 504,010 | 20,785,372 |
| FMC Corp. | | 537,500 | 42,183,000 |
| Nutrien Ltd. | | 272,427 | 13,385,694 |
| The Scotts Miracle-Gro Co. Class A | | 187,131 | 16,811,849 |
| | | | 93,165,915 |
| Industrial Gases - 5.1% | | | |
| Linde AG (a) | | 436,111 | 96,772,567 |
| Specialty Chemicals - 7.9% | | | |
| Axalta Coating Systems Ltd. (a) | | 445,000 | 13,706,000 |
| Celanese Corp. Class A | | 289,600 | 29,209,056 |
| Frutarom Industries Ltd. | | 115,796 | 10,654,491 |
| Platform Specialty Products Corp. (a) | | 1,973,900 | 20,607,516 |
| Sherwin-Williams Co. | | 169,800 | 68,188,284 |
| W.R. Grace & Co. | | 84,702 | 5,605,578 |
| | | | 147,970,925 |
|
| TOTAL CHEMICALS | | | 1,256,037,324 |
|
| Construction Materials - 4.4% | | | |
| Construction Materials - 4.4% | | | |
| CRH PLC sponsored ADR (b) | | 239,200 | 7,917,520 |
| Eagle Materials, Inc. | | 344,115 | 34,490,646 |
| Summit Materials, Inc. | | 1,288,728 | 40,762,467 |
| | | | 83,170,633 |
| Containers & Packaging - 10.4% | | | |
| Metal & Glass Containers - 1.6% | | | |
| Aptargroup, Inc. | | 182,800 | 16,345,976 |
| Berry Global Group, Inc. (a) | | 261,200 | 14,209,280 |
| | | | 30,555,256 |
| Paper Packaging - 8.8% | | | |
| Avery Dennison Corp. | | 182,100 | 21,515,115 |
| Graphic Packaging Holding Co. | | 2,717,095 | 41,598,724 |
| Packaging Corp. of America | | 189,800 | 22,624,160 |
| WestRock Co. | | 1,202,819 | 79,097,377 |
| | | | 164,835,376 |
|
| TOTAL CONTAINERS & PACKAGING | | | 195,390,632 |
|
| Energy Equipment & Services - 0.5% | | | |
| Oil & Gas Equipment & Services - 0.5% | | | |
| Tenaris SA sponsored ADR (b) | | 298,700 | 10,302,163 |
| Metals & Mining - 14.6% | | | |
| Copper - 3.5% | | | |
| Freeport-McMoRan, Inc. (a) | | 3,059,700 | 56,910,420 |
| Lundin Mining Corp. | | 1,442,500 | 9,386,592 |
| | | | 66,297,012 |
| Diversified Metals & Mining - 2.2% | | | |
| Alcoa Corp. (a) | | 427,300 | 19,215,681 |
| Glencore Xstrata PLC | | 3,613,113 | 19,000,118 |
| Ivanhoe Mines Ltd. (a) | | 1,260,100 | 3,171,854 |
| | | | 41,387,653 |
| Gold - 2.7% | | | |
| Franco-Nevada Corp. | | 75,100 | 5,261,506 |
| Newmont Mining Corp. | | 1,076,100 | 41,107,020 |
| Randgold Resources Ltd. sponsored ADR | | 59,900 | 4,853,098 |
| | | | 51,221,624 |
| Steel - 6.2% | | | |
| Allegheny Technologies, Inc. (a) | | 250,700 | 6,495,637 |
| Nucor Corp. | | 292,100 | 19,103,340 |
| Reliance Steel & Aluminum Co. | | 211,600 | 19,079,972 |
| Ryerson Holding Corp. (a) | | 541,100 | 5,465,110 |
| Steel Dynamics, Inc. | | 1,248,900 | 57,761,625 |
| United States Steel Corp. | | 188,255 | 8,190,975 |
| | | | 116,096,659 |
|
| TOTAL METALS & MINING | | | 275,002,948 |
|
| Trading Companies & Distributors - 1.6% | | | |
| Trading Companies & Distributors - 1.6% | | | |
| Univar, Inc. (a) | | 1,040,733 | 29,983,518 |
| TOTAL COMMON STOCKS | | | |
| (Cost $1,467,654,984) | | | 1,849,887,218 |
|
| Nonconvertible Preferred Stocks - 1.5% | | | |
| Chemicals - 1.5% | | | |
| Commodity Chemicals - 1.5% | | | |
| Braskem SA (PN-A) | | | |
| (Cost $30,933,362) | | 1,982,400 | 28,354,016 |
|
| Money Market Funds - 1.5% | | | |
| Fidelity Cash Central Fund, 1.41% (c) | | 20,056,467 | 20,060,478 |
| Fidelity Securities Lending Cash Central Fund 1.42% (c)(d) | | 7,755,046 | 7,755,822 |
| TOTAL MONEY MARKET FUNDS | | | |
| (Cost $27,816,300) | | | 27,816,300 |
| TOTAL INVESTMENT IN SECURITIES - 101.2% | | | |
| (Cost $1,526,404,646) | | | 1,906,057,534 |
| NET OTHER ASSETS (LIABILITIES) - (1.2)% | | | (23,459,758) |
| NET ASSETS - 100% | | | $1,882,597,776 |
Legend
(a) Non-income producing
(b) Security or a portion of the security is on loan at period end.
(c) Affiliated fund that is generally available only to investment companies and other accounts managed by Fidelity Investments. The rate quoted is the annualized seven-day yield of the fund at period end. A complete unaudited listing of the fund's holdings as of its most recent quarter end is available upon request. In addition, each Fidelity Central Fund's financial statements, which are not covered by the Fund's Report of Independent Registered Public Accounting Firm, are available on the SEC's website or upon request.
(d) Investment made with cash collateral received from securities on loan.
Affiliated Central Funds
Information regarding fiscal year to date income earned by the Fund from investments in Fidelity Central Funds is as follows:
| Fund | Income earned |
| Fidelity Cash Central Fund | $193,465 |
| Fidelity Securities Lending Cash Central Fund | 58,427 |
| Total | $251,892 |
Amounts in the income column in the above table include any capital gain distributions from underlying funds, which are presented in the corresponding line-item in the Statement of Operations if applicable.
Investment Valuation
The following is a summary of the inputs used, as of February 28, 2018, involving the Fund's assets and liabilities carried at fair value. The inputs or methodology used for valuing securities may not be an indication of the risk associated with investing in those securities. For more information on valuation inputs, and their aggregation into the levels used below, please refer to the Investment Valuation section in the accompanying Notes to Financial Statements.
| | Valuation Inputs at Reporting Date: |
| Description | Total | Level 1 | Level 2 | Level 3 |
| Investments in Securities: | | | | |
| Common Stocks | $1,849,887,218 | $1,722,158,062 | $127,729,156 | $-- |
| Nonconvertible Preferred Stocks | 28,354,016 | 28,354,016 | -- | -- |
| Money Market Funds | 27,816,300 | 27,816,300 | -- | -- |
| Total Investments in Securities: | $1,906,057,534 | $1,778,328,378 | $127,729,156 | $-- |
Other Information
Distribution of investments by country or territory of incorporation, as a percentage of Total Net Assets, is as follows (Unaudited):
| United States of America | 75.6% |
| Netherlands | 9.8% |
| Germany | 5.1% |
| Canada | 1.7% |
| Brazil | 1.5% |
| Australia | 1.3% |
| Bailiwick of Jersey | 1.2% |
| Luxembourg | 1.2% |
| Others (Individually Less Than 1%) | 2.6% |
| | 100.0% |
See accompanying notes which are an integral part of the financial statements.
Materials Portfolio
Financial Statements
Statement of Assets and Liabilities
| | | February 28, 2018 |
| Assets | | |
Investment in securities, at value (including securities loaned of $7,427,930) — See accompanying schedule:
Unaffiliated issuers (cost $1,498,588,346) | $1,878,241,234 | |
| Fidelity Central Funds (cost $27,816,300) | 27,816,300 | |
| Total Investment in Securities (cost $1,526,404,646) | | $1,906,057,534 |
| Foreign currency held at value (cost $20,678) | | 20,068 |
| Receivable for fund shares sold | | 2,130,082 |
| Dividends receivable | | 3,493,889 |
| Distributions receivable from Fidelity Central Funds | | 21,085 |
| Prepaid expenses | | 5,327 |
| Other receivables | | 150,425 |
| Total assets | | 1,911,878,410 |
| Liabilities | | |
| Payable for investments purchased | $17,477,642 | |
| Payable for fund shares redeemed | 2,470,957 | |
| Accrued management fee | 857,894 | |
| Distribution and service plan fees payable | 132,028 | |
| Other affiliated payables | 356,102 | |
| Other payables and accrued expenses | 233,411 | |
| Collateral on securities loaned | 7,752,600 | |
| Total liabilities | | 29,280,634 |
| Net Assets | | $1,882,597,776 |
| Net Assets consist of: | | |
| Paid in capital | | $1,415,875,624 |
| Undistributed net investment income | | 2,045,516 |
| Accumulated undistributed net realized gain (loss) on investments and foreign currency transactions | | 85,026,036 |
| Net unrealized appreciation (depreciation) on investments and assets and liabilities in foreign currencies | | 379,650,600 |
| Net Assets | | $1,882,597,776 |
| Calculation of Maximum Offering Price | | |
| Class A: | | |
| Net Asset Value and redemption price per share ($201,933,218 ÷ 2,281,837 shares) | | $88.50 |
| Maximum offering price per share (100/94.25 of $88.50) | | $93.90 |
| Class M: | | |
| Net Asset Value and redemption price per share ($40,106,737 ÷ 456,823 shares) | | $87.79 |
| Maximum offering price per share (100/96.50 of $87.79) | | $90.97 |
| Class C: | | |
| Net Asset Value and offering price per share ($85,792,215 ÷ 1,003,158 shares)(a) | | $85.52 |
| Materials: | | |
| Net Asset Value, offering price and redemption price per share ($1,043,703,839 ÷ 11,739,884 shares) | | $88.90 |
| Class I: | | |
| Net Asset Value, offering price and redemption price per share ($511,061,767 ÷ 5,759,805 shares) | | $88.73 |
(a) Redemption price per share is equal to net asset value less any applicable contingent deferred sales charge.
See accompanying notes which are an integral part of the financial statements.
Statement of Operations
| | | Year ended February 28, 2018 |
| Investment Income | | |
| Dividends | | $28,739,191 |
| Income from Fidelity Central Funds | | 251,892 |
| Total income | | 28,991,083 |
| Expenses | | |
| Management fee | $9,263,034 | |
| Transfer agent fees | 3,402,060 | |
| Distribution and service plan fees | 1,535,038 | |
| Accounting and security lending fees | 529,164 | |
| Custodian fees and expenses | 35,786 | |
| Independent trustees' fees and expenses | 35,989 | |
| Registration fees | 147,869 | |
| Audit | 54,328 | |
| Legal | 20,307 | |
| Interest | 570 | |
| Miscellaneous | 90,300 | |
| Total expenses before reductions | 15,114,445 | |
| Expense reductions | (66,975) | 15,047,470 |
| Net investment income (loss) | | 13,943,613 |
| Realized and Unrealized Gain (Loss) | | |
| Net realized gain (loss) on: | | |
| Investment securities: | | |
| Unaffiliated issuers | 168,685,493 | |
| Fidelity Central Funds | 564 | |
| Foreign currency transactions | (70,430) | |
| Total net realized gain (loss) | | 168,615,627 |
| Change in net unrealized appreciation (depreciation) on: | �� | |
| Investment securities: | | |
| Unaffiliated issuers | 43,200,972 | |
| Fidelity Central Funds | (2,498) | |
| Assets and liabilities in foreign currencies | 7,401 | |
| Total change in net unrealized appreciation (depreciation) | | 43,205,875 |
| Net gain (loss) | | 211,821,502 |
| Net increase (decrease) in net assets resulting from operations | | $225,765,115 |
See accompanying notes which are an integral part of the financial statements.
Statement of Changes in Net Assets
| | Year ended February 28, 2018 | Year ended February 28, 2017 |
| Increase (Decrease) in Net Assets | | |
| Operations | | |
| Net investment income (loss) | $13,943,613 | $16,237,847 |
| Net realized gain (loss) | 168,615,627 | 64,095,613 |
| Change in net unrealized appreciation (depreciation) | 43,205,875 | 293,420,932 |
| Net increase (decrease) in net assets resulting from operations | 225,765,115 | 373,754,392 |
| Distributions to shareholders from net investment income | (13,925,069) | (13,547,763) |
| Distributions to shareholders from net realized gain | (80,094,510) | – |
| Total distributions | (94,019,579) | (13,547,763) |
| Share transactions - net increase (decrease) | 182,977,431 | (113,259,980) |
| Redemption fees | – | 17,097 |
| Total increase (decrease) in net assets | 314,722,967 | 246,963,746 |
| Net Assets | | |
| Beginning of period | 1,567,874,809 | 1,320,911,063 |
| End of period | $1,882,597,776 | $1,567,874,809 |
| Other Information | | |
| Undistributed net investment income end of period | $2,045,516 | $2,492,054 |
See accompanying notes which are an integral part of the financial statements.
Financial Highlights
Materials Portfolio Class A
| Years ended February 28, | 2018 | 2017 | 2016A | 2015 | 2014 |
| Selected Per–Share Data | | | | | |
| Net asset value, beginning of period | $81.27 | $62.94 | $80.43 | $86.46 | $73.44 |
| Income from Investment Operations | | | | | |
| Net investment income (loss)B | .55 | .70 | .79 | .51 | .36 |
| Net realized and unrealized gain (loss) | 11.18 | 18.26 | (16.80) | 1.05 | 14.56 |
| Total from investment operations | 11.73 | 18.96 | (16.01) | 1.56 | 14.92 |
| Distributions from net investment income | (.50) | (.63) | (.58) | (.43) | (.30) |
| Distributions from net realized gain | (4.00) | – | (.91) | (7.17) | (1.60) |
| Total distributions | (4.50) | (.63) | (1.48)C | (7.59)D | (1.90) |
| Redemption fees added to paid in capitalB | – | –E | –E | –E | –E |
| Net asset value, end of period | $88.50 | $81.27 | $62.94 | $80.43 | $86.46 |
| Total ReturnF,G | 14.65% | 30.18% | (20.01)% | 2.20% | 20.46% |
| Ratios to Average Net AssetsH,I | | | | | |
| Expenses before reductions | 1.07% | 1.08% | 1.06% | 1.06% | 1.10% |
| Expenses net of fee waivers, if any | 1.07% | 1.08% | 1.06% | 1.06% | 1.10% |
| Expenses net of all reductions | 1.06% | 1.07% | 1.06% | 1.06% | 1.09% |
| Net investment income (loss) | .64% | .96% | 1.09% | .61% | .45% |
| Supplemental Data | | | | | |
| Net assets, end of period (000 omitted) | $201,933 | $229,086 | $202,747 | $319,740 | $336,777 |
| Portfolio turnover rateJ | 67% | 49%K | 64% | 76%K | 53% |
A For the year ended February 29.
B Calculated based on average shares outstanding during the period.
C Total distributions of $1.48 per share is comprised of distributions from net investment income of $.575 and distributions from net realized gain of $.906 per share.
D Total distributions of $7.59 per share is comprised of distributions from net investment income of $.425 and distributions from net realized gain of $7.167 per share.
E Amount represents less than $.005 per share.
F Total returns would have been lower if certain expenses had not been reduced during the applicable periods shown.
G Total returns do not include the effect of the sales charges.
H Fees and expenses of any underlying Fidelity Central Funds are not included in the Fund's expense ratio. The Fund indirectly bears its proportionate share of the expenses of any underlying Fidelity Central Funds.
I Expense ratios reflect operating expenses of the class. Expenses before reductions do not reflect amounts reimbursed by the investment adviser or reductions from brokerage service arrangements or reductions from other expense offset arrangements and do not represent the amount paid by the class during periods when reimbursements or reductions occur. Expenses net of fee waivers reflect expenses after reimbursement by the investment adviser but prior to reductions from brokerage service arrangements or other expense offset arrangements. Expenses net of all reductions represent the net expenses paid by the class.
J Amount does not include the portfolio activity of any underlying Fidelity Central Funds.
K Portfolio turnover rate excludes securities received or delivered in-kind.
See accompanying notes which are an integral part of the financial statements.
Materials Portfolio Class M
| Years ended February 28, | 2018 | 2017 | 2016A | 2015 | 2014 |
| Selected Per–Share Data | | | | | |
| Net asset value, beginning of period | $80.66 | $62.52 | $79.95 | $85.99 | $73.05 |
| Income from Investment Operations | | | | | |
| Net investment income (loss)B | .30 | .47 | .56 | .25 | .12 |
| Net realized and unrealized gain (loss) | 11.08 | 18.12 | (16.69) | 1.06 | 14.48 |
| Total from investment operations | 11.38 | 18.59 | (16.13) | 1.31 | 14.60 |
| Distributions from net investment income | (.25) | (.45) | (.40) | (.18) | (.06) |
| Distributions from net realized gain | (4.00) | – | (.91) | (7.17) | (1.60) |
| Total distributions | (4.25) | (.45) | (1.30)C | (7.35) | (1.66) |
| Redemption fees added to paid in capitalB | – | –D | –D | –D | –D |
| Net asset value, end of period | $87.79 | $80.66 | $62.52 | $79.95 | $85.99 |
| Total ReturnE,F | 14.30% | 29.78% | (20.27)% | 1.90% | 20.10% |
| Ratios to Average Net AssetsG,H | | | | | |
| Expenses before reductions | 1.36% | 1.39% | 1.38% | 1.37% | 1.40% |
| Expenses net of fee waivers, if any | 1.36% | 1.39% | 1.37% | 1.37% | 1.40% |
| Expenses net of all reductions | 1.35% | 1.38% | 1.37% | 1.37% | 1.39% |
| Net investment income (loss) | .35% | .65% | .77% | .31% | .15% |
| Supplemental Data | | | | | |
| Net assets, end of period (000 omitted) | $40,107 | $40,935 | $30,118 | $45,252 | $45,223 |
| Portfolio turnover rateI | 67% | 49%J | 64% | 76%J | 53% |
A For the year ended February 29.
B Calculated based on average shares outstanding during the period.
C Total distributions of $1.30 per share is comprised of distributions from net investment income of $.395 and distributions from net realized gain of $.906 per share.
D Amount represents less than $.005 per share.
E Total returns would have been lower if certain expenses had not been reduced during the applicable periods shown.
F Total returns do not include the effect of the sales charges.
G Fees and expenses of any underlying Fidelity Central Funds are not included in the Fund's expense ratio. The Fund indirectly bears its proportionate share of the expenses of any underlying Fidelity Central Funds.
H Expense ratios reflect operating expenses of the class. Expenses before reductions do not reflect amounts reimbursed by the investment adviser or reductions from brokerage service arrangements or reductions from other expense offset arrangements and do not represent the amount paid by the class during periods when reimbursements or reductions occur. Expenses net of fee waivers reflect expenses after reimbursement by the investment adviser but prior to reductions from brokerage service arrangements or other expense offset arrangements. Expenses net of all reductions represent the net expenses paid by the class.
I Amount does not include the portfolio activity of any underlying Fidelity Central Funds.
J Portfolio turnover rate excludes securities received or delivered in-kind.
See accompanying notes which are an integral part of the financial statements.
Materials Portfolio Class C
| Years ended February 28, | 2018 | 2017 | 2016A | 2015 | 2014 |
| Selected Per–Share Data | | | | | |
| Net asset value, beginning of period | $78.72 | $61.09 | $78.12 | $84.38 | $71.96 |
| Income from Investment Operations | | | | | |
| Net investment income (loss)B | (.09) | .15 | .24 | (.12) | (.23) |
| Net realized and unrealized gain (loss) | 10.80 | 17.68 | (16.28) | 1.03 | 14.23 |
| Total from investment operations | 10.71 | 17.83 | (16.04) | .91 | 14.00 |
| Distributions from net investment income | (.02) | (.20) | (.08) | – | – |
| Distributions from net realized gain | (3.89) | – | (.91) | (7.17) | (1.58) |
| Total distributions | (3.91) | (.20) | (.99) | (7.17) | (1.58) |
| Redemption fees added to paid in capitalB | – | –C | –C | –C | –C |
| Net asset value, end of period | $85.52 | $78.72 | $61.09 | $78.12 | $84.38 |
| Total ReturnD,E | 13.78% | 29.21% | (20.61)% | 1.43% | 19.56% |
| Ratios to Average Net AssetsF,G | | | | | |
| Expenses before reductions | 1.82% | 1.83% | 1.81% | 1.82% | 1.85% |
| Expenses net of fee waivers, if any | 1.82% | 1.82% | 1.81% | 1.82% | 1.85% |
| Expenses net of all reductions | 1.82% | 1.82% | 1.81% | 1.82% | 1.84% |
| Net investment income (loss) | (.11)% | .21% | .34% | (.14)% | (.30)% |
| Supplemental Data | | | | | |
| Net assets, end of period (000 omitted) | $85,792 | $80,225 | $66,896 | $107,697 | $106,879 |
| Portfolio turnover rateH | 67% | 49%I | 64% | 76%I | 53% |
A For the year ended February 29.
B Calculated based on average shares outstanding during the period.
C Amount represents less than $.005 per share.
D Total returns would have been lower if certain expenses had not been reduced during the applicable periods shown.
E Total returns do not include the effect of the contingent deferred sales charge.
F Fees and expenses of any underlying Fidelity Central Funds are not included in the Fund's expense ratio. The Fund indirectly bears its proportionate share of the expenses of any underlying Fidelity Central Funds.
G Expense ratios reflect operating expenses of the class. Expenses before reductions do not reflect amounts reimbursed by the investment adviser or reductions from brokerage service arrangements or reductions from other expense offset arrangements and do not represent the amount paid by the class during periods when reimbursements or reductions occur. Expenses net of fee waivers reflect expenses after reimbursement by the investment adviser but prior to reductions from brokerage service arrangements or other expense offset arrangements. Expenses net of all reductions represent the net expenses paid by the class.
H Amount does not include the portfolio activity of any underlying Fidelity Central Funds.
I Portfolio turnover rate excludes securities received or delivered in-kind.
See accompanying notes which are an integral part of the financial statements.
Materials Portfolio
| Years ended February 28, | 2018 | 2017 | 2016A | 2015 | 2014 |
| Selected Per–Share Data | | | | | |
| Net asset value, beginning of period | $81.64 | $63.20 | $80.77 | $86.81 | $73.68 |
| Income from Investment Operations | | | | | |
| Net investment income (loss)B | .79 | .90 | .98 | .73 | .58 |
| Net realized and unrealized gain (loss) | 11.24 | 18.34 | (16.89) | 1.05 | 14.63 |
| Total from investment operations | 12.03 | 19.24 | (15.91) | 1.78 | 15.21 |
| Distributions from net investment income | (.77) | (.80) | (.76) | (.65) | (.48) |
| Distributions from net realized gain | (4.00) | – | (.91) | (7.17) | (1.60) |
| Total distributions | (4.77) | (.80) | (1.66)C | (7.82) | (2.08) |
| Redemption fees added to paid in capitalB | – | –D | –D | –D | –D |
| Net asset value, end of period | $88.90 | $81.64 | $63.20 | $80.77 | $86.81 |
| Total ReturnE | 14.96% | 30.52% | (19.81)% | 2.46% | 20.80% |
| Ratios to Average Net AssetsF,G | | | | | |
| Expenses before reductions | .79% | .81% | .81% | .80% | .82% |
| Expenses net of fee waivers, if any | .79% | .81% | .81% | .80% | .82% |
| Expenses net of all reductions | .79% | .81% | .80% | .80% | .82% |
| Net investment income (loss) | .91% | 1.22% | 1.34% | .87% | .73% |
| Supplemental Data | | | | | |
| Net assets, end of period (000 omitted) | $1,043,704 | $882,504 | $711,985 | $1,107,689 | $1,231,942 |
| Portfolio turnover rateH | 67% | 49%I | 64% | 76%I | 53% |
A For the year ended February 29.
B Calculated based on average shares outstanding during the period.
C Total distributions of $1.66 per share is comprised of distributions from net investment income of $.756 and distributions from net realized gain of $.906 per share.
D Amount represents less than $.005 per share.
E Total returns would have been lower if certain expenses had not been reduced during the applicable periods shown.
F Fees and expenses of any underlying Fidelity Central Funds are not included in the Fund's expense ratio. The Fund indirectly bears its proportionate share of the expenses of any underlying Fidelity Central Funds.
G Expense ratios reflect operating expenses of the class. Expenses before reductions do not reflect amounts reimbursed by the investment adviser or reductions from brokerage service arrangements or reductions from other expense offset arrangements and do not represent the amount paid by the class during periods when reimbursements or reductions occur. Expenses net of fee waivers reflect expenses after reimbursement by the investment adviser but prior to reductions from brokerage service arrangements or other expense offset arrangements. Expenses net of all reductions represent the net expenses paid by the class.
H Amount does not include the portfolio activity of any underlying Fidelity Central Funds.
I Portfolio turnover rate excludes securities received or delivered in-kind.
See accompanying notes which are an integral part of the financial statements.
Materials Portfolio Class I
| Years ended February 28, | 2018 | 2017 | 2016A | 2015 | 2014 |
| Selected Per–Share Data | | | | | |
| Net asset value, beginning of period | $81.49 | $63.07 | $80.60 | $86.66 | $73.57 |
| Income from Investment Operations | | | | | |
| Net investment income (loss)B | .80 | .91 | 1.00 | .74 | .59 |
| Net realized and unrealized gain (loss) | 11.22 | 18.31 | (16.86) | 1.05 | 14.60 |
| Total from investment operations | 12.02 | 19.22 | (15.86) | 1.79 | 15.19 |
| Distributions from net investment income | (.78) | (.80) | (.77) | (.68) | (.50) |
| Distributions from net realized gain | (4.00) | – | (.91) | (7.17) | (1.60) |
| Total distributions | (4.78) | (.80) | (1.67)C | (7.85) | (2.10) |
| Redemption fees added to paid in capitalB | – | –D | –D | –D | –D |
| Net asset value, end of period | $88.73 | $81.49 | $63.07 | $80.60 | $86.66 |
| Total ReturnE | 14.97% | 30.55% | (19.79)% | 2.49% | 20.81% |
| Ratios to Average Net AssetsF,G | | | | | |
| Expenses before reductions | .79% | .79% | .78% | .78% | .81% |
| Expenses net of fee waivers, if any | .79% | .79% | .78% | .78% | .81% |
| Expenses net of all reductions | .78% | .78% | .78% | .78% | .81% |
| Net investment income (loss) | .92% | 1.25% | 1.37% | .89% | .74% |
| Supplemental Data | | | | | |
| Net assets, end of period (000 omitted) | $511,062 | $335,124 | $306,145 | $468,371 | $333,963 |
| Portfolio turnover rateH | 67% | 49%I | 64% | 76%I | 53% |
A For the year ended February 29.
B Calculated based on average shares outstanding during the period.
C Total distributions of $1.67 per share is comprised of distributions from net investment income of $.767 and distributions from net realized gain of $.906 per share.
D Amount represents less than $.005 per share.
E Total returns would have been lower if certain expenses had not been reduced during the applicable periods shown.
F Fees and expenses of any underlying Fidelity Central Funds are not included in the Fund's expense ratio. The Fund indirectly bears its proportionate share of the expenses of any underlying Fidelity Central Funds.
G Expense ratios reflect operating expenses of the class. Expenses before reductions do not reflect amounts reimbursed by the investment adviser or reductions from brokerage service arrangements or reductions from other expense offset arrangements and do not represent the amount paid by the class during periods when reimbursements or reductions occur. Expenses net of fee waivers reflect expenses after reimbursement by the investment adviser but prior to reductions from brokerage service arrangements or other expense offset arrangements. Expenses net of all reductions represent the net expenses paid by the class.
H Amount does not include the portfolio activity of any underlying Fidelity Central Funds.
I Portfolio turnover rate excludes securities received or delivered in-kind.
See accompanying notes which are an integral part of the financial statements.
Notes to Financial Statements
For the period ended February 28, 2018
1. Organization.
Materials Portfolio (the Fund) is a non-diversified fund of Fidelity Select Portfolios (the Trust) and is authorized to issue an unlimited number of shares. The Trust is registered under the Investment Company Act of 1940, as amended (the 1940 Act), as an open-end management investment company organized as a Massachusetts business trust. The Fund invests primarily in securities of companies whose principal business activities fall within specific industries. The Fund offers Class A, Class M (formerly Class T), Class C, Materials and Class I shares, each of which has equal rights as to assets and voting privileges. Each class has exclusive voting rights with respect to matters that affect that class.
After the close of business on June 24, 2016, all outstanding Class B shares were converted to Class A shares. All prior fiscal period dollar and share amounts for Class B presented in the Notes to Financial Statements are for the period March 1, 2016 through June 24, 2016.
2. Investments in Fidelity Central Funds.
The Fund invests in Fidelity Central Funds, which are open-end investment companies generally available only to other investment companies and accounts managed by the investment adviser and its affiliates. The Fund's Schedule of Investments lists each of the Fidelity Central Funds held as of period end, if any, as an investment of the Fund, but does not include the underlying holdings of each Fidelity Central Fund. As an Investing Fund, the Fund indirectly bears its proportionate share of the expenses of the underlying Fidelity Central Funds.
The Money Market Central Funds seek preservation of capital and current income and are managed by Fidelity Investments Money Management, Inc. (FIMM), an affiliate of the investment adviser. Annualized expenses of the Money Market Central Funds as of their most recent shareholder report date are less than .005%.
A complete unaudited list of holdings for each Fidelity Central Fund is available upon request or at the Securities and Exchange Commission (the SEC) website at www.sec.gov. In addition, the financial statements of the Fidelity Central Funds, which are not covered by the Fund's Report of Independent Registered Public Accounting Firm, are available on the SEC website or upon request.
3. Significant Accounting Policies.
The Fund is an investment company and applies the accounting and reporting guidance of the Financial Accounting Standards Board (FASB) Accounting Standards Codification Topic 946 Financial Services – Investments Companies. The financial statements have been prepared in conformity with accounting principles generally accepted in the United States of America (GAAP), which require management to make certain estimates and assumptions at the date of the financial statements. Actual results could differ from those estimates. Subsequent events, if any, through the date that the financial statements were issued have been evaluated in the preparation of the financial statements. The following summarizes the significant accounting policies of the Fund:
Investment Valuation. Investments are valued as of 4:00 p.m. Eastern time on the last calendar day of the period. The Board of Trustees (the Board) has delegated the day to day responsibility for the valuation of the Fund's investments to the Fair Value Committee (the Committee) established by the Fund's investment adviser. In accordance with valuation policies and procedures approved by the Board, the Fund attempts to obtain prices from one or more third party pricing vendors or brokers to value its investments. When current market prices, quotations or currency exchange rates are not readily available or reliable, investments will be fair valued in good faith by the Committee, in accordance with procedures adopted by the Board. Factors used in determining fair value vary by investment type and may include market or investment specific events. The frequency with which these procedures are used cannot be predicted and they may be utilized to a significant extent. The Committee oversees the Fund's valuation policies and procedures and reports to the Board on the Committee's activities and fair value determinations. The Board monitors the appropriateness of the procedures used in valuing the Fund's investments and ratifies the fair value determinations of the Committee.
The Fund categorizes the inputs to valuation techniques used to value its investments into a disclosure hierarchy consisting of three levels as shown below:
- Level 1 – quoted prices in active markets for identical investments
- Level 2 – other significant observable inputs (including quoted prices for similar investments, interest rates, prepayment speeds, etc.)
- Level 3 – unobservable inputs (including the Fund's own assumptions based on the best information available)
Valuation techniques used to value the Fund's investments by major category are as follows:
Equity securities, including restricted securities, for which market quotations are readily available, are valued at the last reported sale price or official closing price as reported by a third party pricing vendor on the primary market or exchange on which they are traded and are categorized as Level 1 in the hierarchy. In the event there were no sales during the day or closing prices are not available, securities are valued at the last quoted bid price or may be valued using the last available price and are generally categorized as Level 2 in the hierarchy. For foreign equity securities, when market or security specific events arise, comparisons to the valuation of American Depositary Receipts (ADRs), futures contracts, Exchange-Traded Funds (ETFs) and certain indexes as well as quoted prices for similar securities may be used and would be categorized as Level 2 in the hierarchy. Utilizing these techniques may result in transfers between Level 1 and Level 2. For equity securities, including restricted securities, where observable inputs are limited, assumptions about market activity and risk are used and these securities may be categorized as Level 3 in the hierarchy.
Investments in open-end mutual funds, including the Fidelity Central Funds, are valued at their closing net asset value (NAV) each business day and are categorized as Level 1 in the hierarchy.
Changes in valuation techniques may result in transfers in or out of an assigned level within the disclosure hierarchy. The aggregate value of investments by input level as of February 28, 2018 is included at the end of the Fund's Schedule of Investments.
Foreign Currency. The Fund may use foreign currency contracts to facilitate transactions in foreign-denominated securities. Gains and losses from these transactions may arise from changes in the value of the foreign currency or if the counterparties do not perform under the contracts' terms.
Foreign-denominated assets, including investment securities, and liabilities are translated into U.S. dollars at the exchange rates at period end. Purchases and sales of investment securities, income and dividends received and expenses denominated in foreign currencies are translated into U.S. dollars at the exchange rate in effect on the transaction date.
The effects of exchange rate fluctuations on investments are included with the net realized and unrealized gain (loss) on investment securities. Other foreign currency transactions resulting in realized and unrealized gain (loss) are disclosed separately.
Investment Transactions and Income. For financial reporting purposes, the Fund's investment holdings and NAV include trades executed through the end of the last business day of the period. The NAV per share for processing shareholder transactions is calculated as of the close of business of the New York Stock Exchange (NYSE), normally 4:00 p.m. Eastern time and includes trades executed through the end of the prior business day. Gains and losses on securities sold are determined on the basis of identified cost and includes proceeds received from litigation. Dividend income is recorded on the ex-dividend date, except for certain dividends from foreign securities where the ex-dividend date may have passed, which are recorded as soon as the Fund is informed of the ex-dividend date. Non-cash dividends included in dividend income, if any, are recorded at the fair market value of the securities received. Income and capital gain distributions from Fidelity Central Funds, if any, are recorded on the ex-dividend date. Certain distributions received by the Fund represent a return of capital or capital gain. The Fund determines the components of these distributions subsequent to the ex-dividend date, based upon receipt of tax filings or other correspondence relating to the underlying investment. These distributions are recorded as a reduction of cost of investments and/or as a realized gain. Investment income is recorded net of foreign taxes withheld where recovery of such taxes is uncertain.
Class Allocations and Expenses. Investment income, realized and unrealized capital gains and losses, common expenses of the Fund, and certain fund-level expense reductions, if any, are allocated daily on a pro-rata basis to each class based on the relative net assets of each class to the total net assets of the Fund. Each class differs with respect to transfer agent and distribution and service plan fees incurred. Certain expense reductions may also differ by class. For the reporting period, the allocated portion of income and expenses to each class as a percent of its average net assets may vary due to the timing of recording these transactions in relation to fluctuating net assets of the classes. Expenses directly attributable to a fund are charged to that fund. Expenses attributable to more than one fund are allocated among the respective funds on the basis of relative net assets or other appropriate methods. Expense estimates are accrued in the period to which they relate and adjustments are made when actual amounts are known.
Deferred Trustee Compensation. Under a Deferred Compensation Plan (the Plan), independent Trustees may elect to defer receipt of a portion of their annual compensation. Deferred amounts are invested in a cross-section of Fidelity funds, are marked-to-market and remain in the Fund until distributed in accordance with the Plan. The investment of deferred amounts and the offsetting payable to the Trustees are included in the accompanying Statement of Assets and Liabilities.
Income Tax Information and Distributions to Shareholders. Each year, the Fund intends to qualify as a regulated investment company under Subchapter M of the Internal Revenue Code, including distributing substantially all of its taxable income and realized gains. As a result, no provision for U.S. Federal income taxes is required. As of February 28, 2018, the Fund did not have any unrecognized tax benefits in the financial statements; nor is the Fund aware of any tax positions for which it is reasonably possible that the total amounts of unrecognized tax benefits will significantly change in the next twelve months. The Fund files a U.S. federal tax return, in addition to state and local tax returns as required. The Fund's federal income tax returns are subject to examination by the Internal Revenue Service (IRS) for a period of three fiscal years after they are filed. State and local tax returns may be subject to examination for an additional fiscal year depending on the jurisdiction. Foreign taxes are provided for based on the Fund's understanding of the tax rules and rates that exist in the foreign markets in which it invests.
Distributions are declared and recorded on the ex-dividend date. Income dividends and capital gain distributions are declared separately for each class. Income and capital gain distributions are determined in accordance with income tax regulations, which may differ from GAAP. In addition, the Fund claimed a portion of the payment made to redeeming shareholders as a distribution for income tax purposes.
Capital accounts within the financial statements are adjusted for permanent book-tax differences. These adjustments have no impact on net assets or the results of operations. Capital accounts are not adjusted for temporary book-tax differences which will reverse in a subsequent period.
Book-tax differences are primarily due to foreign currency transactions, deferred trustees compensation, partnerships, capital loss carryforwards and losses deferred due to wash sales.
As of period end, the cost and unrealized appreciation (depreciation) in securities, and derivatives if applicable, for federal income tax purposes were as follows:
| Gross unrealized appreciation | $412,959,681 |
| Gross unrealized depreciation | (34,010,031) |
| Net unrealized appreciation (depreciation) | $378,949,650 |
| Tax Cost | $1,527,107,884 |
The tax-based components of distributable earnings as of period end were as follows:
| Undistributed ordinary income | $2,171,471 |
| Undistributed long-term capital gain | $85,810,060 |
| Net unrealized appreciation (depreciation) on securities and other investments | $378,947,362 |
Capital loss carryforwards are only available to offset future capital gains of the Fund to the extent provided by regulations and may be limited. Under the Regulated Investment Company Modernization Act of 2010 (the Act), the Fund is permitted to carry forward capital losses incurred in taxable years beginning after December 22, 2010 for an unlimited period and such capital losses are required to be used prior to any losses that expire. The capital loss carryforward information presented below, including any applicable limitation, is estimated as of fiscal period end and is subject to adjustment.
| Fiscal year of expiration | |
| 2019 | $(80,787) |
The tax character of distributions paid was as follows:
| | February 28, 2018 | February 28, 2017 |
| Ordinary Income | $18,045,341 | $ 13,547,763 |
| Long-term Capital Gains | 75,974,238 | – |
| Total | $94,019,579 | $ 13,547,763 |
4. Purchases and Sales of Investments.
Purchases and sales of securities, other than short-term securities, aggregated $1,239,934,125 and $1,125,370,092, respectively.
5. Fees and Other Transactions with Affiliates.
Management Fee. Fidelity SelectCo, LLC (the investment adviser) and its affiliates provide the Fund with investment management related services for which the Fund pays a monthly management fee. The management fee is the sum of an individual fund fee rate that is based on an annual rate of .30% of the Fund's average net assets and an annualized group fee rate that averaged .24% during the period. The group fee rate is based upon the average net assets of all the mutual funds advised by Fidelity Management & Research Company (FMR) and the investment adviser. The group fee rate decreases as assets under management increase and increases as assets under management decrease. For the reporting period, the total annual management fee rate was .54% of the Fund's average net assets.
Distribution and Service Plan Fees. In accordance with Rule 12b-1 of the 1940 Act, the Fund has adopted separate Distribution and Service Plans for each class of shares. Certain classes pay Fidelity Distributors Corporation (FDC), an affiliate of the investment adviser, separate Distribution and Service Fees, each of which is based on an annual percentage of each class' average net assets. In addition, FDC may pay financial intermediaries for selling shares of the Fund and providing shareholder support services. For the period, the Distribution and Service Fee rates, total fees and amounts retained by FDC were as follows:
| | Distribution Fee | Service Fee | Total Fees | Retained by FDC |
| Class A | -% | .25% | $496,804 | $8,089 |
| Class M | .25% | .25% | 196,406 | – |
| Class C | .75% | .25% | 841,828 | 108,388 |
| | | | $1,535,038 | $116,477 |
Sales Load. FDC may receive a front-end sales charge of up to 5.75% for selling Class A shares and 3.50% for selling Class M shares, some of which is paid to financial intermediaries for selling shares of the Fund. Depending on the holding period, FDC may receive contingent deferred sales charges levied on Class A, Class M and Class C redemptions. The deferred sales charges are 1.00% for Class C shares, 1.00% for certain purchases of Class A shares and .25% for certain purchases of Class M shares.
For the period, sales charge amounts retained by FDC were as follows:
| | Retained by FDC |
| Class A | $90,137 |
| Class M | 9,649 |
| Class C(a) | 8,057 |
| | $107,843 |
(a) When Class C shares are initially sold, FDC pays commissions from its own resources to financial intermediaries through which the sales are made.
Transfer Agent Fees. Fidelity Investments Institutional Operations Company, Inc., (FIIOC), an affiliate of the investment adviser, is the transfer, dividend disbursing and shareholder servicing agent for each class of the Fund. FIIOC receives account fees and asset-based fees that vary according to the account size and type of account of the shareholders of the respective classes of the Fund. FIIOC pays for typesetting, printing and mailing of shareholder reports, except proxy statements.
For the period, transfer agent fees for each class were as follows:
| | Amount | % of Class-Level Average Net Assets |
| Class A | $436,003 | .22 |
| Class M | 101,499 | .26 |
| Class C | 186,332 | .22 |
| Materials | 1,835,081 | .20 |
| Class I | 843,145 | .19 |
| | $3,402,060 | |
Accounting and Security Lending Fees. Fidelity Service Company, Inc. (FSC), an affiliate of the investment adviser, maintains the Fund's accounting records. The accounting fee is based on the level of average net assets for each month. Under a separate contract, FSC administers the security lending program. The security lending fee is based on the number and duration of lending transactions.
Brokerage Commissions. The Fund placed a portion of its portfolio transactions with brokerage firms which are affiliates of the investment adviser. Brokerage commissions are included in net realized gain (loss) and change in net unrealized appreciation (depreciation) in the Statement of Operations. The commissions paid to these affiliated firms were $35,962 for the period.
Interfund Lending Program. Pursuant to an Exemptive Order issued by the SEC, the Fund, along with other registered investment companies having management contracts with Fidelity Management & Research Company (FMR) or other affiliated entities of FMR, may participate in an interfund lending program. This program provides an alternative credit facility allowing the funds to borrow from, or lend money to, other participating affiliated funds. At period end, there were no interfund loans outstanding. The Fund's activity in this program during the period for which loans were outstanding was as follows:
| Borrower or Lender | Average Loan Balance | Weighted Average Interest Rate | Interest Expense |
| Borrower | $7,691,000 | 1.34% | $570 |
Interfund Trades. The Fund may purchase from or sell securities to other Fidelity Funds under procedures adopted by the Board. The procedures have been designed to ensure these interfund trades are executed in accordance with Rule 17a-7 of the 1940 Act. Interfund trades are included within the respective purchases and sales amounts shown in the Purchases and Sales of Investments note.
Prior Fiscal Year Redemptions In-Kind. During the prior period, 845,013 shares of Materials Portfolio held by an affiliated entity were redeemed in-kind for investments and cash with a value of $60,325,459. The Fund had a net realized gain of $17,720,821 on investments delivered through in-kind redemptions. The amount of the in-kind redemptions is included in share transactions in the accompanying Statement of Changes in Net Assets as well as the Notes to Financial Statements. Materials Portfolio recognized no gain or loss for federal income tax purposes.
6. Committed Line of Credit.
The Fund participates with other funds managed by the investment adviser or an affiliate in a $4.25 billion credit facility (the "line of credit") to be utilized for temporary or emergency purposes to fund shareholder redemptions or for other short-term liquidity purposes. The Fund has agreed to pay commitment fees on its pro-rata portion of the line of credit, which amounted to $4,956 and is reflected in Miscellaneous expenses on the Statement of Operations. During the period, the Fund did not borrow on this line of credit.
7. Security Lending.
The Fund lends portfolio securities through a lending agent from time to time in order to earn additional income. On the settlement date of the loan, the Fund receives collateral (in the form of U.S. Treasury obligations, letters of credit and/or cash) against the loaned securities and maintains collateral in an amount not less than 100% of the market value of the loaned securities during the period of the loan. The market value of the loaned securities is determined at the close of business of the Fund and any additional required collateral is delivered to the Fund on the next business day. The Fund or borrower may terminate the loan at any time, and if the borrower defaults on its obligation to return the securities loaned because of insolvency or other reasons, the Fund may apply collateral received from the borrower against the obligation. The Fund may experience delays and costs in recovering the securities loaned. Any cash collateral received is invested in the Fidelity Securities Lending Cash Central Fund. The value of loaned securities and cash collateral at period end are disclosed on the Fund's Statement of Assets and Liabilities. Security lending income represents the income earned on investing cash collateral, less rebates paid to borrowers and any lending agent fees associated with the loan, plus any premium payments received for lending certain types of securities. Security lending income is presented in the Statement of Operations as a component of income from Fidelity Central Funds. Total security lending income during the period amounted to $58,427.
8. Expense Reductions.
Commissions paid to certain brokers with whom the investment adviser, or its affiliates, places trades on behalf of the Fund include an amount in addition to trade execution, which may be rebated back to the Fund to offset certain expenses. This amount totaled $51,367 for the period.
In addition, during the period the investment adviser reimbursed and/or waived a portion of fund-level operating expenses in the amount of $15,608.
9. Distributions to Shareholders.
Distributions to shareholders of each class were as follows:
| | Year ended
February 28, 2018 | Year ended
February 28, 2017 |
| From net investment income | | |
| Class A | $1,122,417 | $1,672,756 |
| Class M | 111,276 | 205,222 |
| Class C | 21,712 | 195,843 |
| Materials | 8,651,332 | 8,304,133 |
| Class I | 4,018,332 | 3,169,809 |
| Total | $13,925,069 | $13,547,763 |
| From net realized gain | | |
| Class A | $8,907,618 | $– |
| Class M | 1,755,252 | – |
| Class C | 3,835,607 | – |
| Materials | 44,912,504 | – |
| Class I | 20,683,529 | – |
| Total | $80,094,510 | $– |
10. Share Transactions.
Share transactions for each class were as follows and may contain automatic conversions between classes or exchanges between affiliated funds:
| | Shares | Shares | Dollars | Dollars |
| | Year ended February 28, 2018 | Year ended February 28, 2017 | Year ended February 28, 2018 | Year ended February 28, 2017 |
| Class A | | | | |
| Shares sold | 680,092 | 902,923 | $58,507,834 | $67,495,419 |
| Reinvestment of distributions | 113,874 | 20,549 | 9,780,873 | 1,575,920 |
| Shares redeemed | (1,331,034) | (1,326,009) | (112,075,163) | (96,308,599) |
| Net increase (decrease) | (537,068) | (402,537) | $(43,786,456) | $(27,237,260) |
| Class M | | | | |
| Shares sold | 208,725 | 158,674 | $17,686,478 | $11,939,333 |
| Reinvestment of distributions | 21,925 | 2,663 | 1,863,640 | 202,830 |
| Shares redeemed | (281,358) | (135,543) | (23,392,261) | (9,849,995) |
| Net increase (decrease) | (50,708) | 25,794 | $(3,842,143) | $2,292,168 |
| Class B | | | | |
| Shares sold | – | 325 | $– | $22,444 |
| Shares redeemed | – | (49,631) | – | (3,403,614) |
| Net increase (decrease) | – | (49,306) | $– | $(3,381,170) |
| Class C | | | | |
| Shares sold | 181,208 | 197,093 | $15,047,250 | $14,487,205 |
| Reinvestment of distributions | 44,268 | 2,419 | 3,679,464 | 179,992 |
| Shares redeemed | (241,477) | (275,454) | (20,012,880) | (19,415,602) |
| Net increase (decrease) | (16,001) | (75,942) | $(1,286,166) | $(4,748,405) |
| Materials | | | | |
| Shares sold | 3,151,404 | 2,367,980 | $281,933,571 | $176,958,165 |
| Reinvestment of distributions | 582,560 | 100,563 | 50,400,849 | 7,743,369 |
| Shares redeemed | (2,803,708) | (2,924,430) | (242,311,502) | (214,559,584) |
| Net increase (decrease) | 930,256 | (455,887) | $90,022,918 | $(29,858,050) |
| Class I | | | | |
| Shares sold | 2,807,810 | 1,754,029 | $243,189,109 | $130,244,335 |
| Reinvestment of distributions | 269,534 | 37,780 | 23,282,439 | 2,903,738 |
| Shares redeemed | (1,429,768) | (2,533,375)(a) | (124,602,270) | (183,475,336)(a) |
| Net increase (decrease) | 1,647,576 | (741,566) | $141,869,278 | $(50,327,263) |
(a) Amount includes in-kind redemptions (see the Prior Fiscal Year Redemptions In-Kind note for additional details).
11. Other.
The Fund's organizational documents provide former and current trustees and officers with a limited indemnification against liabilities arising in connection with the performance of their duties to the Fund. In the normal course of business, the Fund may also enter into contracts that provide general indemnifications. The Fund's maximum exposure under these arrangements is unknown as this would be dependent on future claims that may be made against the Fund. The risk of material loss from such claims is considered remote.
Fidelity Advisor® Telecommunications Fund
Performance: The Bottom Line
Average annual total return reflects the change in the value of an investment, assuming reinvestment of distributions from dividend income and capital gains (the profits earned upon the sale of securities that have grown in value, if any) and assuming a constant rate of performance each year. The hypothetical investment and the average annual total returns do not reflect the deduction of taxes that a shareholder would pay on fund distributions or the redemption of fund shares. During periods of reimbursement by Fidelity, a fund’s total return will be greater than it would be had the reimbursement not occurred. How a fund did yesterday is no guarantee of how it will do tomorrow.
Average Annual Total Returns
| For the periods ended February 28, 2018 | Past 1 year | Past 5 years | Past 10 years |
| Class A (incl. 5.75% sales charge) | (9.57)% | 6.81% | 6.13% |
| Class M (incl. 3.50% sales charge) | (7.75)% | 6.97% | 6.06% |
| Class C (incl. contingent deferred sales charge) | (5.54)% | 7.31% | 5.99% |
| Class I | (3.75)% | 8.42% | 7.09% |
Class C shares' contingent deferred sales charges included in the past one year, past five years and past ten years total return figures are 1%, 0% and 0%, respectively.
$10,000 Over 10 Years
Let's say hypothetically that $10,000 was invested in Fidelity Advisor® Telecommunications Fund - Class A on February 29, 2008, and the current 5.75% sales charge was paid.
The chart shows how the value of your investment would have changed, and also shows how the S&P 500® Index performed over the same period.
| Period Ending Values |
| $18,135 | Fidelity Advisor® Telecommunications Fund - Class A |
| $25,307 | S&P 500® Index |
Fidelity Advisor® Telecommunications Fund
Management's Discussion of Fund Performance
Market Recap: U.S. equities gained 17.10% for the 12 months ending February 28, 2018, as the S&P 500
® index moved steadily higher throughout 2017 and into 2018 until sharply reversing course in February. The drop was in stark contrast to the low volatility seen throughout 2017, along with consumer sentiment and other market indicators that stayed positive. Investors remained decidedly upbeat as the calendar turned, and the index rose 5.73% in January. February was a decidedly different story, though, as volatility spiked amid fear that rising inflation and the potential for the economy to overheat would prompt the U.S. Federal Reserve to pick up the pace of interest rate hikes. The index returned -3.69% for the month, its first negative result since October 2016. For the full 12 months, growth stocks handily topped value, while large-caps bested small-caps. By sector, information technology fared best by far, gaining 36% amid strong earnings growth from several major index constituents. Consumer discretionary (+22%) also stood out, driven by retailers. Financials added 20%, riding the uptick in bond yields. Materials and industrials rose about 16% each, boosted by higher demand, especially from China. Conversely, notable laggards included the defensive telecommunication services (-5%) and utilities (-2%) sectors, while rising rates held back real estate (-3%).
Comments from Portfolio Manager Matthew Drukker: For the year, the fund's share classes (excluding sales charges, if applicable) returned roughly between -4% and -5%, outpacing the -7.93% return of the sector benchmark, the MSCI U.S. IMI Telecommunication Services 25/50 Index. However, the fund’s results trailed the broad-market S&P 500
®. Investors generally shunned telecommunication services stocks for most of the reporting period, instead favoring higher-growth stocks. Versus the MSCI benchmark, favorable stock selection largely drove the fund’s outperformance. Choices in the integrated telecommunication services and wireless telecommunication services segments added value, as did underweighting two poor-performing index components here: Windstream Holdings (-78%) and NII Holdings (-88%), respectively. I eliminated NII from the fund this period. Elsewhere, a non-index position in wireless tower operator American Tower worked well, as the fund’s position rose 23% this period. Conversely, an underweighting in the relatively strong-performing alternative carriers segment detracted, especially avoiding index constituent PDVWireless (25%) and underweighting Orbcomm (21%). In addition, an out-of-MSCI-benchmark stake in application software stocks proved disappointing. A small position in Synchronoss Technologies returned -52% for the fund, and I eliminated this position during the period.
The views expressed above reflect those of the portfolio manager(s) only through the end of the period as stated on the cover of this report and do not necessarily represent the views of Fidelity or any other person in the Fidelity organization. Any such views are subject to change at any time based upon market or other conditions and Fidelity disclaims any responsibility to update such views. These views may not be relied on as investment advice and, because investment decisions for a Fidelity fund are based on numerous factors, may not be relied on as an indication of trading intent on behalf of any Fidelity fund.
Notes to shareholders: On December 8, 2017, shareholders approved proposals from the Board of Trustees to eliminate each sector/industry fund's fundamental “invests primarily” policy and to modify the fundamental concentration policy for certain funds. The changes took effect on January 1, 2018, and do not impact how the funds are managed.
Telecommunications Portfolio
Investment Summary (Unaudited)
Top Ten Stocks as of February 28, 2018
| | % of fund's net assets |
| Verizon Communications, Inc. | 20.9 |
| AT&T, Inc. | 11.3 |
| T-Mobile U.S., Inc. | 7.7 |
| CenturyLink, Inc. | 5.4 |
| Zayo Group Holdings, Inc. | 3.9 |
| Gci Liberty, Inc. Class A | 3.7 |
| Vonage Holdings Corp. | 3.5 |
| Cogent Communications Group, Inc. | 3.3 |
| Telephone & Data Systems, Inc. | 3.0 |
| Iridium Communications, Inc. | 2.9 |
| | 65.6 |
Top Industries (% of fund's net assets)
| As of February 28, 2018 |
| | Diversified Telecommunication Services | 63.1% |
| | Wireless Telecommunication Services | 18.0% |
| | Media | 12.4% |
| | Internet Software & Services | 2.2% |
| | Equity Real Estate Investment Trusts (Reits) | 2.0% |
| | All Others* | 2.3% |

* Includes short-term investments and net other assets (liabilities).
Telecommunications Portfolio
Schedule of Investments February 28, 2018
Showing Percentage of Net Assets
| Common Stocks - 99.2% | | | |
| | | Shares | Value |
| Communications Equipment - 0.8% | | | |
| Communications Equipment - 0.8% | | | |
| Quantenna Communications, Inc. (a) | | 218,900 | $3,009,875 |
| Diversified Telecommunication Services - 63.1% | | | |
| Alternative Carriers - 21.3% | | | |
| CenturyLink, Inc. | | 1,099,140 | 19,421,804 |
| Cogent Communications Group, Inc. | | 277,139 | 11,875,406 |
| Globalstar, Inc. (a)(b) | | 3,109,948 | 2,956,317 |
| Iliad SA | | 11,784 | 2,762,883 |
| Iridium Communications, Inc. (a)(b) | | 904,911 | 10,587,459 |
| ORBCOMM, Inc. (a) | | 231,949 | 2,412,270 |
| Vonage Holdings Corp. (a) | | 1,244,271 | 12,629,351 |
| Zayo Group Holdings, Inc. (a) | | 397,100 | 14,236,035 |
| | | | 76,881,525 |
| Integrated Telecommunication Services - 41.8% | | | |
| Altice U.S.A., Inc. Class A (b) | | 28,800 | 524,160 |
| AT&T, Inc. | | 1,120,220 | 40,663,986 |
| Atlantic Tele-Network, Inc. | | 91,000 | 5,450,900 |
| Cincinnati Bell, Inc. (a) | | 546,502 | 8,826,007 |
| Consolidated Communications Holdings, Inc. (b) | | 241,900 | 2,796,364 |
| Frontier Communications Corp. (b) | | 246,575 | 1,733,422 |
| Gci Liberty, Inc. Class A (a) | | 344,343 | 13,239,988 |
| Verizon Communications, Inc. | | 1,579,697 | 75,414,733 |
| Windstream Holdings, Inc. (b) | | 1,119,530 | 1,768,857 |
| | | | 150,418,417 |
|
| TOTAL DIVERSIFIED TELECOMMUNICATION SERVICES | | | 227,299,942 |
|
| Electronic Equipment & Components - 1.2% | | | |
| Electronic Equipment & Instruments - 0.3% | | | |
| ADT, Inc. (a) | | 98,500 | 1,040,160 |
| Electronic Manufacturing Services - 0.9% | | | |
| Fabrinet | | 104,500 | 3,150,675 |
|
| TOTAL ELECTRONIC EQUIPMENT & COMPONENTS | | | 4,190,835 |
|
| Equity Real Estate Investment Trusts (REITs) - 2.0% | | | |
| Specialized REITs - 2.0% | | | |
| American Tower Corp. | | 50,690 | 7,062,638 |
| Internet Software & Services - 2.2% | | | |
| Internet Software & Services - 2.2% | | | |
| Akamai Technologies, Inc. (a) | | 29,200 | 1,969,832 |
| Gogo, Inc. (a)(b) | | 306,047 | 2,778,907 |
| Pandora Media, Inc. (a)(b) | | 739,000 | 3,258,990 |
| | | | 8,007,729 |
| Media - 12.4% | | | |
| Cable & Satellite - 9.7% | | | |
| Altice NV Class A (a)(b) | | 288,548 | 2,752,491 |
| Comcast Corp. Class A | | 286,100 | 10,359,681 |
| DISH Network Corp. Class A (a) | | 39,900 | 1,663,431 |
| Liberty Broadband Corp. Class A (a) | | 93,100 | 8,135,078 |
| Liberty Global PLC: | | | |
| Class C (a) | | 293,936 | 8,826,898 |
| LiLAC Class C (a)(c) | | 92,834 | 1 |
| Liberty Latin America Ltd. (a) | | 88,834 | 1,816,655 |
| Megacable Holdings S.A.B. de CV unit | | 346,100 | 1,531,968 |
| | | | 35,086,203 |
| Movies & Entertainment - 2.7% | | | |
| Lions Gate Entertainment Corp. Class B | | 12,603 | 338,265 |
| Time Warner, Inc. | | 98,800 | 9,184,448 |
| | | | 9,522,713 |
|
| TOTAL MEDIA | | | 44,608,916 |
|
| Wireless Telecommunication Services - 17.5% | | | |
| Wireless Telecommunication Services - 17.5% | | | |
| Millicom International Cellular SA | | 24,100 | 1,595,179 |
| Shenandoah Telecommunications Co. | | 193,767 | 6,355,558 |
| Sprint Corp. (a)(b) | | 1,358,885 | 7,052,613 |
| T-Mobile U.S., Inc. (a) | | 459,597 | 27,856,174 |
| Telephone & Data Systems, Inc. | | 388,464 | 10,892,531 |
| U.S. Cellular Corp. (a) | | 164,300 | 6,340,337 |
| VimpelCom Ltd. sponsored ADR | | 1,019,200 | 2,945,488 |
| | | | 63,037,880 |
| TOTAL COMMON STOCKS | | | |
| (Cost $312,680,019) | | | 357,217,815 |
|
| Nonconvertible Preferred Stocks - 0.5% | | | |
| Wireless Telecommunication Services - 0.5% | | | |
| Wireless Telecommunication Services - 0.5% | | | |
| TIM Participacoes SA sponsored ADR | | | |
| (Cost $1,861,185) | | 91,900 | 1,955,632 |
|
| Money Market Funds - 8.7% | | | |
| Fidelity Cash Central Fund, 1.41% (d) | | 1,837,723 | 1,838,091 |
| Fidelity Securities Lending Cash Central Fund 1.42% (d)(e) | | 29,460,348 | 29,463,294 |
| TOTAL MONEY MARKET FUNDS | | | |
| (Cost $31,300,258) | | | 31,301,385 |
| TOTAL INVESTMENT IN SECURITIES - 108.4% | | | |
| (Cost $345,841,462) | | | 390,474,832 |
| NET OTHER ASSETS (LIABILITIES) - (8.4)% | | | (30,175,304) |
| NET ASSETS - 100% | | | $360,299,528 |
Legend
(a) Non-income producing
(b) Security or a portion of the security is on loan at period end.
(c) Level 3 security
(d) Affiliated fund that is generally available only to investment companies and other accounts managed by Fidelity Investments. The rate quoted is the annualized seven-day yield of the fund at period end. A complete unaudited listing of the fund's holdings as of its most recent quarter end is available upon request. In addition, each Fidelity Central Fund's financial statements, which are not covered by the Fund's Report of Independent Registered Public Accounting Firm, are available on the SEC's website or upon request.
(e) Investment made with cash collateral received from securities on loan.
Affiliated Central Funds
Information regarding fiscal year to date income earned by the Fund from investments in Fidelity Central Funds is as follows:
| Fund | Income earned |
| Fidelity Cash Central Fund | $16,867 |
| Fidelity Securities Lending Cash Central Fund | 1,024,632 |
| Total | $1,041,499 |
Amounts in the income column in the above table include any capital gain distributions from underlying funds, which are presented in the corresponding line-item in the Statement of Operations if applicable.
Investment Valuation
The following is a summary of the inputs used, as of February 28, 2018, involving the Fund's assets and liabilities carried at fair value. The inputs or methodology used for valuing securities may not be an indication of the risk associated with investing in those securities. For more information on valuation inputs, and their aggregation into the levels used below, please refer to the Investment Valuation section in the accompanying Notes to Financial Statements.
| | Valuation Inputs at Reporting Date: |
| Description | Total | Level 1 | Level 2 | Level 3 |
| Investments in Securities: | | | | |
| Common Stocks | $357,217,815 | $351,702,440 | $5,515,374 | $1 |
| Nonconvertible Preferred Stocks | 1,955,632 | 1,955,632 | -- | -- |
| Money Market Funds | 31,301,385 | 31,301,385 | -- | -- |
| Total Investments in Securities: | $390,474,832 | $384,959,457 | $5,515,374 | $1 |
The following is a summary of transfers between Level 1 and Level 2 for the period ended February 28, 2018. Transfers are assumed to have occurred at the beginning of the period, and are primarily attributable to the valuation techniques used for foreign equity securities, as discussed in the accompanying Notes to Financial Statements:
| Transfers | Total |
| Level 1 to Level 2 | $15,663,328 |
| Level 2 to Level 1 | $0 |
See accompanying notes which are an integral part of the financial statements.
Telecommunications Portfolio
Financial Statements
Statement of Assets and Liabilities
| | | February 28, 2018 |
| Assets | | |
Investment in securities, at value (including securities loaned of $27,731,294) — See accompanying schedule:
Unaffiliated issuers (cost $314,541,204) | $359,173,447 | |
| Fidelity Central Funds (cost $31,300,258) | 31,301,385 | |
| Total Investment in Securities (cost $345,841,462) | | $390,474,832 |
| Receivable for fund shares sold | | 117,779 |
| Distributions receivable from Fidelity Central Funds | | 58,283 |
| Prepaid expenses | | 1,443 |
| Other receivables | | 25,149 |
| Total assets | | 390,677,486 |
| Liabilities | | |
| Payable for fund shares redeemed | $614,329 | |
| Accrued management fee | 167,382 | |
| Distribution and service plan fees payable | 13,209 | |
| Other affiliated payables | 75,626 | |
| Other payables and accrued expenses | 52,854 | |
| Collateral on securities loaned | 29,454,558 | |
| Total liabilities | | 30,377,958 |
| Net Assets | | $360,299,528 |
| Net Assets consist of: | | |
| Paid in capital | | $312,723,185 |
| Undistributed net investment income | | 1,308,030 |
| Accumulated undistributed net realized gain (loss) on investments and foreign currency transactions | | 1,638,240 |
| Net unrealized appreciation (depreciation) on investments and assets and liabilities in foreign currencies | | 44,630,073 |
| Net Assets | | $360,299,528 |
| Calculation of Maximum Offering Price | | |
| Class A: | | |
| Net Asset Value and redemption price per share ($17,816,126 ÷ 320,574 shares) | | $55.58 |
| Maximum offering price per share (100/94.25 of $55.58) | | $58.97 |
| Class M: | | |
| Net Asset Value and redemption price per share ($4,847,326 ÷ 87,645 shares) | | $55.31 |
| Maximum offering price per share (100/96.50 of $55.31) | | $57.32 |
| Class C: | | |
| Net Asset Value and offering price per share ($8,395,717 ÷ 151,859 shares)(a) | | $55.29 |
| Telecommunications: | | |
| Net Asset Value, offering price and redemption price per share ($320,908,125 ÷ 5,742,379 shares) | | $55.88 |
| Class I: | | |
| Net Asset Value, offering price and redemption price per share ($8,332,234 ÷ 149,485 shares) | | $55.74 |
(a) Redemption price per share is equal to net asset value less any applicable contingent deferred sales charge.
See accompanying notes which are an integral part of the financial statements.
Statement of Operations
| | | Year ended February 28, 2018 |
| Investment Income | | |
| Dividends | | $11,959,525 |
| Income from Fidelity Central Funds (including $1,024,632 from security lending) | | 1,041,499 |
| Total income | | 13,001,024 |
| Expenses | | |
| Management fee | $2,589,708 | |
| Transfer agent fees | 933,897 | |
| Distribution and service plan fees | 191,805 | |
| Accounting and security lending fees | 192,923 | |
| Custodian fees and expenses | 17,509 | |
| Independent trustees' fees and expenses | 11,267 | |
| Registration fees | 88,653 | |
| Audit | 63,220 | |
| Legal | 7,827 | |
| Interest | 11,274 | |
| Miscellaneous | 25,911 | |
| Total expenses before reductions | 4,133,994 | |
| Expense reductions | (77,723) | 4,056,271 |
| Net investment income (loss) | | 8,944,753 |
| Realized and Unrealized Gain (Loss) | | |
| Net realized gain (loss) on: | | |
| Investment securities: | | |
| Unaffiliated issuers | 61,421,052 | |
| Fidelity Central Funds | 127 | |
| Foreign currency transactions | (6,535) | |
| Total net realized gain (loss) | | 61,414,644 |
| Change in net unrealized appreciation (depreciation) on: | | |
| Investment securities: | | |
| Unaffiliated issuers | (86,609,104) | |
| Fidelity Central Funds | (9,530) | |
| Assets and liabilities in foreign currencies | 132 | |
| Total change in net unrealized appreciation (depreciation) | | (86,618,502) |
| Net gain (loss) | | (25,203,858) |
| Net increase (decrease) in net assets resulting from operations | | $(16,259,105) |
See accompanying notes which are an integral part of the financial statements.
Statement of Changes in Net Assets
| | Year ended February 28, 2018 | Year ended February 28, 2017 |
| Increase (Decrease) in Net Assets | | |
| Operations | | |
| Net investment income (loss) | $8,944,753 | $13,937,211 |
| Net realized gain (loss) | 61,414,644 | 61,532,842 |
| Change in net unrealized appreciation (depreciation) | (86,618,502) | 57,549,557 |
| Net increase (decrease) in net assets resulting from operations | (16,259,105) | 133,019,610 |
| Distributions to shareholders from net investment income | (9,787,526) | (13,294,404) |
| Distributions to shareholders from net realized gain | (66,377,876) | (31,675,318) |
| Total distributions | (76,165,402) | (44,969,722) |
| Share transactions - net increase (decrease) | (304,973,804) | (55,515,132) |
| Redemption fees | – | 54,102 |
| Total increase (decrease) in net assets | (397,398,311) | 32,588,858 |
| Net Assets | | |
| Beginning of period | 757,697,839 | 725,108,981 |
| End of period | $360,299,528 | $757,697,839 |
| Other Information | | |
| Undistributed net investment income end of period | $1,308,030 | $2,151,795 |
See accompanying notes which are an integral part of the financial statements.
Financial Highlights
Telecommunications Portfolio Class A
| Years ended February 28, | 2018 | 2017 | 2016 A | 2015 | 2014 |
| Selected Per–Share Data | | | | | |
| Net asset value, beginning of period | $69.61 | $62.32 | $63.26 | $58.71 | $51.58 |
| Income from Investment Operations | | | | | |
| Net investment income (loss)B | 1.05 | .88 | .81 | .76 | 1.76C |
| Net realized and unrealized gain (loss) | (3.38) | 10.68 | (.76) | 5.83 | 6.48 |
| Total from investment operations | (2.33) | 11.56 | .05 | 6.59 | 8.24 |
| Distributions from net investment income | (1.31) | (1.11) | (.54) | (2.04) | (1.11) |
| Distributions from net realized gain | (10.39) | (3.16) | (.45) | – | (.01) |
| Total distributions | (11.70) | (4.27) | (.99) | (2.04) | (1.11)D |
| Redemption fees added to paid in capitalB | – | –E | –E | –E | –E |
| Net asset value, end of period | $55.58 | $69.61 | $62.32 | $63.26 | $58.71 |
| Total ReturnF,G | (4.06)% | 18.65% | .16% | 11.54% | 16.00% |
| Ratios to Average Net AssetsH,I | | | | | |
| Expenses before reductions | 1.14% | 1.14% | 1.15% | 1.15% | 1.18% |
| Expenses net of fee waivers, if any | 1.14% | 1.14% | 1.15% | 1.15% | 1.18% |
| Expenses net of all reductions | 1.12% | 1.12% | 1.15% | 1.15% | 1.15% |
| Net investment income (loss) | 1.59% | 1.28% | 1.33% | 1.26% | 3.08%C |
| Supplemental Data | | | | | |
| Net assets, end of period (000 omitted) | $17,816 | $31,966 | $13,032 | $11,052 | $7,712 |
| Portfolio turnover rateJ | 66% | 105%K | 51% | 94%K | 111% |
A For the year ended February 29.
B Calculated based on average shares outstanding during the period.
C Net Investment income per share reflects a large, non-recurring dividend which amounted to $.95 per share. Excluding this non-recurring dividend, the ratio of net investment income (loss) to average net assets would have been 1.43%.
D Total distributions of $1.11 per share is comprised of distributions from net investment income of $1.106 and distributions from net realized gain of $.005 per share.
E Amount represents less than $.005 per share.
F Total returns would have been lower if certain expenses had not been reduced during the applicable periods shown.
G Total returns do not include the effect of the sales charges.
H Fees and expenses of any underlying Fidelity Central Funds are not included in the Fund's expense ratio. The Fund indirectly bears its proportionate share of the expenses of any underlying Fidelity Central Funds.
I Expense ratios reflect operating expenses of the class. Expenses before reductions do not reflect amounts reimbursed by the investment adviser or reductions from brokerage service arrangements or reductions from other expense offset arrangements and do not represent the amount paid by the class during periods when reimbursements or reductions occur. Expenses net of fee waivers reflect expenses after reimbursement by the investment adviser but prior to reductions from brokerage service arrangements or other expense offset arrangements. Expenses net of all reductions represent the net expenses paid by the class.
J Amount does not include the portfolio activity of any underlying Fidelity Central Funds.
K Portfolio turnover rate excludes securities received or delivered in-kind.
See accompanying notes which are an integral part of the financial statements.
Telecommunications Portfolio Class M
| Years ended February 28, | 2018 | 2017 | 2016 A | 2015 | 2014 |
| Selected Per–Share Data | | | | | |
| Net asset value, beginning of period | $69.33 | $61.95 | $63.04 | $58.50 | $51.41 |
| Income from Investment Operations | | | | | |
| Net investment income (loss)B | .81 | .65 | .61 | .57 | 1.59C |
| Net realized and unrealized gain (loss) | (3.36) | 10.62 | (.76) | 5.81 | 6.44 |
| Total from investment operations | (2.55) | 11.27 | (.15) | 6.38 | 8.03 |
| Distributions from net investment income | (1.07) | (.73) | (.49) | (1.84) | (.94) |
| Distributions from net realized gain | (10.39) | (3.16) | (.45) | – | (.01) |
| Total distributions | (11.47)D | (3.89) | (.94) | (1.84) | (.94)E |
| Redemption fees added to paid in capitalB | – | –F | –F | –F | –F |
| Net asset value, end of period | $55.31 | $69.33 | $61.95 | $63.04 | $58.50 |
| Total ReturnG,H | (4.40)% | 18.26% | (.16)% | 11.19% | 15.64% |
| Ratios to Average Net AssetsI,J | | | | | |
| Expenses before reductions | 1.49% | 1.46% | 1.47% | 1.47% | 1.48% |
| Expenses net of fee waivers, if any | 1.49% | 1.46% | 1.47% | 1.47% | 1.48% |
| Expenses net of all reductions | 1.48% | 1.44% | 1.46% | 1.46% | 1.45% |
| Net investment income (loss) | 1.24% | .96% | 1.01% | .94% | 2.78%C |
| Supplemental Data | | | | | |
| Net assets, end of period (000 omitted) | $4,847 | $6,933 | $8,280 | $5,095 | $4,344 |
| Portfolio turnover rateK | 66% | 105%L | 51% | 94%L | 111% |
A For the year ended February 29.
B Calculated based on average shares outstanding during the period.
C Net Investment income per share reflects a large, non-recurring dividend which amounted to $.94 per share. Excluding this non-recurring dividend, the ratio of net investment income (loss) to average net assets would have been 1.13%.
D Total distributions of $11.47 per share is comprised of distributions from net investment income of $1.073 and distributions from net realized gain of $10.393 per share.
E Total distributions of $.94 per share is comprised of distributions from net investment income of $.939 and distributions from net realized gain of $.005 per share.
F Amount represents less than $.005 per share.
G Total returns would have been lower if certain expenses had not been reduced during the applicable periods shown.
H Total returns do not include the effect of the sales charges.
I Fees and expenses of any underlying Fidelity Central Funds are not included in the Fund's expense ratio. The Fund indirectly bears its proportionate share of the expenses of any underlying Fidelity Central Funds.
J Expense ratios reflect operating expenses of the class. Expenses before reductions do not reflect amounts reimbursed by the investment adviser or reductions from brokerage service arrangements or reductions from other expense offset arrangements and do not represent the amount paid by the class during periods when reimbursements or reductions occur. Expenses net of fee waivers reflect expenses after reimbursement by the investment adviser but prior to reductions from brokerage service arrangements or other expense offset arrangements. Expenses net of all reductions represent the net expenses paid by the class.
K Amount does not include the portfolio activity of any underlying Fidelity Central Funds.
L Portfolio turnover rate excludes securities received or delivered in-kind.
See accompanying notes which are an integral part of the financial statements.
Telecommunications Portfolio Class C
| Years ended February 28, | 2018 | 2017 | 2016 A | 2015 | 2014 |
| Selected Per–Share Data | | | | | |
| Net asset value, beginning of period | $69.24 | $62.10 | $63.04 | $58.54 | $51.47 |
| Income from Investment Operations | | | | | |
| Net investment income (loss)B | .57 | .37 | .36 | .34 | 1.36C |
| Net realized and unrealized gain (loss) | (3.36) | 10.62 | (.75) | 5.80 | 6.46 |
| Total from investment operations | (2.79) | 10.99 | (.39) | 6.14 | 7.82 |
| Distributions from net investment income | (.77) | (.69) | (.10) | (1.64) | (.74) |
| Distributions from net realized gain | (10.39) | (3.16) | (.45) | – | (.01) |
| Total distributions | (11.16) | (3.85) | (.55) | (1.64) | (.75) |
| Redemption fees added to paid in capitalB | – | –D | –D | –D | –D |
| Net asset value, end of period | $55.29 | $69.24 | $62.10 | $63.04 | $58.54 |
| Total ReturnE,F | (4.75)% | 17.77% | (.57)% | 10.75% | 15.20% |
| Ratios to Average Net AssetsG,H | | | | | |
| Expenses before reductions | 1.86% | 1.88% | 1.89% | 1.85% | 1.88% |
| Expenses net of fee waivers, if any | 1.86% | 1.88% | 1.89% | 1.85% | 1.88% |
| Expenses net of all reductions | 1.85% | 1.86% | 1.88% | 1.85% | 1.85% |
| Net investment income (loss) | .87% | .54% | .60% | .56% | 2.38%C |
| Supplemental Data | | | | | |
| Net assets, end of period (000 omitted) | $8,396 | $13,528 | $7,735 | $7,074 | $5,523 |
| Portfolio turnover rateI | 66% | 105%J | 51% | 94%J | 111% |
A For the year ended February 29.
B Calculated based on average shares outstanding during the period.
C Net Investment income per share reflects a large, non-recurring dividend which amounted to $.94 per share. Excluding this non-recurring dividend, the ratio of net investment income (loss) to average net assets would have been .73%.
D Amount represents less than $.005 per share.
E Total returns would have been lower if certain expenses had not been reduced during the applicable periods shown.
F Total returns do not include the effect of the contingent deferred sales charge.
G Fees and expenses of any underlying Fidelity Central Funds are not included in the Fund's expense ratio. The Fund indirectly bears its proportionate share of the expenses of any underlying Fidelity Central Funds.
H Expense ratios reflect operating expenses of the class. Expenses before reductions do not reflect amounts reimbursed by the investment adviser or reductions from brokerage service arrangements or reductions from other expense offset arrangements and do not represent the amount paid by the class during periods when reimbursements or reductions occur. Expenses net of fee waivers reflect expenses after reimbursement by the investment adviser but prior to reductions from brokerage service arrangements or other expense offset arrangements. Expenses net of all reductions represent the net expenses paid by the class.
I Amount does not include the portfolio activity of any underlying Fidelity Central Funds.
J Portfolio turnover rate excludes securities received or delivered in-kind.
See accompanying notes which are an integral part of the financial statements.
Telecommunications Portfolio
| Years ended February 28, | 2018 | 2017 | 2016 A | 2015 | 2014 |
| Selected Per–Share Data | | | | | |
| Net asset value, beginning of period | $69.97 | $62.58 | $63.54 | $58.94 | $51.75 |
| Income from Investment Operations | | | | | |
| Net investment income (loss)B | 1.28 | 1.12 | 1.02 | .96 | 1.96C |
| Net realized and unrealized gain (loss) | (3.42) | 10.74 | (.77) | 5.85 | 6.51 |
| Total from investment operations | (2.14) | 11.86 | .25 | 6.81 | 8.47 |
| Distributions from net investment income | (1.56) | (1.31) | (.76) | (2.21) | (1.28) |
| Distributions from net realized gain | (10.39) | (3.16) | (.45) | – | (.01) |
| Total distributions | (11.95) | (4.47) | (1.21) | (2.21) | (1.28)D |
| Redemption fees added to paid in capitalB | – | –E | –E | –E | –E |
| Net asset value, end of period | $55.88 | $69.97 | $62.58 | $63.54 | $58.94 |
| Total ReturnF | (3.76)% | 19.06% | .49% | 11.90% | 16.40% |
| Ratios to Average Net AssetsG,H | | | | | |
| Expenses before reductions | .82% | .80% | .82% | .83% | .85% |
| Expenses net of fee waivers, if any | .82% | .80% | .81% | .83% | .85% |
| Expenses net of all reductions | .80% | .78% | .81% | .82% | .82% |
| Net investment income (loss) | 1.92% | 1.62% | 1.67% | 1.58% | 3.41%C |
| Supplemental Data | | | | | |
| Net assets, end of period (000 omitted) | $320,908 | $690,720 | $689,600 | $346,174 | $343,548 |
| Portfolio turnover rateI | 66% | 105%J | 51% | 94%J | 111% |
A For the year ended February 29.
B Calculated based on average shares outstanding during the period.
C Net Investment income per share reflects a large, non-recurring dividend which amounted to $.95 per share. Excluding this non-recurring dividend, the ratio of net investment income (loss) to average net assets would have been 1.76%.
D Total distributions of $1.28 per share is comprised of distributions from net investment income of $1.275 and distributions from net realized gain of $.005 per share.
E Amount represents less than $.005 per share.
F Total returns would have been lower if certain expenses had not been reduced during the applicable periods shown.
G Fees and expenses of any underlying Fidelity Central Funds are not included in the Fund's expense ratio. The Fund indirectly bears its proportionate share of the expenses of any underlying Fidelity Central Funds.
H Expense ratios reflect operating expenses of the class. Expenses before reductions do not reflect amounts reimbursed by the investment adviser or reductions from brokerage service arrangements or reductions from other expense offset arrangements and do not represent the amount paid by the class during periods when reimbursements or reductions occur. Expenses net of fee waivers reflect expenses after reimbursement by the investment adviser but prior to reductions from brokerage service arrangements or other expense offset arrangements. Expenses net of all reductions represent the net expenses paid by the class.
I Amount does not include the portfolio activity of any underlying Fidelity Central Funds.
J Portfolio turnover rate excludes securities received or delivered in-kind.
See accompanying notes which are an integral part of the financial statements.
Telecommunications Portfolio Class I
| Years ended February 28, | 2018 | 2017 | 2016 A | 2015 | 2014 |
| Selected Per–Share Data | | | | | |
| Net asset value, beginning of period | $69.82 | $62.46 | $63.38 | $58.80 | $51.65 |
| Income from Investment Operations | | | | | |
| Net investment income (loss)B | 1.26 | 1.12 | 1.02 | .94 | 1.93C |
| Net realized and unrealized gain (loss) | (3.39) | 10.70 | (.76) | 5.83 | 6.48 |
| Total from investment operations | (2.13) | 11.82 | .26 | 6.77 | 8.41 |
| Distributions from net investment income | (1.56) | (1.30) | (.73) | (2.19) | (1.25) |
| Distributions from net realized gain | (10.39) | (3.16) | (.45) | – | (.01) |
| Total distributions | (11.95) | (4.46) | (1.18) | (2.19) | (1.26) |
| Redemption fees added to paid in capitalB | – | –D | –D | –D | –D |
| Net asset value, end of period | $55.74 | $69.82 | $62.46 | $63.38 | $58.80 |
| Total ReturnE | (3.75)% | 19.03% | .51% | 11.85% | 16.30% |
| Ratios to Average Net AssetsF,G | | | | | |
| Expenses before reductions | .82% | .80% | .82% | .86% | .91% |
| Expenses net of fee waivers, if any | .82% | .80% | .82% | .86% | .91% |
| Expenses net of all reductions | .80% | .78% | .81% | .85% | .88% |
| Net investment income (loss) | 1.91% | 1.62% | 1.67% | 1.55% | 3.35%C |
| Supplemental Data | | | | | |
| Net assets, end of period (000 omitted) | $8,332 | $14,550 | $6,197 | $2,505 | $1,604 |
| Portfolio turnover rateH | 66% | 105%I | 51% | 94%I | 111% |
A For the year ended February 29.
B Calculated based on average shares outstanding during the period.
C Net Investment income per share reflects a large, non-recurring dividend which amounted to $.95 per share. Excluding this non-recurring dividend, the ratio of net investment income (loss) to average net assets would have been 1.70%.
D Amount represents less than $.005 per share.
E Total returns would have been lower if certain expenses had not been reduced during the applicable periods shown.
F Fees and expenses of any underlying Fidelity Central Funds are not included in the Fund's expense ratio. The Fund indirectly bears its proportionate share of the expenses of any underlying Fidelity Central Funds.
G Expense ratios reflect operating expenses of the class. Expenses before reductions do not reflect amounts reimbursed by the investment adviser or reductions from brokerage service arrangements or reductions from other expense offset arrangements and do not represent the amount paid by the class during periods when reimbursements or reductions occur. Expenses net of fee waivers reflect expenses after reimbursement by the investment adviser but prior to reductions from brokerage service arrangements or other expense offset arrangements. Expenses net of all reductions represent the net expenses paid by the class.
H Amount does not include the portfolio activity of any underlying Fidelity Central Funds.
I Portfolio turnover rate excludes securities received or delivered in-kind.
See accompanying notes which are an integral part of the financial statements.
Notes to Financial Statements
For the period ended February 28, 2018
1. Organization.
Telecommunications Portfolio (the Fund) is a non-diversified fund of Fidelity Select Portfolios (the Trust) and is authorized to issue an unlimited number of shares. The Trust is registered under the Investment Company Act of 1940, as amended (the 1940 Act), as an open-end management investment company organized as a Massachusetts business trust. The Fund invests primarily in securities of companies whose principal business activities fall within specific industries. The Fund offers Class A, Class M (formerly Class T), Class C, Telecommunications and Class I shares, each of which has equal rights as to assets and voting privileges. Each class has exclusive voting rights with respect to matters that affect that class.
After the close of business on June 24, 2016, all outstanding Class B shares were converted to Class A shares. All prior fiscal period dollar and share amounts for Class B presented in the Notes to Financial Statements are for the period March 1, 2016 through June 24, 2016.
2. Investments in Fidelity Central Funds.
The Fund invests in Fidelity Central Funds, which are open-end investment companies generally available only to other investment companies and accounts managed by the investment adviser and its affiliates. The Fund's Schedule of Investments lists each of the Fidelity Central Funds held as of period end, if any, as an investment of the Fund, but does not include the underlying holdings of each Fidelity Central Fund. As an Investing Fund, the Fund indirectly bears its proportionate share of the expenses of the underlying Fidelity Central Funds.
The Money Market Central Funds seek preservation of capital and current income and are managed by Fidelity Investments Money Management, Inc. (FIMM), an affiliate of the investment adviser. Annualized expenses of the Money Market Central Funds as of their most recent shareholder report date are less than .005%.
A complete unaudited list of holdings for each Fidelity Central Fund is available upon request or at the Securities and Exchange Commission (the SEC) website at www.sec.gov. In addition, the financial statements of the Fidelity Central Funds, which are not covered by the Fund's Report of Independent Registered Public Accounting Firm, are available on the SEC website or upon request.
3. Significant Accounting Policies.
The Fund is an investment company and applies the accounting and reporting guidance of the Financial Accounting Standards Board (FASB) Accounting Standards Codification Topic 946 Financial Services – Investments Companies. The financial statements have been prepared in conformity with accounting principles generally accepted in the United States of America (GAAP), which require management to make certain estimates and assumptions at the date of the financial statements. Actual results could differ from those estimates. Subsequent events, if any, through the date that the financial statements were issued have been evaluated in the preparation of the financial statements. The following summarizes the significant accounting policies of the Fund:
Investment Valuation. Investments are valued as of 4:00 p.m. Eastern time on the last calendar day of the period. The Board of Trustees (the Board) has delegated the day to day responsibility for the valuation of the Fund's investments to the Fair Value Committee (the Committee) established by the Fund's investment adviser. In accordance with valuation policies and procedures approved by the Board, the Fund attempts to obtain prices from one or more third party pricing vendors or brokers to value its investments. When current market prices, quotations or currency exchange rates are not readily available or reliable, investments will be fair valued in good faith by the Committee, in accordance with procedures adopted by the Board. Factors used in determining fair value vary by investment type and may include market or investment specific events. The frequency with which these procedures are used cannot be predicted and they may be utilized to a significant extent. The Committee oversees the Fund's valuation policies and procedures and reports to the Board on the Committee's activities and fair value determinations. The Board monitors the appropriateness of the procedures used in valuing the Fund's investments and ratifies the fair value determinations of the Committee.
The Fund categorizes the inputs to valuation techniques used to value its investments into a disclosure hierarchy consisting of three levels as shown below:
- Level 1 – quoted prices in active markets for identical investments
- Level 2 – other significant observable inputs (including quoted prices for similar investments, interest rates, prepayment speeds, etc.)
- Level 3 – unobservable inputs (including the Fund's own assumptions based on the best information available)
Valuation techniques used to value the Fund's investments by major category are as follows:
Equity securities, including restricted securities, for which market quotations are readily available, are valued at the last reported sale price or official closing price as reported by a third party pricing vendor on the primary market or exchange on which they are traded and are categorized as Level 1 in the hierarchy. In the event there were no sales during the day or closing prices are not available, securities are valued at the last quoted bid price or may be valued using the last available price and are generally categorized as Level 2 in the hierarchy. For foreign equity securities, when market or security specific events arise, comparisons to the valuation of American Depositary Receipts (ADRs), futures contracts, Exchange-Traded Funds (ETFs) and certain indexes as well as quoted prices for similar securities may be used and would be categorized as Level 2 in the hierarchy. Utilizing these techniques may result in transfers between Level 1 and Level 2. For equity securities, including restricted securities, where observable inputs are limited, assumptions about market activity and risk are used and these securities may be categorized as Level 3 in the hierarchy.
Investments in open-end mutual funds, including the Fidelity Central Funds, are valued at their closing net asset value (NAV) each business day and are categorized as Level 1 in the hierarchy.
Changes in valuation techniques may result in transfers in or out of an assigned level within the disclosure hierarchy. The aggregate value of investments by input level as of February 28, 2018, including information on transfers between Levels 1 and 2 is included at the end of the Fund's Schedule of Investments.
Foreign Currency. The Fund may use foreign currency contracts to facilitate transactions in foreign-denominated securities. Gains and losses from these transactions may arise from changes in the value of the foreign currency or if the counterparties do not perform under the contracts' terms.
Foreign-denominated assets, including investment securities, and liabilities are translated into U.S. dollars at the exchange rates at period end. Purchases and sales of investment securities, income and dividends received and expenses denominated in foreign currencies are translated into U.S. dollars at the exchange rate in effect on the transaction date.
The effects of exchange rate fluctuations on investments are included with the net realized and unrealized gain (loss) on investment securities. Other foreign currency transactions resulting in realized and unrealized gain (loss) are disclosed separately.
Investment Transactions and Income. For financial reporting purposes, the Fund's investment holdings and NAV include trades executed through the end of the last business day of the period. The NAV per share for processing shareholder transactions is calculated as of the close of business of the New York Stock Exchange (NYSE), normally 4:00 p.m. Eastern time and includes trades executed through the end of the prior business day. Gains and losses on securities sold are determined on the basis of identified cost and includes proceeds received from litigation. Dividend income is recorded on the ex-dividend date, except for certain dividends from foreign securities where the ex-dividend date may have passed, which are recorded as soon as the Fund is informed of the ex-dividend date. Non-cash dividends included in dividend income, if any, are recorded at the fair market value of the securities received. Income and capital gain distributions from Fidelity Central Funds, if any, are recorded on the ex-dividend date. Certain distributions received by the Fund represent a return of capital or capital gain. The Fund determines the components of these distributions subsequent to the ex-dividend date, based upon receipt of tax filings or other correspondence relating to the underlying investment. These distributions are recorded as a reduction of cost of investments and/or as a realized gain. Investment income is recorded net of foreign taxes withheld where recovery of such taxes is uncertain.
Class Allocations and Expenses. Investment income, realized and unrealized capital gains and losses, common expenses of the Fund, and certain fund-level expense reductions, if any, are allocated daily on a pro-rata basis to each class based on the relative net assets of each class to the total net assets of the Fund. Each class differs with respect to transfer agent and distribution and service plan fees incurred. Certain expense reductions may also differ by class. For the reporting period, the allocated portion of income and expenses to each class as a percent of its average net assets may vary due to the timing of recording these transactions in relation to fluctuating net assets of the classes. Expenses directly attributable to a fund are charged to that fund. Expenses attributable to more than one fund are allocated among the respective funds on the basis of relative net assets or other appropriate methods. Expense estimates are accrued in the period to which they relate and adjustments are made when actual amounts are known.
Income Tax Information and Distributions to Shareholders. Each year, the Fund intends to qualify as a regulated investment company under Subchapter M of the Internal Revenue Code, including distributing substantially all of its taxable income and realized gains. As a result, no provision for U.S. Federal income taxes is required. As of February 28, 2018, the Fund did not have any unrecognized tax benefits in the financial statements; nor is the Fund aware of any tax positions for which it is reasonably possible that the total amounts of unrecognized tax benefits will significantly change in the next twelve months. The Fund files a U.S. federal tax return, in addition to state and local tax returns as required. The Fund's federal income tax returns are subject to examination by the Internal Revenue Service (IRS) for a period of three fiscal years after they are filed. State and local tax returns may be subject to examination for an additional fiscal year depending on the jurisdiction. Foreign taxes are provided for based on the Fund's understanding of the tax rules and rates that exist in the foreign markets in which it invests.
Distributions are declared and recorded on the ex-dividend date. Income dividends and capital gain distributions are declared separately for each class. Income and capital gain distributions are determined in accordance with income tax regulations, which may differ from GAAP.
Capital accounts within the financial statements are adjusted for permanent book-tax differences. These adjustments have no impact on net assets or the results of operations. Capital accounts are not adjusted for temporary book-tax differences which will reverse in a subsequent period.
Book-tax differences are primarily due to foreign currency transactions, certain deemed distributions and losses deferred due to wash sales.
As of period end, the cost and unrealized appreciation (depreciation) in securities, and derivatives if applicable, for federal income tax purposes were as follows:
| Gross unrealized appreciation | $74,138,518 |
| Gross unrealized depreciation | (31,769,857) |
| Net unrealized appreciation (depreciation) | $42,368,661 |
| Tax Cost | $348,106,171 |
The tax-based components of distributable earnings as of period end were as follows:
| Undistributed ordinary income | $1,308,030 |
| Undistributed long-term capital gain | $3,902,949 |
| Net unrealized appreciation (depreciation) on securities and other investments | $42,365,364 |
The tax character of distributions paid was as follows:
| | February 28, 2018 | February 28, 2017 |
| Ordinary Income | $16,292,007 | $ 33,284,559 |
| Long-term Capital Gains | 59,873,395 | 11,685,163 |
| Total | $76,165,402 | $ 44,969,722 |
4. Purchases and Sales of Investments.
Purchases and sales of securities, other than short-term securities, aggregated $320,343,309 and $690,123,904, respectively.
5. Fees and Other Transactions with Affiliates.
Management Fee. Fidelity SelectCo, LLC (the investment adviser) and its affiliates provide the Fund with investment management related services for which the Fund pays a monthly management fee. The management fee is the sum of an individual fund fee rate that is based on an annual rate of .30% of the Fund's average net assets and an annualized group fee rate that averaged .24% during the period. The group fee rate is based upon the average net assets of all the mutual funds advised by Fidelity Management & Research Company (FMR) and the investment adviser. The group fee rate decreases as assets under management increase and increases as assets under management decrease. For the reporting period, the total annual management fee rate was .54% of the Fund's average net assets.
Distribution and Service Plan Fees. In accordance with Rule 12b-1 of the 1940 Act, the Fund has adopted separate Distribution and Service Plans for each class of shares. Certain classes pay Fidelity Distributors Corporation (FDC), an affiliate of the investment adviser, separate Distribution and Service Fees, each of which is based on an annual percentage of each class' average net assets. In addition, FDC may pay financial intermediaries for selling shares of the Fund and providing shareholder support services. For the period, the Distribution and Service Fee rates, total fees and amounts retained by FDC were as follows:
| | Distribution Fee | Service Fee | Total Fees | Retained by FDC |
| Class A | -% | .25% | $56,288 | $549 |
| Class M | .25% | .25% | 28,768 | – |
| Class C | .75% | .25% | 106,749 | 18,929 |
| | | | $191,805 | $19,478 |
Sales Load. FDC may receive a front-end sales charge of up to 5.75% for selling Class A shares and 3.50% for selling Class M shares, some of which is paid to financial intermediaries for selling shares of the Fund. Depending on the holding period, FDC may receive contingent deferred sales charges levied on Class A, Class M and Class C redemptions. The deferred sales charges are 1.00% for Class C shares, 1.00% for certain purchases of Class A shares and .25% for certain purchases of Class M shares.
For the period, sales charge amounts retained by FDC were as follows:
| | Retained by FDC |
| Class A | $17,703 |
| Class M | 2,079 |
| Class C(a) | 4,933 |
| | $24,715 |
(a) When Class C shares are initially sold, FDC pays commissions from its own resources to financial intermediaries through which the sales are made.
Transfer Agent Fees. Fidelity Investments Institutional Operations Company, Inc., (FIIOC), an affiliate of the investment adviser, is the transfer, dividend disbursing and shareholder servicing agent for each class of the Fund. FIIOC receives account fees and asset-based fees that vary according to the account size and type of account of the shareholders of the respective classes of the Fund. FIIOC pays for typesetting, printing and mailing of shareholder reports, except proxy statements.
For the period, transfer agent fees for each class were as follows:
| | Amount | % of Class-Level Average Net Assets |
| Class A | $59,019 | .26 |
| Class M | 21,139 | .37 |
| Class C | 25,248 | .24 |
| Telecommunications | 805,725 | .19 |
| Class I | 22,766 | .19 |
| | $933,897 | |
Accounting and Security Lending Fees. Fidelity Service Company, Inc. (FSC), an affiliate of the investment adviser, maintains the Fund's accounting records. The accounting fee is based on the level of average net assets for each month. Under a separate contract, FSC administers the security lending program. The security lending fee is based on the number and duration of lending transactions.
Brokerage Commissions. The Fund placed a portion of its portfolio transactions with brokerage firms which are affiliates of the investment adviser. Brokerage commissions are included in net realized gain (loss) and change in net unrealized appreciation (depreciation) in the Statement of Operations. The commissions paid to these affiliated firms were $30,814 for the period.
Interfund Lending Program. Pursuant to an Exemptive Order issued by the SEC, the Fund, along with other registered investment companies having management contracts with Fidelity Management & Research Company (FMR) or other affiliated entities of FMR, may participate in an interfund lending program. This program provides an alternative credit facility allowing the funds to borrow from, or lend money to, other participating affiliated funds. At period end, there were no interfund loans outstanding. The Fund's activity in this program during the period for which loans were outstanding was as follows:
| Borrower or Lender | Average Loan Balance | Weighted Average Interest Rate | Interest Expense |
| Borrower | $6,749,957 | 1.15% | $10,093 |
Interfund Trades. The Fund may purchase from or sell securities to other Fidelity Funds under procedures adopted by the Board. The procedures have been designed to ensure these interfund trades are executed in accordance with Rule 17a-7 of the 1940 Act. Interfund trades are included within the respective purchases and sales amounts shown in the Purchases and Sales of Investments note.
Prior Fiscal Year Redemptions In-Kind. During the prior period, 805,095 shares of Telecommunications Portfolio held by an affiliated entity were redeemed in-kind for investments and cash with a value of $53,345,591. The Fund had a net realized gain of $12,655,696 on investments delivered through in-kind redemptions. The amount of the in-kind redemptions is included in share transactions in the accompanying Statement of Changes in Net Assets as well as the Notes to Financial Statements. Telecommunications Portfolio recognized no gain or loss for federal income tax purposes.
6. Committed Line of Credit.
The Fund participates with other funds managed by the investment adviser or an affiliate in a $4.25 billion credit facility (the "line of credit") to be utilized for temporary or emergency purposes to fund shareholder redemptions or for other short-term liquidity purposes. The Fund has agreed to pay commitment fees on its pro-rata portion of the line of credit, which amounted to $1,732 and is reflected in Miscellaneous expenses on the Statement of Operations. During the period, the Fund did not borrow on this line of credit.
7. Security Lending.
The Fund lends portfolio securities through a lending agent from time to time in order to earn additional income. On the settlement date of the loan, the Fund receives collateral (in the form of U.S. Treasury obligations, letters of credit and/or cash) against the loaned securities and maintains collateral in an amount not less than 100% of the market value of the loaned securities during the period of the loan. The market value of the loaned securities is determined at the close of business of the Fund and any additional required collateral is delivered to the Fund on the next business day. The Fund or borrower may terminate the loan at any time, and if the borrower defaults on its obligation to return the securities loaned because of insolvency or other reasons, the Fund may apply collateral received from the borrower against the obligation. The Fund may experience delays and costs in recovering the securities loaned. Any cash collateral received is invested in the Fidelity Securities Lending Cash Central Fund. The value of loaned securities and cash collateral at period end are disclosed on the Fund's Statement of Assets and Liabilities. Security lending income represents the income earned on investing cash collateral, less rebates paid to borrowers and any lending agent fees associated with the loan, plus any premium payments received for lending certain types of securities. Security lending income is presented in the Statement of Operations as a component of income from Fidelity Central Funds.
8. Bank Borrowings.
The Fund is permitted to have bank borrowings for temporary or emergency purposes to fund shareholder redemptions or for other short-term liquidity requirements. The Fund has established borrowing arrangements with certain banks. The interest rate on the borrowings is the bank's base rate, as revised from time to time. The average loan balance during the period for which loans were outstanding amounted to $3,895,111. The weighted average interest rate was 1.21%. The interest expense amounted to $1,181 under the bank borrowing program. At period end, there were no bank borrowings outstanding.
9. Expense Reductions.
Commissions paid to certain brokers with whom the investment adviser, or its affiliates, places trades on behalf of the Fund include an amount in addition to trade execution, which may be rebated back to the Fund to offset certain expenses. This amount totaled $72,277 for the period.
In addition, during the period the investment adviser reimbursed and/or waived a portion of fund-level operating expenses in the amount of $5,446.
10. Distributions to Shareholders.
Distributions to shareholders of each class were as follows:
| | Year ended
February 28, 2018 | Year ended
February 28, 2017 |
| From net investment income | | |
| Class A | $396,755 | $455,173 |
| Class M | 86,824 | 67,280 |
| Class C | 113,266 | 124,522 |
| Telecommunications | 8,955,299 | 12,452,745 |
| Class I | 235,382 | 194,684 |
| Total | $9,787,526 | $13,294,404 |
| From net realized gain | | |
| Class A | $3,147,334 | $1,308,078 |
| Class M | 841,588 | 287,783 |
| Class C | 1,545,756 | 572,522 |
| Telecommunications | 59,280,788 | 29,029,256 |
| Class I | 1,562,410 | 477,679 |
| Total | $66,377,876 | $31,675,318 |
11. Share Transactions.
Share transactions for each class were as follows and may contain automatic conversions between classes or exchanges between affiliated funds:
| | Shares | Shares | Dollars | Dollars |
| | Year ended February 28, 2018 | Year ended February 28, 2017 | Year ended February 28, 2018 | Year ended February 28, 2017 |
| Class A | | | | |
| Shares sold | 76,520 | 521,786 | $4,987,299 | $35,388,038 |
| Reinvestment of distributions | 57,962 | 24,324 | 3,454,010 | 1,671,796 |
| Shares redeemed | (273,126) | (296,004) | (18,205,397) | (20,518,786) |
| Net increase (decrease) | (138,644) | 250,106 | $(9,764,088) | $16,541,048 |
| Class M | | | | |
| Shares sold | 21,912 | 82,122 | $1,457,815 | $5,468,018 |
| Reinvestment of distributions | 15,649 | 5,039 | 926,496 | 345,400 |
| Shares redeemed | (49,923) | (120,797) | (3,308,018) | (8,187,323) |
| Net increase (decrease) | (12,362) | (33,636) | $(923,707) | $(2,373,905) |
| Class B | | | | |
| Shares sold | – | 975 | $– | $64,042 |
| Shares redeemed | – | (5,216) | – | (349,278) |
| Net increase (decrease) | – | (4,241) | $– | $(285,236) |
| Class C | | | | |
| Shares sold | 31,294 | 135,768 | $2,045,854 | $9,283,679 |
| Reinvestment of distributions | 25,537 | 8,829 | 1,513,170 | 604,885 |
| Shares redeemed | (100,350) | (73,776) | (6,561,447) | (5,085,863) |
| Net increase (decrease) | (43,519) | 70,821 | $(3,002,423) | $4,802,701 |
| Telecommunications | | | | |
| Shares sold | 1,189,602 | 6,206,062 | $77,745,057 | $424,943,213 |
| Reinvestment of distributions | 1,082,670 | 578,869 | 65,288,273 | 39,940,628 |
| Shares redeemed | (6,401,925) | (7,931,924)(a) | (430,649,733) | (546,713,599)(a) |
| Net increase (decrease) | (4,129,653) | (1,146,993) | $(287,616,403) | $(81,829,758) |
| Class I | | | | |
| Shares sold | 250,120 | 536,498 | $16,564,921 | $37,085,732 |
| Reinvestment of distributions | 25,845 | 8,128 | 1,544,599 | 559,963 |
| Shares redeemed | (334,874) | (435,454) | (21,776,703) | (30,015,677) |
| Net increase (decrease) | (58,909) | 109,172 | $(3,667,183) | $7,630,018 |
(a) Amount includes in-kind redemptions (see the Prior Fiscal Year Redemptions In-Kind note for additional details).
12. Other.
The Fund's organizational documents provide former and current trustees and officers with a limited indemnification against liabilities arising in connection with the performance of their duties to the Fund. In the normal course of business, the Fund may also enter into contracts that provide general indemnifications. The Fund's maximum exposure under these arrangements is unknown as this would be dependent on future claims that may be made against the Fund. The risk of material loss from such claims is considered remote.
Report of Independent Registered Public Accounting Firm
To the Trustees of Select Portfolios and the Shareholders of Consumer Staples Portfolio, Gold Portfolio, Materials Portfolio and Telecommunications Portfolio:
Opinions on the Financial Statements
We have audited the accompanying statements of assets and liabilities, including the schedules of investments, of Consumer Staples Portfolio, Gold Portfolio, Materials Portfolio and Telecommunications Portfolio (four of the funds constituting Fidelity Select Portfolios, hereafter collectively referred to as the "Funds") as of February 28, 2018, the related statements of operations for the year ended February 28, 2018, the statements of changes in net assets for each of the two years in the period ended February 28, 2018, including the related notes, and the financial highlights for each of the five years in the period ended February 28, 2018 (collectively referred to as the “financial statements”). In our opinion, the financial statements present fairly, in all material respects, the financial position of each of the Funds as of February 28, 2018, the results of each of their operations for the year then ended, the changes in each of their net assets for each of the two years in the period ended February 28, 2018 and each of the financial highlights for each of the five years in the period ended February 28, 2018 in conformity with accounting principles generally accepted in the United States of America.
Basis for Opinions
These financial statements are the responsibility of the Funds' management. Our responsibility is to express an opinion on the Funds' financial statements based on our audits. We are a public accounting firm registered with the Public Company Accounting Oversight Board (United States) (“PCAOB”) and are required to be independent with respect to the Funds in accordance with the U.S. federal securities laws and the applicable rules and regulations of the Securities and Exchange Commission and the PCAOB.
We conducted our audits of these financial statements in accordance with the standards of the PCAOB. Those standards require that we plan and perform the audit to obtain reasonable assurance about whether the financial statements are free of material misstatement, whether due to error or fraud.
Our audits included performing procedures to assess the risks of material misstatement of the financial statements, whether due to error or fraud, and performing procedures that respond to those risks. Such procedures included examining, on a test basis, evidence regarding the amounts and disclosures in the financial statements. Our audits also included evaluating the accounting principles used and significant estimates made by management, as well as evaluating the overall presentation of the financial statements. Our procedures included confirmation of securities owned as of February 28, 2018 by correspondence with the custodian and brokers; when replies were not received from brokers, we performed other auditing procedures. We believe that our audits provide a reasonable basis for our opinions.
PricewaterhouseCoopers LLP
Boston, Massachusetts
April 17, 2018
We have served as the auditor of one or more investment companies in the Fidelity group of funds since 1932.
Trustees and Officers
The Trustees, Members of the Advisory Board (if any), and officers of the trust and funds, as applicable, are listed below. The Board of Trustees governs each fund and is responsible for protecting the interests of shareholders. The Trustees are experienced executives who meet periodically throughout the year to oversee each fund's activities, review contractual arrangements with companies that provide services to each fund, oversee management of the risks associated with such activities and contractual arrangements, and review each fund's performance. Except for Michael E. Wiley, each of the Trustees oversees 281 funds. Mr. Wiley oversees 193 funds.
The Trustees hold office without limit in time except that (a) any Trustee may resign; (b) any Trustee may be removed by written instrument, signed by at least two-thirds of the number of Trustees prior to such removal; (c) any Trustee who requests to be retired or who has become incapacitated by illness or injury may be retired by written instrument signed by a majority of the other Trustees; and (d) any Trustee may be removed at any special meeting of shareholders by a two-thirds vote of the outstanding voting securities of the trust. Each Trustee who is not an interested person (as defined in the 1940 Act) of the trust and the funds is referred to herein as an Independent Trustee. Each Independent Trustee shall retire not later than the last day of the calendar year in which his or her 75th birthday occurs. The Independent Trustees may waive this mandatory retirement age policy with respect to individual Trustees. Officers and Advisory Board Members hold office without limit in time, except that any officer or Advisory Board Member may resign or may be removed by a vote of a majority of the Trustees at any regular meeting or any special meeting of the Trustees. Except as indicated, each individual has held the office shown or other offices in the same company for the past five years.
Each fund’s Statement of Additional Information (SAI) includes more information about the Trustees. To request a free copy, call Fidelity at 1-877-208-0098.
Experience, Skills, Attributes, and Qualifications of the Trustees. The Governance and Nominating Committee has adopted a statement of policy that describes the experience, qualifications, attributes, and skills that are necessary and desirable for potential Independent Trustee candidates (Statement of Policy). The Board believes that each Trustee satisfied at the time he or she was initially elected or appointed a Trustee, and continues to satisfy, the standards contemplated by the Statement of Policy. The Governance and Nominating Committee also engages professional search firms to help identify potential Independent Trustee candidates who have the experience, qualifications, attributes, and skills consistent with the Statement of Policy. From time to time, additional criteria based on the composition and skills of the current Independent Trustees, as well as experience or skills that may be appropriate in light of future changes to board composition, business conditions, and regulatory or other developments, have also been considered by the professional search firms and the Governance and Nominating Committee. In addition, the Board takes into account the Trustees' commitment and participation in Board and committee meetings, as well as their leadership of standing and ad hoc committees throughout their tenure.
In determining that a particular Trustee was and continues to be qualified to serve as a Trustee, the Board has considered a variety of criteria, none of which, in isolation, was controlling. The Board believes that, collectively, the Trustees have balanced and diverse experience, qualifications, attributes, and skills, which allow the Board to operate effectively in governing each fund and protecting the interests of shareholders. Information about the specific experience, skills, attributes, and qualifications of each Trustee, which in each case led to the Board's conclusion that the Trustee should serve (or continue to serve) as a trustee of the funds, is provided below.
Board Structure and Oversight Function. James C. Curvey is an interested person and currently serves as Chairman. The Trustees have determined that an interested Chairman is appropriate and benefits shareholders because an interested Chairman has a personal and professional stake in the quality and continuity of services provided to the funds. Independent Trustees exercise their informed business judgment to appoint an individual of their choosing to serve as Chairman, regardless of whether the Trustee happens to be independent or a member of management. The Independent Trustees have determined that they can act independently and effectively without having an Independent Trustee serve as Chairman and that a key structural component for assuring that they are in a position to do so is for the Independent Trustees to constitute a substantial majority for the Board. The Independent Trustees also regularly meet in executive session. Ned C. Lautenbach serves as Chairman of the Independent Trustees and as such (i) acts as a liaison between the Independent Trustees and management with respect to matters important to the Independent Trustees and (ii) with management prepares agendas for Board meetings.
Fidelity® funds are overseen by different Boards of Trustees. The funds' Board oversees Fidelity's high income and certain equity funds, and other Boards oversee Fidelity's investment-grade bond, money market, asset allocation, and other equity funds. The asset allocation funds may invest in Fidelity® funds overseen by the funds' Board. The use of separate Boards, each with its own committee structure, allows the Trustees of each group of Fidelity® funds to focus on the unique issues of the funds they oversee, including common research, investment, and operational issues. On occasion, the separate Boards establish joint committees to address issues of overlapping consequences for the Fidelity® funds overseen by each Board.
The Trustees operate using a system of committees to facilitate the timely and efficient consideration of all matters of importance to the Trustees, each fund, and fund shareholders and to facilitate compliance with legal and regulatory requirements and oversight of the funds' activities and associated risks. The Board, acting through its committees, has charged SelectCo and its affiliates with (i) identifying events or circumstances the occurrence of which could have demonstrably adverse effects on the funds' business and/or reputation; (ii) implementing processes and controls to lessen the possibility that such events or circumstances occur or to mitigate the effects of such events or circumstances if they do occur; and (iii) creating and maintaining a system designed to evaluate continuously business and market conditions in order to facilitate the identification and implementation processes described in (i) and (ii) above. Because the day-to-day operations and activities of the funds are carried out by or through SelectCo, its affiliates, and other service providers, the funds' exposure to risks is mitigated but not eliminated by the processes overseen by the Trustees. While each of the Board's committees has responsibility for overseeing different aspects of the funds' activities, oversight is exercised primarily through the Operations, Audit, and Compliance Committees. In addition, the Independent Trustees have worked with Fidelity to enhance the Board's oversight of investment and financial risks, legal and regulatory risks, technology risks, and operational risks, including the development of additional risk reporting to the Board. Appropriate personnel, including but not limited to the funds' Chief Compliance Officer (CCO), SelectCo's internal auditor, the independent accountants, the funds' Treasurer and portfolio management personnel, make periodic reports to the Board's committees, as appropriate, including an annual review of Fidelity's risk management program for the Fidelity® funds. The responsibilities of each standing committee, including their oversight responsibilities, are described further under "Standing Committees of the Trustees."
Interested Trustees*:
Correspondence intended for a Trustee who is an interested person may be sent to Fidelity Investments, 245 Summer Street, Boston, Massachusetts 02210.
Name, Year of Birth; Principal Occupations and Other Relevant Experience+
James C. Curvey (1935)
Year of Election or Appointment: 2018
Trustee
Chairman of the Board of Trustees
Mr. Curvey also serves as Trustee of other Fidelity® funds. Mr. Curvey is a Director of Fidelity Research & Analysis Co. (investment adviser firm, 2009-present), and Vice Chairman (2007-present) and Director of FMR LLC (diversified financial services company). In addition, Mr. Curvey serves as an Overseer for the Boston Symphony Orchestra and a member of the board of Artis-Naples, Naples, Florida, and as a Trustee for Brewster Academy, Wolfeboro, New Hampshire. Previously, Mr. Curvey served as a Director of Fidelity Investments Money Management, Inc. (investment adviser firm, 2009-2014) and a Director of FMR and FMR Co., Inc. (investment adviser firms, 2007-2014).
Charles S. Morrison (1960)
Year of Election or Appointment: 2018
Trustee
Mr. Morrison also serves as Trustee of other funds. He serves as President of Fidelity SelectCo, LLC (investment adviser firm, 2017-present) and Fidelity Management & Research Company (FMR) (investment adviser firm, 2016-present), a Director of Fidelity Investments Money Management, Inc. (FIMM) (investment adviser firm, 2014-present), Director of Fidelity SelectCo, LLC (investment adviser firm, 2014-present), President, Asset Management (2014-present), and is an employee of Fidelity Investments. Previously, Mr. Morrison served as Vice President of Fidelity's Fixed Income and Asset Allocation Funds (2012-2014), President, Fixed Income (2011-2014), Vice President of Fidelity's Money Market Funds (2005-2009), President, Money Market Group Leader of FMR (investment adviser firm, 2009), and Senior Vice President, Money Market Group of FMR (2004-2009). Mr. Morrison also served as Vice President of Fidelity's Bond Funds (2002-2005), certain Balanced Funds (2002-2005), and certain Asset Allocation Funds (2002-2007), and as Senior Vice President (2002-2005) of Fidelity's Bond Division.
* Determined to be an "Interested Trustee" by virtue of, among other things, his or her affiliation with the trust or various entities under common control with SelectCo.
+ The information includes the Trustee's principal occupation during the last five years and other information relating to the experience, attributes, and skills relevant to the Trustee's qualifications to serve as a Trustee, which led to the conclusion that the Trustee should serve as a Trustee for each fund.
Independent Trustees:
Correspondence intended for an Independent Trustee may be sent to Fidelity Investments, P.O. Box 55235, Boston, Massachusetts 02205-5235.
Name, Year of Birth; Principal Occupations and Other Relevant Experience+
Dennis J. Dirks (1948)
Year of Election or Appointment: 2018
Trustee
Mr. Dirks also serves as Trustee of other Fidelity® funds. Prior to his retirement in May 2003, Mr. Dirks was Chief Operating Officer and a member of the Board of The Depository Trust & Clearing Corporation (DTCC). He also served as President, Chief Operating Officer, and Board member of The Depository Trust Company (DTC) and President and Board member of the National Securities Clearing Corporation (NSCC). In addition, Mr. Dirks served as Chief Executive Officer and Board member of the Government Securities Clearing Corporation, Chief Executive Officer and Board member of the Mortgage-Backed Securities Clearing Corporation, as a Trustee and a member of the Finance Committee of Manhattan College (2005-2008), as a Trustee and a member of the Finance Committee of AHRC of Nassau County (2006-2008), as a member of the Independent Directors Council (IDC) Governing Council (2010-2015), and as a member of the Board of Directors for The Brookville Center for Children’s Services, Inc. (2009-2017). Mr. Dirks is a member of the Finance Committee (2016-present) and Board of Directors (2017-present) of the Asolo Repertory Theatre.
Donald F. Donahue (1950)
Year of Election or Appointment: 2018
Trustee
Mr. Donahue also serves as a Trustee of other Fidelity® funds. Mr. Donahue is President and Chief Executive Officer of Miranda Partners, LLC (risk consulting for the financial services industry, 2012-present). Previously, Mr. Donahue served as a Member of the Advisory Board of certain Fidelity® funds (2015-2018) and Chief Executive Officer (2006-2012), Chief Operating Officer (2003-2006), and Managing Director, Customer Marketing and Development (1999-2003) of The Depository Trust & Clearing Corporation (financial markets infrastructure). Mr. Donahue serves as a Member (2007-present) and Co-Chairman (2016-present) of the Board of Directors of United Way of New York, Member of the Board of Directors of NYC Leadership Academy (2012-present) and Member of the Board of Advisors of Ripple Labs, Inc. (financial services, 2015-present). He also served as Chairman (2010-2012) and Member of the Board of Directors (2012-2013) of Omgeo, LLC (financial services), Treasurer of United Way of New York (2012-2016), and Member of the Board of Directors of XBRL US (financial services non-profit, 2009-2012) and the International Securities Services Association (2009-2012).
Alan J. Lacy (1953)
Year of Election or Appointment: 2018
Trustee
Mr. Lacy also serves as Trustee of other Fidelity® funds. Mr. Lacy serves as a Director of Bristol-Myers Squibb Company (global pharmaceuticals, 2008-present). He is a Trustee of the California Chapter of The Nature Conservancy (2015-present) and a Director of the Center for Advanced Study in the Behavioral Sciences at Stanford University (2015-present). In addition, Mr. Lacy served as Senior Adviser (2007-2014) of Oak Hill Capital Partners, L.P. (private equity) and also served as Chief Executive Officer (2005) and Vice Chairman (2005-2006) of Sears Holdings Corporation (retail) and Chief Executive Officer and Chairman of the Board of Sears, Roebuck and Co. (retail, 2000-2005). Previously, Mr. Lacy served as Chairman (2014-2017) and a member (2010-2017) of the Board of Directors of Dave & Buster’s Entertainment, Inc. (restaurant and entertainment complexes), as Chairman (2008-2011) and a member (2006-2015) of the Board of Trustees of the National Parks Conservation Association, and as a member of the Board of Directors for The Hillman Companies, Inc. (hardware wholesalers, 2010-2014), Earth Fare, Inc. (retail grocery, 2010-2014), and The Western Union Company (global money transfer, 2006-2011).
Ned C. Lautenbach (1944)
Year of Election or Appointment: 2018
Trustee
Chairman of the Independent Trustees
Mr. Lautenbach also serves as Trustee of other Fidelity® funds. Mr. Lautenbach currently serves as Vice Chair of the Board of Governors, State University System of Florida (2013-present) and is a member of the Council on Foreign Relations (1994-present). He is also a member and has most recently served as Chairman of the Board of Directors of Artis-Naples (2012-present). Previously, Mr. Lautenbach served as a member and then Lead Director of the Board of Directors of Eaton Corporation (diversified industrial, 1997-2016). He was also a Partner and Advisory Partner at Clayton, Dubilier & Rice, LLC (private equity investment, 1998-2010), as well as a Director of Sony Corporation (2006-2007). In addition, Mr. Lautenbach also had a 30-year career with IBM (technology company) during which time he served as Senior Vice President and a member of the Corporate Executive Committee (1968-1998).
Joseph Mauriello (1944)
Year of Election or Appointment: 2018
Trustee
Mr. Mauriello also serves as Trustee of other Fidelity® funds. Prior to his retirement in January 2006, Mr. Mauriello served in numerous senior management positions including Deputy Chairman and Chief Operating Officer (2004-2005), and Vice Chairman of Financial Services (2002-2004) of KPMG LLP US (professional services, 1965-2005). Mr. Mauriello currently serves as a member of the Board of Directors of XL Group plc. (global insurance and re-insurance, 2006-present) and the Independent Directors Council (IDC) Governing Council (2015-present). Previously, Mr. Mauriello served as a Director of the Hamilton Funds of the Bank of New York (2006-2007) and of Arcadia Resources Inc. (health care services and products, 2007-2012).
Cornelia M. Small (1944)
Year of Election or Appointment: 2018
Trustee
Ms. Small also serves as Trustee of other Fidelity® funds. Ms. Small is a member of the Board of Directors (2009-present) and Chair of the Investment Committee (2010-present) of the Teagle Foundation. Ms. Small also serves on the Investment Committee of the Berkshire Taconic Community Foundation (2008-present). Previously, Ms. Small served as Chairperson (2002-2008) and a member of the Investment Committee and Chairperson (2008-2012) and a member of the Board of Trustees of Smith College. In addition, Ms. Small served as Chief Investment Officer, Director of Global Equity Investments, and a member of the Board of Directors of Scudder, Stevens & Clark and Scudder Kemper Investments.
Garnett A. Smith (1947)
Year of Election or Appointment: 2013
Trustee
Mr. Smith also serves as Trustee of other Fidelity® funds. Prior to Mr. Smith's retirement, he served as Chairman and Chief Executive Officer of Inbrand Corp. (manufacturer of personal absorbent products, 1990-1997). He also served as President (1986-1990) of Inbrand Corp. Prior to his employment with Inbrand Corp., he was employed by a retail fabric chain and North Carolina National Bank. In addition, Mr. Smith served as a Member of the Advisory Board of certain Fidelity® funds (2012-2013) and as a board member of the Jackson Hole Land Trust (2009-2012).
David M. Thomas (1949)
Year of Election or Appointment: 2018
Trustee
Mr. Thomas also serves as Trustee of other Fidelity® funds. Mr. Thomas serves as Non-Executive Chairman of the Board of Directors of Fortune Brands Home and Security (home and security products, 2011-present), as a member of the Board of Directors (2004-present) and Presiding Director (2013-present) of Interpublic Group of Companies, Inc. (marketing communication), and as a member of the Board of Trustees of the University of Florida (2013-present). Previously, Mr. Thomas served as Executive Chairman (2005-2006) and Chairman and Chief Executive Officer (2000-2005) of IMS Health, Inc. (pharmaceutical and healthcare information solutions), and a Director of Fortune Brands, Inc. (consumer products, 2000-2011).
Michael E. Wiley (1950)
Year of Election or Appointment: 2008
Trustee
Mr. Wiley also serves as Trustee or Member of the Advisory Board of other Fidelity® funds. Mr. Wiley serves as a Director of Andeavor Corporation (independent oil refiner and marketer, 2005-present), a Director of Andeavor Logistics LP (natural resources logistics, 2015-present), and a Director of Bill Barrett Corporation (exploration and production, 2005-present). In addition, Mr. Wiley also serves as a Director of Post Oak Bank (privately-held bank, 2004-present). Previously, Mr. Wiley served as a Trustee of other Fidelity® funds (2008-2013), as a Director of Asia Pacific Exploration Consolidated (international oil and gas exploration and production, 2008-2013), as a member of the Board of Trustees of the University of Tulsa (2000-2006; 2007-2010), as a Senior Energy Advisor of Katzenbach Partners, LLC (consulting, 2006-2007), as an Advisory Director of Riverstone Holdings (private investment), Chairman, President, and CEO of Baker Hughes, Inc. (oilfield services, 2000-2004), and as Director of Spinnaker Exploration Company (exploration and production, 2001-2005).
+ The information includes the Trustee's principal occupation during the last five years and other information relating to the experience, attributes, and skills relevant to the Trustee's qualifications to serve as a Trustee, which led to the conclusion that the Trustee should serve as a Trustee for each fund.
Advisory Board Members and Officers:
Correspondence intended for a Member of the Advisory Board (if any) may be sent to Fidelity Investments, P.O. Box 55235, Boston, Massachusetts 02205-5235. Correspondence intended for an officer or Peter S. Lynch may be sent to Fidelity Investments, 245 Summer Street, Boston, Massachusetts 02210. Officers appear below in alphabetical order.
Name, Year of Birth; Principal Occupation
Peter S. Lynch (1944)
Year of Election or Appointment: 2018
Member of the Advisory Board
Mr. Lynch also serves as Member of the Advisory Board of other Fidelity® funds. Mr. Lynch is Vice Chairman and a Director of FMR (investment adviser firm) and FMR Co., Inc. (investment adviser firm). In addition, Mr. Lynch serves as a Trustee of Boston College and as the Chairman of the Inner-City Scholarship Fund. Previously, Mr. Lynch served on the Special Olympics International Board of Directors (1997-2006).
William S. Stavropoulos (1939)
Year of Election or Appointment: 2018
Member of the Advisory Board
Mr. Stavropoulos also serves as Member of the Advisory Board of other Fidelity® funds. Mr. Stavropoulos serves as President and Founder of the Michigan Baseball Foundation, the Great Lakes Loons (2007-present). Mr. Stavropoulos is Chairman Emeritus of the Board of Directors of The Dow Chemical Company, where he previously served in numerous senior management positions, including President, CEO (1995-2000; 2002-2004), Chairman of the Executive Committee (2000-2006), and as a member of the Board of Directors (1990-2006). Currently, Mr. Stavropoulos is Chairman of the Board of Directors of Univar Inc. (global distributor of commodity and specialty chemicals), a Director of Teradata Corporation (data warehousing and technology solutions), and a member of the Advisory Board for Metalmark Capital LLC (private equity investment, 2005-present). Mr. Stavropoulos is an operating advisor to Clayton, Dubilier & Rice, LLC (private equity investment). In addition, Mr. Stavropoulos is a member of the University of Notre Dame Advisory Council for the College of Science, a Trustee of the Rollin L. Gerstacker Foundation, and a Director of Artis-Naples in Naples, Florida. Previously, Mr. Stavropoulos served as Trustee of certain Fidelity® funds (2001-2018) and as a Director of Chemical Financial Corporation (bank holding company, 1993-2012) and Tyco International, Ltd. (multinational manufacturing and services, 2007-2012).
Carol B. Tomé (1957)
Year of Election or Appointment: 2017
Member of the Advisory Board
Ms. Tomé also serves as Member of the Advisory Board of other Fidelity® funds. Ms. Tomé is Chief Financial Officer (2001-present) and Executive Vice President of Corporate Services (2007-present) of The Home Depot, Inc. (home improvement retailer) and a Director (2003-present) and Chair of the Audit Committee (2004-present) of United Parcel Service, Inc. (package delivery and supply chain management). Previously, Ms. Tomé served as Trustee of certain Fidelity® funds (2017), Senior Vice President of Finance and Accounting/Treasurer (2000-2007) and Vice President and Treasurer (1995-2000) of The Home Depot, Inc. and Chair of the Board (2010-2012), Vice Chair of the Board (2009 and 2013), and a Director (2008-2013) of the Federal Reserve Bank of Atlanta. Ms. Tomé is also a director or trustee of many community and professional organizations.
Elizabeth Paige Baumann (1968)
Year of Election or Appointment: 2017
Anti-Money Laundering (AML) Officer
Ms. Baumann also serves as AML Officer of other funds. She is Chief AML Officer (2012-present) and Senior Vice President (2014-present) of FMR LLC (diversified financial services company) and is an employee of Fidelity Investments. Previously, Ms. Baumann served as AML Officer of the funds (2012-2016), and Vice President (2007-2014) and Deputy Anti-Money Laundering Officer (2007-2012) of FMR LLC.
Marc R. Bryant (1966)
Year of Election or Appointment: 2013
Secretary and Chief Legal Officer (CLO)
Mr. Bryant also serves as Secretary and CLO of other funds. Mr. Bryant serves as CLO, Secretary, and Senior Vice President of Fidelity Management & Research Company (investment adviser firm, 2015-present) and FMR Co., Inc. (investment adviser firm, 2015-present); Secretary of Fidelity SelectCo, LLC (investment adviser firm, 2015-present) and Fidelity Investments Money Management, Inc. (investment adviser firm, 2015-present); and CLO of Fidelity Management & Research (Hong Kong) Limited and FMR Investment Management (UK) Limited (investment adviser firms, 2015-present) and Fidelity Management & Research (Japan) Limited (investment adviser firm, 2016-present). He is Senior Vice President and Deputy General Counsel of FMR LLC (diversified financial services company). Previously, Mr. Bryant served as Secretary and CLO of Fidelity Rutland Square Trust II (2010-2014) and Assistant Secretary of Fidelity's Fixed Income and Asset Allocation Funds (2013-2015). Prior to joining Fidelity Investments, Mr. Bryant served as a Senior Vice President and the Head of Global Retail Legal for AllianceBernstein L.P. (2006-2010), and as the General Counsel for ProFund Advisors LLC (2001-2006).
William C. Coffey (1969)
Year of Election or Appointment: 2009
Assistant Secretary
Mr. Coffey also serves as Assistant Secretary of other funds. He is Senior Vice President and Deputy General Counsel of FMR LLC (diversified financial services company, 2010-present), and is an employee of Fidelity Investments. Previously, Mr. Coffey served as Vice President and Associate General Counsel of FMR LLC (2005-2009).
Jonathan Davis (1968)
Year of Election or Appointment: 2010
Assistant Treasurer
Mr. Davis also serves as Assistant Treasurer of other funds. Mr. Davis serves as Assistant Treasurer of FMR Capital, Inc. (2017-present) and is an employee of Fidelity Investments. Previously, Mr. Davis served as Vice President and Associate General Counsel of FMR LLC (diversified financial services company, 2003-2010).
Adrien E. Deberghes (1967)
Year of Election or Appointment: 2018
Assistant Treasurer
Mr. Deberghes also serves as an officer of other funds. He serves as Assistant Treasurer of FMR Capital, Inc. (2017-present), Executive Vice President of Fidelity Investments Money Management, Inc. (FIMM) (investment adviser firm, 2016-present), and is an employee of Fidelity Investments (2008-present). Previously, Mr. Deberghes served as President and Treasurer of certain Fidelity® funds (2013-2018). Prior to joining Fidelity Investments, Mr. Deberghes was Senior Vice President of Mutual Fund Administration at State Street Corporation (2007-2008), Senior Director of Mutual Fund Administration at Investors Bank & Trust (2005-2007), and Director of Finance for Dunkin' Brands (2000-2005). Previously, Mr. Deberghes served in other fund officer roles.
Joseph DeSantis (1959)
Year of Election or Appointment: 2015
Vice President
Mr. DeSantis also serves as Vice President of other funds. Mr. DeSantis serves as a Director of Fidelity Management & Research (Japan) Limited (investment adviser firm, 2016-present), Chief Investment Officer, Equities (2010-present) and is an employee of Fidelity Investments.
Stephanie J. Dorsey (1969)
Year of Election or Appointment: 2010
Assistant Treasurer
Ms. Dorsey also serves as an officer of other funds. Ms. Dorsey serves as Assistant Treasurer of FMR Capital, Inc. (2017-present), is an employee of Fidelity Investments (2008-present), and has served in other fund officer roles. Prior to joining Fidelity Investments, Ms. Dorsey served as Treasurer (2004-2008) of the JPMorgan Mutual Funds and Vice President (2004-2008) of JPMorgan Chase Bank.
Howard J. Galligan III (1966)
Year of Election or Appointment: 2014
Chief Financial Officer
Mr. Galligan also serves as Chief Financial Officer of other funds. Mr. Galligan serves as President of Fidelity Pricing and Cash Management Services (FPCMS) (2014-present) and as a Director of Strategic Advisers LLC (investment adviser firm, 2008-present). Previously, Mr. Galligan served as Chief Administrative Officer of Asset Management (2011-2014) and Chief Operating Officer and Senior Vice President of Investment Support for Strategic Advisers, Inc. (2003-2011).
Brian B. Hogan (1964)
Year of Election or Appointment: 2009
Vice President
Mr. Hogan also serves as Trustee or Vice President of other funds. Mr. Hogan serves as Head of Fidelity Investments’ Investment Solutions and Innovation organization (2018-present), and as a Director of FMR Investment Management (UK) Limited (investment adviser firm, 2015-present) and Fidelity SelectCo, LLC (investment adviser firm, 2014-present). Previously, Mr. Hogan served as Trustee of certain Fidelity® funds (2014-2018), President of the Equity Division of FMR (investment adviser firm, 2009-2018), Senior Vice President, Equity Research of FMR (2006-2009), and as a portfolio manager. Mr. Brian B. Hogan is not related to Mr. Colm A. Hogan.
Colm A. Hogan (1973)
Year of Election or Appointment: 2018
Deputy Treasurer
Mr. Hogan also serves as an officer of other funds. Mr. Hogan serves as Assistant Treasurer of FMR Capital, Inc. (2017-present) and is an employee of Fidelity Investments (2005-present). Previously, Mr. Hogan served as Assistant Treasurer of certain Fidelity® funds (2016-2018). Mr. Colm A. Hogan is not related to Mr. Brian B. Hogan.
Chris Maher (1972)
Year of Election or Appointment: 2013
Assistant Treasurer
Mr. Maher serves as Assistant Treasurer of other funds. Mr. Maher is Vice President of Valuation Oversight, serves as Assistant Treasurer of FMR Capital, Inc. (2017-present), and is an employee of Fidelity Investments. Previously, Mr. Maher served as Vice President of Asset Management Compliance (2013), Vice President of the Program Management Group of FMR (investment adviser firm, 2010-2013), and Vice President of Valuation Oversight (2008-2010).
Rieco E. Mello (1969)
Year of Election or Appointment: 2017
Assistant Treasurer
Mr. Mello also serves as Assistant Treasurer of other funds. Mr. Mello serves as Assistant Treasurer of FMR Capital, Inc. (2017-present) and is an employee of Fidelity Investments (1995-present).
Kenneth B. Robins (1969)
Year of Election or Appointment: 2018
Chief Compliance Officer
Mr. Robins also serves as an officer of other funds. Mr. Robins serves as Compliance Officer of Fidelity Management & Research Company and FMR Co., Inc. (investment adviser firms, 2016-present) and is an employee of Fidelity Investments (2004-present). Previously, Mr. Robins served as Executive Vice President of Fidelity Investments Money Management, Inc. (investment adviser firm, 2013-2016) and served in other fund officer roles.
Stacie M. Smith (1974)
Year of Election or Appointment: 2018
President and Treasurer
Ms. Smith also serves as an officer of other funds. Ms. Smith serves as Assistant Treasurer of FMR Capital, Inc. (2017-present), is an employee of Fidelity Investments (2009-present), and has served in other fund officer roles. Prior to joining Fidelity Investments, Ms. Smith served as Senior Audit Manager of Ernst & Young LLP (accounting firm, 1996-2009). Previously, Ms. Smith served as Assistant Treasurer (2013-2018) and Deputy Treasurer (2013-2016) of certain Fidelity® funds.
Marc L. Spector (1972)
Year of Election or Appointment: 2017
Assistant Treasurer
Mr. Spector also serves as an officer of other funds. Mr. Spector serves as Assistant Treasurer of FMR Capital, Inc. (2017-present) and is an employee of Fidelity Investments (2016-present). Prior to joining Fidelity Investments, Mr. Spector served as Director at the Siegfried Group (accounting firm, 2013-2016), and prior to Siegfried Group as audit senior manager at Deloitte & Touche (accounting firm, 2005-2013).
Renee Stagnone (1975)
Year of Election or Appointment: 2016
Assistant Treasurer
Ms. Stagnone also serves as an officer of other funds. Ms. Stagnone serves as Assistant Treasurer of FMR Capital, Inc. (2017-present) and is an employee of Fidelity Investments (1997-present). Previously, Ms. Stagnone served as Deputy Treasurer of certain Fidelity® funds (2013-2016).
Shareholder Expense Example
As a shareholder of the Fund, you incur two types of costs: (1) transaction costs, including sales charges (loads) on purchase payments or redemption proceeds, and (2) ongoing costs, including management fees, distribution and/or service (12b-1) fees and other Fund expenses. This Example is intended to help you understand your ongoing costs (in dollars) of investing in the Fund and to compare these costs with the ongoing costs of investing in other mutual funds.
The Example is based on an investment of $1,000 invested at the beginning of the period and held for the entire period (September 1, 2017 to February 28, 2018).
Actual Expenses
The first line of the accompanying table for each class of the Fund provides information about actual account values and actual expenses. You may use the information in this line, together with the amount you invested, to estimate the expenses that you paid over the period. Simply divide your account value by $1,000.00 (for example, an $8,600 account value divided by $1,000.00 = 8.6), then multiply the result by the number in the first line for a class of the Fund under the heading entitled "Expenses Paid During Period" to estimate the expenses you paid on your account during this period. A small balance maintenance fee of $12.00 that is charged once a year may apply for certain accounts with a value of less than $2,000. This fee is not included in the table below. If it was, the estimate of expenses you paid during the period would be higher, and your ending account value lower, by this amount. In addition, the Fund, as a shareholder in the underlying Fidelity Central Funds, will indirectly bear its pro-rata share of the fees and expenses incurred by the underlying Fidelity Central Funds. These fees and expenses are not included in the Fund's annualized expense ratio used to calculate the expense estimate in the table below.
Hypothetical Example for Comparison Purposes
The second line of the accompanying table for each class of the Fund provides information about hypothetical account values and hypothetical expenses based on a Class' actual expense ratio and an assumed rate of return of 5% per year before expenses, which is not the Class' actual return. The hypothetical account values and expenses may not be used to estimate the actual ending account balance or expenses you paid for the period. You may use this information to compare the ongoing costs of investing in the Fund and other funds. To do so, compare this 5% hypothetical example with the 5% hypothetical examples that appear in the shareholder reports of the other funds. A small balance maintenance fee of $12.00 that is charged once a year may apply for certain accounts with a value of less than $2,000. This fee is not included in the table below. If it was, the estimate of expenses you paid during the period would be higher, and your ending account value lower, by this amount. In addition, the Fund, as a shareholder in the underlying Fidelity Central Funds, will indirectly bear its pro-rata share of the fees and expenses incurred by the underlying Fidelity Central Funds. These fees and expenses are not included in the Fund's annualized expense ratio used to calculate the expense estimate in the table below.
Please note that the expenses shown in the table are meant to highlight your ongoing costs only and do not reflect any transaction costs. Therefore, the second line of the table is useful in comparing ongoing costs only, and will not help you determine the relative total costs of owning different funds. In addition, if these transactional costs were included, your costs would have been higher.
| | Annualized Expense Ratio-A | Beginning
Account Value
September 1, 2017 | Ending
Account Value
February 28, 2018 | Expenses Paid
During Period-B
September 1, 2017
to February 28, 2018 |
| Consumer Staples Portfolio | | | | |
| Class A | 1.05% | | | |
| Actual | | $1,000.00 | $972.80 | $5.14 |
| Hypothetical-C | | $1,000.00 | $1,019.59 | $5.26 |
| Class M | 1.32% | | | |
| Actual | | $1,000.00 | $971.50 | $6.45 |
| Hypothetical-C | | $1,000.00 | $1,018.25 | $6.61 |
| Class C | 1.79% | | | |
| Actual | | $1,000.00 | $969.20 | $8.74 |
| Hypothetical-C | | $1,000.00 | $1,015.92 | $8.95 |
| Consumer Staples | .76% | | | |
| Actual | | $1,000.00 | $974.20 | $3.72 |
| Hypothetical-C | | $1,000.00 | $1,021.03 | $3.81 |
| Class I | .78% | | | |
| Actual | | $1,000.00 | $974.10 | $3.82 |
| Hypothetical-C | | $1,000.00 | $1,020.93 | $3.91 |
| Gold Portfolio | | | | |
| Class A | 1.17% | | | |
| Actual | | $1,000.00 | $845.70 | $5.35 |
| Hypothetical-C | | $1,000.00 | $1,018.99 | $5.86 |
| Class M | 1.47% | | | |
| Actual | | $1,000.00 | $844.20 | $6.72 |
| Hypothetical-C | | $1,000.00 | $1,017.50 | $7.35 |
| Class C | 1.83% | | | |
| Actual | | $1,000.00 | $843.20 | $8.36 |
| Hypothetical-C | | $1,000.00 | $1,015.72 | $9.15 |
| Gold | .85% | | | |
| Actual | | $1,000.00 | $847.50 | $3.89 |
| Hypothetical-C | | $1,000.00 | $1,020.58 | $4.26 |
| Class I | .83% | | | |
| Actual | | $1,000.00 | $847.50 | $3.80 |
| Hypothetical-C | | $1,000.00 | $1,020.68 | $4.16 |
| Materials Portfolio | | | | |
| Class A | 1.06% | | | |
| Actual | | $1,000.00 | $1,080.90 | $5.47 |
| Hypothetical-C | | $1,000.00 | $1,019.54 | $5.31 |
| Class M | 1.35% | | | |
| Actual | | $1,000.00 | $1,079.30 | $6.96 |
| Hypothetical-C | | $1,000.00 | $1,018.10 | $6.76 |
| Class C | 1.81% | | | |
| Actual | | $1,000.00 | $1,076.80 | $9.32 |
| Hypothetical-C | | $1,000.00 | $1,015.82 | $9.05 |
| Materials | .78% | | | |
| Actual | | $1,000.00 | $1,082.40 | $4.03 |
| Hypothetical-C | | $1,000.00 | $1,020.93 | $3.91 |
| Class I | .78% | | | |
| Actual | | $1,000.00 | $1,082.50 | $4.03 |
| Hypothetical-C | | $1,000.00 | $1,020.93 | $3.91 |
| Telecommunications Portfolio | | | | |
| Class A | 1.14% | | | |
| Actual | | $1,000.00 | $946.90 | $5.50 |
| Hypothetical-C | | $1,000.00 | $1,019.14 | $5.71 |
| Class M | 1.50% | | | |
| Actual | | $1,000.00 | $945.20 | $7.23 |
| Hypothetical-C | | $1,000.00 | $1,017.36 | $7.50 |
| Class C | 1.86% | | | |
| Actual | | $1,000.00 | $943.40 | $8.96 |
| Hypothetical-C | | $1,000.00 | $1,015.57 | $9.30 |
| Telecommunications | .82% | | | |
| Actual | | $1,000.00 | $948.20 | $3.96 |
| Hypothetical-C | | $1,000.00 | $1,020.73 | $4.11 |
| Class I | .82% | | | |
| Actual | | $1,000.00 | $948.40 | $3.96 |
| Hypothetical-C | | $1,000.00 | $1,020.73 | $4.11 |
A Annualized expense ratio reflects expenses net of applicable fee waivers.
B Expenses are equal to each Class' annualized expense ratio, multiplied by the average account value over the period, multiplied by 181/ 365 (to reflect the one-half year period).
C 5% return per year before expenses
Distributions (Unaudited)
The Board of Trustees of each fund voted to pay to shareholders of record at the opening of business on record date, the following distributions per share derived from capital gains realized from sales of portfolio securities and dividends derived from net investment income:
| | Pay Date | Record Date | Dividends | Capital Gains |
| Consumer Staples Portfolio | | | | |
| Class A | 4/12/18 | 4/11/18 | $0.207 | $5.129 |
| Class M | 4/12/18 | 4/11/18 | $0.166 | $5.129 |
| Class C | 4/12/18 | 4/11/18 | $0.088 | $5.129 |
| Consumer Staples | 4/12/18 | 4/11/18 | $0.255 | $5.129 |
| Class I | 4/12/18 | 4/11/18 | $0.251 | $5.129 |
| Gold Portfolio | | | | |
| Class A | 4/12/18 | 4/11/18 | $0.000 | $0.000 |
| Class M | 4/12/18 | 4/11/18 | $0.000 | $0.000 |
| Class C | 4/12/18 | 4/11/18 | $0.000 | $0.000 |
| Gold | 4/12/18 | 4/11/18 | $0.000 | $0.000 |
| Class I | 4/12/18 | 4/11/18 | $0.000 | $0.000 |
| Materials Portfolio | | | | |
| Class A | 4/12/18 | 4/11/18 | $0.077 | $4.161 |
| Class M | 4/12/18 | 4/11/18 | $0.035 | $4.161 |
| Class C | 4/12/18 | 4/11/18 | $0.000 | $4.161 |
| Materials | 4/12/18 | 4/11/18 | $0.119 | $4.161 |
| Class I | 4/12/18 | 4/11/18 | $0.121 | $4.161 |
| Telecommunications Portfolio | | | | |
| Class A | 4/12/18 | 4/11/18 | $0.183 | $0.615 |
| Class M | 4/12/18 | 4/11/18 | $0.143 | $0.615 |
| Class C | 4/12/18 | 4/11/18 | $0.109 | $0.615 |
| Telecommunications | 4/12/18 | 4/11/18 | $0.213 | $0.615 |
| Class I | 4/12/18 | 4/11/18 | $0.210 | $0.615 |
|
The funds hereby designate as capital gain dividend the amounts noted below for the taxable year ended February 28, 2018 or, if subsequently determined to be different, the net capital gain of such year.
| Consumer Staples Portfolio | $297,296,339 |
| Materials Portfolio | $150,893,353 |
| Telecommunications Portfolio | $50,643,126 |
|
A percentage of the dividends distributed during the fiscal year for the following funds qualify for the dividends–received deduction for corporate shareholders:
| | Class A | Class M | Class C | Retail | Class I |
| Consumer Staples Portfolio | | | | | |
| April 2017 | 100% | 100% | 100% | 86% | 84% |
| December 2017 | 100% | 100% | 100% | 100% | 100% |
| Gold Portfolio | | | | | |
| April 2017 | 11% | 14% | 23% | 8% | 8% |
| Materials Portfolio | | | | | |
| April 2017 | 100% | 100% | 100% | 100% | 100% |
| December 2017 | 100% | 100% | 100% | 100% | 100% |
| Telecommunications Portfolio | | | | | |
| April 2017 | 100% | 100% | 100% | 100% | 100% |
| December 2017 | 100% | 100% | 100% | 100% | 100% |
|
A percentage of the dividends distributed during the fiscal year for the following funds may be taken into account as a dividend for purposes of the maximum rate under section 1(h)(11) of the Internal Revenue Code.
| | Class A | Class M | Class C | Retail | Class I |
| Consumer Staples Portfolio | | | | | |
| April 2017 | 100% | 100% | 100% | 100% | 100% |
| December 2017 | 100% | 100% | 100% | 100% | 100% |
| Gold Portfolio | | | | | |
| April 2017 | 38% | 49% | 80% | 29% | 28% |
| Materials Portfolio | | | | | |
| April 2017 | 100% | 100% | 100% | 100% | 100% |
| December 2017 | 100% | 100% | 100% | 100% | 100% |
| Telecommunications Portfolio | | | | | |
| April 2017 | 100% | 100% | 100% | 93% | 92% |
| December 2017 | 100% | 100% | 100% | 100% | 100% |
|
The amounts per share which represent income derived from sources within, and taxes paid to, foreign countries or possessions of the United States are as follows:
| | Pay Date | Income | Taxes |
| Gold Portfolio | | | |
| Class A | 04/13/17 | $0.0102 | $0.0021 |
| Class M | 04/13/17 | $0.0079 | $0.0021 |
| Class C | 04/13/17 | $0.0048 | $0.0021 |
| Gold | 04/13/17 | $0.0136 | $0.0021 |
| Class I | 04/13/17 | $0.0142 | $0.0021 |
|
The funds will notify shareholders in January 2019 of amounts for use in preparing 2018 income tax returns.
Board Approval of Investment Advisory Contracts and Management Fees
Consumer Staples Portfolio
Gold Portfolio
Materials Portfolio
Telecommunications Portfolio
Each year, the Board of Trustees, including the Independent Trustees (together, the Board), votes on the renewal of the management contract with Fidelity SelectCo, LLC (SelectCo), an affiliate of Fidelity Management & Research Company (FMR), and the sub-advisory agreements with affiliates of FMR (together, the Advisory Contracts) for each fund. SelectCo and the sub-advisers are collectively referred to herein as the Investment Advisers. The Board, assisted by the advice of fund counsel and Independent Trustees' counsel, requests and considers a broad range of information relevant to the renewal of the Advisory Contracts throughout the year.
The Board meets regularly and, at each of its meetings, covers an extensive agenda of topics and materials and considers factors that are relevant to its annual consideration of the renewal of each fund's Advisory Contracts, including the services and support provided to each fund and its shareholders. The Board has established four standing committees (Committees) — Operations, Audit, Fair Valuation, and Governance and Nominating — each composed of and chaired by Independent Trustees with varying backgrounds, to which the Board has assigned specific subject matter responsibilities in order to enhance effective decision-making by the Board. The Operations Committee, of which all of the Independent Trustees are members, meets regularly throughout the year and considers, among other matters, information specifically related to the annual consideration of the renewal of each fund's Advisory Contracts. The Board, acting directly and through its Committees, requests and receives information concerning the annual consideration of the renewal of each fund's Advisory Contracts. The Board also meets as needed to review matters specifically related to the Board's annual consideration of the renewal of the Advisory Contracts. Members of the Board may also meet with trustees of other Fidelity funds through ad hoc joint committees to discuss certain matters relevant to all of the Fidelity funds.
At its January 2018 meeting, the Board unanimously determined to renew each fund's Advisory Contracts. In reaching its determination, the Board considered all factors it believed relevant, including (i) the nature, extent, and quality of the services to be provided to each fund and its shareholders (including the investment performance of each fund); (ii) the competitiveness of each fund's management fee and total expense ratio relative to peer funds; (iii) the total costs of the services to be provided by and the profits to be realized by Fidelity from its relationships with each fund; and (iv) the extent to which, if any, economies of scale exist and would be realized as each fund grows, and whether any economies of scale are appropriately shared with fund shareholders.
In considering whether to renew the Advisory Contracts for each fund, the Board reached a determination, with the assistance of fund counsel and Independent Trustees' counsel and through the exercise of its business judgment, that the renewal of the Advisory Contracts was in the best interests of each fund and its shareholders and that the compensation payable under the Advisory Contracts was fair and reasonable. The Board's decision to renew the Advisory Contracts was not based on any single factor, but rather was based on a comprehensive consideration of all the information provided to the Board at its meetings throughout the year. The Board, in reaching its determination to renew the Advisory Contracts, was aware that shareholders of each fund have a broad range of investment choices available to them, including a wide choice among funds offered by Fidelity's competitors, and that each fund's shareholders, who have the opportunity to review and weigh the disclosure provided by the fund in its prospectus and other public disclosures, have chosen to invest in that fund, which is part of the Fidelity family of funds.
Amendment to Group Fee Rate. The Board also ratified an amendment to the management contract for each fund to add an additional breakpoint to the group fee schedule, which was effective October 1, 2017. The Board noted that the additional breakpoint would result in lower management fee rates to the extent that assets under management that are included in group fee calculations increase above the new breakpoint.
Nature, Extent, and Quality of Services Provided. The Board considered the staffing of the Investment Advisers as it relates to the funds, including the backgrounds of investment personnel of SelectCo, and also considered the funds' investment objectives, strategies, and related investment philosophies. The Independent Trustees also had discussions with senior management of Fidelity's investment operations and investment groups. The Board considered the structure of the investment personnel compensation program and whether this structure provides appropriate incentives to act in the best interests of each fund. Additionally, the Board considered the portfolio managers' investments, if any, in the funds that they manage.
Resources Dedicated to Investment Management and Support Services. The Board reviewed the general qualifications and capabilities of the Investment Advisers' investment staffs, including their size, education, experience, and resources, as well as Fidelity's approach to recruiting, training, managing, and compensating investment personnel. The Board noted that Fidelity has continued to increase the resources devoted to non-U.S. offices, including expansion of Fidelity's global investment organization. The Board also noted that Fidelity's analysts have extensive resources, tools and capabilities that allow them to conduct sophisticated quantitative and fundamental analysis, as well as credit analysis of issuers, counterparties and guarantors. Further, the Board considered that Fidelity's investment professionals have sufficient access to global information and data so as to provide competitive investment results over time, and that those professionals also have access to sophisticated tools that permit them to assess portfolio construction and risk and performance attribution characteristics continuously, as well as to transmit new information and research conclusions rapidly around the world. Additionally, in its deliberations, the Board considered Fidelity's trading, risk management, compliance, and technology and operations capabilities and resources, which are integral parts of the investment management process.
Shareholder and Administrative Services. The Board considered (i) the nature, extent, quality, and cost of advisory, administrative, and shareholder services performed by the Investment Advisers and their affiliates under the Advisory Contracts and under separate agreements covering transfer agency, pricing and bookkeeping, and securities lending services for each fund; (ii) the nature and extent of the supervision of third party service providers, principally custodians, subcustodians, and pricing vendors; and (iii) the resources devoted to, and the record of compliance with, each fund's compliance policies and procedures. The Board also reviewed the allocation of fund brokerage, including allocations to brokers affiliated with the Investment Advisers, the use of brokerage commissions to pay fund expenses, and the use of "soft" commission dollars to pay for research services.
The Board noted that the growth of fund assets over time across the complex allows Fidelity to reinvest in the development of services designed to enhance the value or convenience of the Fidelity funds as investment vehicles. These services include 24-hour access to account information and market information through telephone representatives and over the Internet, investor education materials and asset allocation tools, and the expanded availability of Fidelity Investor Centers.
The Board noted that it and the boards of certain other Fidelity funds had formed an ad hoc Committee on Transfer Agency Fees to review the variety of transfer agency fee structures throughout the industry and Fidelity's competitive positioning with respect to industry participants.
Investment in a Large Fund Family. The Board considered the benefits to shareholders of investing in a Fidelity fund, including the benefits of investing in a fund that is part of a large family of funds offering a variety of investment disciplines and providing a large variety of mutual fund investor services. The Board noted that Fidelity had taken, or had made recommendations that resulted in the Fidelity funds taking, a number of actions over the previous year that benefited particular funds, including: (i) continuing to dedicate additional resources to Fidelity's investment research process, which includes meetings with management of issuers in which the funds invest, and to the support of the senior management team that oversees asset management; (ii) continuing efforts to enhance Fidelity's global research capabilities; (iii) launching new funds and making other enhancements to meet client needs; (iv) launching new share classes of existing funds; (v) eliminating purchase minimums and broadening eligibility requirements for certain lower-priced share classes; (vi) reducing management fees and total expenses for certain growth equity funds and index funds; (vii) lowering expense caps for certain existing funds and classes to reduce expenses borne by shareholders; (viii) eliminating short-term redemption fees for certain funds; (ix) introducing a new pricing structure for certain funds of funds that is expected to reduce overall expenses paid by shareholders; (x) rationalizing product lines and gaining increased efficiencies through proposals for fund mergers and share class consolidations; (xi) continuing to develop, acquire and implement systems and technology to improve services to the funds and shareholders, strengthen information security, and increase efficiency; and (xii) implementing enhancements to further strengthen Fidelity's product line to increase investors' probability of success in achieving their investment goals, including retirement income goals.
Investment Performance. The Board considered whether each fund has operated in accordance with its investment objective, as well as its record of compliance with its investment restrictions and its performance history.
The Board took into account discussions with representatives of SelectCo about fund investment performance that occur at Board meetings throughout the year. In this regard the Board noted that as part of regularly scheduled fund reviews and other reports to the Board on fund performance, the Board considers annualized return information for each fund for different time periods, measured against a securities market index ("benchmark index"). In its evaluation of fund investment performance at meetings throughout the year, the Board gave particular attention to information indicating underperformance of certain Fidelity funds for specific time periods and discussed with the Investment Advisers the reasons for such underperformance. Materials Portfolio underperformed its benchmark for the one-, three-, and five-year periods ended June 30, 2017, and as a result, the Board will continue to discuss with SelectCo the steps it is taking to address each such fund's performance.
In addition to reviewing absolute and relative fund performance, the Independent Trustees periodically consider the appropriateness of fund performance metrics in evaluating the results achieved. In general, the Independent Trustees believe that fund performance should be evaluated based on net performance (after fees and expenses) of both the highest performing and lowest performing fund share classes, where applicable, compared to appropriate benchmark indices, over appropriate time periods that may include full market cycles, taking into account relevant factors, including the following: general market conditions; issuer-specific information; and fund cash flows and other factors. Depending on the circumstances, the Independent Trustees may be satisfied with a fund's performance notwithstanding that it lags its benchmark index for certain periods.
The Independent Trustees recognize that shareholders evaluate performance on a net basis over their own holding periods, for which one-, three-, and five-year periods are often used as a proxy. For this reason, the performance information reviewed by the Board also included net cumulative total return information for each fund and an appropriate benchmark index for the most recent one-, three-, and five-year periods ended June 30, 2017.
Based on its review, the Board concluded that the nature, extent, and quality of services provided to each fund under the Advisory Contracts should continue to benefit the shareholders of each fund.
Competitiveness of Management Fee and Total Expense Ratio. The Board considered each fund's management fee and total expense ratio compared to "mapped groups" of competitive funds and classes created for the purpose of facilitating the Trustees' analysis of the competitiveness of management fees and total expenses. Fidelity creates "mapped groups" by combining similar Lipper investment objective categories that have comparable investment mandates. For this purpose, all sector focused equity funds are grouped in the same mapped group. Combining Lipper investment objective categories aids the Board's management fee and total expense ratio comparisons by broadening the competitive group used for comparison.
Management Fee. The Board considered two proprietary management fee comparisons for the 12-month periods ended June 30 shown in basis points (BP) in the charts below. The group of Lipper funds used by the Board for management fee comparisons is referred to below as the "Total Mapped Group." The Total Mapped Group comparison focuses on a fund's standing in terms of gross management fees before expense reimbursements or caps relative to the total universe of funds with comparable investment mandates (
i.e., sector equities), regardless of whether their management fee structures also are comparable. Funds with comparable management fee structures have similar management fee contractual arrangements (
e.g., flat rate charged for advisory services, all-inclusive fee rate,
etc.). "TMG %" represents the percentage of funds in the Total Mapped Group that had management fees that were lower than a fund's. For example, a hypothetical TMG % of 20% would mean that 80% of the funds in the Total Mapped Group had higher, and 20% had lower, management fees than a fund. The funds' actual TMG %s and the number of funds in the Total Mapped Group are in the charts below. The "Asset-Size Peer Group" (ASPG) comparison focuses on a fund's standing relative to a subset of non-Fidelity funds within the Total Mapped Group that are similar in size and management fee structure. For example, if a fund is in the first quartile of the ASPG, the fund's management fee ranks in the least expensive or lowest 25% of funds in the ASPG. The ASPG represents at least 15% of the funds in the Total Mapped Group with comparable asset size and management fee structures, subject to a minimum of 50 funds (or all funds in the Total Mapped Group if fewer than 50). Additional information, such as the ASPG quartile in which a fund's management fee rate ranked, is also included in the charts and considered by the Board.
Consumer Staples Portfolio
Gold Portfolio

Materials Portfolio
Telecommunications Portfolio
The Board noted that each fund's management fee rate ranked below the median of its Total Mapped Group and below the median of its ASPG for the 12-month period ended June 30, 2017.
The Board noted that it and the boards of other Fidelity funds formed an ad hoc Committee on Group Fee, which meets periodically, to conduct an in-depth review of the "group fee" component of the management fee of funds with such management fee structures. The Committee's focus included the mechanics of the group fee, the competitive landscape of group fee structures, Fidelity funds with no group fee component and investment products not included in group fee assets. The Board also considered that, for funds subject to the group fee, FMR agreed to voluntarily waive fees over a specified period of time in amounts designed to account for assets converted from certain funds to certain collective investment trusts.
Based on its review, the Board concluded that each fund's management fee is fair and reasonable in light of the services that each fund receives and the other factors considered.
Total Expense Ratio. In its review of the total expense ratio of each class of each fund, the Board considered the fund's management fee rate as well as other fund or class expenses, as applicable, such as transfer agent fees, pricing and bookkeeping fees, fund-paid 12b-1 fees, and custodial, legal, and audit fees. The Board also noted that Fidelity may agree to waive fees and expenses from time to time, and the extent to which, if any, it has done so for each fund. As part of its review, the Board also considered the current and historical total expense ratios of each class of each fund compared to competitive fund median expenses. Each class of each fund is compared to those funds and classes in the Total Mapped Group (used by the Board for management fee comparisons) that have a similar sales load structure.
For each of Consumer Staples Portfolio and Materials Portfolio, the Board noted that the total expense ratio of each class ranked below the competitive median for the 12-month period ended June 30, 2017.
For each of Gold Portfolio and Telecommunications Portfolio, the Board noted that the total expense ratio of each of Class A, Class C, Class I, and the retail class ranked below the competitive median for the 12-month period ended June 30, 2017 and the total expense ratio of Class M (formerly Class T) ranked above the competitive median for the 12-month period ended June 30, 2017. The Board considered that, in general, various factors can affect total expense ratios. The Board noted that the total expense ratio of Class M of certain funds was above the competitive median primarily because of higher 12b-1 fees on Class M as compared to most competitor funds. Class M has a higher 12b-1 fee, but a lower front-end sales charge, than traditionally priced front-end sales charge classes. The Board considered that Class M is primarily sold load-waived in the retirement plan market where its 0.50% 12b-1 fee is comparable to competing no-load, higher 12b-1 fee classes designed specifically for retirement plans. The Board noted that each fund offers multiple classes, each of which has a different sales load and 12b-1 fee structure, and that the multiple structures are intended to offer a range of pricing options for the intermediary market. The Board also noted that the total expense ratios of the classes of each fund vary primarily by the level of their 12b-1 fees, although differences in transfer agent fees may also cause expenses to vary from class to class.
Fees Charged to Other Fidelity Clients. The Board also considered Fidelity fee structures and other information with respect to clients of Fidelity, such as other funds advised or subadvised by Fidelity, pension plan clients, and other institutional clients with similar mandates. The Board noted that an ad hoc joint committee created by it and the boards of other Fidelity funds periodically reviews and compares Fidelity's institutional investment advisory business with its business of providing services to the Fidelity funds, including the differences in services provided, fees charged, and costs incurred, as well as competition in their respective marketplaces.
Based on its review of total expense ratios and fees charged to other Fidelity clients, the Board concluded that, although the total expense ratio of Class M of each of Gold Portfolio and Telecommunications Portfolio was above the median of the universe presented for comparison, the total expense ratio of each class of each fund was reasonable in light of the services that each fund and its shareholders receive and the other factors considered.
Costs of the Services and Profitability. The Board considered the revenues earned and the expenses incurred by Fidelity in conducting the business of developing, marketing, distributing, managing, administering and servicing each fund and servicing each fund's shareholders. The Board also considered the level of Fidelity's profits in respect of all the Fidelity funds.
On an annual basis, Fidelity presents to the Board information about the profitability of its relationships with each fund. Fidelity calculates profitability information for each fund, as well as aggregate profitability information for groups of Fidelity funds and all Fidelity funds, using a series of detailed revenue and cost allocation methodologies which originate with the books and records of Fidelity on which Fidelity's audited financial statements are based. The Audit Committee of the Board reviews any significant changes from the prior year's methodologies.
PricewaterhouseCoopers LLP (PwC), independent registered public accounting firm and auditor to Fidelity and certain Fidelity funds, has been engaged annually by the Board as part of the Board's assessment of the profitability analysis used by Fidelity. PwC's engagement includes the review and assessment of Fidelity's methodologies used in determining the revenues and expenses attributable to Fidelity's mutual fund business, and completion of agreed-upon procedures in respect of the mathematical accuracy of the fund profitability information and its conformity to established allocation methodologies. After considering PwC's reports issued under the engagement and information provided by Fidelity, the Board concluded that while other allocation methods may also be reasonable, Fidelity's profitability methodologies are reasonable in all material respects.
The Board also reviewed Fidelity's non-fund businesses and potential fall-out benefits related to the mutual fund business as well as cases where Fidelity's affiliates may benefit from or be related to the funds' business.
The Board considered the costs of the services provided by and the profits realized by Fidelity in connection with the operation of each fund and was satisfied that the profitability was not excessive.
Economies of Scale. The Board considered whether there have been economies of scale in respect of the management of the Fidelity funds, whether the Fidelity funds (including each fund) have appropriately benefited from any such economies of scale, and whether there is potential for realization of any further economies of scale. The Board considered the extent to which each fund will benefit from economies of scale as assets grow through increased services to the fund, through waivers or reimbursements, or through fee or expense ratio reductions. The Board also noted that a committee (the Economies of Scale Committee) created by it and the boards of other Fidelity funds periodically analyzes whether Fidelity attains economies of scale in respect of the management and servicing of the Fidelity funds, whether the Fidelity funds have appropriately benefited from such economies of scale, and whether there is potential for realization of any further economies of scale.
The Board recognized that each fund's management contract incorporates a "group fee" structure, which provides for lower group fee rates as total group assets increase, and for higher group fee rates as total group assets decrease (with "group assets" defined to include fund assets under SelectCo's management plus assets under FMR's management). SelectCo calculates the group fee rates based on a tiered asset "breakpoint" schedule that varies based on asset class. The Board considered that the group fee is designed to deliver the benefits of economies of scale to fund shareholders when total group assets increase, even if assets of any particular fund are unchanged or have declined, because some portion of Fidelity's costs are attributable to services provided to all Fidelity funds, and all funds benefit if those costs can be allocated among more assets. The Board concluded that, given the group fee structure, fund shareholders will benefit from lower management fees as group assets increase at the fund complex level, regardless of whether Fidelity achieves any such economies of scale.
The Board concluded, taking into account the analysis of the Economies of Scale Committee, that economies of scale, if any, are being appropriately shared between fund shareholders and Fidelity.
Additional Information Requested by the Board. In order to develop fully the factual basis for consideration of the Fidelity funds' advisory contracts, the Board requested and received additional information on certain topics, including: (i) Fidelity's fund profitability methodology, profitability trends for certain funds, and the impact of certain factors on fund profitability results; (ii) portfolio manager changes that have occurred during the past year and the amount of the investment that each portfolio manager has made in the Fidelity fund(s) that he or she manages; (iii) Fidelity's compensation structure for portfolio managers, research analysts, and other key personnel, including its effects on fund profitability; (iv) comparisons to institutional products; (v) the arrangements with and compensation paid to certain fund sub-advisers on behalf of the Fidelity funds; (vi) the impact of proposed changes to contractual expense cap arrangements in place for certain funds; (vii) Fidelity's long-term expectations for its offerings in the workplace investing channel; (viii) the methodology with respect to evaluating competitive fund data and peer group classifications and fee comparisons; (ix) the presentation of certain fund performance information; (x) Fidelity's transfer agent fee, expense, and service structures for different funds and classes, including the increased use of omnibus accounts and lower pricing in the retirement channel; (xi) fluctuations in trading expenses; (xii) explanations regarding the relative total expense ratios of certain funds and classes; and (xiii) Fidelity's expectations regarding the future asset levels of certain funds.
Based on its evaluation of all of the conclusions noted above, and after considering all factors it believed relevant, the Board concluded that the advisory fee structures are fair and reasonable, and that each fund's Advisory Contracts should be renewed.
Proxy Voting Results
A special meeting of shareholders was held on December 8, 2017. The results of votes taken among shareholders on the proposals before them are reported below. Each vote reported represents one dollar of net asset value held on the record date for the meeting.
PROPOSAL 1
To elect a Board of Trustees.
| | # of
Votes | % of
Votes |
| James C. Curvey |
| Affirmative | 40,874,579,146.19 | 94.146 |
| Withheld | 2,541,618,753.48 | 5.854 |
| TOTAL | 43,416,197,899.67 | 100.000 |
| Dennis J. Dirks |
| Affirmative | 41,093,243,800.03 | 94.650 |
| Withheld | 2,322,954,099.64 | 5.350 |
| TOTAL | 43,416,197,899.67 | 100.000 |
| Donald F. Donahue |
| Affirmative | 41,121,116,505.64 | 94.714 |
| Withheld | 2,295,081,394.03 | 5.286 |
| TOTAL | 43,416,197,899.67 | 100.000 |
| Alan J. Lacy |
| Affirmative | 41,091,494,851.72 | 94.646 |
| Withheld | 2,324,703,047.95 | 5.354 |
| TOTAL | 43,416,197,899.67 | 100.00 |
| Ned C. Lautenbach |
| Affirmative | 40,970,733,721.42 | 94.368 |
| Withheld | 2,445,464,178.25 | 5.632 |
| TOTAL | 43,416,197,899.67 | 100.000 |
| Joseph Mauriello |
| Affirmative | 41,021,688,840.89 | 94.485 |
| Withheld | 2,394,509,058.78 | 5.515 |
| TOTAL | 43,416,197,899.67 | 100.000 |
| Charles S. Morrison |
| Affirmative | 41,163,534,997.01 | 94.812 |
| Withheld | 2,252,662,902.66 | 5.188 |
| TOTAL | 43,416,197,899.67 | 100.000 |
| Cornelia M. Small |
| Affirmative | 41,061,752,034.66 | 94.578 |
| Withheld | 2,354,445,865.01 | 5.422 |
| TOTAL | 43,416,197,899.67 | 100.000 |
| Garnett A. Smith |
| Affirmative | 41,061,939,407.02 | 94.578 |
| Withheld | 2,354,258,492.65 | 5.422 |
| TOTAL | 43,416,197,899.67 | 100.000 |
| David M. Thomas |
| Affirmative | 41,102,875,738.06 | 94.672 |
| Withheld | 2,313,322,161.61 | 5.328 |
| TOTAL | 43,416,197,899.67 | 100.000 |
| Michael E. Wiley |
| Affirmative | 41,112,279,187.11 | 94.694 |
| Withheld | 2,303,918,712.56 | 5.306 |
| TOTAL | 43,416,197,899.67 | 100.000 |
PROPOSAL 2
To eliminate a fundamental investment policy for Consumer Staples Portfolio.
| | # of
Votes | % of
Votes |
| Affirmative | 1,047,860,661.69 | 67.586 |
| Against | 172,474,017.24 | 11.125 |
| Abstain | 142,090,530.94 | 9.164 |
| Broker Non-Vote | 188,000,815.27 | 12.125 |
| TOTAL | 1,550,426,025.14 | 100.000 |
PROPOSAL 2
To eliminate a fundamental investment policy for Gold Portfolio.
| | # of
Votes | % of
Votes |
| Affirmative | 551,653,263.84 | 68.465 |
| Against | 97,346,103.67 | 12.082 |
| Abstain | 55,639,285.11 | 6.905 |
| Broker Non-Vote | 101,109,455.71 | 12.548 |
| TOTAL | 805,748,108.33 | 100.000 |
PROPOSAL 2
To eliminate a fundamental investment policy for Materials Portfolio.
| | # of
Votes | % of
Votes |
| Affirmative | 646,463,758.16 | 67.767 |
| Against | 104,408,119.98 | 10.945 |
| Abstain | 75,339,602.11 | 7.898 |
| Broker Non-Vote | 127,741,389.12 | 13.390 |
| TOTAL | 953,952,869.37 | 100.000 |
PROPOSAL 2
To eliminate a fundamental investment policy for Telecommunications Portfolio.
| | # of
Votes | % of
Votes |
| Affirmative | 162,019,030.04 | 74.073 |
| Against | 27,461,064.77 | 12.555 |
| Abstain | 16,983,637.20 | 7.765 |
| Broker Non-Vote | 12,265,953.67 | 5.607 |
| TOTAL | 218,729,685.68 | 100.000 |
PROPOSAL 3
To modify Gold Portfolio's fundamental concentration policy.
| | # of
Votes | % of
Votes |
| Affirmative | 569,696,386.64 | 70.705 |
| Against | 80,140,442.00 | 9.946 |
| Abstain | 54,801,823.98 | 6.801 |
| Broker Non-Vote | 101,109,455.71 | 12.548 |
| TOTAL | 805,748,108.33 | 100.000 |
PROPOSAL 3
To modify Telecommunications Portfolio's fundamental concentration policy.
| | # of
Votes | % of
Votes |
| Affirmative | 165,072,876.21 | 75.469 |
| Against | 22,149,640.69 | 10.127 |
| Abstain | 19,241,215.11 | 8.797 |
| Broker Non-Vote | 12,265,953.67 | 5.607 |
| TOTAL | 218,729,685.68 | 100.000 |
|
| |
ASGMT-ANN-0418
1.845780.111
Fidelity® Select Portfolios®
Consumer Staples Sector Consumer Staples Portfolio
Annual Report February 28, 2018 |
|
Contents
To view a fund's proxy voting guidelines and proxy voting record for the 12-month period ended June 30, visit http://www.fidelity.com/proxyvotingresults or visit the Securities and Exchange Commission's (SEC) web site at http://www.sec.gov.
You may also call 1-800-544-8544 to request a free copy of the proxy voting guidelines.
Standard & Poor's, S&P and S&P 500 are registered service marks of The McGraw-Hill Companies, Inc. and have been licensed for use by Fidelity Distributors Corporation.
Other third-party marks appearing herein are the property of their respective owners.
All other marks appearing herein are registered or unregistered trademarks or service marks of FMR LLC or an affiliated company. © 2018 FMR LLC. All rights reserved.
This report and the financial statements contained herein are submitted for the general information of the shareholders of the Fund. This report is not authorized for distribution to prospective investors in the Fund unless preceded or accompanied by an effective prospectus.
A fund files its complete schedule of portfolio holdings with the SEC for the first and third quarters of each fiscal year on Form N-Q. Forms N-Q are available on the SEC’s web site at http://www.sec.gov. A fund's Forms N-Q may be reviewed and copied at the SEC’s Public Reference Room in Washington, DC. Information regarding the operation of the SEC's Public Reference Room may be obtained by calling 1-800-SEC-0330.
For a complete list of a fund's portfolio holdings, view the most recent holdings listing, semiannual report, or annual report on Fidelity's web site at http://www.fidelity.com, http://www.institutional.fidelity.com, or http://www.401k.com, as applicable.
NOT FDIC INSURED •MAY LOSE VALUE •NO BANK GUARANTEE
Neither the Fund nor Fidelity Distributors Corporation is a bank.
Performance: The Bottom Line
Average annual total return reflects the change in the value of an investment, assuming reinvestment of distributions from dividend income and capital gains (the profits earned upon the sale of securities that have grown in value, if any) and assuming a constant rate of performance each year. The hypothetical investment and the average annual total returns do not reflect the deduction of taxes that a shareholder would pay on fund distributions or the redemption of fund shares. During periods of reimbursement by Fidelity, a fund’s total return will be greater than it would be had the reimbursement not occurred. How a fund did yesterday is no guarantee of how it will do tomorrow.
Average Annual Total Returns
| For the periods ended February 28, 2018 | Past 1 year | Past 5 years | Past 10 years |
| Consumer Staples Portfolio | (1.40)% | 7.73% | 8.37% |
$10,000 Over 10 Years
Let's say hypothetically that $10,000 was invested in Consumer Staples Portfolio, a class of the fund, on February 29, 2008.
The chart shows how the value of your investment would have changed, and also shows how the S&P 500® Index performed over the same period.
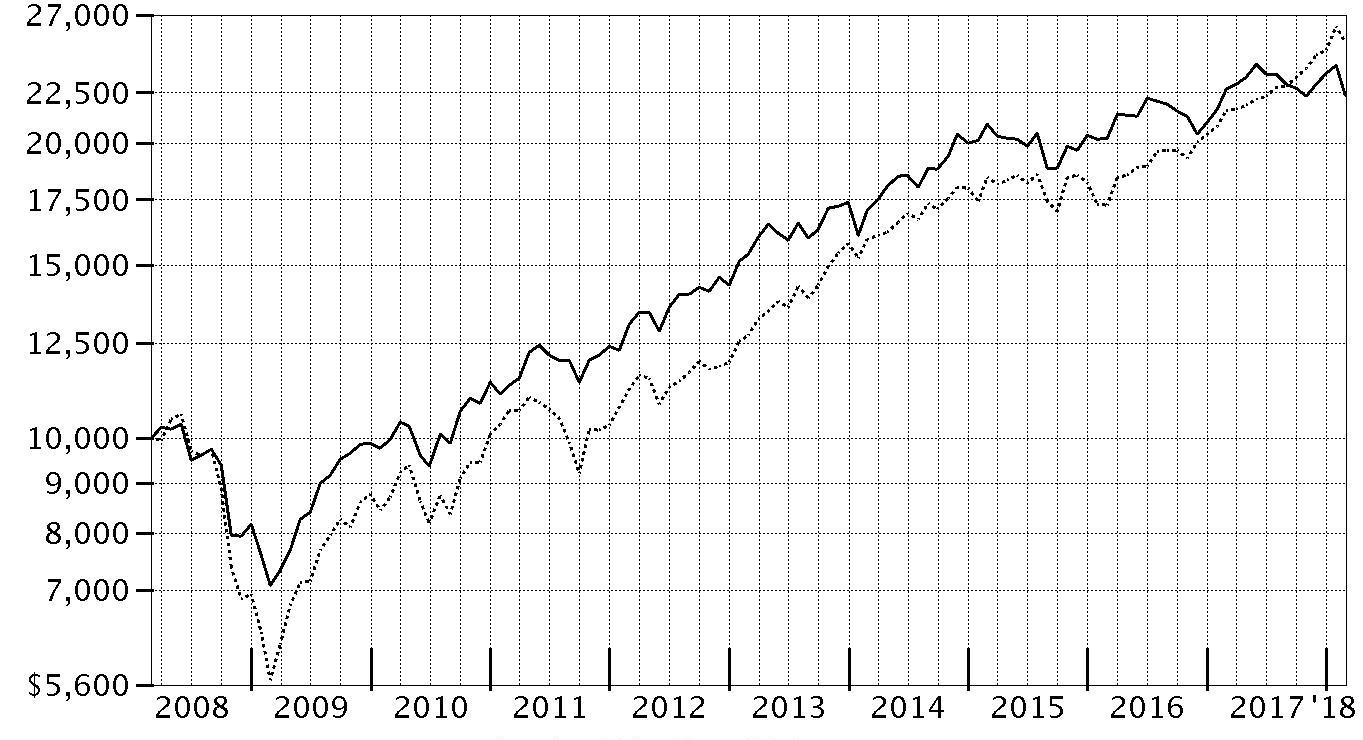
| Period Ending Values |
| $22,350 | Consumer Staples Portfolio |
| $25,307 | S&P 500® Index |
Management's Discussion of Fund Performance
Market Recap: U.S. equities gained 17.10% for the 12 months ending February 28, 2018, as the S&P 500
® index moved steadily higher throughout 2017 and into 2018 until sharply reversing course in February. The drop was in stark contrast to the low volatility seen throughout 2017, along with consumer sentiment and other market indicators that stayed positive. Investors remained decidedly upbeat as the calendar turned, and the index rose 5.73% in January. February was a decidedly different story, though, as volatility spiked amid fear that rising inflation and the potential for the economy to overheat would prompt the U.S. Federal Reserve to pick up the pace of interest rate hikes. The index returned -3.69% for the month, its first negative result since October 2016. For the full 12 months, growth stocks handily topped value, while large-caps bested small-caps. By sector, information technology fared best by far, gaining 36% amid strong earnings growth from several major index constituents. Consumer discretionary (+22%) also stood out, driven by retailers. Financials added 20%, riding the uptick in bond yields. Materials and industrials rose about 16% each, boosted by higher demand, especially from China. Conversely, notable laggards included the defensive telecommunication services (-5%) and utilities (-2%) sectors, while rising rates held back real estate (-3%).
Comments from Portfolio Manager James McElligott: For the fiscal year, the fund’s share classes (excluding sales charges, if applicable) returned roughly between -1% and -3%, trailing the -0.37% result of the MSCI U.S. IMI Consumer Staples 25/50 Index and well behind the S&P 500
®. Consumer staples lagged the broader equity market, as investors favored more economically sensitive sectors. Versus the MSCI sector index, the fund’s sizable underexposure to the hypermarkets & super centers segment hurt. Most notable was our large underweighting in discount retailer Walmart, which saw its stock climb 30% as investors grew more confident in the company’s ability to compete with e-commerce juggernaut Amazon.com (not in the fund). An overweighting in the weak-performing tobacco segment and stock picks in the food retail group also detracted. In particular, shares of Kroger (-13%) fell as increased competition led to an earnings shortfall. Investor disappointment with the grocer’s decision to use its savings from tax reform to boost employee wages and lower prices also pressured the stock. By contrast, a sizable overweighting in the strong-performing personal products category and stock picks in the tobacco and soft drinks groups helped relative performance. Standouts included beauty products company Estee Lauder (+69%), which benefited from strong growth overseas, new products and the acquisition of some faster-growing brands. Foreign holdings also contributed overall, aided in part by a broadly weaker U.S. dollar.
The views expressed above reflect those of the portfolio manager(s) only through the end of the period as stated on the cover of this report and do not necessarily represent the views of Fidelity or any other person in the Fidelity organization. Any such views are subject to change at any time based upon market or other conditions and Fidelity disclaims any responsibility to update such views. These views may not be relied on as investment advice and, because investment decisions for a Fidelity fund are based on numerous factors, may not be relied on as an indication of trading intent on behalf of any Fidelity fund.
Note to shareholders: On November 17, 2017, James McElligott became Portfolio Manager of the fund, succeeding Robert Lee. On December 8, 2017, shareholders approved proposals from the Board of Trustees to eliminate each sector/industry fund’s fundamental “invests primarily” policy and to modify the fundamental concentration policy for certain funds. The changes took effect on January 1, 2018, and do not impact how the funds are managed.
Investment Summary (Unaudited)
Top Ten Stocks as of February 28, 2018
| | % of fund's net assets |
| The Coca-Cola Co. | 8.6 |
| Procter & Gamble Co. | 8.0 |
| Philip Morris International, Inc. | 7.7 |
| PepsiCo, Inc. | 7.1 |
| Monster Beverage Corp. | 4.4 |
| CVS Health Corp. | 4.1 |
| Mondelez International, Inc. | 3.8 |
| Altria Group, Inc. | 3.7 |
| Costco Wholesale Corp. | 3.3 |
| Spectrum Brands Holdings, Inc. | 3.0 |
| | 53.7 |
Top Industries (% of fund's net assets)
| As of February 28, 2018 |
| | Beverages | 27.8% |
| | Food Products | 19.5% |
| | Household Products | 14.4% |
| | Food & Staples Retailing | 13.7% |
| | Tobacco | 13.4% |
| | All Others* | 11.2% |

* Includes short-term investments and net other assets (liabilities).
Schedule of Investments February 28, 2018
Showing Percentage of Net Assets
| Common Stocks - 99.8% | | | |
| | | Shares | Value |
| Beverages - 27.8% | | | |
| Brewers - 1.2% | | | |
| Beijing Yanjing Brewery Co. Ltd. Class A | | 14,437,040 | $16,241,964 |
| China Resources Beer Holdings Co. Ltd. | | 162,000 | 623,910 |
| Molson Coors Brewing Co. Class B | | 108,900 | 8,303,625 |
| | | | 25,169,499 |
| Distillers & Vintners - 1.9% | | | |
| Constellation Brands, Inc. Class A (sub. vtg.) | | 190,000 | 40,941,200 |
| Kweichow Moutai Co. Ltd. (A Shares) | | 13,453 | 1,531,664 |
| | | | 42,472,864 |
| Soft Drinks - 24.7% | | | |
| Britvic PLC | | 525,074 | 4,882,222 |
| Coca-Cola Bottling Co. Consolidated | | 101,344 | 18,911,804 |
| Coca-Cola European Partners PLC | | 848,453 | 32,258,183 |
| Coca-Cola HBC AG | | 58,450 | 1,910,856 |
| Coca-Cola West Co. Ltd. | | 100,500 | 3,804,667 |
| Dr. Pepper Snapple Group, Inc. | | 293,300 | 34,096,125 |
| Fever-Tree Drinks PLC | | 92,513 | 3,159,063 |
| Monster Beverage Corp. (a) | | 1,535,302 | 97,292,088 |
| PepsiCo, Inc. | | 1,423,200 | 156,167,736 |
| The Coca-Cola Co. | | 4,366,218 | 188,707,942 |
| | | | 541,190,686 |
|
| TOTAL BEVERAGES | | | 608,833,049 |
|
| Chemicals - 0.3% | | | |
| Specialty Chemicals - 0.3% | | | |
| Frutarom Industries Ltd. | | 70,500 | 6,486,766 |
| Food & Staples Retailing - 13.7% | | | |
| Drug Retail - 6.4% | | | |
| CVS Health Corp. | | 1,318,003 | 89,268,343 |
| Rite Aid Corp. (a)(b) | | 1,582,170 | 3,116,875 |
| Walgreens Boots Alliance, Inc. | | 704,824 | 48,555,325 |
| | | | 140,940,543 |
| Food Distributors - 1.5% | | | |
| Sysco Corp. | | 479,300 | 28,590,245 |
| United Natural Foods, Inc. (a) | | 106,100 | 4,527,287 |
| | | | 33,117,532 |
| Food Retail - 1.5% | | | |
| Kroger Co. | | 859,770 | 23,316,962 |
| Sprouts Farmers Market LLC (a) | | 357,500 | 9,209,200 |
| | | | 32,526,162 |
| Hypermarkets & Super Centers - 4.3% | | | |
| Costco Wholesale Corp. | | 379,500 | 72,446,550 |
| Walmart, Inc. | | 236,600 | 21,296,366 |
| | | | 93,742,916 |
|
| TOTAL FOOD & STAPLES RETAILING | | | 300,327,153 |
|
| Food Products - 19.5% | | | |
| Agricultural Products - 1.7% | | | |
| Bunge Ltd. | | 223,635 | 16,868,788 |
| Darling International, Inc. (a) | | 701,000 | 12,751,190 |
| Ingredion, Inc. | | 51,300 | 6,701,832 |
| | | | 36,321,810 |
| Packaged Foods & Meats - 17.8% | | | |
| ConAgra Foods, Inc. | | 818,100 | 29,557,953 |
| Danone SA | | 180,600 | 14,404,018 |
| JBS SA | | 4,970,800 | 15,171,588 |
| Kellogg Co. | | 481,900 | 31,901,780 |
| Mondelez International, Inc. | | 1,916,658 | 84,141,286 |
| Post Holdings, Inc. (a) | | 203,300 | 15,406,074 |
| The Hain Celestial Group, Inc. (a) | | 707,599 | 24,610,293 |
| The Hershey Co. | | 156,800 | 15,407,168 |
| The J.M. Smucker Co. | | 354,100 | 44,722,830 |
| The Kraft Heinz Co. | | 785,400 | 52,661,070 |
| The Simply Good Foods Co. | | 2,495,700 | 33,716,907 |
| TreeHouse Foods, Inc. (a) | | 763,359 | 29,022,909 |
| | | | 390,723,876 |
|
| TOTAL FOOD PRODUCTS | | | 427,045,686 |
|
| Hotels, Restaurants & Leisure - 1.3% | | | |
| Restaurants - 1.3% | | | |
| Compass Group PLC | | 57,711 | 1,226,082 |
| U.S. Foods Holding Corp. (a) | | 789,716 | 26,368,617 |
| | | | 27,594,699 |
| Household Durables - 0.1% | | | |
| Housewares & Specialties - 0.1% | | | |
| Newell Brands, Inc. | | 91,400 | 2,348,066 |
| Household Products - 14.4% | | | |
| Household Products - 14.4% | | | |
| Colgate-Palmolive Co. | | 552,080 | 38,076,958 |
| Essity AB Class B | | 1,107,000 | 30,298,347 |
| Procter & Gamble Co. | | 2,221,150 | 174,404,698 |
| Reckitt Benckiser Group PLC | | 94,500 | 7,501,072 |
| Spectrum Brands Holdings, Inc. (b) | | 657,899 | 64,941,210 |
| | | | 315,222,285 |
| Internet & Direct Marketing Retail - 0.3% | | | |
| Internet & Direct Marketing Retail - 0.3% | | | |
| Amazon.com, Inc. (a) | | 3,800 | 5,747,310 |
| Multiline Retail - 0.1% | | | |
| General Merchandise Stores - 0.1% | | | |
| Dollar Tree, Inc. (a) | | 21,200 | 2,175,968 |
| Paper & Forest Products - 0.2% | | | |
| Forest Products - 0.2% | | | |
| Svenska Cellulosa AB (SCA) (B Shares) | | 408,800 | 4,051,212 |
| Personal Products - 8.7% | | | |
| Personal Products - 8.7% | | | |
| Avon Products, Inc. (a) | | 10,658,435 | 28,031,684 |
| Coty, Inc. Class A | | 2,939,597 | 56,793,014 |
| Estee Lauder Companies, Inc. Class A | | 198,539 | 27,485,739 |
| Herbalife Ltd. (a) | | 217,510 | 20,032,671 |
| Ontex Group NV | | 281,400 | 8,125,905 |
| Unilever NV (Certificaten Van Aandelen) (Bearer) | | 979,430 | 51,259,595 |
| | | | 191,728,608 |
| Tobacco - 13.4% | | | |
| Tobacco - 13.4% | | | |
| Altria Group, Inc. | | 1,288,345 | 81,101,318 |
| British American Tobacco PLC sponsored ADR | | 768,426 | 45,383,240 |
| Philip Morris International, Inc. | | 1,626,591 | 168,433,498 |
| | | | 294,918,056 |
| TOTAL COMMON STOCKS | | | |
| (Cost $1,894,934,580) | | | 2,186,478,858 |
|
| Money Market Funds - 0.2% | | | |
| Fidelity Securities Lending Cash Central Fund 1.42% (c)(d) | | | |
| (Cost $4,717,386) | | 4,716,914 | 4,717,386 |
| TOTAL INVESTMENT IN SECURITIES - 100.0% | | | |
| (Cost $1,899,651,966) | | | 2,191,196,244 |
| NET OTHER ASSETS (LIABILITIES) - 0.0% | | | 916,003 |
| NET ASSETS - 100% | | | $2,192,112,247 |
Legend
(a) Non-income producing
(b) Security or a portion of the security is on loan at period end.
(c) Affiliated fund that is generally available only to investment companies and other accounts managed by Fidelity Investments. The rate quoted is the annualized seven-day yield of the fund at period end. A complete unaudited listing of the fund's holdings as of its most recent quarter end is available upon request. In addition, each Fidelity Central Fund's financial statements, which are not covered by the Fund's Report of Independent Registered Public Accounting Firm, are available on the SEC's website or upon request.
(d) Investment made with cash collateral received from securities on loan.
Affiliated Central Funds
Information regarding fiscal year to date income earned by the Fund from investments in Fidelity Central Funds is as follows:
| Fund | Income earned |
| Fidelity Cash Central Fund | $390,447 |
| Fidelity Securities Lending Cash Central Fund | 4,589,676 |
| Total | $4,980,123 |
Amounts in the income column in the above table include any capital gain distributions from underlying funds, which are presented in the corresponding line-item in the Statement of Operations if applicable.
Investment Valuation
The following is a summary of the inputs used, as of February 28, 2018, involving the Fund's assets and liabilities carried at fair value. The inputs or methodology used for valuing securities may not be an indication of the risk associated with investing in those securities. For more information on valuation inputs, and their aggregation into the levels used below, please refer to the Investment Valuation section in the accompanying Notes to Financial Statements.
| | Valuation Inputs at Reporting Date: |
| Description | Total | Level 1 | Level 2 | Level 3 |
| Investments in Securities: | | | | |
| Common Stocks | $2,186,478,858 | $2,037,458,281 | $149,020,577 | $-- |
| Money Market Funds | 4,717,386 | 4,717,386 | -- | -- |
| Total Investments in Securities: | $2,191,196,244 | $2,042,175,667 | $149,020,577 | $-- |
The following is a summary of transfers between Level 1 and Level 2 for the period ended February 28, 2018. Transfers are assumed to have occurred at the beginning of the period, and are primarily attributable to the valuation techniques used for foreign equity securities, as discussed in the accompanying Notes to Financial Statements:
| Transfers | Total |
| Level 1 to Level 2 | $39,433,161 |
| Level 2 to Level 1 | $0 |
Other Information
Distribution of investments by country or territory of incorporation, as a percentage of Total Net Assets, is as follows (Unaudited):
| United States of America | 88.9% |
| Netherlands | 2.3% |
| United Kingdom | 2.2% |
| Sweden | 1.6% |
| Others (Individually Less Than 1%) | 5.0% |
| | 100.0% |
See accompanying notes which are an integral part of the financial statements.
Financial Statements
Statement of Assets and Liabilities
| | | February 28, 2018 |
| Assets | | |
Investment in securities, at value (including securities loaned of $4,394,057) — See accompanying schedule:
Unaffiliated issuers (cost $1,894,934,580) | $2,186,478,858 | |
| Fidelity Central Funds (cost $4,717,386) | 4,717,386 | |
| Total Investment in Securities (cost $1,899,651,966) | | $2,191,196,244 |
| Foreign currency held at value (cost $70,608) | | 70,251 |
| Receivable for investments sold | | 13,813,876 |
| Receivable for fund shares sold | | 1,032,001 |
| Dividends receivable | | 3,999,432 |
| Distributions receivable from Fidelity Central Funds | | 6,000 |
| Prepaid expenses | | 9,349 |
| Other receivables | | 278,452 |
| Total assets | | 2,210,405,605 |
| Liabilities | | |
| Payable to custodian bank | $1,846,679 | |
| Payable for investments purchased | 5,604,674 | |
| Payable for fund shares redeemed | 4,024,795 | |
| Accrued management fee | 1,018,703 | |
| Distribution and service plan fees payable | 299,567 | |
| Other affiliated payables | 412,196 | |
| Other payables and accrued expenses | 350,863 | |
| Collateral on securities loaned | 4,735,881 | |
| Total liabilities | | 18,293,358 |
| Net Assets | | $2,192,112,247 |
| Net Assets consist of: | | |
| Paid in capital | | $1,773,739,580 |
| Undistributed net investment income | | 5,261,183 |
| Accumulated undistributed net realized gain (loss) on investments and foreign currency transactions | | 121,513,199 |
| Net unrealized appreciation (depreciation) on investments and assets and liabilities in foreign currencies | | 291,598,285 |
| Net Assets | | $2,192,112,247 |
| Calculation of Maximum Offering Price | | |
| Class A: | | |
| Net Asset Value and redemption price per share ($317,365,757 ÷ 3,644,956 shares) | | $87.07 |
| Maximum offering price per share (100/94.25 of $87.07) | | $92.38 |
| Class M: | | |
| Net Asset Value and redemption price per share ($76,571,538 ÷ 887,281 shares) | | $86.30 |
| Maximum offering price per share (100/96.50 of $86.30) | | $89.43 |
| Class C: | | |
| Net Asset Value and offering price per share ($228,873,523 ÷ 2,697,381 shares)(a) | | $84.85 |
| Consumer Staples: | | |
| Net Asset Value, offering price and redemption price per share ($1,328,696,456 ÷ 15,124,744 shares) | | $87.85 |
| Class I: | | |
| Net Asset Value, offering price and redemption price per share ($240,604,973 ÷ 2,744,225 shares) | | $87.68 |
(a) Redemption price per share is equal to net asset value less any applicable contingent deferred sales charge.
See accompanying notes which are an integral part of the financial statements.
Statement of Operations
| | | Year ended February 28, 2018 |
| Investment Income | | |
| Dividends | | $65,418,862 |
| Income from Fidelity Central Funds (including $4,589,676 from security lending) | | 4,980,123 |
| Total income | | 70,398,985 |
| Expenses | | |
| Management fee | $14,425,413 | |
| Transfer agent fees | 4,851,634 | |
| Distribution and service plan fees | 4,214,872 | |
| Accounting and security lending fees | 817,137 | |
| Custodian fees and expenses | 69,334 | |
| Independent trustees' fees and expenses | 58,794 | |
| Registration fees | 153,387 | |
| Audit | 61,585 | |
| Legal | 36,471 | |
| Interest | 16,749 | |
| Miscellaneous | 143,372 | |
| Total expenses before reductions | 24,848,748 | |
| Expense reductions | (173,345) | 24,675,403 |
| Net investment income (loss) | | 45,723,582 |
| Realized and Unrealized Gain (Loss) | | |
| Net realized gain (loss) on: | | |
| Investment securities: | | |
| Unaffiliated issuers | 299,702,774 | |
| Fidelity Central Funds | (9,191) | |
| Foreign currency transactions | 287,386 | |
| Total net realized gain (loss) | | 299,980,969 |
| Change in net unrealized appreciation (depreciation) on: | | |
| Unaffiliated issuers (net of decrease in deferred foreign taxes of $618,798) | (369,386,234) | |
| Fidelity Central Funds | (29,590) | |
| Assets and liabilities in foreign currencies | 100,702 | |
| Total change in net unrealized appreciation (depreciation) | | (369,315,122) |
| Net gain (loss) | | (69,334,153) |
| Net increase (decrease) in net assets resulting from operations | | $(23,610,571) |
See accompanying notes which are an integral part of the financial statements.
Statement of Changes in Net Assets
| | Year ended February 28, 2018 | Year ended February 28, 2017 |
| Increase (Decrease) in Net Assets | | |
| Operations | | |
| Net investment income (loss) | $45,723,582 | $47,285,744 |
| Net realized gain (loss) | 299,980,969 | 217,332,500 |
| Change in net unrealized appreciation (depreciation) | (369,315,122) | 57,308,049 |
| Net increase (decrease) in net assets resulting from operations | (23,610,571) | 321,926,293 |
| Distributions to shareholders from net investment income | (43,177,465) | (44,327,157) |
| Distributions to shareholders from net realized gain | (165,062,987) | (82,139,579) |
| Total distributions | (208,240,452) | (126,466,736) |
| Share transactions - net increase (decrease) | (437,546,127) | (395,070,237) |
| Redemption fees | – | 44,026 |
| Total increase (decrease) in net assets | (669,397,150) | (199,566,654) |
| Net Assets | | |
| Beginning of period | 2,861,509,397 | 3,061,076,051 |
| End of period | $2,192,112,247 | $2,861,509,397 |
| Other Information | | |
| Undistributed net investment income end of period | $5,261,183 | $4,801,401 |
See accompanying notes which are an integral part of the financial statements.
Financial Highlights
Consumer Staples Portfolio Class A
| Years ended February 28, | 2018 | 2017 | 2016A | 2015 | 2014 |
| Selected Per–Share Data | | | | | |
| Net asset value, beginning of period | $96.18 | $89.78 | $101.33 | $87.93 | $85.67 |
| Income from Investment Operations | | | | | |
| Net investment income (loss)B | 1.54 | 1.28 | 1.34 | 1.37 | 1.43 |
| Net realized and unrealized gain (loss) | (2.80) | 9.12 | (4.86) | 17.28 | 7.51 |
| Total from investment operations | (1.26) | 10.40 | (3.52) | 18.65 | 8.94 |
| Distributions from net investment income | (1.55) | (1.37) | (1.31) | (1.28) | (1.44) |
| Distributions from net realized gain | (6.30) | (2.64) | (6.72) | (3.98) | (5.24) |
| Total distributions | (7.85) | (4.00)C | (8.03) | (5.25)D | (6.68) |
| Redemption fees added to paid in capitalB | – | –E | –E | –E | –E |
| Net asset value, end of period | $87.07 | $96.18 | $89.78 | $101.33 | $87.93 |
| Total ReturnF,G | (1.68)% | 11.91% | (3.51)% | 21.95% | 10.53% |
| Ratios to Average Net AssetsH,I | | | | | |
| Expenses before reductions | 1.05% | 1.04% | 1.04% | 1.05% | 1.06% |
| Expenses net of fee waivers, if any | 1.05% | 1.04% | 1.04% | 1.05% | 1.06% |
| Expenses net of all reductions | 1.04% | 1.03% | 1.04% | 1.05% | 1.06% |
| Net investment income (loss) | 1.60% | 1.37% | 1.45% | 1.45% | 1.61% |
| Supplemental Data | | | | | |
| Net assets, end of period (000 omitted) | $317,366 | $522,014 | $470,249 | $414,151 | $329,459 |
| Portfolio turnover rateJ | 76% | 56%K | 63% | 42%K | 31% |
A For the year ended February 29.
B Calculated based on average shares outstanding during the period.
C Total distributions of $4.00 per share is comprised of distributions from net investment income of $1.365 and distributions from net realized gain of $2.636 per share.
D Total distributions of $5.25 per share is comprised of distributions from net investment income of $1.275 and distributions from net realized gain of $3.976 per share.
E Amount represents less than $.005 per share.
F Total returns would have been lower if certain expenses had not been reduced during the applicable periods shown.
G Total returns do not include the effect of the sales charges.
H Fees and expenses of any underlying Fidelity Central Funds are not included in the Fund's expense ratio. The Fund indirectly bears its proportionate share of the expenses of any underlying Fidelity Central Funds.
I Expense ratios reflect operating expenses of the class. Expenses before reductions do not reflect amounts reimbursed by the investment adviser or reductions from brokerage service arrangements or reductions from other expense offset arrangements and do not represent the amount paid by the class during periods when reimbursements or reductions occur. Expenses net of fee waivers reflect expenses after reimbursement by the investment adviser but prior to reductions from brokerage service arrangements or other expense offset arrangements. Expenses net of all reductions represent the net expenses paid by the class.
J Amount does not include the portfolio activity of any underlying Fidelity Central Funds.
K Portfolio turnover rate excludes securities received or delivered in-kind.
See accompanying notes which are an integral part of the financial statements.
Consumer Staples Portfolio Class M
| Years ended February 28, | 2018 | 2017 | 2016A | 2015 | 2014 |
| Selected Per–Share Data | | | | | |
| Net asset value, beginning of period | $95.42 | $89.10 | $100.61 | $87.37 | $85.18 |
| Income from Investment Operations | | | | | |
| Net investment income (loss)B | 1.27 | 1.01 | 1.08 | 1.10 | 1.18 |
| Net realized and unrealized gain (loss) | (2.78) | 9.07 | (4.83) | 17.15 | 7.46 |
| Total from investment operations | (1.51) | 10.08 | (3.75) | 18.25 | 8.64 |
| Distributions from net investment income | (1.31) | (1.12) | (1.04) | (1.04) | (1.21) |
| Distributions from net realized gain | (6.30) | (2.64) | (6.72) | (3.98) | (5.24) |
| Total distributions | (7.61) | (3.76) | (7.76) | (5.01)C | (6.45) |
| Redemption fees added to paid in capitalB | – | –D | –D | –D | –D |
| Net asset value, end of period | $86.30 | $95.42 | $89.10 | $100.61 | $87.37 |
| Total ReturnE,F | (1.94)% | 11.61% | (3.78)% | 21.60% | 10.23% |
| Ratios to Average Net AssetsG,H | | | | | |
| Expenses before reductions | 1.32% | 1.32% | 1.32% | 1.32% | 1.33% |
| Expenses net of fee waivers, if any | 1.32% | 1.32% | 1.32% | 1.32% | 1.33% |
| Expenses net of all reductions | 1.31% | 1.31% | 1.31% | 1.32% | 1.33% |
| Net investment income (loss) | 1.33% | 1.09% | 1.17% | 1.18% | 1.34% |
| Supplemental Data | | | | | |
| Net assets, end of period (000 omitted) | $76,572 | $89,925 | $76,586 | $81,489 | $61,421 |
| Portfolio turnover rateI | 76% | 56%J | 63% | 42%J | 31% |
A For the year ended February 29.
B Calculated based on average shares outstanding during the period.
C Total distributions of $5.01 per share is comprised of distributions from net investment income of $1.036 and distributions from net realized gain of $3.976 per share.
D Amount represents less than $.005 per share.
E Total returns would have been lower if certain expenses had not been reduced during the applicable periods shown.
F Total returns do not include the effect of the sales charges.
G Fees and expenses of any underlying Fidelity Central Funds are not included in the Fund's expense ratio. The Fund indirectly bears its proportionate share of the expenses of any underlying Fidelity Central Funds.
H Expense ratios reflect operating expenses of the class. Expenses before reductions do not reflect amounts reimbursed by the investment adviser or reductions from brokerage service arrangements or reductions from other expense offset arrangements and do not represent the amount paid by the class during periods when reimbursements or reductions occur. Expenses net of fee waivers reflect expenses after reimbursement by the investment adviser but prior to reductions from brokerage service arrangements or other expense offset arrangements. Expenses net of all reductions represent the net expenses paid by the class.
I Amount does not include the portfolio activity of any underlying Fidelity Central Funds.
J Portfolio turnover rate excludes securities received or delivered in-kind.
See accompanying notes which are an integral part of the financial statements.
Consumer Staples Portfolio Class C
| Years ended February 28, | 2018 | 2017 | 2016A | 2015 | 2014 |
| Selected Per–Share Data | | | | | |
| Net asset value, beginning of period | $93.89 | $87.77 | $99.27 | $86.32 | $84.28 |
| Income from Investment Operations | | | | | |
| Net investment income (loss)B | .81 | .56 | .63 | .65 | .75 |
| Net realized and unrealized gain (loss) | (2.73) | 8.92 | (4.75) | 16.93 | 7.36 |
| Total from investment operations | (1.92) | 9.48 | (4.12) | 17.58 | 8.11 |
| Distributions from net investment income | (.82) | (.73) | (.65) | (.65) | (.84) |
| Distributions from net realized gain | (6.30) | (2.64) | (6.72) | (3.98) | (5.24) |
| Total distributions | (7.12) | (3.36)C | (7.38)D | (4.63) | (6.07)E |
| Redemption fees added to paid in capitalB | – | –F | –F | –F | –F |
| Net asset value, end of period | $84.85 | $93.89 | $87.77 | $99.27 | $86.32 |
| Total ReturnG,H | (2.41)% | 11.07% | (4.23)% | 21.03% | 9.70% |
| Ratios to Average Net AssetsI,J | | | | | |
| Expenses before reductions | 1.79% | 1.80% | 1.80% | 1.80% | 1.82% |
| Expenses net of fee waivers, if any | 1.79% | 1.79% | 1.80% | 1.80% | 1.82% |
| Expenses net of all reductions | 1.78% | 1.79% | 1.79% | 1.80% | 1.81% |
| Net investment income (loss) | .86% | .61% | .69% | .70% | .85% |
| Supplemental Data | | | | | |
| Net assets, end of period (000 omitted) | $228,874 | $308,350 | $250,576 | $228,151 | $164,669 |
| Portfolio turnover rateK | 76% | 56%L | 63% | 42%L | 31% |
A For the year ended February 29.
B Calculated based on average shares outstanding during the period.
C Total distributions of $3.36 per share is comprised of distributions from net investment income of $.726 and distributions from net realized gain of $2.636 per share.
D Total distributions of $7.38 per share is comprised of distributions from net investment income of $.651 and distributions from net realized gain of $6.724 per share.
E Total distributions of $6.07 per share is comprised of distributions from net investment income of $.837 and distributions from net realized gain of $5.237 per share.
F Amount represents less than $.005 per share.
G Total returns would have been lower if certain expenses had not been reduced during the applicable periods shown.
H Total returns do not include the effect of the contingent deferred sales charge.
I Fees and expenses of any underlying Fidelity Central Funds are not included in the Fund's expense ratio. The Fund indirectly bears its proportionate share of the expenses of any underlying Fidelity Central Funds.
J Expense ratios reflect operating expenses of the class. Expenses before reductions do not reflect amounts reimbursed by the investment adviser or reductions from brokerage service arrangements or reductions from other expense offset arrangements and do not represent the amount paid by the class during periods when reimbursements or reductions occur. Expenses net of fee waivers reflect expenses after reimbursement by the investment adviser but prior to reductions from brokerage service arrangements or other expense offset arrangements. Expenses net of all reductions represent the net expenses paid by the class.
K Amount does not include the portfolio activity of any underlying Fidelity Central Funds.
L Portfolio turnover rate excludes securities received or delivered in-kind.
See accompanying notes which are an integral part of the financial statements.
Consumer Staples Portfolio
| Years ended February 28, | 2018 | 2017 | 2016A | 2015 | 2014 |
| Selected Per–Share Data | | | | | |
| Net asset value, beginning of period | $97.01 | $90.48 | $102.03 | $88.51 | $86.17 |
| Income from Investment Operations | | | | | |
| Net investment income (loss)B | 1.82 | 1.56 | 1.61 | 1.64 | 1.69 |
| Net realized and unrealized gain (loss) | (2.82) | 9.20 | (4.89) | 17.40 | 7.55 |
| Total from investment operations | (1.00) | 10.76 | (3.28) | 19.04 | 9.24 |
| Distributions from net investment income | (1.86) | (1.60) | (1.55) | (1.54) | (1.66) |
| Distributions from net realized gain | (6.30) | (2.64) | (6.72) | (3.98) | (5.24) |
| Total distributions | (8.16) | (4.23)C | (8.27) | (5.52) | (6.90) |
| Redemption fees added to paid in capitalB | – | –D | –D | –D | –D |
| Net asset value, end of period | $87.85 | $97.01 | $90.48 | $102.03 | $88.51 |
| Total ReturnE | (1.40)% | 12.24% | (3.25)% | 22.27% | 10.82% |
| Ratios to Average Net AssetsF,G | | | | | |
| Expenses before reductions | .76% | .76% | .77% | .77% | .79% |
| Expenses net of fee waivers, if any | .76% | .76% | .77% | .77% | .79% |
| Expenses net of all reductions | .76% | .76% | .76% | .77% | .79% |
| Net investment income (loss) | 1.89% | 1.64% | 1.72% | 1.73% | 1.88% |
| Supplemental Data | | | | | |
| Net assets, end of period (000 omitted) | $1,328,696 | $1,665,604 | $2,039,983 | $2,173,970 | $1,328,594 |
| Portfolio turnover rateH | 76% | 56%I | 63% | 42%I | 31% |
A For the year ended February 29.
B Calculated based on average shares outstanding during the period.
C Total distributions of $4.23 per share is comprised of distributions from net investment income of $1.596 and distributions from net realized gain of $2.636 per share.
D Amount represents less than $.005 per share.
E Total returns would have been lower if certain expenses had not been reduced during the applicable periods shown.
F Fees and expenses of any underlying Fidelity Central Funds are not included in the Fund's expense ratio. The Fund indirectly bears its proportionate share of the expenses of any underlying Fidelity Central Funds.
G Expense ratios reflect operating expenses of the class. Expenses before reductions do not reflect amounts reimbursed by the investment adviser or reductions from brokerage service arrangements or reductions from other expense offset arrangements and do not represent the amount paid by the class during periods when reimbursements or reductions occur. Expenses net of fee waivers reflect expenses after reimbursement by the investment adviser but prior to reductions from brokerage service arrangements or other expense offset arrangements. Expenses net of all reductions represent the net expenses paid by the class.
H Amount does not include the portfolio activity of any underlying Fidelity Central Funds.
I Portfolio turnover rate excludes securities received or delivered in-kind.
See accompanying notes which are an integral part of the financial statements.
Consumer Staples Portfolio Class I
| Years ended February 28, | 2018 | 2017 | 2016A | 2015 | 2014 |
| Selected Per–Share Data | | | | | |
| Net asset value, beginning of period | $96.82 | $90.34 | $101.91 | $88.33 | $85.92 |
| Income from Investment Operations | | | | | |
| Net investment income (loss)B | 1.81 | 1.54 | 1.60 | 1.59 | 1.66 |
| Net realized and unrealized gain (loss) | (2.82) | 9.19 | (4.89) | 17.40 | 7.53 |
| Total from investment operations | (1.01) | 10.73 | (3.29) | 18.99 | 9.19 |
| Distributions from net investment income | (1.83) | (1.61) | (1.55) | (1.44) | (1.54) |
| Distributions from net realized gain | (6.30) | (2.64) | (6.72) | (3.98) | (5.24) |
| Total distributions | (8.13) | (4.25) | (8.28)C | (5.41)D | (6.78) |
| Redemption fees added to paid in capitalB | – | –E | –E | –E | –E |
| Net asset value, end of period | $87.68 | $96.82 | $90.34 | $101.91 | $88.33 |
| Total ReturnF | (1.41)% | 12.22% | (3.26)% | 22.26% | 10.80% |
| Ratios to Average Net AssetsG,H | | | | | |
| Expenses before reductions | .78% | .78% | .78% | .80% | .82% |
| Expenses net of fee waivers, if any | .78% | .78% | .77% | .80% | .82% |
| Expenses net of all reductions | .77% | .77% | .77% | .80% | .82% |
| Net investment income (loss) | 1.88% | 1.63% | 1.71% | 1.70% | 1.85% |
| Supplemental Data | | | | | |
| Net assets, end of period (000 omitted) | $240,605 | $275,616 | $216,836 | $198,538 | $154,271 |
| Portfolio turnover rateI | 76% | 56%J | 63% | 42%J | 31% |
A For the year ended February 29.
B Calculated based on average shares outstanding during the period.
C Total distributions of $8.28 per share is comprised of distributions from net investment income of $1.553 and distributions from net realized gain of $6.724 per share.
D Total distributions of $5.41 per share is comprised of distributions from net investment income of $1.436 and distributions from net realized gain of $3.976 per share.
E Amount represents less than $.005 per share.
F Total returns would have been lower if certain expenses had not been reduced during the applicable periods shown.
G Fees and expenses of any underlying Fidelity Central Funds are not included in the Fund's expense ratio. The Fund indirectly bears its proportionate share of the expenses of any underlying Fidelity Central Funds.
H Expense ratios reflect operating expenses of the class. Expenses before reductions do not reflect amounts reimbursed by the investment adviser or reductions from brokerage service arrangements or reductions from other expense offset arrangements and do not represent the amount paid by the class during periods when reimbursements or reductions occur. Expenses net of fee waivers reflect expenses after reimbursement by the investment adviser but prior to reductions from brokerage service arrangements or other expense offset arrangements. Expenses net of all reductions represent the net expenses paid by the class.
I Amount does not include the portfolio activity of any underlying Fidelity Central Funds.
J Portfolio turnover rate excludes securities received or delivered in-kind.
See accompanying notes which are an integral part of the financial statements.
Notes to Financial Statements
For the period ended February 28, 2018
1. Organization.
Consumer Staples Portfolio (the Fund) is a non-diversified fund of Fidelity Select Portfolios (the Trust) and is authorized to issue an unlimited number of shares. The Trust is registered under the Investment Company Act of 1940, as amended (the 1940 Act), as an open-end management investment company organized as a Massachusetts business trust. The Fund invests primarily in securities of companies whose principal business activities fall within specific industries. The Fund offers Class A, Class M (formerly Class T), Class C, Consumer Staples and Class I shares, each of which has equal rights as to assets and voting privileges. Each class has exclusive voting rights with respect to matters that affect that class.
After the close of business on June 24, 2016, all outstanding Class B shares were converted to Class A shares. All prior fiscal period dollar and share amounts for Class B presented in the Notes to Financial Statements are for the period March 1, 2016 through June 24, 2016.
2. Investments in Fidelity Central Funds.
The Fund invests in Fidelity Central Funds, which are open-end investment companies generally available only to other investment companies and accounts managed by the investment adviser and its affiliates. The Fund's Schedule of Investments lists each of the Fidelity Central Funds held as of period end, if any, as an investment of the Fund, but does not include the underlying holdings of each Fidelity Central Fund. As an Investing Fund, the Fund indirectly bears its proportionate share of the expenses of the underlying Fidelity Central Funds.
The Money Market Central Funds seek preservation of capital and current income and are managed by Fidelity Investments Money Management, Inc. (FIMM), an affiliate of the investment adviser. Annualized expenses of the Money Market Central Funds as of their most recent shareholder report date are less than .005%.
A complete unaudited list of holdings for each Fidelity Central Fund is available upon request or at the Securities and Exchange Commission (the SEC) website at www.sec.gov. In addition, the financial statements of the Fidelity Central Funds, which are not covered by the Fund's Report of Independent Registered Public Accounting Firm, are available on the SEC website or upon request.
3. Significant Accounting Policies.
The Fund is an investment company and applies the accounting and reporting guidance of the Financial Accounting Standards Board (FASB) Accounting Standards Codification Topic 946 Financial Services – Investments Companies. The financial statements have been prepared in conformity with accounting principles generally accepted in the United States of America (GAAP), which require management to make certain estimates and assumptions at the date of the financial statements. Actual results could differ from those estimates. Subsequent events, if any, through the date that the financial statements were issued have been evaluated in the preparation of the financial statements. The following summarizes the significant accounting policies of the Fund:
Investment Valuation. Investments are valued as of 4:00 p.m. Eastern time on the last calendar day of the period. The Board of Trustees (the Board) has delegated the day to day responsibility for the valuation of the Fund's investments to the Fair Value Committee (the Committee) established by the Fund's investment adviser. In accordance with valuation policies and procedures approved by the Board, the Fund attempts to obtain prices from one or more third party pricing vendors or brokers to value its investments. When current market prices, quotations or currency exchange rates are not readily available or reliable, investments will be fair valued in good faith by the Committee, in accordance with procedures adopted by the Board. Factors used in determining fair value vary by investment type and may include market or investment specific events. The frequency with which these procedures are used cannot be predicted and they may be utilized to a significant extent. The Committee oversees the Fund's valuation policies and procedures and reports to the Board on the Committee's activities and fair value determinations. The Board monitors the appropriateness of the procedures used in valuing the Fund's investments and ratifies the fair value determinations of the Committee.
The Fund categorizes the inputs to valuation techniques used to value its investments into a disclosure hierarchy consisting of three levels as shown below:
- Level 1 – quoted prices in active markets for identical investments
- Level 2 – other significant observable inputs (including quoted prices for similar investments, interest rates, prepayment speeds, etc.)
- Level 3 – unobservable inputs (including the Fund's own assumptions based on the best information available)
Valuation techniques used to value the Fund's investments by major category are as follows:
Equity securities, including restricted securities, for which market quotations are readily available, are valued at the last reported sale price or official closing price as reported by a third party pricing vendor on the primary market or exchange on which they are traded and are categorized as Level 1 in the hierarchy. In the event there were no sales during the day or closing prices are not available, securities are valued at the last quoted bid price or may be valued using the last available price and are generally categorized as Level 2 in the hierarchy. For foreign equity securities, when market or security specific events arise, comparisons to the valuation of American Depositary Receipts (ADRs), futures contracts, Exchange-Traded Funds (ETFs) and certain indexes as well as quoted prices for similar securities may be used and would be categorized as Level 2 in the hierarchy. Utilizing these techniques may result in transfers between Level 1 and Level 2. For equity securities, including restricted securities, where observable inputs are limited, assumptions about market activity and risk are used and these securities may be categorized as Level 3 in the hierarchy.
Investments in open-end mutual funds, including the Fidelity Central Funds, are valued at their closing net asset value (NAV) each business day and are categorized as Level 1 in the hierarchy.
Changes in valuation techniques may result in transfers in or out of an assigned level within the disclosure hierarchy. The aggregate value of investments by input level as of February 28, 2018 including information on transfers between Levels 1 and 2 is included at the end of the Fund's Schedule of Investments.
Foreign Currency. The Fund may use foreign currency contracts to facilitate transactions in foreign-denominated securities. Gains and losses from these transactions may arise from changes in the value of the foreign currency or if the counterparties do not perform under the contracts' terms.
Foreign-denominated assets, including investment securities, and liabilities are translated into U.S. dollars at the exchange rates at period end. Purchases and sales of investment securities, income and dividends received and expenses denominated in foreign currencies are translated into U.S. dollars at the exchange rate in effect on the transaction date.
The effects of exchange rate fluctuations on investments are included with the net realized and unrealized gain (loss) on investment securities. Other foreign currency transactions resulting in realized and unrealized gain (loss) are disclosed separately.
Investment Transactions and Income. For financial reporting purposes, the Fund's investment holdings and NAV include trades executed through the end of the last business day of the period. The NAV per share for processing shareholder transactions is calculated as of the close of business of the New York Stock Exchange (NYSE), normally 4:00 p.m. Eastern time and includes trades executed through the end of the prior business day. Gains and losses on securities sold are determined on the basis of identified cost and includes proceeds received from litigation. Dividend income is recorded on the ex-dividend date, except for certain dividends from foreign securities where the ex-dividend date may have passed, which are recorded as soon as the Fund is informed of the ex-dividend date. Non-cash dividends included in dividend income, if any, are recorded at the fair market value of the securities received. Income and capital gain distributions from Fidelity Central Funds, if any, are recorded on the ex-dividend date. Certain distributions received by the Fund represent a return of capital or capital gain. The Fund determines the components of these distributions subsequent to the ex-dividend date, based upon receipt of tax filings or other correspondence relating to the underlying investment. These distributions are recorded as a reduction of cost of investments and/or as a realized gain. Investment income is recorded net of foreign taxes withheld where recovery of such taxes is uncertain.
Class Allocations and Expenses. Investment income, realized and unrealized capital gains and losses, common expenses of the Fund, and certain fund-level expense reductions, if any, are allocated daily on a pro-rata basis to each class based on the relative net assets of each class to the total net assets of the Fund. Each class differs with respect to transfer agent and distribution and service plan fees incurred. Certain expense reductions may also differ by class. For the reporting period, the allocated portion of income and expenses to each class as a percent of its average net assets may vary due to the timing of recording these transactions in relation to fluctuating net assets of the classes. Expenses directly attributable to a fund are charged to that fund. Expenses attributable to more than one fund are allocated among the respective funds on the basis of relative net assets or other appropriate methods. Expense estimates are accrued in the period to which they relate and adjustments are made when actual amounts are known.
Deferred Trustee Compensation. Under a Deferred Compensation Plan (the Plan), independent Trustees may elect to defer receipt of a portion of their annual compensation. Deferred amounts are invested in a cross-section of Fidelity funds, are marked-to-market and remain in the Fund until distributed in accordance with the Plan. The investment of deferred amounts and the offsetting payable to the Trustees are included in the accompanying Statement of Assets and Liabilities.
Income Tax Information and Distributions to Shareholders. Each year, the Fund intends to qualify as a regulated investment company under Subchapter M of the Internal Revenue Code, including distributing substantially all of its taxable income and realized gains. As a result, no provision for U.S. Federal income taxes is required. As of February 28, 2018, the Fund did not have any unrecognized tax benefits in the financial statements; nor is the Fund aware of any tax positions for which it is reasonably possible that the total amounts of unrecognized tax benefits will significantly change in the next twelve months. The Fund files a U.S. federal tax return, in addition to state and local tax returns as required. The Fund's federal income tax returns are subject to examination by the Internal Revenue Service (IRS) for a period of three fiscal years after they are filed. State and local tax returns may be subject to examination for an additional fiscal year depending on the jurisdiction. Foreign taxes are provided for based on the Fund's understanding of the tax rules and rates that exist in the foreign markets in which it invests.
Distributions are declared and recorded on the ex-dividend date. Income dividends and capital gain distributions are declared separately for each class. Income and capital gain distributions are determined in accordance with income tax regulations, which may differ from GAAP. In addition, the Fund claimed a portion of the payment made to redeeming shareholders as a distribution for income tax purposes.
Capital accounts within the financial statements are adjusted for permanent book-tax differences. These adjustments have no impact on net assets or the results of operations. Capital accounts are not adjusted for temporary book-tax differences which will reverse in a subsequent period.
Book-tax differences are primarily due to foreign currency transactions, deferred trustees compensation and losses deferred due to wash sales.
As of period end, the cost and unrealized appreciation (depreciation) in securities, and derivatives if applicable, for federal income tax purposes were as follows:
| Gross unrealized appreciation | $387,126,400 |
| Gross unrealized depreciation | (98,497,007) |
| Net unrealized appreciation (depreciation) | $288,629,393 |
| Tax Cost | $1,902,566,851 |
The tax-based components of distributable earnings as of period end were as follows:
| Undistributed ordinary income | $5,462,244 |
| Undistributed long-term capital gain | $124,428,083 |
| Net unrealized appreciation (depreciation) on securities and other investments | $288,683,400 |
The tax character of distributions paid was as follows:
| | February 28, 2018 | February 28, 2017 |
| Ordinary Income | $43,177,465 | $ 67,916,475 |
| Long-term Capital Gains | 165,062,987 | 58,550,261 |
| Total | $208,240,452 | $ 126,466,736 |
4. Purchases and Sales of Investments.
Purchases and sales of securities, other than short-term securities, aggregated $1,965,840,225 and $2,509,410,359, respectively.
5. Fees and Other Transactions with Affiliates.
Management Fee. Fidelity SelectCo, LLC (the investment adviser) and its affiliates provide the Fund with investment management related services for which the Fund pays a monthly management fee. The management fee is the sum of an individual fund fee rate that is based on an annual rate of .30% of the Fund's average net assets and an annualized group fee rate that averaged .24% during the period. The group fee rate is based upon the average net assets of all the mutual funds advised by Fidelity Management & Research Company (FMR) and the investment adviser. The group fee rate decreases as assets under management increase and increases as assets under management decrease. For the reporting period, the total annual management fee rate was .54% of the Fund's average net assets.
Distribution and Service Plan Fees. In accordance with Rule 12b-1 of the 1940 Act, the Fund has adopted separate Distribution and Service Plans for each class of shares. Certain classes pay Fidelity Distributors Corporation (FDC), an affiliate of the investment adviser, separate Distribution and Service Fees, each of which is based on an annual percentage of each class' average net assets. In addition, FDC may pay financial intermediaries for selling shares of the Fund and providing shareholder support services. For the period, the Distribution and Service Fee rates, total fees and amounts retained by FDC were as follows:
| | Distribution Fee | Service Fee | Total Fees | Retained by FDC |
| Class A | -% | .25% | $917,644 | $2,440 |
| Class M | .25% | .25% | 436,644 | – |
| Class C | .75% | .25% | 2,860,584 | 395,349 |
| | | | $4,214,872 | $397,789 |
Sales Load. FDC may receive a front-end sales charge of up to 5.75% for selling Class A shares and 3.50% for selling Class M shares, some of which is paid to financial intermediaries for selling shares of the Fund. Depending on the holding period, FDC may receive contingent deferred sales charges levied on Class A, Class M and Class C redemptions. The deferred sales charges are 1.00% for Class C shares, 1.00% for certain purchases of Class A shares and .25% for certain purchases of Class M shares.
For the period, sales charge amounts retained by FDC were as follows:
| | Retained by FDC |
| Class A | $198,511 |
| Class M | 22,666 |
| Class C(a) | 46,661 |
| | $267,838 |
(a) When Class C shares are initially sold, FDC pays commissions from its own resources to financial intermediaries through which the sales are made.
Transfer Agent Fees. Fidelity Investments Institutional Operations Company, Inc., (FIIOC), an affiliate of the investment adviser, is the transfer, dividend disbursing and shareholder servicing agent for each class of the Fund. FIIOC receives account fees and asset-based fees that vary according to the account size and type of account of the shareholders of the respective classes of the Fund. FIIOC pays for typesetting, printing and mailing of shareholder reports, except proxy statements.
For the period, transfer agent fees for each class were as follows:
| | Amount | % of Class-Level Average Net Assets |
| Class A | $757,447 | .21 |
| Class M | 196,881 | .23 |
| Class C | 569,799 | .20 |
| Consumer Staples | 2,676,898 | .17 |
| Class I | 650,609 | .18 |
| | $4,851,634 | |
Accounting and Security Lending Fees. Fidelity Service Company, Inc. (FSC), an affiliate of the investment adviser, maintains the Fund's accounting records. The accounting fee is based on the level of average net assets for each month. Under a separate contract, FSC administers the security lending program. The security lending fee is based on the number and duration of lending transactions.
Brokerage Commissions. The Fund placed a portion of its portfolio transactions with brokerage firms which are affiliates of the investment adviser. Brokerage commissions are included in net realized gain (loss) and change in net unrealized appreciation (depreciation) in the Statement of Operations. The commissions paid to these affiliated firms were $68,312 for the period.
Interfund Lending Program. Pursuant to an Exemptive Order issued by the SEC, the Fund, along with other registered investment companies having management contracts with Fidelity Management & Research Company (FMR) or other affiliated entities of FMR, may participate in an interfund lending program. This program provides an alternative credit facility allowing the funds to borrow from, or lend money to, other participating affiliated funds. At period end, there were no interfund loans outstanding. The Fund's activity in this program during the period for which loans were outstanding was as follows:
| Borrower or Lender | Average Loan Balance | Weighted Average Interest Rate | Interest Expense |
| Borrower | $11,534,242 | 1.55% | $16,347 |
Interfund Trades. The Fund may purchase from or sell securities to other Fidelity Funds under procedures adopted by the Board. The procedures have been designed to ensure these interfund trades are executed in accordance with Rule 17a-7 of the 1940 Act. Interfund trades are included within the respective purchases and sales amounts shown in the Purchases and Sales of Investments note.
Prior Fiscal Year Redemptions In-Kind. During the prior period, 2,230,314 shares of the Fund held by an affiliated entity were redeemed in-kind for investments and cash with a value of $205,991,818. The Fund had a net realized gain of $85,065,706 on investments delivered through in-kind redemptions. The amount of the in-kind redemptions is included in share transactions in the accompanying Statement of Changes in Net Assets as well as the Notes to Financial Statements. The Fund recognized no gain or loss for federal income tax purposes.
Other. During the period, the investment adviser reimbursed the Fund for certain losses in the amount of $7,646.
6. Committed Line of Credit.
The Fund participates with other funds managed by the investment adviser or an affiliate in a $4.25 billion credit facility (the "line of credit") to be utilized for temporary or emergency purposes to fund shareholder redemptions or for other short-term liquidity purposes. The Fund has agreed to pay commitment fees on its pro-rata portion of the line of credit, which amounted to $8,453 and is reflected in Miscellaneous expenses on the Statement of Operations. During the period, the Fund did not borrow on this line of credit.
7. Security Lending.
The Fund lends portfolio securities through a lending agent from time to time in order to earn additional income. On the settlement date of the loan, the Fund receives collateral (in the form of U.S. Treasury obligations, letters of credit and/or cash) against the loaned securities and maintains collateral in an amount not less than 100% of the market value of the loaned securities during the period of the loan. The market value of the loaned securities is determined at the close of business of the Fund and any additional required collateral is delivered to the Fund on the next business day. The Fund or borrower may terminate the loan at any time, and if the borrower defaults on its obligation to return the securities loaned because of insolvency or other reasons, the Fund may apply collateral received from the borrower against the obligation. The Fund may experience delays and costs in recovering the securities loaned. Any cash collateral received is invested in the Fidelity Securities Lending Cash Central Fund. The value of loaned securities and cash collateral at period end are disclosed on the Fund's Statement of Assets and Liabilities. Security lending income represents the income earned on investing cash collateral, less rebates paid to borrowers and any lending agent fees associated with the loan, plus any premium payments received for lending certain types of securities. Security lending income is presented in the Statement of Operations as a component of income from Fidelity Central Funds.
8. Bank Borrowings.
The Fund is permitted to have bank borrowings for temporary or emergency purposes to fund shareholder redemptions or for other short-term liquidity requirements. The Fund has established borrowing arrangements with certain banks. The interest rate on the borrowings is the bank's base rate, as revised from time to time. The average loan balance during the period for which loans were outstanding amounted to $2,511,333. The weighted average interest rate was 1.92%. The interest expense amounted to $402 under the bank borrowing program. At period end, there were no bank borrowings outstanding.
9. Expense Reductions.
Commissions paid to certain brokers with whom the investment adviser, or its affiliates, places trades on behalf of the Fund include an amount in addition to trade execution, which may be rebated back to the Fund to offset certain expenses. This amount totaled $148,330 for the period. Through arrangements with the Fund's custodian, credits realized as a result of certain uninvested cash balances were used to reduce the Fund's expenses.
In addition, during the period the investment adviser reimbursed and/or waived a portion of fund-level operating expenses in the amount of $25,015.
10. Distributions to Shareholders.
Distributions to shareholders of each class were as follows:
| | Year ended
February 28, 2018 | Year ended
February 28, 2017 |
| From net investment income | | |
| Class A | $5,661,958 | $7,577,410 |
| Class M | 1,157,943 | 1,043,893 |
| Class C | 2,342,161 | 2,453,649 |
| Consumer Staples | 28,193,421 | 28,450,076 |
| Class I | 5,821,982 | 4,802,129 |
| Total | $43,177,465 | $44,327,157 |
| From net realized gain | | |
| Class A | $23,291,142 | $14,585,099 |
| Class M | 5,598,245 | 2,440,856 |
| Class B | – | 38,559 |
| Class C | 18,434,923 | 8,724,413 |
| Consumer Staples | 96,942,698 | 48,589,839 |
| Class I | 20,795,979 | 7,760,813 |
| Total | $165,062,987 | $82,139,579 |
11. Share Transactions.
Share transactions for each class were as follows and may contain automatic conversions between classes or exchanges between affiliated funds:
| | Shares | Shares | Dollars | Dollars |
| | Year ended February 28, 2018 | Year ended February 28, 2017 | Year ended February 28, 2018 | Year ended February 28, 2017 |
| Class A | | | | |
| Shares sold | 878,413 | 2,074,631 | $84,134,789 | $195,949,659 |
| Reinvestment of distributions | 304,910 | 237,892 | 28,169,668 | 21,465,950 |
| Shares redeemed | (2,965,599) | (2,123,267) | (284,396,390) | (197,828,865) |
| Net increase (decrease) | (1,782,276) | 189,256 | $(172,091,933) | $19,586,744 |
| Class M | | | | |
| Shares sold | 105,204 | 258,361 | $10,021,877 | $24,169,768 |
| Reinvestment of distributions | 73,231 | 37,389 | 6,708,282 | 3,349,216 |
| Shares redeemed | (233,572) | (212,844) | (22,022,226) | (19,792,973) |
| Net increase (decrease) | (55,137) | 82,906 | $(5,292,067) | $7,726,011 |
| Class B | | | | |
| Shares sold | – | 1,629 | $– | $151,958 |
| Reinvestment of distributions | – | 379 | – | 35,399 |
| Shares redeemed | – | (78,913) | – | (7,397,851) |
| Net increase (decrease) | – | (76,905) | $– | $(7,210,494) |
| Class C | | | | |
| Shares sold | 324,616 | 1,245,446 | $30,510,004 | $115,155,143 |
| Reinvestment of distributions | 218,231 | 115,157 | 19,684,994 | 10,152,865 |
| Shares redeemed | (1,129,562) | (931,585) | (104,331,925) | (84,513,838) |
| Net increase (decrease) | (586,715) | 429,018 | $(54,136,927) | $40,794,170 |
| Consumer Staples | | | | |
| Shares sold | 1,946,234 | 4,086,473 | $188,435,249 | $389,479,615 |
| Reinvestment of distributions | 1,262,390 | 801,941 | 117,653,205 | 73,103,322 |
| Shares redeemed | (5,253,889) | (10,263,589)(a) | (504,239,846) | (963,924,332)(a) |
| Net increase (decrease) | (2,045,265) | (5,375,175) | $(198,151,392) | $(501,341,395) |
| Class I | | | | |
| Shares sold | 2,545,385 | 2,282,645�� | $246,802,163 | $217,344,361 |
| Reinvestment of distributions | 261,308 | 121,641 | 24,362,082 | 11,031,386 |
| Shares redeemed | (2,909,251) | (1,957,632) | (279,038,053) | (183,001,020) |
| Net increase (decrease) | (102,558) | 446,654 | $(7,873,808) | $45,374,727 |
(a) Amount includes in-kind redemptions (see the Prior Fiscal Year Redemptions In-Kind note for additional details).
12. Other.
The Fund's organizational documents provide former and current trustees and officers with a limited indemnification against liabilities arising in connection with the performance of their duties to the Fund. In the normal course of business, the Fund may also enter into contracts that provide general indemnifications. The Fund's maximum exposure under these arrangements is unknown as this would be dependent on future claims that may be made against the Fund. The risk of material loss from such claims is considered remote.
Report of Independent Registered Public Accounting Firm
To the Trustees of Fidelity Select Portfolios and Shareholders of Consumer Staples Portfolio:
Opinion on the Financial Statements
We have audited the accompanying statement of assets and liabilities, including the schedule of investments, of Consumer Staples Portfolio (one of the funds constituting Fidelity Select Portfolios, referred to hereafter as the "Fund") as of February 28, 2018, the related statement of operations for the year ended February 28, 2018, the statement of changes in net assets for each of the two years in the period ended February 28, 2018, including the related notes, and the financial highlights for each of the five years in the period ended February 28, 2018 (collectively referred to as the “financial statements”). In our opinion, the financial statements present fairly, in all material respects, the financial position of the Fund as of February 28, 2018, the results of its operations for the year then ended, the changes in its net assets for each of the two years in the period ended February 28, 2018 and the financial highlights for each of the five years in the period ended February 28, 2018 in conformity with accounting principles generally accepted in the United States of America.
Basis for Opinion
These financial statements are the responsibility of the Fund’s management. Our responsibility is to express an opinion on the Fund’s financial statements based on our audits. We are a public accounting firm registered with the Public Company Accounting Oversight Board (United States) (“PCAOB”) and are required to be independent with respect to the Fund in accordance with the U.S. federal securities laws and the applicable rules and regulations of the Securities and Exchange Commission and the PCAOB.
We conducted our audits of these financial statements in accordance with the standards of the PCAOB. Those standards require that we plan and perform the audit to obtain reasonable assurance about whether the financial statements are free of material misstatement, whether due to error or fraud.
Our audits included performing procedures to assess the risks of material misstatement of the financial statements, whether due to error or fraud, and performing procedures that respond to those risks. Such procedures included examining, on a test basis, evidence regarding the amounts and disclosures in the financial statements. Our audits also included evaluating the accounting principles used and significant estimates made by management, as well as evaluating the overall presentation of the financial statements. Our procedures included confirmation of securities owned as of February 28, 2018 by correspondence with the custodian and brokers; when replies were not received from brokers, we performed other auditing procedures. We believe that our audits provide a reasonable basis for our opinion.
PricewaterhouseCoopers LLP
Boston, Massachusetts
April 17, 2018
We have served as the auditor of one or more investment companies in the Fidelity group of funds since 1932.
Trustees and Officers
The Trustees, Members of the Advisory Board (if any), and officers of the trust and fund, as applicable, are listed below. The Board of Trustees governs the fund and is responsible for protecting the interests of shareholders. The Trustees are experienced executives who meet periodically throughout the year to oversee the fund's activities, review contractual arrangements with companies that provide services to the fund, oversee management of the risks associated with such activities and contractual arrangements, and review the fund's performance. Except for Michael E. Wiley, each of the Trustees oversees 281 funds. Mr. Wiley oversees 193 funds.
The Trustees hold office without limit in time except that (a) any Trustee may resign; (b) any Trustee may be removed by written instrument, signed by at least two-thirds of the number of Trustees prior to such removal; (c) any Trustee who requests to be retired or who has become incapacitated by illness or injury may be retired by written instrument signed by a majority of the other Trustees; and (d) any Trustee may be removed at any special meeting of shareholders by a two-thirds vote of the outstanding voting securities of the trust. Each Trustee who is not an interested person (as defined in the 1940 Act) of the trust and the fund is referred to herein as an Independent Trustee. Each Independent Trustee shall retire not later than the last day of the calendar year in which his or her 75th birthday occurs. The Independent Trustees may waive this mandatory retirement age policy with respect to individual Trustees. Officers and Advisory Board Members hold office without limit in time, except that any officer or Advisory Board Member may resign or may be removed by a vote of a majority of the Trustees at any regular meeting or any special meeting of the Trustees. Except as indicated, each individual has held the office shown or other offices in the same company for the past five years.
The fund’s Statement of Additional Information (SAI) includes more information about the Trustees. To request a free copy, call Fidelity at 1-800-544-8544.
Experience, Skills, Attributes, and Qualifications of the Trustees. The Governance and Nominating Committee has adopted a statement of policy that describes the experience, qualifications, attributes, and skills that are necessary and desirable for potential Independent Trustee candidates (Statement of Policy). The Board believes that each Trustee satisfied at the time he or she was initially elected or appointed a Trustee, and continues to satisfy, the standards contemplated by the Statement of Policy. The Governance and Nominating Committee also engages professional search firms to help identify potential Independent Trustee candidates who have the experience, qualifications, attributes, and skills consistent with the Statement of Policy. From time to time, additional criteria based on the composition and skills of the current Independent Trustees, as well as experience or skills that may be appropriate in light of future changes to board composition, business conditions, and regulatory or other developments, have also been considered by the professional search firms and the Governance and Nominating Committee. In addition, the Board takes into account the Trustees' commitment and participation in Board and committee meetings, as well as their leadership of standing and ad hoc committees throughout their tenure.
In determining that a particular Trustee was and continues to be qualified to serve as a Trustee, the Board has considered a variety of criteria, none of which, in isolation, was controlling. The Board believes that, collectively, the Trustees have balanced and diverse experience, qualifications, attributes, and skills, which allow the Board to operate effectively in governing the fund and protecting the interests of shareholders. Information about the specific experience, skills, attributes, and qualifications of each Trustee, which in each case led to the Board's conclusion that the Trustee should serve (or continue to serve) as a trustee of the fund, is provided below.
Board Structure and Oversight Function. James C. Curvey is an interested person and currently serves as Chairman. The Trustees have determined that an interested Chairman is appropriate and benefits shareholders because an interested Chairman has a personal and professional stake in the quality and continuity of services provided to the fund. Independent Trustees exercise their informed business judgment to appoint an individual of their choosing to serve as Chairman, regardless of whether the Trustee happens to be independent or a member of management. The Independent Trustees have determined that they can act independently and effectively without having an Independent Trustee serve as Chairman and that a key structural component for assuring that they are in a position to do so is for the Independent Trustees to constitute a substantial majority for the Board. The Independent Trustees also regularly meet in executive session. Ned C. Lautenbach serves as Chairman of the Independent Trustees and as such (i) acts as a liaison between the Independent Trustees and management with respect to matters important to the Independent Trustees and (ii) with management prepares agendas for Board meetings.
Fidelity® funds are overseen by different Boards of Trustees. The fund's Board oversees Fidelity's high income and certain equity funds, and other Boards oversee Fidelity's investment-grade bond, money market, asset allocation, and other equity funds. The asset allocation funds may invest in Fidelity® funds overseen by the fund's Board. The use of separate Boards, each with its own committee structure, allows the Trustees of each group of Fidelity® funds to focus on the unique issues of the funds they oversee, including common research, investment, and operational issues. On occasion, the separate Boards establish joint committees to address issues of overlapping consequences for the Fidelity® funds overseen by each Board.
The Trustees operate using a system of committees to facilitate the timely and efficient consideration of all matters of importance to the Trustees, the fund, and fund shareholders and to facilitate compliance with legal and regulatory requirements and oversight of the fund's activities and associated risks. The Board, acting through its committees, has charged SelectCo and its affiliates with (i) identifying events or circumstances the occurrence of which could have demonstrably adverse effects on the fund's business and/or reputation; (ii) implementing processes and controls to lessen the possibility that such events or circumstances occur or to mitigate the effects of such events or circumstances if they do occur; and (iii) creating and maintaining a system designed to evaluate continuously business and market conditions in order to facilitate the identification and implementation processes described in (i) and (ii) above. Because the day-to-day operations and activities of the fund are carried out by or through SelectCo, its affiliates, and other service providers, the fund's exposure to risks is mitigated but not eliminated by the processes overseen by the Trustees. While each of the Board's committees has responsibility for overseeing different aspects of the fund's activities, oversight is exercised primarily through the Operations, Audit, and Compliance Committees. In addition, the Independent Trustees have worked with Fidelity to enhance the Board's oversight of investment and financial risks, legal and regulatory risks, technology risks, and operational risks, including the development of additional risk reporting to the Board. Appropriate personnel, including but not limited to the fund's Chief Compliance Officer (CCO), SelectCo's internal auditor, the independent accountants, the fund's Treasurer and portfolio management personnel, make periodic reports to the Board's committees, as appropriate, including an annual review of Fidelity's risk management program for the Fidelity® funds. The responsibilities of each standing committee, including their oversight responsibilities, are described further under "Standing Committees of the Trustees."
Interested Trustees*:
Correspondence intended for a Trustee who is an interested person may be sent to Fidelity Investments, 245 Summer Street, Boston, Massachusetts 02210.
Name, Year of Birth; Principal Occupations and Other Relevant Experience+
James C. Curvey (1935)
Year of Election or Appointment: 2018
Trustee
Chairman of the Board of Trustees
Mr. Curvey also serves as Trustee of other Fidelity® funds. Mr. Curvey is a Director of Fidelity Research & Analysis Co. (investment adviser firm, 2009-present), and Vice Chairman (2007-present) and Director of FMR LLC (diversified financial services company). In addition, Mr. Curvey serves as an Overseer for the Boston Symphony Orchestra and a member of the board of Artis-Naples, Naples, Florida, and as a Trustee for Brewster Academy, Wolfeboro, New Hampshire. Previously, Mr. Curvey served as a Director of Fidelity Investments Money Management, Inc. (investment adviser firm, 2009-2014) and a Director of FMR and FMR Co., Inc. (investment adviser firms, 2007-2014).
Charles S. Morrison (1960)
Year of Election or Appointment: 2018
Trustee
Mr. Morrison also serves as Trustee of other funds. He serves as President of Fidelity SelectCo, LLC (investment adviser firm, 2017-present) and Fidelity Management & Research Company (FMR) (investment adviser firm, 2016-present), a Director of Fidelity Investments Money Management, Inc. (FIMM) (investment adviser firm, 2014-present), Director of Fidelity SelectCo, LLC (investment adviser firm, 2014-present), President, Asset Management (2014-present), and is an employee of Fidelity Investments. Previously, Mr. Morrison served as Vice President of Fidelity's Fixed Income and Asset Allocation Funds (2012-2014), President, Fixed Income (2011-2014), Vice President of Fidelity's Money Market Funds (2005-2009), President, Money Market Group Leader of FMR (investment adviser firm, 2009), and Senior Vice President, Money Market Group of FMR (2004-2009). Mr. Morrison also served as Vice President of Fidelity's Bond Funds (2002-2005), certain Balanced Funds (2002-2005), and certain Asset Allocation Funds (2002-2007), and as Senior Vice President (2002-2005) of Fidelity's Bond Division.
* Determined to be an "Interested Trustee" by virtue of, among other things, his or her affiliation with the trust or various entities under common control with SelectCo.
+ The information includes the Trustee's principal occupation during the last five years and other information relating to the experience, attributes, and skills relevant to the Trustee's qualifications to serve as a Trustee, which led to the conclusion that the Trustee should serve as a Trustee for the fund.
Independent Trustees:
Correspondence intended for an Independent Trustee may be sent to Fidelity Investments, P.O. Box 55235, Boston, Massachusetts 02205-5235.
Name, Year of Birth; Principal Occupations and Other Relevant Experience+
Dennis J. Dirks (1948)
Year of Election or Appointment: 2018
Trustee
Mr. Dirks also serves as Trustee of other Fidelity® funds. Prior to his retirement in May 2003, Mr. Dirks was Chief Operating Officer and a member of the Board of The Depository Trust & Clearing Corporation (DTCC). He also served as President, Chief Operating Officer, and Board member of The Depository Trust Company (DTC) and President and Board member of the National Securities Clearing Corporation (NSCC). In addition, Mr. Dirks served as Chief Executive Officer and Board member of the Government Securities Clearing Corporation, Chief Executive Officer and Board member of the Mortgage-Backed Securities Clearing Corporation, as a Trustee and a member of the Finance Committee of Manhattan College (2005-2008), as a Trustee and a member of the Finance Committee of AHRC of Nassau County (2006-2008), as a member of the Independent Directors Council (IDC) Governing Council (2010-2015), and as a member of the Board of Directors for The Brookville Center for Children’s Services, Inc. (2009-2017). Mr. Dirks is a member of the Finance Committee (2016-present) and Board of Directors (2017-present) of the Asolo Repertory Theatre.
Donald F. Donahue (1950)
Year of Election or Appointment: 2018
Trustee
Mr. Donahue also serves as a Trustee of other Fidelity® funds. Mr. Donahue is President and Chief Executive Officer of Miranda Partners, LLC (risk consulting for the financial services industry, 2012-present). Previously, Mr. Donahue served as a Member of the Advisory Board of certain Fidelity® funds (2015-2018) and Chief Executive Officer (2006-2012), Chief Operating Officer (2003-2006), and Managing Director, Customer Marketing and Development (1999-2003) of The Depository Trust & Clearing Corporation (financial markets infrastructure). Mr. Donahue serves as a Member (2007-present) and Co-Chairman (2016-present) of the Board of Directors of United Way of New York, Member of the Board of Directors of NYC Leadership Academy (2012-present) and Member of the Board of Advisors of Ripple Labs, Inc. (financial services, 2015-present). He also served as Chairman (2010-2012) and Member of the Board of Directors (2012-2013) of Omgeo, LLC (financial services), Treasurer of United Way of New York (2012-2016), and Member of the Board of Directors of XBRL US (financial services non-profit, 2009-2012) and the International Securities Services Association (2009-2012).
Alan J. Lacy (1953)
Year of Election or Appointment: 2018
Trustee
Mr. Lacy also serves as Trustee of other Fidelity® funds. Mr. Lacy serves as a Director of Bristol-Myers Squibb Company (global pharmaceuticals, 2008-present). He is a Trustee of the California Chapter of The Nature Conservancy (2015-present) and a Director of the Center for Advanced Study in the Behavioral Sciences at Stanford University (2015-present). In addition, Mr. Lacy served as Senior Adviser (2007-2014) of Oak Hill Capital Partners, L.P. (private equity) and also served as Chief Executive Officer (2005) and Vice Chairman (2005-2006) of Sears Holdings Corporation (retail) and Chief Executive Officer and Chairman of the Board of Sears, Roebuck and Co. (retail, 2000-2005). Previously, Mr. Lacy served as Chairman (2014-2017) and a member (2010-2017) of the Board of Directors of Dave & Buster’s Entertainment, Inc. (restaurant and entertainment complexes), as Chairman (2008-2011) and a member (2006-2015) of the Board of Trustees of the National Parks Conservation Association, and as a member of the Board of Directors for The Hillman Companies, Inc. (hardware wholesalers, 2010-2014), Earth Fare, Inc. (retail grocery, 2010-2014), and The Western Union Company (global money transfer, 2006-2011).
Ned C. Lautenbach (1944)
Year of Election or Appointment: 2018
Trustee
Chairman of the Independent Trustees
Mr. Lautenbach also serves as Trustee of other Fidelity® funds. Mr. Lautenbach currently serves as Vice Chair of the Board of Governors, State University System of Florida (2013-present) and is a member of the Council on Foreign Relations (1994-present). He is also a member and has most recently served as Chairman of the Board of Directors of Artis-Naples (2012-present). Previously, Mr. Lautenbach served as a member and then Lead Director of the Board of Directors of Eaton Corporation (diversified industrial, 1997-2016). He was also a Partner and Advisory Partner at Clayton, Dubilier & Rice, LLC (private equity investment, 1998-2010), as well as a Director of Sony Corporation (2006-2007). In addition, Mr. Lautenbach also had a 30-year career with IBM (technology company) during which time he served as Senior Vice President and a member of the Corporate Executive Committee (1968-1998).
Joseph Mauriello (1944)
Year of Election or Appointment: 2018
Trustee
Mr. Mauriello also serves as Trustee of other Fidelity® funds. Prior to his retirement in January 2006, Mr. Mauriello served in numerous senior management positions including Deputy Chairman and Chief Operating Officer (2004-2005), and Vice Chairman of Financial Services (2002-2004) of KPMG LLP US (professional services, 1965-2005). Mr. Mauriello currently serves as a member of the Board of Directors of XL Group plc. (global insurance and re-insurance, 2006-present) and the Independent Directors Council (IDC) Governing Council (2015-present). Previously, Mr. Mauriello served as a Director of the Hamilton Funds of the Bank of New York (2006-2007) and of Arcadia Resources Inc. (health care services and products, 2007-2012).
Cornelia M. Small (1944)
Year of Election or Appointment: 2018
Trustee
Ms. Small also serves as Trustee of other Fidelity® funds. Ms. Small is a member of the Board of Directors (2009-present) and Chair of the Investment Committee (2010-present) of the Teagle Foundation. Ms. Small also serves on the Investment Committee of the Berkshire Taconic Community Foundation (2008-present). Previously, Ms. Small served as Chairperson (2002-2008) and a member of the Investment Committee and Chairperson (2008-2012) and a member of the Board of Trustees of Smith College. In addition, Ms. Small served as Chief Investment Officer, Director of Global Equity Investments, and a member of the Board of Directors of Scudder, Stevens & Clark and Scudder Kemper Investments.
Garnett A. Smith (1947)
Year of Election or Appointment: 2013
Trustee
Mr. Smith also serves as Trustee of other Fidelity® funds. Prior to Mr. Smith's retirement, he served as Chairman and Chief Executive Officer of Inbrand Corp. (manufacturer of personal absorbent products, 1990-1997). He also served as President (1986-1990) of Inbrand Corp. Prior to his employment with Inbrand Corp., he was employed by a retail fabric chain and North Carolina National Bank. In addition, Mr. Smith served as a Member of the Advisory Board of certain Fidelity® funds (2012-2013) and as a board member of the Jackson Hole Land Trust (2009-2012).
David M. Thomas (1949)
Year of Election or Appointment: 2018
Trustee
Mr. Thomas also serves as Trustee of other Fidelity® funds. Mr. Thomas serves as Non-Executive Chairman of the Board of Directors of Fortune Brands Home and Security (home and security products, 2011-present), as a member of the Board of Directors (2004-present) and Presiding Director (2013-present) of Interpublic Group of Companies, Inc. (marketing communication), and as a member of the Board of Trustees of the University of Florida (2013-present). Previously, Mr. Thomas served as Executive Chairman (2005-2006) and Chairman and Chief Executive Officer (2000-2005) of IMS Health, Inc. (pharmaceutical and healthcare information solutions), and a Director of Fortune Brands, Inc. (consumer products, 2000-2011).
Michael E. Wiley (1950)
Year of Election or Appointment: 2008
Trustee
Mr. Wiley also serves as Trustee or Member of the Advisory Board of other Fidelity® funds. Mr. Wiley serves as a Director of Andeavor Corporation (independent oil refiner and marketer, 2005-present), a Director of Andeavor Logistics LP (natural resources logistics, 2015-present), and a Director of Bill Barrett Corporation (exploration and production, 2005-present). In addition, Mr. Wiley also serves as a Director of Post Oak Bank (privately-held bank, 2004-present). Previously, Mr. Wiley served as a Trustee of other Fidelity® funds (2008-2013), as a Director of Asia Pacific Exploration Consolidated (international oil and gas exploration and production, 2008-2013), as a member of the Board of Trustees of the University of Tulsa (2000-2006; 2007-2010), as a Senior Energy Advisor of Katzenbach Partners, LLC (consulting, 2006-2007), as an Advisory Director of Riverstone Holdings (private investment), Chairman, President, and CEO of Baker Hughes, Inc. (oilfield services, 2000-2004), and as Director of Spinnaker Exploration Company (exploration and production, 2001-2005).
+ The information includes the Trustee's principal occupation during the last five years and other information relating to the experience, attributes, and skills relevant to the Trustee's qualifications to serve as a Trustee, which led to the conclusion that the Trustee should serve as a Trustee for the fund.
Advisory Board Members and Officers:
Correspondence intended for a Member of the Advisory Board (if any) may be sent to Fidelity Investments, P.O. Box 55235, Boston, Massachusetts 02205-5235. Correspondence intended for an officer or Peter S. Lynch may be sent to Fidelity Investments, 245 Summer Street, Boston, Massachusetts 02210. Officers appear below in alphabetical order.
Name, Year of Birth; Principal Occupation
Peter S. Lynch (1944)
Year of Election or Appointment: 2018
Member of the Advisory Board
Mr. Lynch also serves as Member of the Advisory Board of other Fidelity® funds. Mr. Lynch is Vice Chairman and a Director of FMR (investment adviser firm) and FMR Co., Inc. (investment adviser firm). In addition, Mr. Lynch serves as a Trustee of Boston College and as the Chairman of the Inner-City Scholarship Fund. Previously, Mr. Lynch served on the Special Olympics International Board of Directors (1997-2006).
William S. Stavropoulos (1939)
Year of Election or Appointment: 2018
Member of the Advisory Board
Mr. Stavropoulos also serves as Member of the Advisory Board of other Fidelity® funds. Mr. Stavropoulos serves as President and Founder of the Michigan Baseball Foundation, the Great Lakes Loons (2007-present). Mr. Stavropoulos is Chairman Emeritus of the Board of Directors of The Dow Chemical Company, where he previously served in numerous senior management positions, including President, CEO (1995-2000; 2002-2004), Chairman of the Executive Committee (2000-2006), and as a member of the Board of Directors (1990-2006). Currently, Mr. Stavropoulos is Chairman of the Board of Directors of Univar Inc. (global distributor of commodity and specialty chemicals), a Director of Teradata Corporation (data warehousing and technology solutions), and a member of the Advisory Board for Metalmark Capital LLC (private equity investment, 2005-present). Mr. Stavropoulos is an operating advisor to Clayton, Dubilier & Rice, LLC (private equity investment). In addition, Mr. Stavropoulos is a member of the University of Notre Dame Advisory Council for the College of Science, a Trustee of the Rollin L. Gerstacker Foundation, and a Director of Artis-Naples in Naples, Florida. Previously, Mr. Stavropoulos served as Trustee of certain Fidelity® funds (2001-2018) and as a Director of Chemical Financial Corporation (bank holding company, 1993-2012) and Tyco International, Ltd. (multinational manufacturing and services, 2007-2012).
Carol B. Tomé (1957)
Year of Election or Appointment: 2017
Member of the Advisory Board
Ms. Tomé also serves as Member of the Advisory Board of other Fidelity® funds. Ms. Tomé is Chief Financial Officer (2001-present) and Executive Vice President of Corporate Services (2007-present) of The Home Depot, Inc. (home improvement retailer) and a Director (2003-present) and Chair of the Audit Committee (2004-present) of United Parcel Service, Inc. (package delivery and supply chain management). Previously, Ms. Tomé served as Trustee of certain Fidelity® funds (2017), Senior Vice President of Finance and Accounting/Treasurer (2000-2007) and Vice President and Treasurer (1995-2000) of The Home Depot, Inc. and Chair of the Board (2010-2012), Vice Chair of the Board (2009 and 2013), and a Director (2008-2013) of the Federal Reserve Bank of Atlanta. Ms. Tomé is also a director or trustee of many community and professional organizations.
Elizabeth Paige Baumann (1968)
Year of Election or Appointment: 2017
Anti-Money Laundering (AML) Officer
Ms. Baumann also serves as AML Officer of other funds. She is Chief AML Officer (2012-present) and Senior Vice President (2014-present) of FMR LLC (diversified financial services company) and is an employee of Fidelity Investments. Previously, Ms. Baumann served as AML Officer of the funds (2012-2016), and Vice President (2007-2014) and Deputy Anti-Money Laundering Officer (2007-2012) of FMR LLC.
Marc R. Bryant (1966)
Year of Election or Appointment: 2013
Secretary and Chief Legal Officer (CLO)
Mr. Bryant also serves as Secretary and CLO of other funds. Mr. Bryant serves as CLO, Secretary, and Senior Vice President of Fidelity Management & Research Company (investment adviser firm, 2015-present) and FMR Co., Inc. (investment adviser firm, 2015-present); Secretary of Fidelity SelectCo, LLC (investment adviser firm, 2015-present) and Fidelity Investments Money Management, Inc. (investment adviser firm, 2015-present); and CLO of Fidelity Management & Research (Hong Kong) Limited and FMR Investment Management (UK) Limited (investment adviser firms, 2015-present) and Fidelity Management & Research (Japan) Limited (investment adviser firm, 2016-present). He is Senior Vice President and Deputy General Counsel of FMR LLC (diversified financial services company). Previously, Mr. Bryant served as Secretary and CLO of Fidelity Rutland Square Trust II (2010-2014) and Assistant Secretary of Fidelity's Fixed Income and Asset Allocation Funds (2013-2015). Prior to joining Fidelity Investments, Mr. Bryant served as a Senior Vice President and the Head of Global Retail Legal for AllianceBernstein L.P. (2006-2010), and as the General Counsel for ProFund Advisors LLC (2001-2006).
William C. Coffey (1969)
Year of Election or Appointment: 2009
Assistant Secretary
Mr. Coffey also serves as Assistant Secretary of other funds. He is Senior Vice President and Deputy General Counsel of FMR LLC (diversified financial services company, 2010-present), and is an employee of Fidelity Investments. Previously, Mr. Coffey served as Vice President and Associate General Counsel of FMR LLC (2005-2009).
Jonathan Davis (1968)
Year of Election or Appointment: 2010
Assistant Treasurer
Mr. Davis also serves as Assistant Treasurer of other funds. Mr. Davis serves as Assistant Treasurer of FMR Capital, Inc. (2017-present) and is an employee of Fidelity Investments. Previously, Mr. Davis served as Vice President and Associate General Counsel of FMR LLC (diversified financial services company, 2003-2010).
Adrien E. Deberghes (1967)
Year of Election or Appointment: 2018
Assistant Treasurer
Mr. Deberghes also serves as an officer of other funds. He serves as Assistant Treasurer of FMR Capital, Inc. (2017-present), Executive Vice President of Fidelity Investments Money Management, Inc. (FIMM) (investment adviser firm, 2016-present), and is an employee of Fidelity Investments (2008-present). Previously, Mr. Deberghes served as President and Treasurer of certain Fidelity® funds (2013-2018). Prior to joining Fidelity Investments, Mr. Deberghes was Senior Vice President of Mutual Fund Administration at State Street Corporation (2007-2008), Senior Director of Mutual Fund Administration at Investors Bank & Trust (2005-2007), and Director of Finance for Dunkin' Brands (2000-2005). Previously, Mr. Deberghes served in other fund officer roles.
Joseph DeSantis (1959)
Year of Election or Appointment: 2015
Vice President
Mr. DeSantis also serves as Vice President of other funds. Mr. DeSantis serves as a Director of Fidelity Management & Research (Japan) Limited (investment adviser firm, 2016-present), Chief Investment Officer, Equities (2010-present) and is an employee of Fidelity Investments.
Stephanie J. Dorsey (1969)
Year of Election or Appointment: 2010
Assistant Treasurer
Ms. Dorsey also serves as an officer of other funds. Ms. Dorsey serves as Assistant Treasurer of FMR Capital, Inc. (2017-present), is an employee of Fidelity Investments (2008-present), and has served in other fund officer roles. Prior to joining Fidelity Investments, Ms. Dorsey served as Treasurer (2004-2008) of the JPMorgan Mutual Funds and Vice President (2004-2008) of JPMorgan Chase Bank.
Howard J. Galligan III (1966)
Year of Election or Appointment: 2014
Chief Financial Officer
Mr. Galligan also serves as Chief Financial Officer of other funds. Mr. Galligan serves as President of Fidelity Pricing and Cash Management Services (FPCMS) (2014-present) and as a Director of Strategic Advisers LLC (investment adviser firm, 2008-present). Previously, Mr. Galligan served as Chief Administrative Officer of Asset Management (2011-2014) and Chief Operating Officer and Senior Vice President of Investment Support for Strategic Advisers, Inc. (2003-2011).
Brian B. Hogan (1964)
Year of Election or Appointment: 2009
Vice President
Mr. Hogan also serves as Trustee or Vice President of other funds. Mr. Hogan serves as Head of Fidelity Investments’ Investment Solutions and Innovation organization (2018-present), and as a Director of FMR Investment Management (UK) Limited (investment adviser firm, 2015-present) and Fidelity SelectCo, LLC (investment adviser firm, 2014-present). Previously, Mr. Hogan served as Trustee of certain Fidelity® funds (2014-2018), President of the Equity Division of FMR (investment adviser firm, 2009-2018), Senior Vice President, Equity Research of FMR (2006-2009), and as a portfolio manager. Mr. Brian B. Hogan is not related to Mr. Colm A. Hogan.
Colm A. Hogan (1973)
Year of Election or Appointment: 2018
Deputy Treasurer
Mr. Hogan also serves as an officer of other funds. Mr. Hogan serves as Assistant Treasurer of FMR Capital, Inc. (2017-present) and is an employee of Fidelity Investments (2005-present). Previously, Mr. Hogan served as Assistant Treasurer of certain Fidelity® funds (2016-2018). Mr. Colm A. Hogan is not related to Mr. Brian B. Hogan.
Chris Maher (1972)
Year of Election or Appointment: 2013
Assistant Treasurer
Mr. Maher serves as Assistant Treasurer of other funds. Mr. Maher is Vice President of Valuation Oversight, serves as Assistant Treasurer of FMR Capital, Inc. (2017-present), and is an employee of Fidelity Investments. Previously, Mr. Maher served as Vice President of Asset Management Compliance (2013), Vice President of the Program Management Group of FMR (investment adviser firm, 2010-2013), and Vice President of Valuation Oversight (2008-2010).
Rieco E. Mello (1969)
Year of Election or Appointment: 2017
Assistant Treasurer
Mr. Mello also serves as Assistant Treasurer of other funds. Mr. Mello serves as Assistant Treasurer of FMR Capital, Inc. (2017-present) and is an employee of Fidelity Investments (1995-present).
Kenneth B. Robins (1969)
Year of Election or Appointment: 2018
Chief Compliance Officer
Mr. Robins also serves as an officer of other funds. Mr. Robins serves as Compliance Officer of Fidelity Management & Research Company and FMR Co., Inc. (investment adviser firms, 2016-present) and is an employee of Fidelity Investments (2004-present). Previously, Mr. Robins served as Executive Vice President of Fidelity Investments Money Management, Inc. (investment adviser firm, 2013-2016) and served in other fund officer roles.
Stacie M. Smith (1974)
Year of Election or Appointment: 2018
President and Treasurer
Ms. Smith also serves as an officer of other funds. Ms. Smith serves as Assistant Treasurer of FMR Capital, Inc. (2017-present), is an employee of Fidelity Investments (2009-present), and has served in other fund officer roles. Prior to joining Fidelity Investments, Ms. Smith served as Senior Audit Manager of Ernst & Young LLP (accounting firm, 1996-2009). Previously, Ms. Smith served as Assistant Treasurer (2013-2018) and Deputy Treasurer (2013-2016) of certain Fidelity® funds.
Marc L. Spector (1972)
Year of Election or Appointment: 2017
Assistant Treasurer
Mr. Spector also serves as an officer of other funds. Mr. Spector serves as Assistant Treasurer of FMR Capital, Inc. (2017-present) and is an employee of Fidelity Investments (2016-present). Prior to joining Fidelity Investments, Mr. Spector served as Director at the Siegfried Group (accounting firm, 2013-2016), and prior to Siegfried Group as audit senior manager at Deloitte & Touche (accounting firm, 2005-2013).
Renee Stagnone (1975)
Year of Election or Appointment: 2016
Assistant Treasurer
Ms. Stagnone also serves as an officer of other funds. Ms. Stagnone serves as Assistant Treasurer of FMR Capital, Inc. (2017-present) and is an employee of Fidelity Investments (1997-present). Previously, Ms. Stagnone served as Deputy Treasurer of certain Fidelity® funds (2013-2016).
Shareholder Expense Example
As a shareholder of the Fund, you incur two types of costs: (1) transaction costs, including sales charges (loads) on purchase payments or redemption proceeds, redemption fees and (2) ongoing costs, including management fees, distribution and/or service (12b-1) fees and other Fund expenses. This Example is intended to help you understand your ongoing costs (in dollars) of investing in the Fund and to compare these costs with the ongoing costs of investing in other mutual funds.
The Example is based on an investment of $1,000 invested at the beginning of the period and held for the entire period (September 1, 2017 to February 28, 2018).
Actual Expenses
The first line of the accompanying table for each class of the Fund provides information about actual account values and actual expenses. You may use the information in this line, together with the amount you invested, to estimate the expenses that you paid over the period. Simply divide your account value by $1,000.00 (for example, an $8,600 account value divided by $1,000.00 = 8.6), then multiply the result by the number in the first line for a class of the Fund under the heading entitled "Expenses Paid During Period" to estimate the expenses you paid on your account during this period. A small balance maintenance fee of $12.00 that is charged once a year may apply for certain accounts with a value of less than $2,000. This fee is not included in the table below. If it was, the estimate of expenses you paid during the period would be higher, and your ending account value lower, by this amount. In addition, the Fund, as a shareholder in the underlying Fidelity Central Funds, will indirectly bear its pro-rata share of the fees and expenses incurred by the underlying Fidelity Central Funds. These fees and expenses are not included in the Fund's annualized expense ratio used to calculate the expense estimate in the table below.
Hypothetical Example for Comparison Purposes
The second line of the accompanying table for each class of the Fund provides information about hypothetical account values and hypothetical expenses based on a Class' actual expense ratio and an assumed rate of return of 5% per year before expenses, which is not the Class' actual return. The hypothetical account values and expenses may not be used to estimate the actual ending account balance or expenses you paid for the period. You may use this information to compare the ongoing costs of investing in the Fund and other funds. To do so, compare this 5% hypothetical example with the 5% hypothetical examples that appear in the shareholder reports of the other funds. A small balance maintenance fee of $12.00 that is charged once a year may apply for certain accounts with a value of less than $2,000. This fee is not included in the table below. If it was, the estimate of expenses you paid during the period would be higher, and your ending account value lower, by this amount. In addition, the Fund, as a shareholder in the underlying Fidelity Central Funds, will indirectly bear its pro-rata share of the fees and expenses incurred by the underlying Fidelity Central Funds. These fees and expenses are not included in the Fund's annualized expense ratio used to calculate the expense estimate in the table below.
Please note that the expenses shown in the table are meant to highlight your ongoing costs only and do not reflect any transaction costs. Therefore, the second line of the table is useful in comparing ongoing costs only, and will not help you determine the relative total costs of owning different funds. In addition, if these transactional costs were included, your costs would have been higher.
| | Annualized Expense Ratio-A | Beginning
Account Value
September 1, 2017 | Ending
Account Value
February 28, 2018 | Expenses Paid
During Period-B
September 1, 2017
to February 28, 2018 |
| Class A | 1.05% | | | |
| Actual | | $1,000.00 | $972.80 | $5.14 |
| Hypothetical-C | | $1,000.00 | $1,019.59 | $5.26 |
| Class M | 1.32% | | | |
| Actual | | $1,000.00 | $971.50 | $6.45 |
| Hypothetical-C | | $1,000.00 | $1,018.25 | $6.61 |
| Class C | 1.79% | | | |
| Actual | | $1,000.00 | $969.20 | $8.74 |
| Hypothetical-C | | $1,000.00 | $1,015.92 | $8.95 |
| Consumer Staples | .76% | | | |
| Actual | | $1,000.00 | $974.20 | $3.72 |
| Hypothetical-C | | $1,000.00 | $1,021.03 | $3.81 |
| Class I | .78% | | | |
| Actual | | $1,000.00 | $974.10 | $3.82 |
| Hypothetical-C | | $1,000.00 | $1,020.93 | $3.91 |
A Annualized expense ratio reflects expenses net of applicable fee waivers.
B Expenses are equal to each Class' annualized expense ratio, multiplied by the average account value over the period, multiplied by 181/365 (to reflect the one-half year period).
C 5% return per year before expenses
Distributions (Unaudited)
The Board of Trustees of Consumer Staples Portfolio voted to pay to shareholders of record at the opening of business on record date, the following distributions per share derived from capital gains realized from sales of portfolio securities, and dividends derived from net investment income:
| | Pay Date | Record Date | Dividends | Capital Gains |
| Consumer Staples Portfolio | | | | |
| Class A | 04/12/18 | 04/11/18 | $0.207 | $5.129 |
| Class M | 04/12/18 | 04/11/18 | $0.166 | $5.129 |
| Class C | 04/12/18 | 04/11/18 | $0.088 | $5.129 |
| Consumer Staples | 04/12/18 | 04/11/18 | $0.255 | $5.129 |
| Class I | 04/12/18 | 04/11/18 | $0.251 | $5.129 |
|
The fund hereby designates as a capital gain dividend with respect to the taxable year ended February 28, 2018, $297,296,339, or, if subsequently determined to be different, the net capital gain of such year.
Class A designates 100% and 100%; Class M designates 100% and 100%; Class C designates 100% and 100%; Consumer Staples designates 86% and 100%; and Class I designates 84% and 100%; of the dividends distributed in April and December, respectively during the fiscal year as qualifying for the dividends–received deduction for corporate shareholders.
Class A, Class M, Class C, Consumer Staples, and Class I designate 100% of each dividends distributed during the fiscal year as amounts which may be taken into account as a dividend for purposes of the maximum rate under section 1(h)(11) of the Internal Revenue Code.
The fund will notify shareholders in January 2019 of amounts for use in preparing 2018 income tax returns.
Board Approval of Investment Advisory Contracts and Management Fees
Consumer Staples Portfolio
Each year, the Board of Trustees, including the Independent Trustees (together, the Board), votes on the renewal of the management contract with Fidelity SelectCo, LLC (SelectCo), an affiliate of Fidelity Management & Research Company (FMR), and the sub-advisory agreements with affiliates of FMR (together, the Advisory Contracts) for the fund. SelectCo and the sub-advisers are collectively referred to herein as the Investment Advisers. The Board, assisted by the advice of fund counsel and Independent Trustees' counsel, requests and considers a broad range of information relevant to the renewal of the Advisory Contracts throughout the year.
The Board meets regularly and, at each of its meetings, covers an extensive agenda of topics and materials and considers factors that are relevant to its annual consideration of the renewal of the fund's Advisory Contracts, including the services and support provided to the fund and its shareholders. The Board has established four standing committees (Committees) — Operations, Audit, Fair Valuation, and Governance and Nominating — each composed of and chaired by Independent Trustees with varying backgrounds, to which the Board has assigned specific subject matter responsibilities in order to enhance effective decision-making by the Board. The Operations Committee, of which all of the Independent Trustees are members, meets regularly throughout the year and considers, among other matters, information specifically related to the annual consideration of the renewal of the fund's Advisory Contracts. The Board, acting directly and through its Committees, requests and receives information concerning the annual consideration of the renewal of the fund's Advisory Contracts. The Board also meets as needed to review matters specifically related to the Board's annual consideration of the renewal of the Advisory Contracts. Members of the Board may also meet with trustees of other Fidelity funds through ad hoc joint committees to discuss certain matters relevant to all of the Fidelity funds.
At its January 2018 meeting, the Board unanimously determined to renew the fund's Advisory Contracts. In reaching its determination, the Board considered all factors it believed relevant, including (i) the nature, extent, and quality of the services to be provided to the fund and its shareholders (including the investment performance of the fund); (ii) the competitiveness of the fund's management fee and total expense ratio relative to peer funds; (iii) the total costs of the services to be provided by and the profits to be realized by Fidelity from its relationships with the fund; and (iv) the extent to which, if any, economies of scale exist and would be realized as the fund grows, and whether any economies of scale are appropriately shared with fund shareholders.
In considering whether to renew the Advisory Contracts for the fund, the Board reached a determination, with the assistance of fund counsel and Independent Trustees' counsel and through the exercise of its business judgment, that the renewal of the Advisory Contracts was in the best interests of the fund and its shareholders and that the compensation payable under the Advisory Contracts was fair and reasonable. The Board's decision to renew the Advisory Contracts was not based on any single factor, but rather was based on a comprehensive consideration of all the information provided to the Board at its meetings throughout the year. The Board, in reaching its determination to renew the Advisory Contracts, was aware that shareholders of the fund have a broad range of investment choices available to them, including a wide choice among funds offered by Fidelity's competitors, and that the fund's shareholders, who have the opportunity to review and weigh the disclosure provided by the fund in its prospectus and other public disclosures, have chosen to invest in this fund, which is part of the Fidelity family of funds.
Amendment to Group Fee Rate. The Board also ratified an amendment to the management contract for the fund to add an additional breakpoint to the group fee schedule, which was effective October 1, 2017. The Board noted that the additional breakpoint would result in lower management fee rates to the extent that assets under management that are included in group fee calculations increase above the new breakpoint.
Nature, Extent, and Quality of Services Provided. The Board considered the staffing of the Investment Advisers as it relates to the fund, including the backgrounds of investment personnel of SelectCo, and also considered the fund's investment objective, strategies, and related investment philosophy. The Independent Trustees also had discussions with senior management of Fidelity's investment operations and investment groups. The Board considered the structure of the investment personnel compensation program and whether this structure provides appropriate incentives to act in the best interests of the fund. Additionally, the Board considered the portfolio managers' investments, if any, in the funds that they manage.
Resources Dedicated to Investment Management and Support Services. The Board reviewed the general qualifications and capabilities of the Investment Advisers' investment staffs, including their size, education, experience, and resources, as well as Fidelity's approach to recruiting, training, managing, and compensating investment personnel. The Board noted that Fidelity has continued to increase the resources devoted to non-U.S. offices, including expansion of Fidelity's global investment organization. The Board also noted that Fidelity's analysts have extensive resources, tools and capabilities that allow them to conduct sophisticated quantitative and fundamental analysis, as well as credit analysis of issuers, counterparties and guarantors. Further, the Board considered that Fidelity's investment professionals have sufficient access to global information and data so as to provide competitive investment results over time, and that those professionals also have access to sophisticated tools that permit them to assess portfolio construction and risk and performance attribution characteristics continuously, as well as to transmit new information and research conclusions rapidly around the world. Additionally, in its deliberations, the Board considered Fidelity's trading, risk management, compliance, and technology and operations capabilities and resources, which are integral parts of the investment management process.
Shareholder and Administrative Services. The Board considered (i) the nature, extent, quality, and cost of advisory, administrative, and shareholder services performed by the Investment Advisers and their affiliates under the Advisory Contracts and under separate agreements covering transfer agency, pricing and bookkeeping, and securities lending services for the fund; (ii) the nature and extent of the supervision of third party service providers, principally custodians, subcustodians, and pricing vendors; and (iii) the resources devoted to, and the record of compliance with, the fund's compliance policies and procedures. The Board also reviewed the allocation of fund brokerage, including allocations to brokers affiliated with the Investment Advisers, the use of brokerage commissions to pay fund expenses, and the use of "soft" commission dollars to pay for research services.
The Board noted that the growth of fund assets over time across the complex allows Fidelity to reinvest in the development of services designed to enhance the value or convenience of the Fidelity funds as investment vehicles. These services include 24-hour access to account information and market information through telephone representatives and over the Internet, investor education materials and asset allocation tools, and the expanded availability of Fidelity Investor Centers.
The Board noted that it and the boards of certain other Fidelity funds had formed an ad hoc Committee on Transfer Agency Fees to review the variety of transfer agency fee structures throughout the industry and Fidelity's competitive positioning with respect to industry participants.
Investment in a Large Fund Family. The Board considered the benefits to shareholders of investing in a Fidelity fund, including the benefits of investing in a fund that is part of a large family of funds offering a variety of investment disciplines and providing a large variety of mutual fund investor services. The Board noted that Fidelity had taken, or had made recommendations that resulted in the Fidelity funds taking, a number of actions over the previous year that benefited particular funds, including: (i) continuing to dedicate additional resources to Fidelity's investment research process, which includes meetings with management of issuers in which the funds invest, and to the support of the senior management team that oversees asset management; (ii) continuing efforts to enhance Fidelity's global research capabilities; (iii) launching new funds and making other enhancements to meet client needs; (iv) launching new share classes of existing funds; (v) eliminating purchase minimums and broadening eligibility requirements for certain lower-priced share classes; (vi) reducing management fees and total expenses for certain growth equity funds and index funds; (vii) lowering expense caps for certain existing funds and classes to reduce expenses borne by shareholders; (viii) eliminating short-term redemption fees for certain funds; (ix) introducing a new pricing structure for certain funds of funds that is expected to reduce overall expenses paid by shareholders; (x) rationalizing product lines and gaining increased efficiencies through proposals for fund mergers and share class consolidations; (xi) continuing to develop, acquire and implement systems and technology to improve services to the funds and shareholders, strengthen information security, and increase efficiency; and (xii) implementing enhancements to further strengthen Fidelity's product line to increase investors' probability of success in achieving their investment goals, including retirement income goals.
Investment Performance. The Board considered whether the fund has operated in accordance with its investment objective, as well as its record of compliance with its investment restrictions and its performance history.
The Board took into account discussions with representatives of SelectCo about fund investment performance that occur at Board meetings throughout the year. In this regard the Board noted that as part of regularly scheduled fund reviews and other reports to the Board on fund performance, the Board considers annualized return information for the fund for different time periods, measured against a securities market index ("benchmark index"). In its evaluation of fund investment performance at meetings throughout the year, the Board gave particular attention to information indicating underperformance of certain Fidelity funds for specific time periods and discussed with the Investment Advisers the reasons for such underperformance.
In addition to reviewing absolute and relative fund performance, the Independent Trustees periodically consider the appropriateness of fund performance metrics in evaluating the results achieved. In general, the Independent Trustees believe that fund performance should be evaluated based on net performance (after fees and expenses) of both the highest performing and lowest performing fund share classes, where applicable, compared to appropriate benchmark indices, over appropriate time periods that may include full market cycles, taking into account relevant factors, including the following: general market conditions; issuer-specific information; and fund cash flows and other factors. Depending on the circumstances, the Independent Trustees may be satisfied with a fund's performance notwithstanding that it lags its benchmark index for certain periods.
The Independent Trustees recognize that shareholders evaluate performance on a net basis over their own holding periods, for which one-, three-, and five-year periods are often used as a proxy. For this reason, the performance information reviewed by the Board also included net cumulative total return information for the fund and an appropriate benchmark index for the most recent one-, three-, and five-year periods ended June 30, 2017.
Based on its review, the Board concluded that the nature, extent, and quality of services provided to the fund under the Advisory Contracts should continue to benefit the shareholders of the fund.
Competitiveness of Management Fee and Total Expense Ratio. The Board considered the fund's management fee and total expense ratio compared to "mapped groups" of competitive funds and classes created for the purpose of facilitating the Trustees' analysis of the competitiveness of management fees and total expenses. Fidelity creates "mapped groups" by combining similar Lipper investment objective categories that have comparable investment mandates. For this purpose, all sector focused equity funds are grouped in the same mapped group. Combining Lipper investment objective categories aids the Board's management fee and total expense ratio comparisons by broadening the competitive group used for comparison.
Management Fee. The Board considered two proprietary management fee comparisons for the 12-month periods ended June 30 shown in basis points (BP) in the chart below. The group of Lipper funds used by the Board for management fee comparisons is referred to below as the "Total Mapped Group." The Total Mapped Group comparison focuses on a fund's standing in terms of gross management fees before expense reimbursements or caps relative to the total universe of funds with comparable investment mandates (
i.e., sector equities), regardless of whether their management fee structures also are comparable. Funds with comparable management fee structures have similar management fee contractual arrangements (
e.g., flat rate charged for advisory services, all-inclusive fee rate,
etc.). "TMG %" represents the percentage of funds in the Total Mapped Group that had management fees that were lower than the fund's. For example, a hypothetical TMG % of 20% would mean that 80% of the funds in the Total Mapped Group had higher, and 20% had lower, management fees than the fund. The fund's actual TMG %s and the number of funds in the Total Mapped Group are in the chart below. The "Asset-Size Peer Group" (ASPG) comparison focuses on a fund's standing relative to a subset of non-Fidelity funds within the Total Mapped Group that are similar in size and management fee structure. For example, if a fund is in the first quartile of the ASPG, the fund's management fee ranks in the least expensive or lowest 25% of funds in the ASPG. The ASPG represents at least 15% of the funds in the Total Mapped Group with comparable asset size and management fee structures, subject to a minimum of 50 funds (or all funds in the Total Mapped Group if fewer than 50). Additional information, such as the ASPG quartile in which the fund's management fee rate ranked, is also included in the chart and considered by the Board.
Consumer Staples Portfolio

The Board noted that the fund's management fee rate ranked below the median of its Total Mapped Group and below the median of its ASPG for the 12-month period ended June 30, 2017.
The Board noted that it and the boards of other Fidelity funds formed an ad hoc Committee on Group Fee, which meets periodically, to conduct an in-depth review of the "group fee" component of the management fee of funds with such management fee structures. The Committee's focus included the mechanics of the group fee, the competitive landscape of group fee structures, Fidelity funds with no group fee component and investment products not included in group fee assets. The Board also considered that, for funds subject to the group fee, FMR agreed to voluntarily waive fees over a specified period of time in amounts designed to account for assets converted from certain funds to certain collective investment trusts.
Based on its review, the Board concluded that the fund's management fee is fair and reasonable in light of the services that the fund receives and the other factors considered.
Total Expense Ratio. In its review of each class's total expense ratio, the Board considered the fund's management fee rate as well as other fund or class expenses, as applicable, such as transfer agent fees, pricing and bookkeeping fees, fund-paid 12b-1 fees, and custodial, legal, and audit fees. The Board also noted that Fidelity may agree to waive fees and expenses from time to time, and the extent to which, if any, it has done so for the fund. As part of its review, the Board also considered the current and historical total expense ratios of each class of the fund compared to competitive fund median expenses. Each class of the fund is compared to those funds and classes in the Total Mapped Group (used by the Board for management fee comparisons) that have a similar sales load structure.
The Board noted that the total expense ratio of each class ranked below the competitive median for the 12-month period ended June 30, 2017.
Fees Charged to Other Fidelity Clients. The Board also considered Fidelity fee structures and other information with respect to clients of Fidelity, such as other funds advised or subadvised by Fidelity, pension plan clients, and other institutional clients with similar mandates. The Board noted that an ad hoc joint committee created by it and the boards of other Fidelity funds periodically reviews and compares Fidelity's institutional investment advisory business with its business of providing services to the Fidelity funds, including the differences in services provided, fees charged, and costs incurred, as well as competition in their respective marketplaces.
Based on its review of total expense ratios and fees charged to other Fidelity clients, the Board concluded that the total expense ratio of each class of the fund was reasonable in light of the services that the fund and its shareholders receive and the other factors considered.
Costs of the Services and Profitability. The Board considered the revenues earned and the expenses incurred by Fidelity in conducting the business of developing, marketing, distributing, managing, administering and servicing the fund and servicing the fund's shareholders. The Board also considered the level of Fidelity's profits in respect of all the Fidelity funds.
On an annual basis, Fidelity presents to the Board information about the profitability of its relationships with the fund. Fidelity calculates profitability information for each fund, as well as aggregate profitability information for groups of Fidelity funds and all Fidelity funds, using a series of detailed revenue and cost allocation methodologies which originate with the books and records of Fidelity on which Fidelity's audited financial statements are based. The Audit Committee of the Board reviews any significant changes from the prior year's methodologies.
PricewaterhouseCoopers LLP (PwC), independent registered public accounting firm and auditor to Fidelity and certain Fidelity funds, has been engaged annually by the Board as part of the Board's assessment of the profitability analysis used by Fidelity. PwC's engagement includes the review and assessment of Fidelity's methodologies used in determining the revenues and expenses attributable to Fidelity's mutual fund business, and completion of agreed-upon procedures in respect of the mathematical accuracy of the fund profitability information and its conformity to established allocation methodologies. After considering PwC's reports issued under the engagement and information provided by Fidelity, the Board concluded that while other allocation methods may also be reasonable, Fidelity's profitability methodologies are reasonable in all material respects.
The Board also reviewed Fidelity's non-fund businesses and potential fall-out benefits related to the mutual fund business as well as cases where Fidelity's affiliates may benefit from or be related to the fund's business.
The Board considered the costs of the services provided by and the profits realized by Fidelity in connection with the operation of the fund and was satisfied that the profitability was not excessive.
Economies of Scale. The Board considered whether there have been economies of scale in respect of the management of the Fidelity funds, whether the Fidelity funds (including the fund) have appropriately benefited from any such economies of scale, and whether there is potential for realization of any further economies of scale. The Board considered the extent to which the fund will benefit from economies of scale as assets grow through increased services to the fund, through waivers or reimbursements, or through fee or expense ratio reductions. The Board also noted that a committee (the Economies of Scale Committee) created by it and the boards of other Fidelity funds periodically analyzes whether Fidelity attains economies of scale in respect of the management and servicing of the Fidelity funds, whether the Fidelity funds have appropriately benefited from such economies of scale, and whether there is potential for realization of any further economies of scale.
The Board recognized that the fund's management contract incorporates a "group fee" structure, which provides for lower group fee rates as total group assets increase, and for higher group fee rates as total group assets decrease (with "group assets" defined to include fund assets under SelectCo's management plus assets under FMR's management). SelectCo calculates the group fee rates based on a tiered asset "breakpoint" schedule that varies based on asset class. The Board considered that the group fee is designed to deliver the benefits of economies of scale to fund shareholders when total group assets increase, even if assets of any particular fund are unchanged or have declined, because some portion of Fidelity's costs are attributable to services provided to all Fidelity funds, and all funds benefit if those costs can be allocated among more assets. The Board concluded that, given the group fee structure, fund shareholders will benefit from lower management fees as group assets increase at the fund complex level, regardless of whether Fidelity achieves any such economies of scale.
The Board concluded, taking into account the analysis of the Economies of Scale Committee, that economies of scale, if any, are being appropriately shared between fund shareholders and Fidelity.
Additional Information Requested by the Board. In order to develop fully the factual basis for consideration of the Fidelity funds' advisory contracts, the Board requested and received additional information on certain topics, including: (i) Fidelity's fund profitability methodology, profitability trends for certain funds, and the impact of certain factors on fund profitability results; (ii) portfolio manager changes that have occurred during the past year and the amount of the investment that each portfolio manager has made in the Fidelity fund(s) that he or she manages; (iii) Fidelity's compensation structure for portfolio managers, research analysts, and other key personnel, including its effects on fund profitability; (iv) comparisons to institutional products; (v) the arrangements with and compensation paid to certain fund sub-advisers on behalf of the Fidelity funds; (vi) the impact of proposed changes to contractual expense cap arrangements in place for certain funds; (vii) Fidelity's long-term expectations for its offerings in the workplace investing channel; (viii) the methodology with respect to evaluating competitive fund data and peer group classifications and fee comparisons; (ix) the presentation of certain fund performance information; (x) Fidelity's transfer agent fee, expense, and service structures for different funds and classes, including the increased use of omnibus accounts and lower pricing in the retirement channel; (xi) fluctuations in trading expenses; (xii) explanations regarding the relative total expense ratios of certain funds and classes; and (xiii) Fidelity's expectations regarding the future asset levels of certain funds.
Based on its evaluation of all of the conclusions noted above, and after considering all factors it believed relevant, the Board concluded that the advisory fee structures are fair and reasonable, and that the fund's Advisory Contracts should be renewed.
Proxy Voting Results
A special meeting of shareholders was held on December 8, 2017. The results of votes taken among shareholders on the proposals before them are reported below. Each vote reported represents one dollar of net asset value held on the record date for the meeting.
PROPOSAL 1
To elect a Board of Trustees.
| | # of
Votes | % of
Votes |
| James C. Curvey |
| Affirmative | 40,874,579,146.19 | 94.146 |
| Withheld | 2,541,618,753.48 | 5.854 |
| TOTAL | 43,416,197,899.67 | 100.000 |
| Dennis J. Dirks |
| Affirmative | 41,093,243,800.03 | 94.650 |
| Withheld | 2,322,954,099.64 | 5.350 |
| TOTAL | 43,416,197,899.67 | 100.000 |
| Donald F. Donahue |
| Affirmative | 41,121,116,505.64 | 94.714 |
| Withheld | 2,295,081,394.03 | 5.286 |
| TOTAL | 43,416,197,899.67 | 100.000 |
| Alan J. Lacy |
| Affirmative | 41,091,494,851.72 | 94.646 |
| Withheld | 2,324,703,047.95 | 5.354 |
| TOTAL | 43,416,197,899.67 | 100.00 |
| Ned C. Lautenbach |
| Affirmative | 40,970,733,721.42 | 94.368 |
| Withheld | 2,445,464,178.25 | 5.632 |
| TOTAL | 43,416,197,899.67 | 100.000 |
| Joseph Mauriello |
| Affirmative | 41,021,688,840.89 | 94.485 |
| Withheld | 2,394,509,058.78 | 5.515 |
| TOTAL | 43,416,197,899.67 | 100.000 |
| Charles S. Morrison |
| Affirmative | 41,163,534,997.01 | 94.812 |
| Withheld | 2,252,662,902.66 | 5.188 |
| TOTAL | 43,416,197,899.67 | 100.000 |
| Cornelia M. Small |
| Affirmative | 41,061,752,034.66 | 94.578 |
| Withheld | 2,354,445,865.01 | 5.422 |
| TOTAL | 43,416,197,899.67 | 100.000 |
| Garnett A. Smith |
| Affirmative | 41,061,939,407.02 | 94.578 |
| Withheld | 2,354,258,492.65 | 5.422 |
| TOTAL | 43,416,197,899.67 | 100.000 |
| David M. Thomas |
| Affirmative | 41,102,875,738.06 | 94.672 |
| Withheld | 2,313,322,161.61 | 5.328 |
| TOTAL | 43,416,197,899.67 | 100.000 |
| Michael E. Wiley |
| Affirmative | 41,112,279,187.11 | 94.694 |
| Withheld | 2,303,918,712.56 | 5.306 |
| TOTAL | 43,416,197,899.67 | 100.000 |
PROPOSAL 2
To eliminate a fundamental investment policy.
| | # of
Votes | % of
Votes |
| Affirmative | 1,047,860,661.69 | 67.586 |
| Against | 172,474,017.24 | 11.125 |
| Abstain | 142,090,530.94 | 9.164 |
| Broker Non-Vote | 188,000,815.27 | 12.125 |
| TOTAL | 1,550,426,025.14 | 100.000 |
|
| Proposal 1 reflects trust wide proposal and voting results. |
SELCS-ANN-0418
1.846042.111
Fidelity® Select Portfolios®
Energy Sector Energy Portfolio
Energy Service Portfolio
Natural Gas Portfolio
Natural Resources Portfolio
Annual Report February 28, 2018 |
|
Contents
To view a fund's proxy voting guidelines and proxy voting record for the 12-month period ended June 30, visit http://www.fidelity.com/proxyvotingresults or visit the Securities and Exchange Commission's (SEC) web site at http://www.sec.gov.
You may also call 1-800-544-8544 to request a free copy of the proxy voting guidelines.
Standard & Poor's, S&P and S&P 500 are registered service marks of The McGraw-Hill Companies, Inc. and have been licensed for use by Fidelity Distributors Corporation.
Other third-party marks appearing herein are the property of their respective owners.
All other marks appearing herein are registered or unregistered trademarks or service marks of FMR LLC or an affiliated company. © 2018 FMR LLC. All rights reserved.
This report and the financial statements contained herein are submitted for the general information of the shareholders of the Funds. This report is not authorized for distribution to prospective investors in the Funds unless preceded or accompanied by an effective prospectus.
A fund files its complete schedule of portfolio holdings with the SEC for the first and third quarters of each fiscal year on Form N-Q. Forms N-Q are available on the SEC’s web site at http://www.sec.gov. A fund's Forms N-Q may be reviewed and copied at the SEC’s Public Reference Room in Washington, DC. Information regarding the operation of the SEC's Public Reference Room may be obtained by calling 1-800-SEC-0330.
For a complete list of a fund's portfolio holdings, view the most recent holdings listing, semiannual report, or annual report on Fidelity's web site at http://www.fidelity.com, http://www.institutional.fidelity.com, or http://www.401k.com, as applicable.
NOT FDIC INSURED •MAY LOSE VALUE •NO BANK GUARANTEE
Neither the Funds nor Fidelity Distributors Corporation is a bank.
Energy Portfolio
Performance: The Bottom Line
Average annual total return reflects the change in the value of an investment, assuming reinvestment of distributions from dividend income and capital gains (the profits earned upon the sale of securities that have grown in value, if any) and assuming a constant rate of performance each year. The hypothetical investment and the average annual total returns do not reflect the deduction of taxes that a shareholder would pay on fund distributions or the redemption of fund shares. During periods of reimbursement by Fidelity, a fund’s total return will be greater than it would be had the reimbursement not occurred. How a fund did yesterday is no guarantee of how it will do tomorrow.
Average Annual Total Returns
| For the periods ended February 28, 2018 | Past 1 year | Past 5 years | Past 10 years |
| Energy Portfolio | (5.27)% | (0.90)% | (1.56)% |
$10,000 Over 10 Years
Let's say hypothetically that $10,000 was invested in Energy Portfolio on February 29, 2008.
The chart shows how the value of your investment would have changed, and also shows how the S&P 500® Index performed over the same period.
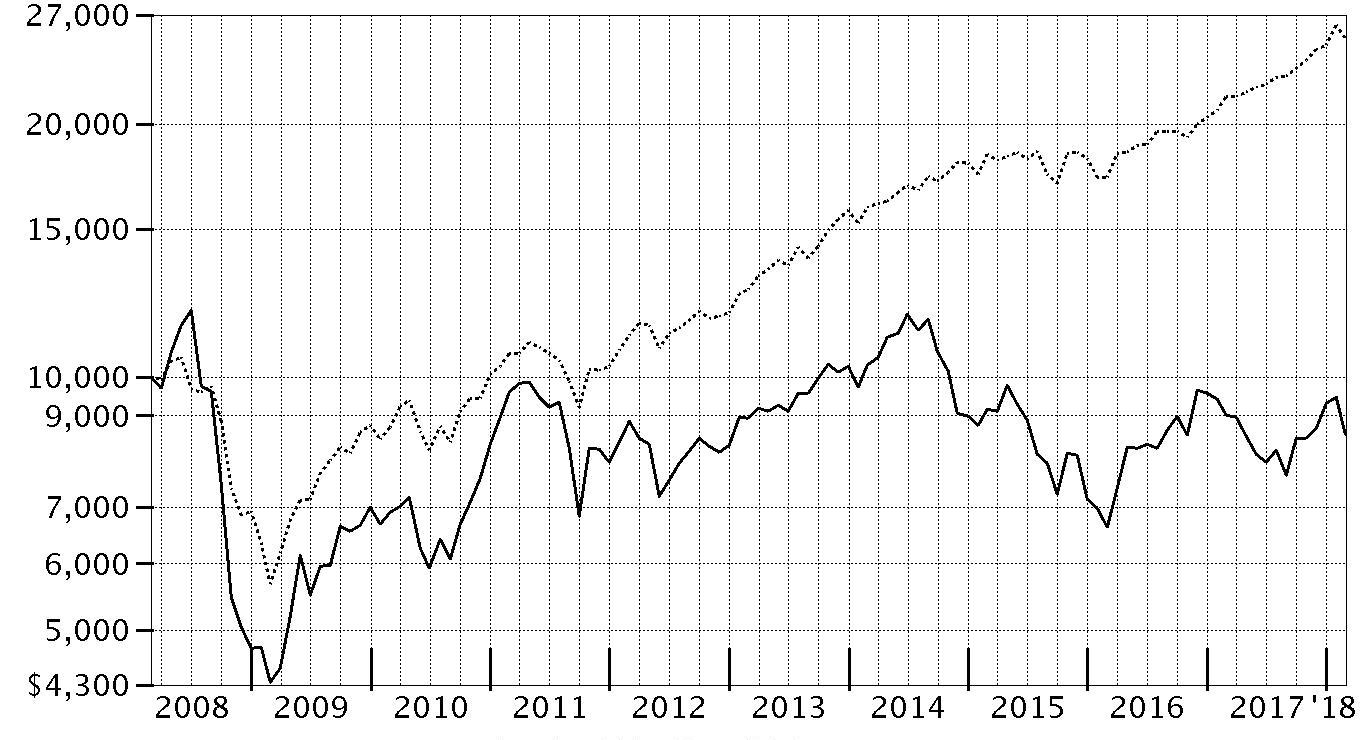
| Period Ending Values |
| $8,546 | Energy Portfolio |
| $25,307 | S&P 500® Index |
Energy Portfolio
Management's Discussion of Fund Performance
Market Recap: U.S. equities gained 17.10% for the 12 months ending February 28, 2018, as the S&P 500
® index moved steadily higher throughout 2017 and into 2018 until sharply reversing course in February. The drop was in stark contrast to the low volatility seen throughout 2017, along with consumer sentiment and other market indicators that stayed positive. Investors remained decidedly upbeat as the calendar turned, and the index rose 5.73% in January. February was a decidedly different story, though, as volatility spiked amid fear that rising inflation and the potential for the economy to overheat would prompt the U.S. Federal Reserve to pick up the pace of interest rate hikes. The index returned -3.69% for the month, its first negative result since October 2016. For the full 12 months, growth stocks handily topped value, while large-caps bested small-caps. By sector, information technology fared best by far, gaining 36% amid strong earnings growth from several major index constituents. Consumer discretionary (+22%) also stood out, driven by retailers. Financials added 20%, riding the uptick in bond yields. Materials and industrials rose about 16% each, boosted by higher demand, especially from China. Conversely, notable laggards included the defensive telecommunication services (-5%) and utilities (-2%) sectors, while rising rates held back real estate (-3%).
Comments from Portfolio Manager John Dowd: For the fiscal year ending February 28, 2018, the fund returned -5.27%, trailing the -4.31% return of the MSCI U.S. IMI Energy 25/50 Index and the 17.10% result of the broad-based S&P 500
® index. Although crude oil prices rose about 14% during the past year amid rapidly declining inventories, energy stocks were pressured by general skepticism about the sustainability of higher oil prices and the sector’s long-term outlook. Versus the MSCI sector index, favorable stock selection across most industries contributed to the fund’s performance the past year, though the gains here were more than offset by unfavorable industry positioning this period. Portfolio Manager John Dowd’s strategy of overweighting oil & gas exploration & production (E&P) companies, which lagged, combined with an underweighting in better-performing integrated oil & gas companies, was the biggest driver of the fund’s relative result. Underweighting refining firm Valero Energy, an index constituent that performed well, was the fund’s biggest relative detractor. The fund’s significant underweighting in ConocoPhillips, another strong performer, also hindered our relative result. Conversely, a sizable overweighting in strong-performing E&P Diamondback Energy was our largest relative contributor. Another top contributor was a non-MSCI-index stake in the stock of refining firm Reliance Industries, which performed well.
The views expressed above reflect those of the portfolio manager(s) only through the end of the period as stated on the cover of this report and do not necessarily represent the views of Fidelity or any other person in the Fidelity organization. Any such views are subject to change at any time based upon market or other conditions and Fidelity disclaims any responsibility to update such views. These views may not be relied on as investment advice and, because investment decisions for a Fidelity fund are based on numerous factors, may not be relied on as an indication of trading intent on behalf of any Fidelity fund.
Note to Shareholders: On December 8, 2017, shareholders approved proposals from the Board of Trustees to eliminate each sector/industry fund's fundamental “invests primarily” policy and to modify the fundamental concentration policy for certain funds. The changes took effect on January 1, 2018, and do not impact how the funds are managed.
Energy Portfolio
Investment Summary (Unaudited)
Top Ten Stocks as of February 28, 2018
| | % of fund's net assets |
| Chevron Corp. | 7.9 |
| EOG Resources, Inc. | 6.8 |
| Diamondback Energy, Inc. | 6.0 |
| Halliburton Co. | 5.8 |
| Exxon Mobil Corp. | 5.5 |
| Pioneer Natural Resources Co. | 4.3 |
| Phillips 66 Co. | 3.5 |
| RSP Permian, Inc. | 3.1 |
| Delek U.S. Holdings, Inc. | 3.0 |
| The Williams Companies, Inc. | 2.6 |
| | 48.5 |
Top Industries (% of fund's net assets)
| As of February 28, 2018 |
| | Oil, Gas & Consumable Fuels | 81.5% |
| | Energy Equipment & Services | 15.0% |
| | Chemicals | 2.0% |
| | Machinery | 0.6% |
| | Gas Utilities | 0.4% |
| | All Others* | 0.5% |

* Includes Short-Term investments and Net Other Assets (Liabilities).
Energy Portfolio
Schedule of Investments February 28, 2018
Showing Percentage of Net Assets
| Common Stocks - 99.8% | | | |
| | | Shares | Value |
| Chemicals - 2.0% | | | |
| Commodity Chemicals - 2.0% | | | |
| LG Chemical Ltd. | | 13,887 | $4,894,744 |
| LyondellBasell Industries NV Class A | | 275,300 | 29,792,966 |
| | | | 34,687,710 |
| Energy Equipment & Services - 15.0% | | | |
| Oil & Gas Drilling - 2.8% | | | |
| Nabors Industries Ltd. | | 2,870,036 | 18,569,133 |
| Odfjell Drilling Ltd. (a) | | 1,309,780 | 6,049,970 |
| Precision Drilling Corp. (a) | | 1,395,100 | 4,392,304 |
| Shelf Drilling Ltd. (b) | | 1,791,500 | 14,671,504 |
| Trinidad Drilling Ltd. (a) | | 1,805,000 | 2,588,217 |
| Xtreme Drilling & Coil Services Corp. (a) | | 2,063,600 | 3,521,886 |
| | | | 49,793,014 |
| Oil & Gas Equipment & Services - 12.2% | | | |
| Baker Hughes, a GE Co. Class A | | 952,600 | 25,148,640 |
| C&J Energy Services, Inc. (a) | | 96,400 | 2,313,600 |
| Dril-Quip, Inc. (a) | | 305,853 | 13,778,678 |
| Frank's International NV (c) | | 814,000 | 4,257,220 |
| Halliburton Co. | | 2,213,800 | 102,764,596 |
| Liberty Oilfield Services, Inc. Class A (a)(c) | | 38,300 | 711,997 |
| National Oilwell Varco, Inc. | | 136,500 | 4,789,785 |
| NCS Multistage Holdings, Inc. (c) | | 510,800 | 7,467,896 |
| Newpark Resources, Inc. (a) | | 1,132,702 | 9,344,792 |
| Oceaneering International, Inc. | | 530,827 | 9,756,600 |
| RigNet, Inc. (a) | | 530,671 | 7,110,991 |
| Schlumberger Ltd. | | 393,958 | 25,859,403 |
| Smart Sand, Inc. (a)(c) | | 243,100 | 1,803,802 |
| TETRA Technologies, Inc. (a) | | 206,405 | 749,250 |
| Total Energy Services, Inc. | | 94,100 | 1,011,986 |
| | | | 216,869,236 |
|
| TOTAL ENERGY EQUIPMENT & SERVICES | | | 266,662,250 |
|
| Gas Utilities - 0.4% | | | |
| Gas Utilities - 0.4% | | | |
| Indraprastha Gas Ltd. (a) | | 1,702,125 | 7,915,600 |
| Machinery - 0.6% | | | |
| Industrial Machinery - 0.6% | | | |
| Cactus, Inc. (a) | | 123,500 | 3,039,335 |
| ProPetro Holding Corp. | | 513,000 | 8,274,690 |
| | | | 11,314,025 |
| Oil, Gas & Consumable Fuels - 81.5% | | | |
| Integrated Oil & Gas - 16.6% | | | |
| Chevron Corp. | | 1,254,923 | 140,450,980 |
| Exxon Mobil Corp. | | 1,290,448 | 97,738,532 |
| Occidental Petroleum Corp. | | 513,100 | 33,659,360 |
| Suncor Energy, Inc. | | 722,800 | 23,792,918 |
| | | | 295,641,790 |
| Oil & Gas Exploration & Production - 49.0% | | | |
| Anadarko Petroleum Corp. | | 597,815 | 34,099,368 |
| Cabot Oil & Gas Corp. | | 1,885,600 | 45,556,096 |
| Callon Petroleum Co. (a) | | 1,951,900 | 20,631,583 |
| Centennial Resource Development, Inc.: | | | |
| Class A (a) | | 115,200 | 2,198,016 |
| Class A (a)(c) | | 809,900 | 15,452,892 |
| Cimarex Energy Co. | | 341,345 | 32,799,841 |
| Concho Resources, Inc. (a) | | 241,200 | 36,372,960 |
| ConocoPhillips Co. | | 420,000 | 22,810,200 |
| Continental Resources, Inc. (a) | | 945,600 | 44,925,456 |
| Devon Energy Corp. | | 1,022,800 | 31,369,276 |
| Diamondback Energy, Inc. (a) | | 854,700 | 106,529,808 |
| Encana Corp. | | 4,395,300 | 46,104,066 |
| EOG Resources, Inc. | | 1,189,964 | 120,686,149 |
| Extraction Oil & Gas, Inc. (a) | | 1,031,037 | 12,454,927 |
| Hess Corp. | | 352,900 | 16,028,718 |
| Lilis Energy, Inc. (a)(c) | | 626,274 | 2,298,426 |
| Marathon Oil Corp. | | 695,100 | 10,092,852 |
| Newfield Exploration Co. (a) | | 1,025,100 | 23,915,583 |
| Parsley Energy, Inc. Class A (a) | | 1,682,300 | 42,528,544 |
| PDC Energy, Inc. (a) | | 244,151 | 12,825,252 |
| Pioneer Natural Resources Co. | | 450,799 | 76,739,514 |
| PrairieSky Royalty Ltd. | | 173,400 | 3,847,177 |
| Ring Energy, Inc. (a) | | 504,322 | 6,843,650 |
| RSP Permian, Inc. (a) | | 1,422,000 | 54,476,820 |
| Viper Energy Partners LP | | 1,023,300 | 23,147,046 |
| WildHorse Resource Development Corp. (a)(c) | | 254,582 | 4,322,802 |
| WPX Energy, Inc. (a) | | 1,616,300 | 22,838,319 |
| | | | 871,895,341 |
| Oil & Gas Refining & Marketing - 8.4% | | | |
| Andeavor | | 196,700 | 17,628,254 |
| Delek U.S. Holdings, Inc. | | 1,590,755 | 54,276,561 |
| Phillips 66 Co. | | 686,373 | 62,027,528 |
| Pilipinas Shell Petroleum Corp. | | 2,726,110 | 2,971,312 |
| Reliance Industries Ltd. | | 465,836 | 6,777,791 |
| Valero Energy Corp. | | 54,900 | 4,964,058 |
| | | | 148,645,504 |
| Oil & Gas Storage & Transport - 7.5% | | | |
| Cheniere Energy, Inc. (a) | | 330,700 | 17,368,364 |
| Enterprise Products Partners LP | | 763,300 | 19,403,086 |
| GasLog Partners LP | | 267,500 | 6,286,250 |
| Gener8 Maritime, Inc. (a) | | 1,470,240 | 8,159,832 |
| Golar LNG Ltd. (c) | | 424,400 | 11,467,288 |
| Noble Midstream Partners LP | | 249,727 | 12,036,841 |
| Noble Midstream Partners LP (d) | | 101,027 | 4,869,501 |
| Plains GP Holdings LP Class A | | 178,300 | 3,708,640 |
| Teekay LNG Partners LP | | 163,000 | 3,015,500 |
| The Williams Companies, Inc. | | 1,661,300 | 46,117,688 |
| | | | 132,432,990 |
|
| TOTAL OIL, GAS & CONSUMABLE FUELS | | | 1,448,615,625 |
|
| Semiconductors & Semiconductor Equipment - 0.3% | | | |
| Semiconductor Equipment - 0.3% | | | |
| SolarEdge Technologies, Inc. (a) | | 116,600 | 5,835,830 |
| TOTAL COMMON STOCKS | | | |
| (Cost $1,573,427,455) | | | 1,775,031,040 |
|
| Money Market Funds - 1.3% | | | |
| Fidelity Cash Central Fund, 1.41% (e) | | 2,836,779 | 2,837,346 |
| Fidelity Securities Lending Cash Central Fund 1.42% (e)(f) | | 20,450,240 | 20,452,285 |
| TOTAL MONEY MARKET FUNDS | | | |
| (Cost $23,289,631) | | | 23,289,631 |
| TOTAL INVESTMENT IN SECURITIES - 101.1% | | | |
| (Cost $1,596,717,086) | | | 1,798,320,671 |
| NET OTHER ASSETS (LIABILITIES) - (1.1)% | | | (19,884,608) |
| NET ASSETS - 100% | | | $1,778,436,063 |
Legend
(a) Non-income producing
(b) Security exempt from registration under Rule 144A of the Securities Act of 1933. These securities may be resold in transactions exempt from registration, normally to qualified institutional buyers. At the end of the period, the value of these securities amounted to $14,671,504 or 0.8% of net assets.
(c) Security or a portion of the security is on loan at period end.
(d) Restricted securities - Investment in securities not registered under the Securities Act of 1933 (excluding 144A issues). At the end of the period, the value of restricted securities (excluding 144A issues) amounted to $4,869,501 or 0.3% of net assets.
(e) Affiliated fund that is generally available only to investment companies and other accounts managed by Fidelity Investments. The rate quoted is the annualized seven-day yield of the fund at period end. A complete unaudited listing of the fund's holdings as of its most recent quarter end is available upon request. In addition, each Fidelity Central Fund's financial statements, which are not covered by the Fund's Report of Independent Registered Public Accounting Firm, are available on the SEC's website or upon request.
(f) Investment made with cash collateral received from securities on loan.
Additional information on each restricted holding is as follows:
| Security | Acquisition Date | Acquisition Cost |
| Noble Midstream Partners LP | 6/21/17 | $4,086,542 |
Affiliated Central Funds
Information regarding fiscal year to date income earned by the Fund from investments in Fidelity Central Funds is as follows:
| Fund | Income earned |
| Fidelity Cash Central Fund | $126,500 |
| Fidelity Securities Lending Cash Central Fund | 282,503 |
| Total | $409,003 |
Amounts in the income column in the above table include any capital gain distributions from underlying funds, which are presented in the corresponding line-item in the Statement of Operations if applicable.
Investment Valuation
The following is a summary of the inputs used, as of February 28, 2018, involving the Fund's assets and liabilities carried at fair value. The inputs or methodology used for valuing securities may not be an indication of the risk associated with investing in those securities. For more information on valuation inputs, and their aggregation into the levels used below, please refer to the Investment Valuation section in the accompanying Notes to Financial Statements.
| | Valuation Inputs at Reporting Date: |
| Description | Total | Level 1 | Level 2 | Level 3 |
| Investments in Securities: | | | | |
| Common Stocks | $1,775,031,040 | $1,731,750,119 | $43,280,921 | $-- |
| Money Market Funds | 23,289,631 | 23,289,631 | -- | -- |
| Total Investments in Securities: | $1,798,320,671 | $1,755,039,750 | $43,280,921 | $-- |
Other Information
Distribution of investments by country or territory of incorporation, as a percentage of Total Net Assets, is as follows (Unaudited):
| United States of America | 86.7% |
| Canada | 4.9% |
| Bermuda | 1.9% |
| Netherlands | 1.9% |
| Curacao | 1.5% |
| Marshall Islands | 1.0% |
| Others (Individually Less Than 1%) | 2.1% |
| | 100.0% |
See accompanying notes which are an integral part of the financial statements.
Energy Portfolio
Financial Statements
Statement of Assets and Liabilities
| | | February 28, 2018 |
| Assets | | |
Investment in securities, at value (including securities loaned of $18,745,730) — See accompanying schedule:
Unaffiliated issuers (cost $1,573,427,455) | $1,775,031,040 | |
| Fidelity Central Funds (cost $23,289,631) | 23,289,631 | |
| Total Investment in Securities (cost $1,596,717,086) | | $1,798,320,671 |
| Receivable for investments sold | | 807,678 |
| Receivable for fund shares sold | | 1,182,743 |
| Dividends receivable | | 3,517,594 |
| Distributions receivable from Fidelity Central Funds | | 16,665 |
| Prepaid expenses | | 6,299 |
| Other receivables | | 199,464 |
| Total assets | | 1,804,051,114 |
| Liabilities | | |
| Payable for investments purchased | $402,170 | |
| Payable for fund shares redeemed | 2,643,547 | |
| Accrued management fee | 827,788 | |
| Other affiliated payables | 366,128 | |
| Other payables and accrued expenses | 929,409 | |
| Collateral on securities loaned | 20,446,009 | |
| Total liabilities | | 25,615,051 |
| Net Assets | | $1,778,436,063 |
| Net Assets consist of: | | |
| Paid in capital | | $1,912,530,448 |
| Distributions in excess of net investment income | | (3,140,266) |
| Accumulated undistributed net realized gain (loss) on investments and foreign currency transactions | | (331,884,825) |
| Net unrealized appreciation (depreciation) on investments and assets and liabilities in foreign currencies | | 200,930,706 |
| Net Assets, for 43,366,737 shares outstanding | | $1,778,436,063 |
| Net Asset Value, offering price and redemption price per share ($1,778,436,063 ÷ 43,366,737 shares) | | $41.01 |
See accompanying notes which are an integral part of the financial statements.
Statement of Operations
| | | Year ended February 28, 2018 |
| Investment Income | | |
| Dividends | | $27,769,555 |
| Special dividends | | 22,615,250 |
| Income from Fidelity Central Funds (including $282,503 from security lending) | | 409,003 |
| Total income | | 50,793,808 |
| Expenses | | |
| Management fee | $10,606,235 | |
| Transfer agent fees | 3,962,284 | |
| Accounting and security lending fees | 603,210 | |
| Custodian fees and expenses | 54,209 | |
| Independent trustees' fees and expenses | 43,479 | |
| Registration fees | 59,099 | |
| Audit | 58,482 | |
| Legal | 29,328 | |
| Interest | 1,039 | |
| Miscellaneous | 91,399 | |
| Total expenses before reductions | 15,508,764 | |
| Expense reductions | (221,649) | 15,287,115 |
| Net investment income (loss) | | 35,506,693 |
| Realized and Unrealized Gain (Loss) | | |
| Net realized gain (loss) on: | | |
| Investment securities: | | |
| Unaffiliated issuers (net of foreign taxes of $69,263) | 16,351,618 | |
| Fidelity Central Funds | 4,519 | |
| Foreign currency transactions | (35,553) | |
| Total net realized gain (loss) | | 16,320,584 |
| Change in net unrealized appreciation (depreciation) on: | | |
| Unaffiliated issuers (net of increase in deferred foreign taxes of $481,032) | (167,305,410) | |
| Fidelity Central Funds | (7,323) | |
| Assets and liabilities in foreign currencies | 1,736 | |
| Total change in net unrealized appreciation (depreciation) | | (167,310,997) |
| Net gain (loss) | | (150,990,413) |
| Net increase (decrease) in net assets resulting from operations | | $(115,483,720) |
See accompanying notes which are an integral part of the financial statements.
Statement of Changes in Net Assets
| | Year ended February 28, 2018 | Year ended February 28, 2017 |
| Increase (Decrease) in Net Assets | | |
| Operations | | |
| Net investment income (loss) | $35,506,693 | $10,465,618 |
| Net realized gain (loss) | 16,320,584 | 120,379,476 |
| Change in net unrealized appreciation (depreciation) | (167,310,997) | 542,954,194 |
| Net increase (decrease) in net assets resulting from operations | (115,483,720) | 673,799,288 |
| Distributions to shareholders from net investment income | (30,128,038) | (13,079,637) |
| Distributions to shareholders from net realized gain | (5,042,802) | (3,147,768) |
| Total distributions | (35,170,840) | (16,227,405) |
| Share transactions | | |
| Proceeds from sales of shares | 394,144,620 | 898,918,597 |
| Reinvestment of distributions | 33,787,233 | 15,617,735 |
| Cost of shares redeemed | (788,191,006) | (1,211,768,502) |
| Net increase (decrease) in net assets resulting from share transactions | (360,259,153) | (297,232,170) |
| Redemption fees | – | 112,786 |
| Total increase (decrease) in net assets | (510,913,713) | 360,452,499 |
| Net Assets | | |
| Beginning of period | 2,289,349,776 | 1,928,897,277 |
| End of period | $1,778,436,063 | $2,289,349,776 |
| Other Information | | |
| Distributions in excess of net investment income end of period | $(3,140,266) | $(5,487,131) |
| Shares | | |
| Sold | 9,498,569 | 21,107,325 |
| Issued in reinvestment of distributions | 813,084 | 360,628 |
| Redeemed | (18,855,556) | (28,669,318) |
| Net increase (decrease) | (8,543,903) | (7,201,365) |
See accompanying notes which are an integral part of the financial statements.
Financial Highlights
Energy Portfolio
| | | | | | |
| Years ended February 28, | 2018 | 2017 | 2016 A | 2015 | 2014 |
| Selected Per–Share Data | | | | | |
| Net asset value, beginning of period | $44.10 | $32.63 | $45.64 | $56.25 | $54.81 |
| Income from Investment Operations | | | | | |
| Net investment income (loss)B | .75C | .18 | .42 | .46 | .44 |
| Net realized and unrealized gain (loss) | (3.06) | 11.58 | (12.98) | (6.37) | 7.86 |
| Total from investment operations | (2.31) | 11.76 | (12.56) | (5.91) | 8.30 |
| Distributions from net investment income | (.68) | (.24) | (.39) | (.46) | (.46) |
| Distributions from net realized gain | (.10) | (.05) | (.07) | (4.23) | (6.40) |
| Total distributions | (.78) | (.29) | (.45)D | (4.70)E | (6.86) |
| Redemption fees added to paid in capitalB | – | –F | –F | –F | –F |
| Net asset value, end of period | $41.01 | $44.10 | $32.63 | $45.64 | $56.25 |
| Total ReturnG | (5.27)% | 36.05% | (27.61)% | (11.25)% | 15.43% |
| Ratios to Average Net AssetsH,I | | | | | |
| Expenses before reductions | .79% | .79% | .80% | .79% | .80% |
| Expenses net of fee waivers, if any | .79% | .79% | .80% | .79% | .80% |
| Expenses net of all reductions | .78% | .78% | .79% | .79% | .80% |
| Net investment income (loss) | 1.82%C | .44% | 1.03% | .85% | .76% |
| Supplemental Data | | | | | |
| Net assets, end of period (000 omitted) | $1,778,436 | $2,289,350 | $1,928,897 | $2,179,828 | $1,995,808 |
| Portfolio turnover rateJ | 59% | 93%K | 79% | 73%K | 98% |
A For the year ended February 29.
B Calculated based on average shares outstanding during the period.
C Net Investment income per share reflects a large, non-recurring dividend which amounted to $.48 per share. Excluding this non-recurring dividend, the ratio of net investment income (loss) to average net assets would have been .66%.
D Total distributions of $.45 per share is comprised of distributions from net investment income of $.387 and distributions from net realized gain of $.066 per share.
E Total distributions of $4.70 per share is comprised of distributions from net investment income of $.463 and distributions from net realized gain of $4.233 per share.
F Amount represents less than $.005 per share.
G Total returns would have been lower if certain expenses had not been reduced during the applicable periods shown.
H Fees and expenses of any underlying Fidelity Central Funds are not included in the Fund's expense ratio. The Fund indirectly bears its proportionate share of the expenses of any underlying Fidelity Central Funds.
I Expense ratios reflect operating expenses of the Fund. Expenses before reductions do not reflect amounts reimbursed by the investment adviser or reductions from brokerage service arrangements or reductions from other expense offset arrangements and do not represent the amount paid by the Fund during periods when reimbursements or reductions occur. Expenses net of fee waivers reflect expenses after reimbursement by the investment adviser but prior to reductions from brokerage service arrangements or other expense offset arrangements. Expenses net of all reductions represent the net expenses paid by the Fund.
J Amount does not include the portfolio activity of any underlying Fidelity Central Funds.
K Portfolio turnover rate excludes securities received or delivered in-kind.
See accompanying notes which are an integral part of the financial statements.
Energy Service Portfolio
Performance: The Bottom Line
Average annual total return reflects the change in the value of an investment, assuming reinvestment of distributions from dividend income and capital gains (the profits earned upon the sale of securities that have grown in value, if any) and assuming a constant rate of performance each year. The hypothetical investment and the average annual total returns do not reflect the deduction of taxes that a shareholder would pay on fund distributions or the redemption of fund shares. During periods of reimbursement by Fidelity, a fund’s total return will be greater than it would be had the reimbursement not occurred. How a fund did yesterday is no guarantee of how it will do tomorrow.
Average Annual Total Returns
| For the periods ended February 28, 2018 | Past 1 year | Past 5 years | Past 10 years |
| Energy Service Portfolio | (17.41)% | (6.64)% | (5.12)% |
$10,000 Over 10 Years
Let's say hypothetically that $10,000 was invested in Energy Service Portfolio on February 29, 2008.
The chart shows how the value of your investment would have changed, and also shows how the S&P 500® Index performed over the same period.
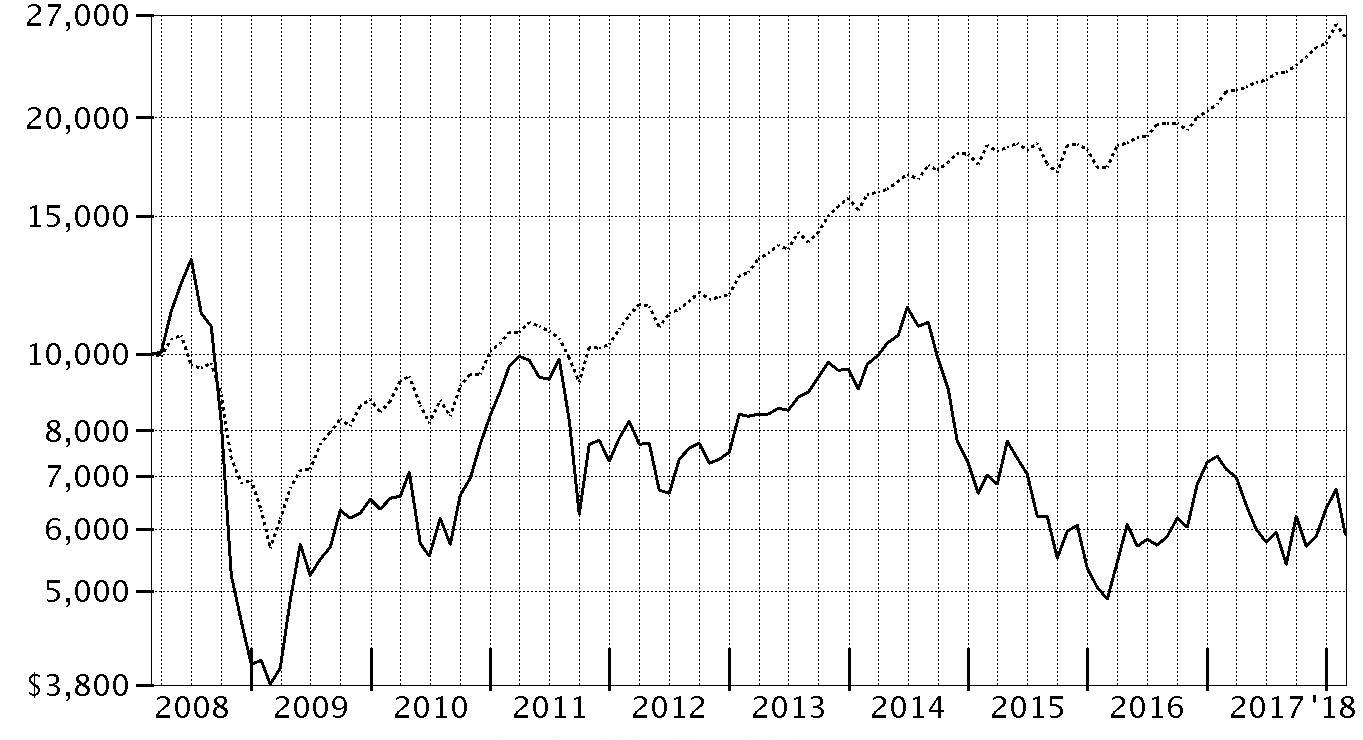
| Period Ending Values |
| $5,909 | Energy Service Portfolio |
| $25,307 | S&P 500® Index |
Energy Service Portfolio
Management's Discussion of Fund Performance
Market Recap: U.S. equities gained 17.10% for the 12 months ending February 28, 2018, as the S&P 500
® index moved steadily higher throughout 2017 and into 2018 until sharply reversing course in February. The drop was in stark contrast to the low volatility seen throughout 2017, along with consumer sentiment and other market indicators that stayed positive. Investors remained decidedly upbeat as the calendar turned, and the index rose 5.73% in January. February was a decidedly different story, though, as volatility spiked amid fear that rising inflation and the potential for the economy to overheat would prompt the U.S. Federal Reserve to pick up the pace of interest rate hikes. The index returned -3.69% for the month, its first negative result since October 2016. For the full 12 months, growth stocks handily topped value, while large-caps bested small-caps. By sector, information technology fared best by far, gaining 36% amid strong earnings growth from several major index constituents. Consumer discretionary (+22%) also stood out, driven by retailers. Financials added 20%, riding the uptick in bond yields. Materials and industrials rose about 16% each, boosted by higher demand, especially from China. Conversely, notable laggards included the defensive telecommunication services (-5%) and utilities (-2%) sectors, while rising rates held back real estate (-3%).
Comments from Portfolio Manager Ben Shuleva: For the 12 months, the fund returned -17.41%, outperforming the -21.74% return of the MSCI U.S. IMI Energy Equipment & Service 25/50 Index. The fund significantly trailed the 17.10% result of the broad-based S&P 500
® index, due to flat drilling and production activity for much of the period. Versus the MSCI industry benchmark, choices in the oil & gas drilling segment largely drove the fund's outperformance, especially non-index positions in Odfjell Drilling and Borr Drilling. A non-index stake in the oil & gas storage & transportation industry also added value. Conversely, picks in the oil & gas equipment & services segment detracted, including an overweighed position in Tesco, a provider of pipe- handling equipment and tubular services that was acquired by oil & natural gas drilling company Nabors Industries at a sizable discount to Tesco's valuation at the start of 2017.
The views expressed above reflect those of the portfolio manager(s) only through the end of the period as stated on the cover of this report and do not necessarily represent the views of Fidelity or any other person in the Fidelity organization. Any such views are subject to change at any time based upon market or other conditions and Fidelity disclaims any responsibility to update such views. These views may not be relied on as investment advice and, because investment decisions for a Fidelity fund are based on numerous factors, may not be relied on as an indication of trading intent on behalf of any Fidelity fund.
Note to Shareholders: On December 8, 2017, shareholders approved proposals from the Board of Trustees to eliminate each sector/industry fund's fundamental “invests primarily” policy and to modify the fundamental concentration policy for certain funds. The changes took effect on January 1, 2018, and do not impact how the funds are managed.
On March 1, 2018, Margaret Banfield assumed co-manager responsibilities for the fund, joining Lead Manager Ben Shuleva.
Energy Service Portfolio
Investment Summary (Unaudited)
Top Ten Stocks as of February 28, 2018
| | % of fund's net assets |
| Halliburton Co. | 14.5 |
| Schlumberger Ltd. | 12.9 |
| Baker Hughes, a GE Co. Class A | 12.4 |
| Nabors Industries Ltd. | 6.2 |
| Oceaneering International, Inc. | 4.4 |
| Trinidad Drilling Ltd. | 3.9 |
| C&J Energy Services, Inc. | 3.1 |
| RigNet, Inc. | 3.1 |
| Dril-Quip, Inc. | 3.0 |
| Odfjell Drilling Ltd. | 2.9 |
| | 66.4 |
Top Industries (% of fund's net assets)
| As of February 28, 2018 |
| | Energy Equipment & Services | 97.4% |
| | Oil, Gas & Consumable Fuels | 2.0% |
| | Construction & Engineering | 0.4% |
| | All Others* | 0.2% |

* Includes Short-Term investments and Net Other Assets (Liabilities).
Energy Service Portfolio
Schedule of Investments February 28, 2018
Showing Percentage of Net Assets
| Common Stocks - 99.8% | | | |
| | | Shares | Value |
| Construction & Engineering - 0.4% | | | |
| Construction & Engineering - 0.4% | | | |
| Enterprise Group, Inc. (a)(b) | | 5,565,237 | $1,669,745 |
| Energy Equipment & Services - 97.4% | | | |
| Oil & Gas Drilling - 21.8% | | | |
| Borr Drilling Ltd. (a) | | 910,564 | 3,900,622 |
| Independence Contract Drilling, Inc. (a) | | 1,623,568 | 6,737,807 |
| Nabors Industries Ltd. | | 3,978,278 | 25,739,459 |
| Odfjell Drilling Ltd. (a) | | 2,558,344 | 11,817,179 |
| Parker Drilling Co. (a) | | 6,392,493 | 5,753,244 |
| Patterson-UTI Energy, Inc. | | 75,600 | 1,366,092 |
| Pioneer Energy Services Corp. (a) | | 623,113 | 1,713,561 |
| Rowan Companies PLC (a) | | 68,600 | 834,176 |
| Shelf Drilling Ltd. (c) | | 1,115,203 | 9,132,964 |
| Trinidad Drilling Ltd. (a) | | 11,072,000 | 15,876,309 |
| Xtreme Drilling & Coil Services Corp. (a)(b) | | 4,198,131 | 7,164,828 |
| | | | 90,036,241 |
| Oil & Gas Equipment & Services - 75.6% | | | |
| Archrock, Inc. | | 448,500 | 4,260,750 |
| Baker Hughes, a GE Co. Class A | | 1,933,146 | 51,035,054 |
| C&J Energy Services, Inc. (a) | | 537,101 | 12,890,424 |
| CSI Compressco LP | | 1,310,010 | 9,825,075 |
| Dril-Quip, Inc. (a) | | 275,300 | 12,402,265 |
| Fairmount Santrol Holidings, Inc. (a)(d) | | 300,000 | 1,344,000 |
| Frank's International NV (d) | | 2,082,564 | 10,891,810 |
| Halliburton Co. | | 1,287,834 | 59,781,251 |
| Helix Energy Solutions Group, Inc. (a) | | 1,014,729 | 6,047,785 |
| Key Energy Services, Inc. (a) | | 36,005 | 482,827 |
| McCoy Global, Inc. (a) | | 1,049,550 | 1,071,470 |
| National Oilwell Varco, Inc. | | 166,262 | 5,834,134 |
| NCS Multistage Holdings, Inc. (d) | | 259,136 | 3,788,568 |
| Newpark Resources, Inc. (a) | | 293,652 | 2,422,629 |
| Oceaneering International, Inc. | | 983,025 | 18,068,000 |
| Ranger Energy Services, Inc. Class A | | 485,832 | 4,338,480 |
| RigNet, Inc. (a)(b)(d) | | 941,447 | 12,615,390 |
| Schlumberger Ltd. | | 811,911 | 53,293,838 |
| Smart Sand, Inc. (a)(d) | | 1,250,832 | 9,281,173 |
| Spectrum ASA (a) | | 433,109 | 2,470,225 |
| Superior Drilling Products, Inc. (a)(b)(d) | | 2,409,569 | 3,662,545 |
| Superior Energy Services, Inc. (a) | | 507,300 | 4,337,415 |
| TechnipFMC PLC | | 231,362 | 6,667,853 |
| TETRA Technologies, Inc. (a) | | 2,558,735 | 9,288,208 |
| TETRA Technologies, Inc. warrants 12/14/21 (a) | | 300,100 | 253,795 |
| Weatherford International PLC (a)(d) | | 2,243,566 | 5,900,579 |
| | | | 312,255,543 |
|
| TOTAL ENERGY EQUIPMENT & SERVICES | | | 402,291,784 |
|
| Oil, Gas & Consumable Fuels - 2.0% | | | |
| Integrated Oil & Gas - 0.1% | | | |
| Cenovus Energy, Inc. | | 50,700 | 369,029 |
| Oil & Gas Storage & Transport - 1.9% | | | |
| Golar LNG Ltd. | | 72,833 | 1,967,948 |
| StealthGas, Inc. (a) | | 1,402,975 | 5,906,525 |
| The Williams Companies, Inc. | | 4,500 | 124,920 |
| | | | 7,999,393 |
|
| TOTAL OIL, GAS & CONSUMABLE FUELS | | | 8,368,422 |
|
| TOTAL COMMON STOCKS | | | |
| (Cost $454,304,155) | | | 412,329,951 |
|
| Money Market Funds - 7.5% | | | |
| Fidelity Securities Lending Cash Central Fund 1.42% (e)(f) | | | |
| (Cost $30,748,269) | | 30,745,714 | 30,748,788 |
| TOTAL INVESTMENT IN SECURITIES - 107.3% | | | |
| (Cost $485,052,424) | | | 443,078,739 |
| NET OTHER ASSETS (LIABILITIES) - (7.3)% | | | (30,024,139) |
| NET ASSETS - 100% | | | $413,054,600 |
Legend
(a) Non-income producing
(b) Affiliated company
(c) Security exempt from registration under Rule 144A of the Securities Act of 1933. These securities may be resold in transactions exempt from registration, normally to qualified institutional buyers. At the end of the period, the value of these securities amounted to $9,132,964 or 2.2% of net assets.
(d) Security or a portion of the security is on loan at period end.
(e) Investment made with cash collateral received from securities on loan.
(f) Affiliated fund that is generally available only to investment companies and other accounts managed by Fidelity Investments. The rate quoted is the annualized seven-day yield of the fund at period end. A complete unaudited listing of the fund's holdings as of its most recent quarter end is available upon request. In addition, each Fidelity Central Fund's financial statements, which are not covered by the Fund's Report of Independent Registered Public Accounting Firm, are available on the SEC's website or upon request.
Affiliated Central Funds
Information regarding fiscal year to date income earned by the Fund from investments in Fidelity Central Funds is as follows:
| Fund | Income earned |
| Fidelity Cash Central Fund | $12,269 |
| Fidelity Securities Lending Cash Central Fund | 348,806 |
| Total | $361,075 |
Amounts in the income column in the above table include any capital gain distributions from underlying funds, which are presented in the corresponding line-item in the Statement of Operations if applicable.
Other Affiliated Issuers
An affiliated company is a company in which the Fund has ownership of at least 5% of the voting securities. Fiscal year to date transactions with companies which are or were affiliates are as follows:
| Affiliate | Value, beginning of period | Purchases | Sales Proceeds | Dividend Income | Realized Gain (loss) | Change in Unrealized appreciation (depreciation) | Value, end of period |
| Borr Drilling Ltd. | $23,110,873 | $854,400 | $22,961,756 | $-- | $11,471,450 | $(8,574,346) | $-- |
| Enterprise Group, Inc. | 1,340,819 | -- | -- | -- | -- | 328,926 | 1,669,745 |
| Forbes Energy Services Ltd. | 62,930 | -- | 16,345 | -- | (4,734,595) | 4,688,010 | -- |
| Parker Drilling Co. | 10,581,966 | 4,199,763 | 2,380,783 | -- | (1,973,561) | (4,674,141) | -- |
| RigNet, Inc. | 27,747,812 | 2,988,597 | 14,894,554 | -- | 2,199,052 | (5,425,517) | 12,615,390 |
| StealthGas, Inc. | 10,668,491 | 1,281,012 | 6,058,279 | -- | (7,792,753) | 7,808,054 | -- |
| Superior Drilling Products, Inc. | 2,481,856 | -- | -- | -- | -- | 1,180,689 | 3,662,545 |
| Tesco Corp. | 22,842,845 | 6,169,667 | 15,462,013 | -- | (10,504,163) | (3,046,336) | -- |
| TETRA Technologies, Inc. | 33,925,982 | 12,071,974 | 33,021,781 | -- | (10,627,049) | 6,939,082 | -- |
| TETRA Technologies, Inc. warrants 12/14/21 | 435,145 | -- | -- | -- | -- | (181,350) | -- |
| Xtreme Drilling & Coil Services Corp. | 10,443,266 | 488,196 | 3,210,798 | -- | (3,299,113) | 2,743,277 | 7,164,828 |
| Total | $143,641,985 | $28,053,609 | $98,006,309 | $-- | $(25,260,732) | $1,786,348 | $25,112,508 |
Investment Valuation
The following is a summary of the inputs used, as of February 28, 2018, involving the Fund's assets and liabilities carried at fair value. The inputs or methodology used for valuing securities may not be an indication of the risk associated with investing in those securities. For more information on valuation inputs, and their aggregation into the levels used below, please refer to the Investment Valuation section in the accompanying Notes to Financial Statements.
| | Valuation Inputs at Reporting Date: |
| Description | Total | Level 1 | Level 2 | Level 3 |
| Investments in Securities: | | | | |
| Common Stocks | $412,329,951 | $384,755,166 | $27,574,785 | $-- |
| Money Market Funds | 30,748,788 | 30,748,788 | -- | -- |
| Total Investments in Securities: | $443,078,739 | $415,503,954 | $27,574,785 | $-- |
The following is a summary of transfers between Level 1 and Level 2 for the period ended February 28, 2018. Transfers are assumed to have occurred at the beginning of the period, and are primarily attributable to the valuation techniques used for foreign equity securities, as discussed in the accompanying Notes to Financial Statements:
| Transfers | Total |
| Level 1 to Level 2 | $45,070,188 |
| Level 2 to Level 1 | $0 |
Other Information
Distribution of investments by country or territory of incorporation, as a percentage of Total Net Assets, is as follows (Unaudited):
| United States of America | 60.1% |
| Curacao | 12.9% |
| Bermuda | 10.6% |
| Canada | 6.4% |
| Netherlands | 2.6% |
| Cayman Islands | 2.2% |
| United Kingdom | 1.8% |
| Marshall Islands | 1.4% |
| Ireland | 1.4% |
| Others (Individually Less Than 1%) | 0.6% |
| | 100.0% |
See accompanying notes which are an integral part of the financial statements.
Energy Service Portfolio
Financial Statements
Statement of Assets and Liabilities
| | | February 28, 2018 |
| Assets | | |
Investment in securities, at value (including securities loaned of $26,415,771) — See accompanying schedule:
Unaffiliated issuers (cost $416,210,529) | $387,217,443 | |
| Fidelity Central Funds (cost $30,748,269) | 30,748,788 | |
| Other affiliated issuers (cost $38,093,626) | 25,112,508 | |
| Total Investment in Securities (cost $485,052,424) | | $443,078,739 |
| Foreign currency held at value (cost $129,345) | | 129,345 |
| Receivable for investments sold | | 8,020,389 |
| Receivable for fund shares sold | | 509,223 |
| Dividends receivable | | 423,467 |
| Distributions receivable from Fidelity Central Funds | | 12,164 |
| Prepaid expenses | | 1,703 |
| Other receivables | | 73,878 |
| Total assets | | 452,248,908 |
| Liabilities | | |
| Payable to custodian bank | $771,130 | |
| Payable for investments purchased | 6,248,894 | |
| Payable for fund shares redeemed | 1,016,888 | |
| Accrued management fee | 196,849 | |
| Other affiliated payables | 98,188 | |
| Other payables and accrued expenses | 114,306 | |
| Collateral on securities loaned | 30,748,053 | |
| Total liabilities | | 39,194,308 |
| Net Assets | | $413,054,600 |
| Net Assets consist of: | | |
| Paid in capital | | $571,111,687 |
| Distributions in excess of net investment income | | (1,901,815) |
| Accumulated undistributed net realized gain (loss) on investments and foreign currency transactions | | (114,180,696) |
| Net unrealized appreciation (depreciation) on investments and assets and liabilities in foreign currencies | | (41,974,576) |
| Net Assets, for 9,826,409 shares outstanding | | $413,054,600 |
| Net Asset Value, offering price and redemption price per share ($413,054,600 ÷ 9,826,409 shares) | | $42.04 |
See accompanying notes which are an integral part of the financial statements.
Statement of Operations
| | | Year ended February 28, 2018 |
| Investment Income | | |
| Dividends | | $4,655,199 |
| Special dividends | | 14,759,028 |
| Income from Fidelity Central Funds (including $348,806 from security lending) | | 361,075 |
| Total income | | 19,775,302 |
| Expenses | | |
| Management fee | $2,777,967 | |
| Transfer agent fees | 1,138,514 | |
| Accounting and security lending fees | 200,843 | |
| Custodian fees and expenses | 36,950 | |
| Independent trustees' fees and expenses | 11,789 | |
| Registration fees | 48,552 | |
| Audit | 48,578 | |
| Legal | 8,564 | |
| Interest | 3,017 | |
| Miscellaneous | 28,166 | |
| Total expenses before reductions | 4,302,940 | |
| Expense reductions | (102,387) | 4,200,553 |
| Net investment income (loss) | | 15,574,749 |
| Realized and Unrealized Gain (Loss) | | |
| Net realized gain (loss) on: | | |
| Investment securities: | | |
| Unaffiliated issuers | (41,090,698) | |
| Fidelity Central Funds | (1,268) | |
| Other affiliated issuers | (25,260,732) | |
| Foreign currency transactions | 62,940 | |
| Total net realized gain (loss) | | (66,289,758) |
| Change in net unrealized appreciation (depreciation) on: | | |
| Investment securities: | | |
| Unaffiliated issuers | (70,725,515) | |
| Fidelity Central Funds | (1,808) | |
| Other affiliated issuers | 1,786,348 | |
| Assets and liabilities in foreign currencies | 2,578 | |
| Total change in net unrealized appreciation (depreciation) | | (68,938,397) |
| Net gain (loss) | | (135,228,155) |
| Net increase (decrease) in net assets resulting from operations | | $(119,653,406) |
See accompanying notes which are an integral part of the financial statements.
Statement of Changes in Net Assets
| | Year ended February 28, 2018 | Year ended February 28, 2017 |
| Increase (Decrease) in Net Assets | | |
| Operations | | |
| Net investment income (loss) | $15,574,749 | $1,984,380 |
| Net realized gain (loss) | (66,289,758) | (19,224,046) |
| Change in net unrealized appreciation (depreciation) | (68,938,397) | 205,013,343 |
| Net increase (decrease) in net assets resulting from operations | (119,653,406) | 187,773,677 |
| Distributions to shareholders from net investment income | (16,191,879) | (2,569,509) |
| Distributions to shareholders from net realized gain | (13,061,204) | – |
| Total distributions | (29,253,083) | (2,569,509) |
| Share transactions | | |
| Proceeds from sales of shares | 170,298,959 | 347,580,414 |
| Reinvestment of distributions | 27,683,185 | 2,440,107 |
| Cost of shares redeemed | (370,145,317) | (236,538,737) |
| Net increase (decrease) in net assets resulting from share transactions | (172,163,173) | 113,481,784 |
| Redemption fees | 32,793 | 30,328 |
| Total increase (decrease) in net assets | (321,036,869) | 298,716,280 |
| Net Assets | | |
| Beginning of period | 734,091,469 | 435,375,189 |
| End of period | $413,054,600 | $734,091,469 |
| Other Information | | |
| Distributions in excess of net investment income end of period | $(1,901,815) | $(393,306) |
| Shares | | |
| Sold | 3,621,446 | 6,670,683 |
| Issued in reinvestment of distributions | 644,244 | 46,274 |
| Redeemed | (7,858,391) | (4,895,393) |
| Net increase (decrease) | (3,592,701) | 1,821,564 |
See accompanying notes which are an integral part of the financial statements.
Financial Highlights
Energy Service Portfolio
| | | | | | |
| Years ended February 28, | 2018 | 2017 | 2016 A | 2015 | 2014 |
| Selected Per–Share Data | | | | | |
| Net asset value, beginning of period | $54.70 | $37.54 | $54.34 | $86.13 | $74.01 |
| Income from Investment Operations | | | | | |
| Net investment income (loss)B | 1.41C | .17 | .45 | .45 | .21 |
| Net realized and unrealized gain (loss) | (10.86) | 17.22 | (16.85) | (23.10) | 12.09 |
| Total from investment operations | (9.45) | 17.39 | (16.40) | (22.65) | 12.30 |
| Distributions from net investment income | (1.77) | (.23) | (.40) | (.39) | (.18) |
| Distributions from net realized gain | (1.43) | – | – | (8.75) | – |
| Total distributions | (3.21)D | (.23) | (.40) | (9.14) | (.18) |
| Redemption fees added to paid in capitalB,E | – | – | – | – | – |
| Net asset value, end of period | $42.04 | $54.70 | $37.54 | $54.34 | $86.13 |
| Total ReturnF | (17.41)% | 46.36% | (30.30)% | (27.82)% | 16.62% |
| Ratios to Average Net AssetsG,H | | | | | |
| Expenses before reductions | .84% | .85% | .85% | .79% | .80% |
| Expenses net of fee waivers, if any | .84% | .85% | .84% | .79% | .80% |
| Expenses net of all reductions | .82% | .84% | .81% | .79% | .80% |
| Net investment income (loss) | 3.04%C | .36% | .92% | .56% | .26% |
| Supplemental Data | | | | | |
| Net assets, end of period (000 omitted) | $413,055 | $734,091 | $435,375 | $698,803 | $1,047,980 |
| Portfolio turnover rateI | 62% | 96% | 58% | 55% | 34% |
A For the year ended February 29.
B Calculated based on average shares outstanding during the period.
C Net Investment income per share reflects a large, non-recurring dividend which amounted to $1.34 per share. Excluding this non-recurring dividend, the ratio of net investment income (loss) to average net assets would have been .16%.
D Total distributions of $3.21 per share is comprised of distributions from net investment income of $1.774 and distributions from net realized gain of $1.431 per share.
E Amount represents less than $.005 per share.
F Total returns would have been lower if certain expenses had not been reduced during the applicable periods shown.
G Fees and expenses of any underlying Fidelity Central Funds are not included in the Fund's expense ratio. The Fund indirectly bears its proportionate share of the expenses of any underlying Fidelity Central Funds.
H Expense ratios reflect operating expenses of the Fund. Expenses before reductions do not reflect amounts reimbursed by the investment adviser or reductions from brokerage service arrangements or reductions from other expense offset arrangements and do not represent the amount paid by the Fund during periods when reimbursements or reductions occur. Expenses net of fee waivers reflect expenses after reimbursement by the investment adviser but prior to reductions from brokerage service arrangements or other expense offset arrangements. Expenses net of all reductions represent the net expenses paid by the Fund.
I Amount does not include the portfolio activity of any underlying Fidelity Central Funds.
See accompanying notes which are an integral part of the financial statements.
Natural Gas Portfolio
Performance: The Bottom Line
Average annual total return reflects the change in the value of an investment, assuming reinvestment of distributions from dividend income and capital gains (the profits earned upon the sale of securities that have grown in value, if any) and assuming a constant rate of performance each year. The hypothetical investment and the average annual total returns do not reflect the deduction of taxes that a shareholder would pay on fund distributions or the redemption of fund shares. During periods of reimbursement by Fidelity, a fund’s total return will be greater than it would be had the reimbursement not occurred. How a fund did yesterday is no guarantee of how it will do tomorrow.
Average Annual Total Returns
| For the periods ended February 28, 2018 | Past 1 year | Past 5 years | Past 10 years |
| Natural Gas Portfolio | (18.97)% | (6.26)% | (6.49)% |
$10,000 Over 10 Years
Let's say hypothetically that $10,000 was invested in Natural Gas Portfolio on February 29, 2008.
The chart shows how the value of your investment would have changed, and also shows how the S&P 500® Index performed over the same period.
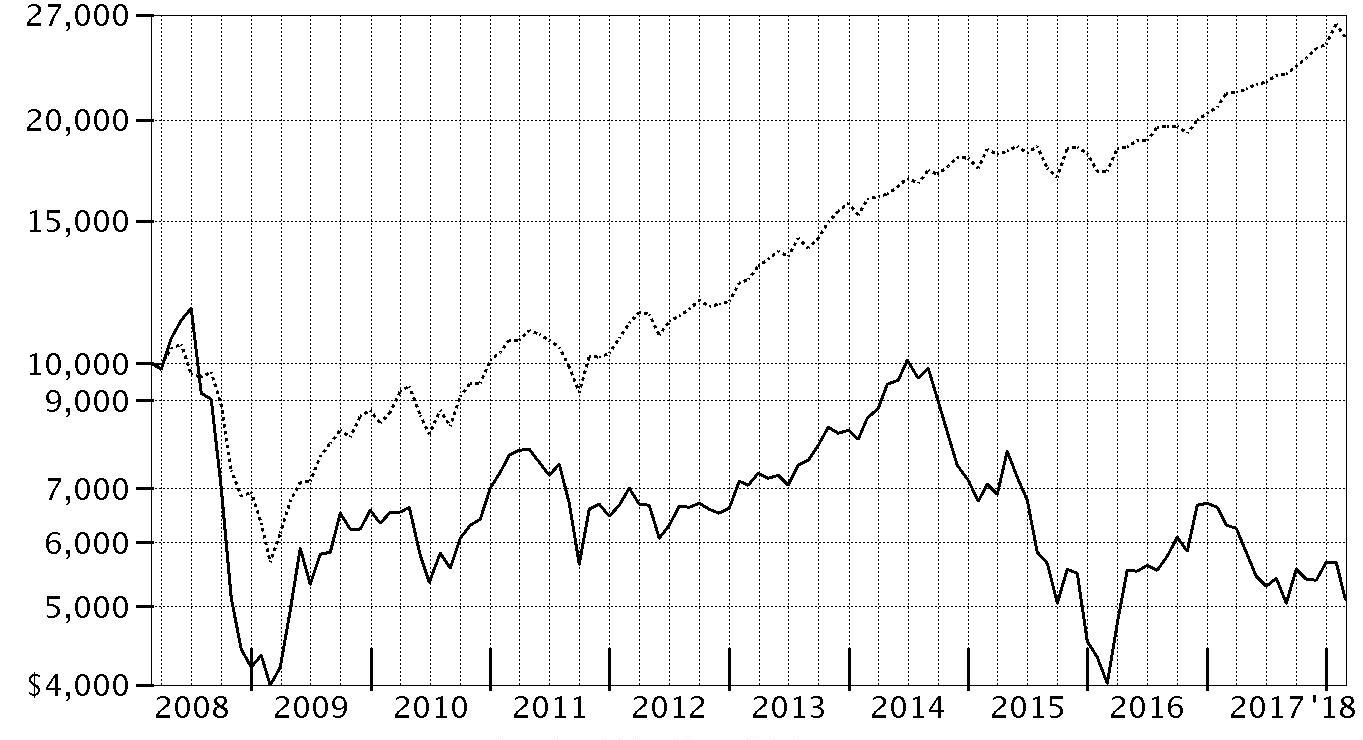
| Period Ending Values |
| $5,110 | Natural Gas Portfolio |
| $25,307 | S&P 500® Index |
Natural Gas Portfolio
Management's Discussion of Fund Performance
Market Recap: U.S. equities gained 17.10% for the 12 months ending February 28, 2018, as the S&P 500
® index moved steadily higher throughout 2017 and into 2018 until sharply reversing course in February. The drop was in stark contrast to the low volatility seen throughout 2017, along with consumer sentiment and other market indicators that stayed positive. Investors remained decidedly upbeat as the calendar turned, and the index rose 5.73% in January. February was a decidedly different story, though, as volatility spiked amid fear that rising inflation and the potential for the economy to overheat would prompt the U.S. Federal Reserve to pick up the pace of interest rate hikes. The index returned -3.69% for the month, its first negative result since October 2016. For the full 12 months, growth stocks handily topped value, while large-caps bested small-caps. By sector, information technology fared best by far, gaining 36% amid strong earnings growth from several major index constituents. Consumer discretionary (+22%) also stood out, driven by retailers. Financials added 20%, riding the uptick in bond yields. Materials and industrials rose about 16% each, boosted by higher demand, especially from China. Conversely, notable laggards included the defensive telecommunication services (-5%) and utilities (-2%) sectors, while rising rates held back real estate (-3%).
Comments from Portfolio Manager Ben Shuleva: For the 12 months, the fund returned -18.97%, trailing the combined -10.11% return of the S&P
® Custom Natural Gas Index for the first month of the period and the FactSet Natural Gas Linked Index for the past 11 months. The fund also lagged the 17.10% gain of the broadly based S&P 500 index. Unfavorable stock selection in the three-largest industry groups –oil & gas exploration & production (E&P), oil & gas storage & transportation, and oil & gas equipment & services – held back fund performance relative to the FactSet industry benchmark. In addition, foreign holdings detracted overall, despite the tailwind from a broadly weaker U.S. dollar. Versus that benchmark, a sizable non-index stake in Boardwalk Pipeline Partners, a provider of transportation and storage of natural gas and liquids, was among the fund's biggest detractors. Conversely, the top contributor was an overweight in Rice Energy, a U.S. natural gas E&P company that rallied sharply after its announced acquisition by natural gas driller EQT Corp. The acquisition was finalized during the period.
The views expressed above reflect those of the portfolio manager(s) only through the end of the period as stated on the cover of this report and do not necessarily represent the views of Fidelity or any other person in the Fidelity organization. Any such views are subject to change at any time based upon market or other conditions and Fidelity disclaims any responsibility to update such views. These views may not be relied on as investment advice and, because investment decisions for a Fidelity fund are based on numerous factors, may not be relied on as an indication of trading intent on behalf of any Fidelity fund.
Note to Shareholders: On April 1, 2017, the fund’s industry benchmark changed from the S&P
® Custom Natural Gas Index to the FactSet Natural Gas Linked Index. Due to new international benchmark guidelines, S&P
® Dow Jones
® Indices has stopped offering its brand on custom benchmarks, effective March 31, 2017. Fidelity believes that the new FactSet index will continue to provide shareholders with meaningful performance comparisons. On December 8, 2017, shareholders approved proposals from the Board of Trustees to eliminate each sector/industry fund's fundamental “invests primarily” policy and to modify the fundamental concentration policy for certain funds. The changes took effect on January 1, 2018, and do not impact how the funds are managed. After joining Lead Manager Edward Davis as a Co-Manager on October 20, 2017, Ben Shuleva assumed lead management of the fund on December 1, 2017, leaving Edward with co-manager responsibilities. On December 30, 2017, Ben became sole manager of the fund.
Natural Gas Portfolio
Investment Summary (Unaudited)
Top Ten Stocks as of February 28, 2018
| | % of fund's net assets |
| ConocoPhillips Co. | 7.2 |
| Anadarko Petroleum Corp. | 6.5 |
| Baker Hughes, a GE Co. Class A | 6.5 |
| EOG Resources, Inc. | 6.5 |
| Kinder Morgan, Inc. | 5.1 |
| Encana Corp. | 4.6 |
| Occidental Petroleum Corp. | 4.1 |
| Schlumberger Ltd. | 3.8 |
| Boardwalk Pipeline Partners, LP | 3.2 |
| Spire, Inc. | 2.9 |
| | 50.4 |
Top Industries (% of fund's net assets)
| As of February 28, 2018 |
| | Oil, Gas & Consumable Fuels | 71.7% |
| | Energy Equipment & Services | 17.8% |
| | Gas Utilities | 9.1% |
| | Multi-Utilities | 1.3% |
| | All Others* | 0.1% |

* Includes Short-Term investments and Net Other Assets (Liabilities).
Natural Gas Portfolio
Schedule of Investments February 28, 2018
Showing Percentage of Net Assets
| Common Stocks - 99.9% | | | |
| | | Shares | Value |
| Energy Equipment & Services - 17.8% | | | |
| Oil & Gas Drilling - 2.9% | | | |
| Nabors Industries Ltd. | | 785,400 | $5,081,538 |
| Patterson-UTI Energy, Inc. | | 2,400 | 43,368 |
| Trinidad Drilling Ltd. (a) | | 1,285,600 | 1,843,441 |
| | | | 6,968,347 |
| Oil & Gas Equipment & Services - 14.9% | | | |
| Baker Hughes, a GE Co. Class A | | 587,100 | 15,499,440 |
| C&J Energy Services, Inc. (a) | | 66,900 | 1,605,600 |
| Halliburton Co. | | 7,600 | 352,792 |
| National Oilwell Varco, Inc. | | 21,400 | 750,926 |
| Oceaneering International, Inc. | | 74,200 | 1,363,796 |
| Pason Systems, Inc. | | 18,600 | 257,142 |
| RigNet, Inc. (a) | | 242,934 | 3,255,316 |
| Schlumberger Ltd. | | 137,632 | 9,034,164 |
| Superior Energy Services, Inc. (a) | | 168,500 | 1,440,675 |
| Weatherford International PLC (a)(b) | | 747,400 | 1,965,662 |
| | | | 35,525,513 |
|
| TOTAL ENERGY EQUIPMENT & SERVICES | | | 42,493,860 |
|
| Gas Utilities - 9.1% | | | |
| Gas Utilities - 9.1% | | | |
| Atmos Energy Corp. | | 64,378 | 5,181,785 |
| Southwest Gas Holdings, Inc. | | 93,200 | 6,140,016 |
| Spire, Inc. | | 104,000 | 7,051,200 |
| Valener, Inc. | | 207,000 | 3,310,193 |
| | | | 21,683,194 |
| Multi-Utilities - 1.3% | | | |
| Multi-Utilities - 1.3% | | | |
| NiSource, Inc. | | 132,400 | 3,062,412 |
| Oil, Gas & Consumable Fuels - 71.7% | | | |
| Integrated Oil & Gas - 4.1% | | | |
| Occidental Petroleum Corp. | | 147,500 | 9,676,000 |
| Oil & Gas Exploration & Production - 49.9% | | | |
| Abraxas Petroleum Corp. (a) | | 108,400 | 233,060 |
| Advantage Oil & Gas Ltd. (a) | | 723,900 | 2,047,816 |
| Anadarko Petroleum Corp. | | 272,720 | 15,555,949 |
| Cabot Oil & Gas Corp. | | 15,400 | 372,064 |
| Cimarex Energy Co. | | 50,700 | 4,871,763 |
| Concho Resources, Inc. (a) | | 14,700 | 2,216,760 |
| ConocoPhillips Co. | | 315,200 | 17,118,512 |
| Crew Energy, Inc. (a) | | 626,600 | 751,998 |
| Crown Point Energy, Inc. (a)(c) | | 18,166 | 5,450 |
| Devon Energy Corp. | | 228,246 | 7,000,305 |
| Encana Corp. | | 1,048,000 | 10,992,893 |
| EOG Resources, Inc. | | 152,300 | 15,446,266 |
| EQT Corp. | | 44,723 | 2,250,014 |
| Gulfport Energy Corp. (a) | | 204,400 | 1,982,680 |
| Lekoil Ltd. (a) | | 5,613,100 | 1,384,005 |
| Marathon Oil Corp. | | 435,600 | 6,324,912 |
| Newfield Exploration Co. (a) | | 32,100 | 748,893 |
| Noble Energy, Inc. | | 215,200 | 6,419,416 |
| Northern Blizzard Resources, Inc. | | 753,800 | 1,145,503 |
| Parsley Energy, Inc. Class A (a) | | 232,100 | 5,867,488 |
| PDC Energy, Inc. (a) | | 118,100 | 6,203,793 |
| Range Resources Corp. | | 171,900 | 2,284,551 |
| Savannah Petroleum PLC (a) | | 4,290,700 | 1,616,305 |
| Surge Energy, Inc. (b) | | 1,408,500 | 2,107,481 |
| WPX Energy, Inc. (a) | | 288,300 | 4,073,679 |
| | | | 119,021,556 |
| Oil & Gas Refining & Marketing - 0.7% | | | |
| Keyera Corp. (b) | | 71,000 | 1,809,305 |
| Oil & Gas Storage & Transport - 17.0% | | | |
| Boardwalk Pipeline Partners, LP | | 669,900 | 7,549,773 |
| Cheniere Energy, Inc. (a) | | 20,800 | 1,092,416 |
| Enbridge, Inc. | | 180,200 | 5,730,955 |
| Kinder Morgan, Inc. | | 747,100 | 12,103,020 |
| Sunoco Logistics Partners LP | | 42,650 | 776,657 |
| The Williams Companies, Inc. | | 251,600 | 6,984,416 |
| TransCanada Corp. | | 135,500 | 5,860,544 |
| TransCanada Corp. | | 8,100 | 350,082 |
| | | | 40,447,863 |
|
| TOTAL OIL, GAS & CONSUMABLE FUELS | | | 170,954,724 |
|
| TOTAL COMMON STOCKS | | | |
| (Cost $347,382,752) | | | 238,194,190 |
|
| Money Market Funds - 2.0% | | | |
| Fidelity Securities Lending Cash Central Fund 1.42% (d)(e) | | | |
| (Cost $4,782,518) | | 4,781,656 | 4,782,134 |
| TOTAL INVESTMENT IN SECURITIES - 101.9% | | | |
| (Cost $352,165,270) | | | 242,976,324 |
| NET OTHER ASSETS (LIABILITIES) - (1.9)% | | | (4,608,117) |
| NET ASSETS - 100% | | | $238,368,207 |
Legend
(a) Non-income producing
(b) Security or a portion of the security is on loan at period end.
(c) Security exempt from registration under Rule 144A of the Securities Act of 1933. These securities may be resold in transactions exempt from registration, normally to qualified institutional buyers. At the end of the period, the value of these securities amounted to $5,450 or 0.0% of net assets.
(d) Investment made with cash collateral received from securities on loan.
(e) Affiliated fund that is generally available only to investment companies and other accounts managed by Fidelity Investments. The rate quoted is the annualized seven-day yield of the fund at period end. A complete unaudited listing of the fund's holdings as of its most recent quarter end is available upon request. In addition, each Fidelity Central Fund's financial statements, which are not covered by the Fund's Report of Independent Registered Public Accounting Firm, are available on the SEC's website or upon request.
Affiliated Central Funds
Information regarding fiscal year to date income earned by the Fund from investments in Fidelity Central Funds is as follows:
| Fund | Income earned |
| Fidelity Cash Central Fund | $22,943 |
| Fidelity Securities Lending Cash Central Fund | 65,271 |
| Total | $88,214 |
Amounts in the income column in the above table include any capital gain distributions from underlying funds, which are presented in the corresponding line-item in the Statement of Operations if applicable.
Investment Valuation
The following is a summary of the inputs used, as of February 28, 2018, involving the Fund's assets and liabilities carried at fair value. The inputs or methodology used for valuing securities may not be an indication of the risk associated with investing in those securities. For more information on valuation inputs, and their aggregation into the levels used below, please refer to the Investment Valuation section in the accompanying Notes to Financial Statements.
| | Valuation Inputs at Reporting Date: |
| Description | Total | Level 1 | Level 2 | Level 3 |
| Investments in Securities: | | | | |
| Common Stocks | $238,194,190 | $235,193,880 | $3,000,310 | $-- |
| Money Market Funds | 4,782,134 | 4,782,134 | -- | -- |
| Total Investments in Securities: | $242,976,324 | $239,976,014 | $3,000,310 | $-- |
The following is a summary of transfers between Level 1 and Level 2 for the period ended February 28, 2018. Transfers are assumed to have occurred at the beginning of the period, and are primarily attributable to the valuation techniques used for foreign equity securities, as discussed in the accompanying Notes to Financial Statements:
| Transfers | Total |
| Level 1 to Level 2 | $3,684,497 |
| Level 2 to Level 1 | $0 |
Other Information
Distribution of investments by country or territory of incorporation, as a percentage of Total Net Assets, is as follows (Unaudited):
| United States of America | 76.8% |
| Canada | 15.2% |
| Curacao | 3.8% |
| Bermuda | 2.1% |
| Others (Individually Less Than 1%) | 2.1% |
| | 100.0% |
See accompanying notes which are an integral part of the financial statements.
Natural Gas Portfolio
Financial Statements
Statement of Assets and Liabilities
| | | February 28, 2018 |
| Assets | | |
Investment in securities, at value (including securities loaned of $4,388,665) — See accompanying schedule:
Unaffiliated issuers (cost $347,382,752) | $238,194,190 | |
| Fidelity Central Funds (cost $4,782,518) | 4,782,134 | |
| Total Investment in Securities (cost $352,165,270) | | $242,976,324 |
| Receivable for investments sold | | 2,914,160 |
| Receivable for fund shares sold | | 436,125 |
| Dividends receivable | | 466,487 |
| Distributions receivable from Fidelity Central Funds | | 2,932 |
| Prepaid expenses | | 1,018 |
| Other receivables | | 44,293 |
| Total assets | | 246,841,339 |
| Liabilities | | |
| Payable to custodian bank | $589,818 | |
| Payable for investments purchased | 2,303,479 | |
| Payable for fund shares redeemed | 530,979 | |
| Accrued management fee | 113,091 | |
| Other affiliated payables | 70,058 | |
| Other payables and accrued expenses | 86,205 | |
| Collateral on securities loaned | 4,779,502 | |
| Total liabilities | | 8,473,132 |
| Net Assets | | $238,368,207 |
| Net Assets consist of: | | |
| Paid in capital | | $795,196,350 |
| Distributions in excess of net investment income | | (4,641,134) |
| Accumulated undistributed net realized gain (loss) on investments and foreign currency transactions | | (442,995,823) |
| Net unrealized appreciation (depreciation) on investments and assets and liabilities in foreign currencies | | (109,191,186) |
| Net Assets, for 11,033,353 shares outstanding | | $238,368,207 |
| Net Asset Value, offering price and redemption price per share ($238,368,207 ÷ 11,033,353 shares) | | $21.60 |
See accompanying notes which are an integral part of the financial statements.
Statement of Operations
| | | Year ended February 28, 2018 |
| Investment Income | | |
| Dividends | | $4,708,838 |
| Special dividends | | 5,815,250 |
| Income from Fidelity Central Funds (including $65,271 from security lending) | | 88,214 |
| Total income | | 10,612,302 |
| Expenses | | |
| Management fee | $1,694,164 | |
| Transfer agent fees | 824,890 | |
| Accounting and security lending fees | 123,964 | |
| Custodian fees and expenses | 15,987 | |
| Independent trustees' fees and expenses | 7,355 | |
| Registration fees | 41,646 | |
| Audit | 40,007 | |
| Legal | 5,604 | |
| Interest | 1,664 | |
| Miscellaneous | 19,373 | |
| Total expenses before reductions | 2,774,654 | |
| Expense reductions | (38,137) | 2,736,517 |
| Net investment income (loss) | | 7,875,785 |
| Realized and Unrealized Gain (Loss) | | |
| Net realized gain (loss) on: | | |
| Investment securities: | | |
| Unaffiliated issuers | (56,957,996) | |
| Fidelity Central Funds | (659) | |
| Foreign currency transactions | (15,515) | |
| Total net realized gain (loss) | | (56,974,170) |
| Change in net unrealized appreciation (depreciation) on: | | |
| Investment securities: | | |
| Unaffiliated issuers | (18,859,412) | |
| Fidelity Central Funds | (384) | |
| Assets and liabilities in foreign currencies | (196) | |
| Total change in net unrealized appreciation (depreciation) | | (18,859,992) |
| Net gain (loss) | | (75,834,162) |
| Net increase (decrease) in net assets resulting from operations | | $(67,958,377) |
See accompanying notes which are an integral part of the financial statements.
Statement of Changes in Net Assets
| | Year ended February 28, 2018 | Year ended February 28, 2017 |
| Increase (Decrease) in Net Assets | | |
| Operations | | |
| Net investment income (loss) | $7,875,785 | $2,134,122 |
| Net realized gain (loss) | (56,974,170) | (14,597,072) |
| Change in net unrealized appreciation (depreciation) | (18,859,992) | 159,311,552 |
| Net increase (decrease) in net assets resulting from operations | (67,958,377) | 146,848,602 |
| Distributions to shareholders from net investment income | (8,092,750) | (2,707,349) |
| Distributions to shareholders from net realized gain | (3,721,773) | (399,401) |
| Total distributions | (11,814,523) | (3,106,750) |
| Share transactions | | |
| Proceeds from sales of shares | 91,904,830 | 363,264,746 |
| Reinvestment of distributions | 11,138,646 | 2,868,753 |
| Cost of shares redeemed | (264,791,683) | (286,062,132) |
| Net increase (decrease) in net assets resulting from share transactions | (161,748,207) | 80,071,367 |
| Redemption fees | 10,206 | 75,698 |
| Total increase (decrease) in net assets | (241,510,901) | 223,888,917 |
| Net Assets | | |
| Beginning of period | 479,879,108 | 255,990,191 |
| End of period | $238,368,207 | $479,879,108 |
| Other Information | | |
| Distributions in excess of net investment income end of period | $(4,641,134) | $(3,915,326) |
| Shares | | |
| Sold | 3,833,010 | 13,555,828 |
| Issued in reinvestment of distributions | 487,783 | 106,018 |
| Redeemed | (10,575,399) | (10,729,732) |
| Net increase (decrease) | (6,254,606) | 2,932,114 |
See accompanying notes which are an integral part of the financial statements.
Financial Highlights
Natural Gas Portfolio
| | | | | | |
| Years ended February 28, | 2018 | 2017 | 2016 A | 2015 | 2014 |
| Selected Per–Share Data | | | | | |
| Net asset value, beginning of period | $27.76 | $17.83 | $32.05 | $39.16 | $32.86 |
| Income from Investment Operations | | | | | |
| Net investment income (loss)B | .61C | .13 | .33 | .34 | .35 |
| Net realized and unrealized gain (loss) | (5.83) | 9.98 | (14.16) | (7.03) | 6.61 |
| Total from investment operations | (5.22) | 10.11 | (13.83) | (6.69) | 6.96 |
| Distributions from net investment income | (.65) | (.15) | (.39) | (.38) | (.33) |
| Distributions from net realized gain | (.29) | (.03) | – | (.04) | (.32) |
| Total distributions | (.94) | (.18) | (.39) | (.42) | (.66)D |
| Redemption fees added to paid in capitalB,E | – | – | – | – | – |
| Net asset value, end of period | $21.60 | $27.76 | $17.83 | $32.05 | $39.16 |
| Total ReturnF | (18.97)% | 56.75% | (43.29)% | (17.15)% | 21.28% |
| Ratios to Average Net AssetsG,H | | | | | |
| Expenses before reductions | .89% | .87% | .89% | .82% | .84% |
| Expenses net of fee waivers, if any | .89% | .87% | .88% | .82% | .84% |
| Expenses net of all reductions | .87% | .87% | .88% | .82% | .84% |
| Net investment income (loss) | 2.52%C | .50% | 1.24% | .84% | .98% |
| Supplemental Data | | | | | |
| Net assets, end of period (000 omitted) | $238,368 | $479,879 | $255,990 | $530,285 | $840,514 |
| Portfolio turnover rateI | 69% | 76% | 62% | 147%J | 135% |
A For the year ended February 29.
B Calculated based on average shares outstanding during the period.
C Net Investment income per share reflects a large, non-recurring dividend which amounted to $.45 per share. Excluding this non-recurring dividend, the ratio of net investment income (loss) to average net assets would have been .66%.
D Total distributions of $.66 per share is comprised of distributions from net investment income of $.332 and distributions from net realized gain of $.324 per share.
E Amount represents less than $.005 per share.
F Total returns would have been lower if certain expenses had not been reduced during the applicable periods shown.
G Fees and expenses of any underlying Fidelity Central Funds are not included in the Fund's expense ratio. The Fund indirectly bears its proportionate share of the expenses of any underlying Fidelity Central Funds.
H Expense ratios reflect operating expenses of the Fund. Expenses before reductions do not reflect amounts reimbursed by the investment adviser or reductions from brokerage service arrangements or reductions from other expense offset arrangements and do not represent the amount paid by the Fund during periods when reimbursements or reductions occur. Expenses net of fee waivers reflect expenses after reimbursement by the investment adviser but prior to reductions from brokerage service arrangements or other expense offset arrangements. Expenses net of all reductions represent the net expenses paid by the Fund.
I Amount does not include the portfolio activity of any underlying Fidelity Central Funds.
J Portfolio turnover rate excludes securities received or delivered in-kind.
See accompanying notes which are an integral part of the financial statements.
Natural Resources Portfolio
Performance: The Bottom Line
Average annual total return reflects the change in the value of an investment, assuming reinvestment of distributions from dividend income and capital gains (the profits earned upon the sale of securities that have grown in value, if any) and assuming a constant rate of performance each year. The hypothetical investment and the average annual total returns do not reflect the deduction of taxes that a shareholder would pay on fund distributions or the redemption of fund shares. During periods of reimbursement by Fidelity, a fund’s total return will be greater than it would be had the reimbursement not occurred. How a fund did yesterday is no guarantee of how it will do tomorrow.
Average Annual Total Returns
| For the periods ended February 28, 2018 | Past 1 year | Past 5 years | Past 10 years |
| Natural Resources Portfolio | (4.16)% | (1.91)% | (1.94)% |
$10,000 Over 10 Years
Let's say hypothetically that $10,000 was invested in Natural Resources Portfolio on February 29, 2008.
The chart shows how the value of your investment would have changed, and also shows how the S&P 500® Index performed over the same period.
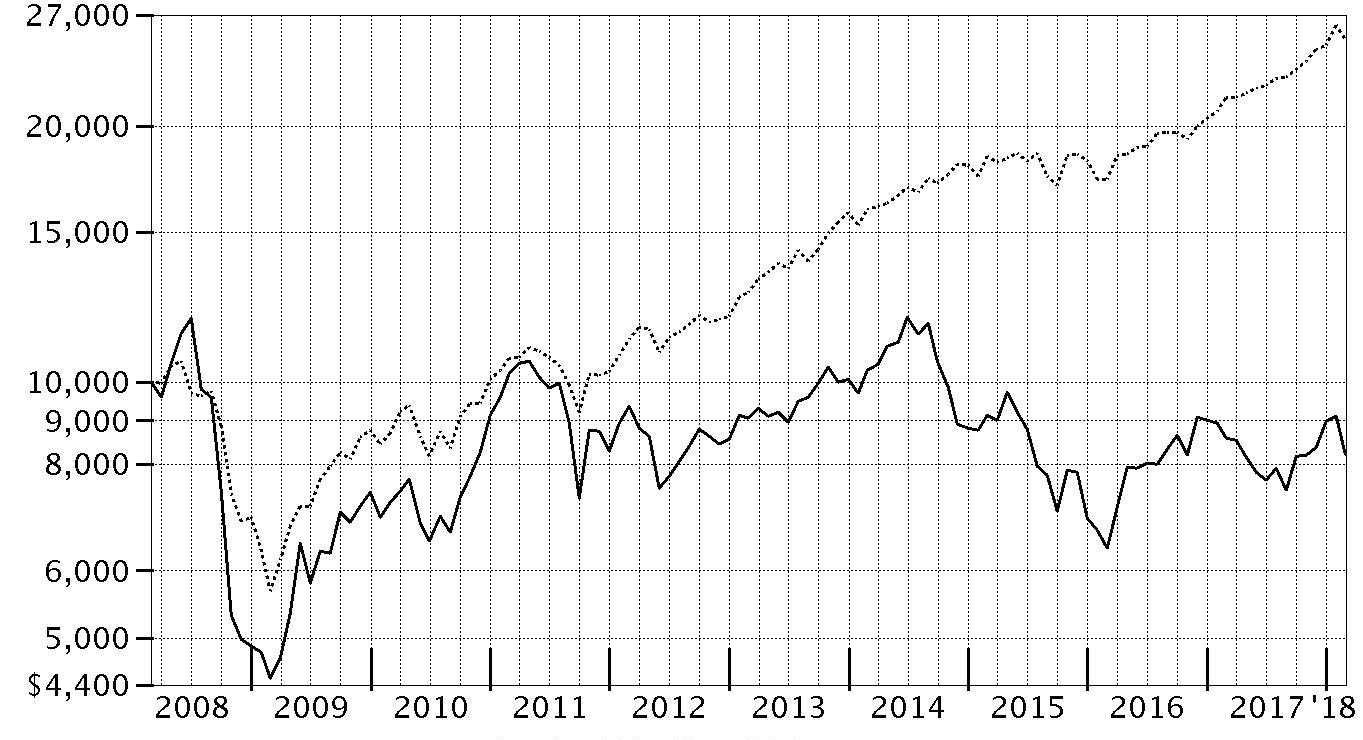
| Period Ending Values |
| $8,223 | Natural Resources Portfolio |
| $25,307 | S&P 500® Index |
Natural Resources Portfolio
Management's Discussion of Fund Performance
Market Recap: U.S. equities gained 17.10% for the 12 months ending February 28, 2018, as the S&P 500
® index moved steadily higher throughout 2017 and into 2018 until sharply reversing course in February. The drop was in stark contrast to the low volatility seen throughout 2017, along with consumer sentiment and other market indicators that stayed positive. Investors remained decidedly upbeat as the calendar turned, and the index rose 5.73% in January. February was a decidedly different story, though, as volatility spiked amid fear that rising inflation and the potential for the economy to overheat would prompt the U.S. Federal Reserve to pick up the pace of interest rate hikes. The index returned -3.69% for the month, its first negative result since October 2016. For the full 12 months, growth stocks handily topped value, while large-caps bested small-caps. By sector, information technology fared best by far, gaining 36% amid strong earnings growth from several major index constituents. Consumer discretionary (+22%) also stood out, driven by retailers. Financials added 20%, riding the uptick in bond yields. Materials and industrials rose about 16% each, boosted by higher demand, especially from China. Conversely, notable laggards included the defensive telecommunication services (-5%) and utilities (-2%) sectors, while rising rates held back real estate (-3%).
Comments from Portfolio Manager Nathan Strik: For the 12 months, the fund returned -4.16%, trailing the -2.99% return of the S&P
® North American Natural Resources Sector Index and the 17.10% gain of the broad market S&P 500 index. Versus the S&P industry benchmark, unfavorable positioning in a few industry groups – oil & gas equipment & services, integrated oil & gas, and copper – held back fund performance. Conversely, good stock picking in oil & gas drilling and a non-index stake in commodity chemicals also added value. Among individual stocks, not having exposure to refining firm Valero Energy and exploration & production (E&P) company ConocoPhillips, two index constituents that performed well, detracted. It helped, however, to overweight E&P Diamondback Energy, which effectively executed its business objectives, and natural gas E&P Rice Energy, which was bought out at a sizable premium by rival EQT Corp. this period.
The views expressed above reflect those of the portfolio manager(s) only through the end of the period as stated on the cover of this report and do not necessarily represent the views of Fidelity or any other person in the Fidelity organization. Any such views are subject to change at any time based upon market or other conditions and Fidelity disclaims any responsibility to update such views. These views may not be relied on as investment advice and, because investment decisions for a Fidelity fund are based on numerous factors, may not be relied on as an indication of trading intent on behalf of any Fidelity fund.
Note to Shareholders: On December 8, 2017, shareholders approved proposals from the Board of Trustees to eliminate each sector/industry fund's fundamental “invests primarily” policy and to modify the fundamental concentration policy for certain funds. Additionally, shareholders approved a proposal to reclassify Select Natural Resources Portfolio as a non-diversified fund, which allows it to focus its investments more heavily in securities of fewer issuers. These changes took effect on January 1, 2018.
On October 20, 2017, Nathan Strik assumed co-manager responsibilities for the fund, joining former Lead Manager John Dowd. Nathan was then named sole portfolio manager of the fund on February 1, 2018.
Natural Resources Portfolio
Investment Summary (Unaudited)
Top Ten Stocks as of February 28, 2018
| | % of fund's net assets |
| Chevron Corp. | 8.7 |
| Suncor Energy, Inc. | 5.3 |
| EOG Resources, Inc. | 4.4 |
| The Williams Companies, Inc. | 4.1 |
| Anadarko Petroleum Corp. | 3.9 |
| Halliburton Co. | 3.8 |
| Phillips 66 Co. | 3.4 |
| Pioneer Natural Resources Co. | 3.4 |
| Diamondback Energy, Inc. | 3.2 |
| Franco-Nevada Corp. | 3.0 |
| | 43.2 |
Top Industries (% of fund's net assets)
| As of February 28, 2018 |
| | Oil, Gas & Consumable Fuels | 68.2% |
| | Energy Equipment & Services | 12.4% |
| | Metals & Mining | 7.3% |
| | Containers & Packaging | 6.8% |
| | Chemicals | 2.1% |
| | All Others* | 3.2% |

* Includes Short-Term investments and Net Other Assets (Liabilities).
Natural Resources Portfolio
Schedule of Investments February 28, 2018
Showing Percentage of Net Assets
| Common Stocks - 99.5% | | | |
| | | Shares | Value |
| Chemicals - 2.1% | | | |
| Commodity Chemicals - 2.1% | | | |
| LyondellBasell Industries NV Class A | | 180,700 | $19,555,354 |
| Construction Materials - 1.9% | | | |
| Construction Materials - 1.9% | | | |
| Eagle Materials, Inc. | | 66,800 | 6,695,364 |
| Summit Materials, Inc. | | 333,300 | 10,542,279 |
| | | | 17,237,643 |
| Containers & Packaging - 6.8% | | | |
| Metal & Glass Containers - 1.4% | | | |
| Ball Corp. | | 329,200 | 13,151,540 |
| Paper Packaging - 5.4% | | | |
| Avery Dennison Corp. | | 115,700 | 13,669,955 |
| Graphic Packaging Holding Co. | | 328,300 | 5,026,273 |
| Packaging Corp. of America | | 125,300 | 14,935,760 |
| WestRock Co. | | 234,000 | 15,387,840 |
| | | | 49,019,828 |
|
| TOTAL CONTAINERS & PACKAGING | | | 62,171,368 |
|
| Energy Equipment & Services - 12.4% | | | |
| Oil & Gas Drilling - 1.7% | | | |
| Nabors Industries Ltd. | | 517,520 | 3,348,354 |
| Odfjell Drilling Ltd. (a) | | 590,700 | 2,728,487 |
| Shelf Drilling Ltd. (b) | | 759,800 | 6,222,388 |
| Trinidad Drilling Ltd. (a) | | 856,400 | 1,228,005 |
| Xtreme Drilling & Coil Services Corp. (a) | | 1,059,900 | 1,808,900 |
| | | | 15,336,134 |
| Oil & Gas Equipment & Services - 10.7% | | | |
| Baker Hughes, a GE Co. Class A | | 850,300 | 22,447,920 |
| Dril-Quip, Inc. (a) | | 113,925 | 5,132,321 |
| Halliburton Co. | | 746,700 | 34,661,814 |
| Liberty Oilfield Services, Inc. Class A (a)(c) | | 19,500 | 362,505 |
| National Oilwell Varco, Inc. | | 209,400 | 7,347,846 |
| NCS Multistage Holdings, Inc. | | 122,500 | 1,790,950 |
| Oceaneering International, Inc. | | 187,200 | 3,440,736 |
| RigNet, Inc. (a) | | 270,230 | 3,621,082 |
| Schlumberger Ltd. | | 282,365 | 18,534,439 |
| | | | 97,339,613 |
|
| TOTAL ENERGY EQUIPMENT & SERVICES | | | 112,675,747 |
|
| Machinery - 0.2% | | | |
| Industrial Machinery - 0.2% | | | |
| ProPetro Holding Corp. | | 108,200 | 1,745,266 |
| Metals & Mining - 7.3% | | | |
| Copper - 0.7% | | | |
| Freeport-McMoRan, Inc. (a) | | 344,400 | 6,405,840 |
| Gold - 6.6% | | | |
| Agnico Eagle Mines Ltd. (Canada) | | 460,500 | 17,545,079 |
| Franco-Nevada Corp. | | 391,700 | 27,448,304 |
| Randgold Resources Ltd. sponsored ADR (c) | | 186,673 | 15,124,246 |
| | | | 60,117,629 |
|
| TOTAL METALS & MINING | | | 66,523,469 |
|
| Oil, Gas & Consumable Fuels - 68.2% | | | |
| Coal & Consumable Fuels - 0.2% | | | |
| Pinnacle Renewable Holds, Inc. (a) | | 157,200 | 1,652,609 |
| Integrated Oil & Gas - 15.2% | | | |
| Cenovus Energy, Inc. | | 1,457,000 | 10,605,034 |
| Chevron Corp. | | 710,798 | 79,552,513 |
| Suncor Energy, Inc. | | 1,477,600 | 48,639,202 |
| | | | 138,796,749 |
| Oil & Gas Exploration & Production - 34.8% | | | |
| Anadarko Petroleum Corp. | | 629,400 | 35,900,976 |
| Cabot Oil & Gas Corp. | | 616,600 | 14,897,056 |
| Callon Petroleum Co. (a) | | 553,500 | 5,850,495 |
| Canadian Natural Resources Ltd. | | 826,900 | 25,615,083 |
| Centennial Resource Development, Inc.: | | | |
| Class A (a) | | 38,300 | 730,764 |
| Class A (a) | | 338,800 | 6,464,304 |
| Cimarex Energy Co. | | 130,900 | 12,578,181 |
| Continental Resources, Inc. (a) | | 331,400 | 15,744,814 |
| Devon Energy Corp. | | 630,400 | 19,334,368 |
| Diamondback Energy, Inc. (a) | | 235,300 | 29,327,792 |
| Encana Corp. | | 1,657,300 | 17,384,085 |
| EOG Resources, Inc. | | 394,100 | 39,969,622 |
| EQT Corp. | | 267,000 | 13,432,770 |
| Extraction Oil & Gas, Inc. (a) | | 424,981 | 5,133,770 |
| Newfield Exploration Co. (a) | | 424,000 | 9,891,920 |
| Parsley Energy, Inc. Class A (a) | | 630,900 | 15,949,152 |
| PDC Energy, Inc. (a) | | 135,300 | 7,107,309 |
| Pioneer Natural Resources Co. | | 179,900 | 30,624,377 |
| PrairieSky Royalty Ltd. | | 102,938 | 2,283,857 |
| Viper Energy Partners LP | | 380,600 | 8,609,172 |
| | | | 316,829,867 |
| Oil & Gas Refining & Marketing - 7.7% | | | |
| Andeavor | | 113,100 | 10,136,022 |
| Delek U.S. Holdings, Inc. | | 648,604 | 22,130,368 |
| Phillips 66 Co. | | 344,916 | 31,170,059 |
| Reliance Industries Ltd. | | 447,286 | 6,507,893 |
| | | | 69,944,342 |
| Oil & Gas Storage & Transport - 10.3% | | | |
| Cheniere Energy, Inc. (a) | | 310,100 | 16,286,452 |
| Enterprise Products Partners LP | | 716,200 | 18,205,804 |
| GasLog Partners LP | | 93,200 | 2,190,200 |
| Gener8 Maritime, Inc. (a) | | 757,807 | 4,205,829 |
| Golar LNG Ltd. (c) | | 185,400 | 5,009,508 |
| Noble Midstream Partners LP | | 155,737 | 7,506,523 |
| Noble Midstream Partners LP (d) | | 43,718 | 2,107,208 |
| Teekay LNG Partners LP | | 50,500 | 934,250 |
| The Williams Companies, Inc. | | 1,331,600 | 36,965,216 |
| | | | 93,410,990 |
|
| TOTAL OIL, GAS & CONSUMABLE FUELS | | | 620,634,557 |
|
| Paper & Forest Products - 0.6% | | | |
| Forest Products - 0.6% | | | |
| Western Forest Products, Inc. | | 2,625,200 | 5,585,098 |
| TOTAL COMMON STOCKS | | | |
| (Cost $876,678,472) | | | 906,128,502 |
|
| Money Market Funds - 2.4% | | | |
| Fidelity Cash Central Fund, 1.41% (e) | | 4,325,027 | 4,325,891 |
| Fidelity Securities Lending Cash Central Fund 1.42% (e)(f) | | 17,831,774 | 17,833,556 |
| TOTAL MONEY MARKET FUNDS | | | |
| (Cost $22,159,091) | | | 22,159,447 |
| TOTAL INVESTMENT IN SECURITIES - 101.9% | | | |
| (Cost $898,837,563) | | | 928,287,949 |
| NET OTHER ASSETS (LIABILITIES) - (1.9)% | | | (17,554,473) |
| NET ASSETS - 100% | | | $910,733,476 |
Legend
(a) Non-income producing
(b) Security exempt from registration under Rule 144A of the Securities Act of 1933. These securities may be resold in transactions exempt from registration, normally to qualified institutional buyers. At the end of the period, the value of these securities amounted to $6,222,388 or 0.7% of net assets.
(c) Security or a portion of the security is on loan at period end.
(d) Restricted securities - Investment in securities not registered under the Securities Act of 1933 (excluding 144A issues). At the end of the period, the value of restricted securities (excluding 144A issues) amounted to $2,107,208 or 0.2% of net assets.
(e) Affiliated fund that is generally available only to investment companies and other accounts managed by Fidelity Investments. The rate quoted is the annualized seven-day yield of the fund at period end. A complete unaudited listing of the fund's holdings as of its most recent quarter end is available upon request. In addition, each Fidelity Central Fund's financial statements, which are not covered by the Fund's Report of Independent Registered Public Accounting Firm, are available on the SEC's website or upon request.
(f) Investment made with cash collateral received from securities on loan.
Additional information on each restricted holding is as follows:
| Security | Acquisition Date | Acquisition Cost |
| Noble Midstream Partners LP | 6/21/17 | $1,768,393 |
Affiliated Central Funds
Information regarding fiscal year to date income earned by the Fund from investments in Fidelity Central Funds is as follows:
| Fund | Income earned |
| Fidelity Cash Central Fund | $83,117 |
| Fidelity Securities Lending Cash Central Fund | 157,366 |
| Total | $240,483 |
Amounts in the income column in the above table include any capital gain distributions from underlying funds, which are presented in the corresponding line-item in the Statement of Operations if applicable.
Investment Valuation
The following is a summary of the inputs used, as of February 28, 2018, involving the Fund's assets and liabilities carried at fair value. The inputs or methodology used for valuing securities may not be an indication of the risk associated with investing in those securities. For more information on valuation inputs, and their aggregation into the levels used below, please refer to the Investment Valuation section in the accompanying Notes to Financial Statements.
| | Valuation Inputs at Reporting Date: |
| Description | Total | Level 1 | Level 2 | Level 3 |
| Investments in Securities: | | | | |
| Common Stocks | $906,128,502 | $890,669,734 | $15,458,768 | $-- |
| Money Market Funds | 22,159,447 | 22,159,447 | -- | -- |
| Total Investments in Securities: | $928,287,949 | $912,829,181 | $15,458,768 | $-- |
Other Information
Distribution of investments by country or territory of incorporation, as a percentage of Total Net Assets, is as follows (Unaudited):
| United States of America | 73.2% |
| Canada | 17.5% |
| Netherlands | 2.1% |
| Curacao | 2.0% |
| Bailiwick of Jersey | 1.7% |
| Bermuda | 1.3% |
| Others (Individually Less Than 1%) | 2.2% |
| | 100.0% |
See accompanying notes which are an integral part of the financial statements.
Natural Resources Portfolio
Financial Statements
Statement of Assets and Liabilities
| | | February 28, 2018 |
| Assets | | |
Investment in securities, at value (including securities loaned of $17,144,922) — See accompanying schedule:
Unaffiliated issuers (cost $876,678,472) | $906,128,502 | |
| Fidelity Central Funds (cost $22,159,091) | 22,159,447 | |
| Total Investment in Securities (cost $898,837,563) | | $928,287,949 |
| Receivable for investments sold | | 102,497 |
| Receivable for fund shares sold | | 850,632 |
| Dividends receivable | | 1,463,419 |
| Distributions receivable from Fidelity Central Funds | | 5,247 |
| Prepaid expenses | | 2,760 |
| Other receivables | | 73,822 |
| Total assets | | 930,786,326 |
| Liabilities | | |
| Payable for fund shares redeemed | $1,126,030 | |
| Accrued management fee | 424,878 | |
| Other affiliated payables | 211,405 | |
| Other payables and accrued expenses | 461,287 | |
| Collateral on securities loaned | 17,829,250 | |
| Total liabilities | | 20,052,850 |
| Net Assets | | $910,733,476 |
| Net Assets consist of: | | |
| Paid in capital | | $1,029,780,136 |
| Distributions in excess of net investment income | | (1,256,817) |
| Accumulated undistributed net realized gain (loss) on investments and foreign currency transactions | | (146,912,975) |
| Net unrealized appreciation (depreciation) on investments and assets and liabilities in foreign currencies | | 29,123,132 |
| Net Assets, for 33,104,402 shares outstanding | | $910,733,476 |
| Net Asset Value, offering price and redemption price per share ($910,733,476 ÷ 33,104,402 shares) | | $27.51 |
See accompanying notes which are an integral part of the financial statements.
Statement of Operations
| | | Year ended February 28, 2018 |
| Investment Income | | |
| Dividends | | $10,854,814 |
| Special dividends | | 10,141,250 |
| Income from Fidelity Central Funds (including $157,366 from security lending) | | 240,483 |
| Total income | | 21,236,547 |
| Expenses | | |
| Management fee | $4,898,592 | |
| Transfer agent fees | 2,047,159 | |
| Accounting and security lending fees | 312,080 | |
| Custodian fees and expenses | 32,728 | |
| Independent trustees' fees and expenses | 19,480 | |
| Registration fees | 46,858 | |
| Audit | 50,126 | |
| Legal | 13,160 | |
| Interest | 5,229 | |
| Miscellaneous | 52,530 | |
| Total expenses before reductions | 7,477,942 | |
| Expense reductions | (83,485) | 7,394,457 |
| Net investment income (loss) | | 13,842,090 |
| Realized and Unrealized Gain (Loss) | | |
| Net realized gain (loss) on: | | |
| Investment securities:�� | | |
| Unaffiliated issuers (net of foreign taxes of $13,974) | 33,692,631 | |
| Fidelity Central Funds | (277) | |
| Foreign currency transactions | (79,683) | |
| Total net realized gain (loss) | | 33,612,671 |
| Change in net unrealized appreciation (depreciation) on: | | |
| Unaffiliated issuers (net of increase in deferred foreign taxes of $263,690) | (80,931,370) | |
| Fidelity Central Funds | (4,805) | |
| Assets and liabilities in foreign currencies | 505 | |
| Total change in net unrealized appreciation (depreciation) | | (80,935,670) |
| Net gain (loss) | | (47,322,999) |
| Net increase (decrease) in net assets resulting from operations | | $(33,480,909) |
See accompanying notes which are an integral part of the financial statements.
Statement of Changes in Net Assets
| | Year ended February 28, 2018 | Year ended February 28, 2017 |
| Increase (Decrease) in Net Assets | | |
| Operations | | |
| Net investment income (loss) | $13,842,090 | $2,893,695 |
| Net realized gain (loss) | 33,612,671 | 18,115,373 |
| Change in net unrealized appreciation (depreciation) | (80,935,670) | 176,626,416 |
| Net increase (decrease) in net assets resulting from operations | (33,480,909) | 197,635,484 |
| Distributions to shareholders from net investment income | (12,904,948) | (3,359,511) |
| Distributions to shareholders from net realized gain | (719,094) | (2,074,553) |
| Total distributions | (13,624,042) | (5,434,064) |
| Share transactions | | |
| Proceeds from sales of shares | 293,810,856 | 495,662,532 |
| Reinvestment of distributions | 13,165,643 | 5,196,216 |
| Cost of shares redeemed | (261,241,461) | (243,885,913) |
| Net increase (decrease) in net assets resulting from share transactions | 45,735,038 | 256,972,835 |
| Redemption fees | 13,793 | 46,019 |
| Total increase (decrease) in net assets | (1,356,120) | 449,220,274 |
| Net Assets | | |
| Beginning of period | 912,089,596 | 462,869,322 |
| End of period | $910,733,476 | $912,089,596 |
| Other Information | | |
| Distributions in excess of net investment income end of period | $(1,256,817) | $(772,686) |
| Shares | | |
| Sold | 10,604,222 | 18,462,591 |
| Issued in reinvestment of distributions | 472,915 | 185,868 |
| Redeemed | (9,288,677) | (8,562,319) |
| Net increase (decrease) | 1,788,460 | 10,086,140 |
See accompanying notes which are an integral part of the financial statements.
Financial Highlights
Natural Resources Portfolio
| | | | | | |
| Years ended February 28, | 2018 | 2017 | 2016 A | 2015 | 2014 |
| Selected Per–Share Data | | | | | |
| Net asset value, beginning of period | $29.13 | $21.80 | $31.49 | $37.85 | $34.10 |
| Income from Investment Operations | | | | | |
| Net investment income (loss)B | .43C | .10 | .18 | .21 | .20 |
| Net realized and unrealized gain (loss) | (1.64) | 7.42 | (9.69) | (4.55) | 4.52 |
| Total from investment operations | (1.21) | 7.52 | (9.51) | (4.34) | 4.72 |
| Distributions from net investment income | (.39) | (.11) | (.18) | (.15) | (.10) |
| Distributions from net realized gain | (.02) | (.08) | – | (1.87) | (.88) |
| Total distributions | (.41) | (.19) | (.18) | (2.02) | (.97)D |
| Redemption fees added to paid in capitalB,E | – | – | – | – | – |
| Net asset value, end of period | $27.51 | $29.13 | $21.80 | $31.49 | $37.85 |
| Total ReturnF | (4.16)% | 34.54% | (30.22)% | (11.45)% | 13.97% |
| Ratios to Average Net AssetsG,H | | | | | |
| Expenses before reductions | .83% | .84% | .86% | .82% | .84% |
| Expenses net of fee waivers, if any | .83% | .84% | .86% | .82% | .84% |
| Expenses net of all reductions | .82% | .83% | .85% | .82% | .83% |
| Net investment income (loss) | 1.54%C | .35% | .66% | .55% | .54% |
| Supplemental Data | | | | | |
| Net assets, end of period (000 omitted) | $910,733 | $912,090 | $462,869 | $761,078 | $949,394 |
| Portfolio turnover rateI | 78% | 84% | 78% | 87% | 99% |
A For the year ended February 29.
B Calculated based on average shares outstanding during the period.
C Net Investment income per share reflects a large, non-recurring dividend which amounted to $.31 per share. Excluding this non-recurring dividend, the ratio of net investment income (loss) to average net assets would have been .41%.
D Total distributions of $.97 per share is comprised of distributions from net investment income of $.095 and distributions from net realized gain of $.877 per share.
E Amount represents less than $.005 per share.
F Total returns would have been lower if certain expenses had not been reduced during the applicable periods shown.
G Fees and expenses of any underlying Fidelity Central Funds are not included in the Fund's expense ratio. The Fund indirectly bears its proportionate share of the expenses of any underlying Fidelity Central Funds.
H Expense ratios reflect operating expenses of the Fund. Expenses before reductions do not reflect amounts reimbursed by the investment adviser or reductions from brokerage service arrangements or reductions from other expense offset arrangements and do not represent the amount paid by the Fund during periods when reimbursements or reductions occur. Expenses net of fee waivers reflect expenses after reimbursement by the investment adviser but prior to reductions from brokerage service arrangements or other expense offset arrangements. Expenses net of all reductions represent the net expenses paid by the Fund.
I Amount does not include the portfolio activity of any underlying Fidelity Central Funds.
See accompanying notes which are an integral part of the financial statements.
Notes to Financial Statements
For the period ended February 28, 2018
1. Organization.
Energy Portfolio, Energy Service Portfolio, Natural Gas Portfolio, and Natural Resources Portfolio (the Funds) are non-diversified funds of Fidelity Select Portfolios (the Trust). The Trust is registered under the Investment Company Act of 1940, as amended (the 1940 Act), as an open-end management investment company organized as a Massachusetts business trust. Effective January 1, 2018, Natural Resources Portfolio has changed from diversified to non-diversified. The Funds invest primarily in securities of companies whose principal business activities fall within specific industries. Each Fund is authorized to issue an unlimited number of shares. Share transactions on the Statement of Changes in Net Assets may contain exchanges between affiliated funds. The Natural Resources Portfolio may also invest in certain precious metals. Certain Funds investments in emerging markets can be subject to social, economic, regulatory, and political uncertainties and can be extremely volatile.
2. Investments in Fidelity Central Funds.
The Funds invest in Fidelity Central Funds, which are open-end investment companies generally available only to other investment companies and accounts managed by the investment adviser and its affiliates. The Funds' Schedules of Investments list each of the Fidelity Central Funds held as of period end, if any, as an investment of each Fund, but does not include the underlying holdings of each Fidelity Central Fund. As an Investing Fund, each Fund indirectly bears its proportionate share of the expenses of the underlying Fidelity Central Funds.
The Money Market Central Funds seek preservation of capital and current income and are managed by Fidelity Investments Money Management, Inc. (FIMM), an affiliate of the investment adviser. Annualized expenses of the Money Market Central Funds as of their most recent shareholder report date are less than .005%.
A complete unaudited list of holdings for each Fidelity Central Fund is available upon request or at the Securities and Exchange Commission (the SEC) website at www.sec.gov. In addition, the financial statements of the Fidelity Central Funds, which are not covered by the Funds' Report of Independent Registered Public Accounting Firm, are available on the SEC website or upon request.
3. Significant Accounting Policies.
Each Fund is an investment company and applies the accounting and reporting guidance of the Financial Accounting Standards Board (FASB) Accounting Standards Codification Topic 946 Financial Services – Investments Companies. The financial statements have been prepared in conformity with accounting principles generally accepted in the United States of America (GAAP), which require management to make certain estimates and assumptions at the date of the financial statements. Actual results could differ from those estimates. Subsequent events, if any, through the date that the financial statements were issued have been evaluated in the preparation of the financial statements. The following summarizes the significant accounting policies of the Funds:
Investment Valuation. Investments are valued as of 4:00 p.m. Eastern time on the last calendar day of the period. The Board of Trustees (the Board) has delegated the day to day responsibility for the valuation of each Fund's investments to the Fair Value Committee (the Committee) established by each Fund's investment adviser. In accordance with valuation policies and procedures approved by the Board, each Fund attempts to obtain prices from one or more third party pricing vendors or brokers to value its investments. When current market prices, quotations or currency exchange rates are not readily available or reliable, investments will be fair valued in good faith by the Committee, in accordance with procedures adopted by the Board. Factors used in determining fair value vary by investment type and may include market or investment specific events. The frequency with which these procedures are used cannot be predicted and they may be utilized to a significant extent. The Committee oversees each Fund's valuation policies and procedures and reports to the Board on the Committee's activities and fair value determinations. The Board monitors the appropriateness of the procedures used in valuing each Fund's investments and ratifies the fair value determinations of the Committee.
Each Fund categorizes the inputs to valuation techniques used to value its investments into a disclosure hierarchy consisting of three levels as shown below:
- Level 1 – quoted prices in active markets for identical investments
- Level 2 – other significant observable inputs (including quoted prices for similar investments, interest rates, prepayment speeds, etc.)
- Level 3 – unobservable inputs (including the Fund's own assumptions based on the best information available)
Valuation techniques used to value each Fund's investments by major category are as follows:
Equity securities, including restricted securities, for which market quotations are readily available, are valued at the last reported sale price or official closing price as reported by a third party pricing vendor on the primary market or exchange on which they are traded and are categorized as Level 1 in the hierarchy. In the event there were no sales during the day or closing prices are not available, securities are valued at the last quoted bid price or may be valued using the last available price and are generally categorized as Level 2 in the hierarchy. For foreign equity securities, when market or security specific events arise, comparisons to the valuation of American Depositary Receipts (ADRs), futures contracts, Exchange-Traded Funds (ETFs) and certain indexes as well as quoted prices for similar securities may be used and would be categorized as Level 2 in the hierarchy. Utilizing these techniques may result in transfers between Level 1 and Level 2. For equity securities, including restricted securities, where observable inputs are limited, assumptions about market activity and risk are used and these securities may be categorized as Level 3 in the hierarchy.
Investments in open-end mutual funds, including the Fidelity Central Funds, are valued at their closing net asset value (NAV) each business day and are categorized as Level 1 in the hierarchy.
Changes in valuation techniques may result in transfers in or out of an assigned level within the disclosure hierarchy. The aggregate value of investments by input level as of February 28, 2018, including information on transfers between Levels 1 and 2, is included at the end of each applicable Fund's Schedule of Investments.
Foreign Currency. The Funds may use foreign currency contracts to facilitate transactions in foreign-denominated securities. Gains and losses from these transactions may arise from changes in the value of the foreign currency or if the counterparties do not perform under the contracts' terms.
Foreign-denominated assets, including investment securities, and liabilities are translated into U.S. dollars at the exchange rates at period end. Purchases and sales of investment securities, income and dividends received and expenses denominated in foreign currencies are translated into U.S. dollars at the exchange rate in effect on the transaction date.
The effects of exchange rate fluctuations on investments are included with the net realized and unrealized gain (loss) on investment securities. Other foreign currency transactions resulting in realized and unrealized gain (loss) are disclosed separately.
Investment Transactions and Income. For financial reporting purposes, the Funds' investment holdings and NAV include trades executed through the end of the last business day of the period. The NAV per share for processing shareholder transactions is calculated as of the close of business of the New York Stock Exchange (NYSE), normally 4:00 p.m. Eastern time and includes trades executed through the end of the prior business day. Gains and losses on securities sold are determined on the basis of identified cost and includes proceeds received from litigation. Dividend income is recorded on the ex-dividend date, except for certain dividends from foreign securities where the ex-dividend date may have passed, which are recorded as soon as the Funds are informed of the ex-dividend date. Non-cash dividends included in dividend income, if any, are recorded at the fair market value of the securities received. Income and capital gain distributions from Fidelity Central Funds, if any, are recorded on the ex-dividend date. Certain distributions received by the Funds represent a return of capital or capital gain. The Funds determine the components of these distributions subsequent to the ex-dividend date, based upon receipt of tax filings or other correspondence relating to the underlying investment. These distributions are recorded as a reduction of cost of investments and/or as a realized gain. Large, non-recurring dividends recognized by the Funds are presented separately on the Statement of Operations as "Special Dividends" and the impact of these dividends is presented in the Financial Highlights. Investment income is recorded net of foreign taxes withheld where recovery of such taxes is uncertain.
Expenses. Expenses directly attributable to a fund are charged to that fund. Expenses attributable to more than one fund are allocated among the respective funds on the basis of relative net assets or other appropriate methods. Expense estimates are accrued in the period to which they relate and adjustments are made when actual amounts are known.
Deferred Trustee Compensation. Under a Deferred Compensation Plan (the Plan) for the Funds, independent Trustees may elect to defer receipt of a portion of their annual compensation. Deferred amounts are invested in a cross-section of Fidelity funds, are marked-to-market and remain in the Fund until distributed in accordance with the Plan. The investment of deferred amounts and the offsetting payable to the Trustees are included in the accompanying Statement of Assets and Liabilities.
Income Tax Information and Distributions to Shareholders. Each year, each Fund intends to qualify as a regulated investment company under Subchapter M of the Internal Revenue Code, including distributing substantially all of its taxable income and realized gains. As a result, no provision for U.S. Federal income taxes is required. As of February 28, 2018, each Fund did not have any unrecognized tax benefits in the financial statements; nor is each Fund aware of any tax positions for which it is reasonably possible that the total amounts of unrecognized tax benefits will significantly change in the next twelve months. Each Fund files a U.S. federal tax return, in addition to state and local tax returns as required. Each Fund's federal income tax returns are subject to examination by the Internal Revenue Service (IRS) for a period of three fiscal years after they are filed. State and local tax returns may be subject to examination for an additional fiscal year depending on the jurisdiction. Foreign taxes are provided for based on each Fund's understanding of the tax rules and rates that exist in the foreign markets in which it invests. An estimated deferred tax liability for net unrealized appreciation on the applicable securities is included in Other payables and accrued expenses on each applicable Fund's Statement of Assets & Liabilities.
Distributions are declared and recorded on the ex-dividend date. Income and capital gain distributions are determined in accordance with income tax regulations, which may differ from GAAP. In addition, certain Funds claimed a portion of the payment made to redeeming shareholders as a distribution for income tax purposes.
Capital accounts within the financial statements are adjusted for permanent book-tax differences. These adjustments have no impact on net assets or the results of operations. Capital accounts are not adjusted for temporary book-tax differences which will reverse in a subsequent period.
Book-tax differences are primarily due to foreign currency transactions, certain foreign taxes, certain deemed distributions, passive foreign investment companies (PFIC), partnerships, deferred trustees compensation, capital loss carryforwards, expiring capital loss carryforwards, and losses deferred due to wash sales and excise tax regulations.
As of period end, the cost and unrealized appreciation (depreciation) in securities, and derivatives if applicable, for federal income tax purposes were as follows for each Fund:
| | Tax cost | Gross unrealized appreciation | Gross unrealized depreciation | Net unrealized appreciation (depreciation) |
| Energy Portfolio | $1,598,650,187 | $318,205,078 | $(118,534,594) | $199,670,484 |
| Energy Service Portfolio | 501,378,644 | 47,260,814 | (105,560,719) | (58,299,905) |
| Natural Gas Portfolio | 352,470,952 | 4,650,096 | (114,144,724) | (109,494,628) |
| Natural Resources Portfolio | 899,822,530 | 112,198,688 | (83,733,269) | 28,465,419 |
The tax-based components of distributable earnings as of period end were as follows for each Fund:
| | Undistributed ordinary income | Capital loss carryforward | Net unrealized appreciation (depreciation) on securities and other investments |
| Energy Portfolio | $– | $(329,951,724) | $196,685,454 |
| Energy Service Portfolio | – | (97,854,477) | (60,149,946) |
| Natural Gas Portfolio | 1,245,751 | (443,935,891) | (114,099,838) |
| Natural Resources Portfolio | 419,227 | (145,952,764) | 26,874,784 |
Capital loss carryforwards are only available to offset future capital gains of the Funds to the extent provided by regulations and may be limited. Under the Regulated Investment Company Modernization Act of 2010 (the Act), the Funds are permitted to carry forward capital losses incurred in taxable years beginning after December 22, 2010 for an unlimited period and such capital losses are required to be used prior to any losses that expire. The capital loss carryforward information presented below, including any applicable limitation, is estimated as of fiscal period end and is subject to adjustment.
| | Fiscal year of expiration |
| | 2019 |
| Natural Gas Portfolio | $(215,752,708) |
| | No expiration | | | |
| | Short-term | Long-term | Total no expiration | Total capital loss carryfoward |
| Energy Portfolio | $(217,837,105) | $(112,114,619) | $(329,951,724) | $(329,951,724) |
| Energy Service Portfolio | (24,382,712) | (73,471,765) | (97,854,477) | (97,854,477) |
| Natural Gas Portfolio | (62,916,685) | (165,266,498) | (228,183,183) | (443,935,891) |
| Natural Resources Portfolio | (65,548,621) | (80,404,143) | (145,952,764) | (145,952,764) |
The tax character of distributions paid was as follows:
| February 28, 2018 | | |
| | Ordinary Income | Total |
| Energy Portfolio | $35,170,840 | $35,170,840 |
| Energy Service Portfolio | 29,253,083 | 29,253,083 |
| Natural Gas Portfolio | 11,814,523 | 11,814,523 |
| Natural Resources Portfolio | 13,624,042 | 13,624,042 |
| February 28, 2017 | | |
| | Ordinary Income | Total |
| Energy Portfolio | $16,227,405 | $16,227,405 |
| Energy Service Portfolio | 2,569,509 | 2,569,509 |
| Natural Gas Portfolio | 3,106,750 | 3,106,750 |
| Natural Resources Portfolio | 5,434,064 | 5,434,064 |
Trading (Redemption) Fees. Shares held by investors in Energy Service Portfolio, Natural Gas Portfolio, and Natural Resources Portfolio less than 30 days may be subject to a redemption fee equal to .75% of the NAV of shares redeemed. All redemption fees, which reduce the proceeds of the shareholder redemption, are retained by the Funds and accounted for as an addition to paid in capital. In November 2017, the Board of Trustees approved the elimination of these redemption fees effective December 18, 2017.
Restricted Securities. The Funds may invest in securities that are subject to legal or contractual restrictions on resale. These securities generally may be resold in transactions exempt from registration or to the public if the securities are registered. Disposal of these securities may involve time-consuming negotiations and expense, and prompt sale at an acceptable price may be difficult. Information regarding restricted securities is included at the end of each applicable Fund's Schedule of Investments.
4. Purchases and Sales of Investments.
Purchases and sales of securities, other than short-term securities, are noted in the table below.
| | Purchases ($) | Sales ($) |
| Energy Portfolio | 1,156,331,296 | 1,495,875,153 |
| Energy Service Portfolio | 322,715,915 | 508,575,767 |
| Natural Gas Portfolio | 217,890,624 | 380,320,988 |
| Natural Resources Portfolio | 747,853,356 | 699,580,166 |
5. Fees and Other Transactions with Affiliates.
Management Fee. Fidelity SelectCo, LLC (the investment adviser) and its affiliates provide the Funds with investment management related services for which the Funds pay a monthly management fee. The management fee is the sum of an individual fund fee rate and an annualized group fee rate. The individual fund fee rate is applied to each Fund's average net assets. The group fee rate is based upon the average net assets of all the mutual funds advised by Fidelity Management & Research Company (FMR) and the investment adviser. The group fee rate decreases as assets under management increase and increases as assets under management decrease. For the reporting period, each Fund's annual management fee rate expressed as a percentage of each Fund's average net assets was as follows:
| | Individual Rate | Group Rate | Total |
| Energy Portfolio | .30% | .24% | .54% |
| Energy Service Portfolio | .30% | .24% | .54% |
| Natural Gas Portfolio | .30% | .24% | .54% |
| Natural Resources Portfolio | .30% | .24% | .54% |
Transfer Agent Fees. Fidelity Investments Institutional Operations Company, Inc. (FIIOC), an affiliate of the investment adviser, is the Funds' transfer, dividend disbursing and shareholder servicing agent. FIIOC receives account fees and asset-based fees that vary according to account size and type of account. FIIOC pays for typesetting, printing and mailing of shareholder reports, except proxy statements. For the period, transfer agent fees were equivalent to the following annual rates expressed as a percentage of average net assets:
| Energy Portfolio | .20% |
| Energy Service Portfolio | .22% |
| Natural Gas Portfolio | .26% |
| Natural Resources Portfolio | .23% |
Accounting and Security Lending Fees. Fidelity Service Company, Inc. (FSC), an affiliate of the investment adviser, maintains each Fund's accounting records. The accounting fee is based on the level of average net assets for each month. Under a separate contract, FSC administers the security lending program. The security lending fee is based on the number and duration of lending transactions.
Brokerage Commissions. Certain Funds placed a portion of their portfolio transactions with brokerage firms which are affiliates of the investment adviser. Brokerage commissions are included in net realized gain (loss) and change in net unrealized appreciation (depreciation) in the Statement of Operations. The commissions paid to these affiliated firms were as follows:
| | Amount |
| Energy Portfolio | $42,446 |
| Energy Service Portfolio | 16,105 |
| Natural Gas Portfolio | 19,180 |
| Natural Resources Portfolio | 26,549 |
Interfund Lending Program. Pursuant to an Exemptive Order issued by the SEC, the Funds, along with other registered investment companies having management contracts with Fidelity Management & Research Company (FMR) or other affiliated entities of FMR, may participate in an interfund lending program. This program provides an alternative credit facility allowing the funds to borrow from, or lend money to, other participating affiliated funds. At period end, there were no interfund loans outstanding. Each applicable fund's activity in this program during the period for which loans were outstanding was as follows:
| | Borrower or Lender | Average Loan Balance | Weighted Average Interest Rate | Interest Expense |
| Energy Portfolio | Borrower | $5,515,143 | .97% | $1,039 |
| Energy Service Portfolio | Borrower | $7,018,222 | .86% | $3,017 |
| Natural Gas Portfolio | Borrower | $3,225,118 | 1.09% | $1,664 |
| Natural Resources Portfolio | Borrower | $6,228,250 | 1.60% | $3,329 |
Interfund Trades. The Funds may purchase from or sell securities to other Fidelity Funds under procedures adopted by the Board. The procedures have been designed to ensure these interfund trades are executed in accordance with Rule 17a-7 of the 1940 Act. Interfund trades are included within the respective purchases and sales amounts shown in the Purchases and Sales of Investments note.
Prior Fiscal Year Redemptions In-Kind. During the prior period, 3,526,343 shares of Energy Portfolio held by an affiliated entity were redeemed in-kind for investments and cash with a value of $146,061,109. The Fund had a net realized gain of $45,915,372 on investments delivered through in-kind redemptions. The amount of in-kind redemptions is included in share transactions in the accompanying Statement of Changes in Net Assets. Energy Portfolio recognized no gain or loss for federal income tax purposes.
6. Committed Line of Credit.
Certain Funds participate with other funds managed by the investment adviser or an affiliate in a $4.25 billion credit facility (the "line of credit") to be utilized for temporary or emergency purposes to fund shareholder redemptions or for other short-term liquidity purposes. The participating funds have agreed to pay commitment fees on their pro-rata portion of the line of credit, which are reflected in Miscellaneous expenses on the Statement of Operations, and are as follows:
| Energy Portfolio | $6,380 |
| Energy Service Portfolio | 1,789 |
| Natural Gas Portfolio | 1,165 |
| Natural Resources Portfolio | 2,757 |
During the period, the Funds did not borrow on this line of credit.
7. Security Lending.
Certain Funds lend portfolio securities through a lending agent from time to time in order to earn additional income. On the settlement date of the loan, each applicable Fund receives collateral (in the form of U.S. Treasury obligations, letters of credit and/or cash) against the loaned securities and maintains collateral in an amount not less than 100% of the market value of the loaned securities during the period of the loan. The market value of the loaned securities is determined at the close of business of the Funds and any additional required collateral is delivered to the Funds on the next business day. The Funds or borrower may terminate the loan at any time, and if the borrower defaults on its obligation to return the securities loaned because of insolvency or other reasons, the Funds may apply collateral received from the borrower against the obligation. The Funds may experience delays and costs in recovering the securities loaned. Any cash collateral received is invested in the Fidelity Securities Lending Cash Central Fund. The value of loaned securities and cash collateral at period end are disclosed on each applicable Fund's Statement of Assets and Liabilities. Security lending income represents the income earned on investing cash collateral, less rebates paid to borrowers and any lending agent fees associated with the loan, plus any premium payments received for lending certain types of securities. Security lending income is presented on each applicable Fund's Statement of Operations as a component of income from Fidelity Central Funds.
8. Bank Borrowings.
Each Fund is permitted to have bank borrowings for temporary or emergency purposes to fund shareholder redemptions or for other short-term liquidity requirements. Each Fund has established borrowing arrangements with certain banks. The interest rate on the borrowings is the bank's base rate, as revised from time to time. At period end, there were no bank borrowings outstanding. Each applicable Fund's activity in this program during the period for which loans were outstanding was as follows:
| | Average Loan Balance | Weighted Average Interest Rate | Interest Expense |
| Natural Resources Portfolio | $3,238,727 | 1.92% | $1,900 |
9. Expense Reductions.
Commissions paid to certain brokers with whom the investment adviser, or its affiliates, places trades on behalf of Certain Funds include an amount in addition to trade execution, which may be rebated back to the Funds to offset certain expenses. In addition, through arrangements with each applicable Fund's custodian, credits realized as a result of certain uninvested cash balances were used to reduce each applicable Fund's expenses. All of the applicable expense reductions are noted in the table below.
| | Brokerage Service reduction | Custody expense reduction |
| Energy Portfolio | $197,535 | $2,475 |
| Energy Service Portfolio | 97,329 | – |
| Natural Gas Portfolio | 34,101 | – |
| Natural Resources Portfolio | 72,834 | 1,429 |
In addition, during the period the investment adviser reimbursed and/or waived a portion of operating expenses as follows:
| | Amount |
| Energy Portfolio | $21,639 |
| Energy Service Portfolio | 5,058 |
| Natural Gas Portfolio | 4,036 |
| Natural Resources Portfolio | 9,222 |
10. Other.
The Funds' organizational documents provide former and current trustees and officers with a limited indemnification against liabilities arising in connection with the performance of their duties to the Funds. In the normal course of business, the Funds may also enter into contracts that provide general indemnifications. The Funds' maximum exposure under these arrangements is unknown as this would be dependent on future claims that may be made against the Funds. The risk of material loss from such claims is considered remote.
At the end of the period, the following mutual funds managed by the investment adviser or its affiliates were the owners of record of 10% or more of the total outstanding shares of the following Fund:
| | Strategic Advisers Value Fund |
| Energy Portfolio | 10% |
Mutual funds managed by the investment adviser or its affiliates, in aggregate, were the owners of record of more than 20% of the total outstanding shares of the following Fund:
| Fund | % of shares held |
| Energy Portfolio | 23% |
Report of Independent Registered Public Accounting Firm
To the Trustees of Fidelity Select Portfolios and the Shareholders of Energy Portfolio, Energy Service Portfolio, Natural Gas Portfolio and Natural Resources Portfolio:
Opinions on the Financial Statements
We have audited the accompanying statements of assets and liabilities, including the schedules of investments, of Energy Portfolio, Energy Service Portfolio, Natural Gas Portfolio and Natural Resources Portfolio (four of the funds constituting Fidelity Select Portfolios, hereafter collectively referred to as the "Funds") as of February 28, 2018, the related statements of operations for the year ended February 28, 2018, the statements of changes in net assets for each of the two years in the period ended February 28, 2018, including the related notes, and the financial highlights for each of the five years in the period ended February 28, 2018 (collectively referred to as the “financial statements”). In our opinion, the financial statements present fairly, in all material respects, the financial position of each of the Funds as of February 28, 2018, the results of each of their operations for the year then ended, the changes in each of their net assets for each of the two years in the period ended February 28, 2018 and each of the financial highlights for each of the five years in the period ended February 28, 2018 in conformity with accounting principles generally accepted in the United States of America.
Basis for Opinions
These financial statements are the responsibility of the Funds' management. Our responsibility is to express an opinion on the Funds' financial statements based on our audits. We are a public accounting firm registered with the Public Company Accounting Oversight Board (United States) (“PCAOB”) and are required to be independent with respect to the Funds in accordance with the U.S. federal securities laws and the applicable rules and regulations of the Securities and Exchange Commission and the PCAOB.
We conducted our audits of these financial statements in accordance with the standards of the PCAOB. Those standards require that we plan and perform the audit to obtain reasonable assurance about whether the financial statements are free of material misstatement, whether due to error or fraud.
Our audits included performing procedures to assess the risks of material misstatement of the financial statements, whether due to error or fraud, and performing procedures that respond to those risks. Such procedures included examining, on a test basis, evidence regarding the amounts and disclosures in the financial statements. Our audits also included evaluating the accounting principles used and significant estimates made by management, as well as evaluating the overall presentation of the financial statements. Our procedures included confirmation of securities owned as of February 28, 2018 by correspondence with the custodian and brokers; when replies were not received from brokers, we performed other auditing procedures. We believe that our audits provided a reasonable basis for our opinions.
PricewaterhouseCoopers LLP
Boston, Massachusetts
April 13, 2018
We have served as the auditor of one or more investment companies in the Fidelity group of funds since 1932.
Trustees and Officers
The Trustees, Members of the Advisory Board (if any), and officers of the trust and funds, as applicable, are listed below. The Board of Trustees governs each fund and is responsible for protecting the interests of shareholders. The Trustees are experienced executives who meet periodically throughout the year to oversee each fund's activities, review contractual arrangements with companies that provide services to each fund, oversee management of the risks associated with such activities and contractual arrangements, and review each fund's performance. Except for Michael E. Wiley, each of the Trustees oversees 281 funds. Wiley oversees 193 funds.
The Trustees hold office without limit in time except that (a) any Trustee may resign; (b) any Trustee may be removed by written instrument, signed by at least two-thirds of the number of Trustees prior to such removal; (c) any Trustee who requests to be retired or who has become incapacitated by illness or injury may be retired by written instrument signed by a majority of the other Trustees; and (d) any Trustee may be removed at any special meeting of shareholders by a two-thirds vote of the outstanding voting securities of the trust. Each Trustee who is not an interested person (as defined in the 1940 Act) of the trust and the funds is referred to herein as an Independent Trustee. Each Independent Trustee shall retire not later than the last day of the calendar year in which his or her 75th birthday occurs. The Independent Trustees may waive this mandatory retirement age policy with respect to individual Trustees. Officers and Advisory Board Members hold office without limit in time, except that any officer or Advisory Board Member may resign or may be removed by a vote of a majority of the Trustees at any regular meeting or any special meeting of the Trustees. Except as indicated, each individual has held the office shown or other offices in the same company for the past five years.
Each fund’s Statement of Additional Information (SAI) includes more information about the Trustees. To request a free copy, call Fidelity at 1-800-544-8544.
Experience, Skills, Attributes, and Qualifications of the Trustees. The Governance and Nominating Committee has adopted a statement of policy that describes the experience, qualifications, attributes, and skills that are necessary and desirable for potential Independent Trustee candidates (Statement of Policy). The Board believes that each Trustee satisfied at the time he or she was initially elected or appointed a Trustee, and continues to satisfy, the standards contemplated by the Statement of Policy. The Governance and Nominating Committee also engages professional search firms to help identify potential Independent Trustee candidates who have the experience, qualifications, attributes, and skills consistent with the Statement of Policy. From time to time, additional criteria based on the composition and skills of the current Independent Trustees, as well as experience or skills that may be appropriate in light of future changes to board composition, business conditions, and regulatory or other developments, have also been considered by the professional search firms and the Governance and Nominating Committee. In addition, the Board takes into account the Trustees' commitment and participation in Board and committee meetings, as well as their leadership of standing and ad hoc committees throughout their tenure.
In determining that a particular Trustee was and continues to be qualified to serve as a Trustee, the Board has considered a variety of criteria, none of which, in isolation, was controlling. The Board believes that, collectively, the Trustees have balanced and diverse experience, qualifications, attributes, and skills, which allow the Board to operate effectively in governing each fund and protecting the interests of shareholders. Information about the specific experience, skills, attributes, and qualifications of each Trustee, which in each case led to the Board's conclusion that the Trustee should serve (or continue to serve) as a trustee of the funds, is provided below.
Board Structure and Oversight Function. James C. Curvey is an interested person and currently serves as Chairman. The Trustees have determined that an interested Chairman is appropriate and benefits shareholders because an interested Chairman has a personal and professional stake in the quality and continuity of services provided to the funds. Independent Trustees exercise their informed business judgment to appoint an individual of their choosing to serve as Chairman, regardless of whether the Trustee happens to be independent or a member of management. The Independent Trustees have determined that they can act independently and effectively without having an Independent Trustee serve as Chairman and that a key structural component for assuring that they are in a position to do so is for the Independent Trustees to constitute a substantial majority for the Board. The Independent Trustees also regularly meet in executive session. Ned C. Lautenbach serves as Chairman of the Independent Trustees and as such (i) acts as a liaison between the Independent Trustees and management with respect to matters important to the Independent Trustees and (ii) with management prepares agendas for Board meetings.
Fidelity® funds are overseen by different Boards of Trustees. The funds' Board oversees Fidelity's high income and certain equity funds, and other Boards oversee Fidelity's investment-grade bond, money market, asset allocation, and other equity funds. The asset allocation funds may invest in Fidelity® funds overseen by the funds' Board. The use of separate Boards, each with its own committee structure, allows the Trustees of each group of Fidelity® funds to focus on the unique issues of the funds they oversee, including common research, investment, and operational issues. On occasion, the separate Boards establish joint committees to address issues of overlapping consequences for the Fidelity® funds overseen by each Board.
The Trustees operate using a system of committees to facilitate the timely and efficient consideration of all matters of importance to the Trustees, each fund, and fund shareholders and to facilitate compliance with legal and regulatory requirements and oversight of the funds' activities and associated risks. The Board, acting through its committees, has charged SelectCo and its affiliates with (i) identifying events or circumstances the occurrence of which could have demonstrably adverse effects on the funds' business and/or reputation; (ii) implementing processes and controls to lessen the possibility that such events or circumstances occur or to mitigate the effects of such events or circumstances if they do occur; and (iii) creating and maintaining a system designed to evaluate continuously business and market conditions in order to facilitate the identification and implementation processes described in (i) and (ii) above. Because the day-to-day operations and activities of the funds are carried out by or through SelectCo, its affiliates, and other service providers, the funds' exposure to risks is mitigated but not eliminated by the processes overseen by the Trustees. While each of the Board's committees has responsibility for overseeing different aspects of the funds' activities, oversight is exercised primarily through the Operations, Audit, and Compliance Committees. In addition, the Independent Trustees have worked with Fidelity to enhance the Board's oversight of investment and financial risks, legal and regulatory risks, technology risks, and operational risks, including the development of additional risk reporting to the Board. Appropriate personnel, including but not limited to the funds' Chief Compliance Officer (CCO), SelectCo's internal auditor, the independent accountants, the funds' Treasurer and portfolio management personnel, make periodic reports to the Board's committees, as appropriate, including an annual review of Fidelity's risk management program for the Fidelity® funds. The responsibilities of each standing committee, including their oversight responsibilities, are described further under "Standing Committees of the Trustees."
Interested Trustees*:
Correspondence intended for a Trustee who is an interested person may be sent to Fidelity Investments, 245 Summer Street, Boston, Massachusetts 02210.
Name, Year of Birth; Principal Occupations and Other Relevant Experience+
James C. Curvey (1935)
Year of Election or Appointment: 2018
Trustee
Chairman of the Board of Trustees
Mr. Curvey also serves as Trustee of other Fidelity® funds. Mr. Curvey is a Director of Fidelity Research & Analysis Co. (investment adviser firm, 2009-present), and Vice Chairman (2007-present) and Director of FMR LLC (diversified financial services company). In addition, Mr. Curvey serves as an Overseer for the Boston Symphony Orchestra and a member of the board of Artis-Naples, Naples, Florida, and as a Trustee for Brewster Academy, Wolfeboro, New Hampshire. Previously, Mr. Curvey served as a Director of Fidelity Investments Money Management, Inc. (investment adviser firm, 2009-2014) and a Director of FMR and FMR Co., Inc. (investment adviser firms, 2007-2014).
Charles S. Morrison (1960)
Year of Election or Appointment: 2018
Trustee
Mr. Morrison also serves as Trustee of other funds. He serves as President of Fidelity SelectCo, LLC (investment adviser firm, 2017-present) and Fidelity Management & Research Company (FMR) (investment adviser firm, 2016-present), a Director of Fidelity Investments Money Management, Inc. (FIMM) (investment adviser firm, 2014-present), Director of Fidelity SelectCo, LLC (investment adviser firm, 2014-present), President, Asset Management (2014-present), and is an employee of Fidelity Investments. Previously, Mr. Morrison served as Vice President of Fidelity's Fixed Income and Asset Allocation Funds (2012-2014), President, Fixed Income (2011-2014), Vice President of Fidelity's Money Market Funds (2005-2009), President, Money Market Group Leader of FMR (investment adviser firm, 2009), and Senior Vice President, Money Market Group of FMR (2004-2009). Mr. Morrison also served as Vice President of Fidelity's Bond Funds (2002-2005), certain Balanced Funds (2002-2005), and certain Asset Allocation Funds (2002-2007), and as Senior Vice President (2002-2005) of Fidelity's Bond Division.
* Determined to be an "Interested Trustee" by virtue of, among other things, his or her affiliation with the trust or various entities under common control with SelectCo.
+ The information includes the Trustee's principal occupation during the last five years and other information relating to the experience, attributes, and skills relevant to the Trustee's qualifications to serve as a Trustee, which led to the conclusion that the Trustee should serve as a Trustee for each fund.
Independent Trustees:
Correspondence intended for an Independent Trustee may be sent to Fidelity Investments, P.O. Box 55235, Boston, Massachusetts 02205-5235.
Name, Year of Birth; Principal Occupations and Other Relevant Experience+
Dennis J. Dirks (1948)
Year of Election or Appointment: 2018
Trustee
Mr. Dirks also serves as Trustee of other Fidelity® funds. Prior to his retirement in May 2003, Mr. Dirks was Chief Operating Officer and a member of the Board of The Depository Trust & Clearing Corporation (DTCC). He also served as President, Chief Operating Officer, and Board member of The Depository Trust Company (DTC) and President and Board member of the National Securities Clearing Corporation (NSCC). In addition, Mr. Dirks served as Chief Executive Officer and Board member of the Government Securities Clearing Corporation, Chief Executive Officer and Board member of the Mortgage-Backed Securities Clearing Corporation, as a Trustee and a member of the Finance Committee of Manhattan College (2005-2008), as a Trustee and a member of the Finance Committee of AHRC of Nassau County (2006-2008), as a member of the Independent Directors Council (IDC) Governing Council (2010-2015), and as a member of the Board of Directors for The Brookville Center for Children’s Services, Inc. (2009-2017). Mr. Dirks is a member of the Finance Committee (2016-present) and Board of Directors (2017-present) of the Asolo Repertory Theatre.
Donald F. Donahue (1950)
Year of Election or Appointment: 2018
Trustee
Mr. Donahue also serves as a Trustee of other Fidelity® funds. Mr. Donahue is President and Chief Executive Officer of Miranda Partners, LLC (risk consulting for the financial services industry, 2012-present). Previously, Mr. Donahue served as a Member of the Advisory Board of certain Fidelity® funds (2015-2018) and Chief Executive Officer (2006-2012), Chief Operating Officer (2003-2006), and Managing Director, Customer Marketing and Development (1999-2003) of The Depository Trust & Clearing Corporation (financial markets infrastructure). Mr. Donahue serves as a Member (2007-present) and Co-Chairman (2016-present) of the Board of Directors of United Way of New York, Member of the Board of Directors of NYC Leadership Academy (2012-present) and Member of the Board of Advisors of Ripple Labs, Inc. (financial services, 2015-present). He also served as Chairman (2010-2012) and Member of the Board of Directors (2012-2013) of Omgeo, LLC (financial services), Treasurer of United Way of New York (2012-2016), and Member of the Board of Directors of XBRL US (financial services non-profit, 2009-2012) and the International Securities Services Association (2009-2012).
Alan J. Lacy (1953)
Year of Election or Appointment: 2018
Trustee
Mr. Lacy also serves as Trustee of other Fidelity® funds. Mr. Lacy serves as a Director of Bristol-Myers Squibb Company (global pharmaceuticals, 2008-present). He is a Trustee of the California Chapter of The Nature Conservancy (2015-present) and a Director of the Center for Advanced Study in the Behavioral Sciences at Stanford University (2015-present). In addition, Mr. Lacy served as Senior Adviser (2007-2014) of Oak Hill Capital Partners, L.P. (private equity) and also served as Chief Executive Officer (2005) and Vice Chairman (2005-2006) of Sears Holdings Corporation (retail) and Chief Executive Officer and Chairman of the Board of Sears, Roebuck and Co. (retail, 2000-2005). Previously, Mr. Lacy served as Chairman (2014-2017) and a member (2010-2017) of the Board of Directors of Dave & Buster’s Entertainment, Inc. (restaurant and entertainment complexes), as Chairman (2008-2011) and a member (2006-2015) of the Board of Trustees of the National Parks Conservation Association, and as a member of the Board of Directors for The Hillman Companies, Inc. (hardware wholesalers, 2010-2014), Earth Fare, Inc. (retail grocery, 2010-2014), and The Western Union Company (global money transfer, 2006-2011).
Ned C. Lautenbach (1944)
Year of Election or Appointment: 2018
Trustee
Chairman of the Independent Trustees
Mr. Lautenbach also serves as Trustee of other Fidelity® funds. Mr. Lautenbach currently serves as Vice Chair of the Board of Governors, State University System of Florida (2013-present) and is a member of the Council on Foreign Relations (1994-present). He is also a member and has most recently served as Chairman of the Board of Directors of Artis-Naples (2012-present). Previously, Mr. Lautenbach served as a member and then Lead Director of the Board of Directors of Eaton Corporation (diversified industrial, 1997-2016). He was also a Partner and Advisory Partner at Clayton, Dubilier & Rice, LLC (private equity investment, 1998-2010), as well as a Director of Sony Corporation (2006-2007). In addition, Mr. Lautenbach also had a 30-year career with IBM (technology company) during which time he served as Senior Vice President and a member of the Corporate Executive Committee (1968-1998).
Joseph Mauriello (1944)
Year of Election or Appointment: 2018
Trustee
Mr. Mauriello also serves as Trustee of other Fidelity® funds. Prior to his retirement in January 2006, Mr. Mauriello served in numerous senior management positions including Deputy Chairman and Chief Operating Officer (2004-2005), and Vice Chairman of Financial Services (2002-2004) of KPMG LLP US (professional services, 1965-2005). Mr. Mauriello currently serves as a member of the Board of Directors of XL Group plc. (global insurance and re-insurance, 2006-present) and the Independent Directors Council (IDC) Governing Council (2015-present). Previously, Mr. Mauriello served as a Director of the Hamilton Funds of the Bank of New York (2006-2007) and of Arcadia Resources Inc. (health care services and products, 2007-2012).
Cornelia M. Small (1944)
Year of Election or Appointment: 2018
Trustee
Ms. Small also serves as Trustee of other Fidelity® funds. Ms. Small is a member of the Board of Directors (2009-present) and Chair of the Investment Committee (2010-present) of the Teagle Foundation. Ms. Small also serves on the Investment Committee of the Berkshire Taconic Community Foundation (2008-present). Previously, Ms. Small served as Chairperson (2002-2008) and a member of the Investment Committee and Chairperson (2008-2012) and a member of the Board of Trustees of Smith College. In addition, Ms. Small served as Chief Investment Officer, Director of Global Equity Investments, and a member of the Board of Directors of Scudder, Stevens & Clark and Scudder Kemper Investments.
Garnett A. Smith (1947)
Year of Election or Appointment: 2013
Trustee
Mr. Smith also serves as Trustee of other Fidelity® funds. Prior to Mr. Smith's retirement, he served as Chairman and Chief Executive Officer of Inbrand Corp. (manufacturer of personal absorbent products, 1990-1997). He also served as President (1986-1990) of Inbrand Corp. Prior to his employment with Inbrand Corp., he was employed by a retail fabric chain and North Carolina National Bank. In addition, Mr. Smith served as a Member of the Advisory Board of certain Fidelity® funds (2012-2013) and as a board member of the Jackson Hole Land Trust (2009-2012).
David M. Thomas (1949)
Year of Election or Appointment: 2018
Trustee
Mr. Thomas also serves as Trustee of other Fidelity® funds. Mr. Thomas serves as Non-Executive Chairman of the Board of Directors of Fortune Brands Home and Security (home and security products, 2011-present), as a member of the Board of Directors (2004-present) and Presiding Director (2013-present) of Interpublic Group of Companies, Inc. (marketing communication), and as a member of the Board of Trustees of the University of Florida (2013-present). Previously, Mr. Thomas served as Executive Chairman (2005-2006) and Chairman and Chief Executive Officer (2000-2005) of IMS Health, Inc. (pharmaceutical and healthcare information solutions), and a Director of Fortune Brands, Inc. (consumer products, 2000-2011).
Michael E. Wiley (1950)
Year of Election or Appointment: 2008
Trustee
Mr. Wiley also serves as Trustee or Member of the Advisory Board of other Fidelity® funds. Mr. Wiley serves as a Director of Andeavor Corporation (independent oil refiner and marketer, 2005-present), a Director of Andeavor Logistics LP (natural resources logistics, 2015-present), and a Director of Bill Barrett Corporation (exploration and production, 2005-present). In addition, Mr. Wiley also serves as a Director of Post Oak Bank (privately-held bank, 2004-present). Previously, Mr. Wiley served as a Trustee of other Fidelity® funds (2008-2013), as a Director of Asia Pacific Exploration Consolidated (international oil and gas exploration and production, 2008-2013), as a member of the Board of Trustees of the University of Tulsa (2000-2006; 2007-2010), as a Senior Energy Advisor of Katzenbach Partners, LLC (consulting, 2006-2007), as an Advisory Director of Riverstone Holdings (private investment), Chairman, President, and CEO of Baker Hughes, Inc. (oilfield services, 2000-2004), and as Director of Spinnaker Exploration Company (exploration and production, 2001-2005).
+ The information includes the Trustee's principal occupation during the last five years and other information relating to the experience, attributes, and skills relevant to the Trustee's qualifications to serve as a Trustee, which led to the conclusion that the Trustee should serve as a Trustee for each fund.
Advisory Board Members and Officers:
Correspondence intended for a Member of the Advisory Board (if any) may be sent to Fidelity Investments, P.O. Box 55235, Boston, Massachusetts 02205-5235. Correspondence intended for an officer or Peter S. Lynch may be sent to Fidelity Investments, 245 Summer Street, Boston, Massachusetts 02210. Officers appear below in alphabetical order.
Name, Year of Birth; Principal Occupation
Peter S. Lynch (1944)
Year of Election or Appointment: 2018
Member of the Advisory Board
Mr. Lynch also serves as Member of the Advisory Board of other Fidelity® funds. Mr. Lynch is Vice Chairman and a Director of FMR (investment adviser firm) and FMR Co., Inc. (investment adviser firm). In addition, Mr. Lynch serves as a Trustee of Boston College and as the Chairman of the Inner-City Scholarship Fund. Previously, Mr. Lynch served on the Special Olympics International Board of Directors (1997-2006).
William S. Stavropoulos (1939)
Year of Election or Appointment: 2018
Member of the Advisory Board
Mr. Stavropoulos also serves as Member of the Advisory Board of other Fidelity® funds. Mr. Stavropoulos serves as President and Founder of the Michigan Baseball Foundation, the Great Lakes Loons (2007-present). Mr. Stavropoulos is Chairman Emeritus of the Board of Directors of The Dow Chemical Company, where he previously served in numerous senior management positions, including President, CEO (1995-2000; 2002-2004), Chairman of the Executive Committee (2000-2006), and as a member of the Board of Directors (1990-2006). Currently, Mr. Stavropoulos is Chairman of the Board of Directors of Univar Inc. (global distributor of commodity and specialty chemicals), a Director of Teradata Corporation (data warehousing and technology solutions), and a member of the Advisory Board for Metalmark Capital LLC (private equity investment, 2005-present). Mr. Stavropoulos is an operating advisor to Clayton, Dubilier & Rice, LLC (private equity investment). In addition, Mr. Stavropoulos is a member of the University of Notre Dame Advisory Council for the College of Science, a Trustee of the Rollin L. Gerstacker Foundation, and a Director of Artis-Naples in Naples, Florida. Previously, Mr. Stavropoulos served as Trustee of certain Fidelity® funds (2001-2018) and as a Director of Chemical Financial Corporation (bank holding company, 1993-2012) and Tyco International, Ltd. (multinational manufacturing and services, 2007-2012).
Carol B. Tomé (1957)
Year of Election or Appointment: 2017
Member of the Advisory Board
Ms. Tomé also serves as Member of the Advisory Board of other Fidelity® funds. Ms. Tomé is Chief Financial Officer (2001-present) and Executive Vice President of Corporate Services (2007-present) of The Home Depot, Inc. (home improvement retailer) and a Director (2003-present) and Chair of the Audit Committee (2004-present) of United Parcel Service, Inc. (package delivery and supply chain management). Previously, Ms. Tomé served as Trustee of certain Fidelity® funds (2017), Senior Vice President of Finance and Accounting/Treasurer (2000-2007) and Vice President and Treasurer (1995-2000) of The Home Depot, Inc. and Chair of the Board (2010-2012), Vice Chair of the Board (2009 and 2013), and a Director (2008-2013) of the Federal Reserve Bank of Atlanta. Ms. Tomé is also a director or trustee of many community and professional organizations.
Elizabeth Paige Baumann (1968)
Year of Election or Appointment: 2017
Anti-Money Laundering (AML) Officer
Ms. Baumann also serves as AML Officer of other funds. She is Chief AML Officer (2012-present) and Senior Vice President (2014-present) of FMR LLC (diversified financial services company) and is an employee of Fidelity Investments. Previously, Ms. Baumann served as AML Officer of the funds (2012-2016), and Vice President (2007-2014) and Deputy Anti-Money Laundering Officer (2007-2012) of FMR LLC.
Marc R. Bryant (1966)
Year of Election or Appointment: 2013
Secretary and Chief Legal Officer (CLO)
Mr. Bryant also serves as Secretary and CLO of other funds. Mr. Bryant serves as CLO, Secretary, and Senior Vice President of Fidelity Management & Research Company (investment adviser firm, 2015-present) and FMR Co., Inc. (investment adviser firm, 2015-present); Secretary of Fidelity SelectCo, LLC (investment adviser firm, 2015-present) and Fidelity Investments Money Management, Inc. (investment adviser firm, 2015-present); and CLO of Fidelity Management & Research (Hong Kong) Limited and FMR Investment Management (UK) Limited (investment adviser firms, 2015-present) and Fidelity Management & Research (Japan) Limited (investment adviser firm, 2016-present). He is Senior Vice President and Deputy General Counsel of FMR LLC (diversified financial services company). Previously, Mr. Bryant served as Secretary and CLO of Fidelity Rutland Square Trust II (2010-2014) and Assistant Secretary of Fidelity's Fixed Income and Asset Allocation Funds (2013-2015). Prior to joining Fidelity Investments, Mr. Bryant served as a Senior Vice President and the Head of Global Retail Legal for AllianceBernstein L.P. (2006-2010), and as the General Counsel for ProFund Advisors LLC (2001-2006).
William C. Coffey (1969)
Year of Election or Appointment: 2009
Assistant Secretary
Mr. Coffey also serves as Assistant Secretary of other funds. He is Senior Vice President and Deputy General Counsel of FMR LLC (diversified financial services company, 2010-present), and is an employee of Fidelity Investments. Previously, Mr. Coffey served as Vice President and Associate General Counsel of FMR LLC (2005-2009).
Jonathan Davis (1968)
Year of Election or Appointment: 2010
Assistant Treasurer
Mr. Davis also serves as Assistant Treasurer of other funds. Mr. Davis serves as Assistant Treasurer of FMR Capital, Inc. (2017-present) and is an employee of Fidelity Investments. Previously, Mr. Davis served as Vice President and Associate General Counsel of FMR LLC (diversified financial services company, 2003-2010).
Adrien E. Deberghes (1967)
Year of Election or Appointment: 2018
Assistant Treasurer
Mr. Deberghes also serves as an officer of other funds. He serves as Assistant Treasurer of FMR Capital, Inc. (2017-present), Executive Vice President of Fidelity Investments Money Management, Inc. (FIMM) (investment adviser firm, 2016-present), and is an employee of Fidelity Investments (2008-present). Previously, Mr. Deberghes served as President and Treasurer of certain Fidelity® funds (2013-2018). Prior to joining Fidelity Investments, Mr. Deberghes was Senior Vice President of Mutual Fund Administration at State Street Corporation (2007-2008), Senior Director of Mutual Fund Administration at Investors Bank & Trust (2005-2007), and Director of Finance for Dunkin' Brands (2000-2005). Previously, Mr. Deberghes served in other fund officer roles.
Joseph DeSantis (1959)
Year of Election or Appointment: 2015
Vice President
Mr. DeSantis also serves as Vice President of other funds. Mr. DeSantis serves as a Director of Fidelity Management & Research (Japan) Limited (investment adviser firm, 2016-present), Chief Investment Officer, Equities (2010-present) and is an employee of Fidelity Investments.
Stephanie J. Dorsey (1969)
Year of Election or Appointment: 2010
Assistant Treasurer
Ms. Dorsey also serves as an officer of other funds. Ms. Dorsey serves as Assistant Treasurer of FMR Capital, Inc. (2017-present), is an employee of Fidelity Investments (2008-present), and has served in other fund officer roles. Prior to joining Fidelity Investments, Ms. Dorsey served as Treasurer (2004-2008) of the JPMorgan Mutual Funds and Vice President (2004-2008) of JPMorgan Chase Bank.
Howard J. Galligan III (1966)
Year of Election or Appointment: 2014
Chief Financial Officer
Mr. Galligan also serves as Chief Financial Officer of other funds. Mr. Galligan serves as President of Fidelity Pricing and Cash Management Services (FPCMS) (2014-present) and as a Director of Strategic Advisers LLC (investment adviser firm, 2008-present). Previously, Mr. Galligan served as Chief Administrative Officer of Asset Management (2011-2014) and Chief Operating Officer and Senior Vice President of Investment Support for Strategic Advisers LLC (2003-2011).
Brian B. Hogan (1964)
Year of Election or Appointment: 2009
Vice President
Mr. Hogan also serves as Trustee or Vice President of other funds. Mr. Hogan serves as Head of Fidelity Investments’ Investment Solutions and Innovation organization (2018-present), and as a Director of FMR Investment Management (UK) Limited (investment adviser firm, 2015-present) and Fidelity SelectCo, LLC (investment adviser firm, 2014-present). Previously, Mr. Hogan served as Trustee of certain Fidelity® funds (2014-2018), President of the Equity Division of FMR (investment adviser firm, 2009-2018), Senior Vice President, Equity Research of FMR (2006-2009), and as a portfolio manager. Mr. Brian B. Hogan is not related to Mr. Colm A. Hogan.
Colm A. Hogan (1973)
Year of Election or Appointment: 2018
Deputy Treasurer
Mr. Hogan also serves as an officer of other funds. Mr. Hogan serves as Assistant Treasurer of FMR Capital, Inc. (2017-present) and is an employee of Fidelity Investments (2005-present). Previously, Mr. Hogan served as Assistant Treasurer of certain Fidelity® funds (2016-2018). Mr. Colm A. Hogan is not related to Mr. Brian B. Hogan.
Chris Maher (1972)
Year of Election or Appointment: 2013
Assistant Treasurer
Mr. Maher serves as Assistant Treasurer of other funds. Mr. Maher is Vice President of Valuation Oversight, serves as Assistant Treasurer of FMR Capital, Inc. (2017-present), and is an employee of Fidelity Investments. Previously, Mr. Maher served as Vice President of Asset Management Compliance (2013), Vice President of the Program Management Group of FMR (investment adviser firm, 2010-2013), and Vice President of Valuation Oversight (2008-2010).
Rieco E. Mello (1969)
Year of Election or Appointment: 2017
Assistant Treasurer
Mr. Mello also serves as Assistant Treasurer of other funds. Mr. Mello serves as Assistant Treasurer of FMR Capital, Inc. (2017-present) and is an employee of Fidelity Investments (1995-present).
Kenneth B. Robins (1969)
Year of Election or Appointment: 2018
Chief Compliance Officer
Mr. Robins also serves as an officer of other funds. Mr. Robins serves as Compliance Officer of Fidelity Management & Research Company and FMR Co., Inc. (investment adviser firms, 2016-present) and is an employee of Fidelity Investments (2004-present). Previously, Mr. Robins served as Executive Vice President of Fidelity Investments Money Management, Inc. (investment adviser firm, 2013-2016) and served in other fund officer roles.
Stacie M. Smith (1974)
Year of Election or Appointment: 2018
President and Treasurer
Ms. Smith also serves as an officer of other funds. Ms. Smith serves as Assistant Treasurer of FMR Capital, Inc. (2017-present), is an employee of Fidelity Investments (2009-present), and has served in other fund officer roles. Prior to joining Fidelity Investments, Ms. Smith served as Senior Audit Manager of Ernst & Young LLP (accounting firm, 1996-2009). Previously, Ms. Smith served as Assistant Treasurer (2013-2018) and Deputy Treasurer (2013-2016) of certain Fidelity® funds.
Marc L. Spector (1972)
Year of Election or Appointment: 2017
Assistant Treasurer
Mr. Spector also serves as an officer of other funds. Mr. Spector serves as Assistant Treasurer of FMR Capital, Inc. (2017-present) and is an employee of Fidelity Investments (2016-present). Prior to joining Fidelity Investments, Mr. Spector served as Director at the Siegfried Group (accounting firm, 2013-2016), and prior to Siegfried Group as audit senior manager at Deloitte & Touche (accounting firm, 2005-2013).
Renee Stagnone (1975)
Year of Election or Appointment: 2016
Assistant Treasurer
Ms. Stagnone also serves as an officer of other funds. Ms. Stagnone serves as Assistant Treasurer of FMR Capital, Inc. (2017-present) and is an employee of Fidelity Investments (1997-present). Previously, Ms. Stagnone served as Deputy Treasurer of certain Fidelity® funds (2013-2016).
Shareholder Expense Example
As a shareholder of a Fund, you incur two types of costs: (1) transaction costs, including redemption fees and (2) ongoing costs, including management fees and other Fund expenses. This Example is intended to help you understand your ongoing costs (in dollars) of investing in the Funds and to compare these costs with the ongoing costs of investing in other mutual funds.
The Example is based on an investment of $1,000 invested at the beginning of the period and held for the entire period (September 1, 2017 to February 28, 2018).
Actual Expenses
The first line of the accompanying table for each fund provides information about actual account values and actual expenses. You may use the information in this line, together with the amount you invested, to estimate the expenses that you paid over the period. Simply divide your account value by $1,000.00 (for example, an $8,600 account value divided by $1,000.00 = 8.6), then multiply the result by the number in the first line for a fund under the heading entitled "Expenses Paid During Period" to estimate the expenses you paid on your account during this period. A small balance maintenance fee of $12.00 that is charged once a year may apply for certain accounts with a value of less than $2,000. This fee is not included in the table below. If it was, the estimate of expenses you paid during the period would be higher, and your ending account value lower, by this amount. In addition, each Fund, as a shareholder in the underlying Fidelity Central Funds, will indirectly bear its pro-rata share of the fees and expenses incurred by the underlying Fidelity Central Funds. These fees and expenses are not included in the Fund's annualized expense ratio used to calculate the expense estimate in the table below.
Hypothetical Example for Comparison Purposes
The second line of the accompanying table for each fund provides information about hypothetical account values and hypothetical expenses based on a fund's actual expense ratio and an assumed rate of return of 5% per year before expenses, which is not the Fund's actual return. The hypothetical account values and expenses may not be used to estimate the actual ending account balance or expenses you paid for the period. You may use this information to compare the ongoing costs of investing in the Fund and other funds. To do so, compare this 5% hypothetical example with the 5% hypothetical examples that appear in the shareholder reports of the other funds. A small balance maintenance fee of $12.00 that is charged once a year may apply for certain accounts with a value of less than $2,000. This fee is not included in the table below. If it was, the estimate of expenses you paid during the period would be higher, and your ending account value lower, by this amount. In addition, each Fund, as a shareholder in the underlying Fidelity Central Funds, will indirectly bear its pro-rata share of the fees and expenses incurred by the underlying Fidelity Central Funds. These fees and expenses are not included in the Fund's annualized expense ratio used to calculate the expense estimate in the table below.
Please note that the expenses shown in the table are meant to highlight your ongoing costs only and do not reflect any transaction costs. Therefore, the second line of the table is useful in comparing ongoing costs only, and will not help you determine the relative total costs of owning different funds. In addition, if these transactional costs were included, your costs would have been higher.
| | Annualized Expense Ratio-A | Beginning
Account Value
September 1, 2017 | Ending
Account Value
February 28, 2018 | Expenses Paid
During Period-B
September 1, 2017
to February 28, 2018 |
| Energy Portfolio | .79% | | | |
| Actual | | $1,000.00 | $1,119.00 | $4.15 |
| Hypothetical-C | | $1,000.00 | $1,020.88 | $3.96 |
| Energy Service Portfolio | .84% | | | |
| Actual | | $1,000.00 | $1,093.30 | $4.36 |
| Hypothetical-C | | $1,000.00 | $1,020.63 | $4.21 |
| Natural Gas Portfolio | .89% | | | |
| Actual | | $1,000.00 | $1,011.10 | $4.44 |
| Hypothetical-C | | $1,000.00 | $1,020.38 | $4.46 |
| Natural Resources Portfolio | .82% | | | |
| Actual | | $1,000.00 | $1,101.80 | $4.27 |
| Hypothetical-C | | $1,000.00 | $1,020.73 | $4.11 |
A Annualized expense ratio reflects expenses net of applicable fee waivers.
B Expenses are equal to each Fund's annualized expense ratio, multiplied by the average account value over the period, multiplied by 181/ 365 (to reflect the one-half year period).
C 5% return per year before expenses
Distributions (Unaudited)
The Board of Trustees of each fund voted to pay to shareholders of record at the opening of business on record date, the following distributions per share derived from capital gains realized from sales of portfolio securities, and dividends derived from net investment income:
| | Pay Date | Record Date | Dividends | Capital Gains |
| Energy Portfolio | 04/09/18 | 04/06/18 | $0.000 | $0.000 |
| Energy Service Portfolio | 04/09/18 | 04/06/18 | $0.000 | $0.000 |
| Natural Gas Portfolio | 04/09/18 | 04/06/18 | $0.000 | $0.117 |
| Natural Resources Portfolio | 04/09/18 | 04/06/18 | $0.013 | $0.001 |
|
A percentage of the dividends distributed during the fiscal year for the following funds qualify for the dividends–received deduction for corporate shareholders:
| | April 2017 | December 2017 |
| Energy Portfolio | 100% | 100% |
| Energy Service Portfolio | –% | 56% |
| Natural Gas Portfolio | 56% | 77% |
| Natural Resources Portfolio | 100% | 100% |
|
A percentage of the dividends distributed during the fiscal year for the following funds may be taken into account as a dividend for purposes of the maximum rate under section 1(h)(11) of the Internal Revenue Code.
| | April 2017 | December 2017 |
| Energy Portfolio | 100% | 100% |
| Energy Service Portfolio | –% | 63% |
| Natural Gas Portfolio | 100% | 88% |
| Natural Resources Portfolio | 100% | 100% |
|
The funds will notify shareholders in January 2019 of amounts for use in preparing 2018 income tax returns.
Board Approval of Investment Advisory Contracts and Management Fees
Energy Portfolio
Energy Service Portfolio
Natural Gas Portfolio
Natural Resources Portfolio
Each year, the Board of Trustees, including the Independent Trustees (together, the Board), votes on the renewal of the management contract with Fidelity SelectCo, LLC (SelectCo), an affiliate of Fidelity Management & Research Company (FMR), and the sub-advisory agreements with affiliates of FMR (together, the Advisory Contracts) for each fund. SelectCo and the sub-advisers are collectively referred to herein as the Investment Advisers. The Board, assisted by the advice of fund counsel and Independent Trustees' counsel, requests and considers a broad range of information relevant to the renewal of the Advisory Contracts throughout the year.
The Board meets regularly and, at each of its meetings, covers an extensive agenda of topics and materials and considers factors that are relevant to its annual consideration of the renewal of each fund's Advisory Contracts, including the services and support provided to each fund and its shareholders. The Board has established four standing committees (Committees) — Operations, Audit, Fair Valuation, and Governance and Nominating — each composed of and chaired by Independent Trustees with varying backgrounds, to which the Board has assigned specific subject matter responsibilities in order to enhance effective decision-making by the Board. The Operations Committee, of which all of the Independent Trustees are members, meets regularly throughout the year and considers, among other matters, information specifically related to the annual consideration of the renewal of each fund's Advisory Contracts. The Board, acting directly and through its Committees, requests and receives information concerning the annual consideration of the renewal of each fund's Advisory Contracts. The Board also meets as needed to review matters specifically related to the Board's annual consideration of the renewal of the Advisory Contracts. Members of the Board may also meet with trustees of other Fidelity funds through ad hoc joint committees to discuss certain matters relevant to all of the Fidelity funds.
At its January 2018 meeting, the Board unanimously determined to renew each fund's Advisory Contracts. In reaching its determination, the Board considered all factors it believed relevant, including (i) the nature, extent, and quality of the services to be provided to each fund and its shareholders (including the investment performance of each fund); (ii) the competitiveness of each fund's management fee and total expense ratio relative to peer funds; (iii) the total costs of the services to be provided by and the profits to be realized by Fidelity from its relationships with each fund; and (iv) the extent to which, if any, economies of scale exist and would be realized as each fund grows, and whether any economies of scale are appropriately shared with fund shareholders.
In considering whether to renew the Advisory Contracts for each fund, the Board reached a determination, with the assistance of fund counsel and Independent Trustees' counsel and through the exercise of its business judgment, that the renewal of the Advisory Contracts was in the best interests of each fund and its shareholders and that the compensation payable under the Advisory Contracts was fair and reasonable. The Board's decision to renew the Advisory Contracts was not based on any single factor, but rather was based on a comprehensive consideration of all the information provided to the Board at its meetings throughout the year. The Board, in reaching its determination to renew the Advisory Contracts, was aware that shareholders of each fund have a broad range of investment choices available to them, including a wide choice among funds offered by Fidelity's competitors, and that each fund's shareholders, who have the opportunity to review and weigh the disclosure provided by the fund in its prospectus and other public disclosures, have chosen to invest in that fund, which is part of the Fidelity family of funds.
Amendment to Group Fee Rate. The Board also ratified an amendment to the management contract for each fund to add an additional breakpoint to the group fee schedule, which was effective October 1, 2017. The Board noted that the additional breakpoint would result in lower management fee rates to the extent that assets under management that are included in group fee calculations increase above the new breakpoint.
Nature, Extent, and Quality of Services Provided. The Board considered the staffing of the Investment Advisers as it relates to the funds, including the backgrounds of investment personnel of SelectCo, and also considered the funds' investment objectives, strategies, and related investment philosophies. The Independent Trustees also had discussions with senior management of Fidelity's investment operations and investment groups. The Board considered the structure of the investment personnel compensation program and whether this structure provides appropriate incentives to act in the best interests of each fund. Additionally, the Board considered the portfolio managers' investments, if any, in the funds that they manage.
Resources Dedicated to Investment Management and Support Services. The Board reviewed the general qualifications and capabilities of the Investment Advisers' investment staffs, including their size, education, experience, and resources, as well as Fidelity's approach to recruiting, training, managing, and compensating investment personnel. The Board noted that Fidelity has continued to increase the resources devoted to non-U.S. offices, including expansion of Fidelity's global investment organization. The Board also noted that Fidelity's analysts have extensive resources, tools and capabilities that allow them to conduct sophisticated quantitative and fundamental analysis, as well as credit analysis of issuers, counterparties and guarantors. Further, the Board considered that Fidelity's investment professionals have sufficient access to global information and data so as to provide competitive investment results over time, and that those professionals also have access to sophisticated tools that permit them to assess portfolio construction and risk and performance attribution characteristics continuously, as well as to transmit new information and research conclusions rapidly around the world. Additionally, in its deliberations, the Board considered Fidelity's trading, risk management, compliance, and technology and operations capabilities and resources, which are integral parts of the investment management process.
Shareholder and Administrative Services. The Board considered (i) the nature, extent, quality, and cost of advisory, administrative, and shareholder services performed by the Investment Advisers and their affiliates under the Advisory Contracts and under separate agreements covering transfer agency, pricing and bookkeeping, and securities lending services for each fund; (ii) the nature and extent of the supervision of third party service providers, principally custodians, subcustodians, and pricing vendors; and (iii) the resources devoted to, and the record of compliance with, each fund's compliance policies and procedures. The Board also reviewed the allocation of fund brokerage, including allocations to brokers affiliated with the Investment Advisers, the use of brokerage commissions to pay fund expenses, and the use of "soft" commission dollars to pay for research services.
The Board noted that the growth of fund assets over time across the complex allows Fidelity to reinvest in the development of services designed to enhance the value or convenience of the Fidelity funds as investment vehicles. These services include 24-hour access to account information and market information through telephone representatives and over the Internet, investor education materials and asset allocation tools, and the expanded availability of Fidelity Investor Centers.
The Board noted that it and the boards of certain other Fidelity funds had formed an ad hoc Committee on Transfer Agency Fees to review the variety of transfer agency fee structures throughout the industry and Fidelity's competitive positioning with respect to industry participants.
Investment in a Large Fund Family. The Board considered the benefits to shareholders of investing in a Fidelity fund, including the benefits of investing in a fund that is part of a large family of funds offering a variety of investment disciplines and providing a large variety of mutual fund investor services. The Board noted that Fidelity had taken, or had made recommendations that resulted in the Fidelity funds taking, a number of actions over the previous year that benefited particular funds, including: (i) continuing to dedicate additional resources to Fidelity's investment research process, which includes meetings with management of issuers in which the funds invest, and to the support of the senior management team that oversees asset management; (ii) continuing efforts to enhance Fidelity's global research capabilities; (iii) launching new funds and making other enhancements to meet client needs; (iv) launching new share classes of existing funds; (v) eliminating purchase minimums and broadening eligibility requirements for certain lower-priced share classes; (vi) reducing management fees and total expenses for certain growth equity funds and index funds; (vii) lowering expense caps for certain existing funds and classes to reduce expenses borne by shareholders; (viii) eliminating short-term redemption fees for certain funds; (ix) introducing a new pricing structure for certain funds of funds that is expected to reduce overall expenses paid by shareholders; (x) rationalizing product lines and gaining increased efficiencies through proposals for fund mergers and share class consolidations; (xi) continuing to develop, acquire and implement systems and technology to improve services to the funds and shareholders, strengthen information security, and increase efficiency; and (xii) implementing enhancements to further strengthen Fidelity's product line to increase investors' probability of success in achieving their investment goals, including retirement income goals.
The Board considered whether each fund has operated in accordance with its investment objective, as well as its record of compliance with its investment restrictions and its performance history.
The Board took into account discussions with representatives of SelectCo about fund investment performance that occur at Board meetings throughout the year. In this regard the Board noted that as part of regularly scheduled fund reviews and other reports to the Board on fund performance, the Board considers annualized return information for each fund for different time periods, measured against a securities market index ("benchmark index"). In its evaluation of fund investment performance at meetings throughout the year, the Board gave particular attention to information indicating underperformance of certain Fidelity funds for specific time periods and discussed with the Investment Advisers the reasons for such underperformance. Each of Natural Gas Portfolio and Natural Resources Portfolio underperformed its benchmark for the one-, three-, and five-year periods ended June 30, 2017, and as a result, the Board will continue to discuss with SelectCo the steps it is taking to address each such fund's performance.
In addition to reviewing absolute and relative fund performance, the Independent Trustees periodically consider the appropriateness of fund performance metrics in evaluating the results achieved. In general, the Independent Trustees believe that fund performance should be evaluated based on net performance (after fees and expenses) of both the highest performing and lowest performing fund share classes, where applicable, compared to appropriate benchmark indices, over appropriate time periods that may include full market cycles, taking into account relevant factors, including the following: general market conditions; issuer-specific information; and fund cash flows and other factors. Depending on the circumstances, the Independent Trustees may be satisfied with a fund's performance notwithstanding that it lags its benchmark index for certain periods.
The Independent Trustees recognize that shareholders evaluate performance on a net basis over their own holding periods, for which one-, three-, and five-year periods are often used as a proxy. For this reason, the performance information reviewed by the Board also included net cumulative total return information for each fund and an appropriate benchmark index for the most recent one-, three-, and five-year periods ended June 30, 2017.
Based on its review, the Board concluded that the nature, extent, and quality of services provided to each fund under the Advisory Contracts should continue to benefit the shareholders of each fund.
Competitiveness of Management Fee and Total Expense Ratio. The Board considered each fund's management fee and total expense ratio compared to "mapped groups" of competitive funds and classes created for the purpose of facilitating the Trustees' analysis of the competitiveness of management fees and total expenses. Fidelity creates "mapped groups" by combining similar Lipper investment objective categories that have comparable investment mandates. For this purpose, all sector focused equity funds are grouped in the same mapped group. Combining Lipper investment objective categories aids the Board's management fee and total expense ratio comparisons by broadening the competitive group used for comparison.
Management Fee. The Board considered two proprietary management fee comparisons for the 12-month periods ended June 30 shown in basis points (BP) in the charts below. The group of Lipper funds used by the Board for management fee comparisons is referred to below as the "Total Mapped Group." The Total Mapped Group comparison focuses on a fund's standing in terms of gross management fees before expense reimbursements or caps relative to the total universe of funds with comparable investment mandates (
i.e., sector equities), regardless of whether their management fee structures also are comparable. Funds with comparable management fee structures have similar management fee contractual arrangements (
e.g., flat rate charged for advisory services, all-inclusive fee rate,
etc.). "TMG %" represents the percentage of funds in the Total Mapped Group that had management fees that were lower than a fund's. For example, a hypothetical TMG % of 20% would mean that 80% of the funds in the Total Mapped Group had higher, and 20% had lower, management fees than a fund. The funds' actual TMG %s and the number of funds in the Total Mapped Group are in the charts below. The "Asset-Size Peer Group" (ASPG) comparison focuses on a fund's standing relative to a subset of non-Fidelity funds within the Total Mapped Group that are similar in size and management fee structure. For example, if a fund is in the first quartile of the ASPG, the fund's management fee ranks in the least expensive or lowest 25% of funds in the ASPG. The ASPG represents at least 15% of the funds in the Total Mapped Group with comparable asset size and management fee structures, subject to a minimum of 50 funds (or all funds in the Total Mapped Group if fewer than 50). Additional information, such as the ASPG quartile in which a fund's management fee rate ranked, is also included in the charts and considered by the Board.
Energy Portfolio
Energy Service Portfolio
Natural Gas Portfolio
Natural Resources Portfolio
The Board noted that each fund's management fee rate ranked below the median of its Total Mapped Group and below the median of its ASPG for the 12-month period ended June 30, 2017.
The Board noted that it and the boards of other Fidelity funds formed an ad hoc Committee on Group Fee, which meets periodically, to conduct an in-depth review of the "group fee" component of the management fee of funds with such management fee structures. The Committee's focus included the mechanics of the group fee, the competitive landscape of group fee structures, Fidelity funds with no group fee component and investment products not included in group fee assets. The Board also considered that, for funds subject to the group fee, FMR agreed to voluntarily waive fees over a specified period of time in amounts designed to account for assets converted from certain funds to certain collective investment trusts.
Based on its review, the Board concluded that each fund's management fee is fair and reasonable in light of the services that each fund receives and the other factors considered.
Total Expense Ratio. In its review of each fund's total expense ratio, the Board considered the fund's management fee rate as well as other fund expenses, such as transfer agent fees, pricing and bookkeeping fees, and custodial, legal, and audit fees. The Board also noted that Fidelity may agree to waive fees and expenses from time to time, and the extent to which, if any, it has done so for each fund. As part of its review, the Board also considered the current and historical total expense ratios of each fund compared to competitive fund median expenses. Each fund is compared to those funds and classes in the Total Mapped Group (used by the Board for management fee comparisons) that have a similar sales load structure.
The Board noted that each fund's total expense ratio ranked below the competitive median for the 12-month period ended June 30, 2017.
Fees Charged to Other Fidelity Clients. The Board also considered Fidelity fee structures and other information with respect to clients of Fidelity, such as other funds advised or subadvised by Fidelity, pension plan clients, and other institutional clients with similar mandates. The Board noted that an ad hoc joint committee created by it and the boards of other Fidelity funds periodically reviews and compares Fidelity's institutional investment advisory business with its business of providing services to the Fidelity funds, including the differences in services provided, fees charged, and costs incurred, as well as competition in their respective marketplaces.
Based on its review of total expense ratios and fees charged to other Fidelity clients, the Board concluded that each fund's total expense ratio was reasonable in light of the services that each fund and its shareholders receive and the other factors considered.
Costs of the Services and Profitability. The Board considered the revenues earned and the expenses incurred by Fidelity in conducting the business of developing, marketing, distributing, managing, administering and servicing each fund and servicing each fund's shareholders. The Board also considered the level of Fidelity's profits in respect of all the Fidelity funds.
On an annual basis, Fidelity presents to the Board information about the profitability of its relationships with each fund. Fidelity calculates profitability information for each fund, as well as aggregate profitability information for groups of Fidelity funds and all Fidelity funds, using a series of detailed revenue and cost allocation methodologies which originate with the books and records of Fidelity on which Fidelity's audited financial statements are based. The Audit Committee of the Board reviews any significant changes from the prior year's methodologies.
PricewaterhouseCoopers LLP (PwC), independent registered public accounting firm and auditor to Fidelity and certain Fidelity funds, has been engaged annually by the Board as part of the Board's assessment of the profitability analysis used by Fidelity. PwC's engagement includes the review and assessment of Fidelity's methodologies used in determining the revenues and expenses attributable to Fidelity's mutual fund business, and completion of agreed-upon procedures in respect of the mathematical accuracy of the fund profitability information and its conformity to established allocation methodologies. After considering PwC's reports issued under the engagement and information provided by Fidelity, the Board concluded that while other allocation methods may also be reasonable, Fidelity's profitability methodologies are reasonable in all material respects.
The Board also reviewed Fidelity's non-fund businesses and potential fall-out benefits related to the mutual fund business as well as cases where Fidelity's affiliates may benefit from or be related to the funds' business.
The Board considered the costs of the services provided by and the profits realized by Fidelity in connection with the operation of each fund and was satisfied that the profitability was not excessive.
Economies of Scale. The Board considered whether there have been economies of scale in respect of the management of the Fidelity funds, whether the Fidelity funds (including each fund) have appropriately benefited from any such economies of scale, and whether there is potential for realization of any further economies of scale. The Board considered the extent to which each fund will benefit from economies of scale as assets grow through increased services to the fund, through waivers or reimbursements, or through fee or expense ratio reductions. The Board also noted that a committee (the Economies of Scale Committee) created by it and the boards of other Fidelity funds periodically analyzes whether Fidelity attains economies of scale in respect of the management and servicing of the Fidelity funds, whether the Fidelity funds have appropriately benefited from such economies of scale, and whether there is potential for realization of any further economies of scale.
The Board recognized that each fund's management contract incorporates a "group fee" structure, which provides for lower group fee rates as total group assets increase, and for higher group fee rates as total group assets decrease (with "group assets" defined to include fund assets under SelectCo's management plus assets under FMR's management). SelectCo calculates the group fee rates based on a tiered asset "breakpoint" schedule that varies based on asset class. The Board considered that the group fee is designed to deliver the benefits of economies of scale to fund shareholders when total group assets increase, even if assets of any particular fund are unchanged or have declined, because some portion of Fidelity's costs are attributable to services provided to all Fidelity funds, and all funds benefit if those costs can be allocated among more assets. The Board concluded that, given the group fee structure, fund shareholders will benefit from lower management fees as group assets increase at the fund complex level, regardless of whether Fidelity achieves any such economies of scale.
The Board concluded, taking into account the analysis of the Economies of Scale Committee, that economies of scale, if any, are being appropriately shared between fund shareholders and Fidelity.
Additional Information Requested by the Board. In order to develop fully the factual basis for consideration of the Fidelity funds' advisory contracts, the Board requested and received additional information on certain topics, including: (i) Fidelity's fund profitability methodology, profitability trends for certain funds, and the impact of certain factors on fund profitability results; (ii) portfolio manager changes that have occurred during the past year and the amount of the investment that each portfolio manager has made in the Fidelity fund(s) that he or she manages; (iii) Fidelity's compensation structure for portfolio managers, research analysts, and other key personnel, including its effects on fund profitability; (iv) comparisons to institutional products; (v) the arrangements with and compensation paid to certain fund sub-advisers on behalf of the Fidelity funds; (vi) the impact of proposed changes to contractual expense cap arrangements in place for certain funds; (vii) Fidelity's long-term expectations for its offerings in the workplace investing channel; (viii) the methodology with respect to evaluating competitive fund data and peer group classifications and fee comparisons; (ix) the presentation of certain fund performance information; (x) Fidelity's transfer agent fee, expense, and service structures for different funds and classes, including the increased use of omnibus accounts and lower pricing in the retirement channel; (xi) fluctuations in trading expenses; (xii) explanations regarding the relative total expense ratios of certain funds and classes; and (xiii) Fidelity's expectations regarding the future asset levels of certain funds.
Based on its evaluation of all of the conclusions noted above, and after considering all factors it believed relevant, the Board concluded that the advisory fee structures are fair and reasonable, and that each fund's Advisory Contracts should be renewed.
Proxy Voting Results
A special meeting of shareholders was held on December 8, 2017. The results of votes taken among shareholders on the proposals before them are reported below. Each vote reported represents one dollar of net asset value held on the record date for the meeting.
PROPOSAL 1
To elect a Board of Trustees.
| | # of
Votes | % of
Votes |
| James C. Curvey |
| Affirmative | 40,874,579,146.19 | 94.146 |
| Withheld | 2,541,618,753.48 | 5.854 |
| TOTAL | 43,416,197,899.67 | 100.000 |
| Dennis J. Dirks |
| Affirmative | 41,093,243,800.03 | 94.650 |
| Withheld | 2,322,954,099.64 | 5.350 |
| TOTAL | 43,416,197,899.67 | 100.000 |
| Donald F. Donahue |
| Affirmative | 41,121,116,505.64 | 94.714 |
| Withheld | 2,295,081,394.03 | 5.286 |
| TOTAL | 43,416,197,899.67 | 100.000 |
| Alan J. Lacy |
| Affirmative | 41,091,494,851.72 | 94.646 |
| Withheld | 2,324,703,047.95 | 5.354 |
| TOTAL | 43,416,197,899.67 | 100.00 |
| Ned C. Lautenbach |
| Affirmative | 40,970,733,721.42 | 94.368 |
| Withheld | 2,445,464,178.25 | 5.632 |
| TOTAL | 43,416,197,899.67 | 100.000 |
| Joseph Mauriello |
| Affirmative | 41,021,688,840.89 | 94.485 |
| Withheld | 2,394,509,058.78 | 5.515 |
| TOTAL | 43,416,197,899.67 | 100.000 |
| Charles S. Morrison |
| Affirmative | 41,163,534,997.01 | 94.812 |
| Withheld | 2,252,662,902.66 | 5.188 |
| TOTAL | 43,416,197,899.67 | 100.000 |
| Cornelia M. Small |
| Affirmative | 41,061,752,034.66 | 94.578 |
| Withheld | 2,354,445,865.01 | 5.422 |
| TOTAL | 43,416,197,899.67 | 100.000 |
| Garnett A. Smith |
| Affirmative | 41,061,939,407.02 | 94.578 |
| Withheld | 2,354,258,492.65 | 5.422 |
| TOTAL | 43,416,197,899.67 | 100.000 |
| David M. Thomas |
| Affirmative | 41,102,875,738.06 | 94.672 |
| Withheld | 2,313,322,161.61 | 5.328 |
| TOTAL | 43,416,197,899.67 | 100.000 |
| Michael E. Wiley |
| Affirmative | 41,112,279,187.11 | 94.694 |
| Withheld | 2,303,918,712.56 | 5.306 |
| TOTAL | 43,416,197,899.67 | 100.000 |
PROPOSAL 2
To eliminate a fundamental investment policy for Energy Portfolio.
| | # of
Votes | % of
Votes |
| Affirmative | 872,405,264.92 | 71.826 |
| Against | 171,096,267.20 | 14.087 |
| Abstain | 91,077,895.37 | 7.498 |
| Broker Non-Vote | 80,037,978.52 | 6.589 |
| TOTAL | 1,214,617,406.01 | 100.000 |
PROPOSAL 2
To eliminate a fundamental investment policy for Energy Service Portfolio.
| | # of
Votes | % of
Votes |
| Affirmative | 218,720,242.86 | 72.926 |
| Against | 35,984,488.64 | 11.998 |
| Abstain | 19,568,134.36 | 6.524 |
| Broker Non-Vote | 25,649,953.89 | 8.552 |
| TOTAL | 299,922,819.75 | 100.000 |
PROPOSAL 2
To eliminate a fundamental investment policy for Natural Gas Portfolio.
| | # of
Votes | % of
Votes |
| Affirmative | 127,228,336.60 | 71.400 |
| Against | 16,559,012.65 | 9.293 |
| Abstain | 12,303,746.72 | 6.905 |
| Broker Non-Vote | 22,100,746.04 | 12.402 |
| TOTAL | 178,191,842.01 | 100.000 |
PROPOSAL 2
To eliminate a fundamental investment policy for Natural Resources Portfolio.
| | # of
Votes | % of
Votes |
| Affirmative | 482,984,049.43 | 74.573 |
| Against | 94,003,272.73 | 14.514 |
| Abstain | 49,297,173.77 | 7.611 |
| Broker Non-Vote | 21,389,995.98 | 3.302 |
| TOTAL | 647,674,491.91 | 100.000 |
PROPOSAL 3
To modify Energy Portfolio's fundamental concentration policy.
| | # of
Votes | % of
Votes |
| Affirmative | 906,803,274.54 | 74.658 |
| Against | 133,661,759.98 | 11.005 |
| Abstain | 94,114,392.97 | 7.748 |
| Broker Non-Vote | 80,037,978.52 | 6.589 |
| TOTAL | 1,214,617,406.01 | 100.000 |
PROPOSAL 3
To modify Energy Service Portfolio's fundamental concentration policy.
| | # of
Votes | % of
Votes |
| Affirmative | 226,261,640.15 | 75.440 |
| Against | 28,368,343.72 | 9.459 |
| Abstain | 19,642,881.99 | 6.549 |
| Broker Non-Vote | 25,649,953.89 | 8.552 |
| TOTAL | 299,922,819.75 | 100.000 |
PROPOSAL 3
To modify Natural Gas Portfolio's fundamental concentration policy.
| | # of
Votes | % of
Votes |
| Affirmative | 127,293,166.90 | 71.437 |
| Against | 16,064,588.42 | 9.016 |
| Abstain | 12,733,340.65 | 7.145 |
| Broker Non-Vote | 22,100,746.04 | 12.402 |
| TOTAL | 178,191,842.01 | 100.000 |
PROPOSAL 3
To modify Natural Resources Portfolio's fundamental concentration policy.
| | # of
Votes | % of
Votes |
| Affirmative | 503,884,867.84 | 77.800 |
| Against | 76,526,841.08 | 11.816 |
| Abstain | 45,872,787.01 | 7.082 |
| Broker Non-Vote | 21,389,995.98 | 3.302 |
| TOTAL | 647,674,491.91 | 100.000 |
PROPOSAL 4
To change Natural Resources Portfolio from a diversified fund to a non-diversified fund.
| | # of
Votes | % of
Votes |
| Affirmative | 480,524,490.51 | 74.193 |
| Against | 101,357,416.27 | 15.650 |
| Abstain | 44,402,589.15 | 6.855 |
| Broker Non-Vote | 21,389,995.98 | 3.302 |
| TOTAL | 647,674,491.91 | 100.000 |
|
| Proposal 1 reflects trust wide proposal and voting results. |
SELNR-ANN-0418
1.813649.113
Fidelity® Select Portfolios®
Telecommunications Services Sector Telecommunications Portfolio
Wireless Portfolio
Annual Report February 28, 2018 |
|
Contents
To view a fund's proxy voting guidelines and proxy voting record for the 12-month period ended June 30, visit http://www.fidelity.com/proxyvotingresults or visit the Securities and Exchange Commission's (SEC) web site at http://www.sec.gov.
You may also call 1-800-544-8544 to request a free copy of the proxy voting guidelines.
Standard & Poor's, S&P and S&P 500 are registered service marks of The McGraw-Hill Companies, Inc. and have been licensed for use by Fidelity Distributors Corporation.
Other third-party marks appearing herein are the property of their respective owners.
All other marks appearing herein are registered or unregistered trademarks or service marks of FMR LLC or an affiliated company. © 2018 FMR LLC. All rights reserved.
This report and the financial statements contained herein are submitted for the general information of the shareholders of the Funds. This report is not authorized for distribution to prospective investors in the Funds unless preceded or accompanied by an effective prospectus.
A fund files its complete schedule of portfolio holdings with the SEC for the first and third quarters of each fiscal year on Form N-Q. Forms N-Q are available on the SEC’s web site at http://www.sec.gov. A fund's Forms N-Q may be reviewed and copied at the SEC’s Public Reference Room in Washington, DC. Information regarding the operation of the SEC's Public Reference Room may be obtained by calling 1-800-SEC-0330.
For a complete list of a fund's portfolio holdings, view the most recent holdings listing, semiannual report, or annual report on Fidelity's web site at http://www.fidelity.com, http://www.institutional.fidelity.com, or http://www.401k.com, as applicable.
NOT FDIC INSURED •MAY LOSE VALUE •NO BANK GUARANTEE
Neither the Funds nor Fidelity Distributors Corporation is a bank.
Telecommunications Portfolio
Performance: The Bottom Line
Average annual total return reflects the change in the value of an investment, assuming reinvestment of distributions from dividend income and capital gains (the profits earned upon the sale of securities that have grown in value, if any) and assuming a constant rate of performance each year. The hypothetical investment and the average annual total returns do not reflect the deduction of taxes that a shareholder would pay on fund distributions or the redemption of fund shares. During periods of reimbursement by Fidelity, a fund’s total return will be greater than it would be had the reimbursement not occurred. How a fund did yesterday is no guarantee of how it will do tomorrow.
Average Annual Total Returns
| For the periods ended February 28, 2018 | Past 1 year | Past 5 years | Past 10 years |
| Telecommunications Portfolio | (3.76)% | 8.44% | 7.09% |
$10,000 Over 10 Years
Let's say hypothetically that $10,000 was invested in Telecommunications Portfolio, a class of the fund, on February 29, 2008.
The chart shows how the value of your investment would have changed, and also shows how the S&P 500® Index performed over the same period.
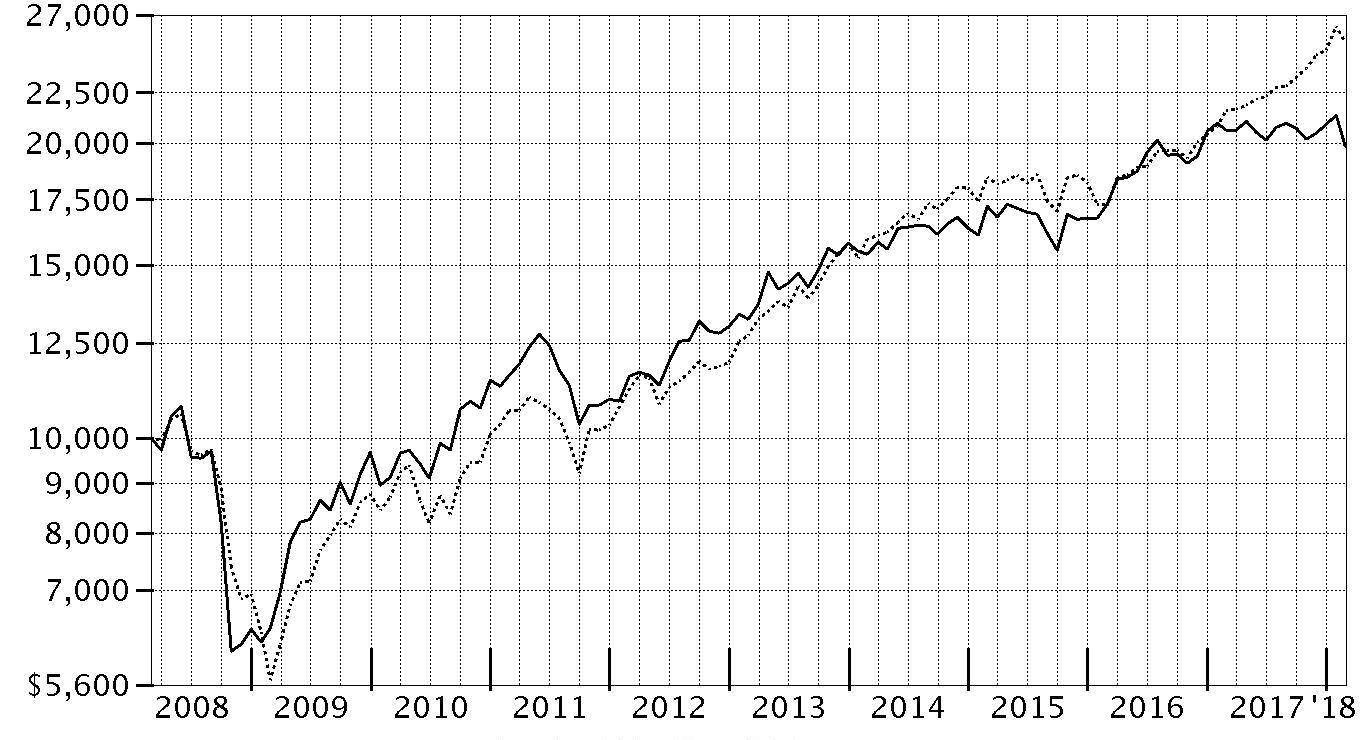
| Period Ending Values |
| $19,835 | Telecommunications Portfolio |
| $25,307 | S&P 500® Index |
Telecommunications Portfolio
Management's Discussion of Fund Performance
Market Recap: U.S. equities gained 17.10% for the 12 months ending February 28, 2018, as the S&P 500
® index moved steadily higher throughout 2017 and into 2018 until sharply reversing course in February. The drop was in stark contrast to the low volatility seen throughout 2017, along with consumer sentiment and other market indicators that stayed positive. Investors remained decidedly upbeat as the calendar turned, and the index rose 5.73% in January. February was a decidedly different story, though, as volatility spiked amid fear that rising inflation and the potential for the economy to overheat would prompt the U.S. Federal Reserve to pick up the pace of interest rate hikes. The index returned -3.69% for the month, its first negative result since October 2016. For the full 12 months, growth stocks handily topped value, while large-caps bested small-caps. By sector, information technology fared best by far, gaining 36% amid strong earnings growth from several major index constituents. Consumer discretionary (+22%) also stood out, driven by retailers. Financials added 20%, riding the uptick in bond yields. Materials and industrials rose about 16% each, boosted by higher demand, especially from China. Conversely, notable laggards included the defensive telecommunication services (-5%) and utilities (-2%) sectors, while rising rates held back real estate (-3%).
Comments from Portfolio Manager Matthew Drukker: For the year, the fund's share classes (excluding sales charges, if applicable) returned roughly between -4% and -5%, outpacing the -7.93% return of the sector benchmark, the MSCI U.S. IMI Telecommunication Services 25/50 Index. However, the fund’s results trailed the broad-market S&P 500
®. Investors generally shunned telecommunication services stocks for most of the reporting period, instead favoring higher-growth stocks. Versus the MSCI benchmark, favorable stock selection largely drove the fund’s outperformance. Choices in the integrated telecommunication services and wireless telecommunication services segments added value, as did underweighting two poor-performing index components here: Windstream Holdings (-78%) and NII Holdings (-88%), respectively. I eliminated NII from the fund this period. Elsewhere, a non-index position in wireless tower operator American Tower worked well, as the fund’s position rose 23% this period. Conversely, an underweighting in the relatively strong-performing alternative carriers segment detracted, especially avoiding index constituent PDVWireless (25%) and underweighting Orbcomm (21%). In addition, an out-of-MSCI-benchmark stake in application software stocks proved disappointing. A small position in Synchronoss Technologies returned -52% for the fund, and I eliminated this position during the period.
The views expressed above reflect those of the portfolio manager(s) only through the end of the period as stated on the cover of this report and do not necessarily represent the views of Fidelity or any other person in the Fidelity organization. Any such views are subject to change at any time based upon market or other conditions and Fidelity disclaims any responsibility to update such views. These views may not be relied on as investment advice and, because investment decisions for a Fidelity fund are based on numerous factors, may not be relied on as an indication of trading intent on behalf of any Fidelity fund.
Notes to shareholders: On December 8, 2017, shareholders approved proposals from the Board of Trustees to eliminate each sector/industry fund's fundamental “invests primarily” policy and to modify the fundamental concentration policy for certain funds. The changes took effect on January 1, 2018, and do not impact how the funds are managed.
Telecommunications Portfolio
Investment Summary (Unaudited)
Top Ten Stocks as of February 28, 2018
| | % of fund's net assets |
| Verizon Communications, Inc. | 20.9 |
| AT&T, Inc. | 11.3 |
| T-Mobile U.S., Inc. | 7.7 |
| CenturyLink, Inc. | 5.4 |
| Zayo Group Holdings, Inc. | 3.9 |
| Gci Liberty, Inc. Class A | 3.7 |
| Vonage Holdings Corp. | 3.5 |
| Cogent Communications Group, Inc. | 3.3 |
| Telephone & Data Systems, Inc. | 3.0 |
| Iridium Communications, Inc. | 2.9 |
| | 65.6 |
Top Industries (% of fund's net assets)
| As of February 28, 2018 |
| | Diversified Telecommunication Services | 63.1% |
| | Wireless Telecommunication Services | 18.0% |
| | Media | 12.4% |
| | Internet Software & Services | 2.2% |
| | Equity Real Estate Investment Trusts (Reits) | 2.0% |
| | All Others* | 2.3% |

* Includes short-term investments and net other assets (liabilities).
Telecommunications Portfolio
Schedule of Investments February 28, 2018
Showing Percentage of Net Assets
| Common Stocks - 99.2% | | | |
| | | Shares | Value |
| Communications Equipment - 0.8% | | | |
| Communications Equipment - 0.8% | | | |
| Quantenna Communications, Inc. (a) | | 218,900 | $3,009,875 |
| Diversified Telecommunication Services - 63.1% | | | |
| Alternative Carriers - 21.3% | | | |
| CenturyLink, Inc. | | 1,099,140 | 19,421,804 |
| Cogent Communications Group, Inc. | | 277,139 | 11,875,406 |
| Globalstar, Inc. (a)(b) | | 3,109,948 | 2,956,317 |
| Iliad SA | | 11,784 | 2,762,883 |
| Iridium Communications, Inc. (a)(b) | | 904,911 | 10,587,459 |
| ORBCOMM, Inc. (a) | | 231,949 | 2,412,270 |
| Vonage Holdings Corp. (a) | | 1,244,271 | 12,629,351 |
| Zayo Group Holdings, Inc. (a) | | 397,100 | 14,236,035 |
| | | | 76,881,525 |
| Integrated Telecommunication Services - 41.8% | | | |
| Altice U.S.A., Inc. Class A (b) | | 28,800 | 524,160 |
| AT&T, Inc. | | 1,120,220 | 40,663,986 |
| Atlantic Tele-Network, Inc. | | 91,000 | 5,450,900 |
| Cincinnati Bell, Inc. (a) | | 546,502 | 8,826,007 |
| Consolidated Communications Holdings, Inc. (b) | | 241,900 | 2,796,364 |
| Frontier Communications Corp. (b) | | 246,575 | 1,733,422 |
| Gci Liberty, Inc. Class A (a) | | 344,343 | 13,239,988 |
| Verizon Communications, Inc. | | 1,579,697 | 75,414,733 |
| Windstream Holdings, Inc. (b) | | 1,119,530 | 1,768,857 |
| | | | 150,418,417 |
|
| TOTAL DIVERSIFIED TELECOMMUNICATION SERVICES | | | 227,299,942 |
|
| Electronic Equipment & Components - 1.2% | | | |
| Electronic Equipment & Instruments - 0.3% | | | |
| ADT, Inc. (a) | | 98,500 | 1,040,160 |
| Electronic Manufacturing Services - 0.9% | | | |
| Fabrinet | | 104,500 | 3,150,675 |
|
| TOTAL ELECTRONIC EQUIPMENT & COMPONENTS | | | 4,190,835 |
|
| Equity Real Estate Investment Trusts (REITs) - 2.0% | | | |
| Specialized REITs - 2.0% | | | |
| American Tower Corp. | | 50,690 | 7,062,638 |
| Internet Software & Services - 2.2% | | | |
| Internet Software & Services - 2.2% | | | |
| Akamai Technologies, Inc. (a) | | 29,200 | 1,969,832 |
| Gogo, Inc. (a)(b) | | 306,047 | 2,778,907 |
| Pandora Media, Inc. (a)(b) | | 739,000 | 3,258,990 |
| | | | 8,007,729 |
| Media - 12.4% | | | |
| Cable & Satellite - 9.7% | | | |
| Altice NV Class A (a)(b) | | 288,548 | 2,752,491 |
| Comcast Corp. Class A | | 286,100 | 10,359,681 |
| DISH Network Corp. Class A (a) | | 39,900 | 1,663,431 |
| Liberty Broadband Corp. Class A (a) | | 93,100 | 8,135,078 |
| Liberty Global PLC: | | | |
| Class C (a) | | 293,936 | 8,826,898 |
| LiLAC Class C (a)(c) | | 92,834 | 1 |
| Liberty Latin America Ltd. (a) | | 88,834 | 1,816,655 |
| Megacable Holdings S.A.B. de CV unit | | 346,100 | 1,531,968 |
| | | | 35,086,203 |
| Movies & Entertainment - 2.7% | | | |
| Lions Gate Entertainment Corp. Class B | | 12,603 | 338,265 |
| Time Warner, Inc. | | 98,800 | 9,184,448 |
| | | | 9,522,713 |
|
| TOTAL MEDIA | | | 44,608,916 |
|
| Wireless Telecommunication Services - 17.5% | | | |
| Wireless Telecommunication Services - 17.5% | | | |
| Millicom International Cellular SA | | 24,100 | 1,595,179 |
| Shenandoah Telecommunications Co. | | 193,767 | 6,355,558 |
| Sprint Corp. (a)(b) | | 1,358,885 | 7,052,613 |
| T-Mobile U.S., Inc. (a) | | 459,597 | 27,856,174 |
| Telephone & Data Systems, Inc. | | 388,464 | 10,892,531 |
| U.S. Cellular Corp. (a) | | 164,300 | 6,340,337 |
| VimpelCom Ltd. sponsored ADR | | 1,019,200 | 2,945,488 |
| | | | 63,037,880 |
| TOTAL COMMON STOCKS | | | |
| (Cost $312,680,019) | | | 357,217,815 |
|
| Nonconvertible Preferred Stocks - 0.5% | | | |
| Wireless Telecommunication Services - 0.5% | | | |
| Wireless Telecommunication Services - 0.5% | | | |
| TIM Participacoes SA sponsored ADR | | | |
| (Cost $1,861,185) | | 91,900 | 1,955,632 |
|
| Money Market Funds - 8.7% | | | |
| Fidelity Cash Central Fund, 1.41% (d) | | 1,837,723 | 1,838,091 |
| Fidelity Securities Lending Cash Central Fund 1.42% (d)(e) | | 29,460,348 | 29,463,294 |
| TOTAL MONEY MARKET FUNDS | | | |
| (Cost $31,300,258) | | | 31,301,385 |
| TOTAL INVESTMENT IN SECURITIES - 108.4% | | | |
| (Cost $345,841,462) | | | 390,474,832 |
| NET OTHER ASSETS (LIABILITIES) - (8.4)% | | | (30,175,304) |
| NET ASSETS - 100% | | | $360,299,528 |
Legend
(a) Non-income producing
(b) Security or a portion of the security is on loan at period end.
(c) Level 3 security
(d) Affiliated fund that is generally available only to investment companies and other accounts managed by Fidelity Investments. The rate quoted is the annualized seven-day yield of the fund at period end. A complete unaudited listing of the fund's holdings as of its most recent quarter end is available upon request. In addition, each Fidelity Central Fund's financial statements, which are not covered by the Fund's Report of Independent Registered Public Accounting Firm, are available on the SEC's website or upon request.
(e) Investment made with cash collateral received from securities on loan.
Affiliated Central Funds
Information regarding fiscal year to date income earned by the Fund from investments in Fidelity Central Funds is as follows:
| Fund | Income earned |
| Fidelity Cash Central Fund | $16,867 |
| Fidelity Securities Lending Cash Central Fund | 1,024,632 |
| Total | $1,041,499 |
Amounts in the income column in the above table include any capital gain distributions from underlying funds, which are presented in the corresponding line-item in the Statement of Operations if applicable.
Investment Valuation
The following is a summary of the inputs used, as of February 28, 2018, involving the Fund's assets and liabilities carried at fair value. The inputs or methodology used for valuing securities may not be an indication of the risk associated with investing in those securities. For more information on valuation inputs, and their aggregation into the levels used below, please refer to the Investment Valuation section in the accompanying Notes to Financial Statements.
| | Valuation Inputs at Reporting Date: |
| Description | Total | Level 1 | Level 2 | Level 3 |
| Investments in Securities: | | | | |
| Common Stocks | $357,217,815 | $351,702,440 | $5,515,374 | $1 |
| Nonconvertible Preferred Stocks | 1,955,632 | 1,955,632 | -- | -- |
| Money Market Funds | 31,301,385 | 31,301,385 | -- | -- |
| Total Investments in Securities: | $390,474,832 | $384,959,457 | $5,515,374 | $1 |
The following is a summary of transfers between Level 1 and Level 2 for the period ended February 28, 2018. Transfers are assumed to have occurred at the beginning of the period, and are primarily attributable to the valuation techniques used for foreign equity securities, as discussed in the accompanying Notes to Financial Statements:
| Transfers | Total |
| Level 1 to Level 2 | $15,663,328 |
| Level 2 to Level 1 | $0 |
See accompanying notes which are an integral part of the financial statements.
Telecommunications Portfolio
Financial Statements
Statement of Assets and Liabilities
| | | February 28, 2018 |
| Assets | | |
Investment in securities, at value (including securities loaned of $27,731,294) — See accompanying schedule:
Unaffiliated issuers (cost $314,541,204) | $359,173,447 | |
| Fidelity Central Funds (cost $31,300,258) | 31,301,385 | |
| Total Investment in Securities (cost $345,841,462) | | $390,474,832 |
| Receivable for fund shares sold | | 117,779 |
| Distributions receivable from Fidelity Central Funds | | 58,283 |
| Prepaid expenses | | 1,443 |
| Other receivables | | 25,149 |
| Total assets | | 390,677,486 |
| Liabilities | | |
| Payable for fund shares redeemed | $614,329 | |
| Accrued management fee | 167,382 | |
| Distribution and service plan fees payable | 13,209 | |
| Other affiliated payables | 75,626 | |
| Other payables and accrued expenses | 52,854 | |
| Collateral on securities loaned | 29,454,558 | |
| Total liabilities | | 30,377,958 |
| Net Assets | | $360,299,528 |
| Net Assets consist of: | | |
| Paid in capital | | $312,723,185 |
| Undistributed net investment income | | 1,308,030 |
| Accumulated undistributed net realized gain (loss) on investments and foreign currency transactions | | 1,638,240 |
| Net unrealized appreciation (depreciation) on investments and assets and liabilities in foreign currencies | | 44,630,073 |
| Net Assets | | $360,299,528 |
| Calculation of Maximum Offering Price | | |
| Class A: | | |
| Net Asset Value and redemption price per share ($17,816,126 ÷ 320,574 shares) | | $55.58 |
| Maximum offering price per share (100/94.25 of $55.58) | | $58.97 |
| Class M: | | |
| Net Asset Value and redemption price per share ($4,847,326 ÷ 87,645 shares) | | $55.31 |
| Maximum offering price per share (100/96.50 of $55.31) | | $57.32 |
| Class C: | | |
| Net Asset Value and offering price per share ($8,395,717 ÷ 151,859 shares)(a) | | $55.29 |
| Telecommunications: | | |
| Net Asset Value, offering price and redemption price per share ($320,908,125 ÷ 5,742,379 shares) | | $55.88 |
| Class I: | | |
| Net Asset Value, offering price and redemption price per share ($8,332,234 ÷ 149,485 shares) | | $55.74 |
(a) Redemption price per share is equal to net asset value less any applicable contingent deferred sales charge.
See accompanying notes which are an integral part of the financial statements.
Statement of Operations
| | | Year ended February 28, 2018 |
| Investment Income | | |
| Dividends | | $11,959,525 |
| Income from Fidelity Central Funds (including $1,024,632 from security lending) | | 1,041,499 |
| Total income | | 13,001,024 |
| Expenses | | |
| Management fee | $2,589,708 | |
| Transfer agent fees | 933,897 | |
| Distribution and service plan fees | 191,805 | |
| Accounting and security lending fees | 192,923 | |
| Custodian fees and expenses | 17,509 | |
| Independent trustees' fees and expenses | 11,267 | |
| Registration fees | 88,653 | |
| Audit | 63,220 | |
| Legal | 7,827 | |
| Interest | 11,274 | |
| Miscellaneous | 25,911 | |
| Total expenses before reductions | 4,133,994 | |
| Expense reductions | (77,723) | 4,056,271 |
| Net investment income (loss) | | 8,944,753 |
| Realized and Unrealized Gain (Loss) | | |
| Net realized gain (loss) on: | | |
| Investment securities: | | |
| Unaffiliated issuers | 61,421,052 | |
| Fidelity Central Funds | 127 | |
| Foreign currency transactions | (6,535) | |
| Total net realized gain (loss) | | 61,414,644 |
| Change in net unrealized appreciation (depreciation) on: | | |
| Investment securities: | | |
| Unaffiliated issuers | (86,609,104) | |
| Fidelity Central Funds | (9,530) | |
| Assets and liabilities in foreign currencies | 132 | |
| Total change in net unrealized appreciation (depreciation) | | (86,618,502) |
| Net gain (loss) | | (25,203,858) |
| Net increase (decrease) in net assets resulting from operations | | $(16,259,105) |
See accompanying notes which are an integral part of the financial statements.
Statement of Changes in Net Assets
| | Year ended February 28, 2018 | Year ended February 28, 2017 |
| Increase (Decrease) in Net Assets | | |
| Operations | | |
| Net investment income (loss) | $8,944,753 | $13,937,211 |
| Net realized gain (loss) | 61,414,644 | 61,532,842 |
| Change in net unrealized appreciation (depreciation) | (86,618,502) | 57,549,557 |
| Net increase (decrease) in net assets resulting from operations | (16,259,105) | 133,019,610 |
| Distributions to shareholders from net investment income | (9,787,526) | (13,294,404) |
| Distributions to shareholders from net realized gain | (66,377,876) | (31,675,318) |
| Total distributions | (76,165,402) | (44,969,722) |
| Share transactions - net increase (decrease) | (304,973,804) | (55,515,132) |
| Redemption fees | – | 54,102 |
| Total increase (decrease) in net assets | (397,398,311) | 32,588,858 |
| Net Assets | | |
| Beginning of period | 757,697,839 | 725,108,981 |
| End of period | $360,299,528 | $757,697,839 |
| Other Information | | |
| Undistributed net investment income end of period | $1,308,030 | $2,151,795 |
See accompanying notes which are an integral part of the financial statements.
Financial Highlights
Telecommunications Portfolio Class A
| Years ended February 28, | 2018 | 2017 | 2016 A | 2015 | 2014 |
| Selected Per–Share Data | | | | | |
| Net asset value, beginning of period | $69.61 | $62.32 | $63.26 | $58.71 | $51.58 |
| Income from Investment Operations | | | | | |
| Net investment income (loss)B | 1.05 | .88 | .81 | .76 | 1.76C |
| Net realized and unrealized gain (loss) | (3.38) | 10.68 | (.76) | 5.83 | 6.48 |
| Total from investment operations | (2.33) | 11.56 | .05 | 6.59 | 8.24 |
| Distributions from net investment income | (1.31) | (1.11) | (.54) | (2.04) | (1.11) |
| Distributions from net realized gain | (10.39) | (3.16) | (.45) | – | (.01) |
| Total distributions | (11.70) | (4.27) | (.99) | (2.04) | (1.11)D |
| Redemption fees added to paid in capitalB | – | –E | –E | –E | –E |
| Net asset value, end of period | $55.58 | $69.61 | $62.32 | $63.26 | $58.71 |
| Total ReturnF,G | (4.06)% | 18.65% | .16% | 11.54% | 16.00% |
| Ratios to Average Net AssetsH,I | | | | | |
| Expenses before reductions | 1.14% | 1.14% | 1.15% | 1.15% | 1.18% |
| Expenses net of fee waivers, if any | 1.14% | 1.14% | 1.15% | 1.15% | 1.18% |
| Expenses net of all reductions | 1.12% | 1.12% | 1.15% | 1.15% | 1.15% |
| Net investment income (loss) | 1.59% | 1.28% | 1.33% | 1.26% | 3.08%C |
| Supplemental Data | | | | | |
| Net assets, end of period (000 omitted) | $17,816 | $31,966 | $13,032 | $11,052 | $7,712 |
| Portfolio turnover rateJ | 66% | 105%K | 51% | 94%K | 111% |
A For the year ended February 29.
B Calculated based on average shares outstanding during the period.
C Net Investment income per share reflects a large, non-recurring dividend which amounted to $.95 per share. Excluding this non-recurring dividend, the ratio of net investment income (loss) to average net assets would have been 1.43%.
D Total distributions of $1.11 per share is comprised of distributions from net investment income of $1.106 and distributions from net realized gain of $.005 per share.
E Amount represents less than $.005 per share.
F Total returns would have been lower if certain expenses had not been reduced during the applicable periods shown.
G Total returns do not include the effect of the sales charges.
H Fees and expenses of any underlying Fidelity Central Funds are not included in the Fund's expense ratio. The Fund indirectly bears its proportionate share of the expenses of any underlying Fidelity Central Funds.
I Expense ratios reflect operating expenses of the class. Expenses before reductions do not reflect amounts reimbursed by the investment adviser or reductions from brokerage service arrangements or reductions from other expense offset arrangements and do not represent the amount paid by the class during periods when reimbursements or reductions occur. Expenses net of fee waivers reflect expenses after reimbursement by the investment adviser but prior to reductions from brokerage service arrangements or other expense offset arrangements. Expenses net of all reductions represent the net expenses paid by the class.
J Amount does not include the portfolio activity of any underlying Fidelity Central Funds.
K Portfolio turnover rate excludes securities received or delivered in-kind.
See accompanying notes which are an integral part of the financial statements.
Telecommunications Portfolio Class M
| Years ended February 28, | 2018 | 2017 | 2016 A | 2015 | 2014 |
| Selected Per–Share Data | | | | | |
| Net asset value, beginning of period | $69.33 | $61.95 | $63.04 | $58.50 | $51.41 |
| Income from Investment Operations | | | | | |
| Net investment income (loss)B | .81 | .65 | .61 | .57 | 1.59C |
| Net realized and unrealized gain (loss) | (3.36) | 10.62 | (.76) | 5.81 | 6.44 |
| Total from investment operations | (2.55) | 11.27 | (.15) | 6.38 | 8.03 |
| Distributions from net investment income | (1.07) | (.73) | (.49) | (1.84) | (.94) |
| Distributions from net realized gain | (10.39) | (3.16) | (.45) | – | (.01) |
| Total distributions | (11.47)D | (3.89) | (.94) | (1.84) | (.94)E |
| Redemption fees added to paid in capitalB | – | –F | –F | –F | –F |
| Net asset value, end of period | $55.31 | $69.33 | $61.95 | $63.04 | $58.50 |
| Total ReturnG,H | (4.40)% | 18.26% | (.16)% | 11.19% | 15.64% |
| Ratios to Average Net AssetsI,J | | | | | |
| Expenses before reductions | 1.49% | 1.46% | 1.47% | 1.47% | 1.48% |
| Expenses net of fee waivers, if any | 1.49% | 1.46% | 1.47% | 1.47% | 1.48% |
| Expenses net of all reductions | 1.48% | 1.44% | 1.46% | 1.46% | 1.45% |
| Net investment income (loss) | 1.24% | .96% | 1.01% | .94% | 2.78%C |
| Supplemental Data | | | | | |
| Net assets, end of period (000 omitted) | $4,847 | $6,933 | $8,280 | $5,095 | $4,344 |
| Portfolio turnover rateK | 66% | 105%L | 51% | 94%L | 111% |
A For the year ended February 29.
B Calculated based on average shares outstanding during the period.
C Net Investment income per share reflects a large, non-recurring dividend which amounted to $.94 per share. Excluding this non-recurring dividend, the ratio of net investment income (loss) to average net assets would have been 1.13%.
D Total distributions of $11.47 per share is comprised of distributions from net investment income of $1.073 and distributions from net realized gain of $10.393 per share.
E Total distributions of $.94 per share is comprised of distributions from net investment income of $.939 and distributions from net realized gain of $.005 per share.
F Amount represents less than $.005 per share.
G Total returns would have been lower if certain expenses had not been reduced during the applicable periods shown.
H Total returns do not include the effect of the sales charges.
I Fees and expenses of any underlying Fidelity Central Funds are not included in the Fund's expense ratio. The Fund indirectly bears its proportionate share of the expenses of any underlying Fidelity Central Funds.
J Expense ratios reflect operating expenses of the class. Expenses before reductions do not reflect amounts reimbursed by the investment adviser or reductions from brokerage service arrangements or reductions from other expense offset arrangements and do not represent the amount paid by the class during periods when reimbursements or reductions occur. Expenses net of fee waivers reflect expenses after reimbursement by the investment adviser but prior to reductions from brokerage service arrangements or other expense offset arrangements. Expenses net of all reductions represent the net expenses paid by the class.
K Amount does not include the portfolio activity of any underlying Fidelity Central Funds.
L Portfolio turnover rate excludes securities received or delivered in-kind.
See accompanying notes which are an integral part of the financial statements.
Telecommunications Portfolio Class C
| Years ended February 28, | 2018 | 2017 | 2016 A | 2015 | 2014 |
| Selected Per–Share Data | | | | | |
| Net asset value, beginning of period | $69.24 | $62.10 | $63.04 | $58.54 | $51.47 |
| Income from Investment Operations | | | | | |
| Net investment income (loss)B | .57 | .37 | .36 | .34 | 1.36C |
| Net realized and unrealized gain (loss) | (3.36) | 10.62 | (.75) | 5.80 | 6.46 |
| Total from investment operations | (2.79) | 10.99 | (.39) | 6.14 | 7.82 |
| Distributions from net investment income | (.77) | (.69) | (.10) | (1.64) | (.74) |
| Distributions from net realized gain | (10.39) | (3.16) | (.45) | – | (.01) |
| Total distributions | (11.16) | (3.85) | (.55) | (1.64) | (.75) |
| Redemption fees added to paid in capitalB | – | –D | –D | –D | –D |
| Net asset value, end of period | $55.29 | $69.24 | $62.10 | $63.04 | $58.54 |
| Total ReturnE,F | (4.75)% | 17.77% | (.57)% | 10.75% | 15.20% |
| Ratios to Average Net AssetsG,H | | | | | |
| Expenses before reductions | 1.86% | 1.88% | 1.89% | 1.85% | 1.88% |
| Expenses net of fee waivers, if any | 1.86% | 1.88% | 1.89% | 1.85% | 1.88% |
| Expenses net of all reductions | 1.85% | 1.86% | 1.88% | 1.85% | 1.85% |
| Net investment income (loss) | .87% | .54% | .60% | .56% | 2.38%C |
| Supplemental Data | | | | | |
| Net assets, end of period (000 omitted) | $8,396 | $13,528 | $7,735 | $7,074 | $5,523 |
| Portfolio turnover rateI | 66% | 105%J | 51% | 94%J | 111% |
A For the year ended February 29.
B Calculated based on average shares outstanding during the period.
C Net Investment income per share reflects a large, non-recurring dividend which amounted to $.94 per share. Excluding this non-recurring dividend, the ratio of net investment income (loss) to average net assets would have been .73%.
D Amount represents less than $.005 per share.
E Total returns would have been lower if certain expenses had not been reduced during the applicable periods shown.
F Total returns do not include the effect of the contingent deferred sales charge.
G Fees and expenses of any underlying Fidelity Central Funds are not included in the Fund's expense ratio. The Fund indirectly bears its proportionate share of the expenses of any underlying Fidelity Central Funds.
H Expense ratios reflect operating expenses of the class. Expenses before reductions do not reflect amounts reimbursed by the investment adviser or reductions from brokerage service arrangements or reductions from other expense offset arrangements and do not represent the amount paid by the class during periods when reimbursements or reductions occur. Expenses net of fee waivers reflect expenses after reimbursement by the investment adviser but prior to reductions from brokerage service arrangements or other expense offset arrangements. Expenses net of all reductions represent the net expenses paid by the class.
I Amount does not include the portfolio activity of any underlying Fidelity Central Funds.
J Portfolio turnover rate excludes securities received or delivered in-kind.
See accompanying notes which are an integral part of the financial statements.
Telecommunications Portfolio
| Years ended February 28, | 2018 | 2017 | 2016 A | 2015 | 2014 |
| Selected Per–Share Data | | | | | |
| Net asset value, beginning of period | $69.97 | $62.58 | $63.54 | $58.94 | $51.75 |
| Income from Investment Operations | | | | | |
| Net investment income (loss)B | 1.28 | 1.12 | 1.02 | .96 | 1.96C |
| Net realized and unrealized gain (loss) | (3.42) | 10.74 | (.77) | 5.85 | 6.51 |
| Total from investment operations | (2.14) | 11.86 | .25 | 6.81 | 8.47 |
| Distributions from net investment income | (1.56) | (1.31) | (.76) | (2.21) | (1.28) |
| Distributions from net realized gain | (10.39) | (3.16) | (.45) | – | (.01) |
| Total distributions | (11.95) | (4.47) | (1.21) | (2.21) | (1.28)D |
| Redemption fees added to paid in capitalB | – | –E | –E | –E | –E |
| Net asset value, end of period | $55.88 | $69.97 | $62.58 | $63.54 | $58.94 |
| Total ReturnF | (3.76)% | 19.06% | .49% | 11.90% | 16.40% |
| Ratios to Average Net AssetsG,H | | | | | |
| Expenses before reductions | .82% | .80% | .82% | .83% | .85% |
| Expenses net of fee waivers, if any | .82% | .80% | .81% | .83% | .85% |
| Expenses net of all reductions | .80% | .78% | .81% | .82% | .82% |
| Net investment income (loss) | 1.92% | 1.62% | 1.67% | 1.58% | 3.41%C |
| Supplemental Data | | | | | |
| Net assets, end of period (000 omitted) | $320,908 | $690,720 | $689,600 | $346,174 | $343,548 |
| Portfolio turnover rateI | 66% | 105%J | 51% | 94%J | 111% |
A For the year ended February 29.
B Calculated based on average shares outstanding during the period.
C Net Investment income per share reflects a large, non-recurring dividend which amounted to $.95 per share. Excluding this non-recurring dividend, the ratio of net investment income (loss) to average net assets would have been 1.76%.
D Total distributions of $1.28 per share is comprised of distributions from net investment income of $1.275 and distributions from net realized gain of $.005 per share.
E Amount represents less than $.005 per share.
F Total returns would have been lower if certain expenses had not been reduced during the applicable periods shown.
G Fees and expenses of any underlying Fidelity Central Funds are not included in the Fund's expense ratio. The Fund indirectly bears its proportionate share of the expenses of any underlying Fidelity Central Funds.
H Expense ratios reflect operating expenses of the class. Expenses before reductions do not reflect amounts reimbursed by the investment adviser or reductions from brokerage service arrangements or reductions from other expense offset arrangements and do not represent the amount paid by the class during periods when reimbursements or reductions occur. Expenses net of fee waivers reflect expenses after reimbursement by the investment adviser but prior to reductions from brokerage service arrangements or other expense offset arrangements. Expenses net of all reductions represent the net expenses paid by the class.
I Amount does not include the portfolio activity of any underlying Fidelity Central Funds.
J Portfolio turnover rate excludes securities received or delivered in-kind.
See accompanying notes which are an integral part of the financial statements.
Telecommunications Portfolio Class I
| Years ended February 28, | 2018 | 2017 | 2016 A | 2015 | 2014 |
| Selected Per–Share Data | | | | | |
| Net asset value, beginning of period | $69.82 | $62.46 | $63.38 | $58.80 | $51.65 |
| Income from Investment Operations | | | | | |
| Net investment income (loss)B | 1.26 | 1.12 | 1.02 | .94 | 1.93C |
| Net realized and unrealized gain (loss) | (3.39) | 10.70 | (.76) | 5.83 | 6.48 |
| Total from investment operations | (2.13) | 11.82 | .26 | 6.77 | 8.41 |
| Distributions from net investment income | (1.56) | (1.30) | (.73) | (2.19) | (1.25) |
| Distributions from net realized gain | (10.39) | (3.16) | (.45) | – | (.01) |
| Total distributions | (11.95) | (4.46) | (1.18) | (2.19) | (1.26) |
| Redemption fees added to paid in capitalB | – | –D | –D | –D | –D |
| Net asset value, end of period | $55.74 | $69.82 | $62.46 | $63.38 | $58.80 |
| Total ReturnE | (3.75)% | 19.03% | .51% | 11.85% | 16.30% |
| Ratios to Average Net AssetsF,G | | | | | |
| Expenses before reductions | .82% | .80% | .82% | .86% | .91% |
| Expenses net of fee waivers, if any | .82% | .80% | .82% | .86% | .91% |
| Expenses net of all reductions | .80% | .78% | .81% | .85% | .88% |
| Net investment income (loss) | 1.91% | 1.62% | 1.67% | 1.55% | 3.35%C |
| Supplemental Data | | | | | |
| Net assets, end of period (000 omitted) | $8,332 | $14,550 | $6,197 | $2,505 | $1,604 |
| Portfolio turnover rateH | 66% | 105%I | 51% | 94%I | 111% |
A For the year ended February 29.
B Calculated based on average shares outstanding during the period.
C Net Investment income per share reflects a large, non-recurring dividend which amounted to $.95 per share. Excluding this non-recurring dividend, the ratio of net investment income (loss) to average net assets would have been 1.70%.
D Amount represents less than $.005 per share.
E Total returns would have been lower if certain expenses had not been reduced during the applicable periods shown.
F Fees and expenses of any underlying Fidelity Central Funds are not included in the Fund's expense ratio. The Fund indirectly bears its proportionate share of the expenses of any underlying Fidelity Central Funds.
G Expense ratios reflect operating expenses of the class. Expenses before reductions do not reflect amounts reimbursed by the investment adviser or reductions from brokerage service arrangements or reductions from other expense offset arrangements and do not represent the amount paid by the class during periods when reimbursements or reductions occur. Expenses net of fee waivers reflect expenses after reimbursement by the investment adviser but prior to reductions from brokerage service arrangements or other expense offset arrangements. Expenses net of all reductions represent the net expenses paid by the class.
H Amount does not include the portfolio activity of any underlying Fidelity Central Funds.
I Portfolio turnover rate excludes securities received or delivered in-kind.
See accompanying notes which are an integral part of the financial statements.
Notes to Financial Statements
For the period ended February 28, 2018
1. Organization.
Telecommunications Portfolio (the Fund) is a non-diversified fund of Fidelity Select Portfolios (the Trust) and is authorized to issue an unlimited number of shares. The Trust is registered under the Investment Company Act of 1940, as amended (the 1940 Act), as an open-end management investment company organized as a Massachusetts business trust. The Fund invests primarily in securities of companies whose principal business activities fall within specific industries. The Fund offers Class A, Class M (formerly Class T), Class C, Telecommunications and Class I shares, each of which has equal rights as to assets and voting privileges. Each class has exclusive voting rights with respect to matters that affect that class.
After the close of business on June 24, 2016, all outstanding Class B shares were converted to Class A shares. All prior fiscal period dollar and share amounts for Class B presented in the Notes to Financial Statements are for the period March 1, 2016 through June 24, 2016.
2. Investments in Fidelity Central Funds.
The Fund invests in Fidelity Central Funds, which are open-end investment companies generally available only to other investment companies and accounts managed by the investment adviser and its affiliates. The Fund's Schedule of Investments lists each of the Fidelity Central Funds held as of period end, if any, as an investment of the Fund, but does not include the underlying holdings of each Fidelity Central Fund. As an Investing Fund, the Fund indirectly bears its proportionate share of the expenses of the underlying Fidelity Central Funds.
The Money Market Central Funds seek preservation of capital and current income and are managed by Fidelity Investments Money Management, Inc. (FIMM), an affiliate of the investment adviser. Annualized expenses of the Money Market Central Funds as of their most recent shareholder report date are less than .005%.
A complete unaudited list of holdings for each Fidelity Central Fund is available upon request or at the Securities and Exchange Commission (the SEC) website at www.sec.gov. In addition, the financial statements of the Fidelity Central Funds, which are not covered by the Fund's Report of Independent Registered Public Accounting Firm, are available on the SEC website or upon request.
3. Significant Accounting Policies.
The Fund is an investment company and applies the accounting and reporting guidance of the Financial Accounting Standards Board (FASB) Accounting Standards Codification Topic 946 Financial Services – Investments Companies. The financial statements have been prepared in conformity with accounting principles generally accepted in the United States of America (GAAP), which require management to make certain estimates and assumptions at the date of the financial statements. Actual results could differ from those estimates. Subsequent events, if any, through the date that the financial statements were issued have been evaluated in the preparation of the financial statements. The following summarizes the significant accounting policies of the Fund:
Investment Valuation. Investments are valued as of 4:00 p.m. Eastern time on the last calendar day of the period. The Board of Trustees (the Board) has delegated the day to day responsibility for the valuation of the Fund's investments to the Fair Value Committee (the Committee) established by the Fund's investment adviser. In accordance with valuation policies and procedures approved by the Board, the Fund attempts to obtain prices from one or more third party pricing vendors or brokers to value its investments. When current market prices, quotations or currency exchange rates are not readily available or reliable, investments will be fair valued in good faith by the Committee, in accordance with procedures adopted by the Board. Factors used in determining fair value vary by investment type and may include market or investment specific events. The frequency with which these procedures are used cannot be predicted and they may be utilized to a significant extent. The Committee oversees the Fund's valuation policies and procedures and reports to the Board on the Committee's activities and fair value determinations. The Board monitors the appropriateness of the procedures used in valuing the Fund's investments and ratifies the fair value determinations of the Committee.
The Fund categorizes the inputs to valuation techniques used to value its investments into a disclosure hierarchy consisting of three levels as shown below:
- Level 1 – quoted prices in active markets for identical investments
- Level 2 – other significant observable inputs (including quoted prices for similar investments, interest rates, prepayment speeds, etc.)
- Level 3 – unobservable inputs (including the Fund's own assumptions based on the best information available)
Valuation techniques used to value the Fund's investments by major category are as follows:
Equity securities, including restricted securities, for which market quotations are readily available, are valued at the last reported sale price or official closing price as reported by a third party pricing vendor on the primary market or exchange on which they are traded and are categorized as Level 1 in the hierarchy. In the event there were no sales during the day or closing prices are not available, securities are valued at the last quoted bid price or may be valued using the last available price and are generally categorized as Level 2 in the hierarchy. For foreign equity securities, when market or security specific events arise, comparisons to the valuation of American Depositary Receipts (ADRs), futures contracts, Exchange-Traded Funds (ETFs) and certain indexes as well as quoted prices for similar securities may be used and would be categorized as Level 2 in the hierarchy. Utilizing these techniques may result in transfers between Level 1 and Level 2. For equity securities, including restricted securities, where observable inputs are limited, assumptions about market activity and risk are used and these securities may be categorized as Level 3 in the hierarchy.
Investments in open-end mutual funds, including the Fidelity Central Funds, are valued at their closing net asset value (NAV) each business day and are categorized as Level 1 in the hierarchy.
Changes in valuation techniques may result in transfers in or out of an assigned level within the disclosure hierarchy. The aggregate value of investments by input level as of February 28, 2018, including information on transfers between Levels 1 and 2 is included at the end of the Fund's Schedule of Investments.
Foreign Currency. The Fund may use foreign currency contracts to facilitate transactions in foreign-denominated securities. Gains and losses from these transactions may arise from changes in the value of the foreign currency or if the counterparties do not perform under the contracts' terms.
Foreign-denominated assets, including investment securities, and liabilities are translated into U.S. dollars at the exchange rates at period end. Purchases and sales of investment securities, income and dividends received and expenses denominated in foreign currencies are translated into U.S. dollars at the exchange rate in effect on the transaction date.
The effects of exchange rate fluctuations on investments are included with the net realized and unrealized gain (loss) on investment securities. Other foreign currency transactions resulting in realized and unrealized gain (loss) are disclosed separately.
Investment Transactions and Income. For financial reporting purposes, the Fund's investment holdings and NAV include trades executed through the end of the last business day of the period. The NAV per share for processing shareholder transactions is calculated as of the close of business of the New York Stock Exchange (NYSE), normally 4:00 p.m. Eastern time and includes trades executed through the end of the prior business day. Gains and losses on securities sold are determined on the basis of identified cost and includes proceeds received from litigation. Dividend income is recorded on the ex-dividend date, except for certain dividends from foreign securities where the ex-dividend date may have passed, which are recorded as soon as the Fund is informed of the ex-dividend date. Non-cash dividends included in dividend income, if any, are recorded at the fair market value of the securities received. Income and capital gain distributions from Fidelity Central Funds, if any, are recorded on the ex-dividend date. Certain distributions received by the Fund represent a return of capital or capital gain. The Fund determines the components of these distributions subsequent to the ex-dividend date, based upon receipt of tax filings or other correspondence relating to the underlying investment. These distributions are recorded as a reduction of cost of investments and/or as a realized gain. Investment income is recorded net of foreign taxes withheld where recovery of such taxes is uncertain.
Class Allocations and Expenses. Investment income, realized and unrealized capital gains and losses, common expenses of the Fund, and certain fund-level expense reductions, if any, are allocated daily on a pro-rata basis to each class based on the relative net assets of each class to the total net assets of the Fund. Each class differs with respect to transfer agent and distribution and service plan fees incurred. Certain expense reductions may also differ by class. For the reporting period, the allocated portion of income and expenses to each class as a percent of its average net assets may vary due to the timing of recording these transactions in relation to fluctuating net assets of the classes. Expenses directly attributable to a fund are charged to that fund. Expenses attributable to more than one fund are allocated among the respective funds on the basis of relative net assets or other appropriate methods. Expense estimates are accrued in the period to which they relate and adjustments are made when actual amounts are known.
Income Tax Information and Distributions to Shareholders. Each year, the Fund intends to qualify as a regulated investment company under Subchapter M of the Internal Revenue Code, including distributing substantially all of its taxable income and realized gains. As a result, no provision for U.S. Federal income taxes is required. As of February 28, 2018, the Fund did not have any unrecognized tax benefits in the financial statements; nor is the Fund aware of any tax positions for which it is reasonably possible that the total amounts of unrecognized tax benefits will significantly change in the next twelve months. The Fund files a U.S. federal tax return, in addition to state and local tax returns as required. The Fund's federal income tax returns are subject to examination by the Internal Revenue Service (IRS) for a period of three fiscal years after they are filed. State and local tax returns may be subject to examination for an additional fiscal year depending on the jurisdiction. Foreign taxes are provided for based on the Fund's understanding of the tax rules and rates that exist in the foreign markets in which it invests.
Distributions are declared and recorded on the ex-dividend date. Income dividends and capital gain distributions are declared separately for each class. Income and capital gain distributions are determined in accordance with income tax regulations, which may differ from GAAP.
Capital accounts within the financial statements are adjusted for permanent book-tax differences. These adjustments have no impact on net assets or the results of operations. Capital accounts are not adjusted for temporary book-tax differences which will reverse in a subsequent period.
Book-tax differences are primarily due to foreign currency transactions, certain deemed distributions and losses deferred due to wash sales.
As of period end, the cost and unrealized appreciation (depreciation) in securities, and derivatives if applicable, for federal income tax purposes were as follows:
| Gross unrealized appreciation | $74,138,518 |
| Gross unrealized depreciation | (31,769,857) |
| Net unrealized appreciation (depreciation) | $42,368,661 |
| Tax Cost | $348,106,171 |
The tax-based components of distributable earnings as of period end were as follows:
| Undistributed ordinary income | $1,308,030 |
| Undistributed long-term capital gain | $3,902,949 |
| Net unrealized appreciation (depreciation) on securities and other investments | $42,365,364 |
The tax character of distributions paid was as follows:
| | February 28, 2018 | February 28, 2017 |
| Ordinary Income | $16,292,007 | $ 33,284,559 |
| Long-term Capital Gains | 59,873,395 | 11,685,163 |
| Total | $76,165,402 | $ 44,969,722 |
4. Purchases and Sales of Investments.
Purchases and sales of securities, other than short-term securities, aggregated $320,343,309 and $690,123,904, respectively.
5. Fees and Other Transactions with Affiliates.
Management Fee. Fidelity SelectCo, LLC (the investment adviser) and its affiliates provide the Fund with investment management related services for which the Fund pays a monthly management fee. The management fee is the sum of an individual fund fee rate that is based on an annual rate of .30% of the Fund's average net assets and an annualized group fee rate that averaged .24% during the period. The group fee rate is based upon the average net assets of all the mutual funds advised by Fidelity Management & Research Company (FMR) and the investment adviser. The group fee rate decreases as assets under management increase and increases as assets under management decrease. For the reporting period, the total annual management fee rate was .54% of the Fund's average net assets.
Distribution and Service Plan Fees. In accordance with Rule 12b-1 of the 1940 Act, the Fund has adopted separate Distribution and Service Plans for each class of shares. Certain classes pay Fidelity Distributors Corporation (FDC), an affiliate of the investment adviser, separate Distribution and Service Fees, each of which is based on an annual percentage of each class' average net assets. In addition, FDC may pay financial intermediaries for selling shares of the Fund and providing shareholder support services. For the period, the Distribution and Service Fee rates, total fees and amounts retained by FDC were as follows:
| | Distribution Fee | Service Fee | Total Fees | Retained by FDC |
| Class A | -% | .25% | $56,288 | $549 |
| Class M | .25% | .25% | 28,768 | – |
| Class C | .75% | .25% | 106,749 | 18,929 |
| | | | $191,805 | $19,478 |
Sales Load. FDC may receive a front-end sales charge of up to 5.75% for selling Class A shares and 3.50% for selling Class M shares, some of which is paid to financial intermediaries for selling shares of the Fund. Depending on the holding period, FDC may receive contingent deferred sales charges levied on Class A, Class M and Class C redemptions. The deferred sales charges are 1.00% for Class C shares, 1.00% for certain purchases of Class A shares and .25% for certain purchases of Class M shares.
For the period, sales charge amounts retained by FDC were as follows:
| | Retained by FDC |
| Class A | $17,703 |
| Class M | 2,079 |
| Class C(a) | 4,933 |
| | $24,715 |
(a) When Class C shares are initially sold, FDC pays commissions from its own resources to financial intermediaries through which the sales are made.
Transfer Agent Fees. Fidelity Investments Institutional Operations Company, Inc., (FIIOC), an affiliate of the investment adviser, is the transfer, dividend disbursing and shareholder servicing agent for each class of the Fund. FIIOC receives account fees and asset-based fees that vary according to the account size and type of account of the shareholders of the respective classes of the Fund. FIIOC pays for typesetting, printing and mailing of shareholder reports, except proxy statements.
For the period, transfer agent fees for each class were as follows:
| | Amount | % of Class-Level Average Net Assets |
| Class A | $59,019 | .26 |
| Class M | 21,139 | .37 |
| Class C | 25,248 | .24 |
| Telecommunications | 805,725 | .19 |
| Class I | 22,766 | .19 |
| | $933,897 | |
Accounting and Security Lending Fees. Fidelity Service Company, Inc. (FSC), an affiliate of the investment adviser, maintains the Fund's accounting records. The accounting fee is based on the level of average net assets for each month. Under a separate contract, FSC administers the security lending program. The security lending fee is based on the number and duration of lending transactions.
Brokerage Commissions. The Fund placed a portion of its portfolio transactions with brokerage firms which are affiliates of the investment adviser. Brokerage commissions are included in net realized gain (loss) and change in net unrealized appreciation (depreciation) in the Statement of Operations. The commissions paid to these affiliated firms were $30,814 for the period.
Interfund Lending Program. Pursuant to an Exemptive Order issued by the SEC, the Fund, along with other registered investment companies having management contracts with Fidelity Management & Research Company (FMR) or other affiliated entities of FMR, may participate in an interfund lending program. This program provides an alternative credit facility allowing the funds to borrow from, or lend money to, other participating affiliated funds. At period end, there were no interfund loans outstanding. The Fund's activity in this program during the period for which loans were outstanding was as follows:
| Borrower or Lender | Average Loan Balance | Weighted Average Interest Rate | Interest Expense |
| Borrower | $6,749,957 | 1.15% | $10,093 |
Interfund Trades. The Fund may purchase from or sell securities to other Fidelity Funds under procedures adopted by the Board. The procedures have been designed to ensure these interfund trades are executed in accordance with Rule 17a-7 of the 1940 Act. Interfund trades are included within the respective purchases and sales amounts shown in the Purchases and Sales of Investments note.
Prior Fiscal Year Redemptions In-Kind. During the prior period, 805,095 shares of Telecommunications Portfolio held by an affiliated entity were redeemed in-kind for investments and cash with a value of $53,345,591. The Fund had a net realized gain of $12,655,696 on investments delivered through in-kind redemptions. The amount of the in-kind redemptions is included in share transactions in the accompanying Statement of Changes in Net Assets as well as the Notes to Financial Statements. Telecommunications Portfolio recognized no gain or loss for federal income tax purposes.
6. Committed Line of Credit.
The Fund participates with other funds managed by the investment adviser or an affiliate in a $4.25 billion credit facility (the "line of credit") to be utilized for temporary or emergency purposes to fund shareholder redemptions or for other short-term liquidity purposes. The Fund has agreed to pay commitment fees on its pro-rata portion of the line of credit, which amounted to $1,732 and is reflected in Miscellaneous expenses on the Statement of Operations. During the period, the Fund did not borrow on this line of credit.
7. Security Lending.
The Fund lends portfolio securities through a lending agent from time to time in order to earn additional income. On the settlement date of the loan, the Fund receives collateral (in the form of U.S. Treasury obligations, letters of credit and/or cash) against the loaned securities and maintains collateral in an amount not less than 100% of the market value of the loaned securities during the period of the loan. The market value of the loaned securities is determined at the close of business of the Fund and any additional required collateral is delivered to the Fund on the next business day. The Fund or borrower may terminate the loan at any time, and if the borrower defaults on its obligation to return the securities loaned because of insolvency or other reasons, the Fund may apply collateral received from the borrower against the obligation. The Fund may experience delays and costs in recovering the securities loaned. Any cash collateral received is invested in the Fidelity Securities Lending Cash Central Fund. The value of loaned securities and cash collateral at period end are disclosed on the Fund's Statement of Assets and Liabilities. Security lending income represents the income earned on investing cash collateral, less rebates paid to borrowers and any lending agent fees associated with the loan, plus any premium payments received for lending certain types of securities. Security lending income is presented in the Statement of Operations as a component of income from Fidelity Central Funds.
8. Bank Borrowings.
The Fund is permitted to have bank borrowings for temporary or emergency purposes to fund shareholder redemptions or for other short-term liquidity requirements. The Fund has established borrowing arrangements with certain banks. The interest rate on the borrowings is the bank's base rate, as revised from time to time. The average loan balance during the period for which loans were outstanding amounted to $3,895,111. The weighted average interest rate was 1.21%. The interest expense amounted to $1,181 under the bank borrowing program. At period end, there were no bank borrowings outstanding.
9. Expense Reductions.
Commissions paid to certain brokers with whom the investment adviser, or its affiliates, places trades on behalf of the Fund include an amount in addition to trade execution, which may be rebated back to the Fund to offset certain expenses. This amount totaled $72,277 for the period.
In addition, during the period the investment adviser reimbursed and/or waived a portion of fund-level operating expenses in the amount of $5,446.
10. Distributions to Shareholders.
Distributions to shareholders of each class were as follows:
| | Year ended
February 28, 2018 | Year ended
February 28, 2017 |
| From net investment income | | |
| Class A | $396,755 | $455,173 |
| Class M | 86,824 | 67,280 |
| Class C | 113,266 | 124,522 |
| Telecommunications | 8,955,299 | 12,452,745 |
| Class I | 235,382 | 194,684 |
| Total | $9,787,526 | $13,294,404 |
| From net realized gain | | |
| Class A | $3,147,334 | $1,308,078 |
| Class M | 841,588 | 287,783 |
| Class C | 1,545,756 | 572,522 |
| Telecommunications | 59,280,788 | 29,029,256 |
| Class I | 1,562,410 | 477,679 |
| Total | $66,377,876 | $31,675,318 |
11. Share Transactions.
Share transactions for each class were as follows and may contain automatic conversions between classes or exchanges between affiliated funds:
| | Shares | Shares | Dollars | Dollars |
| | Year ended February 28, 2018 | Year ended February 28, 2017 | Year ended February 28, 2018 | Year ended February 28, 2017 |
| Class A | | | | |
| Shares sold | 76,520 | 521,786 | $4,987,299 | $35,388,038 |
| Reinvestment of distributions | 57,962 | 24,324 | 3,454,010 | 1,671,796 |
| Shares redeemed | (273,126) | (296,004) | (18,205,397) | (20,518,786) |
| Net increase (decrease) | (138,644) | 250,106 | $(9,764,088) | $16,541,048 |
| Class M | | | | |
| Shares sold | 21,912 | 82,122 | $1,457,815 | $5,468,018 |
| Reinvestment of distributions | 15,649 | 5,039 | 926,496 | 345,400 |
| Shares redeemed | (49,923) | (120,797) | (3,308,018) | (8,187,323) |
| Net increase (decrease) | (12,362) | (33,636) | $(923,707) | $(2,373,905) |
| Class B | | | | |
| Shares sold | – | 975 | $– | $64,042 |
| Shares redeemed | – | (5,216) | – | (349,278) |
| Net increase (decrease) | – | (4,241) | $– | $(285,236) |
| Class C | | | | |
| Shares sold | 31,294 | 135,768 | $2,045,854 | $9,283,679 |
| Reinvestment of distributions | 25,537 | 8,829 | 1,513,170 | 604,885 |
| Shares redeemed | (100,350) | (73,776) | (6,561,447) | (5,085,863) |
| Net increase (decrease) | (43,519) | 70,821 | $(3,002,423) | $4,802,701 |
| Telecommunications | | | | |
| Shares sold | 1,189,602 | 6,206,062 | $77,745,057 | $424,943,213 |
| Reinvestment of distributions | 1,082,670 | 578,869 | 65,288,273 | 39,940,628 |
| Shares redeemed | (6,401,925) | (7,931,924)(a) | (430,649,733) | (546,713,599)(a) |
| Net increase (decrease) | (4,129,653) | (1,146,993) | $(287,616,403) | $(81,829,758) |
| Class I | | | | |
| Shares sold | 250,120 | 536,498 | $16,564,921 | $37,085,732 |
| Reinvestment of distributions | 25,845 | 8,128 | 1,544,599 | 559,963 |
| Shares redeemed | (334,874) | (435,454) | (21,776,703) | (30,015,677) |
| Net increase (decrease) | (58,909) | 109,172 | $(3,667,183) | $7,630,018 |
(a) Amount includes in-kind redemptions (see the Prior Fiscal Year Redemptions In-Kind note for additional details).
12. Other.
The Fund's organizational documents provide former and current trustees and officers with a limited indemnification against liabilities arising in connection with the performance of their duties to the Fund. In the normal course of business, the Fund may also enter into contracts that provide general indemnifications. The Fund's maximum exposure under these arrangements is unknown as this would be dependent on future claims that may be made against the Fund. The risk of material loss from such claims is considered remote.
Wireless Portfolio
Performance: The Bottom Line
Average annual total return reflects the change in the value of an investment, assuming reinvestment of distributions from dividend income and capital gains (the profits earned upon the sale of securities that have grown in value, if any) and assuming a constant rate of performance each year. The hypothetical investment and the average annual total returns do not reflect the deduction of taxes that a shareholder would pay on fund distributions or the redemption of fund shares. During periods of reimbursement by Fidelity, a fund’s total return will be greater than it would be had the reimbursement not occurred. How a fund did yesterday is no guarantee of how it will do tomorrow.
Average Annual Total Returns
| For the periods ended February 28, 2018 | Past 1 year | Past 5 years | Past 10 years |
| Wireless Portfolio | 17.21% | 11.54% | 8.57% |
$10,000 Over 10 Years
Let's say hypothetically that $10,000 was invested in Wireless Portfolio on February 29, 2008.
The chart shows how the value of your investment would have changed, and also shows how the S&P 500® Index performed over the same period.
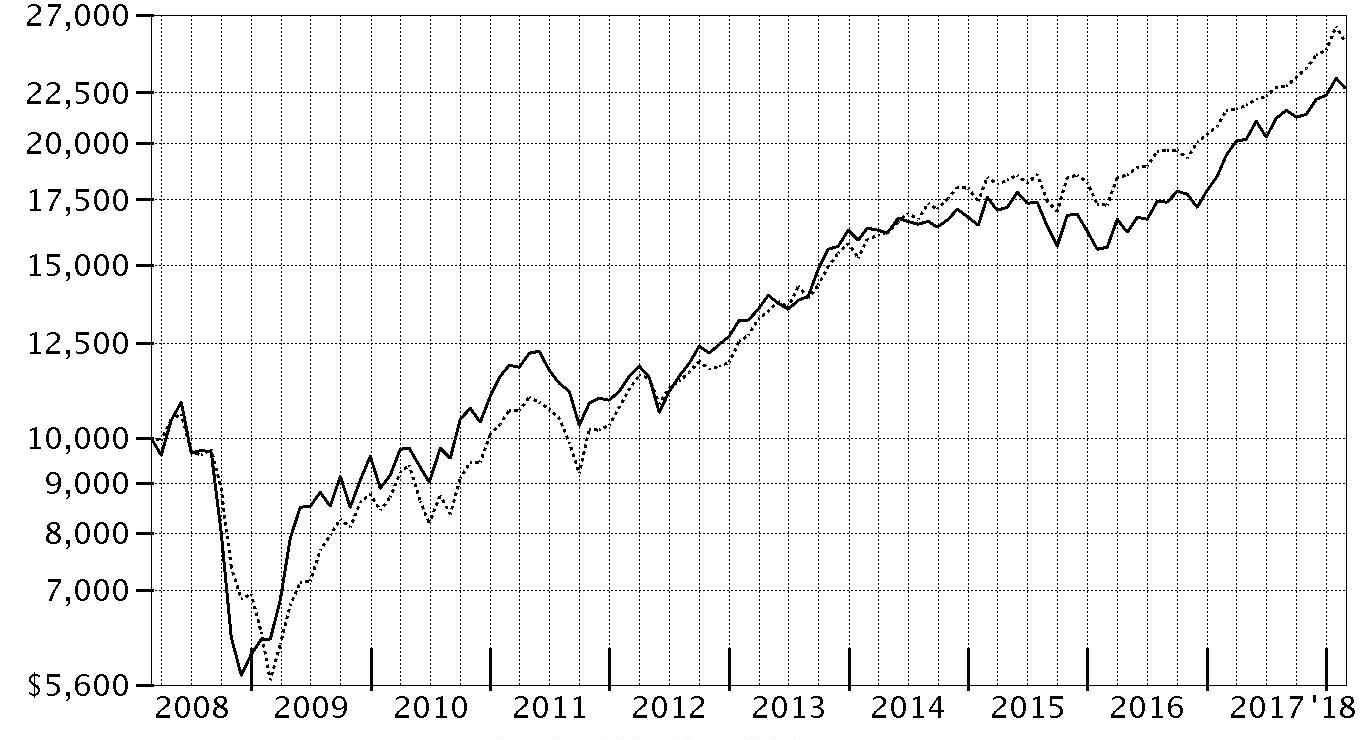
| Period Ending Values |
| $22,747 | Wireless Portfolio |
| $25,307 | S&P 500® Index |
Wireless Portfolio
Management's Discussion of Fund Performance
Market Recap: U.S. equities gained 17.10% for the 12 months ending February 28, 2018, as the S&P 500
® index moved steadily higher throughout 2017 and into 2018 until sharply reversing course in February. The drop was in stark contrast to the low volatility seen throughout 2017, along with consumer sentiment and other market indicators that stayed positive. Investors remained decidedly upbeat as the calendar turned, and the index rose 5.73% in January. February was a decidedly different story, though, as volatility spiked amid fear that rising inflation and the potential for the economy to overheat would prompt the U.S. Federal Reserve to pick up the pace of interest rate hikes. The index returned -3.69% for the month, its first negative result since October 2016. For the full 12 months, growth stocks handily topped value, while large-caps bested small-caps. By sector, information technology fared best by far, gaining 36% amid strong earnings growth from several major index constituents. Consumer discretionary (+22%) also stood out, driven by retailers. Financials added 20%, riding the uptick in bond yields. Materials and industrials rose about 16% each, boosted by higher demand, especially from China. Conversely, notable laggards included the defensive telecommunication services (-5%) and utilities (-2%) sectors, while rising rates held back real estate (-3%).
Comments from Portfolio Manager Matthew Drukker: For the year,the fund gained 17.21%, strongly outpacing the 12.42% return of the sector benchmark, the Fidelity Wireless Index, and finishing ahead of the broad-market S&P 500
®. Favorable stock selection largely drove the fund’s outperformance versus the Fidelity industry benchmark. Choices in the integrated telecommunication services segment added considerable value, led by shares of Spanish mobile wireless provider Masmovil Ibercom (332%), an out-of-index holding and the fund’s largest relative contributor. Significantly underweighting telecom services provider AT&T (-9%) also worked well. Additionally, foreign holdings contributed overall this period, aided in part by a broadly weaker U.S. dollar. Conversely, stock picking in the non-index cable & satellite segment detracted. In particular, two positions here turned out to be the fund’s biggest individual relative disappointments, namely Netherlands-based global telecommunications company Altice and London-based broadband and mobile services provider Liberty Global, which returned -54% and -13%, respectively, this period.
The views expressed above reflect those of the portfolio manager(s) only through the end of the period as stated on the cover of this report and do not necessarily represent the views of Fidelity or any other person in the Fidelity organization. Any such views are subject to change at any time based upon market or other conditions and Fidelity disclaims any responsibility to update such views. These views may not be relied on as investment advice and, because investment decisions for a Fidelity fund are based on numerous factors, may not be relied on as an indication of trading intent on behalf of any Fidelity fund.
Notes to shareholders: Due to new international benchmark guidelines, S&P
® Dow Jones
® Indices stopped offering its brand on custom benchmarks, effective March 31, 2017. As a temporary solution, on April 1, 2017, the fund's industry benchmark changed from the S&P
® Custom Wireless Index to the Fidelity Wireless Index. S&P
® agreed to continue calculating the benchmark until a suitable alternative is found.
On December 8, 2017, shareholders approved proposals from the Board of Trustees to eliminate each sector/industry fund's fundamental “invests primarily” policy and to modify the fundamental concentration policy for certain funds. The changes took effect on January 1, 2018, and do not impact how the funds are managed.
Wireless Portfolio
Investment Summary (Unaudited)
Top Ten Stocks as of February 28, 2018
| | % of fund's net assets |
| Apple, Inc. | 17.5 |
| Qualcomm, Inc. | 9.7 |
| Masmovil Ibercom SA | 5.7 |
| T-Mobile U.S., Inc. | 5.6 |
| AT&T, Inc. | 4.9 |
| Vodafone Group PLC sponsored ADR | 4.9 |
| American Tower Corp. | 4.8 |
| Liberty Global PLC Class A | 2.7 |
| Alphabet, Inc. Class A | 2.7 |
| BT Group PLC sponsored ADR | 2.4 |
| | 60.9 |
Top Industries (% of fund's net assets)
| As of February 28, 2018 |
| | Diversified Telecommunication Services | 27.7% |
| | Technology Hardware, Storage & Peripherals | 17.5% |
| | Wireless Telecommunication Services | 15.3% |
| | Semiconductors & Semiconductor Equipment | 14.2% |
| | Equity Real Estate Investment Trusts (Reits) | 6.2% |
| | All Others* | 19.1% |
* Includes short-term investments and net other assets (liabilities).
Wireless Portfolio
Schedule of Investments February 28, 2018
Showing Percentage of Net Assets
| Common Stocks - 96.4% | | | |
| | | Shares | Value |
| Aerospace & Defense - 1.3% | | | |
| Aerospace & Defense - 1.3% | | | |
| Harris Corp. | | 22,500 | $3,513,375 |
| Communications Equipment - 4.4% | | | |
| Communications Equipment - 4.4% | | | |
| CommScope Holding Co., Inc. (a) | | 69,300 | 2,682,603 |
| Motorola Solutions, Inc. | | 12,168 | 1,291,633 |
| NETGEAR, Inc. (a) | | 18,300 | 1,020,225 |
| Nokia Corp. sponsored ADR | | 126,800 | 735,440 |
| Quantenna Communications, Inc. (a) | | 215,700 | 2,965,875 |
| Telefonaktiebolaget LM Ericsson (B Shares) sponsored ADR (b) | | 534,800 | 3,540,376 |
| ViaSat, Inc. (a) | | 1 | 70 |
| | | | 12,236,222 |
| Diversified Telecommunication Services - 26.3% | | | |
| Alternative Carriers - 1.5% | | | |
| Iliad SA | | 9,178 | 2,151,879 |
| Iridium Communications, Inc. (a)(b) | | 149,000 | 1,743,300 |
| ORBCOMM, Inc. (a) | | 37,000 | 384,800 |
| | | | 4,279,979 |
| Integrated Telecommunication Services - 24.8% | | | |
| AT&T, Inc. | | 372,100 | 13,507,230 |
| BCE, Inc. | | 95,800 | 4,180,798 |
| BT Group PLC sponsored ADR (b) | | 391,800 | 6,519,552 |
| Chunghwa Telecom Co. Ltd. sponsored ADR (b) | | 12,900 | 477,429 |
| Deutsche Telekom AG | | 156,300 | 2,511,223 |
| Euskaltel, S.A. (b)(c) | | 375,500 | 3,056,190 |
| Masmovil Ibercom SA (a) | | 111,336 | 15,793,341 |
| Nippon Telegraph & Telephone Corp. sponsored ADR | | 77,500 | 3,615,375 |
| Orange SA | | 299,900 | 5,073,751 |
| Telecom Italia SpA (a) | | 3,702,300 | 3,322,773 |
| Telecom Italia SpA sponsored ADR (a)(b) | | 25,400 | 229,870 |
| Telefonica Deutschland Holding AG | | 161,249 | 742,152 |
| Telefonica SA sponsored ADR (b) | | 519,797 | 5,005,645 |
| Verizon Communications, Inc. | | 89,601 | 4,277,552 |
| | | | 68,312,881 |
|
| TOTAL DIVERSIFIED TELECOMMUNICATION SERVICES | | | 72,592,860 |
|
| Electronic Equipment & Components - 1.2% | | | |
| Electronic Manufacturing Services - 1.2% | | | |
| Fabrinet | | 110,700 | 3,337,605 |
| Equity Real Estate Investment Trusts (REITs) - 6.2% | | | |
| Specialized REITs - 6.2% | | | |
| American Tower Corp. | | 93,892 | 13,081,972 |
| Crown Castle International Corp. | | 1 | 110 |
| SBA Communications Corp. Class A (a) | | 24,800 | 3,900,296 |
| | | | 16,982,378 |
| Internet Software & Services - 5.3% | | | |
| Internet Software & Services - 5.3% | | | |
| Akamai Technologies, Inc. (a) | | 28,000 | 1,888,880 |
| Alphabet, Inc.: | | | |
| Class A (a) | | 6,700 | 7,396,264 |
| Class C (a) | | 2,952 | 3,261,163 |
| Gogo, Inc. (a)(b) | | 236,200 | 2,144,696 |
| | | | 14,691,003 |
| Media - 4.3% | | | |
| Cable & Satellite - 4.3% | | | |
| Altice NV: | | | |
| Class A (a)(b) | | 142,293 | 1,357,348 |
| Class B (a) | | 12,097 | 115,093 |
| Liberty Global PLC Class A (a) | | 237,700 | 7,401,978 |
| Telenet Group Holding NV (a) | | 41,979 | 2,877,722 |
| | | | 11,752,141 |
| Semiconductors & Semiconductor Equipment - 14.2% | | | |
| Semiconductors - 14.2% | | | |
| Marvell Technology Group Ltd. | | 130,900 | 3,074,841 |
| Qorvo, Inc. (a) | | 65,225 | 5,264,310 |
| Qualcomm, Inc. | | 408,550 | 26,555,750 |
| Skyworks Solutions, Inc. | | 30,800 | 3,364,900 |
| STMicroelectronics NV (NY Shares) unit (b) | | 33,500 | 763,800 |
| | | | 39,023,601 |
| Software - 1.6% | | | |
| Application Software - 1.2% | | | |
| RingCentral, Inc. (a) | | 54,400 | 3,408,160 |
| Systems Software - 0.4% | | | |
| BlackBerry Ltd. (a) | | 81,801 | 992,551 |
|
| TOTAL SOFTWARE | | | 4,400,711 |
|
| Technology Hardware, Storage & Peripherals - 17.5% | | | |
| Technology Hardware, Storage & Peripherals - 17.5% | | | |
| Apple, Inc. | | 271,305 | 48,324,846 |
| Wireless Telecommunication Services - 14.1% | | | |
| Wireless Telecommunication Services - 14.1% | | | |
| China Mobile Ltd. sponsored ADR | | 92,100 | 4,281,729 |
| Millicom International Cellular SA | | 25,900 | 1,714,321 |
| Rogers Communications, Inc. Class B (non-vtg.) | | 6,900 | 310,909 |
| SoftBank Corp. | | 33,800 | 2,785,014 |
| Spok Holdings, Inc. | | 1 | 16 |
| Sprint Corp. (a) | | 32 | 166 |
| T-Mobile U.S., Inc. (a) | | 252,975 | 15,332,815 |
| Telephone & Data Systems, Inc. | | 27,614 | 774,297 |
| U.S. Cellular Corp. (a) | | 5,800 | 223,822 |
| Vodafone Group PLC sponsored ADR | | 473,481 | 13,404,247 |
| | | | 38,827,336 |
| TOTAL COMMON STOCKS | | | |
| (Cost $204,755,036) | | | 265,682,078 |
|
| Nonconvertible Preferred Stocks - 2.6% | | | |
| Diversified Telecommunication Services - 1.4% | | | |
| Integrated Telecommunication Services - 1.4% | | | |
| Telefonica Brasil SA | | 253,600 | 3,956,032 |
| Wireless Telecommunication Services - 1.2% | | | |
| Wireless Telecommunication Services - 1.2% | | | |
| TIM Participacoes SA sponsored ADR | | 155,300 | 3,304,784 |
| TOTAL NONCONVERTIBLE PREFERRED STOCKS | | | |
| (Cost $5,767,243) | | | 7,260,816 |
|
| Money Market Funds - 6.3% | | | |
| Fidelity Cash Central Fund, 1.41% (d) | | 2,383,247 | 2,383,724 |
| Fidelity Securities Lending Cash Central Fund 1.42% (d)(e) | | 14,925,974 | 14,927,467 |
| TOTAL MONEY MARKET FUNDS | | | |
| (Cost $17,311,210) | | | 17,311,191 |
| TOTAL INVESTMENT IN SECURITIES - 105.3% | | | |
| (Cost $227,833,489) | | | 290,254,085 |
| NET OTHER ASSETS (LIABILITIES) - (5.3)% | | | (14,511,692) |
| NET ASSETS - 100% | | | $275,742,393 |
Legend
(a) Non-income producing
(b) Security or a portion of the security is on loan at period end.
(c) Security exempt from registration under Rule 144A of the Securities Act of 1933. These securities may be resold in transactions exempt from registration, normally to qualified institutional buyers. At the end of the period, the value of these securities amounted to $3,056,190 or 1.1% of net assets.
(d) Affiliated fund that is generally available only to investment companies and other accounts managed by Fidelity Investments. The rate quoted is the annualized seven-day yield of the fund at period end. A complete unaudited listing of the fund's holdings as of its most recent quarter end is available upon request. In addition, each Fidelity Central Fund's financial statements, which are not covered by the Fund's Report of Independent Registered Public Accounting Firm, are available on the SEC's website or upon request.
(e) Investment made with cash collateral received from securities on loan.
Affiliated Central Funds
Information regarding fiscal year to date income earned by the Fund from investments in Fidelity Central Funds is as follows:
| Fund | Income earned |
| Fidelity Cash Central Fund | $36,831 |
| Fidelity Securities Lending Cash Central Fund | 98,637 |
| Total | $135,468 |
Amounts in the income column in the above table include any capital gain distributions from underlying funds, which are presented in the corresponding line-item in the Statement of Operations if applicable.
Investment Valuation
The following is a summary of the inputs used, as of February 28, 2018, involving the Fund's assets and liabilities carried at fair value. The inputs or methodology used for valuing securities may not be an indication of the risk associated with investing in those securities. For more information on valuation inputs, and their aggregation into the levels used below, please refer to the Investment Valuation section in the accompanying Notes to Financial Statements.
| | Valuation Inputs at Reporting Date: |
| Description | Total | Level 1 | Level 2 | Level 3 |
| Investments in Securities: | | | | |
| Common Stocks | $265,682,078 | $225,895,592 | $39,786,486 | $-- |
| Nonconvertible Preferred Stocks | 7,260,816 | 7,260,816 | -- | -- |
| Money Market Funds | 17,311,191 | 17,311,191 | -- | -- |
| Total Investments in Securities: | $290,254,085 | $250,467,599 | $39,786,486 | $-- |
The following is a summary of transfers between Level 1 and Level 2 for the period ended February 28, 2018. Transfers are assumed to have occurred at the beginning of the period, and are primarily attributable to the valuation techniques used for foreign equity securities, as discussed in the accompanying Notes to Financial Statements:
| Transfers | Total |
| Level 1 to Level 2 | $22,379,668 |
| Level 2 to Level 1 | $3,150,787 |
Other Information
Distribution of investments by country or territory of incorporation, as a percentage of Total Net Assets, is as follows (Unaudited):
| United States of America | 61.4% |
| United Kingdom | 10.0% |
| Spain | 8.6% |
| Brazil | 2.6% |
| France | 2.6% |
| Japan | 2.3% |
| Canada | 2.0% |
| Hong Kong | 1.5% |
| Italy | 1.3% |
| Sweden | 1.3% |
| Cayman Islands | 1.2% |
| Germany | 1.2% |
| Bermuda | 1.1% |
| Belgium | 1.1% |
| Others (Individually Less Than 1%) | 1.8% |
| | 100.0% |
See accompanying notes which are an integral part of the financial statements.
Wireless Portfolio
Financial Statements
Statement of Assets and Liabilities
| | | February 28, 2018 |
| Assets | | |
Investment in securities, at value (including securities loaned of $14,344,065) — See accompanying schedule:
Unaffiliated issuers (cost $210,522,279) | $272,942,894 | |
| Fidelity Central Funds (cost $17,311,210) | 17,311,191 | |
| Total Investment in Securities (cost $227,833,489) | | $290,254,085 |
| Receivable for fund shares sold | | 482,634 |
| Dividends receivable | | 379,125 |
| Distributions receivable from Fidelity Central Funds | | 12,219 |
| Prepaid expenses | | 1,111 |
| Other receivables | | 28,017 |
| Total assets | | 291,157,191 |
| Liabilities | | |
| Payable for fund shares redeemed | $263,684 | |
| Accrued management fee | 122,204 | |
| Other affiliated payables | 52,812 | |
| Other payables and accrued expenses | 50,592 | |
| Collateral on securities loaned | 14,925,506 | |
| Total liabilities | | 15,414,798 |
| Net Assets | | $275,742,393 |
| Net Assets consist of: | | |
| Paid in capital | | $212,146,889 |
| Undistributed net investment income | | 469,557 |
| Accumulated undistributed net realized gain (loss) on investments and foreign currency transactions | | 705,162 |
| Net unrealized appreciation (depreciation) on investments and assets and liabilities in foreign currencies | | 62,420,785 |
| Net Assets, for 26,793,400 shares outstanding | | $275,742,393 |
| Net Asset Value, offering price and redemption price per share ($275,742,393 ÷ 26,793,400 shares) | | $10.29 |
See accompanying notes which are an integral part of the financial statements.
Statement of Operations
| | | Year ended February 28, 2018 |
| Investment Income | | |
| Dividends | | $6,686,748 |
| Income from Fidelity Central Funds | | 135,468 |
| Total income | | 6,822,216 |
| Expenses | | |
| Management fee | $1,526,537 | |
| Transfer agent fees | 554,990 | |
| Accounting and security lending fees | 110,716 | |
| Custodian fees and expenses | 30,803 | |
| Independent trustees' fees and expenses | 5,984 | |
| Registration fees | 44,845 | |
| Audit | 50,427 | |
| Legal | 3,747 | |
| Interest | 498 | |
| Miscellaneous | 13,808 | |
| Total expenses before reductions | 2,342,355 | |
| Expense reductions | (42,265) | 2,300,090 |
| Net investment income (loss) | | 4,522,126 |
| Realized and Unrealized Gain (Loss) | | |
| Net realized gain (loss) on: | | |
| Investment securities: | | |
| Unaffiliated issuers | 11,062,841 | |
| Fidelity Central Funds | 433 | |
| Foreign currency transactions | (42,924) | |
| Total net realized gain (loss) | | 11,020,350 |
| Change in net unrealized appreciation (depreciation) on: | | |
| Investment securities: | | |
| Unaffiliated issuers | 25,973,969 | |
| Fidelity Central Funds | (1,077) | |
| Assets and liabilities in foreign currencies | (657) | |
| Total change in net unrealized appreciation (depreciation) | | 25,972,235 |
| Net gain (loss) | | 36,992,585 |
| Net increase (decrease) in net assets resulting from operations | | $41,514,711 |
See accompanying notes which are an integral part of the financial statements.
Statement of Changes in Net Assets
| | Year ended February 28, 2018 | Year ended February 28, 2017 |
| Increase (Decrease) in Net Assets | | |
| Operations | | |
| Net investment income (loss) | $4,522,126 | $2,634,675 |
| Net realized gain (loss) | 11,020,350 | 17,033,169 |
| Change in net unrealized appreciation (depreciation) | 25,972,235 | 26,589,316 |
| Net increase (decrease) in net assets resulting from operations | 41,514,711 | 46,257,160 |
| Distributions to shareholders from net investment income | (3,603,116) | (2,089,084) |
| Distributions to shareholders from net realized gain | (6,240,342) | (11,015,171) |
| Total distributions | (9,843,458) | (13,104,255) |
| Share transactions | | |
| Proceeds from sales of shares | 174,215,147 | 45,389,529 |
| Reinvestment of distributions | 9,361,647 | 12,510,630 |
| Cost of shares redeemed | (178,872,137) | (59,190,184) |
| Net increase (decrease) in net assets resulting from share transactions | 4,704,657 | (1,290,025) |
| Redemption fees | 7,555 | 4,168 |
| Total increase (decrease) in net assets | 36,383,465 | 31,867,048 |
| Net Assets | | |
| Beginning of period | 239,358,928 | 207,491,880 |
| End of period | $275,742,393 | $239,358,928 |
| Other Information | | |
| Undistributed net investment income end of period | $469,557 | $247,360 |
| Shares | | |
| Sold | 17,791,191 | 5,182,631 |
| Issued in reinvestment of distributions | 947,168 | 1,569,715 |
| Redeemed | (18,220,551) | (6,898,091) |
| Net increase (decrease) | 517,808 | (145,745) |
See accompanying notes which are an integral part of the financial statements.
Financial Highlights
Wireless Portfolio
| | | | | | |
| Years ended February 28, | 2018 | 2017 | 2016 A | 2015 | 2014 |
| Selected Per–Share Data | | | | | |
| Net asset value, beginning of period | $9.11 | $7.85 | $9.54 | $10.57 | $8.60 |
| Income from Investment Operations | | | | | |
| Net investment income (loss)B | .16 | .10 | .11 | .17 | .56C |
| Net realized and unrealized gain (loss) | 1.39 | 1.71 | (1.11) | .48 | 1.51 |
| Total from investment operations | 1.55 | 1.81 | (1.00) | .65 | 2.07 |
| Distributions from net investment income | (.14) | (.09) | (.12) | (.62) | (.10) |
| Distributions from net realized gain | (.24) | (.46) | (.57) | (1.06) | – |
| Total distributions | (.37)D | (.55) | (.69) | (1.68) | (.10) |
| Redemption fees added to paid in capitalB,E | – | – | – | – | – |
| Net asset value, end of period | $10.29 | $9.11 | $7.85 | $9.54 | $10.57 |
| Total ReturnF | 17.21% | 24.09% | (11.07)% | 7.55% | 24.11% |
| Ratios to Average Net AssetsG,H | | | | | |
| Expenses before reductions | .83% | .87% | .86% | .86% | .88% |
| Expenses net of fee waivers, if any | .83% | .87% | .86% | .86% | .88% |
| Expenses net of all reductions | .82% | .86% | .85% | .85% | .86% |
| Net investment income (loss) | 1.61% | 1.23% | 1.23% | 1.76% | 5.91%C |
| Supplemental Data | | | | | |
| Net assets, end of period (000 omitted) | $275,742 | $239,359 | $207,492 | $270,449 | $290,057 |
| Portfolio turnover rateI | 85% | 98% | 78% | 48% | 120% |
A For the year ended February 29.
B Calculated based on average shares outstanding during the period.
C Net Investment income per share reflects a large, non-recurring dividend which amounted to $.45 per share. Excluding this non-recurring dividend, the ratio of net investment income (loss) to average net assets would have been 1.23%.
D Total distributions of $.37 per share is comprised of distributions from net investment income of $.136 and distributions from net realized gain of $.235 per share.
E Amount represents less than $.005 per share.
F Total returns would have been lower if certain expenses had not been reduced during the applicable periods shown.
G Fees and expenses of any underlying Fidelity Central Funds are not included in the Fund's expense ratio. The Fund indirectly bears its proportionate share of the expenses of any underlying Fidelity Central Funds.
H Expense ratios reflect operating expenses of the Fund. Expenses before reductions do not reflect amounts reimbursed by the investment adviser or reductions from brokerage service arrangements or reductions from other expense offset arrangements and do not represent the amount paid by the Fund during periods when reimbursements or reductions occur. Expenses net of fee waivers reflect expenses after reimbursement by the investment adviser but prior to reductions from brokerage service arrangements or other expense offset arrangements. Expenses net of all reductions represent the net expenses paid by the Fund.
I Amount does not include the portfolio activity of any underlying Fidelity Central Funds.
See accompanying notes which are an integral part of the financial statements.
Notes to Financial Statements
For the period ended February 28, 2018
1. Organization.
Wireless Portfolio (the Fund) is a non-diversified fund of Fidelity Select Portfolios (the Trust) and is authorized to issue an unlimited number of shares. Share transactions on the Statement of Changes in Net Assets may contain exchanges between affiliated funds. The Trust is registered under the Investment Company Act of 1940, as amended (the 1940 Act), as an open-end management investment company organized as a Massachusetts business trust. The Fund invests primarily in securities of companies whose principal business activities fall within specific industries.
2. Investments in Fidelity Central Funds.
The Fund invests in Fidelity Central Funds, which are open-end investment companies generally available only to other investment companies and accounts managed by the investment adviser and its affiliates. The Fund's Schedule of Investments lists each of the Fidelity Central Funds held as of period end, if any, as an investment of the Fund, but does not include the underlying holdings of each Fidelity Central Fund. As an Investing Fund, the Fund indirectly bears its proportionate share of the expenses of the underlying Fidelity Central Funds.
The Money Market Central Funds seek preservation of capital and current income and are managed by Fidelity Investments Money Management, Inc. (FIMM), an affiliate of the investment adviser. Annualized expenses of the Money Market Central Funds as of their most recent shareholder report date are less than .005%.
A complete unaudited list of holdings for each Fidelity Central Fund is available upon request or at the Securities and Exchange Commission (the SEC) website at www.sec.gov. In addition, the financial statements of the Fidelity Central Funds, which are not covered by the Fund's Report of Independent Registered Public Accounting Firm, are available on the SEC website or upon request.
3. Significant Accounting Policies.
The Fund is an investment company and applies the accounting and reporting guidance of the Financial Accounting Standards Board (FASB) Accounting Standards Codification Topic 946 Financial Services – Investments Companies. The financial statements have been prepared in conformity with accounting principles generally accepted in the United States of America (GAAP), which require management to make certain estimates and assumptions at the date of the financial statements. Actual results could differ from those estimates. Subsequent events, if any, through the date that the financial statements were issued have been evaluated in the preparation of the financial statements. The following summarizes the significant accounting policies of the Fund:
Investment Valuation. Investments are valued as of 4:00 p.m. Eastern time on the last calendar day of the period. The Board of Trustees (the Board) has delegated the day to day responsibility for the valuation of the Fund's investments to the Fair Value Committee (the Committee) established by the Fund's investment adviser. In accordance with valuation policies and procedures approved by the Board, the Fund attempts to obtain prices from one or more third party pricing vendors or brokers to value its investments. When current market prices, quotations or currency exchange rates are not readily available or reliable, investments will be fair valued in good faith by the Committee, in accordance with procedures adopted by the Board. Factors used in determining fair value vary by investment type and may include market or investment specific events. The frequency with which these procedures are used cannot be predicted and they may be utilized to a significant extent. The Committee oversees the Fund's valuation policies and procedures and reports to the Board on the Committee's activities and fair value determinations. The Board monitors the appropriateness of the procedures used in valuing the Fund's investments and ratifies the fair value determinations of the Committee.
The Fund categorizes the inputs to valuation techniques used to value its investments into a disclosure hierarchy consisting of three levels as shown below:
- Level 1 – quoted prices in active markets for identical investments
- Level 2 – other significant observable inputs (including quoted prices for similar investments, interest rates, prepayment speeds, etc.)
- Level 3– unobservable inputs (including the Fund's own assumptions based on the best information available)
Valuation techniques used to value the Fund's investments by major category are as follows:
Equity securities, including restricted securities, for which market quotations are readily available, are valued at the last reported sale price or official closing price as reported by a third party pricing vendor on the primary market or exchange on which they are traded and are categorized as Level 1 in the hierarchy. In the event there were no sales during the day or closing prices are not available, securities are valued at the last quoted bid price or may be valued using the last available price and are generally categorized as Level 2 in the hierarchy. For foreign equity securities, when market or security specific events arise, comparisons to the valuation of American Depositary Receipts (ADRs), futures contracts, Exchange-Traded Funds (ETFs) and certain indexes as well as quoted prices for similar securities may be used and would be categorized as Level 2 in the hierarchy. Utilizing these techniques may result in transfers between Level 1 and Level 2. For equity securities, including restricted securities, where observable inputs are limited, assumptions about market activity and risk are used and these securities may be categorized as Level 3 in the hierarchy.
Investments in open-end mutual funds, including the Fidelity Central Funds, are valued at their closing net asset value (NAV) each business day and are categorized as Level 1 in the hierarchy.
Changes in valuation techniques may result in transfers in or out of an assigned level within the disclosure hierarchy. The aggregate value of investments by input level as of February 28, 2018, including information on transfers between Levels 1 and 2 is included at the end of the Fund's Schedule of Investments.
Foreign Currency. The Fund may use foreign currency contracts to facilitate transactions in foreign-denominated securities. Gains and losses from these transactions may arise from changes in the value of the foreign currency or if the counterparties do not perform under the contracts' terms.
Foreign-denominated assets, including investment securities, and liabilities are translated into U.S. dollars at the exchange rates at period end. Purchases and sales of investment securities, income and dividends received and expenses denominated in foreign currencies are translated into U.S. dollars at the exchange rate in effect on the transaction date.
The effects of exchange rate fluctuations on investments are included with the net realized and unrealized gain (loss) on investment securities. Other foreign currency transactions resulting in realized and unrealized gain (loss) are disclosed separately.
Investment Transactions and Income. For financial reporting purposes, the Fund's investment holdings and NAV include trades executed through the end of the last business day of the period. The NAV per share for processing shareholder transactions is calculated as of the close of business of the New York Stock Exchange (NYSE), normally 4:00 p.m. Eastern time and includes trades executed through the end of the prior business day. Gains and losses on securities sold are determined on the basis of identified cost and includes proceeds received from litigation. Dividend income is recorded on the ex-dividend date, except for certain dividends from foreign securities where the ex-dividend date may have passed, which are recorded as soon as the Fund is informed of the ex-dividend date. Non-cash dividends included in dividend income, if any, are recorded at the fair market value of the securities received. Income and capital gain distributions from Fidelity Central Funds, if any, are recorded on the ex-dividend date. Certain distributions received by the Fund represent a return of capital or capital gain. The Fund determines the components of these distributions subsequent to the ex-dividend date, based upon receipt of tax filings or other correspondence relating to the underlying investment. These distributions are recorded as a reduction of cost of investments and/or as a realized gain. Investment income is recorded net of foreign taxes withheld where recovery of such taxes is uncertain.
Expenses. Expenses directly attributable to a fund are charged to that fund. Expenses attributable to more than one fund are allocated among the respective funds on the basis of relative net assets or other appropriate methods. Expense estimates are accrued in the period to which they relate and adjustments are made when actual amounts are known.
Income Tax Information and Distributions to Shareholders. Each year, the Fund intends to qualify as a regulated investment company under Subchapter M of the Internal Revenue Code, including distributing substantially all of its taxable income and realized gains. As a result, no provision for U.S. Federal income taxes is required. As of February 28, 2018, the Fund did not have any unrecognized tax benefits in the financial statements; nor is the Fund aware of any tax positions for which it is reasonably possible that the total amounts of unrecognized tax benefits will significantly change in the next twelve months. The Fund files a U.S. federal tax return, in addition to state and local tax returns as required. The Fund's federal income tax returns are subject to examination by the Internal Revenue Service (IRS) for a period of three fiscal years after they are filed. State and local tax returns may be subject to examination for an additional fiscal year depending on the jurisdiction. Foreign taxes are provided for based on the Fund's understanding of the tax rules and rates that exist in the foreign markets in which it invests.
Distributions are declared and recorded on the ex-dividend date. Income and capital gain distributions are determined in accordance with income tax regulations, which may differ from GAAP. In addition, the Fund claimed a portion of the payment made to redeeming shareholders as a distribution for income tax purposes.
Capital accounts within the financial statements are adjusted for permanent book-tax differences. These adjustments have no impact on net assets or the results of operations. Capital accounts are not adjusted for temporary book-tax differences which will reverse in a subsequent period.
Book-tax differences are primarily due to foreign currency transactions and losses deferred due to wash sales.
As of period end, the cost and unrealized appreciation (depreciation) in securities, and derivatives if applicable, for federal income tax purposes were as follows:
| Gross unrealized appreciation | $70,591,440 |
| Gross unrealized depreciation | (9,371,128) |
| Net unrealized appreciation (depreciation) | $61,220,312 |
| Tax Cost | $229,033,773 |
The tax-based components of distributable earnings as of period end were as follows:
| Undistributed ordinary income | $469,558 |
| Undistributed long-term capital gain | $1,905,448 |
| Net unrealized appreciation (depreciation) on securities and other investments | $61,220,501 |
The tax character of distributions paid was as follows:
| | February 28, 2018 | February 28, 2017 |
| Ordinary Income | $3,684,850 | $ 2,089,084 |
| Long-term Capital Gains | 6,158,608 | 11,015,171 |
| Total | $9,843,458 | $ 13,104,255 |
Trading (Redemption) Fees. Shares held by investors in the Fund less than 30 days may be subject to a redemption fee equal to .75% of the NAV of shares redeemed. All redemption fees, which reduce the proceeds of the shareholder redemption, are retained by the Fund and accounted for as an addition to paid in capital. In November 2017, the Board of Trustees approved the elimination of these redemption fees effective December 18, 2017.
Restricted Securities. The Fund may invest in securities that are subject to legal or contractual restrictions on resale. These securities generally may be resold in transactions exempt from registration or to the public if the securities are registered. Disposal of these securities may involve time-consuming negotiations and expense, and prompt sale at an acceptable price may be difficult. Information regarding restricted securities is included at the end of the Fund's Schedule of Investments.
4. Purchases and Sales of Investments.
Purchases and sales of securities, other than short-term securities, aggregated $242,660,683 and $235,547,732, respectively.
5. Fees and Other Transactions with Affiliates.
Management Fee. Fidelity SelectCo, LLC (the investment adviser) and its affiliates provide the Fund with investment management related services for which the Fund pays a monthly management fee. The management fee is the sum of an individual fund fee rate that is based on an annual rate of .30% of the Fund's average net assets and an annualized group fee rate that averaged .24% during the period. The group fee rate is based upon the average net assets of all the mutual funds advised by Fidelity Management & Research Company (FMR) and the investment adviser. The group fee rate decreases as assets under management increase and increases as assets under management decrease. For the reporting period, the total annual management fee rate was .54% of the Fund's average net assets.
Transfer Agent Fees. Fidelity Investments Institutional Operations Company, Inc. (FIIOC), an affiliate of the investment adviser, is the Fund's transfer, dividend disbursing and shareholder servicing agent. FIIOC receives account fees and asset-based fees that vary according to account size and type of account. FIIOC pays for typesetting, printing and mailing of shareholder reports, except proxy statements. For the period, the transfer agent fees were equivalent to an annual rate of .20% of average net assets.
Accounting and Security Lending Fees. Fidelity Service Company, Inc. (FSC), an affiliate of the investment adviser, maintains the Fund's accounting records. The accounting fee is based on the level of average net assets for each month. Under a separate contract, FSC administers the security lending program. The security lending fee is based on the number and duration of lending transactions.
Brokerage Commissions. The Fund placed a portion of its portfolio transactions with brokerage firms which are affiliates of the investment adviser. Brokerage commissions are included in net realized gain (loss) and change in net unrealized appreciation (depreciation) in the Statement of Operations. The commissions paid to these affiliated firms were $4,687 for the period.
Interfund Lending Program. Pursuant to an Exemptive Order issued by the SEC, the Fund, along with other registered investment companies having management contracts with Fidelity Management & Research Company (FMR) or other affiliated entities of FMR, may participate in an interfund lending program. This program provides an alternative credit facility allowing the funds to borrow from, or lend money to, other participating affiliated funds. At period end, there were no interfund loans outstanding. The Fund's activity in this program during the period for which loans were outstanding was as follows:
| Borrower or Lender | Average Loan Balance | Weighted Average Interest Rate | Interest Expense |
| Borrower | $3,354,000 | 1.34% | $498 |
Interfund Trades. The Fund may purchase from or sell securities to other Fidelity Funds under procedures adopted by the Board. The procedures have been designed to ensure these interfund trades are executed in accordance with Rule 17a-7 of the 1940 Act. Interfund trades are included within the respective purchases and sales amounts shown in the Purchases and Sales of Investments note.
6. Committed Line of Credit.
The Fund participates with other funds managed by the investment adviser or an affiliate in a $4.25 billion credit facility (the "line of credit") to be utilized for temporary or emergency purposes to fund shareholder redemptions or for other short-term liquidity purposes. The Fund has agreed to pay commitment fees on its pro-rata portion of the line of credit, which amounted to $835 and is reflected in Miscellaneous expenses on the Statement of Operations. During the period, the Fund did not borrow on this line of credit.
7. Security Lending.
The Fund lends portfolio securities through a lending agent from time to time in order to earn additional income. On the settlement date of the loan, the Fund receives collateral (in the form of U.S. Treasury obligations, letters of credit and/or cash) against the loaned securities and maintains collateral in an amount not less than 100% of the market value of the loaned securities during the period of the loan. The market value of the loaned securities is determined at the close of business of the Fund and any additional required collateral is delivered to the Fund on the next business day. The Fund or borrower may terminate the loan at any time, and if the borrower defaults on its obligation to return the securities loaned because of insolvency or other reasons, the Fund may apply collateral received from the borrower against the obligation. The Fund may experience delays and costs in recovering the securities loaned. Any cash collateral received is invested in the Fidelity Securities Lending Cash Central Fund. The value of loaned securities and cash collateral at period end are disclosed on the Fund's Statement of Assets and Liabilities. Security lending income represents the income earned on investing cash collateral, less rebates paid to borrowers and any lending agent fees associated with the loan, plus any premium payments received for lending certain types of securities. Security lending income is presented in the Statement of Operations as a component of income from Fidelity Central Funds. Total security lending income during the period amounted to $98,637.
8. Expense Reductions.
Commissions paid to certain brokers with whom the investment adviser, or its affiliates, places trades on behalf of the Fund include an amount in addition to trade execution, which may be rebated back to the Fund to offset certain expenses. This amount totaled $39,993 for the period.
In addition, during the period the investment adviser reimbursed and/or waived a portion of operating expenses in the amount of $2,272.
9. Other.
The Fund's organizational documents provide former and current trustees and officers with a limited indemnification against liabilities arising in connection with the performance of their duties to the Fund. In the normal course of business, the Fund may also enter into contracts that provide general indemnifications. The Fund's maximum exposure under these arrangements is unknown as this would be dependent on future claims that may be made against the Fund. The risk of material loss from such claims is considered remote.
Report of Independent Registered Public Accounting Firm
To the Trustees of Fidelity Select Portfolios and the Shareholders of Telecommunications Portfolio and Wireless Portfolio:
Opinions on the Financial Statements
We have audited the accompanying statements of assets and liabilities, including the schedules of investments, of Telecommunications Portfolio and Wireless Portfolio (two of the funds constituting Fidelity Select Portfolios, hereafter collectively referred to as the "Funds") as of February 28, 2018, the related statements of operations for the year ended February 28, 2018, the statements of changes in net assets for each of the two years in the period ended February 28, 2018, including the related notes, and the financial highlights for each of the five years in the period ended February 28, 2018 (collectively referred to as the “financial statements”). In our opinion, the financial statements present fairly, in all material respects, the financial position of each of the Funds as of February 28, 2018, the results of each of their operations for the year then ended, the changes in each of their net assets for each of the two years in the period ended February 28, 2018 and each of the financial highlights for each of the five years in the period ended February 28, 2018 in conformity with accounting principles generally accepted in the United States of America.
Basis for Opinions
These financial statements are the responsibility of the Funds' management. Our responsibility is to express an opinion on the Funds' financial statements based on our audits. We are a public accounting firm registered with the Public Company Accounting Oversight Board (United States) (“PCAOB”) and are required to be independent with respect to the Funds in accordance with the U.S. federal securities laws and the applicable rules and regulations of the Securities and Exchange Commission and the PCAOB.
We conducted our audits of these financial statements in accordance with the standards of the PCAOB. Those standards require that we plan and perform the audit to obtain reasonable assurance about whether the financial statements are free of material misstatement, whether due to error or fraud.
Our audits included performing procedures to assess the risks of material misstatement of the financial statements, whether due to error or fraud, and performing procedures that respond to those risks. Such procedures included examining, on a test basis, evidence regarding the amounts and disclosures in the financial statements. Our audits also included evaluating the accounting principles used and significant estimates made by management, as well as evaluating the overall presentation of the financial statements. Our procedures included confirmation of securities owned as of February 28, 2018 by correspondence with the custodian. We believe that our audits provide a reasonable basis for our opinions.
PricewaterhouseCoopers LLP
Boston, Massachusetts
April 17, 2018
We have served as the auditor of one or more investment companies in the Fidelity group of funds since 1932.
Trustees and Officers
The Trustees, Members of the Advisory Board (if any), and officers of the trust and funds, as applicable, are listed below. The Board of Trustees governs each fund and is responsible for protecting the interests of shareholders. The Trustees are experienced executives who meet periodically throughout the year to oversee each fund's activities, review contractual arrangements with companies that provide services to each fund, oversee management of the risks associated with such activities and contractual arrangements, and review each fund's performance. Except for Michael. E. Wiley, each of the Trustees oversees 281 funds. Mr. Wiley oversees 193 funds.
The Trustees hold office without limit in time except that (a) any Trustee may resign; (b) any Trustee may be removed by written instrument, signed by at least two-thirds of the number of Trustees prior to such removal; (c) any Trustee who requests to be retired or who has become incapacitated by illness or injury may be retired by written instrument signed by a majority of the other Trustees; and (d) any Trustee may be removed at any special meeting of shareholders by a two-thirds vote of the outstanding voting securities of the trust. Each Trustee who is not an interested person (as defined in the 1940 Act) of the trust and the funds is referred to herein as an Independent Trustee. Each Independent Trustee shall retire not later than the last day of the calendar year in which his or her 75th birthday occurs. The Independent Trustees may waive this mandatory retirement age policy with respect to individual Trustees. Officers and Advisory Board Members hold office without limit in time, except that any officer or Advisory Board Member may resign or may be removed by a vote of a majority of the Trustees at any regular meeting or any special meeting of the Trustees. Except as indicated, each individual has held the office shown or other offices in the same company for the past five years.
Each fund’s Statement of Additional Information (SAI) includes more information about the Trustees. To request a free copy, call Fidelity at 1-800-544-8544.
Experience, Skills, Attributes, and Qualifications of the Trustees. The Governance and Nominating Committee has adopted a statement of policy that describes the experience, qualifications, attributes, and skills that are necessary and desirable for potential Independent Trustee candidates (Statement of Policy). The Board believes that each Trustee satisfied at the time he or she was initially elected or appointed a Trustee, and continues to satisfy, the standards contemplated by the Statement of Policy. The Governance and Nominating Committee also engages professional search firms to help identify potential Independent Trustee candidates who have the experience, qualifications, attributes, and skills consistent with the Statement of Policy. From time to time, additional criteria based on the composition and skills of the current Independent Trustees, as well as experience or skills that may be appropriate in light of future changes to board composition, business conditions, and regulatory or other developments, have also been considered by the professional search firms and the Governance and Nominating Committee. In addition, the Board takes into account the Trustees' commitment and participation in Board and committee meetings, as well as their leadership of standing and ad hoc committees throughout their tenure.
In determining that a particular Trustee was and continues to be qualified to serve as a Trustee, the Board has considered a variety of criteria, none of which, in isolation, was controlling. The Board believes that, collectively, the Trustees have balanced and diverse experience, qualifications, attributes, and skills, which allow the Board to operate effectively in governing each fund and protecting the interests of shareholders. Information about the specific experience, skills, attributes, and qualifications of each Trustee, which in each case led to the Board's conclusion that the Trustee should serve (or continue to serve) as a trustee of the funds, is provided below.
Board Structure and Oversight Function. James C. Curvey is an interested person and currently serves as Chairman. The Trustees have determined that an interested Chairman is appropriate and benefits shareholders because an interested Chairman has a personal and professional stake in the quality and continuity of services provided to the funds. Independent Trustees exercise their informed business judgment to appoint an individual of their choosing to serve as Chairman, regardless of whether the Trustee happens to be independent or a member of management. The Independent Trustees have determined that they can act independently and effectively without having an Independent Trustee serve as Chairman and that a key structural component for assuring that they are in a position to do so is for the Independent Trustees to constitute a substantial majority for the Board. The Independent Trustees also regularly meet in executive session. Ned C. Lautenbach serves as Chairman of the Independent Trustees and as such (i) acts as a liaison between the Independent Trustees and management with respect to matters important to the Independent Trustees and (ii) with management prepares agendas for Board meetings.
Fidelity® funds are overseen by different Boards of Trustees. The funds' Board oversees Fidelity's high income and certain equity funds, and other Boards oversee Fidelity's investment-grade bond, money market, asset allocation, and other equity funds. The asset allocation funds may invest in Fidelity® funds overseen by the funds' Board. The use of separate Boards, each with its own committee structure, allows the Trustees of each group of Fidelity® funds to focus on the unique issues of the funds they oversee, including common research, investment, and operational issues. On occasion, the separate Boards establish joint committees to address issues of overlapping consequences for the Fidelity® funds overseen by each Board.
The Trustees operate using a system of committees to facilitate the timely and efficient consideration of all matters of importance to the Trustees, each fund, and fund shareholders and to facilitate compliance with legal and regulatory requirements and oversight of the funds' activities and associated risks. The Board, acting through its committees, has charged SelectCo and its affiliates with (i) identifying events or circumstances the occurrence of which could have demonstrably adverse effects on the funds' business and/or reputation; (ii) implementing processes and controls to lessen the possibility that such events or circumstances occur or to mitigate the effects of such events or circumstances if they do occur; and (iii) creating and maintaining a system designed to evaluate continuously business and market conditions in order to facilitate the identification and implementation processes described in (i) and (ii) above. Because the day-to-day operations and activities of the funds are carried out by or through SelectCo, its affiliates, and other service providers, the funds' exposure to risks is mitigated but not eliminated by the processes overseen by the Trustees. While each of the Board's committees has responsibility for overseeing different aspects of the funds' activities, oversight is exercised primarily through the Operations, Audit, and Compliance Committees. In addition, the Independent Trustees have worked with Fidelity to enhance the Board's oversight of investment and financial risks, legal and regulatory risks, technology risks, and operational risks, including the development of additional risk reporting to the Board. Appropriate personnel, including but not limited to the funds' Chief Compliance Officer (CCO), SelectCo's internal auditor, the independent accountants, the funds' Treasurer and portfolio management personnel, make periodic reports to the Board's committees, as appropriate, including an annual review of Fidelity's risk management program for the Fidelity® funds. The responsibilities of each standing committee, including their oversight responsibilities, are described further under "Standing Committees of the Trustees."
Interested Trustees*:
Correspondence intended for a Trustee who is an interested person may be sent to Fidelity Investments, 245 Summer Street, Boston, Massachusetts 02210.
Name, Year of Birth; Principal Occupations and Other Relevant Experience+
James C. Curvey (1935)
Year of Election or Appointment: 2018
Trustee
Chairman of the Board of Trustees
Mr. Curvey also serves as Trustee of other Fidelity® funds. Mr. Curvey is a Director of Fidelity Research & Analysis Co. (investment adviser firm, 2009-present), and Vice Chairman (2007-present) and Director of FMR LLC (diversified financial services company). In addition, Mr. Curvey serves as an Overseer for the Boston Symphony Orchestra and a member of the board of Artis-Naples, Naples, Florida, and as a Trustee for Brewster Academy, Wolfeboro, New Hampshire. Previously, Mr. Curvey served as a Director of Fidelity Investments Money Management, Inc. (investment adviser firm, 2009-2014) and a Director of FMR and FMR Co., Inc. (investment adviser firms, 2007-2014).
Charles S. Morrison (1960)
Year of Election or Appointment: 2018
Trustee
Mr. Morrison also serves as Trustee of other funds. He serves as President of Fidelity SelectCo, LLC (investment adviser firm, 2017-present) and Fidelity Management & Research Company (FMR) (investment adviser firm, 2016-present), a Director of Fidelity Investments Money Management, Inc. (FIMM) (investment adviser firm, 2014-present), Director of Fidelity SelectCo, LLC (investment adviser firm, 2014-present), President, Asset Management (2014-present), and is an employee of Fidelity Investments. Previously, Mr. Morrison served as Vice President of Fidelity's Fixed Income and Asset Allocation Funds (2012-2014), President, Fixed Income (2011-2014), Vice President of Fidelity's Money Market Funds (2005-2009), President, Money Market Group Leader of FMR (investment adviser firm, 2009), and Senior Vice President, Money Market Group of FMR (2004-2009). Mr. Morrison also served as Vice President of Fidelity's Bond Funds (2002-2005), certain Balanced Funds (2002-2005), and certain Asset Allocation Funds (2002-2007), and as Senior Vice President (2002-2005) of Fidelity's Bond Division.
* Determined to be an "Interested Trustee" by virtue of, among other things, his or her affiliation with the trust or various entities under common control with SelectCo.
+ The information includes the Trustee's principal occupation during the last five years and other information relating to the experience, attributes, and skills relevant to the Trustee's qualifications to serve as a Trustee, which led to the conclusion that the Trustee should serve as a Trustee for each fund.
Independent Trustees:
Correspondence intended for an Independent Trustee may be sent to Fidelity Investments, P.O. Box 55235, Boston, Massachusetts 02205-5235.
Name, Year of Birth; Principal Occupations and Other Relevant Experience+
Dennis J. Dirks (1948)
Year of Election or Appointment: 2018
Trustee
Mr. Dirks also serves as Trustee of other Fidelity® funds. Prior to his retirement in May 2003, Mr. Dirks was Chief Operating Officer and a member of the Board of The Depository Trust & Clearing Corporation (DTCC). He also served as President, Chief Operating Officer, and Board member of The Depository Trust Company (DTC) and President and Board member of the National Securities Clearing Corporation (NSCC). In addition, Mr. Dirks served as Chief Executive Officer and Board member of the Government Securities Clearing Corporation, Chief Executive Officer and Board member of the Mortgage-Backed Securities Clearing Corporation, as a Trustee and a member of the Finance Committee of Manhattan College (2005-2008), as a Trustee and a member of the Finance Committee of AHRC of Nassau County (2006-2008), as a member of the Independent Directors Council (IDC) Governing Council (2010-2015), and as a member of the Board of Directors for The Brookville Center for Children’s Services, Inc. (2009-2017). Mr. Dirks is a member of the Finance Committee (2016-present) and Board of Directors (2017-present) of the Asolo Repertory Theatre.
Donald F. Donahue (1950)
Year of Election or Appointment: 2018
Trustee
Mr. Donahue also serves as a Trustee of other Fidelity® funds. Mr. Donahue is President and Chief Executive Officer of Miranda Partners, LLC (risk consulting for the financial services industry, 2012-present). Previously, Mr. Donahue served as a Member of the Advisory Board of certain Fidelity® funds (2015-2018) and Chief Executive Officer (2006-2012), Chief Operating Officer (2003-2006), and Managing Director, Customer Marketing and Development (1999-2003) of The Depository Trust & Clearing Corporation (financial markets infrastructure). Mr. Donahue serves as a Member (2007-present) and Co-Chairman (2016-present) of the Board of Directors of United Way of New York, Member of the Board of Directors of NYC Leadership Academy (2012-present) and Member of the Board of Advisors of Ripple Labs, Inc. (financial services, 2015-present). He also served as Chairman (2010-2012) and Member of the Board of Directors (2012-2013) of Omgeo, LLC (financial services), Treasurer of United Way of New York (2012-2016), and Member of the Board of Directors of XBRL US (financial services non-profit, 2009-2012) and the International Securities Services Association (2009-2012).
Alan J. Lacy (1953)
Year of Election or Appointment: 2018
Trustee
Mr. Lacy also serves as Trustee of other Fidelity® funds. Mr. Lacy serves as a Director of Bristol-Myers Squibb Company (global pharmaceuticals, 2008-present). He is a Trustee of the California Chapter of The Nature Conservancy (2015-present) and a Director of the Center for Advanced Study in the Behavioral Sciences at Stanford University (2015-present). In addition, Mr. Lacy served as Senior Adviser (2007-2014) of Oak Hill Capital Partners, L.P. (private equity) and also served as Chief Executive Officer (2005) and Vice Chairman (2005-2006) of Sears Holdings Corporation (retail) and Chief Executive Officer and Chairman of the Board of Sears, Roebuck and Co. (retail, 2000-2005). Previously, Mr. Lacy served as Chairman (2014-2017) and a member (2010-2017) of the Board of Directors of Dave & Buster’s Entertainment, Inc. (restaurant and entertainment complexes), as Chairman (2008-2011) and a member (2006-2015) of the Board of Trustees of the National Parks Conservation Association, and as a member of the Board of Directors for The Hillman Companies, Inc. (hardware wholesalers, 2010-2014), Earth Fare, Inc. (retail grocery, 2010-2014), and The Western Union Company (global money transfer, 2006-2011).
Ned C. Lautenbach (1944)
Year of Election or Appointment: 2018
Trustee
Chairman of the Independent Trustees
Mr. Lautenbach also serves as Trustee of other Fidelity® funds. Mr. Lautenbach currently serves as Vice Chair of the Board of Governors, State University System of Florida (2013-present) and is a member of the Council on Foreign Relations (1994-present). He is also a member and has most recently served as Chairman of the Board of Directors of Artis-Naples (2012-present). Previously, Mr. Lautenbach served as a member and then Lead Director of the Board of Directors of Eaton Corporation (diversified industrial, 1997-2016). He was also a Partner and Advisory Partner at Clayton, Dubilier & Rice, LLC (private equity investment, 1998-2010), as well as a Director of Sony Corporation (2006-2007). In addition, Mr. Lautenbach also had a 30-year career with IBM (technology company) during which time he served as Senior Vice President and a member of the Corporate Executive Committee (1968-1998).
Joseph Mauriello (1944)
Year of Election or Appointment: 2018
Trustee
Mr. Mauriello also serves as Trustee of other Fidelity® funds. Prior to his retirement in January 2006, Mr. Mauriello served in numerous senior management positions including Deputy Chairman and Chief Operating Officer (2004-2005), and Vice Chairman of Financial Services (2002-2004) of KPMG LLP US (professional services, 1965-2005). Mr. Mauriello currently serves as a member of the Board of Directors of XL Group plc. (global insurance and re-insurance, 2006-present) and the Independent Directors Council (IDC) Governing Council (2015-present). Previously, Mr. Mauriello served as a Director of the Hamilton Funds of the Bank of New York (2006-2007) and of Arcadia Resources Inc. (health care services and products, 2007-2012).
Cornelia M. Small (1944)
Year of Election or Appointment: 2018
Trustee
Ms. Small also serves as Trustee of other Fidelity® funds. Ms. Small is a member of the Board of Directors (2009-present) and Chair of the Investment Committee (2010-present) of the Teagle Foundation. Ms. Small also serves on the Investment Committee of the Berkshire Taconic Community Foundation (2008-present). Previously, Ms. Small served as Chairperson (2002-2008) and a member of the Investment Committee and Chairperson (2008-2012) and a member of the Board of Trustees of Smith College. In addition, Ms. Small served as Chief Investment Officer, Director of Global Equity Investments, and a member of the Board of Directors of Scudder, Stevens & Clark and Scudder Kemper Investments.
Garnett A. Smith (1947)
Year of Election or Appointment: 2013
Trustee
Mr. Smith also serves as Trustee of other Fidelity® funds. Prior to Mr. Smith's retirement, he served as Chairman and Chief Executive Officer of Inbrand Corp. (manufacturer of personal absorbent products, 1990-1997). He also served as President (1986-1990) of Inbrand Corp. Prior to his employment with Inbrand Corp., he was employed by a retail fabric chain and North Carolina National Bank. In addition, Mr. Smith served as a Member of the Advisory Board of certain Fidelity® funds (2012-2013) and as a board member of the Jackson Hole Land Trust (2009-2012).
David M. Thomas (1949)
Year of Election or Appointment: 2018
Trustee
Mr. Thomas also serves as Trustee of other Fidelity® funds. Mr. Thomas serves as Non-Executive Chairman of the Board of Directors of Fortune Brands Home and Security (home and security products, 2011-present), as a member of the Board of Directors (2004-present) and Presiding Director (2013-present) of Interpublic Group of Companies, Inc. (marketing communication), and as a member of the Board of Trustees of the University of Florida (2013-present). Previously, Mr. Thomas served as Executive Chairman (2005-2006) and Chairman and Chief Executive Officer (2000-2005) of IMS Health, Inc. (pharmaceutical and healthcare information solutions), and a Director of Fortune Brands, Inc. (consumer products, 2000-2011).
Michael E. Wiley (1950)
Year of Election or Appointment: 2008
Trustee
Mr. Wiley also serves as Trustee or Member of the Advisory Board of other Fidelity® funds. Mr. Wiley serves as a Director of Andeavor Corporation (independent oil refiner and marketer, 2005-present), a Director of Andeavor Logistics LP (natural resources logistics, 2015-present), and a Director of Bill Barrett Corporation (exploration and production, 2005-present). In addition, Mr. Wiley also serves as a Director of Post Oak Bank (privately-held bank, 2004-present). Previously, Mr. Wiley served as a Trustee of other Fidelity® funds (2008-2013), as a Director of Asia Pacific Exploration Consolidated (international oil and gas exploration and production, 2008-2013), as a member of the Board of Trustees of the University of Tulsa (2000-2006; 2007-2010), as a Senior Energy Advisor of Katzenbach Partners, LLC (consulting, 2006-2007), as an Advisory Director of Riverstone Holdings (private investment), Chairman, President, and CEO of Baker Hughes, Inc. (oilfield services, 2000-2004), and as Director of Spinnaker Exploration Company (exploration and production, 2001-2005).
+ The information includes the Trustee's principal occupation during the last five years and other information relating to the experience, attributes, and skills relevant to the Trustee's qualifications to serve as a Trustee, which led to the conclusion that the Trustee should serve as a Trustee for each fund.
Advisory Board Members and Officers:
Correspondence intended for a Member of the Advisory Board (if any) may be sent to Fidelity Investments, P.O. Box 55235, Boston, Massachusetts 02205-5235. Correspondence intended for an officer or Peter S. Lynch may be sent to Fidelity Investments, 245 Summer Street, Boston, Massachusetts 02210. Officers appear below in alphabetical order.
Name, Year of Birth; Principal Occupation
Peter S. Lynch (1944)
Year of Election or Appointment: 2018
Member of the Advisory Board
Mr. Lynch also serves as Member of the Advisory Board of other Fidelity® funds. Mr. Lynch is Vice Chairman and a Director of FMR (investment adviser firm) and FMR Co., Inc. (investment adviser firm). In addition, Mr. Lynch serves as a Trustee of Boston College and as the Chairman of the Inner-City Scholarship Fund. Previously, Mr. Lynch served on the Special Olympics International Board of Directors (1997-2006).
William S. Stavropoulos (1939)
Year of Election or Appointment: 2018
Member of the Advisory Board
Mr. Stavropoulos also serves as Member of the Advisory Board of other Fidelity® funds. Mr. Stavropoulos serves as President and Founder of the Michigan Baseball Foundation, the Great Lakes Loons (2007-present). Mr. Stavropoulos is Chairman Emeritus of the Board of Directors of The Dow Chemical Company, where he previously served in numerous senior management positions, including President, CEO (1995-2000; 2002-2004), Chairman of the Executive Committee (2000-2006), and as a member of the Board of Directors (1990-2006). Currently, Mr. Stavropoulos is Chairman of the Board of Directors of Univar Inc. (global distributor of commodity and specialty chemicals), a Director of Teradata Corporation (data warehousing and technology solutions), and a member of the Advisory Board for Metalmark Capital LLC (private equity investment, 2005-present). Mr. Stavropoulos is an operating advisor to Clayton, Dubilier & Rice, LLC (private equity investment). In addition, Mr. Stavropoulos is a member of the University of Notre Dame Advisory Council for the College of Science, a Trustee of the Rollin L. Gerstacker Foundation, and a Director of Artis-Naples in Naples, Florida. Previously, Mr. Stavropoulos served as Trustee of certain Fidelity® funds (2001-2018) and as a Director of Chemical Financial Corporation (bank holding company, 1993-2012) and Tyco International, Ltd. (multinational manufacturing and services, 2007-2012).
Carol B. Tomé (1957)
Year of Election or Appointment: 2017
Member of the Advisory Board
Ms. Tomé also serves as Member of the Advisory Board of other Fidelity® funds. Ms. Tomé is Chief Financial Officer (2001-present) and Executive Vice President of Corporate Services (2007-present) of The Home Depot, Inc. (home improvement retailer) and a Director (2003-present) and Chair of the Audit Committee (2004-present) of United Parcel Service, Inc. (package delivery and supply chain management). Previously, Ms. Tomé served as Trustee of certain Fidelity® funds (2017), Senior Vice President of Finance and Accounting/Treasurer (2000-2007) and Vice President and Treasurer (1995-2000) of The Home Depot, Inc. and Chair of the Board (2010-2012), Vice Chair of the Board (2009 and 2013), and a Director (2008-2013) of the Federal Reserve Bank of Atlanta. Ms. Tomé is also a director or trustee of many community and professional organizations.
Elizabeth Paige Baumann (1968)
Year of Election or Appointment: 2017
Anti-Money Laundering (AML) Officer
Ms. Baumann also serves as AML Officer of other funds. She is Chief AML Officer (2012-present) and Senior Vice President (2014-present) of FMR LLC (diversified financial services company) and is an employee of Fidelity Investments. Previously, Ms. Baumann served as AML Officer of the funds (2012-2016), and Vice President (2007-2014) and Deputy Anti-Money Laundering Officer (2007-2012) of FMR LLC.
Marc R. Bryant (1966)
Year of Election or Appointment: 2013
Secretary and Chief Legal Officer (CLO)
Mr. Bryant also serves as Secretary and CLO of other funds. Mr. Bryant serves as CLO, Secretary, and Senior Vice President of Fidelity Management & Research Company (investment adviser firm, 2015-present) and FMR Co., Inc. (investment adviser firm, 2015-present); Secretary of Fidelity SelectCo, LLC (investment adviser firm, 2015-present) and Fidelity Investments Money Management, Inc. (investment adviser firm, 2015-present); and CLO of Fidelity Management & Research (Hong Kong) Limited and FMR Investment Management (UK) Limited (investment adviser firms, 2015-present) and Fidelity Management & Research (Japan) Limited (investment adviser firm, 2016-present). He is Senior Vice President and Deputy General Counsel of FMR LLC (diversified financial services company). Previously, Mr. Bryant served as Secretary and CLO of Fidelity Rutland Square Trust II (2010-2014) and Assistant Secretary of Fidelity's Fixed Income and Asset Allocation Funds (2013-2015). Prior to joining Fidelity Investments, Mr. Bryant served as a Senior Vice President and the Head of Global Retail Legal for AllianceBernstein L.P. (2006-2010), and as the General Counsel for ProFund Advisors LLC (2001-2006).
William C. Coffey (1969)
Year of Election or Appointment: 2009
Assistant Secretary
Mr. Coffey also serves as Assistant Secretary of other funds. He is Senior Vice President and Deputy General Counsel of FMR LLC (diversified financial services company, 2010-present), and is an employee of Fidelity Investments. Previously, Mr. Coffey served as Vice President and Associate General Counsel of FMR LLC (2005-2009).
Jonathan Davis (1968)
Year of Election or Appointment: 2010
Assistant Treasurer
Mr. Davis also serves as Assistant Treasurer of other funds. Mr. Davis serves as Assistant Treasurer of FMR Capital, Inc. (2017-present) and is an employee of Fidelity Investments. Previously, Mr. Davis served as Vice President and Associate General Counsel of FMR LLC (diversified financial services company, 2003-2010).
Adrien E. Deberghes (1967)
Year of Election or Appointment: 2018
Assistant Treasurer
Mr. Deberghes also serves as an officer of other funds. He serves as Assistant Treasurer of FMR Capital, Inc. (2017-present), Executive Vice President of Fidelity Investments Money Management, Inc. (FIMM) (investment adviser firm, 2016-present), and is an employee of Fidelity Investments (2008-present). Previously, Mr. Deberghes served as President and Treasurer of certain Fidelity® funds (2013-2018). Prior to joining Fidelity Investments, Mr. Deberghes was Senior Vice President of Mutual Fund Administration at State Street Corporation (2007-2008), Senior Director of Mutual Fund Administration at Investors Bank & Trust (2005-2007), and Director of Finance for Dunkin' Brands (2000-2005). Previously, Mr. Deberghes served in other fund officer roles.
Joseph DeSantis (1959)
Year of Election or Appointment: 2015
Vice President
Mr. DeSantis also serves as Vice President of other funds. Mr. DeSantis serves as a Director of Fidelity Management & Research (Japan) Limited (investment adviser firm, 2016-present), Chief Investment Officer, Equities (2010-present) and is an employee of Fidelity Investments.
Stephanie J. Dorsey (1969)
Year of Election or Appointment: 2010
Assistant Treasurer
Ms. Dorsey also serves as an officer of other funds. Ms. Dorsey serves as Assistant Treasurer of FMR Capital, Inc. (2017-present), is an employee of Fidelity Investments (2008-present), and has served in other fund officer roles. Prior to joining Fidelity Investments, Ms. Dorsey served as Treasurer (2004-2008) of the JPMorgan Mutual Funds and Vice President (2004-2008) of JPMorgan Chase Bank.
Howard J. Galligan III (1966)
Year of Election or Appointment: 2014
Chief Financial Officer
Mr. Galligan also serves as Chief Financial Officer of other funds. Mr. Galligan serves as President of Fidelity Pricing and Cash Management Services (FPCMS) (2014-present) and as a Director of Strategic Advisers LLC (investment adviser firm, 2008-present). Previously, Mr. Galligan served as Chief Administrative Officer of Asset Management (2011-2014) and Chief Operating Officer and Senior Vice President of Investment Support for Strategic Advisers, Inc. (2003-2011).
Brian B. Hogan (1964)
Year of Election or Appointment: 2009
Vice President
Mr. Hogan also serves as Trustee or Vice President of other funds. Mr. Hogan serves as Head of Fidelity Investments’ Investment Solutions and Innovation organization (2018-present), and as a Director of FMR Investment Management (UK) Limited (investment adviser firm, 2015-present) and Fidelity SelectCo, LLC (investment adviser firm, 2014-present). Previously, Mr. Hogan served as Trustee of certain Fidelity® funds (2014-2018), President of the Equity Division of FMR (investment adviser firm, 2009-2018), Senior Vice President, Equity Research of FMR (2006-2009), and as a portfolio manager. Mr. Brian B. Hogan is not related to Mr. Colm A. Hogan.
Colm A. Hogan (1973)
Year of Election or Appointment: 2018
Deputy Treasurer
Mr. Hogan also serves as an officer of other funds. Mr. Hogan serves as Assistant Treasurer of FMR Capital, Inc. (2017-present) and is an employee of Fidelity Investments (2005-present). Previously, Mr. Hogan served as Assistant Treasurer of certain Fidelity® funds (2016-2018). Mr. Colm A. Hogan is not related to Mr. Brian B. Hogan.
Chris Maher (1972)
Year of Election or Appointment: 2013
Assistant Treasurer
Mr. Maher serves as Assistant Treasurer of other funds. Mr. Maher is Vice President of Valuation Oversight, serves as Assistant Treasurer of FMR Capital, Inc. (2017-present), and is an employee of Fidelity Investments. Previously, Mr. Maher served as Vice President of Asset Management Compliance (2013), Vice President of the Program Management Group of FMR (investment adviser firm, 2010-2013), and Vice President of Valuation Oversight (2008-2010).
Rieco E. Mello (1969)
Year of Election or Appointment: 2017
Assistant Treasurer
Mr. Mello also serves as Assistant Treasurer of other funds. Mr. Mello serves as Assistant Treasurer of FMR Capital, Inc. (2017-present) and is an employee of Fidelity Investments (1995-present).
Kenneth B. Robins (1969)
Year of Election or Appointment: 2018
Chief Compliance Officer
Mr. Robins also serves as an officer of other funds. Mr. Robins serves as Compliance Officer of Fidelity Management & Research Company and FMR Co., Inc. (investment adviser firms, 2016-present) and is an employee of Fidelity Investments (2004-present). Previously, Mr. Robins served as Executive Vice President of Fidelity Investments Money Management, Inc. (investment adviser firm, 2013-2016) and served in other fund officer roles.
Stacie M. Smith (1974)
Year of Election or Appointment: 2018
President and Treasurer
Ms. Smith also serves as an officer of other funds. Ms. Smith serves as Assistant Treasurer of FMR Capital, Inc. (2017-present), is an employee of Fidelity Investments (2009-present), and has served in other fund officer roles. Prior to joining Fidelity Investments, Ms. Smith served as Senior Audit Manager of Ernst & Young LLP (accounting firm, 1996-2009). Previously, Ms. Smith served as Assistant Treasurer (2013-2018) and Deputy Treasurer (2013-2016) of certain Fidelity® funds.
Marc L. Spector (1972)
Year of Election or Appointment: 2017
Assistant Treasurer
Mr. Spector also serves as an officer of other funds. Mr. Spector serves as Assistant Treasurer of FMR Capital, Inc. (2017-present) and is an employee of Fidelity Investments (2016-present). Prior to joining Fidelity Investments, Mr. Spector served as Director at the Siegfried Group (accounting firm, 2013-2016), and prior to Siegfried Group as audit senior manager at Deloitte & Touche (accounting firm, 2005-2013).
Renee Stagnone (1975)
Year of Election or Appointment: 2016
Assistant Treasurer
Ms. Stagnone also serves as an officer of other funds. Ms. Stagnone serves as Assistant Treasurer of FMR Capital, Inc. (2017-present) and is an employee of Fidelity Investments (1997-present). Previously, Ms. Stagnone served as Deputy Treasurer of certain Fidelity® funds (2013-2016).
Shareholder Expense Example
As a shareholder of a Fund, you incur two types of costs: (1) transaction costs, including sales charges (loads) on purchase payments or redemption proceeds and (2) ongoing costs, including management fees, distribution and/or service (12b-1) fees and other Fund expenses. This Example is intended to help you understand your ongoing costs (in dollars) of investing in the Funds and to compare these costs with the ongoing costs of investing in other mutual funds.
The Example is based on an investment of $1,000 invested at the beginning of the period and held for the entire period (September 1, 2017 to February 28, 2018).
Actual Expenses
The first line of the accompanying table for each Class of each fund provides information about actual account values and actual expenses. You may use the information in this line, together with the amount you invested, to estimate the expenses that you paid over the period. Simply divide your account value by $1,000.00 (for example, an $8,600 account value divided by $1,000.00 = 8.6), then multiply the result by the number in the first line for a Class of the fund under the heading entitled "Expenses Paid During Period" to estimate the expenses you paid on your account during this period. A small balance maintenance fee of $12.00 that is charged once a year may apply for certain accounts with a value of less than $2,000. This fee is not included in the table below. If it was, the estimate of expenses you paid during the period would be higher, and your ending account value lower, by this amount. In addition, each Fund, as a shareholder in the underlying Fidelity Central Funds, will indirectly bear its pro-rata share of the fees and expenses incurred by the underlying Fidelity Central Funds. These fees and expenses are not included in the Fund's annualized expense ratio used to calculate the expense estimate in the table below.
Hypothetical Example for Comparison Purposes
The second line of the accompanying table for each Class of each fund provides information about hypothetical account values and hypothetical expenses based on a Class' actual expense ratio and an assumed rate of return of 5% per year before expenses, which is not the Class' actual return. The hypothetical account values and expenses may not be used to estimate the actual ending account balance or expenses you paid for the period. You may use this information to compare the ongoing costs of investing in the Fund and other funds. To do so, compare this 5% hypothetical example with the 5% hypothetical examples that appear in the shareholder reports of the other funds. A small balance maintenance fee of $12.00 that is charged once a year may apply for certain accounts with a value of less than $2,000. This fee is not included in the table below. If it was, the estimate of expenses you paid during the period would be higher, and your ending account value lower, by this amount. In addition, each Fund, as a shareholder in the underlying Fidelity Central Funds, will indirectly bear its pro-rata share of the fees and expenses incurred by the underlying Fidelity Central Funds. These fees and expenses are not included in the Fund's annualized expense ratio used to calculate the expense estimate in the table below.
Please note that the expenses shown in the table are meant to highlight your ongoing costs only and do not reflect any transaction costs. Therefore, the second line of the table is useful in comparing ongoing costs only, and will not help you determine the relative total costs of owning different funds. In addition, if these transactional costs were included, your costs would have been higher.
| | Annualized Expense Ratio-A | Beginning
Account Value
September 1, 2017 | Ending
Account Value
February 28, 2018 | Expenses Paid
During Period-B
September 1, 2017
to February 28, 2018 |
| Telecommunications Portfolio | | | | |
| Class A | 1.14% | | | |
| Actual | | $1,000.00 | $946.90 | $5.50 |
| Hypothetical-C | | $1,000.00 | $1,019.14 | $5.71 |
| Class M | 1.50% | | | |
| Actual | | $1,000.00 | $945.20 | $7.23 |
| Hypothetical-C | | $1,000.00 | $1,017.36 | $7.50 |
| Class C | 1.86% | | | |
| Actual | | $1,000.00 | $943.40 | $8.96 |
| Hypothetical-C | | $1,000.00 | $1,015.57 | $9.30 |
| Telecommunications | .82% | | | |
| Actual | | $1,000.00 | $948.20 | $3.96 |
| Hypothetical-C | | $1,000.00 | $1,020.73 | $4.11 |
| Class I | .82% | | | |
| Actual | | $1,000.00 | $948.40 | $3.96 |
| Hypothetical-C | | $1,000.00 | $1,020.73 | $4.11 |
| Wireless Portfolio | .81% | | | |
| Actual | | $1,000.00 | $1,053.20 | $4.12 |
| Hypothetical-C | | $1,000.00 | $1,020.78 | $4.06 |
A Annualized expense ratio reflects expenses net of applicable fee waivers.
B Expenses are equal to each Class' annualized expense ratio, multiplied by the average account value over the period, multiplied by 181/ 365 (to reflect the one-half year period).
C 5% return per year before expenses
Distributions (Unaudited)
The Board of Trustees of each fund voted to pay to shareholders of record at the opening of business on record date, the following distributions per share derived from capital gains realized from sales of portfolio securities, and dividends derived from net investment income:
| | Pay Date | Record Date | Dividends | Capital Gains |
| Telecommunications Portfolio | 04/12/18 | 04/11/18 | $0.213 | $0.615 |
| Wireless Portfolio | 04/12/18 | 04/11/18 | $0.019 | $0.077 |
|
The funds hereby designate as capital gain dividend the amounts noted below for the taxable year ended February 28, 2018, or, if subsequently determined to be different, the net capital gain of such year.
| Telecommunications Portfolio | $50,643,126 |
| Wireless Portfolio | $9,236,257 |
|
A percentage of the dividends distributed during the fiscal year for the following funds qualify for the dividends–received deduction for corporate shareholders:
| | April 2017 | December 2017 |
| Telecommunications Portfolio | 100% | 100% |
| Wireless Portfolio | 99% | 93% |
|
A percentage of the dividends distributed during the fiscal year for the following funds may be taken into account as a dividend for purposes of the maximum rate under section 1(h)(11) of the Internal Revenue Code.
| | April 2017 | December 2017 |
| Telecommunications Portfolio | 93% | 100% |
| Wireless Portfolio | 100% | 100% |
|
The funds will notify shareholders in January 2019 of amounts for use in preparing 2018 income tax returns.
Board Approval of Investment Advisory Contracts and Management Fees
Telecommunications Portfolio
Wireless Portfolio
Each year, the Board of Trustees, including the Independent Trustees (together, the Board), votes on the renewal of the management contract with Fidelity SelectCo, LLC (SelectCo), an affiliate of Fidelity Management & Research Company (FMR), and the sub-advisory agreements with affiliates of FMR (together, the Advisory Contracts) for each fund. SelectCo and the sub-advisers are collectively referred to herein as the Investment Advisers. The Board, assisted by the advice of fund counsel and Independent Trustees' counsel, requests and considers a broad range of information relevant to the renewal of the Advisory Contracts throughout the year.
The Board meets regularly and, at each of its meetings, covers an extensive agenda of topics and materials and considers factors that are relevant to its annual consideration of the renewal of each fund's Advisory Contracts, including the services and support provided to each fund and its shareholders. The Board has established four standing committees (Committees) — Operations, Audit, Fair Valuation, and Governance and Nominating — each composed of and chaired by Independent Trustees with varying backgrounds, to which the Board has assigned specific subject matter responsibilities in order to enhance effective decision-making by the Board. The Operations Committee, of which all of the Independent Trustees are members, meets regularly throughout the year and considers, among other matters, information specifically related to the annual consideration of the renewal of each fund's Advisory Contracts. The Board, acting directly and through its Committees, requests and receives information concerning the annual consideration of the renewal of each fund's Advisory Contracts. The Board also meets as needed to review matters specifically related to the Board's annual consideration of the renewal of the Advisory Contracts. Members of the Board may also meet with trustees of other Fidelity funds through ad hoc joint committees to discuss certain matters relevant to all of the Fidelity funds.
At its January 2018 meeting, the Board unanimously determined to renew each fund's Advisory Contracts. In reaching its determination, the Board considered all factors it believed relevant, including (i) the nature, extent, and quality of the services to be provided to each fund and its shareholders (including the investment performance of each fund); (ii) the competitiveness of each fund's management fee and total expense ratio relative to peer funds; (iii) the total costs of the services to be provided by and the profits to be realized by Fidelity from its relationships with each fund; and (iv) the extent to which, if any, economies of scale exist and would be realized as each fund grows, and whether any economies of scale are appropriately shared with fund shareholders.
In considering whether to renew the Advisory Contracts for each fund, the Board reached a determination, with the assistance of fund counsel and Independent Trustees' counsel and through the exercise of its business judgment, that the renewal of the Advisory Contracts was in the best interests of each fund and its shareholders and that the compensation payable under the Advisory Contracts was fair and reasonable. The Board's decision to renew the Advisory Contracts was not based on any single factor, but rather was based on a comprehensive consideration of all the information provided to the Board at its meetings throughout the year. The Board, in reaching its determination to renew the Advisory Contracts, was aware that shareholders of each fund have a broad range of investment choices available to them, including a wide choice among funds offered by Fidelity's competitors, and that each fund's shareholders, who have the opportunity to review and weigh the disclosure provided by the fund in its prospectus and other public disclosures, have chosen to invest in that fund, which is part of the Fidelity family of funds.
Amendment to Group Fee Rate. The Board also ratified an amendment to the management contract for each fund to add an additional breakpoint to the group fee schedule, which was effective October 1, 2017. The Board noted that the additional breakpoint would result in lower management fee rates to the extent that assets under management that are included in group fee calculations increase above the new breakpoint.
Nature, Extent, and Quality of Services Provided. The Board considered the staffing of the Investment Advisers as it relates to the funds, including the backgrounds of investment personnel of SelectCo, and also considered the funds' investment objectives, strategies, and related investment philosophies. The Independent Trustees also had discussions with senior management of Fidelity's investment operations and investment groups. The Board considered the structure of the investment personnel compensation program and whether this structure provides appropriate incentives to act in the best interests of each fund. Additionally, the Board considered the portfolio managers' investments, if any, in the funds that they manage.
Resources Dedicated to Investment Management and Support Services. The Board reviewed the general qualifications and capabilities of the Investment Advisers' investment staffs, including their size, education, experience, and resources, as well as Fidelity's approach to recruiting, training, managing, and compensating investment personnel. The Board noted that Fidelity has continued to increase the resources devoted to non-U.S. offices, including expansion of Fidelity's global investment organization. The Board also noted that Fidelity's analysts have extensive resources, tools and capabilities that allow them to conduct sophisticated quantitative and fundamental analysis, as well as credit analysis of issuers, counterparties and guarantors. Further, the Board considered that Fidelity's investment professionals have sufficient access to global information and data so as to provide competitive investment results over time, and that those professionals also have access to sophisticated tools that permit them to assess portfolio construction and risk and performance attribution characteristics continuously, as well as to transmit new information and research conclusions rapidly around the world. Additionally, in its deliberations, the Board considered Fidelity's trading, risk management, compliance, and technology and operations capabilities and resources, which are integral parts of the investment management process.
Shareholder and Administrative Services. The Board considered (i) the nature, extent, quality, and cost of advisory, administrative, and shareholder services performed by the Investment Advisers and their affiliates under the Advisory Contracts and under separate agreements covering transfer agency, pricing and bookkeeping, and securities lending services for each fund; (ii) the nature and extent of the supervision of third party service providers, principally custodians, subcustodians, and pricing vendors; and (iii) the resources devoted to, and the record of compliance with, each fund's compliance policies and procedures. The Board also reviewed the allocation of fund brokerage, including allocations to brokers affiliated with the Investment Advisers, the use of brokerage commissions to pay fund expenses, and the use of "soft" commission dollars to pay for research services.
The Board noted that the growth of fund assets over time across the complex allows Fidelity to reinvest in the development of services designed to enhance the value or convenience of the Fidelity funds as investment vehicles. These services include 24-hour access to account information and market information through telephone representatives and over the Internet, investor education materials and asset allocation tools, and the expanded availability of Fidelity Investor Centers.
The Board noted that it and the boards of certain other Fidelity funds had formed an ad hoc Committee on Transfer Agency Fees to review the variety of transfer agency fee structures throughout the industry and Fidelity's competitive positioning with respect to industry participants.
Investment in a Large Fund Family. The Board considered the benefits to shareholders of investing in a Fidelity fund, including the benefits of investing in a fund that is part of a large family of funds offering a variety of investment disciplines and providing a large variety of mutual fund investor services. The Board noted that Fidelity had taken, or had made recommendations that resulted in the Fidelity funds taking, a number of actions over the previous year that benefited particular funds, including: (i) continuing to dedicate additional resources to Fidelity's investment research process, which includes meetings with management of issuers in which the funds invest, and to the support of the senior management team that oversees asset management; (ii) continuing efforts to enhance Fidelity's global research capabilities; (iii) launching new funds and making other enhancements to meet client needs; (iv) launching new share classes of existing funds; (v) eliminating purchase minimums and broadening eligibility requirements for certain lower-priced share classes; (vi) reducing management fees and total expenses for certain growth equity funds and index funds; (vii) lowering expense caps for certain existing funds and classes to reduce expenses borne by shareholders; (viii) eliminating short-term redemption fees for certain funds; (ix) introducing a new pricing structure for certain funds of funds that is expected to reduce overall expenses paid by shareholders; (x) rationalizing product lines and gaining increased efficiencies through proposals for fund mergers and share class consolidations; (xi) continuing to develop, acquire and implement systems and technology to improve services to the funds and shareholders, strengthen information security, and increase efficiency; and (xii) implementing enhancements to further strengthen Fidelity's product line to increase investors' probability of success in achieving their investment goals, including retirement income goals.
Investment Performance. The Board considered whether each fund has operated in accordance with its investment objective, as well as its record of compliance with its investment restrictions and its performance history.
The Board took into account discussions with representatives of SelectCo about fund investment performance that occur at Board meetings throughout the year. In this regard the Board noted that as part of regularly scheduled fund reviews and other reports to the Board on fund performance, the Board considers annualized return information for each fund for different time periods, measured against a securities market index ("benchmark index"). In its evaluation of fund investment performance at meetings throughout the year, the Board gave particular attention to information indicating underperformance of certain Fidelity funds for specific time periods and discussed with the Investment Advisers the reasons for such underperformance.
In addition to reviewing absolute and relative fund performance, the Independent Trustees periodically consider the appropriateness of fund performance metrics in evaluating the results achieved. In general, the Independent Trustees believe that fund performance should be evaluated based on net performance (after fees and expenses) of both the highest performing and lowest performing fund share classes, where applicable, compared to appropriate benchmark indices, over appropriate time periods that may include full market cycles, taking into account relevant factors, including the following: general market conditions; issuer-specific information; and fund cash flows and other factors. Depending on the circumstances, the Independent Trustees may be satisfied with a fund's performance notwithstanding that it lags its benchmark index for certain periods.
The Independent Trustees recognize that shareholders evaluate performance on a net basis over their own holding periods, for which one-, three-, and five-year periods are often used as a proxy. For this reason, the performance information reviewed by the Board also included net cumulative total return information for each fund and an appropriate benchmark index for the most recent one-, three-, and five-year periods ended June 30, 2017.
Based on its review, the Board concluded that the nature, extent, and quality of services provided to each fund under the Advisory Contracts should continue to benefit the shareholders of each fund.
Competitiveness of Management Fee and Total Expense Ratio. The Board considered each fund's management fee and total expense ratio compared to "mapped groups" of competitive funds and classes created for the purpose of facilitating the Trustees' analysis of the competitiveness of management fees and total expenses. Fidelity creates "mapped groups" by combining similar Lipper investment objective categories that have comparable investment mandates. For this purpose, all sector focused equity funds are grouped in the same mapped group. Combining Lipper investment objective categories aids the Board's management fee and total expense ratio comparisons by broadening the competitive group used for comparison.
Management Fee. The Board considered two proprietary management fee comparisons for the 12-month periods ended June 30 shown in basis points (BP) in the charts below. The group of Lipper funds used by the Board for management fee comparisons is referred to below as the "Total Mapped Group." The Total Mapped Group comparison focuses on a fund's standing in terms of gross management fees before expense reimbursements or caps relative to the total universe of funds with comparable investment mandates (
i.e., sector equities), regardless of whether their management fee structures also are comparable. Funds with comparable management fee structures have similar management fee contractual arrangements (
e.g., flat rate charged for advisory services, all-inclusive fee rate,
etc.). "TMG %" represents the percentage of funds in the Total Mapped Group that had management fees that were lower than a fund's. For example, a hypothetical TMG % of 20% would mean that 80% of the funds in the Total Mapped Group had higher, and 20% had lower, management fees than a fund. The funds' actual TMG %s and the number of funds in the Total Mapped Group are in the charts below. The "Asset-Size Peer Group" (ASPG) comparison focuses on a fund's standing relative to a subset of non-Fidelity funds within the Total Mapped Group that are similar in size and management fee structure. For example, if a fund is in the first quartile of the ASPG, the fund's management fee ranks in the least expensive or lowest 25% of funds in the ASPG. The ASPG represents at least 15% of the funds in the Total Mapped Group with comparable asset size and management fee structures, subject to a minimum of 50 funds (or all funds in the Total Mapped Group if fewer than 50). Additional information, such as the ASPG quartile in which a fund's management fee rate ranked, is also included in the charts and considered by the Board.
Telecommunications Portfolio

Wireless Portfolio
The Board noted that each fund's management fee rate ranked below the median of its Total Mapped Group and below the median of its ASPG for the 12-month period ended June 30, 2017.
The Board noted that it and the boards of other Fidelity funds formed an ad hoc Committee on Group Fee, which meets periodically, to conduct an in-depth review of the "group fee" component of the management fee of funds with such management fee structures. The Committee's focus included the mechanics of the group fee, the competitive landscape of group fee structures, Fidelity funds with no group fee component and investment products not included in group fee assets. The Board also considered that, for funds subject to the group fee, FMR agreed to voluntarily waive fees over a specified period of time in amounts designed to account for assets converted from certain funds to certain collective investment trusts.
Based on its review, the Board concluded that each fund's management fee is fair and reasonable in light of the services that each fund receives and the other factors considered.
Total Expense Ratio. In its review of the total expense ratio of each class of Telecommunications Portfolio, the Board considered the fund's management fee rate as well as other fund or class expenses, as applicable, such as transfer agent fees, pricing and bookkeeping fees, fund-paid 12b-1 fees, and custodial, legal, and audit fees. The Board also noted that Fidelity may agree to waive fees and expenses from time to time, and the extent to which, if any, it has done so for the fund. As part of its review, the Board also considered the current and historical total expense ratios of each class of the fund compared to competitive fund median expenses. Each class of the fund is compared to those funds and classes in the Total Mapped Group (used by the Board for management fee comparisons) that have a similar sales load structure.
For Telecommunications Portfolio, the Board noted that the total expense ratio of each of Class A, Class C, Class I, and the retail class ranked below the competitive median for the 12-month period ended June 30, 2017 and the total expense ratio of Class M (formerly Class T) ranked above the competitive median for the 12-month period ended June 30, 2017. The Board considered that, in general, various factors can affect total expense ratios. The Board noted that the total expense ratio of Class M was above the competitive median primarily because of higher 12b-1 fees on Class M as compared to most competitor funds. Class M has a higher 12b-1 fee, but a lower front-end sales charge, than traditionally priced front-end sales charge classes. The Board considered that Class M is primarily sold load-waived in the retirement plan market where its 0.50% 12b-1 fee is comparable to competing no-load, higher 12b-1 fee classes designed specifically for retirement plans. The Board noted that each fund offers multiple classes, each of which has a different sales load and 12b-1 fee structure, and that the multiple structures are intended to offer a range of pricing options for the intermediary market. The Board also noted that the total expense ratios of the classes of each fund vary primarily by the level of their 12b-1 fees, although differences in transfer agent fees may also cause expenses to vary from class to class.
In its review of Wireless Portfolio's total expense ratio, the Board considered the fund's management fee rate as well as other fund expenses, such as transfer agent fees, pricing and bookkeeping fees, and custodial, legal, and audit fees. The Board also noted that Fidelity may agree to waive fees and expenses from time to time, and the extent to which, if any, it has done so for the fund. As part of its review, the Board also considered the current and historical total expense ratios of the fund compared to competitive fund median expenses. The fund is compared to those funds and classes in the Total Mapped Group (used by the Board for management fee comparisons) that have a similar sales load structure.
For Wireless Portfolio, the Board noted that the total expense ratio ranked below the competitive median for the 12-month period ended June 30, 2017.
Fees Charged to Other Fidelity Clients. The Board also considered Fidelity fee structures and other information with respect to clients of Fidelity, such as other funds advised or subadvised by Fidelity, pension plan clients, and other institutional clients with similar mandates. The Board noted that an ad hoc joint committee created by it and the boards of other Fidelity funds periodically reviews and compares Fidelity's institutional investment advisory business with its business of providing services to the Fidelity funds, including the differences in services provided, fees charged, and costs incurred, as well as competition in their respective marketplaces.
Based on its review of total expense ratios and fees charged to other Fidelity clients, the Board concluded that, although the expense ratio of Class M of Telecommunications Portfolio was above the median of the universe presented for comparison, the total expense ratio of each class of each fund was reasonable in light of the services that each fund and its shareholders receive and the other factors considered.
Costs of the Services and Profitability. The Board considered the revenues earned and the expenses incurred by Fidelity in conducting the business of developing, marketing, distributing, managing, administering and servicing each fund and servicing each fund's shareholders. The Board also considered the level of Fidelity's profits in respect of all the Fidelity funds.
On an annual basis, Fidelity presents to the Board information about the profitability of its relationships with each fund. Fidelity calculates profitability information for each fund, as well as aggregate profitability information for groups of Fidelity funds and all Fidelity funds, using a series of detailed revenue and cost allocation methodologies which originate with the books and records of Fidelity on which Fidelity's audited financial statements are based. The Audit Committee of the Board reviews any significant changes from the prior year's methodologies.
PricewaterhouseCoopers LLP (PwC), independent registered public accounting firm and auditor to Fidelity and certain Fidelity funds, has been engaged annually by the Board as part of the Board's assessment of the profitability analysis used by Fidelity. PwC's engagement includes the review and assessment of Fidelity's methodologies used in determining the revenues and expenses attributable to Fidelity's mutual fund business, and completion of agreed-upon procedures in respect of the mathematical accuracy of the fund profitability information and its conformity to established allocation methodologies. After considering PwC's reports issued under the engagement and information provided by Fidelity, the Board concluded that while other allocation methods may also be reasonable, Fidelity's profitability methodologies are reasonable in all material respects.
The Board also reviewed Fidelity's non-fund businesses and potential fall-out benefits related to the mutual fund business as well as cases where Fidelity's affiliates may benefit from or be related to the funds' business.
The Board considered the costs of the services provided by and the profits realized by Fidelity in connection with the operation of each fund and was satisfied that the profitability was not excessive.
Economies of Scale. The Board considered whether there have been economies of scale in respect of the management of the Fidelity funds, whether the Fidelity funds (including each fund) have appropriately benefited from any such economies of scale, and whether there is potential for realization of any further economies of scale. The Board considered the extent to which each fund will benefit from economies of scale as assets grow through increased services to the fund, through waivers or reimbursements, or through fee or expense ratio reductions. The Board also noted that a committee (the Economies of Scale Committee) created by it and the boards of other Fidelity funds periodically analyzes whether Fidelity attains economies of scale in respect of the management and servicing of the Fidelity funds, whether the Fidelity funds have appropriately benefited from such economies of scale, and whether there is potential for realization of any further economies of scale.
The Board recognized that each fund's management contract incorporates a "group fee" structure, which provides for lower group fee rates as total group assets increase, and for higher group fee rates as total group assets decrease (with "group assets" defined to include fund assets under SelectCo's management plus assets under FMR's management). SelectCo calculates the group fee rates based on a tiered asset "breakpoint" schedule that varies based on asset class. The Board considered that the group fee is designed to deliver the benefits of economies of scale to fund shareholders when total group assets increase, even if assets of any particular fund are unchanged or have declined, because some portion of Fidelity's costs are attributable to services provided to all Fidelity funds, and all funds benefit if those costs can be allocated among more assets. The Board concluded that, given the group fee structure, fund shareholders will benefit from lower management fees as group assets increase at the fund complex level, regardless of whether Fidelity achieves any such economies of scale.
The Board concluded, taking into account the analysis of the Economies of Scale Committee, that economies of scale, if any, are being appropriately shared between fund shareholders and Fidelity.
Additional Information Requested by the Board. In order to develop fully the factual basis for consideration of the Fidelity funds' advisory contracts, the Board requested and received additional information on certain topics, including: (i) Fidelity's fund profitability methodology, profitability trends for certain funds, and the impact of certain factors on fund profitability results; (ii) portfolio manager changes that have occurred during the past year and the amount of the investment that each portfolio manager has made in the Fidelity fund(s) that he or she manages; (iii) Fidelity's compensation structure for portfolio managers, research analysts, and other key personnel, including its effects on fund profitability; (iv) comparisons to institutional products; (v) the arrangements with and compensation paid to certain fund sub-advisers on behalf of the Fidelity funds; (vi) the impact of proposed changes to contractual expense cap arrangements in place for certain funds; (vii) Fidelity's long-term expectations for its offerings in the workplace investing channel; (viii) the methodology with respect to evaluating competitive fund data and peer group classifications and fee comparisons; (ix) the presentation of certain fund performance information; (x) Fidelity's transfer agent fee, expense, and service structures for different funds and classes, including the increased use of omnibus accounts and lower pricing in the retirement channel; (xi) fluctuations in trading expenses; (xii) explanations regarding the relative total expense ratios of certain funds and classes; and (xiii) Fidelity's expectations regarding the future asset levels of certain funds.
Based on its evaluation of all of the conclusions noted above, and after considering all factors it believed relevant, the Board concluded that the advisory fee structures are fair and reasonable, and that each fund's Advisory Contracts should be renewed.
Proxy Voting Results
A special meeting of shareholders was held on December 8, 2017. The results of votes taken among shareholders on the proposals before them are reported below. Each vote reported represents one dollar of net asset value held on the record date for the meeting.
PROPOSAL 1
To elect a Board of Trustees.
| | # of
Votes | % of
Votes |
| James C. Curvey |
| Affirmative | 40,874,579,146.19 | 94.146 |
| Withheld | 2,541,618,753.48 | 5.854 |
| TOTAL | 43,416,197,899.67 | 100.000 |
| Dennis J. Dirks |
| Affirmative | 41,093,243,800.03 | 94.650 |
| Withheld | 2,322,954,099.64 | 5.350 |
| TOTAL | 43,416,197,899.67 | 100.000 |
| Donald F. Donahue |
| Affirmative | 41,121,116,505.64 | 94.714 |
| Withheld | 2,295,081,394.03 | 5.286 |
| TOTAL | 43,416,197,899.67 | 100.000 |
| Alan J. Lacy |
| Affirmative | 41,091,494,851.72 | 94.646 |
| Withheld | 2,324,703,047.95 | 5.354 |
| TOTAL | 43,416,197,899.67 | 100.00 |
| Ned C. Lautenbach |
| Affirmative | 40,970,733,721.42 | 94.368 |
| Withheld | 2,445,464,178.25 | 5.632 |
| TOTAL | 43,416,197,899.67 | 100.000 |
| Joseph Mauriello |
| Affirmative | 41,021,688,840.89 | 94.485 |
| Withheld | 2,394,509,058.78 | 5.515 |
| TOTAL | 43,416,197,899.67 | 100.000 |
| Charles S. Morrison |
| Affirmative | 41,163,534,997.01 | 94.812 |
| Withheld | 2,252,662,902.66 | 5.188 |
| TOTAL | 43,416,197,899.67 | 100.000 |
| Cornelia M. Small |
| Affirmative | 41,061,752,034.66 | 94.578 |
| Withheld | 2,354,445,865.01 | 5.422 |
| TOTAL | 43,416,197,899.67 | 100.000 |
| Garnett A. Smith |
| Affirmative | 41,061,939,407.02 | 94.578 |
| Withheld | 2,354,258,492.65 | 5.422 |
| TOTAL | 43,416,197,899.67 | 100.000 |
| David M. Thomas |
| Affirmative | 41,102,875,738.06 | 94.672 |
| Withheld | 2,313,322,161.61 | 5.328 |
| TOTAL | 43,416,197,899.67 | 100.000 |
| Michael E. Wiley |
| Affirmative | 41,112,279,187.11 | 94.694 |
| Withheld | 2,303,918,712.56 | 5.306 |
| TOTAL | 43,416,197,899.67 | 100.000 |
PROPOSAL 2
To eliminate a fundamental investment policy for Telecommunications Portfolio.
| | # of
Votes | % of
Votes |
| Affirmative | 162,019,030.04 | 74.073 |
| Against | 27,461,064.77 | 12.555 |
| Abstain | 16,983,637.20 | 7.765 |
| Broker Non-Vote | 12,265,953.67 | 5.607 |
| TOTAL | 218,729,685.68 | 100.000 |
PROPOSAL 2
To eliminate a fundamental investment policy for Wireless Portfolio.
| | # of
Votes | % of
Votes |
| Affirmative | 121,674,303.19 | 75.607 |
| Against | 21,823,236.50 | 13.561 |
| Abstain | 8,164,414.14 | 5.073 |
| Broker Non-Vote | 9,269,616.97 | 5.759 |
| TOTAL | 160,931,570.80 | 100.000 |
PROPOSAL 3
To eliminate a fundamental investment policy for Telecommunications Portfolio.
| | # of
Votes | % of
Votes |
| Affirmative | 165,072,876.21 | 75.469 |
| Against | 22,149,640.69 | 10.127 |
| Abstain | 19,241,215.11 | 8.797 |
| Broker Non-Vote | 12,265,953.67 | 5.607 |
| TOTAL | 218,729,685.68 | 100.000 |
PROPOSAL 3
To eliminate a fundamental investment policy for Wireless Portfolio.
| | # of
Votes | % of
Votes |
| Affirmative | 126,851,297.87 | 78.824 |
| Against | 16,906,721.96 | 10.506 |
| Abstain | 7,903,934.00 | 4.911 |
| Broker Non-Vote | 9,269,616.97 | 5.759 |
| TOTAL | 160,931,570.80 | 100.000 |
|
| Proposal 1 reflects trust wide proposal and voting results. |
SELTS-ANN-0418
1.846050.111
Fidelity® Select Portfolios®
Utilities Sector Utilities Portfolio
Annual Report February 28, 2018 |
|
Contents
To view a fund's proxy voting guidelines and proxy voting record for the 12-month period ended June 30, visit http://www.fidelity.com/proxyvotingresults or visit the Securities and Exchange Commission's (SEC) web site at http://www.sec.gov.
You may also call 1-800-544-8544 to request a free copy of the proxy voting guidelines.
Standard & Poor's, S&P and S&P 500 are registered service marks of The McGraw-Hill Companies, Inc. and have been licensed for use by Fidelity Distributors Corporation.
Other third-party marks appearing herein are the property of their respective owners.
All other marks appearing herein are registered or unregistered trademarks or service marks of FMR LLC or an affiliated company. © 2018 FMR LLC. All rights reserved.
This report and the financial statements contained herein are submitted for the general information of the shareholders of the Fund. This report is not authorized for distribution to prospective investors in the Fund unless preceded or accompanied by an effective prospectus.
A fund files its complete schedule of portfolio holdings with the SEC for the first and third quarters of each fiscal year on Form N-Q. Forms N-Q are available on the SEC’s web site at http://www.sec.gov. A fund's Forms N-Q may be reviewed and copied at the SEC’s Public Reference Room in Washington, DC. Information regarding the operation of the SEC's Public Reference Room may be obtained by calling 1-800-SEC-0330.
For a complete list of a fund's portfolio holdings, view the most recent holdings listing, semiannual report, or annual report on Fidelity's web site at http://www.fidelity.com, http://www.institutional.fidelity.com, or http://www.401k.com, as applicable.
NOT FDIC INSURED •MAY LOSE VALUE •NO BANK GUARANTEE
Neither the Fund nor Fidelity Distributors Corporation is a bank.
Performance: The Bottom Line
Average annual total return reflects the change in the value of an investment, assuming reinvestment of distributions from dividend income and capital gains (the profits earned upon the sale of securities that have grown in value, if any) and assuming a constant rate of performance each year. The hypothetical investment and the average annual total returns do not reflect the deduction of taxes that a shareholder would pay on fund distributions or the redemption of fund shares. During periods of reimbursement by Fidelity, a fund’s total return will be greater than it would be had the reimbursement not occurred. How a fund did yesterday is no guarantee of how it will do tomorrow.
Average Annual Total Returns
| For the periods ended February 28, 2018 | Past 1 year | Past 5 years | Past 10 years |
| Utilities Portfolio | 4.99% | 9.44% | 6.47% |
$10,000 Over 10 Years
Let's say hypothetically that $10,000 was invested in Utilities Portfolio on February 29, 2008.
The chart shows how the value of your investment would have changed, and also shows how the S&P 500® Index performed over the same period.
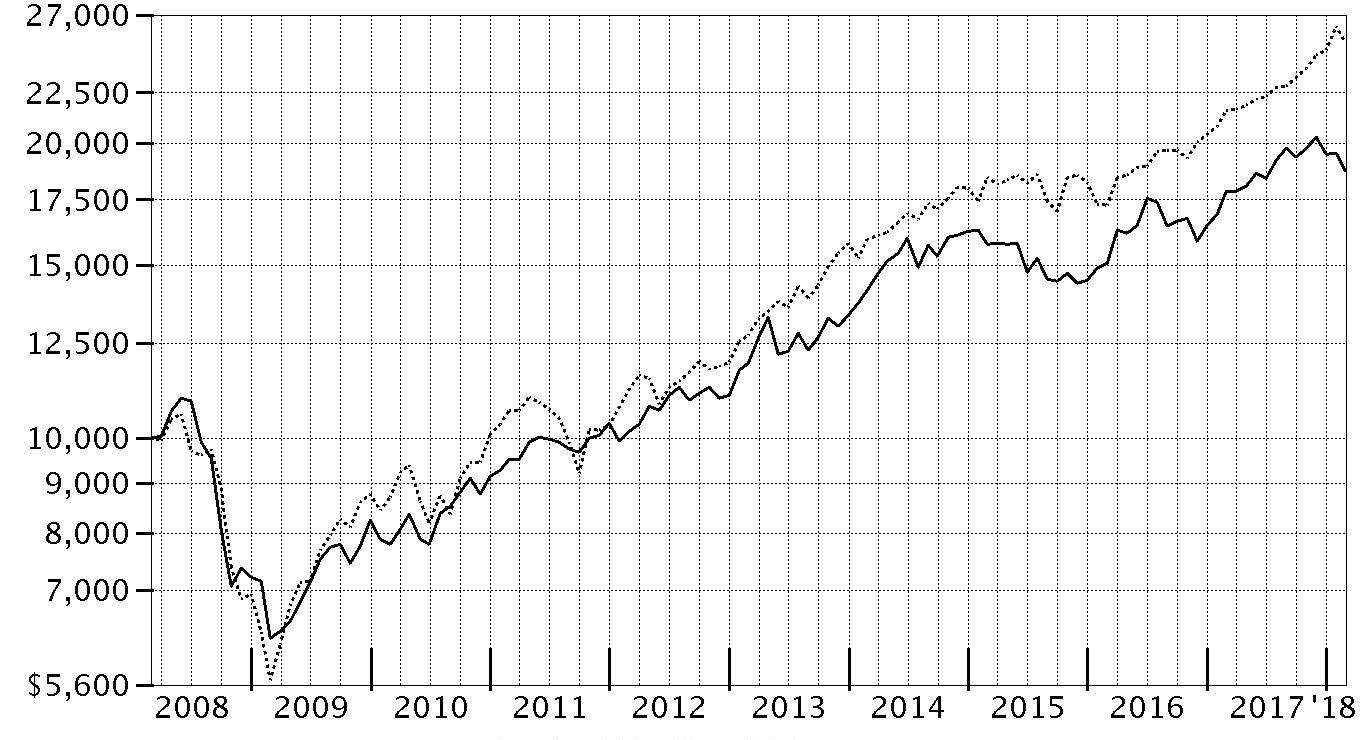
| Period Ending Values |
| $18,724 | Utilities Portfolio |
| $25,307 | S&P 500® Index |
Management's Discussion of Fund Performance
Market Recap: U.S. equities gained 17.10% for the 12 months ending February 28, 2018, as the S&P 500
® index moved steadily higher throughout 2017 and into 2018 until sharply reversing course in February. The drop was in stark contrast to the low volatility seen throughout 2017, along with consumer sentiment and other market indicators that stayed positive. Investors remained decidedly upbeat as the calendar turned, and the index rose 5.73% in January. February was a decidedly different story, though, as volatility spiked amid fear that rising inflation and the potential for the economy to overheat would prompt the U.S. Federal Reserve to pick up the pace of interest rate hikes. The index returned -3.69% for the month, its first negative result since October 2016. For the full 12 months, growth stocks handily topped value, while large-caps bested small-caps. By sector, information technology fared best by far, gaining 36% amid strong earnings growth from several major index constituents. Consumer discretionary (+22%) also stood out, driven by retailers. Financials added 20%, riding the uptick in bond yields. Materials and industrials rose about 16% each, boosted by higher demand, especially from China. Conversely, notable laggards included the defensive telecommunication services (-5%) and utilities (-2%) sectors, while rising rates held back real estate (-3%).
Comments from Portfolio Manager Douglas Simmons: For the 12 months ending February 28, 2018, the fund gained 4.99%, well ahead of the -1.55% return of the sector benchmark, the MSCI U.S. IMI Utilities 25/50 Index, but trailing the broadly based S&P 500
®. In a rising interest rate environment, utilities historically have tended to underperform the broader market. This scenario played out again this fiscal year, as relatively cheaper utility stocks backed by dividend growth and solid business fundamentals – a number of which were owned by the fund – outperformed. Favorable stock picking was the main driver of performance versus the MSCI index, led by choices in electric utilities. Here, a large overweighting in NextEra Energy, the largest U.S. renewable energy provider, was our biggest individual contributor. The company benefited from solid operational execution and earnings growth. Stock selection and an overweighting in the independent power producers & energy traders segment also contributed, led by our position in NRG Energy. Conversely, stock picking in multi-utilities detracted. Here, our stake in South Carolina regulated electric and natural gas utility SCANA proved detrimental, as the firm encountered numerous obstacles to completing its nuclear projects.
The views expressed above reflect those of the portfolio manager(s) only through the end of the period as stated on the cover of this report and do not necessarily represent the views of Fidelity or any other person in the Fidelity organization. Any such views are subject to change at any time based upon market or other conditions and Fidelity disclaims any responsibility to update such views. These views may not be relied on as investment advice and, because investment decisions for a Fidelity fund are based on numerous factors, may not be relied on as an indication of trading intent on behalf of any Fidelity fund.
Note to Shareholders: On December 8, 2017, shareholders approved proposals from the Board of Trustees to eliminate each sector/industry fund's fundamental “invests primarily” policy and to modify the fundamental concentration policy for certain funds. The changes took effect on January 1, 2018, and do not impact how the funds are managed.
Investment Summary (Unaudited)
Top Ten Stocks as of February 28, 2018
| | % of fund's net assets |
| NextEra Energy, Inc. | 15.6 |
| Exelon Corp. | 10.5 |
| Sempra Energy | 10.0 |
| NRG Energy, Inc. | 7.0 |
| FirstEnergy Corp. | 4.8 |
| The AES Corp. | 4.8 |
| Comcast Corp. Class A | 4.4 |
| Public Service Enterprise Group, Inc. | 4.4 |
| Eversource Energy | 4.4 |
| Avangrid, Inc. | 3.9 |
| | 69.8 |
Top Industries (% of fund's net assets)
| As of February 28, 2018 |
| | Electric Utilities | 48.4% |
| | Multi-Utilities | 25.2% |
| | Independent Power and Renewable Electricity Producers | 15.6% |
| | Media | 6.7% |
| | Oil, Gas & Consumable Fuels | 2.8% |
| | All Others* | 1.3% |

* Includes Short-Term investments and Net Other Assets (Liabilities).
Schedule of Investments February 28, 2018
Showing Percentage of Net Assets
| Common Stocks - 99.3% | | | |
| | | Shares | Value |
| Electric Utilities - 48.4% | | | |
| Electric Utilities - 48.4% | | | |
| Eversource Energy | | 551,100 | $31,412,700 |
| Exelon Corp. | | 2,025,292 | 75,016,816 |
| FirstEnergy Corp. | | 1,074,303 | 34,732,216 |
| Great Plains Energy, Inc. | | 893,582 | 26,047,915 |
| NextEra Energy, Inc. | | 734,732 | 111,789,474 |
| PG&E Corp. | | 507,504 | 20,853,339 |
| Vistra Energy Corp. (a) | | 1,417,607 | 26,863,653 |
| Westar Energy, Inc. | | 412,368 | 20,094,693 |
| | | | 346,810,806 |
| Equity Real Estate Investment Trusts (REITs) - 0.2% | | | |
| Specialized REITs - 0.2% | | | |
| InfraReit, Inc. | | 81,218 | 1,513,904 |
| Gas Utilities - 0.4% | | | |
| Gas Utilities - 0.4% | | | |
| South Jersey Industries, Inc. | | 97,200 | 2,547,612 |
| Independent Power and Renewable Electricity Producers - 15.6% | | | |
| Independent Power Producers & Energy Traders - 12.5% | | | |
| NRG Energy, Inc. | | 1,933,602 | 50,002,948 |
| NRG Yield, Inc. Class C | | 353,000 | 5,524,450 |
| The AES Corp. | | 3,156,204 | 34,307,937 |
| | | | 89,835,335 |
| Renewable Electricity - 3.1% | | | |
| NextEra Energy Partners LP | | 567,053 | 22,251,160 |
|
| TOTAL INDEPENDENT POWER AND RENEWABLE ELECTRICITY PRODUCERS | | | 112,086,495 |
|
| Media - 6.7% | | | |
| Cable & Satellite - 4.4% | | | |
| Comcast Corp. Class A | | 883,406 | 31,988,131 |
| Movies & Entertainment - 2.3% | | | |
| Time Warner, Inc. | | 176,600 | 16,416,736 |
|
| TOTAL MEDIA | | | 48,404,867 |
|
| Multi-Utilities - 25.2% | | | |
| Multi-Utilities - 25.2% | | | |
| Avangrid, Inc. | | 575,261 | 27,911,664 |
| CenterPoint Energy, Inc. | | 869,726 | 23,526,088 |
| Dominion Resources, Inc. | | 324,668 | 24,048,159 |
| Public Service Enterprise Group, Inc. | | 651,870 | 31,570,064 |
| SCANA Corp. | | 36,194 | 1,435,816 |
| Sempra Energy | | 660,227 | 71,951,538 |
| | | | 180,443,329 |
| Oil, Gas & Consumable Fuels - 2.8% | | | |
| Oil & Gas Storage & Transport - 2.8% | | | |
| Cheniere Energy Partners LP Holdings LLC | | 324,342 | 8,721,556 |
| Cheniere Energy, Inc. (a) | | 212,889 | 11,180,930 |
| | | | 19,902,486 |
| TOTAL COMMON STOCKS | | | |
| (Cost $594,893,127) | | | 711,709,499 |
|
| Money Market Funds - 0.5% | | | |
| Fidelity Cash Central Fund, 1.41% (b) | | | |
| (Cost $3,683,834) | | 3,683,097 | 3,683,834 |
| TOTAL INVESTMENT IN SECURITIES - 99.8% | | | |
| (Cost $598,576,961) | | | 715,393,333 |
| NET OTHER ASSETS (LIABILITIES) - 0.2% | | | 1,585,881 |
| NET ASSETS - 100% | | | $716,979,214 |
Legend
(a) Non-income producing
(b) Affiliated fund that is generally available only to investment companies and other accounts managed by Fidelity Investments. The rate quoted is the annualized seven-day yield of the fund at period end. A complete unaudited listing of the fund's holdings as of its most recent quarter end is available upon request. In addition, each Fidelity Central Fund's financial statements, which are not covered by the Fund's Report of Independent Registered Public Accounting Firm, are available on the SEC's website or upon request.
Affiliated Central Funds
Information regarding fiscal year to date income earned by the Fund from investments in Fidelity Central Funds is as follows:
| Fund | Income earned |
| Fidelity Cash Central Fund | $188,824 |
| Fidelity Securities Lending Cash Central Fund | 10,552 |
| Total | $199,376 |
Amounts in the income column in the above table include any capital gain distributions from underlying funds, which are presented in the corresponding line-item in the Statement of Operations if applicable.
Investment Valuation
All investments are categorized as Level 1 under the Fair Value Hierarchy. The inputs or methodology used for valuing securities may not be an indication of the risk associated with investing in those securities. For more information on valuation inputs please refer to the Investment Valuation section in the accompanying Notes to Financial Statements.
See accompanying notes which are an integral part of the financial statements.
Financial Statements
Statement of Assets and Liabilities
| | | February 28, 2018 |
| Assets | | |
Investment in securities, at value — See accompanying schedule:
Unaffiliated issuers (cost $594,893,127) | $711,709,499 | |
| Fidelity Central Funds (cost $3,683,834) | 3,683,834 | |
| Total Investment in Securities (cost $598,576,961) | | $715,393,333 |
| Receivable for investments sold | | 13,455,842 |
| Receivable for fund shares sold | | 410,892 |
| Dividends receivable | | 2,586,792 |
| Distributions receivable from Fidelity Central Funds | | 6,863 |
| Prepaid expenses | | 2,360 |
| Other receivables | | 36,443 |
| Total assets | | 731,892,525 |
| Liabilities | | |
| Payable for investments purchased | $13,703,615 | |
| Payable for fund shares redeemed | 698,433 | |
| Accrued management fee | 325,333 | |
| Other affiliated payables | 132,270 | |
| Other payables and accrued expenses | 53,660 | |
| Total liabilities | | 14,913,311 |
| Net Assets | | $716,979,214 |
| Net Assets consist of: | | |
| Paid in capital | | $602,587,101 |
| Undistributed net investment income | | 1,233,166 |
| Accumulated undistributed net realized gain (loss) on investments and foreign currency transactions | | (3,657,425) |
| Net unrealized appreciation (depreciation) on investments | | 116,816,372 |
| Net Assets, for 9,341,146 shares outstanding | | $716,979,214 |
| Net Asset Value, offering price and redemption price per share ($716,979,214 ÷ 9,341,146 shares) | | $76.75 |
See accompanying notes which are an integral part of the financial statements.
Statement of Operations
| | | Year ended February 28, 2018 |
| Investment Income | | |
| Dividends | | $20,198,236 |
| Income from Fidelity Central Funds | | 199,376 |
| Total income | | 20,397,612 |
| Expenses | | |
| Management fee | $3,989,674 | |
| Transfer agent fees | 1,354,246 | |
| Accounting and security lending fees | 260,050 | |
| Custodian fees and expenses | 5,830 | |
| Independent trustees' fees and expenses | 15,867 | |
| Registration fees | 46,927 | |
| Audit | 45,210 | |
| Legal | 10,518 | |
| Miscellaneous | 33,532 | |
| Total expenses before reductions | 5,761,854 | |
| Expense reductions | (78,944) | 5,682,910 |
| Net investment income (loss) | | 14,714,702 |
| Realized and Unrealized Gain (Loss) | | |
| Net realized gain (loss) on: | | |
| Investment securities: | | |
| Unaffiliated issuers | 36,445,123 | |
| Fidelity Central Funds | 139 | |
| Foreign currency transactions | 7,900 | |
| Total net realized gain (loss) | | 36,453,162 |
| Change in net unrealized appreciation (depreciation) on investment securities | | (21,215,157) |
| Net gain (loss) | | 15,238,005 |
| Net increase (decrease) in net assets resulting from operations | | $29,952,707 |
See accompanying notes which are an integral part of the financial statements.
Statement of Changes in Net Assets
| | Year ended February 28, 2018 | Year ended February 28, 2017 |
| Increase (Decrease) in Net Assets | | |
| Operations | | |
| Net investment income (loss) | $14,714,702 | $18,373,129 |
| Net realized gain (loss) | 36,453,162 | 31,127,434 |
| Change in net unrealized appreciation (depreciation) | (21,215,157) | 75,669,341 |
| Net increase (decrease) in net assets resulting from operations | 29,952,707 | 125,169,904 |
| Distributions to shareholders from net investment income | (12,115,593) | (17,560,259) |
| Distributions to shareholders from net realized gain | (29,852,182) | (256,435) |
| Total distributions | (41,967,775) | (17,816,694) |
| Share transactions | | |
| Proceeds from sales of shares | 273,622,475 | 384,948,279 |
| Reinvestment of distributions | 39,960,296 | 17,007,314 |
| Cost of shares redeemed | (280,726,603) | (621,442,544) |
| Net increase (decrease) in net assets resulting from share transactions | 32,856,168 | (219,486,951) |
| Redemption fees | 79 | 36,967 |
| Total increase (decrease) in net assets | 20,841,179 | (112,096,774) |
| Net Assets | | |
| Beginning of period | 696,138,035 | 808,234,809 |
| End of period | $716,979,214 | $696,138,035 |
| Other Information | | |
| Undistributed net investment income end of period | $1,233,166 | $– |
| Distributions in excess of net investment income end of period | $– | $(684) |
| Shares | | |
| Sold | 3,316,107 | 5,289,786 |
| Issued in reinvestment of distributions | 481,973 | 247,779 |
| Redeemed | (3,492,131) | (8,587,083) |
| Net increase (decrease) | 305,949 | (3,049,518) |
See accompanying notes which are an integral part of the financial statements.
Financial Highlights
Utilities Portfolio
| | | | | | |
| Years ended February 28, | 2018 | 2017 | 2016A | 2015 | 2014 |
| Selected Per–Share Data | | | | | |
| Net asset value, beginning of period | $77.05 | $66.88 | $72.85 | $70.64 | $61.04 |
| Income from Investment Operations | | | | | |
| Net investment income (loss)B | 1.62 | 1.52 | 1.39 | 1.41 | 1.49 |
| Net realized and unrealized gain (loss) | 2.56 | 10.44 | (4.49) | 6.40 | 9.80 |
| Total from investment operations | 4.18 | 11.96 | (3.10) | 7.81 | 11.29 |
| Distributions from net investment income | (1.29) | (1.77) | (1.60) | (1.20) | (1.07) |
| Distributions from net realized gain | (3.19) | (.02) | (1.27) | (4.42) | (.62) |
| Total distributions | (4.48) | (1.79) | (2.87) | (5.61)C | (1.69) |
| Redemption fees added to paid in capitalB | –D | –D | –D | .01 | –D |
| Net asset value, end of period | $76.75 | $77.05 | $66.88 | $72.85 | $70.64 |
| Total ReturnE | 4.99% | 18.21% | (4.19)% | 11.22% | 18.71% |
| Ratios to Average Net AssetsF,G | | | | | |
| Expenses before reductions | .78% | .79% | .80% | .80% | .82% |
| Expenses net of fee waivers, if any | .78% | .79% | .79% | .80% | .82% |
| Expenses net of all reductions | .77% | .78% | .78% | .80% | .80% |
| Net investment income (loss) | 2.00% | 2.09% | 2.05% | 1.89% | 2.28% |
| Supplemental Data | | | | | |
| Net assets, end of period (000 omitted) | $716,979 | $696,138 | $808,235 | $988,426 | $695,932 |
| Portfolio turnover rateH | 66% | 70%I | 74% | 129%I | 160% |
A For the year ended February 29.
B Calculated based on average shares outstanding during the period.
C Total distributions of $5.61 per share is comprised of distributions from net investment income of $1.199 and distributions from net realized gain of $4.415 per share.
D Amount represents less than $.005 per share.
E Total returns would have been lower if certain expenses had not been reduced during the applicable periods shown.
F Fees and expenses of any underlying Fidelity Central Funds are not included in the Fund's expense ratio. The Fund indirectly bears its proportionate share of the expenses of any underlying Fidelity Central Fund.
G Expense ratios reflect operating expenses of the Fund. Expenses before reductions do not reflect amounts reimbursed by the investment adviser or reductions from brokerage service arrangements or reductions from other expense offset arrangements and do not represent the amount paid by the Fund during periods when reimbursements or reductions occur. Expenses net of fee waivers reflect expenses after reimbursement by the investment adviser but prior to reductions from brokerage service arrangements or other expense offset arrangements. Expenses net of all reductions represent the net expenses paid by the Fund.
H Amount does not include the portfolio activity of any underlying Fidelity Central Funds.
I Portfolio turnover rate excludes securities received or delivered in-kind.
See accompanying notes which are an integral part of the financial statements.
Notes to Financial Statements
For the period ended February 28, 2018
1. Organization.
Utilities Portfolio (the Fund) is a non-diversified fund of Fidelity Select Portfolios (the Trust) and is authorized to issue an unlimited number of shares. Share transactions on the Statement of Changes in Net Assets may contain exchanges between affiliated funds. The Trust is registered under the Investment Company Act of 1940, as amended (the 1940 Act), as an open-end management investment company organized as a Massachusetts business trust. The Fund invests primarily in securities of companies whose principal business activities fall within specific industries.
2. Investments in Fidelity Central Funds.
The Fund invests in Fidelity Central Funds, which are open-end investment companies generally available only to other investment companies and accounts managed by the investment adviser and its affiliates. The Fund's Schedule of Investments lists each of the Fidelity Central Funds held as of period end, if any, as an investment of the Fund, but does not include the underlying holdings of each Fidelity Central Fund. As an Investing Fund, the Fund indirectly bears its proportionate share of the expenses of the underlying Fidelity Central Funds.
The Money Market Central Funds seek preservation of capital and current income and are managed by Fidelity Investments Money Management, Inc. (FIMM), an affiliate of the investment adviser. Annualized expenses of the Money Market Central Funds as of their most recent shareholder report date are less than .005%.
A complete unaudited list of holdings for each Fidelity Central Fund is available upon request or at the Securities and Exchange Commission (the SEC) website at www.sec.gov. In addition, the financial statements of the Fidelity Central Funds, which are not covered by the Fund's Report of Independent Registered Public Accounting Firm, are available on the SEC website or upon request.
3. Significant Accounting Policies.
The Fund is an investment company and applies the accounting and reporting guidance of the Financial Accounting Standards Board (FASB) Accounting Standards Codification Topic 946 Financial Services – Investments Companies. The financial statements have been prepared in conformity with accounting principles generally accepted in the United States of America (GAAP), which require management to make certain estimates and assumptions at the date of the financial statements. Actual results could differ from those estimates. Subsequent events, if any, through the date that the financial statements were issued have been evaluated in the preparation of the financial statements. The following summarizes the significant accounting policies of the Fund:
Investment Valuation. Investments are valued as of 4:00 p.m. Eastern time on the last calendar day of the period. The Board of Trustees (the Board) has delegated the day to day responsibility for the valuation of the Fund's investments to the Fair Value Committee (the Committee) established by the Fund's investment adviser. In accordance with valuation policies and procedures approved by the Board, the Fund attempts to obtain prices from one or more third party pricing vendors or brokers to value its investments. When current market prices, quotations or currency exchange rates are not readily available or reliable, investments will be fair valued in good faith by the Committee, in accordance with procedures adopted by the Board. Factors used in determining fair value vary by investment type and may include market or investment specific events. The frequency with which these procedures are used cannot be predicted and they may be utilized to a significant extent. The Committee oversees the Fund's valuation policies and procedures and reports to the Board on the Committee's activities and fair value determinations. The Board monitors the appropriateness of the procedures used in valuing the Fund's investments and ratifies the fair value determinations of the Committee.
The Fund categorizes the inputs to valuation techniques used to value its investments into a disclosure hierarchy consisting of three levels as shown below:
- Level 1 – quoted prices in active markets for identical investments
- Level 2 – other significant observable inputs (including quoted prices for similar investments, interest rates, prepayment speeds, etc.)
- Level 3– unobservable inputs (including the Fund's own assumptions based on the best information available)
Valuation techniques used to value the Fund's investments by major category are as follows:
Equity securities, including restricted securities, for which market quotations are readily available, are valued at the last reported sale price or official closing price as reported by a third party pricing vendor on the primary market or exchange on which they are traded and are categorized as Level 1 in the hierarchy. In the event there were no sales during the day or closing prices are not available, securities are valued at the last quoted bid price or may be valued using the last available price and are generally categorized as Level 2 in the hierarchy. For foreign equity securities, when market or security specific events arise, comparisons to the valuation of American Depositary Receipts (ADRs), futures contracts, Exchange-Traded Funds (ETFs)and certain indexes as well as quoted prices for similar securities may be used and would be categorized as Level 2 in the hierarchy. Utilizing these techniques may result in transfers between Level 1 and Level 2. For equity securities, including restricted securities, where observable inputs are limited, assumptions about market activity and risk are used and these securities may be categorized as Level 3 in the hierarchy.
Investments in open-end mutual funds, including the Fidelity Central Funds, are valued at their closing net asset value (NAV) each business day and are categorized as Level 1 in the hierarchy.
Changes in valuation techniques may result in transfers in or out of an assigned level within the disclosure hierarchy.
Foreign Currency. The Fund may use foreign currency contracts to facilitate transactions in foreign-denominated securities. Gains and losses from these transactions may arise from changes in the value of the foreign currency or if the counterparties do not perform under the contracts' terms.
Foreign-denominated assets, including investment securities, and liabilities are translated into U.S. dollars at the exchange rates at period end. Purchases and sales of investment securities, income and dividends received and expenses denominated in foreign currencies are translated into U.S. dollars at the exchange rate in effect on the transaction date.
The effects of exchange rate fluctuations on investments are included with the net realized and unrealized gain (loss) on investment securities. Other foreign currency transactions resulting in realized and unrealized gain (loss) are disclosed separately.
Investment Transactions and Income. For financial reporting purposes, the Fund's investment holdings and NAV include trades executed through the end of the last business day of the period. The NAV per share for processing shareholder transactions is calculated as of the close of business of the New York Stock Exchange (NYSE), normally 4:00 p.m. Eastern time and includes trades executed through the end of the prior business day. Gains and losses on securities sold are determined on the basis of identified cost and includes proceeds received from litigation. Dividend income is recorded on the ex-dividend date, except for certain dividends from foreign securities where the ex-dividend date may have passed, which are recorded as soon as the Fund is informed of the ex-dividend date. Non-cash dividends included in dividend income, if any, are recorded at the fair market value of the securities received. Income and capital gain distributions from Fidelity Central Funds, if any, are recorded on the ex-dividend date. Certain distributions received by the Fund represent a return of capital or capital gain. The Fund determines the components of these distributions subsequent to the ex-dividend date, based upon receipt of tax filings or other correspondence relating to the underlying investment. These distributions are recorded as a reduction of cost of investments and/or as a realized gain. Investment income is recorded net of foreign taxes withheld where recovery of such taxes is uncertain.
Expenses. Expenses directly attributable to a fund are charged to that fund. Expenses attributable to more than one fund are allocated among the respective funds on the basis of relative net assets or other appropriate methods. Expense estimates are accrued in the period to which they relate and adjustments are made when actual amounts are known.
Income Tax Information and Distributions to Shareholders. Each year, the Fund intends to qualify as a regulated investment company under Subchapter M of the Internal Revenue Code, including distributing substantially all of its taxable income and realized gains. As a result, no provision for U.S. Federal income taxes is required. As of February 28, 2018, the Fund did not have any unrecognized tax benefits in the financial statements; nor is the Fund aware of any tax positions for which it is reasonably possible that the total amounts of unrecognized tax benefits will significantly change in the next twelve months. The Fund files a U.S. federal tax return, in addition to state and local tax returns as required. The Fund's federal income tax returns are subject to examination by the Internal Revenue Service (IRS) for a period of three fiscal years after they are filed. State and local tax returns may be subject to examination for an additional fiscal year depending on the jurisdiction. Foreign taxes are provided for based on the Fund's understanding of the tax rules and rates that exist in the foreign markets in which it invests.
Distributions are declared and recorded on the ex-dividend date. Income and capital gain distributions are determined in accordance with income tax regulations, which may differ from GAAP. In addition, certain Funds claimed a portion of the payment made to redeeming shareholders as a distribution for income tax purposes.
Capital accounts within the financial statements are adjusted for permanent book-tax differences. These adjustments have no impact on net assets or the results of operations. Capital accounts are not adjusted for temporary book-tax differences which will reverse in a subsequent period.
Book-tax differences are primarily due to foreign currency transactions, deferred trustee compensation, capital loss carryforwards and losses deferred due to wash sales.
As of period end, the cost and unrealized appreciation (depreciation) in securities, and derivatives if applicable, for federal income tax purposes were as follows:
| Gross unrealized appreciation | $123,712,915 |
| Gross unrealized depreciation | (12,825,128) |
| Net unrealized appreciation (depreciation) | $110,887,787 |
| Tax Cost | $604,505,546 |
The tax-based components of distributable earnings as of period end were as follows:
| Undistributed ordinary income | $1,233,165 |
| Undistributed long-term capital gain | $2,271,160 |
| Net unrealized appreciation (depreciation) on securities and other investments | $110,887,787 |
The tax character of distributions paid was as follows:
| | February 28, 2018 | February 28, 2017 |
| Ordinary Income | $12,115,593 | $ 17,816,694 |
| Long-term Capital Gains | 29,852,182 | – |
| Total | $41,967,775 | $ 17,816,694 |
4. Purchases and Sales of Investments.
Purchases and sales of securities other than short-term securities, aggregated $487,442,477 and $474,440,461, respectively.
5. Fees and Other Transactions with Affiliates.
Management Fee. Fidelity SelectCo, LLC (the investment adviser) and its affiliates provide the Fund with investment management related services for which the Fund pays a monthly management fee. The management fee is the sum of an individual fund fee rate that is based on an annual rate of .30% of the Fund's average net assets and an annualized group fee rate that averaged .24% during the period. The group fee rate is based upon the average net assets of all the mutual funds advised by Fidelity Management & Research Company (FMR) and the investment adviser. The group fee rate decreases as assets under management increase and increases as assets under management decrease. For the reporting period, the total annual management fee rate was .54% of the Fund's average net assets.
Transfer Agent Fees. Fidelity Investments Institutional Operations Company, Inc. (FIIOC), an affiliate of the investment adviser, is the Fund's transfer, dividend disbursing and shareholder servicing agent. FIIOC receives account fees and asset-based fees that vary according to account size and type of account. FIIOC pays for typesetting, printing and mailing of shareholder reports, except proxy statements. For the period, the transfer agent fees were equivalent to an annual rate of .18% of average net assets.
Accounting and Security Lending Fees. Fidelity Service Company, Inc. (FSC), an affiliate of the investment adviser, maintains the Fund's accounting records. The accounting fee is based on the level of average net assets for each month. Under a separate contract, FSC administers the security lending program. The security lending fee is based on the number and duration of lending transactions.
Brokerage Commissions. The Fund placed a portion of its portfolio transactions with brokerage firms which are affiliates of the investment adviser. Brokerage commissions are included in net realized gain (loss) and change in net unrealized appreciation (depreciation) in the Statement of Operations. The commissions paid to these affiliated firms were $12,835 for the period.
Interfund Trades. The Fund may purchase from or sell securities to other Fidelity Funds under procedures adopted by the Board. The procedures have been designed to ensure these interfund trades are executed in accordance with Rule 17a-7 of the 1940 Act. Interfund trades are included within the respective purchases and sales amounts shown in the Purchases and Sales of Investments note.
Prior Fiscal Year Redemptions In-Kind. During the prior period, 950,668 shares of the Fund held by an affiliated entity were redeemed in-kind for investments and cash with a value of $68,267,475. The Fund had a net realized gain of $14,595,449 on investments delivered through in-kind redemptions. The amount of in-kind redemptions is included in share transactions in the accompanying Statement of Changes in Net Assets. The Fund recognized no gain or loss for federal income tax purposes.
6. Committed Line of Credit.
The Fund participates with other funds managed by the investment adviser or an affiliate in a $4.25 billion credit facility (the "line of credit") to be utilized for temporary or emergency purposes to fund shareholder redemptions or for other short-term liquidity purposes. The Fund has agreed to pay commitment fees on its pro-rata portion of the line of credit, which amounted to $2,209 and is reflected in Miscellaneous expenses on the Statement of Operations. During the period, the Fund did not borrow on this line of credit.
7. Security Lending.
The Fund lends portfolio securities through a lending agent from time to time in order to earn additional income. On the settlement date of the loan, the Fund receives collateral (in the form of U.S. Treasury obligations, letters of credit and/or cash) against the loaned securities and maintains collateral in an amount not less than 100% of the market value of the loaned securities during the period of the loan. The market value of the loaned securities is determined at the close of business of the Fund and any additional required collateral is delivered to the Fund on the next business day. The Fund or borrower may terminate the loan at any time, and if the borrower defaults on its obligation to return the securities loaned because of insolvency or other reasons, the Fund may apply collateral received from the borrower against the obligation. The Fund may experience delays and costs in recovering the securities loaned. Any cash collateral received is invested in the Fidelity Securities Lending Cash Central Fund. At period end, there were no security loans outstanding. Security lending income represents the income earned on investing cash collateral, less rebates paid to borrowers and any lending agent fees associated with the loan, plus any premium payments received for lending certain types of securities. Security lending income is presented in the Statement of Operations as a component of income from Fidelity Central Funds. Total security lending income during the period amounted to $10,552.
8. Expense Reductions.
Commissions paid to certain brokers with whom the investment adviser, or its affiliates, places trades on behalf of the Fund include an amount in addition to trade execution, which may be rebated back to the Fund to offset certain expenses. This amount totaled $71,921 for the period.
In addition, during the period the investment adviser reimbursed and/or waived a portion of operating expenses in the amount of $7,023.
9. Other.
The Fund's organizational documents provide former and current trustees and officers with a limited indemnification against liabilities arising in connection with the performance of their duties to the Fund. In the normal course of business, the Fund may also enter into contracts that provide general indemnifications. The Fund's maximum exposure under these arrangements is unknown as this would be dependent on future claims that may be made against the Fund. The risk of material loss from such claims is considered remote.
Report of Independent Registered Public Accounting Firm
To the Trustees of Fidelity Select Portfolios and Shareholders of Utilities Portfolio:
Opinion on the Financial Statements
We have audited the accompanying statement of assets and liabilities, including the schedule of investments, of Utilities Portfolio (one of the funds constituting Fidelity Select Portfolios, referred to hereafter as the "Fund") as of February 28, 2018, the related statement of operations for the year ended February 28, 2018, the statement of changes in net assets for each of the two years in the period ended February 28, 2018, including the related notes, and the financial highlights for each of the five years in the period ended February 28, 2018 (collectively referred to as the “financial statements”). In our opinion, the financial statements present fairly, in all material respects, the financial position of the Fund as of February 28, 2018, the results of its operations for the year then ended, the changes in its net assets for each of the two years in the period ended February 28, 2018 and the financial highlights for each of the five years in the period ended February 28, 2018 in conformity with accounting principles generally accepted in the United States of America.
Basis for Opinion
These financial statements are the responsibility of the Fund’s management. Our responsibility is to express an opinion on the Fund’s financial statements based on our audits. We are a public accounting firm registered with the Public Company Accounting Oversight Board (United States) (“PCAOB”) and are required to be independent with respect to the Fund in accordance with the U.S. federal securities laws and the applicable rules and regulations of the Securities and Exchange Commission and the PCAOB.
We conducted our audits of these financial statements in accordance with the standards of the PCAOB. Those standards require that we plan and perform the audit to obtain reasonable assurance about whether the financial statements are free of material misstatement, whether due to error or fraud.
Our audits included performing procedures to assess the risks of material misstatement of the financial statements, whether due to error or fraud, and performing procedures that respond to those risks. Such procedures included examining, on a test basis, evidence regarding the amounts and disclosures in the financial statements. Our audits also included evaluating the accounting principles used and significant estimates made by management, as well as evaluating the overall presentation of the financial statements. Our procedures included confirmation of securities owned as of February 28, 2018 by correspondence with the custodian and brokers; when replies were not received from brokers, we performed other auditing procedures. We believe that our audits provide a reasonable basis for our opinion.
PricewaterhouseCoopers LLP
Boston, Massachusetts
April 13, 2018
We have served as the auditor of one or more investment companies in the Fidelity group of funds since 1932.
Trustees and Officers
The Trustees, Members of the Advisory Board (if any), and officers of the trust and fund, as applicable, are listed below. The Board of Trustees governs the fund and is responsible for protecting the interests of shareholders. The Trustees are experienced executives who meet periodically throughout the year to oversee the fund's activities, review contractual arrangements with companies that provide services to the fund, oversee management of the risks associated with such activities and contractual arrangements, and review the fund's performance. Except for Mr. Michael E. Wiley each of the Trustees oversees 281 funds. Mr. Wiley oversees 193 funds.
The Trustees hold office without limit in time except that (a) any Trustee may resign; (b) any Trustee may be removed by written instrument, signed by at least two-thirds of the number of Trustees prior to such removal; (c) any Trustee who requests to be retired or who has become incapacitated by illness or injury may be retired by written instrument signed by a majority of the other Trustees; and (d) any Trustee may be removed at any special meeting of shareholders by a two-thirds vote of the outstanding voting securities of the trust. Each Trustee who is not an interested person (as defined in the 1940 Act) of the trust and the fund is referred to herein as an Independent Trustee. Each Independent Trustee shall retire not later than the last day of the calendar year in which his or her 75th birthday occurs. The Independent Trustees may waive this mandatory retirement age policy with respect to individual Trustees. Officers and Advisory Board Members hold office without limit in time, except that any officer or Advisory Board Member may resign or may be removed by a vote of a majority of the Trustees at any regular meeting or any special meeting of the Trustees. Except as indicated, each individual has held the office shown or other offices in the same company for the past five years.
The fund’s Statement of Additional Information (SAI) includes more information about the Trustees. To request a free copy, call Fidelity at 1-800-544-8544.
Experience, Skills, Attributes, and Qualifications of the Trustees. The Governance and Nominating Committee has adopted a statement of policy that describes the experience, qualifications, attributes, and skills that are necessary and desirable for potential Independent Trustee candidates (Statement of Policy). The Board believes that each Trustee satisfied at the time he or she was initially elected or appointed a Trustee, and continues to satisfy, the standards contemplated by the Statement of Policy. The Governance and Nominating Committee also engages professional search firms to help identify potential Independent Trustee candidates who have the experience, qualifications, attributes, and skills consistent with the Statement of Policy. From time to time, additional criteria based on the composition and skills of the current Independent Trustees, as well as experience or skills that may be appropriate in light of future changes to board composition, business conditions, and regulatory or other developments, have also been considered by the professional search firms and the Governance and Nominating Committee. In addition, the Board takes into account the Trustees' commitment and participation in Board and committee meetings, as well as their leadership of standing and ad hoc committees throughout their tenure.
In determining that a particular Trustee was and continues to be qualified to serve as a Trustee, the Board has considered a variety of criteria, none of which, in isolation, was controlling. The Board believes that, collectively, the Trustees have balanced and diverse experience, qualifications, attributes, and skills, which allow the Board to operate effectively in governing the fund and protecting the interests of shareholders. Information about the specific experience, skills, attributes, and qualifications of each Trustee, which in each case led to the Board's conclusion that the Trustee should serve (or continue to serve) as a trustee of the fund, is provided below.
Board Structure and Oversight Function. James C. Curvey is an interested person and currently serves as Chairman. The Trustees have determined that an interested Chairman is appropriate and benefits shareholders because an interested Chairman has a personal and professional stake in the quality and continuity of services provided to the fund. Independent Trustees exercise their informed business judgment to appoint an individual of their choosing to serve as Chairman, regardless of whether the Trustee happens to be independent or a member of management. The Independent Trustees have determined that they can act independently and effectively without having an Independent Trustee serve as Chairman and that a key structural component for assuring that they are in a position to do so is for the Independent Trustees to constitute a substantial majority for the Board. The Independent Trustees also regularly meet in executive session. Ned C. Lautenbach serves as Chairman of the Independent Trustees and as such (i) acts as a liaison between the Independent Trustees and management with respect to matters important to the Independent Trustees and (ii) with management prepares agendas for Board meetings.
Fidelity® funds are overseen by different Boards of Trustees. The fund's Board oversees Fidelity's high income and certain equity funds, and other Boards oversee Fidelity's investment-grade bond, money market, asset allocation, and other equity funds. The asset allocation funds may invest in Fidelity® funds overseen by the fund's Board. The use of separate Boards, each with its own committee structure, allows the Trustees of each group of Fidelity® funds to focus on the unique issues of the funds they oversee, including common research, investment, and operational issues. On occasion, the separate Boards establish joint committees to address issues of overlapping consequences for the Fidelity® funds overseen by each Board.
The Trustees operate using a system of committees to facilitate the timely and efficient consideration of all matters of importance to the Trustees, the fund, and fund shareholders and to facilitate compliance with legal and regulatory requirements and oversight of the fund's activities and associated risks. The Board, acting through its committees, has charged SelectCo and its affiliates with (i) identifying events or circumstances the occurrence of which could have demonstrably adverse effects on the fund's business and/or reputation; (ii) implementing processes and controls to lessen the possibility that such events or circumstances occur or to mitigate the effects of such events or circumstances if they do occur; and (iii) creating and maintaining a system designed to evaluate continuously business and market conditions in order to facilitate the identification and implementation processes described in (i) and (ii) above. Because the day-to-day operations and activities of the fund are carried out by or through SelectCo, its affiliates, and other service providers, the fund's exposure to risks is mitigated but not eliminated by the processes overseen by the Trustees. While each of the Board's committees has responsibility for overseeing different aspects of the fund's activities, oversight is exercised primarily through the Operations, Audit, and Compliance Committees. In addition, the Independent Trustees have worked with Fidelity to enhance the Board's oversight of investment and financial risks, legal and regulatory risks, technology risks, and operational risks, including the development of additional risk reporting to the Board. Appropriate personnel, including but not limited to the fund's Chief Compliance Officer (CCO), SelectCo's internal auditor, the independent accountants, the fund's Treasurer and portfolio management personnel, make periodic reports to the Board's committees, as appropriate, including an annual review of Fidelity's risk management program for the Fidelity® funds. The responsibilities of each standing committee, including their oversight responsibilities, are described further under "Standing Committees of the Trustees."
Interested Trustees*:
Correspondence intended for a Trustee who is an interested person may be sent to Fidelity Investments, 245 Summer Street, Boston, Massachusetts 02210.
Name, Year of Birth; Principal Occupations and Other Relevant Experience+
James C. Curvey (1935)
Year of Election or Appointment: 2018
Trustee
Chairman of the Board of Trustees
Mr. Curvey also serves as Trustee of other Fidelity® funds. Mr. Curvey is a Director of Fidelity Research & Analysis Co. (investment adviser firm, 2009-present), and Vice Chairman (2007-present) and Director of FMR LLC (diversified financial services company). In addition, Mr. Curvey serves as an Overseer for the Boston Symphony Orchestra and a member of the board of Artis-Naples, Naples, Florida, and as a Trustee for Brewster Academy, Wolfeboro, New Hampshire. Previously, Mr. Curvey served as a Director of Fidelity Investments Money Management, Inc. (investment adviser firm, 2009-2014) and a Director of FMR and FMR Co., Inc. (investment adviser firms, 2007-2014).
Charles S. Morrison (1960)
Year of Election or Appointment: 2018
Trustee
Mr. Morrison also serves as Trustee of other funds. He serves as President of Fidelity SelectCo, LLC (investment adviser firm, 2017-present) and Fidelity Management & Research Company (FMR) (investment adviser firm, 2016-present), a Director of Fidelity Investments Money Management, Inc. (FIMM) (investment adviser firm, 2014-present), Director of Fidelity SelectCo, LLC (investment adviser firm, 2014-present), President, Asset Management (2014-present), and is an employee of Fidelity Investments. Previously, Mr. Morrison served as Vice President of Fidelity's Fixed Income and Asset Allocation Funds (2012-2014), President, Fixed Income (2011-2014), Vice President of Fidelity's Money Market Funds (2005-2009), President, Money Market Group Leader of FMR (investment adviser firm, 2009), and Senior Vice President, Money Market Group of FMR (2004-2009). Mr. Morrison also served as Vice President of Fidelity's Bond Funds (2002-2005), certain Balanced Funds (2002-2005), and certain Asset Allocation Funds (2002-2007), and as Senior Vice President (2002-2005) of Fidelity's Bond Division.
* Determined to be an "Interested Trustee" by virtue of, among other things, his or her affiliation with the trusts or various entities under common control with SelectCo.
+ The information includes the Trustee's principal occupation during the last five years and other information relating to the experience, attributes, and skills relevant to the Trustee's qualifications to serve as a Trustee, which led to the conclusion that the Trustee should serve as a Trustee for the fund.
Independent Trustees:
Correspondence intended for an Independent Trustee may be sent to Fidelity Investments, P.O. Box 55235, Boston, Massachusetts 02205-5235.
Name, Year of Birth; Principal Occupations and Other Relevant Experience+
Dennis J. Dirks (1948)
Year of Election or Appointment: 2018
Trustee
Mr. Dirks also serves as Trustee of other Fidelity® funds. Prior to his retirement in May 2003, Mr. Dirks was Chief Operating Officer and a member of the Board of The Depository Trust & Clearing Corporation (DTCC). He also served as President, Chief Operating Officer, and Board member of The Depository Trust Company (DTC) and President and Board member of the National Securities Clearing Corporation (NSCC). In addition, Mr. Dirks served as Chief Executive Officer and Board member of the Government Securities Clearing Corporation, Chief Executive Officer and Board member of the Mortgage-Backed Securities Clearing Corporation, as a Trustee and a member of the Finance Committee of Manhattan College (2005-2008), as a Trustee and a member of the Finance Committee of AHRC of Nassau County (2006-2008), as a member of the Independent Directors Council (IDC) Governing Council (2010-2015), and as a member of the Board of Directors for The Brookville Center for Children’s Services, Inc. (2009-2017). Mr. Dirks is a member of the Finance Committee (2016-present) and Board of Directors (2017-present) of the Asolo Repertory Theatre.
Donald F. Donahue (1950)
Year of Election or Appointment: 2018
Trustee
Mr. Donahue also serves as a Trustee of other Fidelity® funds. Mr. Donahue is President and Chief Executive Officer of Miranda Partners, LLC (risk consulting for the financial services industry, 2012-present). Previously, Mr. Donahue served as a Member of the Advisory Board of certain Fidelity® funds (2015-2018) and Chief Executive Officer (2006-2012), Chief Operating Officer (2003-2006), and Managing Director, Customer Marketing and Development (1999-2003) of The Depository Trust & Clearing Corporation (financial markets infrastructure). Mr. Donahue serves as a Member (2007-present) and Co-Chairman (2016-present) of the Board of Directors of United Way of New York, Member of the Board of Directors of NYC Leadership Academy (2012-present) and Member of the Board of Advisors of Ripple Labs, Inc. (financial services, 2015-present). He also served as Chairman (2010-2012) and Member of the Board of Directors (2012-2013) of Omgeo, LLC (financial services), Treasurer of United Way of New York (2012-2016), and Member of the Board of Directors of XBRL US (financial services non-profit, 2009-2012) and the International Securities Services Association (2009-2012).
Alan J. Lacy (1953)
Year of Election or Appointment: 2018
Trustee
Mr. Lacy also serves as Trustee of other Fidelity® funds. Mr. Lacy serves as a Director of Bristol-Myers Squibb Company (global pharmaceuticals, 2008-present). He is a Trustee of the California Chapter of The Nature Conservancy (2015-present) and a Director of the Center for Advanced Study in the Behavioral Sciences at Stanford University (2015-present). In addition, Mr. Lacy served as Senior Adviser (2007-2014) of Oak Hill Capital Partners, L.P. (private equity) and also served as Chief Executive Officer (2005) and Vice Chairman (2005-2006) of Sears Holdings Corporation (retail) and Chief Executive Officer and Chairman of the Board of Sears, Roebuck and Co. (retail, 2000-2005). Previously, Mr. Lacy served as Chairman (2014-2017) and a member (2010-2017) of the Board of Directors of Dave & Buster’s Entertainment, Inc. (restaurant and entertainment complexes), as Chairman (2008-2011) and a member (2006-2015) of the Board of Trustees of the National Parks Conservation Association, and as a member of the Board of Directors for The Hillman Companies, Inc. (hardware wholesalers, 2010-2014), Earth Fare, Inc. (retail grocery, 2010-2014), and The Western Union Company (global money transfer, 2006-2011).
Ned C. Lautenbach (1944)
Year of Election or Appointment: 2018
Trustee
Chairman of the Independent Trustees
Mr. Lautenbach also serves as Trustee of other Fidelity® funds. Mr. Lautenbach currently serves as Vice Chair of the Board of Governors, State University System of Florida (2013-present) and is a member of the Council on Foreign Relations (1994-present). He is also a member and has most recently served as Chairman of the Board of Directors of Artis-Naples (2012-present). Previously, Mr. Lautenbach served as a member and then Lead Director of the Board of Directors of Eaton Corporation (diversified industrial, 1997-2016). He was also a Partner and Advisory Partner at Clayton, Dubilier & Rice, LLC (private equity investment, 1998-2010), as well as a Director of Sony Corporation (2006-2007). In addition, Mr. Lautenbach also had a 30-year career with IBM (technology company) during which time he served as Senior Vice President and a member of the Corporate Executive Committee (1968-1998).
Joseph Mauriello (1944)
Year of Election or Appointment: 2018
Trustee
Mr. Mauriello also serves as Trustee of other Fidelity® funds. Prior to his retirement in January 2006, Mr. Mauriello served in numerous senior management positions including Deputy Chairman and Chief Operating Officer (2004-2005), and Vice Chairman of Financial Services (2002-2004) of KPMG LLP US (professional services, 1965-2005). Mr. Mauriello currently serves as a member of the Board of Directors of XL Group plc. (global insurance and re-insurance, 2006-present) and the Independent Directors Council (IDC) Governing Council (2015-present). Previously, Mr. Mauriello served as a Director of the Hamilton Funds of the Bank of New York (2006-2007) and of Arcadia Resources Inc. (health care services and products, 2007-2012).
Cornelia M. Small (1944)
Year of Election or Appointment: 2018
Trustee
Ms. Small also serves as Trustee of other Fidelity® funds. Ms. Small is a member of the Board of Directors (2009-present) and Chair of the Investment Committee (2010-present) of the Teagle Foundation. Ms. Small also serves on the Investment Committee of the Berkshire Taconic Community Foundation (2008-present). Previously, Ms. Small served as Chairperson (2002-2008) and a member of the Investment Committee and Chairperson (2008-2012) and a member of the Board of Trustees of Smith College. In addition, Ms. Small served as Chief Investment Officer, Director of Global Equity Investments, and a member of the Board of Directors of Scudder, Stevens & Clark and Scudder Kemper Investments.
Garnett A. Smith (1947)
Year of Election or Appointment: 2013
Trustee
Mr. Smith also serves as Trustee of other Fidelity® funds. Prior to Mr. Smith's retirement, he served as Chairman and Chief Executive Officer of Inbrand Corp. (manufacturer of personal absorbent products, 1990-1997). He also served as President (1986-1990) of Inbrand Corp. Prior to his employment with Inbrand Corp., he was employed by a retail fabric chain and North Carolina National Bank. In addition, Mr. Smith served as a Member of the Advisory Board of certain Fidelity® funds (2012-2013) and as a board member of the Jackson Hole Land Trust (2009-2012).
David M. Thomas (1949)
Year of Election or Appointment: 2018
Trustee
Mr. Thomas also serves as Trustee of other Fidelity® funds. Mr. Thomas serves as Non-Executive Chairman of the Board of Directors of Fortune Brands Home and Security (home and security products, 2011-present), as a member of the Board of Directors (2004-present) and Presiding Director (2013-present) of Interpublic Group of Companies, Inc. (marketing communication), and as a member of the Board of Trustees of the University of Florida (2013-present). Previously, Mr. Thomas served as Executive Chairman (2005-2006) and Chairman and Chief Executive Officer (2000-2005) of IMS Health, Inc. (pharmaceutical and healthcare information solutions), and a Director of Fortune Brands, Inc. (consumer products, 2000-2011).
Michael E. Wiley (1950)
Year of Election or Appointment: 2008
Trustee
Mr. Wiley also serves as Trustee or Member of the Advisory Board of other Fidelity® funds. Mr. Wiley serves as a Director of Andeavor Corporation (independent oil refiner and marketer, 2005-present), a Director of Andeavor Logistics LP (natural resources logistics, 2015-present), and a Director of Bill Barrett Corporation (exploration and production, 2005-present). In addition, Mr. Wiley also serves as a Director of Post Oak Bank (privately-held bank, 2004-present). Previously, Mr. Wiley served as a Trustee of other Fidelity® funds (2008-2013), as a Director of Asia Pacific Exploration Consolidated (international oil and gas exploration and production, 2008-2013), as a member of the Board of Trustees of the University of Tulsa (2000-2006; 2007-2010), as a Senior Energy Advisor of Katzenbach Partners, LLC (consulting, 2006-2007), as an Advisory Director of Riverstone Holdings (private investment), Chairman, President, and CEO of Baker Hughes, Inc. (oilfield services, 2000-2004), and as Director of Spinnaker Exploration Company (exploration and production, 2001-2005).
+ The information includes the Trustee's principal occupation during the last five years and other information relating to the experience, attributes, and skills relevant to the Trustee's qualifications to serve as a Trustee, which led to the conclusion that the Trustee should serve as a Trustee for the fund.
Advisory Board Members and Officers:
Correspondence intended for a Member of the Advisory Board (if any) may be sent to Fidelity Investments, P.O. Box 55235, Boston, Massachusetts 02205-5235. Correspondence intended for an officer or Peter S. Lynch may be sent to Fidelity Investments, 245 Summer Street, Boston, Massachusetts 02210. Officers appear below in alphabetical order.
Name, Year of Birth; Principal Occupation
Peter S. Lynch (1944)
Year of Election or Appointment: 2018
Member of the Advisory Board
Mr. Lynch also serves as Member of the Advisory Board of other Fidelity® funds. Mr. Lynch is Vice Chairman and a Director of FMR (investment adviser firm) and FMR Co., Inc. (investment adviser firm). In addition, Mr. Lynch serves as a Trustee of Boston College and as the Chairman of the Inner-City Scholarship Fund. Previously, Mr. Lynch served on the Special Olympics International Board of Directors (1997-2006).
William S. Stavropoulos (1939)
Year of Election or Appointment: 2018
Member of the Advisory Board
Mr. Stavropoulos also serves as Member of the Advisory Board of other Fidelity® funds. Mr. Stavropoulos serves as President and Founder of the Michigan Baseball Foundation, the Great Lakes Loons (2007-present). Mr. Stavropoulos is Chairman Emeritus of the Board of Directors of The Dow Chemical Company, where he previously served in numerous senior management positions, including President, CEO (1995-2000; 2002-2004), Chairman of the Executive Committee (2000-2006), and as a member of the Board of Directors (1990-2006). Currently, Mr. Stavropoulos is Chairman of the Board of Directors of Univar Inc. (global distributor of commodity and specialty chemicals), a Director of Teradata Corporation (data warehousing and technology solutions), and a member of the Advisory Board for Metalmark Capital LLC (private equity investment, 2005-present). Mr. Stavropoulos is an operating advisor to Clayton, Dubilier & Rice, LLC (private equity investment). In addition, Mr. Stavropoulos is a member of the University of Notre Dame Advisory Council for the College of Science, a Trustee of the Rollin L. Gerstacker Foundation, and a Director of Artis-Naples in Naples, Florida. Previously, Mr. Stavropoulos served as Trustee of certain Fidelity® funds (2001-2018) and as a Director of Chemical Financial Corporation (bank holding company, 1993-2012) and Tyco International, Ltd. (multinational manufacturing and services, 2007-2012).
Carol B. Tomé (1957)
Year of Election or Appointment: 2017
Member of the Advisory Board
Ms. Tomé also serves as Member of the Advisory Board of other Fidelity® funds. Ms. Tomé is Chief Financial Officer (2001-present) and Executive Vice President of Corporate Services (2007-present) of The Home Depot, Inc. (home improvement retailer) and a Director (2003-present) and Chair of the Audit Committee (2004-present) of United Parcel Service, Inc. (package delivery and supply chain management). Previously, Ms. Tomé served as Trustee of certain Fidelity® funds (2017), Senior Vice President of Finance and Accounting/Treasurer (2000-2007) and Vice President and Treasurer (1995-2000) of The Home Depot, Inc. and Chair of the Board (2010-2012), Vice Chair of the Board (2009 and 2013), and a Director (2008-2013) of the Federal Reserve Bank of Atlanta. Ms. Tomé is also a director or trustee of many community and professional organizations.
Elizabeth Paige Baumann (1968)
Year of Election or Appointment: 2017
Anti-Money Laundering (AML) Officer
Ms. Baumann also serves as AML Officer of other funds. She is Chief AML Officer (2012-present) and Senior Vice President (2014-present) of FMR LLC (diversified financial services company) and is an employee of Fidelity Investments. Previously, Ms. Baumann served as AML Officer of the funds (2012-2016), and Vice President (2007-2014) and Deputy Anti-Money Laundering Officer (2007-2012) of FMR LLC.
Marc R. Bryant (1966)
Year of Election or Appointment: 2013
Secretary and Chief Legal Officer (CLO)
Mr. Bryant also serves as Secretary and CLO of other funds. Mr. Bryant serves as CLO, Secretary, and Senior Vice President of Fidelity Management & Research Company (investment adviser firm, 2015-present) and FMR Co., Inc. (investment adviser firm, 2015-present); Secretary of Fidelity SelectCo, LLC (investment adviser firm, 2015-present) and Fidelity Investments Money Management, Inc. (investment adviser firm, 2015-present); and CLO of Fidelity Management & Research (Hong Kong) Limited and FMR Investment Management (UK) Limited (investment adviser firms, 2015-present) and Fidelity Management & Research (Japan) Limited (investment adviser firm, 2016-present). He is Senior Vice President and Deputy General Counsel of FMR LLC (diversified financial services company). Previously, Mr. Bryant served as Secretary and CLO of Fidelity Rutland Square Trust II (2010-2014) and Assistant Secretary of Fidelity's Fixed Income and Asset Allocation Funds (2013-2015). Prior to joining Fidelity Investments, Mr. Bryant served as a Senior Vice President and the Head of Global Retail Legal for AllianceBernstein L.P. (2006-2010), and as the General Counsel for ProFund Advisors LLC (2001-2006).
William C. Coffey (1969)
Year of Election or Appointment: 2009
Assistant Secretary
Mr. Coffey also serves as Assistant Secretary of other funds. He is Senior Vice President and Deputy General Counsel of FMR LLC (diversified financial services company, 2010-present), and is an employee of Fidelity Investments. Previously, Mr. Coffey served as Vice President and Associate General Counsel of FMR LLC (2005-2009).
Jonathan Davis (1968)
Year of Election or Appointment: 2010
Assistant Treasurer
Mr. Davis also serves as Assistant Treasurer of other funds. Mr. Davis serves as Assistant Treasurer of FMR Capital, Inc. (2017-present) and is an employee of Fidelity Investments. Previously, Mr. Davis served as Vice President and Associate General Counsel of FMR LLC (diversified financial services company, 2003-2010).
Adrien E. Deberghes (1967)
Year of Election or Appointment: 2018
Assistant Treasurer
Mr. Deberghes also serves as an officer of other funds. He serves as Assistant Treasurer of FMR Capital, Inc. (2017-present), Executive Vice President of Fidelity Investments Money Management, Inc. (FIMM) (investment adviser firm, 2016-present), and is an employee of Fidelity Investments (2008-present). Previously, Mr. Deberghes served as President and Treasurer of certain Fidelity® funds (2013-2018). Prior to joining Fidelity Investments, Mr. Deberghes was Senior Vice President of Mutual Fund Administration at State Street Corporation (2007-2008), Senior Director of Mutual Fund Administration at Investors Bank & Trust (2005-2007), and Director of Finance for Dunkin' Brands (2000-2005). Previously, Mr. Deberghes served in other fund officer roles.
Joseph DeSantis (1959)
Year of Election or Appointment: 2015
Vice President
Mr. DeSantis also serves as Vice President of other funds. Mr. DeSantis serves as a Director of Fidelity Management & Research (Japan) Limited (investment adviser firm, 2016-present), Chief Investment Officer, Equities (2010-present) and is an employee of Fidelity Investments.
Stephanie J. Dorsey (1969)
Year of Election or Appointment: 2010
Assistant Treasurer
Ms. Dorsey also serves as an officer of other funds. Ms. Dorsey serves as Assistant Treasurer of FMR Capital, Inc. (2017-present), is an employee of Fidelity Investments (2008-present), and has served in other fund officer roles. Prior to joining Fidelity Investments, Ms. Dorsey served as Treasurer (2004-2008) of the JPMorgan Mutual Funds and Vice President (2004-2008) of JPMorgan Chase Bank.
Howard J. Galligan III (1966)
Year of Election or Appointment: 2014
Chief Financial Officer
Mr. Galligan also serves as Chief Financial Officer of other funds. Mr. Galligan serves as President of Fidelity Pricing and Cash Management Services (FPCMS) (2014-present) and as a Director of Strategic Advisers LLC (investment adviser firm, 2008-present). Previously, Mr. Galligan served as Chief Administrative Officer of Asset Management (2011-2014) and Chief Operating Officer and Senior Vice President of Investment Support for Strategic Advisers, Inc. (2003-2011).
Brian B. Hogan (1964)
Year of Election or Appointment: 2009
Vice President
Mr. Hogan also serves as Trustee or Vice President of other funds. Mr. Hogan serves as Head of Fidelity Investments’ Investment Solutions and Innovation organization (2018-present), and as a Director of FMR Investment Management (UK) Limited (investment adviser firm, 2015-present) and Fidelity SelectCo, LLC (investment adviser firm, 2014-present). Previously, Mr. Hogan served as Trustee of certain Fidelity® funds (2014-2018), President of the Equity Division of FMR (investment adviser firm, 2009-2018), Senior Vice President, Equity Research of FMR (2006-2009), and as a portfolio manager. Mr. Brian B. Hogan is not related to Mr. Colm A. Hogan.
Colm A. Hogan (1973)
Year of Election or Appointment: 2018
Deputy Treasurer
Mr. Hogan also serves as an officer of other funds. Mr. Hogan serves as Assistant Treasurer of FMR Capital, Inc. (2017-present) and is an employee of Fidelity Investments (2005-present). Previously, Mr. Hogan served as Assistant Treasurer of certain Fidelity® funds (2016-2018). Mr. Colm A. Hogan is not related to Mr. Brian B. Hogan.
Chris Maher (1972)
Year of Election or Appointment: 2013
Assistant Treasurer
Mr. Maher serves as Assistant Treasurer of other funds. Mr. Maher is Vice President of Valuation Oversight, serves as Assistant Treasurer of FMR Capital, Inc. (2017-present), and is an employee of Fidelity Investments. Previously, Mr. Maher served as Vice President of Asset Management Compliance (2013), Vice President of the Program Management Group of FMR (investment adviser firm, 2010-2013), and Vice President of Valuation Oversight (2008-2010).
Rieco E. Mello (1969)
Year of Election or Appointment: 2017
Assistant Treasurer
Mr. Mello also serves as Assistant Treasurer of other funds. Mr. Mello serves as Assistant Treasurer of FMR Capital, Inc. (2017-present) and is an employee of Fidelity Investments (1995-present).
Kenneth B. Robins (1969)
Year of Election or Appointment: 2018
Chief Compliance Officer
Mr. Robins also serves as an officer of other funds. Mr. Robins serves as Compliance Officer of Fidelity Management & Research Company and FMR Co., Inc. (investment adviser firms, 2016-present) and is an employee of Fidelity Investments (2004-present). Previously, Mr. Robins served as Executive Vice President of Fidelity Investments Money Management, Inc. (investment adviser firm, 2013-2016) and served in other fund officer roles.
Stacie M. Smith (1974)
Year of Election or Appointment: 2018
President and Treasurer
Ms. Smith also serves as an officer of other funds. Ms. Smith serves as Assistant Treasurer of FMR Capital, Inc. (2017-present), is an employee of Fidelity Investments (2009-present), and has served in other fund officer roles. Prior to joining Fidelity Investments, Ms. Smith served as Senior Audit Manager of Ernst & Young LLP (accounting firm, 1996-2009). Previously, Ms. Smith served as Assistant Treasurer (2013-2018) and Deputy Treasurer (2013-2016) of certain Fidelity® funds.
Marc L. Spector (1972)
Year of Election or Appointment: 2017
Assistant Treasurer
Mr. Spector also serves as an officer of other funds. Mr. Spector serves as Assistant Treasurer of FMR Capital, Inc. (2017-present) and is an employee of Fidelity Investments (2016-present). Prior to joining Fidelity Investments, Mr. Spector served as Director at the Siegfried Group (accounting firm, 2013-2016), and prior to Siegfried Group as audit senior manager at Deloitte & Touche (accounting firm, 2005-2013).
Renee Stagnone (1975)
Year of Election or Appointment: 2016
Assistant Treasurer
Ms. Stagnone also serves as an officer of other funds. Ms. Stagnone serves as Assistant Treasurer of FMR Capital, Inc. (2017-present) and is an employee of Fidelity Investments (1997-present). Previously, Ms. Stagnone served as Deputy Treasurer of certain Fidelity® funds (2013-2016).
Shareholder Expense Example
As a shareholder of a Fund, you incur two types of costs: (1) transaction costs, and (2) ongoing costs, including management fees and other Fund expenses. This Example is intended to help you understand your ongoing costs (in dollars) of investing in the Funds and to compare these costs with the ongoing costs of investing in other mutual funds.
The Example is based on an investment of $1,000 invested at the beginning of the period and held for the entire period (September 1, 2017 to February 28, 2018).
Actual Expenses
The first line of the accompanying table provides information about actual account values and actual expenses. You may use the information in this line, together with the amount you invested, to estimate the expenses that you paid over the period. Simply divide your account value by $1,000.00 (for example, an $8,600 account value divided by $1,000.00 = 8.6), then multiply the result by the number in the first line under the heading entitled "Expenses Paid During Period" to estimate the expenses you paid on your account during this period. A small balance maintenance fee of $12.00 that is charged once a year may apply for certain accounts with a value of less than $2,000. This fee is not included in the table below. If it was, the estimate of expenses you paid during the period would be higher, and your ending account value lower, by this amount. In addition, the Fund, as a shareholder in the underlying Fidelity Central Funds, will indirectly bear its pro-rata share of the fees and expenses incurred by the underlying Fidelity Central Funds. These fees and expenses are not included in the Fund's annualized expense ratio used to calculate the expense estimate in the table below.
Hypothetical Example for Comparison Purposes
The second line of the accompanying table provides information about hypothetical account values and hypothetical expenses based on the Fund's actual expense ratio and an assumed rate of return of 5% per year before expenses, which is not the Fund's actual return. The hypothetical account values and expenses may not be used to estimate the actual ending account balance or expenses you paid for the period. You may use this information to compare the ongoing costs of investing in the Fund and other funds. To do so, compare this 5% hypothetical example with the 5% hypothetical examples that appear in the shareholder reports of the other funds. A small balance maintenance fee of $12.00 that is charged once a year may apply for certain accounts with a value of less than $2,000. This fee is not included in the table below. If it was, the estimate of expenses you paid during the period would be higher, and your ending account value lower, by this amount. In addition, the Fund, as a shareholder in the underlying Fidelity Central Funds, will indirectly bear its pro-rata share of the fees and expenses incurred by the underlying Fidelity Central Funds. These fees and expenses are not included in the Fund's annualized expense ratio used to calculate the expense estimate in the table below.
Please note that the expenses shown in the table are meant to highlight your ongoing costs only and do not reflect any transaction costs. Therefore, the second line of the table is useful in comparing ongoing costs only, and will not help you determine the relative total costs of owning different funds. In addition, if these transactional costs were included, your costs would have been higher.
| | Annualized Expense Ratio-A | Beginning
Account Value
September 1, 2017 | Ending
Account Value
February 28, 2018 | Expenses Paid
During Period-B
September 1, 2017
to February 28, 2018 |
| Actual | .78% | $1,000.00 | $948.30 | $3.77 |
| Hypothetical-C | | $1,000.00 | $1,020.93 | $3.91 |
A Annualized expense ratio reflects expenses net of applicable fee waivers.
B Expenses are equal to the Fund's annualized expense ratio, multiplied by the average account value over the period, multiplied by 181/365 (to reflect the one-half year period).
C 5% return per year before expenses
Distributions (Unaudited)
The Board of Trustees of Utilities Portfolio voted to pay on April 9, 2018, to shareholders of record at the opening of business on April 6, 2018, a distribution of $0.243 per share derived from capital gains realized from sales of portfolio securities and a dividend of $0.131 per share from net investment income.
The fund hereby designates as a capital gain dividend with respect to the taxable year ended February 28, 2018, $34,652,334, or, if subsequently determined to be different, the net capital gain of such year.
The fund designates 100% of the dividend distributed during the fiscal year as qualifying for the dividends–received deduction for corporate shareholders.
The fund designates 100% of the dividend distributed in during the fiscal year as amounts which may be taken into account as a dividend for the purposes of the maximum rate under section 1(h)(11) of the Internal Revenue Code.
The fund will notify shareholders in January 2019 of amounts for use in preparing 2018 income tax returns.
Board Approval of Investment Advisory Contracts and Management Fees
Utilities Portfolio
Each year, the Board of Trustees, including the Independent Trustees (together, the Board), votes on the renewal of the management contract with Fidelity SelectCo, LLC (SelectCo), an affiliate of Fidelity Management & Research Company (FMR), and the sub-advisory agreements with affiliates of FMR (together, the Advisory Contracts) for the fund. SelectCo and the sub-advisers are collectively referred to herein as the Investment Advisers. The Board, assisted by the advice of fund counsel and Independent Trustees' counsel, requests and considers a broad range of information relevant to the renewal of the Advisory Contracts throughout the year.
The Board meets regularly and, at each of its meetings, covers an extensive agenda of topics and materials and considers factors that are relevant to its annual consideration of the renewal of the fund's Advisory Contracts, including the services and support provided to the fund and its shareholders. The Board has established four standing committees (Committees) — Operations, Audit, Fair Valuation, and Governance and Nominating — each composed of and chaired by Independent Trustees with varying backgrounds, to which the Board has assigned specific subject matter responsibilities in order to enhance effective decision-making by the Board. The Operations Committee, of which all of the Independent Trustees are members, meets regularly throughout the year and considers, among other matters, information specifically related to the annual consideration of the renewal of the fund's Advisory Contracts. The Board, acting directly and through its Committees, requests and receives information concerning the annual consideration of the renewal of the fund's Advisory Contracts. The Board also meets as needed to review matters specifically related to the Board's annual consideration of the renewal of the Advisory Contracts. Members of the Board may also meet with trustees of other Fidelity funds through ad hoc joint committees to discuss certain matters relevant to all of the Fidelity funds.
At its January 2018 meeting, the Board unanimously determined to renew the fund's Advisory Contracts. In reaching its determination, the Board considered all factors it believed relevant, including (i) the nature, extent, and quality of the services to be provided to the fund and its shareholders (including the investment performance of the fund); (ii) the competitiveness of the fund's management fee and total expense ratio relative to peer funds; (iii) the total costs of the services to be provided by and the profits to be realized by Fidelity from its relationships with the fund; and (iv) the extent to which, if any, economies of scale exist and would be realized as the fund grows, and whether any economies of scale are appropriately shared with fund shareholders.
In considering whether to renew the Advisory Contracts for the fund, the Board reached a determination, with the assistance of fund counsel and Independent Trustees' counsel and through the exercise of its business judgment, that the renewal of the Advisory Contracts was in the best interests of the fund and its shareholders and that the compensation payable under the Advisory Contracts was fair and reasonable. The Board's decision to renew the Advisory Contracts was not based on any single factor, but rather was based on a comprehensive consideration of all the information provided to the Board at its meetings throughout the year. The Board, in reaching its determination to renew the Advisory Contracts, was aware that shareholders of the fund have a broad range of investment choices available to them, including a wide choice among funds offered by Fidelity's competitors, and that the fund's shareholders, who have the opportunity to review and weigh the disclosure provided by the fund in its prospectus and other public disclosures, have chosen to invest in this fund, which is part of the Fidelity family of funds.
Amendment to Group Fee Rate. The Board also ratified an amendment to the management contract for the fund to add an additional breakpoint to the group fee schedule, which was effective October 1, 2017. The Board noted that the additional breakpoint would result in lower management fee rates to the extent that assets under management that are included in group fee calculations increase above the new breakpoint.
Nature, Extent, and Quality of Services Provided. The Board considered the staffing of the Investment Advisers as it relates to the fund, including the backgrounds of investment personnel of SelectCo, and also considered the fund's investment objective, strategies, and related investment philosophy. The Independent Trustees also had discussions with senior management of Fidelity's investment operations and investment groups. The Board considered the structure of the investment personnel compensation program and whether this structure provides appropriate incentives to act in the best interests of the fund. Additionally, the Board considered the portfolio managers' investments, if any, in the funds that they manage.
Resources Dedicated to Investment Management and Support Services. The Board reviewed the general qualifications and capabilities of the Investment Advisers' investment staffs, including their size, education, experience, and resources, as well as Fidelity's approach to recruiting, training, managing, and compensating investment personnel. The Board noted that Fidelity has continued to increase the resources devoted to non-U.S. offices, including expansion of Fidelity's global investment organization. The Board also noted that Fidelity's analysts have extensive resources, tools and capabilities that allow them to conduct sophisticated quantitative and fundamental analysis, as well as credit analysis of issuers, counterparties and guarantors. Further, the Board considered that Fidelity's investment professionals have sufficient access to global information and data so as to provide competitive investment results over time, and that those professionals also have access to sophisticated tools that permit them to assess portfolio construction and risk and performance attribution characteristics continuously, as well as to transmit new information and research conclusions rapidly around the world. Additionally, in its deliberations, the Board considered Fidelity's trading, risk management, compliance, and technology and operations capabilities and resources, which are integral parts of the investment management process.
Shareholder and Administrative Services. The Board considered (i) the nature, extent, quality, and cost of advisory, administrative, and shareholder services performed by the Investment Advisers and their affiliates under the Advisory Contracts and under separate agreements covering transfer agency, pricing and bookkeeping, and securities lending services for the fund; (ii) the nature and extent of the supervision of third party service providers, principally custodians, subcustodians, and pricing vendors; and (iii) the resources devoted to, and the record of compliance with, the fund's compliance policies and procedures. The Board also reviewed the allocation of fund brokerage, including allocations to brokers affiliated with the Investment Advisers, the use of brokerage commissions to pay fund expenses, and the use of "soft" commission dollars to pay for research services.
The Board noted that the growth of fund assets over time across the complex allows Fidelity to reinvest in the development of services designed to enhance the value or convenience of the Fidelity funds as investment vehicles. These services include 24-hour access to account information and market information through telephone representatives and over the Internet, investor education materials and asset allocation tools, and the expanded availability of Fidelity Investor Centers.
The Board noted that it and the boards of certain other Fidelity funds had formed an ad hoc Committee on Transfer Agency Fees to review the variety of transfer agency fee structures throughout the industry and Fidelity's competitive positioning with respect to industry participants.
Investment in a Large Fund Family. The Board considered the benefits to shareholders of investing in a Fidelity fund, including the benefits of investing in a fund that is part of a large family of funds offering a variety of investment disciplines and providing a large variety of mutual fund investor services. The Board noted that Fidelity had taken, or had made recommendations that resulted in the Fidelity funds taking, a number of actions over the previous year that benefited particular funds, including: (i) continuing to dedicate additional resources to Fidelity's investment research process, which includes meetings with management of issuers in which the funds invest, and to the support of the senior management team that oversees asset management; (ii) continuing efforts to enhance Fidelity's global research capabilities; (iii) launching new funds and making other enhancements to meet client needs; (iv) launching new share classes of existing funds; (v) eliminating purchase minimums and broadening eligibility requirements for certain lower-priced share classes; (vi) reducing management fees and total expenses for certain growth equity funds and index funds; (vii) lowering expense caps for certain existing funds and classes to reduce expenses borne by shareholders; (viii) eliminating short-term redemption fees for certain funds; (ix) introducing a new pricing structure for certain funds of funds that is expected to reduce overall expenses paid by shareholders; (x) rationalizing product lines and gaining increased efficiencies through proposals for fund mergers and share class consolidations; (xi) continuing to develop, acquire and implement systems and technology to improve services to the funds and shareholders, strengthen information security, and increase efficiency; and (xii) implementing enhancements to further strengthen Fidelity's product line to increase investors' probability of success in achieving their investment goals, including retirement income goals.
Investment Performance. The Board considered whether the fund has operated in accordance with its investment objective, as well as its record of compliance with its investment restrictions and its performance history.
The Board took into account discussions with representatives of SelectCo about fund investment performance that occur at Board meetings throughout the year. In this regard the Board noted that as part of regularly scheduled fund reviews and other reports to the Board on fund performance, the Board considers annualized return information for the fund for different time periods, measured against a securities market index ("benchmark index"). In its evaluation of fund investment performance at meetings throughout the year, the Board gave particular attention to information indicating underperformance of certain Fidelity funds for specific time periods and discussed with the Investment Advisers the reasons for such underperformance.
In addition to reviewing absolute and relative fund performance, the Independent Trustees periodically consider the appropriateness of fund performance metrics in evaluating the results achieved. In general, the Independent Trustees believe that fund performance should be evaluated based on net performance (after fees and expenses) of both the highest performing and lowest performing fund share classes, where applicable, compared to appropriate benchmark indices, over appropriate time periods that may include full market cycles, taking into account relevant factors, including the following: general market conditions; issuer-specific information; and fund cash flows and other factors. Depending on the circumstances, the Independent Trustees may be satisfied with a fund's performance notwithstanding that it lags its benchmark index for certain periods.
The Independent Trustees recognize that shareholders evaluate performance on a net basis over their own holding periods, for which one-, three-, and five-year periods are often used as a proxy. For this reason, the performance information reviewed by the Board also included net cumulative total return information for the fund and an appropriate benchmark index for the most recent one-, three-, and five-year periods ended June 30, 2017.
Based on its review, the Board concluded that the nature, extent, and quality of services provided to the fund under the Advisory Contracts should continue to benefit the shareholders of the fund.
Competitiveness of Management Fee and Total Expense Ratio. The Board considered the fund's management fee and total expense ratio compared to "mapped groups" of competitive funds and classes created for the purpose of facilitating the Trustees' analysis of the competitiveness of management fees and total expenses. Fidelity creates "mapped groups" by combining similar Lipper investment objective categories that have comparable investment mandates. For this purpose, all sector focused equity funds are grouped in the same mapped group. Combining Lipper investment objective categories aids the Board's management fee and total expense ratio comparisons by broadening the competitive group used for comparison.
Management Fee. The Board considered two proprietary management fee comparisons for the 12-month periods ended June 30 shown in basis points (BP) in the chart below. The group of Lipper funds used by the Board for management fee comparisons is referred to below as the "Total Mapped Group." The Total Mapped Group comparison focuses on a fund's standing in terms of gross management fees before expense reimbursements or caps relative to the total universe of funds with comparable investment mandates (
i.e., sector equities), regardless of whether their management fee structures also are comparable. Funds with comparable management fee structures have similar management fee contractual arrangements (
e.g., flat rate charged for advisory services, all-inclusive fee rate,
etc.). "TMG %" represents the percentage of funds in the Total Mapped Group that had management fees that were lower than the fund's. For example, a hypothetical TMG % of 20% would mean that 80% of the funds in the Total Mapped Group had higher, and 20% had lower, management fees than the fund. The fund's actual TMG %s and the number of funds in the Total Mapped Group are in the chart below. The "Asset-Size Peer Group" (ASPG) comparison focuses on a fund's standing relative to a subset of non-Fidelity funds within the Total Mapped Group that are similar in size and management fee structure. For example, if a fund is in the first quartile of the ASPG, the fund's management fee ranks in the least expensive or lowest 25% of funds in the ASPG. The ASPG represents at least 15% of the funds in the Total Mapped Group with comparable asset size and management fee structures, subject to a minimum of 50 funds (or all funds in the Total Mapped Group if fewer than 50). Additional information, such as the ASPG quartile in which the fund's management fee rate ranked, is also included in the chart and considered by the Board.
Utilities Portfolio

The Board noted that the fund's management fee rate ranked below the median of its Total Mapped Group and below the median of its ASPG for the 12-month period ended June 30, 2017.
The Board noted that it and the boards of other Fidelity funds formed an ad hoc Committee on Group Fee, which meets periodically, to conduct an in-depth review of the "group fee" component of the management fee of funds with such management fee structures. The Committee's focus included the mechanics of the group fee, the competitive landscape of group fee structures, Fidelity funds with no group fee component and investment products not included in group fee assets. The Board also considered that, for funds subject to the group fee, FMR agreed to voluntarily waive fees over a specified period of time in amounts designed to account for assets converted from certain funds to certain collective investment trusts.
Based on its review, the Board concluded that the fund's management fee is fair and reasonable in light of the services that the fund receives and the other factors considered.
Total Expense Ratio. In its review of the fund's total expense ratio, the Board considered the fund's management fee rate as well as other fund expenses, such as transfer agent fees, pricing and bookkeeping fees, and custodial, legal, and audit fees. The Board also noted that Fidelity may agree to waive fees and expenses from time to time, and the extent to which, if any, it has done so for the fund. As part of its review, the Board also considered the current and historical total expense ratios of the fund compared to competitive fund median expenses. The fund is compared to those funds and classes in the Total Mapped Group (used by the Board for management fee comparisons) that have a similar sales load structure.
The Board noted that the fund's total expense ratio ranked below the competitive median for the 12-month period ended June 30, 2017.
Fees Charged to Other Fidelity Clients. The Board also considered Fidelity fee structures and other information with respect to clients of Fidelity, such as other funds advised or subadvised by Fidelity, pension plan clients, and other institutional clients with similar mandates. The Board noted that an ad hoc joint committee created by it and the boards of other Fidelity funds periodically reviews and compares Fidelity's institutional investment advisory business with its business of providing services to the Fidelity funds, including the differences in services provided, fees charged, and costs incurred, as well as competition in their respective marketplaces.
Based on its review of total expense ratios and fees charged to other Fidelity clients, the Board concluded that the fund's total expense ratio was reasonable in light of the services that the fund and its shareholders receive and the other factors considered.
Costs of the Services and Profitability. The Board considered the revenues earned and the expenses incurred by Fidelity in conducting the business of developing, marketing, distributing, managing, administering and servicing the fund and servicing the fund's shareholders. The Board also considered the level of Fidelity's profits in respect of all the Fidelity funds.
On an annual basis, Fidelity presents to the Board information about the profitability of its relationships with the fund. Fidelity calculates profitability information for each fund, as well as aggregate profitability information for groups of Fidelity funds and all Fidelity funds, using a series of detailed revenue and cost allocation methodologies which originate with the books and records of Fidelity on which Fidelity's audited financial statements are based. The Audit Committee of the Board reviews any significant changes from the prior year's methodologies.
PricewaterhouseCoopers LLP (PwC), independent registered public accounting firm and auditor to Fidelity and certain Fidelity funds, has been engaged annually by the Board as part of the Board's assessment of the profitability analysis used by Fidelity. PwC's engagement includes the review and assessment of Fidelity's methodologies used in determining the revenues and expenses attributable to Fidelity's mutual fund business, and completion of agreed-upon procedures in respect of the mathematical accuracy of the fund profitability information and its conformity to established allocation methodologies. After considering PwC's reports issued under the engagement and information provided by Fidelity, the Board concluded that while other allocation methods may also be reasonable, Fidelity's profitability methodologies are reasonable in all material respects.
The Board also reviewed Fidelity's non-fund businesses and potential fall-out benefits related to the mutual fund business as well as cases where Fidelity's affiliates may benefit from or be related to the fund's business.
The Board considered the costs of the services provided by and the profits realized by Fidelity in connection with the operation of the fund and was satisfied that the profitability was not excessive.
Economies of Scale. The Board considered whether there have been economies of scale in respect of the management of the Fidelity funds, whether the Fidelity funds (including the fund) have appropriately benefited from any such economies of scale, and whether there is potential for realization of any further economies of scale. The Board considered the extent to which the fund will benefit from economies of scale as assets grow through increased services to the fund, through waivers or reimbursements, or through fee or expense ratio reductions. The Board also noted that a committee (the Economies of Scale Committee) created by it and the boards of other Fidelity funds periodically analyzes whether Fidelity attains economies of scale in respect of the management and servicing of the Fidelity funds, whether the Fidelity funds have appropriately benefited from such economies of scale, and whether there is potential for realization of any further economies of scale.
The Board recognized that the fund's management contract incorporates a "group fee" structure, which provides for lower group fee rates as total group assets increase, and for higher group fee rates as total group assets decrease (with "group assets" defined to include fund assets under SelectCo's management plus assets under FMR's management). SelectCo calculates the group fee rates based on a tiered asset "breakpoint" schedule that varies based on asset class. The Board considered that the group fee is designed to deliver the benefits of economies of scale to fund shareholders when total group assets increase, even if assets of any particular fund are unchanged or have declined, because some portion of Fidelity's costs are attributable to services provided to all Fidelity funds, and all funds benefit if those costs can be allocated among more assets. The Board concluded that, given the group fee structure, fund shareholders will benefit from lower management fees as group assets increase at the fund complex level, regardless of whether Fidelity achieves any such economies of scale.
The Board concluded, taking into account the analysis of the Economies of Scale Committee, that economies of scale, if any, are being appropriately shared between fund shareholders and Fidelity.
Additional Information Requested by the Board. In order to develop fully the factual basis for consideration of the Fidelity funds' advisory contracts, the Board requested and received additional information on certain topics, including: (i) Fidelity's fund profitability methodology, profitability trends for certain funds, and the impact of certain factors on fund profitability results; (ii) portfolio manager changes that have occurred during the past year and the amount of the investment that each portfolio manager has made in the Fidelity fund(s) that he or she manages; (iii) Fidelity's compensation structure for portfolio managers, research analysts, and other key personnel, including its effects on fund profitability; (iv) comparisons to institutional products; (v) the arrangements with and compensation paid to certain fund sub-advisers on behalf of the Fidelity funds; (vi) the impact of proposed changes to contractual expense cap arrangements in place for certain funds; (vii) Fidelity's long-term expectations for its offerings in the workplace investing channel; (viii) the methodology with respect to evaluating competitive fund data and peer group classifications and fee comparisons; (ix) the presentation of certain fund performance information; (x) Fidelity's transfer agent fee, expense, and service structures for different funds and classes, including the increased use of omnibus accounts and lower pricing in the retirement channel; (xi) fluctuations in trading expenses; (xii) explanations regarding the relative total expense ratios of certain funds and classes; and (xiii) Fidelity's expectations regarding the future asset levels of certain funds.
Based on its evaluation of all of the conclusions noted above, and after considering all factors it believed relevant, the Board concluded that the advisory fee structures are fair and reasonable, and that the fund's Advisory Contracts should be renewed.
SELUTL-ANN-0418
1.813626.113
Item 2.
Code of Ethics
As of the end of the period, February 28, 2018, Fidelity Select Portfolios (the trust) has adopted a code of ethics, as defined in Item 2 of Form N-CSR, that applies to its President and Treasurer and its Chief Financial Officer. A copy of the code of ethics is filed as an exhibit to this Form N-CSR.
Item 3.
Audit Committee Financial Expert
The Board of Trustees of the trust has determined that Joseph Mauriello is an audit committee financial expert, as defined in Item 3 of Form N-CSR. Mr. Mauriello is independent for purposes of Item 3 of Form N-CSR.
Item 4.
Principal Accountant Fees and Services
Fees and Services
The following table presents fees billed by PricewaterhouseCoopers LLP (“PwC”) in each of the last two fiscal years for services rendered to Air Transportation Portfolio, Automotive Portfolio, Banking Portfolio, Biotechnology Portfolio, Brokerage and Investment Management Portfolio, Chemicals Portfolio, Communications Equipment Portfolio, Computers Portfolio, Construction and Housing Portfolio, Consumer Discretionary Portfolio, Consumer Finance Portfolio, Consumer Staples Portfolio, Defense and Aerospace Portfolio, Energy Portfolio, Energy Service Portfolio, Environment and Alternative Energy Portfolio, Financial Services Portfolio, Gold Portfolio, Health Care Portfolio, Health Care Services Portfolio, Industrials Portfolio, Insurance Portfolio, IT Services Portfolio, Leisure Portfolio, Materials Portfolio, Medical Technology and Devices Portfolio, Multimedia Portfolio, Natural Gas Portfolio, Natural Resources Portfolio, Pharmaceuticals Portfolio, Retailing Portfolio, Semiconductors Portfolio, Software and IT Services Portfolio, Technology Portfolio, Telecommunications Portfolio, Transportation Portfolio, Utilities Portfolio and Wireless Portfolio (the “Funds”):
Services Billed by PwC
February 28, 2018 FeesA
| | | | |
| Audit Fees | Audit-Related Fees | Tax Fees | All Other Fees |
Air Transportation Portfolio | $33,000 | $3,000 | $2,600 | $1,300 |
Automotive Portfolio | $33,000 | $3,000 | $2,600 | $1,200 |
Banking Portfolio | $32,000 | $3,000 | $2,800 | $1,200 |
Biotechnology Portfolio | $63,000 | $4,300 | $48,200 | $1,800 |
Brokerage and Investment Management Portfolio | $33,000 | $3,000 | $2,800 | $1,300 |
Chemicals Portfolio | $33,000 | $3,000 | $2,800 | $1,200 |
Communications Equipment Portfolio | $33,000 | $3,000 | $2,600 | $1,200 |
Computers Portfolio | $34,000 | $3,000 | $2,600 | $1,300 |
Construction and Housing Portfolio | $33,000 | $2,900 | $2,600 | $1,200 |
Consumer Discretionary Portfolio | $35,000 | $3,000 | $5,100 | $1,200 |
Consumer Finance Portfolio | $34,000 | $3,000 | $3,700 | $1,300 |
Consumer Staples Portfolio | $39,000 | $3,400 | $5,100 | $1,400 |
Defense and Aerospace Portfolio | $33,000 | $3,000 | $2,600 | $1,300 |
Energy Portfolio | $36,000 | $3,100 | $6,400 | $1,300 |
Energy Service Portfolio | $33,000 | $3,000 | $2,800 | $1,300 |
Environment and Alternative Energy Portfolio | $32,000 | $3,000 | $2,600 | $1,200 |
Financial Services Portfolio | $36,000 | $3,000 | $5,300 | $1,300 |
Gold Portfolio | $54,000 | $5,100 | $6,900 | $2,100 |
Health Care Portfolio | $39,000 | $3,300 | $5,100 | $1,400 |
Health Care Services Portfolio | $33,000 | $3,000 | $2,600 | $1,200 |
Industrials Portfolio | $35,000 | $3,000 | $5,100 | $1,200 |
Insurance Portfolio | $33,000 | $3,000 | $2,800 | $1,300 |
IT Services Portfolio | $33,000 | $3,000 | $2,600 | $1,300 |
Leisure Portfolio | $33,000 | $3,000 | $2,800 | $1,300 |
Materials Portfolio | $40,000 | $3,400 | $5,800 | $1,400 |
Medical Technology and Devices Portfolio | $32,000 | $3,000 | $2,600 | $1,200 |
Multimedia Portfolio | $32,000 | $3,000 | $3,300 | $1,200 |
Natural Gas Portfolio | $32,000 | $3,000 | $2,800 | $1,200 |
Natural Resources Portfolio | $32,000 | $2,900 | $4,600 | $1,200 |
Pharmaceuticals Portfolio | $32,000 | $3,000 | $2,600 | $1,200 |
Retailing Portfolio | $33,000 | $3,000 | $2,600 | $1,300 |
Semiconductors Portfolio | $34,000 | $3,000 | $2,600 | $1,300 |
Software and IT Services Portfolio | $32,000 | $2,900 | $2,600 | $1,200 |
Technology Portfolio | $36,000 | $3,300 | $2,600 | $1,400 |
Telecommunications Portfolio | $40,000 | $3,300 | $5,100 | $1,400 |
Transportation Portfolio | $32,000 | $3,000 | $2,600 | $1,200 |
Utilities Portfolio | $35,000 | $3,000 | $5,100 | $1,200 |
Wireless Portfolio | $32,000 | $2,900 | $3,300 | $1,200 |
February 28, 2017 FeesA,B
| | | | |
| Audit Fees | Audit-Related Fees | Tax Fees | All Other Fees |
Air Transportation Portfolio | $33,000 | $3,400 | $2,800 | $1,300 |
Automotive Portfolio | $33,000 | $3,400 | $2,800 | $1,300 |
Banking Portfolio | $33,000 | $3,400 | $3,000 | $1,300 |
Biotechnology Portfolio | $47,000 | $4,800 | $33,300 | $1,800 |
Brokerage and Investment Management Portfolio | $33,000 | $3,400 | $5,000 | $1,300 |
Chemicals Portfolio | $32,000 | $3,400 | $3,800 | $1,200 |
Communications Equipment Portfolio | $33,000 | $3,400 | $2,800 | $1,300 |
Computers Portfolio | $33,000 | $3,500 | $2,800 | $1,300 |
Construction and Housing Portfolio | $32,000 | $3,400 | $2,800 | $1,200 |
Consumer Discretionary Portfolio | $32,000 | $3,400 | $2,800 | $1,200 |
Consumer Finance Portfolio | $34,000 | $3,400 | $3,900 | $1,300 |
Consumer Staples Portfolio | $37,000 | $3,900 | $2,800 | $1,400 |
Defense and Aerospace Portfolio | $33,000 | $3,400 | $2,800 | $1,300 |
Energy Portfolio | $33,000 | $3,500 | $5,800 | $1,300 |
Energy Service Portfolio | $33,000 | $3,500 | $9,700 | $1,300 |
Environment and Alternative Energy Portfolio | $32,000 | $3,400 | $2,800 | $1,200 |
Financial Services Portfolio | $33,000 | $3,500 | $3,200 | $1,300 |
Gold Portfolio | $54,000 | $5,900 | $7,600 | $2,200 |
Health Care Portfolio | $36,000 | $3,800 | $3,000 | $1,400 |
Health Care Services Portfolio | $33,000 | $3,400 | $2,800 | $1,300 |
Industrials Portfolio | $43,000 | $3,400 | $2,800 | $1,200 |
Insurance Portfolio | $33,000 | $3,400 | $3,200 | $1,300 |
IT Services Portfolio | $33,000 | $3,400 | $2,800 | $1,300 |
Leisure Portfolio | $33,000 | $3,400 | $3,200 | $1,300 |
Materials Portfolio | $38,000 | $3,900 | $3,500 | $1,400 |
Medical Technology and Devices Portfolio | $33,000 | $3,400 | $2,800 | $1,300 |
Multimedia Portfolio | $33,000 | $3,400 | $3,500 | $1,300 |
Natural Gas Portfolio | $32,000 | $3,400 | $3,200 | $1,200 |
Natural Resources Portfolio | $32,000 | $3,300 | $6,800 | $1,200 |
Pharmaceuticals Portfolio | $32,000 | $3,400 | $2,800 | $1,200 |
Retailing Portfolio | $33,000 | $3,400 | $2,800 | $1,300 |
Semiconductors Portfolio | $33,000 | $3,400 | $2,800 | $1,300 |
Software and IT Services Portfolio | $32,000 | $3,400 | $2,800 | $1,200 |
Technology Portfolio | $37,000 | $3,800 | $2,800 | $1,400 |
Telecommunications Portfolio | $37,000 | $3,800 | $2,800 | $1,400 |
Transportation Portfolio | $33,000 | $3,400 | $2,800 | $1,300 |
Utilities Portfolio | $33,000 | $3,400 | $5,000 | $1,300 |
Wireless Portfolio | $32,000 | $3,300 | $2,800 | $1,200 |
A Amounts may reflect rounding.
B Certain amounts have been reclassified to align with current period presentation.
The following table presents fees billed by PwC that were required to be approved by the Audit Committee for services that relate directly to the operations and financial reporting of the Funds and that are rendered on behalf of Fidelity SelectCo, LLC (“SelectCo”) and entities controlling, controlled by, or under common control with SelectCo (not including any sub-adviser whose role is primarily portfolio management and is subcontracted with or overseen by another investment adviser) that provide ongoing services to the Funds (“Fund Service Providers”):
Services Billed by PwC
| | |
| February 28, 2018A | February 28, 2017A,B |
Audit-Related Fees | $8,360,000 | $6,065,000 |
Tax Fees | $180,000 | $150,000 |
All Other Fees | $- | $- |
A Amounts may reflect rounding.
B Certain amounts have been reclassified to align with current period presentation.
“Audit-Related Fees” represent fees billed for assurance and related services that are reasonably related to the performance of the fund audit or the review of the fund's financial statements and that are not reported under Audit Fees.
“Tax Fees” represent fees billed for tax compliance, tax advice or tax planning that relate directly to the operations and financial reporting of the fund.
“All Other Fees” represent fees billed for services provided to the fund or Fund Service Provider, a significant portion of which are assurance related, that relate directly to the operations and financial reporting of the fund, excluding those services that are reported under Audit Fees, Audit-Related Fees or Tax Fees.
Assurance services must be performed by an independent public accountant.
* * *
The aggregate non-audit fees billed by PwC for services rendered to the Funds, SelectCo (not including any sub-adviser whose role is primarily portfolio management and is subcontracted with or overseen by another investment adviser), and any Fund Service Provider for each of the last two fiscal years of the Funds are as follows:
| | |
Billed By | February 28, 2018A | February 28, 2017A,B |
PwC | $11,240,000 | $7,865,000 |
A Amounts may reflect rounding.
B Certain amounts have been reclassified to align with current period presentation.
The trust's Audit Committee has considered non-audit services that were not pre-approved that were provided by PwC to Fund Service Providers to be compatible with maintaining the independence of PwC in its audit of the Funds, taking into account representations from PwC, in accordance with Public Company Accounting Oversight Board rules, regarding its independence from the Funds and their related entities and SelectCo’s review of the appropriateness and permissibility under applicable law of such non-audit services prior to their provision to the Fund Service Providers.
Audit Committee Pre-Approval Policies and Procedures
The trust’s Audit Committee must pre-approve all audit and non-audit services provided by a fund’s independent registered public accounting firm relating to the operations or financial reporting of the fund. Prior to the commencement of any audit or non-audit services to a fund, the Audit Committee reviews the services to determine whether they are appropriate and permissible under applicable law.
The Audit Committee has adopted policies and procedures to, among other purposes, provide a framework for the Committee’s consideration of non-audit services by the audit firms that audit the Fidelity funds. The policies and procedures require that any non-audit service provided by a fund audit firm to a Fidelity fund and any non-audit service provided by a fund auditor to a Fund Service Provider that relates directly to the operations and financial reporting of a Fidelity fund (“Covered Service”) are subject to approval by the Audit Committee before such service is provided.
All Covered Services must be approved in advance of provision of the service either: (i) by formal resolution of the Audit Committee, or (ii) by oral or written approval of the service by the Chair of the Audit Committee (or if the Chair is unavailable, such other member of the Audit Committee as may be designated by the Chair to act in the Chair’s absence). The approval contemplated by (ii) above is permitted where the Treasurer determines that action on such an engagement is necessary before the next meeting of the Audit Committee.
Non-audit services provided by a fund audit firm to a Fund Service Provider that do not relate directly to the operations and financial reporting of a Fidelity fund are reported to the Audit Committee periodically.
Non-Audit Services Approved Pursuant to Rule 2-01(c)(7)(i)(C) and (ii) of Regulation S-X (“De Minimis Exception”)
There were no non-audit services approved or required to be approved by the Audit Committee pursuant to the De Minimis Exception during the Funds’ last two fiscal years relating to services provided to (i) the Funds or (ii) any Fund Service Provider that relate directly to the operations and financial reporting of the Funds.
Item 5.
Audit Committee of Listed Registrants
Not applicable.
Item 6.
Investments
(a)
Not applicable.
(b)
Not applicable
Item 7.
Disclosure of Proxy Voting Policies and Procedures for Closed-End Management Investment Companies
Not applicable.
Item 8.
Portfolio Managers of Closed-End Management Investment Companies
Not applicable.
Item 9.
Purchase of Equity Securities by Closed-End Management Investment Company and Affiliated Purchasers
Not applicable.
Item 10.
Submission of Matters to a Vote of Security Holders
There were no material changes to the procedures by which shareholders may recommend nominees to the trust’s Board of Trustees.
Item 11.
Controls and Procedures
(a)(i) The President and Treasurer and the Chief Financial Officer have concluded that the trust’s disclosure controls and procedures (as defined in Rule 30a-3(c) under the Investment Company Act) provide reasonable assurances that material information relating to the trust is made known to them by the appropriate persons, based on their evaluation of these controls and procedures as of a date within 90 days of the filing date of this report.
(a)(ii) There was no change in the trust’s internal control over financial reporting (as defined in Rule 30a-3(d) under the Investment Company Act) that occurred during the second fiscal quarter of the period covered by this report that has materially affected, or is reasonably likely to materially affect, the trust’s internal control over financial reporting.
Item 12.
Exhibits
| | |
(a) | (1) | Code of Ethics pursuant to Item 2 of Form N-CSR is filed and attached hereto as EX-99.CODE ETH. |
(a) | (2) | Certification pursuant to Rule 30a-2(a) under the Investment Company Act of 1940 (17 CFR 270.30a-2(a)) is filed and attached hereto as Exhibit 99.CERT. |
(a) | (3) | Not applicable. |
(b) | | Certification pursuant to Rule 30a-2(b) under the Investment Company Act of 1940 (17 CFR 270.30a-2(b)) is furnished and attached hereto as Exhibit 99.906CERT. |
SIGNATURES
Pursuant to the requirements of the Securities Exchange Act of 1934 and the Investment Company Act of 1940, the registrant has duly caused this report to be signed on its behalf by the undersigned, thereunto duly authorized.
Fidelity Select Portfolios
| |
By: | /s/Stacie M. Smith |
| Stacie M. Smith |
| President and Treasurer |
| |
Date: | April 26, 2018 |
Pursuant to the requirements of the Securities Exchange Act of 1934 and the Investment Company Act of 1940, this report has been signed below by the following persons on behalf of the registrant and in the capacities and on the dates indicated.
| |
By: | /s/Stacie M. Smith |
| Stacie M. Smith |
| President and Treasurer |
| |
Date: | April 26, 2018 |
| |
By: | /s/Howard J. Galligan III |
| Howard J. Galligan III |
| Chief Financial Officer |
| |
Date: | April 26, 2018 |