UNITED STATES
SECURITIES AND EXCHANGE COMMISSION
Washington, D.C. 20549
FORM N-CSR
CERTIFIED SHAREHOLDER REPORT OF REGISTERED
MANAGEMENT INVESTMENT COMPANIES
Investment Company Act file number 811-3114
Fidelity Select Portfolios
(Exact name of registrant as specified in charter)
245 Summer St., Boston, Massachusetts 02210
(Address of principal executive offices) (Zip code)
William C. Coffey, Secretary
245 Summer St.
Boston, Massachusetts 02210
(Name and address of agent for service)
Registrant's telephone number, including area code:
617-563-7000
| |
Date of fiscal year end: | February 28 |
| |
Date of reporting period: | February 28, 2019 |
Item 1.
Reports to Stockholders
Fidelity® Select Portfolios®
Consumer Discretionary Sector Automotive Portfolio
Communication Services Portfolio (formerly Multimedia Portfolio)
Construction and Housing Portfolio
Consumer Discretionary Portfolio
Leisure Portfolio
Retailing Portfolio
Annual Report February 28, 2019 Includes Fidelity and Fidelity Advisor share classes |
 |
Beginning on January 1, 2021, as permitted by regulations adopted by the Securities and Exchange Commission, paper copies of a fund’s shareholder reports will no longer be sent by mail, unless you specifically request paper copies of the reports from the fund or from your financial intermediary, such as a financial advisor, broker-dealer or bank. Instead, the reports will be made available on a website, and you will be notified by mail each time a report is posted and provided with a website link to access the report.
If you already elected to receive shareholder reports electronically, you will not be affected by this change and you need not take any action. You may elect to receive shareholder reports and other communications from a fund electronically, by contacting your financial intermediary. For Fidelity customers, visit Fidelity's web site or call Fidelity using the contact information listed below.
You may elect to receive all future reports in paper free of charge. If you wish to continue receiving paper copies of your shareholder reports, you may contact your financial intermediary or, if you are a Fidelity customer, visit Fidelity’s website, or call Fidelity at the applicable toll-free number listed below. Your election to receive reports in paper will apply to all funds held with the fund complex/your financial intermediary.
| Account Type | Website | Phone Number |
| Brokerage, Mutual Fund, or Annuity Contracts: | fidelity.com/mailpreferences | 1-800-343-3548 |
| Employer Provided Retirement Accounts: | netbenefits.fidelity.com/preferences (choose 'no' under Required Disclosures to continue to print) | 1-800-343-0860 |
| Advisor Sold Accounts Serviced Through Your Financial Intermediary: | Contact Your Financial Intermediary | Your Financial Intermediary's phone number |
| Advisor Sold Accounts Serviced by Fidelity: | institutional.fidelity.com | 1-877-208-0098 |
Contents
To view a fund's proxy voting guidelines and proxy voting record for the 12-month period ended June 30, visit http://www.fidelity.com/proxyvotingresults or visit the Securities and Exchange Commission's (SEC) web site at http://www.sec.gov.
You may also call 1-800-544-8544 if you’re an individual investing directly with Fidelity, call 1-800-835-5092 if you’re a plan sponsor or participant with Fidelity as your recordkeeper or call 1-877-208-0098 on institutional accounts or if you’re an advisor or invest through one to request a free copy of the proxy voting guidelines.
Standard & Poor's, S&P and S&P 500 are registered service marks of The McGraw-Hill Companies, Inc. and have been licensed for use by Fidelity Distributors Corporation.
Other third-party marks appearing herein are the property of their respective owners.
All other marks appearing herein are registered or unregistered trademarks or service marks of FMR LLC or an affiliated company. © 2019 FMR LLC. All rights reserved.
This report and the financial statements contained herein are submitted for the general information of the shareholders of the Funds. This report is not authorized for distribution to prospective investors in the Funds unless preceded or accompanied by an effective prospectus.
A fund files its complete schedule of portfolio holdings with the SEC for the first and third quarters of each fiscal year on Form N-Q. Forms N-Q are available on the SEC’s web site at http://www.sec.gov. A fund's Forms N-Q may be reviewed and copied at the SEC’s Public Reference Room in Washington, DC. Information regarding the operation of the SEC's Public Reference Room may be obtained by calling 1-800-SEC-0330.
For a complete list of a fund's portfolio holdings, view the most recent holdings listing, semiannual report, or annual report on Fidelity's web site at http://www.fidelity.com, http://www.institutional.fidelity.com, or http://www.401k.com, as applicable.
NOT FDIC INSURED •MAY LOSE VALUE •NO BANK GUARANTEE
Neither the Funds nor Fidelity Distributors Corporation is a bank.
Automotive Portfolio
Performance: The Bottom Line
Average annual total return reflects the change in the value of an investment, assuming reinvestment of distributions from dividend income and capital gains (the profits earned upon the sale of securities that have grown in value, if any) and assuming a constant rate of performance each year. The hypothetical investment and the average annual total returns do not reflect the deduction of taxes that a shareholder would pay on fund distributions or the redemption of fund shares. During periods of reimbursement by Fidelity, a fund’s total return will be greater than it would be had the reimbursement not occurred. How a fund did yesterday is no guarantee of how it will do tomorrow.
Average Annual Total Returns
| For the periods ended February 28, 2019 | Past 1 year | Past 5 years | Past 10 years |
| Automotive Portfolio | (4.66)% | 2.77% | 21.93% |
$10,000 Over 10 Years
Let's say hypothetically that $10,000 was invested in Automotive Portfolio on February 28, 2009.
The chart shows how the value of your investment would have changed, and also shows how the S&P 500® Index performed over the same period.
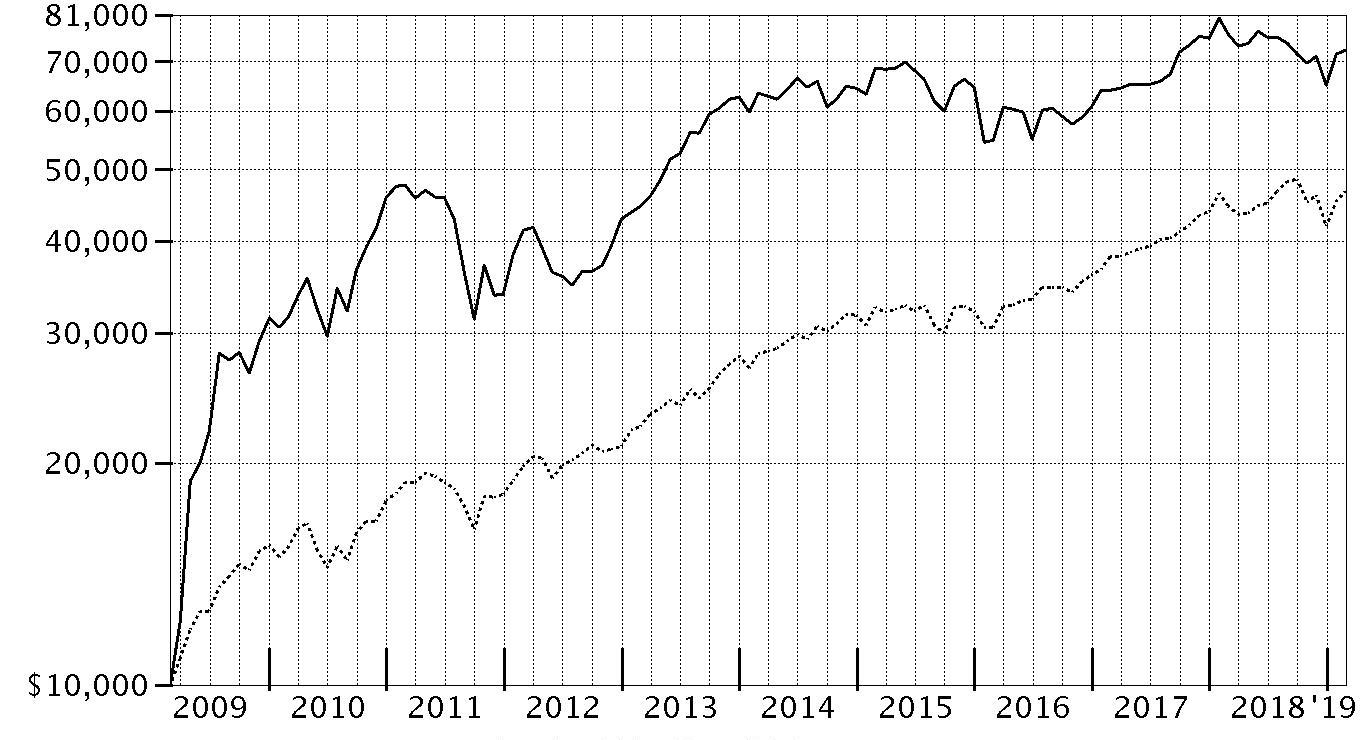
| Period Ending Values |
| $72,656 | Automotive Portfolio |
| $46,739 | S&P 500® Index |
Automotive Portfolio
Management's Discussion of Fund Performance
Market Recap: The S&P 500
® index gained 4.68% for the 12 months ending February 28, 2019, as the U.S. equity bellwether began the new year on a high note after enduring a final quarter of 2018 in which resurgent volatility upset the aging bull market. In October, rising U.S. Treasury yields and concern about peaking corporate earnings growth sent many investors fleeing from risk assets as they were still dealing with lingering uncertainty related to global trade and the U.S. Federal Reserve picking up the pace of interest rate hikes. The index returned -6.84% in October, at the time its largest monthly drop in seven years. But conditions worsened through Christmas, as jitters about the economy and another hike in rates led to a spike in market volatility and a -9.03% result for December. Sharply reversing course to begin 2019, the S&P 500
® gained 11.48% year-to-date, its strongest two-month opening since 1991, amid upbeat company earnings/outlooks and signs the Fed may pause on rates. For the full period, some economically sensitive sectors fared worst, with financials (-6%) and materials (-6%) both losing ground. Energy gained 1%, while communication services and industrials each rose roughly 2%. In contrast, the defensive utilities (+20%), real estate (+20%) and health care (+11%) sectors led the way, while consumer staples finished near the index. Information technology and consumer discretionary were rattled in the late-2018 downturn, but earlier strength contributed to advances of 9% and roughly 7%, respectively.
Comments from Portfolio Manager Elliot Mattingly: For the fiscal year, the fund returned -4.66%, outpacing the -5.87% result of the FactSet Automotive Linked Index, but notably underperforming the broad-based S&P 500
® index. I believe that the global automotive industry is approaching the later stages of the cycle, with a late-2018 market decline and subsequent rally in 2019 resulting in less certainty overall. Against this backdrop, the fund’s outperformance of the FactSet industry index was due to strong security selection, particularly among automobile manufacturers and automotive retailers. Stock picks in the construction machinery & heavy trucks and auto parts & equipment groups aided relative performance to a lesser extent, as did an overweighting in diversified support services. Specifically, the fund’s leading relative contributor was our overweighting in salvage auction company Copart (+24%). It also helped to hold an out-of-index stake in Allison Transmission Holdings (+26%) and an overweighted position in retailer O’Reilly Automotive (+52%). Conversely, investment choices within automotive distributors weighed on the fund’s relative result. In addition, despite good stock picking, underweighting automotive retailers Advance Auto Parts (+42%) and AutoZone (+41%) detracted notably given the broader group’s strong performance. Lastly, an overweighted position in shares of Lear (-17%), a maker of automotive seats and wiring harnesses, also hurt. All of these stocks continued to be held in the fund at period end.
The views expressed above reflect those of the portfolio manager(s) only through the end of the period as stated on the cover of this report and do not necessarily represent the views of Fidelity or any other person in the Fidelity organization. Any such views are subject to change at any time based upon market or other conditions and Fidelity disclaims any responsibility to update such views. These views may not be relied on as investment advice and, because investment decisions for a Fidelity fund are based on numerous factors, may not be relied on as an indication of trading intent on behalf of any Fidelity fund.
Automotive Portfolio
Investment Summary (Unaudited)
Top Ten Stocks as of February 28, 2019
| | % of fund's net assets |
| General Motors Co. | 11.4 |
| Tesla, Inc. | 9.7 |
| Honda Motor Co. Ltd. sponsored ADR | 8.5 |
| Toyota Motor Corp. sponsored ADR | 8.2 |
| O'Reilly Automotive, Inc. | 5.4 |
| Ford Motor Co. | 5.0 |
| Aptiv PLC | 4.7 |
| Magna International, Inc. Class A (sub. vtg.) | 4.5 |
| AutoZone, Inc. | 4.3 |
| Copart, Inc. | 4.2 |
| | 65.9 |
Top Industries (% of fund's net assets)
| As of February 28, 2019 |
| | Automobiles | 51.6% |
| | Auto Components | 20.0% |
| | Specialty Retail | 15.6% |
| | Commercial Services & Supplies | 6.6% |
| | Distributors | 4.1% |
| | All Others* | 2.1% |

* Includes short-term investments and net other assets (liabilities).
Automotive Portfolio
Schedule of Investments February 28, 2019
Showing Percentage of Net Assets
| Common Stocks - 99.5% | | | |
| | | Shares | Value |
| Auto Components - 20.0% | | | |
| Auto Parts & Equipment - 19.6% | | | |
| Adient PLC | | 2,700 | $52,488 |
| Aptiv PLC | | 23,128 | 1,922,168 |
| Autoliv, Inc. | | 5,500 | 449,955 |
| BorgWarner, Inc. | | 25,100 | 1,019,311 |
| Dana Holding Corp. | | 7,500 | 148,125 |
| Delphi Technologies PLC | | 2,452 | 53,478 |
| Gentex Corp. | | 23,300 | 473,922 |
| Lear Corp. | | 10,700 | 1,627,149 |
| Magna International, Inc. Class A (sub. vtg.) | | 34,500 | 1,820,495 |
| Stoneridge, Inc. (a) | | 7,840 | 231,829 |
| Tenneco, Inc. | | 6 | 208 |
| Veoneer, Inc. (a)(b) | | 3,700 | 113,072 |
| Visteon Corp. (a) | | 1,240 | 106,218 |
| | | | 8,018,418 |
| Tires & Rubber - 0.4% | | | |
| The Goodyear Tire & Rubber Co. | | 7,800 | 154,284 |
|
| TOTAL AUTO COMPONENTS | | | 8,172,702 |
|
| Automobiles - 51.2% | | | |
| Automobile Manufacturers - 51.2% | | | |
| Ferrari NV | | 10,100 | 1,295,426 |
| Fiat Chrysler Automobiles NV (b) | | 104,500 | 1,539,285 |
| Ford Motor Co. | | 234,531 | 2,056,837 |
| General Motors Co. | | 118,214 | 4,667,086 |
| Honda Motor Co. Ltd. sponsored ADR | | 123,095 | 3,479,896 |
| NIO, Inc. sponsored ADR (a) | | 47,100 | 449,886 |
| Subaru Corp. | | 4,400 | 112,109 |
| Tesla, Inc. (a) | | 12,391 | 3,963,633 |
| Toyota Motor Corp. sponsored ADR (b) | | 27,517 | 3,330,658 |
| | | | 20,894,816 |
| Commercial Services & Supplies - 6.6% | | | |
| Diversified Support Services - 6.6% | | | |
| Boyd Group Income Fund | | 700 | 64,822 |
| Copart, Inc. (a) | | 29,300 | 1,719,031 |
| KAR Auction Services, Inc. | | 19,380 | 913,767 |
| | | | 2,697,620 |
| Distributors - 4.1% | | | |
| Distributors - 4.1% | | | |
| Genuine Parts Co. | | 8,800 | 957,264 |
| LKQ Corp. (a) | | 26,600 | 736,820 |
| | | | 1,694,084 |
| Electronic Equipment & Components - 0.2% | | | |
| Electronic Manufacturing Services - 0.2% | | | |
| CTS Corp. | | 2,100 | 67,452 |
| Interactive Media & Services - 0.1% | | | |
| Interactive Media & Services - 0.1% | | | |
| CarGurus, Inc. Class A (a) | | 800 | 34,184 |
| Machinery - 1.7% | | | |
| Construction Machinery & Heavy Trucks - 1.7% | | | |
| Allison Transmission Holdings, Inc. | | 13,900 | 690,830 |
| Specialty Retail - 15.6% | | | |
| Automotive Retail - 15.6% | | | |
| Advance Auto Parts, Inc. | | 5,400 | 873,612 |
| AutoNation, Inc. (a) | | 2,100 | 74,046 |
| AutoZone, Inc. (a) | | 1,848 | 1,735,217 |
| CarMax, Inc. (a) | | 13,600 | 844,560 |
| Carvana Co. Class A (a)(b) | | 7,400 | 331,964 |
| Lithia Motors, Inc. Class A (sub. vtg.) | | 3,400 | 306,918 |
| O'Reilly Automotive, Inc. (a) | | 5,877 | 2,186,009 |
| | | | 6,352,326 |
| TOTAL COMMON STOCKS | | | |
| (Cost $30,127,097) | | | 40,604,014 |
|
| Nonconvertible Preferred Stocks - 0.4% | | | |
| Automobiles - 0.4% | | | |
| Automobile Manufacturers - 0.4% | | | |
| Volkswagen AG | | | |
| (Cost $123,020) | | 900 | 154,477 |
|
| Money Market Funds - 4.7% | | | |
| Fidelity Cash Central Fund, 2.44% (c) | | 171,685 | 171,719 |
| Fidelity Securities Lending Cash Central Fund 2.45% (c)(d) | | 1,739,781 | 1,739,956 |
| TOTAL MONEY MARKET FUNDS | | | |
| (Cost $1,911,675) | | | 1,911,675 |
| TOTAL INVESTMENT IN SECURITIES - 104.6% | | | |
| (Cost $32,161,792) | | | 42,670,166 |
| NET OTHER ASSETS (LIABILITIES) - (4.6)% | | | (1,888,965) |
| NET ASSETS - 100% | | | $40,781,201 |
Legend
(a) Non-income producing
(b) Security or a portion of the security is on loan at period end.
(c) Affiliated fund that is generally available only to investment companies and other accounts managed by Fidelity Investments. The rate quoted is the annualized seven-day yield of the fund at period end. A complete unaudited listing of the fund's holdings as of its most recent quarter end is available upon request. In addition, each Fidelity Central Fund's financial statements, which are not covered by the Fund’s Report of Independent Registered Public Accounting Firm, are available on the SEC's website or upon request.
(d) Investment made with cash collateral received from securities on loan.
Affiliated Central Funds
Information regarding fiscal year to date income earned by the Fund from investments in Fidelity Central Funds is as follows:
| Fund | Income earned |
| Fidelity Cash Central Fund | $4,474 |
| Fidelity Securities Lending Cash Central Fund | 50,159 |
| Total | $54,633 |
Amounts in the income column in the above table include any capital gain distributions from underlying funds, which are presented in the corresponding line-item in the Statement of Operations, if applicable.
Investment Valuation
The following is a summary of the inputs used, as of February 28, 2019, involving the Fund's assets and liabilities carried at fair value. The inputs or methodology used for valuing securities may not be an indication of the risk associated with investing in those securities. For more information on valuation inputs, and their aggregation into the levels used below, please refer to the Investment Valuation section in the accompanying Notes to Financial Statements.
| | Valuation Inputs at Reporting Date: |
| Description | Total | Level 1 | Level 2 | Level 3 |
| Investments in Securities: | | | | |
| Common Stocks | $40,604,014 | $40,491,905 | $112,109 | $-- |
| Nonconvertible Preferred Stocks | 154,477 | 154,477 | -- | -- |
| Money Market Funds | 1,911,675 | 1,911,675 | -- | -- |
| Total Investments in Securities: | $42,670,166 | $42,558,057 | $112,109 | $-- |
Other Information
Distribution of investments by country or territory of incorporation, as a percentage of Total Net Assets, is as follows (Unaudited):
| United States of America | 64.9% |
| Japan | 17.0% |
| Netherlands | 7.0% |
| Bailiwick of Jersey | 4.8% |
| Canada | 4.7% |
| Cayman Islands | 1.1% |
| Others (Individually Less Than 1%) | 0.5% |
| | 100.0% |
See accompanying notes which are an integral part of the financial statements.
Automotive Portfolio
Financial Statements
Statement of Assets and Liabilities
| | | February 28, 2019 |
| Assets | | |
Investment in securities, at value (including securities loaned of $1,690,682) — See accompanying schedule:
Unaffiliated issuers (cost $30,250,117) | $40,758,491 | |
| Fidelity Central Funds (cost $1,911,675) | 1,911,675 | |
| Total Investment in Securities (cost $32,161,792) | | $42,670,166 |
| Receivable for investments sold | | 1,098,417 |
| Receivable for fund shares sold | | 44,548 |
| Dividends receivable | | 78,422 |
| Distributions receivable from Fidelity Central Funds | | 1,169 |
| Prepaid expenses | | 468 |
| Other receivables | | 2,582 |
| Total assets | | 43,895,772 |
| Liabilities | | |
| Payable for investments purchased | $969,755 | |
| Payable for fund shares redeemed | 344,083 | |
| Accrued management fee | 18,303 | |
| Other affiliated payables | 9,053 | |
| Other payables and accrued expenses | 33,682 | |
| Collateral on securities loaned | 1,739,695 | |
| Total liabilities | | 3,114,571 |
| Net Assets | | $40,781,201 |
| Net Assets consist of: | | |
| Paid in capital | | $30,351,954 |
| Total distributable earnings (loss) | | 10,429,247 |
| Net Assets, for 1,225,154 shares outstanding | | $40,781,201 |
| Net Asset Value, offering price and redemption price per share ($40,781,201 ÷ 1,225,154 shares) | | $33.29 |
See accompanying notes which are an integral part of the financial statements.
Statement of Operations
| | | Year ended February 28, 2019 |
| Investment Income | | |
| Dividends | | $811,912 |
| Income from Fidelity Central Funds (including $50,159 from security lending) | | 54,633 |
| Total income | | 866,545 |
| Expenses | | |
| Management fee | $232,527 | |
| Transfer agent fees | 99,167 | |
| Accounting and security lending fees | 17,992 | |
| Custodian fees and expenses | 5,650 | |
| Independent trustees' fees and expenses | 250 | |
| Registration fees | 21,803 | |
| Audit | 41,477 | |
| Legal | 312 | |
| Miscellaneous | 1,293 | |
| Total expenses before reductions | 420,471 | |
| Expense reductions | (2,673) | |
| Total expenses after reductions | | 417,798 |
| Net investment income (loss) | | 448,747 |
| Realized and Unrealized Gain (Loss) | | |
| Net realized gain (loss) on: | | |
| Investment securities: | | |
| Unaffiliated issuers | 1,270,550 | |
| Fidelity Central Funds | 516 | |
| Foreign currency transactions | 279 | |
| Total net realized gain (loss) | | 1,271,345 |
| Change in net unrealized appreciation (depreciation) on: | | |
| Investment securities: | | |
| Unaffiliated issuers | (3,853,245) | |
| Assets and liabilities in foreign currencies | (368) | |
| Total change in net unrealized appreciation (depreciation) | | (3,853,613) |
| Net gain (loss) | | (2,582,268) |
| Net increase (decrease) in net assets resulting from operations | | $(2,133,521) |
See accompanying notes which are an integral part of the financial statements.
Statement of Changes in Net Assets
| | Year ended February 28, 2019 | Year ended February 28, 2018 |
| Increase (Decrease) in Net Assets | | |
| Operations | | |
| Net investment income (loss) | $448,747 | $569,500 |
| Net realized gain (loss) | 1,271,345 | 8,846,812 |
| Change in net unrealized appreciation (depreciation) | (3,853,613) | (367,737) |
| Net increase (decrease) in net assets resulting from operations | (2,133,521) | 9,048,575 |
| Distributions to shareholders | (3,068,342) | – |
| Distributions to shareholders from net investment income | – | (298,505) |
| Distributions to shareholders from net realized gain | – | (8,188,561) |
| Total distributions | (3,068,342) | (8,487,066) |
| Share transactions | | |
| Proceeds from sales of shares | 11,884,432 | 34,198,768 |
| Reinvestment of distributions | 2,935,846 | 8,170,537 |
| Cost of shares redeemed | (24,976,652) | (40,862,610) |
| Net increase (decrease) in net assets resulting from share transactions | (10,156,374) | 1,506,695 |
| Redemption fees | – | 2,072 |
| Total increase (decrease) in net assets | (15,358,237) | 2,070,276 |
| Net Assets | | |
| Beginning of period | 56,139,438 | 54,069,162 |
| End of period | $40,781,201 | $56,139,438 |
| Other Information | | |
| Undistributed net investment income end of period | $– | $79,774 |
| Shares | | |
| Sold | 351,778 | 882,784 |
| Issued in reinvestment of distributions | 87,676 | 228,135 |
| Redeemed | (710,478) | (1,084,888) |
| Net increase (decrease) | (271,024) | 26,031 |
See accompanying notes which are an integral part of the financial statements.
Financial Highlights
Automotive Portfolio
| | | | | | |
| Years ended February 28, | 2019 | 2018 | 2017 | 2016 A | 2015 |
| Selected Per–Share Data | | | | | |
| Net asset value, beginning of period | $37.52 | $36.78 | $33.72 | $48.82 | $56.95 |
| Income from Investment Operations | | | | | |
| Net investment income (loss)B | .36 | .39C | .33 | .65 | .42 |
| Net realized and unrealized gain (loss) | (2.15) | 6.11 | 5.22 | (9.37) | 3.05 |
| Total from investment operations | (1.79) | 6.50 | 5.55 | (8.72) | 3.47 |
| Distributions from net investment income | (.38) | (.20) | (.52) | (.45) | (.38) |
| Distributions from net realized gain | (2.06) | (5.56) | (1.98) | (5.93) | (11.22) |
| Total distributions | (2.44) | (5.76) | (2.49)D | (6.38) | (11.60) |
| Redemption fees added to paid in capitalB | – | –E | –E | –E | –E |
| Net asset value, end of period | $33.29 | $37.52 | $36.78 | $33.72 | $48.82 |
| Total ReturnF | (4.66)% | 19.08% | 16.80% | (20.00)% | 8.04% |
| Ratios to Average Net AssetsG,H | | | | | |
| Expenses before reductions | .97% | .97% | .96% | .87% | .85% |
| Expenses net of fee waivers, if any | .97% | .96% | .96% | .87% | .85% |
| Expenses net of all reductions | .97% | .96% | .95% | .86% | .85% |
| Net investment income (loss) | 1.04% | 1.04%C | .92% | 1.49% | .82% |
| Supplemental Data | | | | | |
| Net assets, end of period (000 omitted) | $40,781 | $56,139 | $54,069 | $65,745 | $137,877 |
| Portfolio turnover rateI | 31% | 117% | 83% | 80% | 71% |
A For the year ended February 29.
B Calculated based on average shares outstanding during the period.
C Net investment income per share reflects a large, non-recurring dividend which amounted to $.08 per share. Excluding this non-recurring dividend, the ratio of net investment income (loss) to average net assets would have been .83%.
D Total distributions of $2.49 per share is comprised of distributions from net investment income of $.515 and distributions from net realized gain of $1.975 per share.
E Amount represents less than $.005 per share.
F Total returns would have been lower if certain expenses had not been reduced during the applicable periods shown.
G Fees and expenses of any underlying Fidelity Central Funds are not included in the Fund's expense ratio. The Fund indirectly bears its proportionate share of the expenses of any underlying Fidelity Central Funds.
H Expense ratios reflect operating expenses of the Fund. Expenses before reductions do not reflect amounts reimbursed by the investment adviser or reductions from brokerage service arrangements or reductions from other expense offset arrangements and do not represent the amount paid by the Fund during periods when reimbursements or reductions occur. Expenses net of fee waivers reflect expenses after reimbursement by the investment adviser but prior to reductions from brokerage service arrangements or other expense offset arrangements. Expenses net of all reductions represent the net expenses paid by the Fund.
I Amount does not include the portfolio activity of any underlying Fidelity Central Funds.
See accompanying notes which are an integral part of the financial statements.
Communication Services Portfolio (formerly Multimedia Portfolio)
Performance: The Bottom Line
Average annual total return reflects the change in the value of an investment, assuming reinvestment of distributions from dividend income and capital gains (the profits earned upon the sale of securities that have grown in value, if any) and assuming a constant rate of performance each year. The hypothetical investment and the average annual total returns do not reflect the deduction of taxes that a shareholder would pay on fund distributions or the redemption of fund shares. During periods of reimbursement by Fidelity, a fund’s total return will be greater than it would be had the reimbursement not occurred. How a fund did yesterday is no guarantee of how it will do tomorrow.
Average Annual Total Returns
| For the periods ended February 28, 2019 | Past 1 year | Past 5 years | Past 10 years |
| Class A (incl. 5.75% sales charge) | 1.84% | 5.73% | 20.14% |
| Class M (incl. 3.50% sales charge) | 4.20% | 6.21% | 20.41% |
| Class C (incl. contingent deferred sales charge) | 6.90% | 6.94% | 20.83% |
| Communication Services Portfolio | 8.12% | 7.00% | 20.86% |
| Class I | 8.13% | 7.00% | 20.86% |
| Class Z | 8.15% | 7.00% | 20.86% |
Class C shares' contingent deferred sales charges included in the past one year, past five years and past ten years total return figures are 1%, 0% and 0%, respectively.
The initial offering of Class A, Class M, Class C, Class I and Class Z shares took place on November 30, 2018. Returns prior to November 30, 2018, are those of Communication Services Portfolio, the original class of the fund.
$10,000 Over 10 Years
Let's say hypothetically that $10,000 was invested in Communication Services Portfolio, a class of the fund, on February 28, 2009.
The chart shows how the value of your investment would have changed, and also shows how the S&P 500® Index performed over the same period.
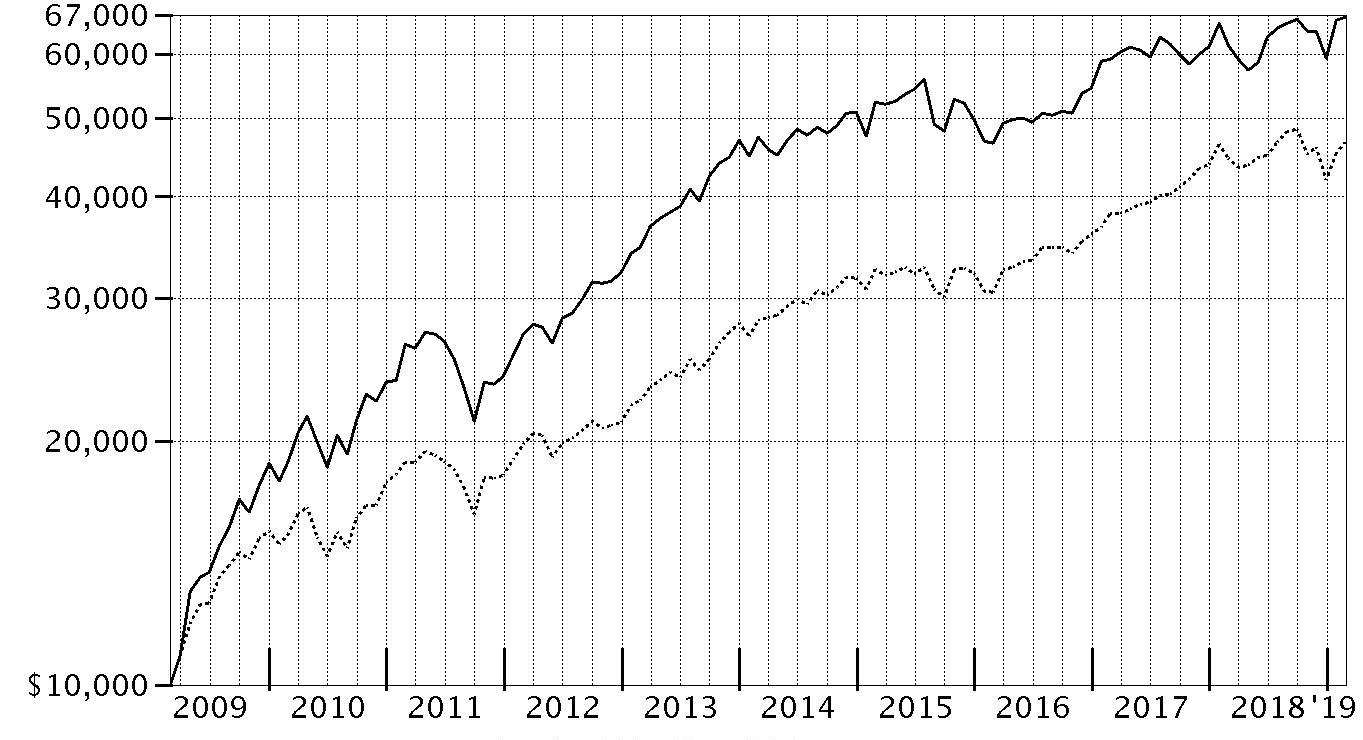
| Period Ending Values |
| $66,494 | Communication Services Portfolio |
| $46,739 | S&P 500® Index |
Communication Services Portfolio
Management's Discussion of Fund Performance
Market Recap: The S&P 500
® index gained 4.68% for the 12 months ending February 28, 2019, as the U.S. equity bellwether began the new year on a high note after enduring a final quarter of 2018 in which resurgent volatility upset the aging bull market. In October, rising U.S. Treasury yields and concern about peaking corporate earnings growth sent many investors fleeing from risk assets as they were still dealing with lingering uncertainty related to global trade and the U.S. Federal Reserve picking up the pace of interest rate hikes. The index returned -6.84% in October, at the time its largest monthly drop in seven years. But conditions worsened through Christmas, as jitters about the economy and another hike in rates led to a spike in market volatility and a -9.03% result for December. Sharply reversing course to begin 2019, the S&P 500
® gained 11.48% year-to-date, its strongest two-month opening since 1991, amid upbeat company earnings/outlooks and signs the Fed may pause on rates. For the full period, some economically sensitive sectors fared worst, with financials (-6%) and materials (-6%) both losing ground. Energy gained 1%, while communication services and industrials each rose roughly 2%. In contrast, the defensive utilities (+20%), real estate (+20%) and health care (+11%) sectors led the way, while consumer staples finished near the index. Information technology and consumer discretionary were rattled in the late-2018 downturn, but earlier strength contributed to advances of 9% and roughly 7%, respectively.
Comments from Portfolio Manager Matthew Drukker: For the year, the fund's share classes returned roughly 8%, trailing the 8.38% result of the sector benchmark, the MSCI U.S. IMI Communication Services 25/50 Index, but outpacing the S&P 500
®. Versus the MSCI index, stock selection and an overweighting in interactive media & services held back the fund's relative result. Within this group, the fund's overweighting in social media platform Facebook detracted versus the sector benchmark, partly due to ongoing data-privacy concerns. An overweighting in shares of video-game developer Activision Blizzard also hurt the relative return. Conversely, underweighting shares of integrated telecommunication services firms added value versus the sector benchmark. Here, avoiding new index component Verizon Communications added value. Elsewhere, stock picking in the cable & satellite industry group contributed on a relative basis, mainly due to timely ownership of U.K.-based Liberty Global.
The views expressed above reflect those of the portfolio manager(s) only through the end of the period as stated on the cover of this report and do not necessarily represent the views of Fidelity or any other person in the Fidelity organization. Any such views are subject to change at any time based upon market or other conditions and Fidelity disclaims any responsibility to update such views. These views may not be relied on as investment advice and, because investment decisions for a Fidelity fund are based on numerous factors, may not be relied on as an indication of trading intent on behalf of any Fidelity fund.
Notes to Shareholders: Aligned with changes to the Global Industry Classification Standard (GICS) structure, on December 1, 2018, the fund's name changed to Select Communication Services Portfolio and its supplemental benchmark changed from the MSCI US IM Media 25/50 Index to the MSCI U.S. IMI Communication Services 25/50 Index. Also on December 1, Matthew Drukker became sole Portfolio Manager of the fund, succeeding Nidhi Gupta.
Communication Services Portfolio
Investment Summary (Unaudited)
Top Ten Stocks as of February 28, 2019
| | % of fund's net assets |
| Alphabet, Inc. Class A | 23.0 |
| Facebook, Inc. Class A | 14.3 |
| Comcast Corp. Class A | 5.1 |
| Netflix, Inc. | 5.0 |
| The Walt Disney Co. | 4.7 |
| Activision Blizzard, Inc. | 4.0 |
| AT&T, Inc. | 3.6 |
| Electronic Arts, Inc. | 3.5 |
| Twenty-First Century Fox, Inc. Class B | 3.5 |
| T-Mobile U.S., Inc. | 3.1 |
| | 69.8 |
Top Industries (% of fund's net assets)
| As of February 28, 2019 |
| | Interactive Media & Services | 41.8% |
| | Entertainment | 24.8% |
| | Media | 16.4% |
| | Diversified Telecommunication Services | 8.0% |
| | Wireless Telecommunication Services | 3.5% |
| | All Others* | 5.5% |

* Includes short-term investments and net other assets (liabilities).
Communication Services Portfolio
Schedule of Investments February 28, 2019
Showing Percentage of Net Assets
| Common Stocks - 97.1% | | | |
| | | Shares | Value |
| Diversified Telecommunication Services - 8.0% | | | |
| Alternative Carriers - 3.2% | | | |
| CenturyLink, Inc. | | 158,700 | $2,093,253 |
| Cogent Communications Group, Inc. | | 57,700 | 2,810,567 |
| Iliad SA | | 19,700 | 2,050,311 |
| Iridium Communications, Inc. (a) | | 233,600 | 4,973,344 |
| ORBCOMM, Inc. (a) | | 174,100 | 1,227,405 |
| Vonage Holdings Corp. (a) | | 274,700 | 2,823,916 |
| Zayo Group Holdings, Inc. (a) | | 82,000 | 2,033,600 |
| | | | 18,012,396 |
| Integrated Telecommunication Services - 4.8% | | | |
| AT&T, Inc. | | 647,100 | 20,137,752 |
| Atn International, Inc. | | 20,800 | 1,167,504 |
| Cincinnati Bell, Inc. (a) | | 129,100 | 1,252,270 |
| Masmovil Ibercom SA (a) | | 220,000 | 4,584,379 |
| | | | 27,141,905 |
|
| TOTAL DIVERSIFIED TELECOMMUNICATION SERVICES | | | 45,154,301 |
|
| Entertainment - 24.8% | | | |
| Interactive Home Entertainment - 9.8% | | | |
| Activision Blizzard, Inc. | | 538,300 | 22,683,962 |
| Electronic Arts, Inc. (a) | | 204,900 | 19,625,322 |
| Take-Two Interactive Software, Inc. (a) | | 92,400 | 8,062,824 |
| Zynga, Inc. (a) | | 970,000 | 5,063,400 |
| | | | 55,435,508 |
| Movies & Entertainment - 15.0% | | | |
| Lions Gate Entertainment Corp. Class B | | 108,334 | 1,591,426 |
| Live Nation Entertainment, Inc. (a) | | 24,700 | 1,397,032 |
| Netflix, Inc. (a) | | 79,100 | 28,325,710 |
| The Walt Disney Co. | | 236,904 | 26,732,247 |
| Twenty-First Century Fox, Inc. Class B | | 386,800 | 19,401,888 |
| World Wrestling Entertainment, Inc. Class A | | 82,800 | 6,930,360 |
| | | | 84,378,663 |
|
| TOTAL ENTERTAINMENT | | | 139,814,171 |
|
| Equity Real Estate Investment Trusts (REITs) - 0.2% | | | |
| Specialized REITs - 0.2% | | | |
| American Tower Corp. | | 7,500 | 1,321,125 |
| Hotels, Restaurants & Leisure - 1.4% | | | |
| Casinos & Gaming - 1.4% | | | |
| Sea Ltd. ADR (a)(b) | | 363,100 | 7,806,650 |
| Interactive Media & Services - 41.8% | | | |
| Interactive Media & Services - 41.8% | | | |
| Alphabet, Inc. Class A (a) | | 115,300 | 129,891,215 |
| Facebook, Inc. Class A (a) | | 502,100 | 81,064,045 |
| Match Group, Inc. (b) | | 39,800 | 2,204,124 |
| Momo, Inc. ADR (a) | | 233,100 | 7,731,927 |
| TripAdvisor, Inc. (a) | | 44,200 | 2,350,114 |
| Twitter, Inc. (a) | | 341,300 | 10,505,214 |
| Zillow Group, Inc. Class A (a) | | 52,800 | 2,187,504 |
| | | | 235,934,143 |
| Internet & Direct Marketing Retail - 1.0% | | | |
| Internet & Direct Marketing Retail - 1.0% | | | |
| Alibaba Group Holding Ltd. sponsored ADR (a) | | 32,300 | 5,911,869 |
| Media - 16.4% | | | |
| Broadcasting - 3.2% | | | |
| CBS Corp. Class B | | 28,438 | 1,427,872 |
| Discovery Communications, Inc. Class C (non-vtg.) (a) | | 221,700 | 6,041,325 |
| Liberty Media Corp.: | | | |
| Liberty Media Class A (a) | | 263,862 | 8,111,118 |
| Liberty SiriusXM Series A (a) | | 54,400 | 2,224,960 |
| | | | 17,805,275 |
| Cable & Satellite - 11.9% | | | |
| Altice U.S.A., Inc. Class A | | 104,500 | 2,279,145 |
| Charter Communications, Inc. Class A (a) | | 18,271 | 6,301,851 |
| Comcast Corp. Class A | | 745,100 | 28,813,017 |
| DISH Network Corp. Class A (a) | | 89,800 | 2,919,398 |
| GCI Liberty, Inc. (a) | | 134,400 | 7,195,776 |
| Liberty Broadband Corp. Class A (a) | | 92,523 | 8,264,154 |
| Liberty Global PLC Class C (a) | | 328,900 | 8,350,771 |
| Liberty Latin America Ltd. Class C (a) | | 119,100 | 2,309,349 |
| Sirius XM Holdings, Inc. (b) | | 101,952 | 604,575 |
| | | | 67,038,036 |
| Publishing - 1.3% | | | |
| The New York Times Co. Class A | | 231,500 | 7,604,775 |
|
| TOTAL MEDIA | | | 92,448,086 |
|
| Wireless Telecommunication Services - 3.5% | | | |
| Wireless Telecommunication Services - 3.5% | | | |
| Boingo Wireless, Inc. (a) | | 98,900 | 2,212,393 |
| T-Mobile U.S., Inc. (a) | | 245,300 | 17,713,113 |
| | | | 19,925,506 |
| TOTAL COMMON STOCKS | | | |
| (Cost $451,542,386) | | | 548,315,851 |
|
| Money Market Funds - 4.9% | | | |
| Fidelity Cash Central Fund, 2.44% (c) | | 17,024,024 | 17,027,429 |
| Fidelity Securities Lending Cash Central Fund 2.45% (c)(d) | | 10,908,703 | 10,909,794 |
| TOTAL MONEY MARKET FUNDS | | | |
| (Cost $27,937,158) | | | 27,937,223 |
| TOTAL INVESTMENT IN SECURITIES - 102.0% | | | |
| (Cost $479,479,544) | | | 576,253,074 |
| NET OTHER ASSETS (LIABILITIES) - (2.0)% | | | (11,272,847) |
| NET ASSETS - 100% | | | $564,980,227 |
Legend
(a) Non-income producing
(b) Security or a portion of the security is on loan at period end.
(c) Affiliated fund that is generally available only to investment companies and other accounts managed by Fidelity Investments. The rate quoted is the annualized seven-day yield of the fund at period end. A complete unaudited listing of the fund's holdings as of its most recent quarter end is available upon request. In addition, each Fidelity Central Fund's financial statements, which are not covered by the Fund's Report of Independent Registered Public Accounting Firm, are available on the SEC's website or upon request.
(d) Investment made with cash collateral received from securities on loan.
Affiliated Central Funds
Information regarding fiscal year to date income earned by the Fund from investments in Fidelity Central Funds is as follows:
| Fund | Income earned |
| Fidelity Cash Central Fund | $107,356 |
| Fidelity Securities Lending Cash Central Fund | 345,399 |
| Total | $452,755 |
Amounts in the income column in the above table include any capital gain distributions from underlying funds, which are presented in the corresponding line-item in the Statement of Operations, if applicable.
Investment Valuation
All investments are categorized as Level 1 under the Fair Value Hierarchy. The inputs or methodology used for valuing securities may not be an indication of the risk associated with investing in those securities. For more information on valuation inputs please refer to the Investment Valuation section in the accompanying Notes to Financial Statements.
See accompanying notes which are an integral part of the financial statements.
Communication Services Portfolio
Financial Statements
Statement of Assets and Liabilities
| | | February 28, 2019 |
| Assets | | |
Investment in securities, at value (including securities loaned of $10,456,138) — See accompanying schedule:
Unaffiliated issuers (cost $451,542,386) | $548,315,851 | |
| Fidelity Central Funds (cost $27,937,158) | 27,937,223 | |
| Total Investment in Securities (cost $479,479,544) | | $576,253,074 |
| Cash | | 22,560 |
| Receivable for fund shares sold | | 290,731 |
| Distributions receivable from Fidelity Central Funds | | 31,423 |
| Prepaid expenses | | 4,219 |
| Receivable from investment adviser for expense reductions | | 71,338 |
| Total assets | | 576,673,345 |
| Liabilities | | |
| Payable for fund shares redeemed | $377,816 | |
| Accrued management fee | 252,144 | |
| Distribution and service plan fees payable | 538 | |
| Other affiliated payables | 101,793 | |
| Other payables and accrued expenses | 52,927 | |
| Collateral on securities loaned | 10,907,900 | |
| Total liabilities | | 11,693,118 |
| Net Assets | | $564,980,227 |
| Net Assets consist of: | | |
| Paid in capital | | $327,376,197 |
| Total distributable earnings (loss) | | 237,604,030 |
| Net Assets | | $564,980,227 |
| Net Asset Value and Maximum Offering Price | | |
| Class A: | | |
| Net Asset Value and redemption price per share ($715,056 ÷ 9,553.6 shares) | | $74.85 |
| Maximum offering price per share (100/94.25 of $74.85) | | $79.42 |
| Class M: | | |
| Net Asset Value and redemption price per share ($485,029 ÷ 6,482.5 shares) | | $74.82 |
| Maximum offering price per share (100/96.50 of $74.82) | | $77.53 |
| Class C: | | |
| Net Asset Value and offering price per share ($377,005 ÷ 5,042.9 shares)(a) | | $74.76 |
| Communication Services: | | |
| Net Asset Value, offering price and redemption price per share ($562,421,688 ÷ 7,510,527.2 shares) | | $74.88 |
| Class I: | | |
| Net Asset Value, offering price and redemption price per share ($452,227 ÷ 6,038.8 shares) | | $74.89 |
| Class Z: | | |
| Net Asset Value, offering price and redemption price per share ($529,222 ÷ 7,066.6 shares) | | $74.89 |
(a) Redemption price per share is equal to net asset value less any applicable contingent deferred sales charge.
See accompanying notes which are an integral part of the financial statements.
Statement of Operations
| | | Year ended February 28, 2019 |
| Investment Income | | |
| Dividends | | $4,405,333 |
| Income from Fidelity Central Funds (including $345,399 from security lending) | | 452,755 |
| Total income | | 4,858,088 |
| Expenses | | |
| Management fee | $2,702,501 | |
| Transfer agent fees | 978,704 | |
| Distribution and service plan fees | 891 | |
| Accounting and security lending fees | 196,363 | |
| Custodian fees and expenses | 14,826 | |
| Independent trustees' fees and expenses | 2,761 | |
| Registration fees | 122,197 | |
| Audit | 48,467 | |
| Legal | 7,511 | |
| Interest | 1,895 | |
| Miscellaneous | 41,171 | |
| Total expenses before reductions | 4,117,287 | |
| Expense reductions | (103,640) | |
| Total expenses after reductions | | 4,013,647 |
| Net investment income (loss) | | 844,441 |
| Realized and Unrealized Gain (Loss) | | |
| Net realized gain (loss) on: | | |
| Investment securities: | | |
| Unaffiliated issuers | 199,088,557 | |
| Fidelity Central Funds | (1,559) | |
| Foreign currency transactions | 560 | |
| Total net realized gain (loss) | | 199,087,558 |
| Change in net unrealized appreciation (depreciation) on: | | |
| Investment securities: | | |
| Unaffiliated issuers | (164,960,812) | |
| Fidelity Central Funds | (68) | |
| Total change in net unrealized appreciation (depreciation) | | (164,960,880) |
| Net gain (loss) | | 34,126,678 |
| Net increase (decrease) in net assets resulting from operations | | $34,971,119 |
See accompanying notes which are an integral part of the financial statements.
Statement of Changes in Net Assets
| | Year ended February 28, 2019 | Year ended February 28, 2018 |
| Increase (Decrease) in Net Assets | | |
| Operations | | |
| Net investment income (loss) | $844,441 | $1,579,243 |
| Net realized gain (loss) | 199,087,558 | 55,286,541 |
| Change in net unrealized appreciation (depreciation) | (164,960,880) | (33,684,418) |
| Net increase (decrease) in net assets resulting from operations | 34,971,119 | 23,181,366 |
| Distributions to shareholders | (67,435,980) | – |
| Distributions to shareholders from net investment income | – | (1,071,017) |
| Distributions to shareholders from net realized gain | – | (29,592,267) |
| Total distributions | (67,435,980) | (30,663,284) |
| Share transactions - net increase (decrease) | 88,069,949 | (163,540,033) |
| Redemption fees | – | 5,340 |
| Total increase (decrease) in net assets | 55,605,088 | (171,016,611) |
| Net Assets | | |
| Beginning of period | 509,375,139 | 680,391,750 |
| End of period | $564,980,227 | $509,375,139 |
| Other Information | | |
| Undistributed net investment income end of period | | $270,718 |
See accompanying notes which are an integral part of the financial statements.
Financial Highlights
Communication Services Portfolio Class A
| Year ended February 28, | 2019 A |
| Selected Per–Share Data | |
| Net asset value, beginning of period | $78.20 |
| Income from Investment Operations | |
| Net investment income (loss)B | (.12) |
| Net realized and unrealized gain (loss) | 2.68 |
| Total from investment operations | 2.56 |
| Distributions from net investment income | (.14) |
| Distributions from net realized gain | (5.77) |
| Total distributions | (5.91) |
| Net asset value, end of period | $74.85 |
| Total ReturnC,D,E | 3.83% |
| Ratios to Average Net AssetsF,G | |
| Expenses before reductions | 1.13%H |
| Expenses net of fee waivers, if any | 1.12%H |
| Expenses net of all reductions | 1.11%H |
| Net investment income (loss) | (.68)%H |
| Supplemental Data | |
| Net assets, end of period (000 omitted) | $715 |
| Portfolio turnover rateI | 107% |
A For the period November 30, 2018 (commencement of sale of shares) to February 28, 2019.
B Calculated based on average shares outstanding during the period.
C Total returns for periods of less than one year are not annualized.
D Total returns would have been lower if certain expenses had not been reduced during the applicable periods shown.
E Total returns do not include the effect of the sales charges.
F Fees and expenses of any underlying Fidelity Central Funds are not included in the Fund's expense ratio. The Fund indirectly bears its proportionate share of the expenses of any underlying Fidelity Central Funds.
G Expense ratios reflect operating expenses of the class. Expenses before reductions do not reflect amounts reimbursed by the investment adviser or reductions from brokerage service arrangements or reductions from other expense offset arrangements and do not represent the amount paid by the class during periods when reimbursements or reductions occur. Expense ratios before reductions for start-up periods may not be representative of longer-term operating periods. Expenses net of fee waivers reflect expenses after reimbursement by the investment adviser but prior to reductions from brokerage service arrangements or other expense offset arrangements. Expenses net of all reductions represent the net expenses paid by the class.
H Annualized
I Amount does not include the portfolio activity of any underlying Fidelity Central Funds.
See accompanying notes which are an integral part of the financial statements.
Communication Services Portfolio Class M
| Year ended February 28, | 2019 A |
| Selected Per–Share Data | |
| Net asset value, beginning of period | $78.20 |
| Income from Investment Operations | |
| Net investment income (loss)B | (.16) |
| Net realized and unrealized gain (loss) | 2.67 |
| Total from investment operations | 2.51 |
| Distributions from net investment income | (.12) |
| Distributions from net realized gain | (5.77) |
| Total distributions | (5.89) |
| Net asset value, end of period | $74.82 |
| Total ReturnC,D,E | 3.76% |
| Ratios to Average Net AssetsF,G | |
| Expenses before reductions | 1.36%H |
| Expenses net of fee waivers, if any | 1.35%H |
| Expenses net of all reductions | 1.34%H |
| Net investment income (loss) | (.90)%H |
| Supplemental Data | |
| Net assets, end of period (000 omitted) | $485 |
| Portfolio turnover rateI | 107% |
A For the period November 30, 2018 (commencement of sale of shares) to February 28, 2019.
B Calculated based on average shares outstanding during the period.
C Total returns for periods of less than one year are not annualized.
D Total returns would have been lower if certain expenses had not been reduced during the applicable periods shown.
E Total returns do not include the effect of the sales charges.
F Fees and expenses of any underlying Fidelity Central Funds are not included in the Fund's expense ratio. The Fund indirectly bears its proportionate share of the expenses of any underlying Fidelity Central Funds.
G Expense ratios reflect operating expenses of the class. Expenses before reductions do not reflect amounts reimbursed by the investment adviser or reductions from brokerage service arrangements or reductions from other expense offset arrangements and do not represent the amount paid by the class during periods when reimbursements or reductions occur. Expense ratios before reductions for start-up periods may not be representative of longer-term operating periods. Expenses net of fee waivers reflect expenses after reimbursement by the investment adviser but prior to reductions from brokerage service arrangements or other expense offset arrangements. Expenses net of all reductions represent the net expenses paid by the class.
H Annualized
I Amount does not include the portfolio activity of any underlying Fidelity Central Funds.
See accompanying notes which are an integral part of the financial statements.
Communication Services Portfolio Class C
| Year ended February 28, | 2019 A |
| Selected Per–Share Data | |
| Net asset value, beginning of period | $78.20 |
| Income from Investment Operations | |
| Net investment income (loss)B | (.25) |
| Net realized and unrealized gain (loss) | 2.67 |
| Total from investment operations | 2.42 |
| Distributions from net investment income | (.09) |
| Distributions from net realized gain | (5.77) |
| Total distributions | (5.86) |
| Net asset value, end of period | $74.76 |
| Total ReturnC,D,E | 3.63% |
| Ratios to Average Net AssetsF,G | |
| Expenses before reductions | 1.87%H |
| Expenses net of fee waivers, if any | 1.85%H |
| Expenses net of all reductions | 1.84%H |
| Net investment income (loss) | (1.37)%H |
| Supplemental Data | |
| Net assets, end of period (000 omitted) | $377 |
| Portfolio turnover rateI | 107% |
A For the period November 30, 2018 (commencement of sale of shares) to February 28, 2019.
B Calculated based on average shares outstanding during the period.
C Total returns for periods of less than one year are not annualized.
D Total returns would have been lower if certain expenses had not been reduced during the applicable periods shown.
E Total returns do not include the effect of the contingent deferred sales charge.
F Fees and expenses of any underlying Fidelity Central Funds are not included in the Fund's expense ratio. The Fund indirectly bears its proportionate share of the expenses of any underlying Fidelity Central Funds.
G Expense ratios reflect operating expenses of the class. Expenses before reductions do not reflect amounts reimbursed by the investment adviser or reductions from brokerage service arrangements or reductions from other expense offset arrangements and do not represent the amount paid by the class during periods when reimbursements or reductions occur. Expense ratios before reductions for start-up periods may not be representative of longer-term operating periods. Expenses net of fee waivers reflect expenses after reimbursement by the investment adviser but prior to reductions from brokerage service arrangements or other expense offset arrangements. Expenses net of all reductions represent the net expenses paid by the class.
H Annualized
I Amount does not include the portfolio activity of any underlying Fidelity Central Funds.
See accompanying notes which are an integral part of the financial statements.
Communication Services Portfolio
| Years ended February 28, | 2019 | 2018 | 2017 | 2016 A | 2015 |
| Selected Per–Share Data | | | | | |
| Net asset value, beginning of period | $79.70 | $80.75 | $68.59 | $82.48 | $81.74 |
| Income from Investment Operations | | | | | |
| Net investment income (loss)B | .13 | .21 | .22 | .27 | .22 |
| Net realized and unrealized gain (loss) | 5.31 | 3.14 | 17.53 | (8.82) | 7.62 |
| Total from investment operations | 5.44 | 3.35 | 17.75 | (8.55) | 7.84 |
| Distributions from net investment income | (.20) | (.16) | (.33) | (.23) | (.20) |
| Distributions from net realized gain | (10.06) | (4.23) | (5.26) | (5.12) | (6.89) |
| Total distributions | (10.26) | (4.40)C | (5.59) | (5.34)D | (7.10)E |
| Redemption fees added to paid in capitalB | – | –F | –F | –F | –F |
| Net asset value, end of period | $74.88 | $79.70 | $80.75 | $68.59 | $82.48 |
| Total ReturnG | 8.12% | 4.16% | 26.85% | (10.88)% | 10.16% |
| Ratios to Average Net AssetsH,I | | | | | |
| Expenses before reductions | .82% | .80% | .82% | .81% | .81% |
| Expenses net of fee waivers, if any | .81% | .80% | .82% | .81% | .81% |
| Expenses net of all reductions | .80% | .79% | .82% | .80% | .81% |
| Net investment income (loss) | .17% | .26% | .30% | .34% | .27% |
| Supplemental Data | | | | | |
| Net assets, end of period (000 omitted) | $562,422 | $509,375 | $680,392 | $576,118 | $802,988 |
| Portfolio turnover rateJ | 107% | 22% | 33% | 42% | 55% |
A For the year ended February 29.
B Calculated based on average shares outstanding during the period.
C Total distributions of $4.40 per share is comprised of distributions from net investment income of $.163 and distributions from net realized gain of $4.233 per share.
D Total distributions of $5.34 per share is comprised of distributions from net investment income of $.227 and distributions from net realized gain of $5.115 per share.
E Total distributions of $7.10 per share is comprised of distributions from net investment income of $.204 and distributions from net realized gain of $6.892 per share.
F Amount represents less than $.005 per share.
G Total returns would have been lower if certain expenses had not been reduced during the applicable periods shown.
H Fees and expenses of any underlying Fidelity Central Funds are not included in the Fund's expense ratio. The Fund indirectly bears its proportionate share of the expenses of any underlying Fidelity Central Funds.
I Expense ratios reflect operating expenses of the class. Expenses before reductions do not reflect amounts reimbursed by the investment adviser or reductions from brokerage service arrangements or reductions from other expense offset arrangements and do not represent the amount paid by the class during periods when reimbursements or reductions occur. Expenses net of fee waivers reflect expenses after reimbursement by the investment adviser but prior to reductions from brokerage service arrangements or other expense offset arrangements. Expenses net of all reductions represent the net expenses paid by the class.
J Amount does not include the portfolio activity of any underlying Fidelity Central Funds.
See accompanying notes which are an integral part of the financial statements.
Communication Services Portfolio Class I
| Year ended February 28, | 2019 A |
| Selected Per–Share Data | |
| Net asset value, beginning of period | $78.20 |
| Income from Investment Operations | |
| Net investment income (loss)B | (.06) |
| Net realized and unrealized gain (loss) | 2.67 |
| Total from investment operations | 2.61 |
| Distributions from net investment income | (.15) |
| Distributions from net realized gain | (5.77) |
| Total distributions | (5.92) |
| Net asset value, end of period | $74.89 |
| Total ReturnC,D | 3.91% |
| Ratios to Average Net AssetsE,F | |
| Expenses before reductions | .70%G |
| Expenses net of fee waivers, if any | .69%G |
| Expenses net of all reductions | .68%G |
| Net investment income (loss) | (.30)%G |
| Supplemental Data | |
| Net assets, end of period (000 omitted) | $452 |
| Portfolio turnover rateH | 107% |
A For the period November 30, 2018 (commencement of sale of shares) to February 28, 2019.
B Calculated based on average shares outstanding during the period.
C Total returns for periods of less than one year are not annualized.
D Total returns would have been lower if certain expenses had not been reduced during the applicable periods shown.
E Fees and expenses of any underlying Fidelity Central Funds are not included in the Fund's expense ratio. The Fund indirectly bears its proportionate share of the expenses of any underlying Fidelity Central Funds.
F Expense ratios reflect operating expenses of the class. Expenses before reductions do not reflect amounts reimbursed by the investment adviser or reductions from brokerage service arrangements or reductions from other expense offset arrangements and do not represent the amount paid by the class during periods when reimbursements or reductions occur. Expense ratios before reductions for start-up periods may not be representative of longer-term operating periods. Expenses net of fee waivers reflect expenses after reimbursement by the investment adviser but prior to reductions from brokerage service arrangements or other expense offset arrangements. Expenses net of all reductions represent the net expenses paid by the class.
G Annualized
H Amount does not include the portfolio activity of any underlying Fidelity Central Funds.
See accompanying notes which are an integral part of the financial statements.
Communication Services Portfolio Class Z
| Year ended February 28, | 2019 A |
| Selected Per–Share Data | |
| Net asset value, beginning of period | $78.20 |
| Income from Investment Operations | |
| Net investment income (loss)B | (.03) |
| Net realized and unrealized gain (loss) | 2.65 |
| Total from investment operations | 2.62 |
| Distributions from net investment income | (.16) |
| Distributions from net realized gain | (5.77) |
| Total distributions | (5.93) |
| Net asset value, end of period | $74.89 |
| Total ReturnC,D | 3.92% |
| Ratios to Average Net AssetsE,F | |
| Expenses before reductions | .64%G |
| Expenses net of fee waivers, if any | .62%G |
| Expenses net of all reductions | .61%G |
| Net investment income (loss) | (.16)%G |
| Supplemental Data | |
| Net assets, end of period (000 omitted) | $529 |
| Portfolio turnover rateH | 107% |
A For the period November 30, 2018 (commencement of sale of shares) to February 28, 2019.
B Calculated based on average shares outstanding during the period.
C Total returns for periods of less than one year are not annualized.
D Total returns would have been lower if certain expenses had not been reduced during the applicable periods shown.
E Fees and expenses of any underlying Fidelity Central Funds are not included in the Fund's expense ratio. The Fund indirectly bears its proportionate share of the expenses of any underlying Fidelity Central Funds.
F Expense ratios reflect operating expenses of the class. Expenses before reductions do not reflect amounts reimbursed by the investment adviser or reductions from brokerage service arrangements or reductions from other expense offset arrangements and do not represent the amount paid by the class during periods when reimbursements or reductions occur. Expense ratios before reductions for start-up periods may not be representative of longer-term operating periods. Expenses net of fee waivers reflect expenses after reimbursement by the investment adviser but prior to reductions from brokerage service arrangements or other expense offset arrangements. Expenses net of all reductions represent the net expenses paid by the class.
G Annualized
H Amount does not include the portfolio activity of any underlying Fidelity Central Funds.
See accompanying notes which are an integral part of the financial statements.
Construction and Housing Portfolio
Performance: The Bottom Line
Average annual total return reflects the change in the value of an investment, assuming reinvestment of distributions from dividend income and capital gains (the profits earned upon the sale of securities that have grown in value, if any) and assuming a constant rate of performance each year. The hypothetical investment and the average annual total returns do not reflect the deduction of taxes that a shareholder would pay on fund distributions or the redemption of fund shares. During periods of reimbursement by Fidelity, a fund’s total return will be greater than it would be had the reimbursement not occurred. How a fund did yesterday is no guarantee of how it will do tomorrow.
Average Annual Total Returns
| For the periods ended February 28, 2019 | Past 1 year | Past 5 years | Past 10 years |
| Construction and Housing Portfolio | 4.03% | 8.35% | 18.30% |
$10,000 Over 10 Years
Let's say hypothetically that $10,000 was invested in Construction and Housing Portfolio on February 28, 2009.
The chart shows how the value of your investment would have changed, and also shows how the S&P 500® Index performed over the same period.
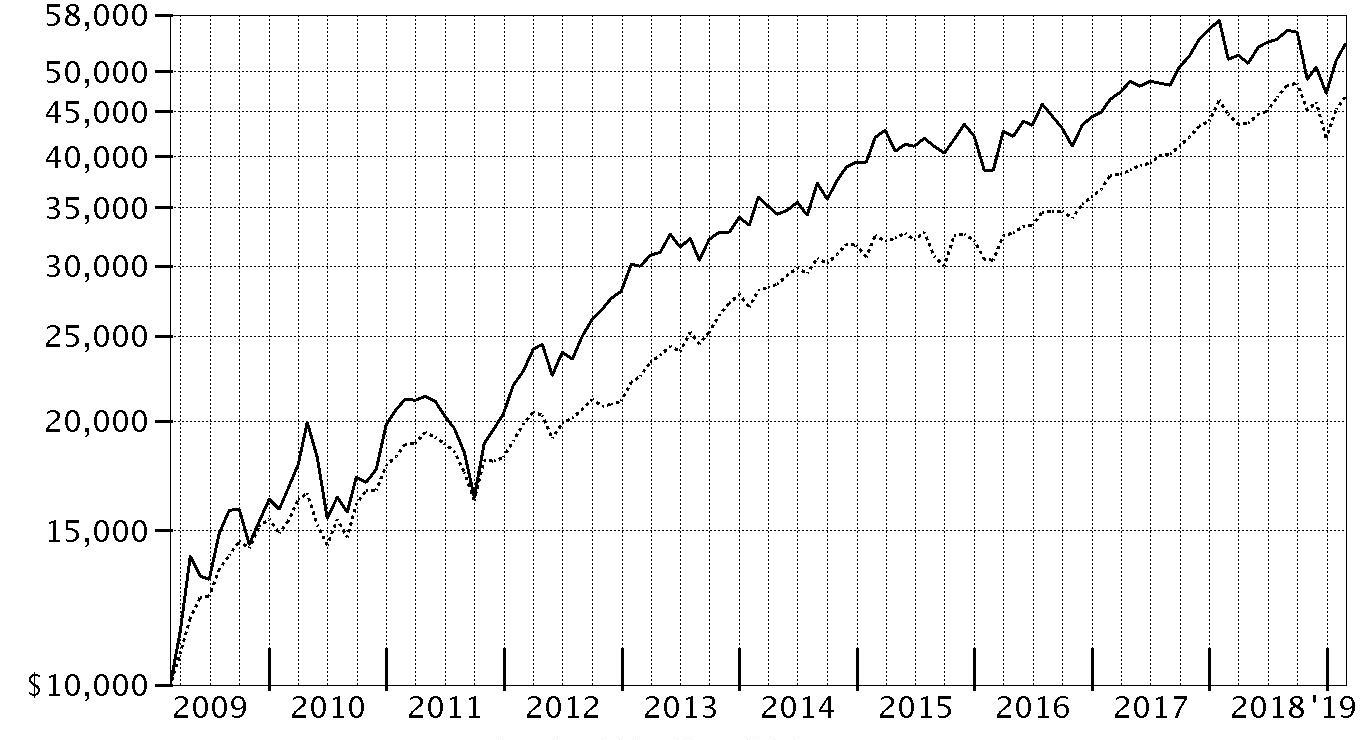
| Period Ending Values |
| $53,679 | Construction and Housing Portfolio |
| $46,739 | S&P 500® Index |
Construction and Housing Portfolio
Management's Discussion of Fund Performance
Market Recap: The S&P 500
® index gained 4.68% for the 12 months ending February 28, 2019, as the U.S. equity bellwether began the new year on a high note after enduring a final quarter of 2018 in which resurgent volatility upset the aging bull market. In October, rising U.S. Treasury yields and concern about peaking corporate earnings growth sent many investors fleeing from risk assets as they were still dealing with lingering uncertainty related to global trade and the U.S. Federal Reserve picking up the pace of interest rate hikes. The index returned -6.84% in October, at the time its largest monthly drop in seven years. But conditions worsened through Christmas, as jitters about the economy and another hike in rates led to a spike in market volatility and a -9.03% result for December. Sharply reversing course to begin 2019, the S&P 500
® gained 11.48% year-to-date, its strongest two-month opening since 1991, amid upbeat company earnings/outlooks and signs the Fed may pause on rates. For the full period, some economically sensitive sectors fared worst, with financials (-6%) and materials (-6%) both losing ground. Energy gained 1%, while communication services and industrials each rose roughly 2%. In contrast, the defensive utilities (+20%), real estate (+20%) and health care (+11%) sectors led the way, while consumer staples finished near the index. Information technology and consumer discretionary were rattled in the late-2018 downturn, but earlier strength contributed to advances of 9% and roughly 7%, respectively.
Comments from Portfolio Manager Neil Nabar: For the fiscal year ending February 28, 2019, the fund gained 4.03%, roughly in line with the 4.10% advance of the MSCI U.S. IMI Construction & Housing 25/50 Index but slightly behind the broad-based S&P 500
®. Within the MSCI industry index, the residential REITS (real estate investment trusts) and home improvement retail segments posted notable gains over the past 12 months, while building products and homebuilding stocks declined. Security selection within the home furnishings and building products groups, along with positioning in the homebuilding category hampered the fund’s performance versus the industry index. Individual disappointments included homebuilder Lennar (-20%), which was partly pressured by higher interest rates, and carpet company Mohawk Industries (-23%), a non-index position hurt by operational missteps. Neither stock was held at period end. On the plus side, the portfolio benefitted from stock picks in the home improvement retail and construction & engineering categories. Here, an overweighting in Lowe’s Companies (+20%) aided our relative result amid signs the home improvement retailer’s turnaround was gaining traction. The timely addition last summer of Essex Property Trust (+21%), a West Coast REIT, combined with an overweighting in AvalonBay Communities (+22%), a REIT operating on both coasts, also contributed. Both stocks were top holdings at period end.
The views expressed above reflect those of the portfolio manager(s) only through the end of the period as stated on the cover of this report and do not necessarily represent the views of Fidelity or any other person in the Fidelity organization. Any such views are subject to change at any time based upon market or other conditions and Fidelity disclaims any responsibility to update such views. These views may not be relied on as investment advice and, because investment decisions for a Fidelity fund are based on numerous factors, may not be relied on as an indication of trading intent on behalf of any Fidelity fund.
Construction and Housing Portfolio
Investment Summary (Unaudited)
Top Ten Stocks as of February 28, 2019
| | % of fund's net assets |
| Home Depot, Inc. | 19.3 |
| Lowe's Companies, Inc. | 15.7 |
| AvalonBay Communities, Inc. | 5.3 |
| D.R. Horton, Inc. | 5.0 |
| Essex Property Trust, Inc. | 4.2 |
| Vulcan Materials Co. | 4.1 |
| NVR, Inc. | 4.1 |
| Masco Corp. | 3.0 |
| Lennox International, Inc. | 2.5 |
| Equity Lifestyle Properties, Inc. | 2.5 |
| | 65.7 |
Top Industries (% of fund's net assets)
| As of February 28, 2019 |
| | Specialty Retail | 35.0% |
| | Equity Real Estate Investment Trusts (Reits) | 19.8% |
| | Building Products | 16.5% |
| | Household Durables | 13.1% |
| | Construction & Engineering | 8.2% |
| | All Others* | 7.4% |

* Includes short-term investments and net other assets (liabilities).
Construction and Housing Portfolio
Schedule of Investments February 28, 2019
Showing Percentage of Net Assets
| Common Stocks - 99.4% | | | |
| | | Shares | Value |
| Building Products - 16.5% | | | |
| Building Products - 16.5% | | | |
| Allegion PLC | | 48,300 | $4,345,068 |
| American Woodmark Corp. (a) | | 23,100 | 1,968,120 |
| Armstrong World Industries, Inc. | | 36,600 | 2,678,388 |
| Jeld-Wen Holding, Inc. (a) | | 107,500 | 2,172,575 |
| Johnson Controls International PLC | | 88,334 | 3,115,540 |
| Lennox International, Inc. | | 22,800 | 5,591,700 |
| Masco Corp. | | 181,600 | 6,820,896 |
| Owens Corning | | 71,843 | 3,587,121 |
| Patrick Industries, Inc. (a) | | 35,000 | 1,582,350 |
| Simpson Manufacturing Co. Ltd. | | 57,100 | 3,422,003 |
| Universal Forest Products, Inc. | | 61,300 | 1,898,461 |
| | | | 37,182,222 |
| Commercial Services & Supplies - 0.7% | | | |
| Environmental & Facility Services - 0.7% | | | |
| ABM Industries, Inc. | | 46,605 | 1,661,934 |
| Construction & Engineering - 8.2% | | | |
| Construction & Engineering - 8.2% | | | |
| Dycom Industries, Inc. (a) | | 7,800 | 351,624 |
| EMCOR Group, Inc. | | 45,728 | 3,298,361 |
| Jacobs Engineering Group, Inc. | | 71,402 | 5,268,040 |
| MasTec, Inc. (a) | | 60,300 | 2,603,754 |
| Quanta Services, Inc. | | 114,800 | 4,091,472 |
| Williams Scotsman Corp. (a) | | 274,100 | 2,793,079 |
| | | | 18,406,330 |
| Construction Materials - 4.9% | | | |
| Construction Materials - 4.9% | | | |
| Summit Materials, Inc. (a) | | 106,900 | 1,817,300 |
| Vulcan Materials Co. | | 83,031 | 9,254,635 |
| | | | 11,071,935 |
| Equity Real Estate Investment Trusts (REITs) - 19.8% | | | |
| Residential REITs - 17.3% | | | |
| American Homes 4 Rent Class A | | 234,400 | 5,119,296 |
| AvalonBay Communities, Inc. | | 61,300 | 11,930,819 |
| Camden Property Trust (SBI) | | 53,300 | 5,228,197 |
| Equity Lifestyle Properties, Inc. | | 50,787 | 5,517,500 |
| Essex Property Trust, Inc. | | 33,600 | 9,402,624 |
| UMH Properties, Inc. | | 120,600 | 1,649,808 |
| | | | 38,848,244 |
| Specialized REITs - 2.5% | | | |
| Equinix, Inc. | | 5,400 | 2,286,900 |
| Weyerhaeuser Co. | | 135,500 | 3,372,595 |
| | | | 5,659,495 |
|
| TOTAL EQUITY REAL ESTATE INVESTMENT TRUSTS (REITS) | | | 44,507,739 |
|
| Household Durables - 13.1% | | | |
| Homebuilding - 13.1% | | | |
| Blu Homes, Inc. (a)(b)(c) | | 11,990,913 | 20,739 |
| D.R. Horton, Inc. | | 287,600 | 11,184,764 |
| KB Home | | 99,500 | 2,269,595 |
| NVR, Inc. (a) | | 3,507 | 9,188,340 |
| Skyline Champion Corp. | | 186,700 | 3,707,862 |
| Taylor Morrison Home Corp. (a) | | 53,601 | 898,889 |
| TopBuild Corp. (a) | | 37,700 | 2,243,150 |
| | | | 29,513,339 |
| Real Estate Management & Development - 1.2% | | | |
| Real Estate Development - 1.2% | | | |
| Howard Hughes Corp. (a) | | 24,700 | 2,751,086 |
| Specialty Retail - 35.0% | | | |
| Home Improvement Retail - 35.0% | | | |
| Home Depot, Inc. | | 234,531 | 43,421,069 |
| Lowe's Companies, Inc. | | 336,370 | 35,349,123 |
| | | | 78,770,192 |
| TOTAL COMMON STOCKS | | | |
| (Cost $155,683,747) | | | 223,864,777 |
|
| Money Market Funds - 0.8% | | | |
| Fidelity Cash Central Fund, 2.44% (d) | | | |
| (Cost $1,775,723) | | 1,775,368 | 1,775,723 |
| TOTAL INVESTMENT IN SECURITIES - 100.2% | | | |
| (Cost $157,459,470) | | | 225,640,500 |
| NET OTHER ASSETS (LIABILITIES) - (0.2)% | | | (385,203) |
| NET ASSETS - 100% | | | $225,255,297 |
Legend
(a) Non-income producing
(b) Restricted securities - Investment in securities not registered under the Securities Act of 1933 (excluding 144A issues). At the end of the period, the value of restricted securities (excluding 144A issues) amounted to $20,739 or 0.0% of net assets.
(c) Level 3 security
(d) Affiliated fund that is generally available only to investment companies and other accounts managed by Fidelity Investments. The rate quoted is the annualized seven-day yield of the fund at period end. A complete unaudited listing of the fund's holdings as of its most recent quarter end is available upon request. In addition, each Fidelity Central Fund's financial statements, which are not covered by the Fund's Report of Independent Registered Public Accounting Firm, are available on the SEC's website or upon request.
Additional information on each restricted holding is as follows:
| Security | Acquisition Date | Acquisition Cost |
| Blu Homes, Inc. | 6/10/13 | $4,000,001 |
Affiliated Central Funds
Information regarding fiscal year to date income earned by the Fund from investments in Fidelity Central Funds is as follows:
| Fund | Income earned |
| Fidelity Cash Central Fund | $29,971 |
| Fidelity Securities Lending Cash Central Fund | 1,199 |
| Total | $31,170 |
Amounts in the income column in the above table include any capital gain distributions from underlying funds, which are presented in the corresponding line-item in the Statement of Operations, if applicable.
Investment Valuation
The following is a summary of the inputs used, as of February 28, 2019, involving the Fund's assets and liabilities carried at fair value. The inputs or methodology used for valuing securities may not be an indication of the risk associated with investing in those securities. For more information on valuation inputs, and their aggregation into the levels used below, please refer to the Investment Valuation section in the accompanying Notes to Financial Statements.
| | Valuation Inputs at Reporting Date: |
| Description | Total | Level 1 | Level 2 | Level 3 |
| Investments in Securities: | | | | |
| Common Stocks | $223,864,777 | $223,844,038 | $-- | $20,739 |
| Money Market Funds | 1,775,723 | 1,775,723 | -- | -- |
| Total Investments in Securities: | $225,640,500 | $225,619,761 | $-- | $20,739 |
See accompanying notes which are an integral part of the financial statements.
Construction and Housing Portfolio
Financial Statements
Statement of Assets and Liabilities
| | | February 28, 2019 |
| Assets | | |
Investment in securities, at value — See accompanying schedule:
Unaffiliated issuers (cost $155,683,747) | $223,864,777 | |
| Fidelity Central Funds (cost $1,775,723) | 1,775,723 | |
| Total Investment in Securities (cost $157,459,470) | | $225,640,500 |
| Receivable for investments sold | | 2,948,144 |
| Receivable for fund shares sold | | 60,958 |
| Dividends receivable | | 114,592 |
| Distributions receivable from Fidelity Central Funds | | 3,826 |
| Prepaid expenses | | 2,747 |
| Other receivables | | 2,256 |
| Total assets | | 228,773,023 |
| Liabilities | | |
| Payable for investments purchased | $2,914,283 | |
| Payable for fund shares redeemed | 425,468 | |
| Accrued management fee | 100,280 | |
| Other affiliated payables | 42,378 | |
| Other payables and accrued expenses | 35,317 | |
| Total liabilities | | 3,517,726 |
| Net Assets | | $225,255,297 |
| Net Assets consist of: | | |
| Paid in capital | | $149,238,409 |
| Total distributable earnings (loss) | | 76,016,888 |
| Net Assets, for 4,154,110 shares outstanding | | $225,255,297 |
| Net Asset Value, offering price and redemption price per share ($225,255,297 ÷ 4,154,110 shares) | | $54.22 |
See accompanying notes which are an integral part of the financial statements.
Statement of Operations
| | | Year ended February 28, 2019 |
| Investment Income | | |
| Dividends | | $4,299,373 |
| Income from Fidelity Central Funds (including $1,199 from security lending) | | 31,170 |
| Total income | | 4,330,543 |
| Expenses | | |
| Management fee | $1,414,356 | |
| Transfer agent fees | 500,592 | |
| Accounting and security lending fees | 102,026 | |
| Custodian fees and expenses | 15,157 | |
| Independent trustees' fees and expenses | 1,531 | |
| Registration fees | 26,437 | |
| Audit | 40,942 | |
| Legal | 2,238 | |
| Miscellaneous | 2,341 | |
| Total expenses before reductions | 2,105,620 | |
| Expense reductions | (29,628) | |
| Total expenses after reductions | | 2,075,992 |
| Net investment income (loss) | | 2,254,551 |
| Realized and Unrealized Gain (Loss) | | |
| Net realized gain (loss) on: | | |
| Investment securities: | | |
| Unaffiliated issuers | 29,973,036 | |
| Fidelity Central Funds | (170) | |
| Total net realized gain (loss) | | 29,972,866 |
| Change in net unrealized appreciation (depreciation) on investment securities | | (23,163,019) |
| Net gain (loss) | | 6,809,847 |
| Net increase (decrease) in net assets resulting from operations | | $9,064,398 |
See accompanying notes which are an integral part of the financial statements.
Statement of Changes in Net Assets
| | Year ended February 28, 2019 | Year ended February 28, 2018 |
| Increase (Decrease) in Net Assets | | |
| Operations | | |
| Net investment income (loss) | $2,254,551 | $2,608,630 |
| Net realized gain (loss) | 29,972,866 | 61,746,960 |
| Change in net unrealized appreciation (depreciation) | (23,163,019) | (25,870,943) |
| Net increase (decrease) in net assets resulting from operations | 9,064,398 | 38,484,647 |
| Distributions to shareholders | (33,784,910) | – |
| Distributions to shareholders from net investment income | – | (1,543,811) |
| Distributions to shareholders from net realized gain | – | (46,308,729) |
| Total distributions | (33,784,910) | (47,852,540) |
| Share transactions | | |
| Proceeds from sales of shares | 27,995,296 | 131,533,408 |
| Reinvestment of distributions | 32,148,706 | 45,604,178 |
| Cost of shares redeemed | (141,586,264) | (240,882,477) |
| Net increase (decrease) in net assets resulting from share transactions | (81,442,262) | (63,744,891) |
| Redemption fees | – | 5,063 |
| Total increase (decrease) in net assets | (106,162,774) | (73,107,721) |
| Net Assets | | |
| Beginning of period | 331,418,071 | 404,525,792 |
| End of period | $225,255,297 | $331,418,071 |
| Other Information | | |
| Undistributed net investment income end of period | | $515,582 |
| Shares | | |
| Sold | 490,715 | 2,043,349 |
| Issued in reinvestment of distributions | 612,966 | 729,117 |
| Redeemed | (2,484,098) | (3,793,864) |
| Net increase (decrease) | (1,380,417) | (1,021,398) |
See accompanying notes which are an integral part of the financial statements.
Financial Highlights
Construction and Housing Portfolio
| | | | | | |
| Years ended February 28, | 2019 | 2018 | 2017 | 2016 A | 2015 |
| Selected Per–Share Data | | | | | |
| Net asset value, beginning of period | $59.88 | $61.70 | $53.16 | $59.74 | $57.48 |
| Income from Investment Operations | | | | | |
| Net investment income (loss)B | .49 | .44 | .37 | .33 | .29 |
| Net realized and unrealized gain (loss) | 1.32 | 6.58 | 10.29 | (5.02) | 8.53 |
| Total from investment operations | 1.81 | 7.02 | 10.66 | (4.69) | 8.82 |
| Distributions from net investment income | (.55) | (.30) | (.45) | (.23) | (.29) |
| Distributions from net realized gain | (6.92) | (8.53) | (1.67) | (1.66) | (6.28) |
| Total distributions | (7.47) | (8.84)C | (2.12) | (1.89) | (6.56)D |
| Redemption fees added to paid in capitalB | – | –E | –E | –E | –E |
| Net asset value, end of period | $54.22 | $59.88 | $61.70 | $53.16 | $59.74 |
| Total ReturnF | 4.03% | 11.07% | 20.23% | (8.11)% | 16.99% |
| Ratios to Average Net AssetsG,H | | | | | |
| Expenses before reductions | .80% | .80% | .80% | .81% | .82% |
| Expenses net of fee waivers, if any | .80% | .80% | .80% | .80% | .82% |
| Expenses net of all reductions | .79% | .79% | .79% | .80% | .82% |
| Net investment income (loss) | .86% | .69% | .62% | .57% | .52% |
| Supplemental Data | | | | | |
| Net assets, end of period (000 omitted) | $225,255 | $331,418 | $404,526 | $449,303 | $419,479 |
| Portfolio turnover rateI | 90% | 56% | 87% | 80% | 71% |
A For the year ended February 29.
B Calculated based on average shares outstanding during the period.
C Total distributions of $8.84 per share is comprised of distributions from net investment income of $.303 and distributions from net realized gain of $8.534 per share.
D Total distributions of $6.56 per share is comprised of distributions from net investment income of $.287 and distributions from net realized gain of $6.276 per share.
E Amount represents less than $.005 per share.
F Total returns would have been lower if certain expenses had not been reduced during the applicable periods shown.
G Fees and expenses of any underlying Fidelity Central Funds are not included in the Fund's expense ratio. The Fund indirectly bears its proportionate share of the expenses of any underlying Fidelity Central Funds.
H Expense ratios reflect operating expenses of the Fund. Expenses before reductions do not reflect amounts reimbursed by the investment adviser or reductions from brokerage service arrangements or reductions from other expense offset arrangements and do not represent the amount paid by the Fund during periods when reimbursements or reductions occur. Expenses net of fee waivers reflect expenses after reimbursement by the investment adviser but prior to reductions from brokerage service arrangements or other expense offset arrangements. Expenses net of all reductions represent the net expenses paid by the Fund.
I Amount does not include the portfolio activity of any underlying Fidelity Central Funds.
See accompanying notes which are an integral part of the financial statements.
Consumer Discretionary Portfolio
Performance: The Bottom Line
Average annual total return reflects the change in the value of an investment, assuming reinvestment of distributions from dividend income and capital gains (the profits earned upon the sale of securities that have grown in value, if any) and assuming a constant rate of performance each year. The hypothetical investment and the average annual total returns do not reflect the deduction of taxes that a shareholder would pay on fund distributions or the redemption of fund shares. During periods of reimbursement by Fidelity, a fund’s total return will be greater than it would be had the reimbursement not occurred. How a fund did yesterday is no guarantee of how it will do tomorrow.
Average Annual Total Returns
| For the periods ended February 28, 2019 | Past 1 year | Past 5 years | Past 10 years |
| Consumer Discretionary Portfolio | 4.81% | 10.19% | 19.26% |
$10,000 Over 10 Years
Let's say hypothetically that $10,000 was invested in Consumer Discretionary Portfolio on February 28, 2009.
The chart shows how the value of your investment would have changed, and also shows how the S&P 500® Index performed over the same period.
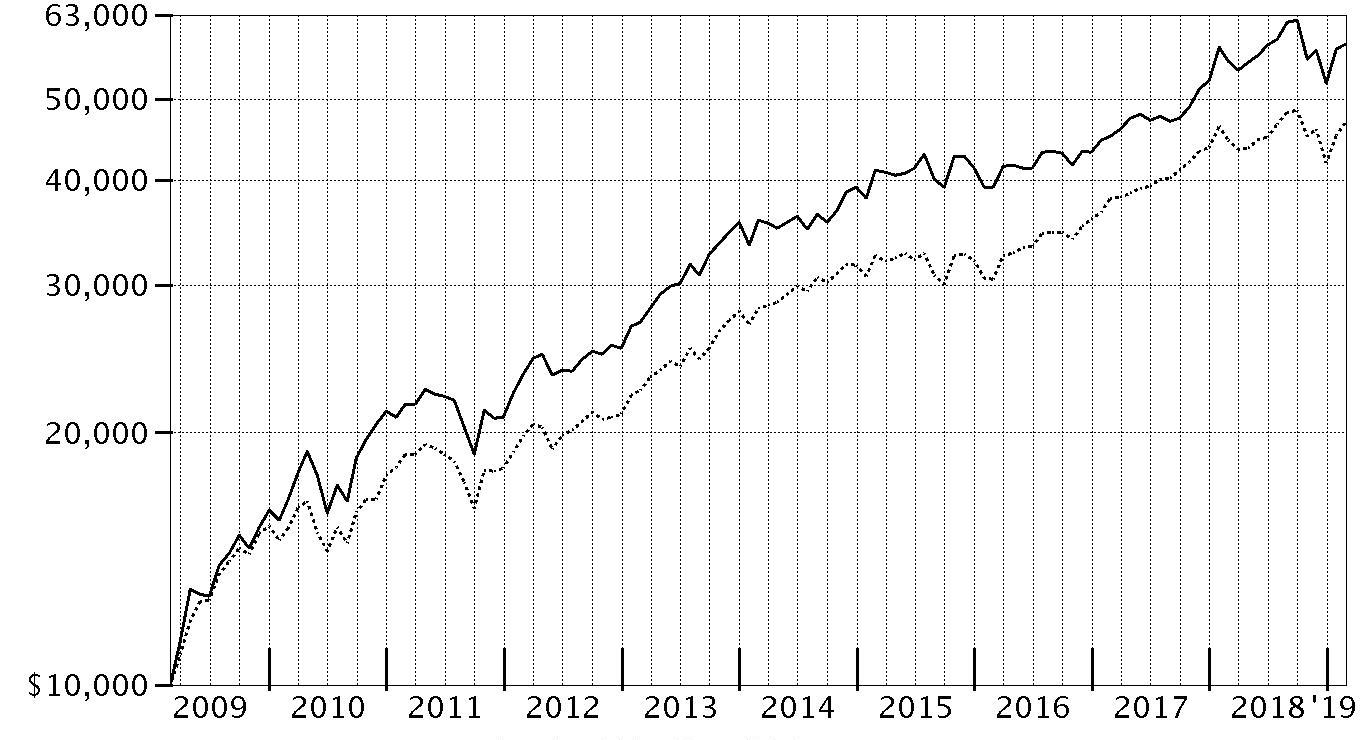
| Period Ending Values |
| $58,181 | Consumer Discretionary Portfolio |
| $46,739 | S&P 500® Index |
Consumer Discretionary Portfolio
Management's Discussion of Fund Performance
Market Recap: The S&P 500
® index gained 4.68% for the 12 months ending February 28, 2019, as the U.S. equity bellwether began the new year on a high note after enduring a final quarter of 2018 in which resurgent volatility upset the aging bull market. In October, rising U.S. Treasury yields and concern about peaking corporate earnings growth sent many investors fleeing from risk assets as they were still dealing with lingering uncertainty related to global trade and the U.S. Federal Reserve picking up the pace of interest rate hikes. The index returned -6.84% in October, at the time its largest monthly drop in seven years. But conditions worsened through Christmas, as jitters about the economy and another hike in rates led to a spike in market volatility and a -9.03% result for December. Sharply reversing course to begin 2019, the S&P 500
® gained 11.48% year-to-date, its strongest two-month opening since 1991, amid upbeat company earnings/outlooks and signs the Fed may pause on rates. For the full period, some economically sensitive sectors fared worst, with financials (-6%) and materials (-6%) both losing ground. Energy gained 1%, while communication services and industrials each rose roughly 2%. In contrast, the defensive utilities (+20%), real estate (+20%) and health care (+11%) sectors led the way, while consumer staples finished near the index. Information technology and consumer discretionary were rattled in the late-2018 downturn, but earlier strength contributed to advances of 9% and roughly 7%, respectively.
Comments from Portfolio Manager Katherine Shaw: For the fiscal year, the fund gained 4.81%, trailing the 6.34% result of the MSCI U.S. IMI Consumer Discretionary 25/50 Index, but modestly ahead of the broad-market S&P 500
® index. During the past 12 months, the sector’s advance was boosted by several tailwinds, including a tight labor market, low unemployment and rising wages. Versus the MSCI sector index, stock selection held back the fund’s performance, notably in the internet & direct marketing and the apparel, accessories & luxury goods industry groups. Overweighting the lagging hotels, resorts & cruise lines segment also detracted this period. Among individual stocks, being underexposed to index component and mass media giant Twenty-First Century Fox held back the fund's relative result the most. The stock rallied ahead of the U.S. Department of Justice's decision to approve Walt Disney's acquisition of most of Fox's assets – a deal that was agreed upon in December 2017. Shares of Fox continued to perform well through period end, as the deal seemingly inched nearer to completion and as Fox showed solid growth in its TV and cable business. An overweighting in apparel company PVH (formerly known as Phillips-Van Heusen) – the owner of the Calvin Klein and Tommy Hilfiger brands – also hurt. Conversely, off-price retailer Burlington Stores was the fund’s top relative contributor, as the stock benefited from stronger-than-expected same-store sales, operating margins and earnings. In November, the company said the addition of 48 new stores drove third-quarter revenue above the market’s expectations. Burlington also raised its full-year outlook. Not owning index component Ford Motor, which suffered a double-digit stock price decline, was another key relative standout.
The views expressed above reflect those of the portfolio manager(s) only through the end of the period as stated on the cover of this report and do not necessarily represent the views of Fidelity or any other person in the Fidelity organization. Any such views are subject to change at any time based upon market or other conditions and Fidelity disclaims any responsibility to update such views. These views may not be relied on as investment advice and, because investment decisions for a Fidelity fund are based on numerous factors, may not be relied on as an indication of trading intent on behalf of any Fidelity fund.
Consumer Discretionary Portfolio
Investment Summary (Unaudited)
Top Ten Stocks as of February 28, 2019
| | % of fund's net assets |
| Amazon.com, Inc. | 22.9 |
| Home Depot, Inc. | 8.0 |
| McDonald's Corp. | 5.1 |
| Lowe's Companies, Inc. | 3.6 |
| NIKE, Inc. Class B | 3.4 |
| The Booking Holdings, Inc. | 3.0 |
| TJX Companies, Inc. | 2.8 |
| Dollar Tree, Inc. | 2.3 |
| Marriott International, Inc. Class A | 2.0 |
| Royal Caribbean Cruises Ltd. | 2.0 |
| | 55.1 |
Top Industries (% of fund's net assets)
| As of February 28, 2019 |
| | Internet & Direct Marketing Retail | 27.3% |
| | Specialty Retail | 23.8% |
| | Hotels, Restaurants & Leisure | 23.6% |
| | Textiles, Apparel & Luxury Goods | 8.0% |
| | Multiline Retail | 4.4% |
| | All Others* | 12.9% |

* Includes short-term investments and net other assets (liabilities).
Consumer Discretionary Portfolio
Schedule of Investments February 28, 2019
Showing Percentage of Net Assets
| Common Stocks - 98.9% | | | |
| | | Shares | Value |
| Auto Components - 0.6% | | | |
| Auto Parts & Equipment - 0.6% | | | |
| Aptiv PLC | | 19,000 | $1,579,090 |
| Lear Corp. | | 7,000 | 1,064,490 |
| | | | 2,643,580 |
| Automobiles - 2.0% | | | |
| Automobile Manufacturers - 2.0% | | | |
| Ferrari NV | | 6,800 | 872,168 |
| Tesla, Inc. (a) | | 20,551 | 6,573,854 |
| Thor Industries, Inc. | | 19,600 | 1,265,572 |
| | | | 8,711,594 |
| Beverages - 0.4% | | | |
| Distillers & Vintners - 0.4% | | | |
| Constellation Brands, Inc. Class A (sub. vtg.) | | 9,300 | 1,573,188 |
| Commercial Services & Supplies - 0.2% | | | |
| Diversified Support Services - 0.2% | | | |
| Copart, Inc. (a) | | 15,800 | 926,986 |
| Distributors - 0.8% | | | |
| Distributors - 0.8% | | | |
| LKQ Corp. (a) | | 90,100 | 2,495,770 |
| Pool Corp. | | 5,329 | 850,189 |
| | | | 3,345,959 |
| Diversified Consumer Services - 0.6% | | | |
| Education Services - 0.6% | | | |
| Grand Canyon Education, Inc. (a) | | 17,308 | 2,002,189 |
| New Oriental Education & Technology Group, Inc. sponsored ADR (a) | | 9,000 | 738,540 |
| | | | 2,740,729 |
| Specialized Consumer Services - 0.0% | | | |
| ServiceMaster Global Holdings, Inc. (a) | | 500 | 22,580 |
|
| TOTAL DIVERSIFIED CONSUMER SERVICES | | | 2,763,309 |
|
| Entertainment - 0.7% | | | |
| Interactive Home Entertainment - 0.1% | | | |
| Electronic Arts, Inc. (a) | | 4,400 | 421,432 |
| Movies & Entertainment - 0.6% | | | |
| Cinemark Holdings, Inc. | | 17,381 | 654,047 |
| Live Nation Entertainment, Inc. (a) | | 7,900 | 446,824 |
| Netflix, Inc. (a) | | 2,479 | 887,730 |
| World Wrestling Entertainment, Inc. Class A | | 5,400 | 451,980 |
| | | | 2,440,581 |
|
| TOTAL ENTERTAINMENT | | | 2,862,013 |
|
| Food & Staples Retailing - 1.5% | | | |
| Food Distributors - 0.7% | | | |
| Performance Food Group Co. (a) | | 83,900 | 3,232,667 |
| Food Retail - 0.1% | | | |
| Kroger Co. | | 14,700 | 431,151 |
| Hypermarkets & Super Centers - 0.7% | | | |
| BJ's Wholesale Club Holdings, Inc. | | 67,747 | 1,715,354 |
| Walmart, Inc. | | 11,000 | 1,088,890 |
| | | | 2,804,244 |
|
| TOTAL FOOD & STAPLES RETAILING | | | 6,468,062 |
|
| Health Care Providers & Services - 0.0% | | | |
| Health Care Services - 0.0% | | | |
| National Vision Holdings, Inc. (a) | | 1,990 | 66,864 |
| Hotels, Restaurants & Leisure - 23.6% | | | |
| Casinos & Gaming - 2.4% | | | |
| Boyd Gaming Corp. | | 26,000 | 773,760 |
| Churchill Downs, Inc. | | 7,200 | 675,360 |
| Eldorado Resorts, Inc. (a) | | 54,500 | 2,627,445 |
| Las Vegas Sands Corp. | | 74,752 | 4,592,015 |
| Penn National Gaming, Inc. (a) | | 59,223 | 1,471,692 |
| PlayAGS, Inc. (a) | | 11,300 | 268,827 |
| | | | 10,409,099 |
| Hotels, Resorts & Cruise Lines - 8.4% | | | |
| Bluegreen Vacations Corp. | | 20,700 | 270,963 |
| Carnival Corp. | | 49,700 | 2,870,672 |
| Hilton Grand Vacations, Inc. (a) | | 54,287 | 1,725,784 |
| Hilton Worldwide Holdings, Inc. | | 83,600�� | 6,947,160 |
| Marriott International, Inc. Class A | | 69,733 | 8,735,453 |
| Marriott Vacations Worldwide Corp. | | 28,506 | 2,774,774 |
| Royal Caribbean Cruises Ltd. | | 72,725 | 8,616,458 |
| Wyndham Destinations, Inc. | | 49,900 | 2,246,997 |
| Wyndham Hotels & Resorts, Inc. | | 37,400 | 1,966,118 |
| | | | 36,154,379 |
| Leisure Facilities - 1.4% | | | |
| Cedar Fair LP (depositary unit) | | 9,213 | 488,289 |
| Drive Shack, Inc. (a) | | 108,318 | 477,682 |
| Planet Fitness, Inc. (a) | | 45,600 | 2,680,368 |
| Vail Resorts, Inc. | | 12,489 | 2,602,583 |
| | | | 6,248,922 |
| Restaurants - 11.4% | | | |
| ARAMARK Holdings Corp. | | 97,700 | 2,960,310 |
| Chipotle Mexican Grill, Inc. (a) | | 4,000 | 2,430,120 |
| Darden Restaurants, Inc. | | 8,400 | 941,724 |
| Del Frisco's Restaurant Group, Inc. (a) | | 27,900 | 236,313 |
| Dine Brands Global, Inc. | | 4,400 | 436,480 |
| Domino's Pizza, Inc. | | 13,500 | 3,387,690 |
| McDonald's Corp. | | 119,400 | 21,950,496 |
| Restaurant Brands International, Inc. | | 34,510 | 2,182,395 |
| Starbucks Corp. | | 101,368 | 7,122,116 |
| U.S. Foods Holding Corp. (a) | | 70,067 | 2,469,161 |
| Wingstop, Inc. | | 9,532 | 634,927 |
| Yum! Brands, Inc. | | 50,600 | 4,781,700 |
| | | | 49,533,432 |
|
| TOTAL HOTELS, RESTAURANTS & LEISURE | | | 102,345,832 |
|
| Household Durables - 2.9% | | | |
| Home Furnishings - 0.4% | | | |
| Mohawk Industries, Inc. (a) | | 12,505 | 1,702,181 |
| Homebuilding - 2.5% | | | |
| Cavco Industries, Inc. (a) | | 5,500 | 761,365 |
| D.R. Horton, Inc. | | 96,200 | 3,741,218 |
| Lennar Corp. Class A | | 68,400 | 3,281,832 |
| NVR, Inc. (a) | | 1,141 | 2,989,420 |
| | | | 10,773,835 |
|
| TOTAL HOUSEHOLD DURABLES | | | 12,476,016 |
|
| Interactive Media & Services - 0.4% | | | |
| Interactive Media & Services - 0.4% | | | |
| Alphabet, Inc. Class A (a) | | 1,500 | 1,689,825 |
| Momo, Inc. ADR (a) | | 7,800 | 258,726 |
| | | | 1,948,551 |
| Internet & Direct Marketing Retail - 27.3% | | | |
| Internet & Direct Marketing Retail - 27.3% | | | |
| Amazon.com, Inc. (a) | | 60,600 | 99,373,696 |
| eBay, Inc. | | 65,600 | 2,437,040 |
| GrubHub, Inc. (a) | | 7,300 | 595,534 |
| Liberty Interactive Corp. QVC Group Series A (a) | | 105,010 | 1,891,230 |
| The Booking Holdings, Inc. (a) | | 7,542 | 12,799,076 |
| Wayfair LLC Class A (a) | | 3,800 | 629,584 |
| Zozo, Inc. | | 22,600 | 424,973 |
| | | | 118,151,133 |
| IT Services - 0.4% | | | |
| Data Processing & Outsourced Services - 0.4% | | | |
| Global Payments, Inc. | | 5,000 | 651,900 |
| PayPal Holdings, Inc. (a) | | 12,500 | 1,225,875 |
| | | | 1,877,775 |
| Leisure Products - 0.4% | | | |
| Leisure Products - 0.4% | | | |
| Mattel, Inc. (a)(b) | | 117,563 | 1,695,258 |
| Media - 0.2% | | | |
| Cable & Satellite - 0.2% | | | |
| MultiChoice Group Ltd. | | 4,200 | 31,305 |
| Naspers Ltd. Class N | | 4,200 | 907,540 |
| | | | 938,845 |
| Multiline Retail - 4.4% | | | |
| Department Stores - 0.1% | | | |
| Future Retail Ltd. (a) | | 44,164 | 264,086 |
| General Merchandise Stores - 4.3% | | | |
| B&M European Value Retail S.A. | | 78,008 | 365,752 |
| Dollar General Corp. | | 60,200 | 7,131,292 |
| Dollar Tree, Inc. (a) | | 101,521 | 9,779,518 |
| Ollie's Bargain Outlet Holdings, Inc. (a) | | 16,100 | 1,420,342 |
| | | | 18,696,904 |
|
| TOTAL MULTILINE RETAIL | | | 18,960,990 |
|
| Software - 0.3% | | | |
| Application Software - 0.3% | | | |
| 2U, Inc. (a) | | 16,000 | 1,179,200 |
| Specialty Retail - 23.8% | | | |
| Apparel Retail - 6.8% | | | |
| Burlington Stores, Inc. (a) | | 46,200 | 7,841,988 |
| Ross Stores, Inc. | | 87,980 | 8,343,143 |
| The Children's Place Retail Stores, Inc. | | 12,300 | 1,175,388 |
| TJX Companies, Inc. | | 238,218 | 12,218,201 |
| | | | 29,578,720 |
| Automotive Retail - 2.9% | | | |
| AutoZone, Inc. (a) | | 5,100 | 4,788,747 |
| Monro, Inc. | | 15,300 | 1,167,543 |
| O'Reilly Automotive, Inc. (a) | | 17,798 | 6,620,144 |
| | | | 12,576,434 |
| Computer & Electronics Retail - 0.7% | | | |
| Best Buy Co., Inc. | | 46,715 | 3,215,861 |
| Home Improvement Retail - 11.9% | | | |
| Floor & Decor Holdings, Inc. Class A (a) | | 29,400 | 1,093,092 |
| Home Depot, Inc. | | 186,800 | 34,584,152 |
| Lowe's Companies, Inc. | | 150,200 | 15,784,518 |
| | | | 51,461,762 |
| Specialty Stores - 1.5% | | | |
| Dick's Sporting Goods, Inc. | | 15,500 | 605,430 |
| Five Below, Inc. (a) | | 7,500 | 902,625 |
| Tiffany & Co., Inc. | | 15,600 | 1,482,624 |
| Ulta Beauty, Inc. (a) | | 11,300 | 3,531,137 |
| | | | 6,521,816 |
|
| TOTAL SPECIALTY RETAIL | | | 103,354,593 |
|
| Technology Hardware, Storage & Peripherals - 0.2% | | | |
| Technology Hardware, Storage & Peripherals - 0.2% | | | |
| Apple, Inc. | | 5,000 | 865,750 |
| Textiles, Apparel & Luxury Goods - 8.0% | | | |
| Apparel, Accessories & Luxury Goods - 4.6% | | | |
| adidas AG | | 4,637 | 1,126,602 |
| Canada Goose Holdings, Inc. (a) | | 6,000 | 341,776 |
| Capri Holdings Ltd. (a) | | 34,400 | 1,568,640 |
| Carter's, Inc. | | 13,400 | 1,305,696 |
| G-III Apparel Group Ltd. (a) | | 10,900 | 388,149 |
| Kering SA | | 1,670 | 911,970 |
| lululemon athletica, Inc. (a) | | 2,800 | 421,176 |
| LVMH Moet Hennessy - Louis Vuitton SA | | 4,000 | 1,372,756 |
| PVH Corp. | | 49,382 | 5,671,029 |
| Tapestry, Inc. | | 106,340 | 3,715,520 |
| VF Corp. | | 36,200 | 3,162,432 |
| | | | 19,985,746 |
| Footwear - 3.4% | | | |
| NIKE, Inc. Class B | | 169,350 | 14,518,376 |
|
| TOTAL TEXTILES, APPAREL & LUXURY GOODS | | | 34,504,122 |
|
| Tobacco - 0.2% | | | |
| Tobacco - 0.2% | | | |
| Philip Morris International, Inc. | | 9,400 | 817,236 |
| TOTAL COMMON STOCKS | | | |
| (Cost $331,237,038) | | | 428,476,856 |
|
| Money Market Funds - 0.4% | | | |
| Fidelity Securities Lending Cash Central Fund 2.45% (c)(d) | | | |
| (Cost $1,742,925) | | 1,742,751 | 1,742,925 |
| TOTAL INVESTMENT IN SECURITIES - 99.3% | | | |
| (Cost $332,979,963) | | | 430,219,781 |
| NET OTHER ASSETS (LIABILITIES) - 0.7% | | | 2,968,267 |
| NET ASSETS - 100% | | | $433,188,048 |
Legend
(a) Non-income producing
(b) Security or a portion of the security is on loan at period end.
(c) Investment made with cash collateral received from securities on loan.
(d) Affiliated fund that is generally available only to investment companies and other accounts managed by Fidelity Investments. The rate quoted is the annualized seven-day yield of the fund at period end. A complete unaudited listing of the fund's holdings as of its most recent quarter end is available upon request. In addition, each Fidelity Central Fund's financial statements, which are not covered by the Fund's Report of Independent Registered Public Accounting Firm, are available on the SEC's website or upon request.
Affiliated Central Funds
Information regarding fiscal year to date income earned by the Fund from investments in Fidelity Central Funds is as follows:
| Fund | Income earned |
| Fidelity Cash Central Fund | $45,769 |
| Fidelity Securities Lending Cash Central Fund | 86,587 |
| Total | $132,356 |
Amounts in the income column in the above table include any capital gain distributions from underlying funds, which are presented in the corresponding line-item in the Statement of Operations, if applicable.
Investment Valuation
The following is a summary of the inputs used, as of February 28, 2019, involving the Fund's assets and liabilities carried at fair value. The inputs or methodology used for valuing securities may not be an indication of the risk associated with investing in those securities. For more information on valuation inputs, and their aggregation into the levels used below, please refer to the Investment Valuation section in the accompanying Notes to Financial Statements.
| | Valuation Inputs at Reporting Date: |
| Description | Total | Level 1 | Level 2 | Level 3 |
| Investments in Securities: | | | | |
| Common Stocks | $428,476,856 | $427,104,100 | $1,372,756 | $-- |
| Money Market Funds | 1,742,925 | 1,742,925 | -- | -- |
| Total Investments in Securities: | $430,219,781 | $428,847,025 | $1,372,756 | $-- |
See accompanying notes which are an integral part of the financial statements.
Consumer Discretionary Portfolio
Financial Statements
Statement of Assets and Liabilities
| | | February 28, 2019 |
| Assets | | |
Investment in securities, at value (including securities loaned of $1,694,350) — See accompanying schedule:
Unaffiliated issuers (cost $331,237,038) | $428,476,856 | |
| Fidelity Central Funds (cost $1,742,925) | 1,742,925 | |
| Total Investment in Securities (cost $332,979,963) | | $430,219,781 |
| Receivable for investments sold | | 6,936,313 |
| Receivable for fund shares sold | | 488,837 |
| Dividends receivable | | 309,726 |
| Distributions receivable from Fidelity Central Funds | | 3,063 |
| Prepaid expenses | | 6,491 |
| Other receivables | | 17,600 |
| Total assets | | 437,981,811 |
| Liabilities | | |
| Payable to custodian bank | $428,971 | |
| Payable for investments purchased | 1,754,374 | |
| Payable for fund shares redeemed | 565,307 | |
| Accrued management fee | 194,343 | |
| Other affiliated payables | 73,733 | |
| Other payables and accrued expenses | 38,035 | |
| Collateral on securities loaned | 1,739,000 | |
| Total liabilities | | 4,793,763 |
| Net Assets | | $433,188,048 |
| Net Assets consist of: | | |
| Paid in capital | | $333,604,749 |
| Total distributable earnings (loss) | | 99,583,299 |
| Net Assets, for 9,775,559 shares outstanding | | $433,188,048 |
| Net Asset Value, offering price and redemption price per share ($433,188,048 ÷ 9,775,559 shares) | | $44.31 |
See accompanying notes which are an integral part of the financial statements.
Statement of Operations
| | | Year ended February 28, 2019 |
| Investment Income | | |
| Dividends | | $4,822,330 |
| Income from Fidelity Central Funds (including $86,587 from security lending) | | 132,356 |
| Total income | | 4,954,686 |
| Expenses | | |
| Management fee | $2,547,770 | |
| Transfer agent fees | 798,043 | |
| Accounting and security lending fees | 181,873 | |
| Custodian fees and expenses | 19,454 | |
| Independent trustees' fees and expenses | 2,837 | |
| Registration fees | 46,153 | |
| Audit | 47,137 | |
| Legal | 6,271 | |
| Interest | 4,715 | |
| Miscellaneous | 7,713 | |
| Total expenses before reductions | 3,661,966 | |
| Expense reductions | (4,905) | |
| Total expenses after reductions | | 3,657,061 |
| Net investment income (loss) | | 1,297,625 |
| Realized and Unrealized Gain (Loss) | | |
| Net realized gain (loss) on: | | |
| Investment securities: | | |
| Unaffiliated issuers | 11,055,553 | |
| Redemptions in-kind with affiliated entities | 132,629,032 | |
| Fidelity Central Funds | (45) | |
| Foreign currency transactions | (619) | |
| Total net realized gain (loss) | | 143,683,921 |
| Change in net unrealized appreciation (depreciation) on: | | |
| Investment securities: | | |
| Unaffiliated issuers | (143,505,909) | |
| Assets and liabilities in foreign currencies | (1,600) | |
| Total change in net unrealized appreciation (depreciation) | | (143,507,509) |
| Net gain (loss) | | 176,412 |
| Net increase (decrease) in net assets resulting from operations | | $1,474,037 |
See accompanying notes which are an integral part of the financial statements.
Statement of Changes in Net Assets
| | Year ended February 28, 2019 | Year ended February 28, 2018 |
| Increase (Decrease) in Net Assets | | |
| Operations | | |
| Net investment income (loss) | $1,297,625 | $2,999,236 |
| Net realized gain (loss) | 143,683,921 | 45,712,325 |
| Change in net unrealized appreciation (depreciation) | (143,507,509) | 102,452,213 |
| Net increase (decrease) in net assets resulting from operations | 1,474,037 | 151,163,774 |
| Distributions to shareholders | (19,190,653) | – |
| Distributions to shareholders from net investment income | – | (2,342,887) |
| Distributions to shareholders from net realized gain | – | (26,353,209) |
| Total distributions | (19,190,653) | (28,696,096) |
| Share transactions | | |
| Proceeds from sales of shares | 214,831,882 | 143,731,533 |
| Reinvestment of distributions | 18,576,766 | 28,101,673 |
| Cost of shares redeemed | (602,441,033) | (303,355,779) |
| Net increase (decrease) in net assets resulting from share transactions | (369,032,385) | (131,522,573) |
| Total increase (decrease) in net assets | (386,749,001) | (9,054,895) |
| Net Assets | | |
| Beginning of period | 819,937,049 | 828,991,944 |
| End of period | $433,188,048 | $819,937,049 |
| Other Information | | |
| Undistributed net investment income end of period | | $228,222 |
| Shares | | |
| Sold | 4,770,097 | 3,475,740 |
| Issued in reinvestment of distributions | 447,659 | 683,905 |
| Redeemed | (14,225,363) | (7,779,213) |
| Net increase (decrease) | (9,007,607) | (3,619,568) |
See accompanying notes which are an integral part of the financial statements.
Financial Highlights
Consumer Discretionary Portfolio
| | | | | | |
| Years ended February 28, | 2019 | 2018 | 2017 | 2016 A | 2015 |
| Selected Per–Share Data | | | | | |
| Net asset value, beginning of period | $43.65 | $37.00 | $32.38 | $35.23 | $33.30 |
| Income from Investment Operations | | | | | |
| Net investment income (loss)B | .12 | .16 | .21 | .24 | .15 |
| Net realized and unrealized gain (loss) | 1.87 | 8.17 | 4.73 | (1.79) | 4.39 |
| Total from investment operations | 1.99 | 8.33 | 4.94 | (1.55) | 4.54 |
| Distributions from net investment income | (.15) | (.14) | (.32) | (.18) | (.11) |
| Distributions from net realized gain | (1.18) | (1.54) | – | (1.13) | (2.51) |
| Total distributions | (1.33) | (1.68) | (.32) | (1.30)C | (2.61)D |
| Redemption fees added to paid in capitalB | – | – | –E | –E | –E |
| Net asset value, end of period | $44.31 | $43.65 | $37.00 | $32.38 | $35.23 |
| Total ReturnF | 4.81% | 22.79% | 15.29% | (4.60)% | 14.79% |
| Ratios to Average Net AssetsG,H | | | | | |
| Expenses before reductions | .78% | .78% | .76% | .77% | .79% |
| Expenses net of fee waivers, if any | .77% | .78% | .76% | .77% | .79% |
| Expenses net of all reductions | .77% | .77% | .76% | .76% | .79% |
| Net investment income (loss) | .27% | .40% | .60% | .71% | .46% |
| Supplemental Data | | | | | |
| Net assets, end of period (000 omitted) | $433,188 | $819,937 | $828,992 | $1,119,021 | $1,078,988 |
| Portfolio turnover rateI | 46%J | 74% | 39%J | 69% | 109%J |
A For the year ended February 29.
B Calculated based on average shares outstanding during the period.
C Total distributions of $1.30 per share is comprised of distributions from net investment income of $.175 and distributions from net realized gain of $1.126 per share.
D Total distributions of $2.61 per share is comprised of distributions from net investment income of $.105 and distributions from net realized gain of $2.508 per share.
E Amount represents less than $.005 per share.
F Total returns would have been lower if certain expenses had not been reduced during the applicable periods shown.
G Fees and expenses of any underlying Fidelity Central Funds are not included in the Fund's expense ratio. The Fund indirectly bears its proportionate share of the expenses of any underlying Fidelity Central Funds.
H Expense ratios reflect operating expenses of the Fund. Expenses before reductions do not reflect amounts reimbursed by the investment adviser or reductions from brokerage service arrangements or reductions from other expense offset arrangements and do not represent the amount paid by the Fund during periods when reimbursements or reductions occur. Expenses net of fee waivers reflect expenses after reimbursement by the investment adviser but prior to reductions from brokerage service arrangements or other expense offset arrangements. Expenses net of all reductions represent the net expenses paid by the Fund.
I Amount does not include the portfolio activity of any underlying Fidelity Central Funds.
J Portfolio turnover rate excludes securities received or delivered in-kind.
See accompanying notes which are an integral part of the financial statements.
Leisure Portfolio
Performance: The Bottom Line
Average annual total return reflects the change in the value of an investment, assuming reinvestment of distributions from dividend income and capital gains (the profits earned upon the sale of securities that have grown in value, if any) and assuming a constant rate of performance each year. The hypothetical investment and the average annual total returns do not reflect the deduction of taxes that a shareholder would pay on fund distributions or the redemption of fund shares. During periods of reimbursement by Fidelity, a fund’s total return will be greater than it would be had the reimbursement not occurred. How a fund did yesterday is no guarantee of how it will do tomorrow.
Average Annual Total Returns
| For the periods ended February 28, 2019 | Past 1 year | Past 5 years | Past 10 years |
| Leisure Portfolio | 4.48% | 9.59% | 18.25% |
$10,000 Over 10 Years
Let's say hypothetically that $10,000 was invested in Leisure Portfolio on February 28, 2009.
The chart shows how the value of your investment would have changed, and also shows how the S&P 500® Index performed over the same period.
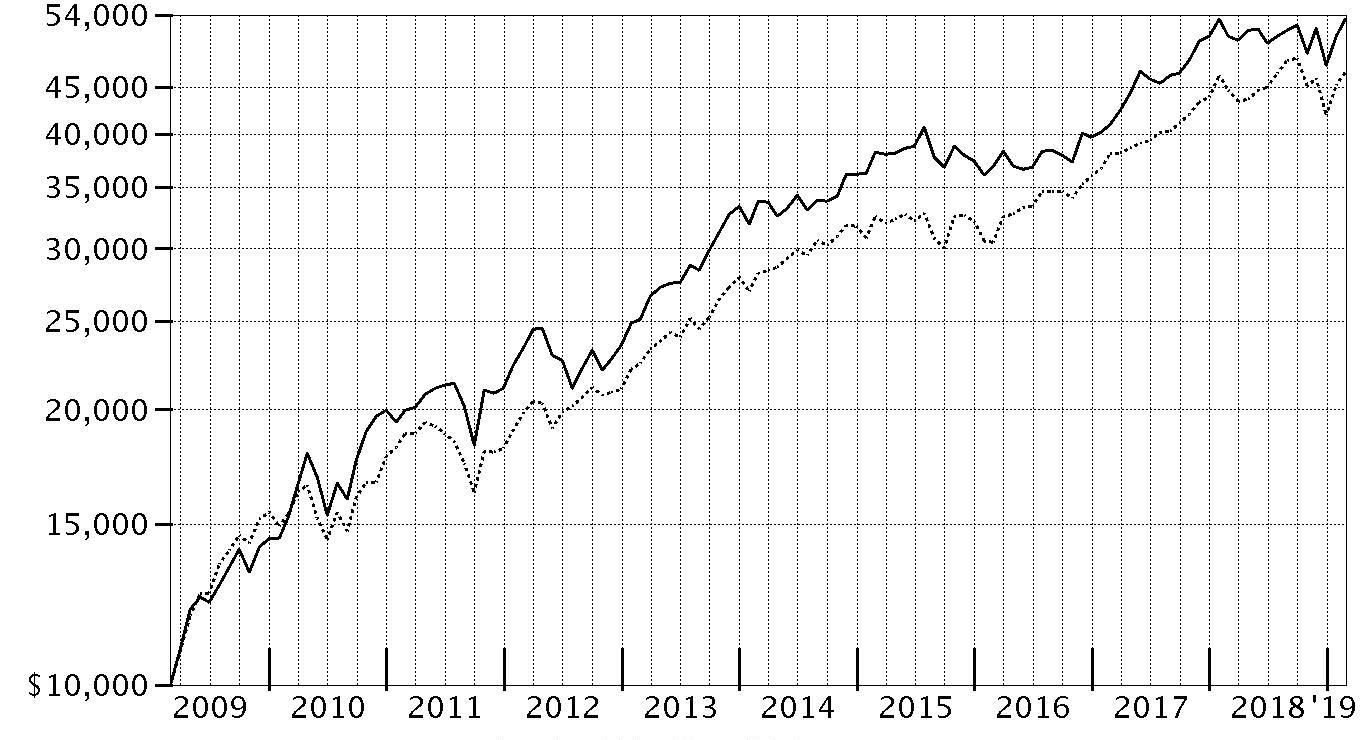
| Period Ending Values |
| $53,451 | Leisure Portfolio |
| $46,739 | S&P 500® Index |
Leisure Portfolio
Management's Discussion of Fund Performance
Market Recap: The S&P 500
® index gained 4.68% for the 12 months ending February 28, 2019, as the U.S. equity bellwether began the new year on a high note after enduring a final quarter of 2018 in which resurgent volatility upset the aging bull market. In October, rising U.S. Treasury yields and concern about peaking corporate earnings growth sent many investors fleeing from risk assets as they were still dealing with lingering uncertainty related to global trade and the U.S. Federal Reserve picking up the pace of interest rate hikes. The index returned -6.84% in October, at the time its largest monthly drop in seven years. But conditions worsened through Christmas, as jitters about the economy and another hike in rates led to a spike in market volatility and a -9.03% result for December. Sharply reversing course to begin 2019, the S&P 500
® gained 11.48% year-to-date, its strongest two-month opening since 1991, amid upbeat company earnings/outlooks and signs the Fed may pause on rates. For the full period, some economically sensitive sectors fared worst, with financials (-6%) and materials (-6%) both losing ground. Energy gained 1%, while communication services and industrials each rose roughly 2%. In contrast, the defensive utilities (+20%), real estate (+20%) and health care (+11%) sectors led the way, while consumer staples finished near the index. Information technology and consumer discretionary were rattled in the late-2018 downturn, but earlier strength contributed to advances of 9% and roughly 7%, respectively.
Comments from Portfolio Manager Rebecca Baker: For the fiscal year, the fund gained 4.48%, trailing the 7.83% advance of the MSCI U.S. IMI Consumer Services 25/50 Index and roughly in line with the broad-based S&P 500. Leisure stocks outpaced the broader U.S. equity market the past 12 months, benefiting from positive consumer trends, including strong confidence, low unemployment and rising wages. Interest rates, though rising, remained low and supportive of consumer borrowing and spending. In addition, investors were largely confident that individual and corporate tax reform could continue to boost consumer spending. Versus the MSCI industry index, security selection and an overweighting in the hotels, resorts & cruise lines group detracted most. Here, the fund's sizable investment in resorts company Hilton Grand Vacations was our biggest individual relative detractor, as our stake in the timeshare operator returned -27% largely due to the firm’s accounting issues. Untimely ownership of weight loss management firm Weight Watchers was another detractor, with the fund’s position returning -71% after we established it this period. Conversely, choices in casinos & gaming and leisure facilities contributed to our relative result. An overweighting in popular gym line Planet Fitness gained 59% and was the fund's biggest individual contributor. Planet Fitness continued to benefit from growing consumer interest in healthy living. Positioning in casino and hotel operator Wynn Resorts also added value, as we added to our exposure here the past 12 months, moving to an overweighting by February 28.
The views expressed above reflect those of the portfolio manager(s) only through the end of the period as stated on the cover of this report and do not necessarily represent the views of Fidelity or any other person in the Fidelity organization. Any such views are subject to change at any time based upon market or other conditions and Fidelity disclaims any responsibility to update such views. These views may not be relied on as investment advice and, because investment decisions for a Fidelity fund are based on numerous factors, may not be relied on as an indication of trading intent on behalf of any Fidelity fund.
Note to shareholders: On March 1, 2018, Rebecca Baker was named sole Portfolio Manager, succeeding Katherine Shaw.
Leisure Portfolio
Investment Summary (Unaudited)
Top Ten Stocks as of February 28, 2019
| | % of fund's net assets |
| McDonald's Corp. | 22.8 |
| Starbucks Corp. | 10.4 |
| Marriott International, Inc. Class A | 6.9 |
| Yum! Brands, Inc. | 6.0 |
| Royal Caribbean Cruises Ltd. | 4.7 |
| Hilton Worldwide Holdings, Inc. | 4.5 |
| Las Vegas Sands Corp. | 3.0 |
| Hilton Grand Vacations, Inc. | 3.0 |
| Wynn Resorts Ltd. | 2.9 |
| Planet Fitness, Inc. | 2.8 |
| | 67.0 |
Top Industries (% of fund's net assets)
| As of February 28, 2019 |
| | Hotels, Restaurants & Leisure | 90.7% |
| | Diversified Consumer Services | 4.9% |
| | Internet & Direct Marketing Retail | 1.1% |
| | Software | 0.6% |
| | Food & Staples Retailing | 0.5% |
| | All Others* | 2.2% |

* Includes short-term investments and net other assets (liabilities).
Leisure Portfolio
Schedule of Investments February 28, 2019
Showing Percentage of Net Assets
| Common Stocks - 98.6% | | | |
| | | Shares | Value |
| Diversified Consumer Services - 4.9% | | | |
| Education Services - 4.6% | | | |
| Bright Horizons Family Solutions, Inc. (a) | | 65,500 | $8,122,000 |
| Chegg, Inc. (a) | | 90,100 | 3,570,663 |
| Grand Canyon Education, Inc. (a) | | 85,300 | 9,867,504 |
| | | | 21,560,167 |
| Specialized Consumer Services - 0.3% | | | |
| ServiceMaster Global Holdings, Inc. (a) | | 22,934 | 1,035,699 |
| Weight Watchers International, Inc. (a) | | 26,300 | 532,049 |
| | | | 1,567,748 |
|
| TOTAL DIVERSIFIED CONSUMER SERVICES | | | 23,127,915 |
|
| Equity Real Estate Investment Trusts (REITs) - 0.3% | | | |
| Diversified REITs - 0.3% | | | |
| Haymaker Acquisition Corp. Class A (a) | | 129,900 | 1,328,877 |
| Food & Staples Retailing - 0.5% | | | |
| Food Distributors - 0.5% | | | |
| Performance Food Group Co. (a) | | 57,500 | 2,215,475 |
| Hotels, Restaurants & Leisure - 90.7% | | | |
| Casinos & Gaming - 11.5% | | | |
| Boyd Gaming Corp. | | 143,500 | 4,270,560 |
| Caesars Entertainment Corp. (a)(b) | | 269,600 | 2,323,952 |
| Eldorado Resorts, Inc. (a) | | 215,800 | 10,403,718 |
| Las Vegas Sands Corp. | | 229,308 | 14,086,390 |
| MGM Mirage, Inc. | | 223,500 | 5,978,625 |
| Penn National Gaming, Inc. (a) | | 50,227 | 1,248,141 |
| Red Rock Resorts, Inc. | | 44,200 | 1,242,904 |
| Scientific Games Corp. Class A (a) | | 40,500 | 1,176,930 |
| Wynn Resorts Ltd. | | 107,100 | 13,552,434 |
| | | | 54,283,654 |
| Hotels, Resorts & Cruise Lines - 29.2% | | | |
| Bluegreen Vacations Corp. | | 23,700 | 310,233 |
| Carnival Corp. | | 200,400 | 11,575,104 |
| Hilton Grand Vacations, Inc. (a) | | 438,212 | 13,930,759 |
| Hilton Worldwide Holdings, Inc. | | 256,797 | 21,339,831 |
| Hyatt Hotels Corp. Class A | | 26,200 | 1,906,574 |
| Marriott International, Inc. Class A | | 260,093 | 32,581,850 |
| Marriott Vacations Worldwide Corp. | | 96,797 | 9,422,220 |
| Norwegian Cruise Line Holdings Ltd. (a) | | 190,900 | 10,600,677 |
| Royal Caribbean Cruises Ltd. | | 188,890 | 22,379,687 |
| Wyndham Destinations, Inc. | | 130,314 | 5,868,039 |
| Wyndham Hotels & Resorts, Inc. | | 155,914 | 8,196,399 |
| | | | 138,111,373 |
| Leisure Facilities - 3.6% | | | |
| Planet Fitness, Inc. (a) | | 221,000 | 12,990,380 |
| Vail Resorts, Inc. | | 18,978 | 3,954,825 |
| | | | 16,945,205 |
| Restaurants - 46.4% | | | |
| ARAMARK Holdings Corp. | | 163,500 | 4,954,050 |
| Chipotle Mexican Grill, Inc. (a) | | 20,650 | 12,545,495 |
| Dave & Buster's Entertainment, Inc. | | 22,200 | 1,139,526 |
| Del Frisco's Restaurant Group, Inc. (a) | | 144,200 | 1,221,374 |
| Domino's Pizza, Inc. | | 16,900 | 4,240,886 |
| McDonald's Corp. | | 586,208 | 107,768,480 |
| Restaurant Brands International, Inc. | | 59,500 | 3,762,749 |
| Shake Shack, Inc. Class A (a) | | 23,000 | 1,268,220 |
| Starbucks Corp. | | 701,100 | 49,259,286 |
| Wendy's Co. | | 288,600 | 5,001,438 |
| Yum! Brands, Inc. | | 300,716 | 28,417,662 |
| | | | 219,579,166 |
|
| TOTAL HOTELS, RESTAURANTS & LEISURE | | | 428,919,398 |
|
| Interactive Media & Services - 0.3% | | | |
| Interactive Media & Services - 0.3% | | | |
| Alphabet, Inc. Class A (a) | | 1,500 | 1,689,825 |
| Internet & Direct Marketing Retail - 1.1% | | | |
| Internet & Direct Marketing Retail - 1.1% | | | |
| GrubHub, Inc. (a) | | 2,400 | 195,792 |
| The Booking Holdings, Inc. (a) | | 2,900 | 4,921,416 |
| | | | 5,117,208 |
| Multiline Retail - 0.2% | | | |
| General Merchandise Stores - 0.2% | | | |
| Dollar Tree, Inc. (a) | | 8,700 | 838,071 |
| Software - 0.6% | | | |
| Application Software - 0.6% | | | |
| 2U, Inc. (a)(b) | | 40,824 | 3,008,729 |
| TOTAL COMMON STOCKS | | | |
| (Cost $302,404,851) | | | 466,245,498 |
|
| Money Market Funds - 1.2% | | | |
| Fidelity Cash Central Fund, 2.44% (c) | | 3,468,850 | 3,469,544 |
| Fidelity Securities Lending Cash Central Fund 2.45% (c)(d) | | 2,280,623 | 2,280,851 |
| TOTAL MONEY MARKET FUNDS | | | |
| (Cost $5,750,395) | | | 5,750,395 |
| TOTAL INVESTMENT IN SECURITIES - 99.8% | | | |
| (Cost $308,155,246) | | | 471,995,893 |
| NET OTHER ASSETS (LIABILITIES) - 0.2% | | | 927,025 |
| NET ASSETS - 100% | | | $472,922,918 |
Legend
(a) Non-income producing
(b) Security or a portion of the security is on loan at period end.
(c) Affiliated fund that is generally available only to investment companies and other accounts managed by Fidelity Investments. The rate quoted is the annualized seven-day yield of the fund at period end. A complete unaudited listing of the fund's holdings as of its most recent quarter end is available upon request. In addition, each Fidelity Central Fund's financial statements, which are not covered by the Fund's Report of Independent Registered Public Accounting Firm, are available on the SEC's website or upon request.
(d) Investment made with cash collateral received from securities on loan.
Affiliated Central Funds
Information regarding fiscal year to date income earned by the Fund from investments in Fidelity Central Funds is as follows:
| Fund | Income earned |
| Fidelity Cash Central Fund | $14,856 |
| Fidelity Securities Lending Cash Central Fund | 24,594 |
| Total | $39,450 |
Amounts in the income column in the above table include any capital gain distributions from underlying funds, which are presented in the corresponding line-item in the Statement of Operations, if applicable.
Investment Valuation
All investments are categorized as Level 1 under the Fair Value Hierarchy. The inputs or methodology used for valuing securities may not be an indication of the risk associated with investing in those securities. For more information on valuation inputs please refer to the Investment Valuation section in the accompanying Notes to Financial Statements.
Other Information
Distribution of investments by country or territory of incorporation, as a percentage of Total Net Assets, is as follows (Unaudited):
| United States of America | 89.8% |
| Liberia | 4.7% |
| Panama | 2.5% |
| Bermuda | 2.2% |
| Others (Individually Less Than 1%) | 0.8% |
| | 100.0% |
See accompanying notes which are an integral part of the financial statements.
Leisure Portfolio
Financial Statements
Statement of Assets and Liabilities
| | | February 28, 2019 |
| Assets | | |
Investment in securities, at value (including securities loaned of $2,212,974) — See accompanying schedule:
Unaffiliated issuers (cost $302,404,851) | $466,245,498 | |
| Fidelity Central Funds (cost $5,750,395) | 5,750,395 | |
| Total Investment in Securities (cost $308,155,246) | | $471,995,893 |
| Foreign currency held at value (cost $529) | | 547 |
| Receivable for fund shares sold | | 6,624,285 |
| Dividends receivable | | 1,125,563 |
| Distributions receivable from Fidelity Central Funds | | 2,965 |
| Prepaid expenses | | 4,542 |
| Total assets | | 479,753,795 |
| Liabilities | | |
| Payable for investments purchased | $3,963,958 | |
| Payable for fund shares redeemed | 281,078 | |
| Accrued management fee | 202,332 | |
| Other affiliated payables | 74,815 | |
| Other payables and accrued expenses | 35,051 | |
| Collateral on securities loaned | 2,273,643 | |
| Total liabilities | | 6,830,877 |
| Net Assets | | $472,922,918 |
| Net Assets consist of: | | |
| Paid in capital | | $311,310,996 |
| Total distributable earnings (loss) | | 161,611,922 |
| Net Assets, for 32,537,210 shares outstanding | | $472,922,918 |
| Net Asset Value, offering price and redemption price per share ($472,922,918 ÷ 32,537,210 shares) | | $14.53 |
See accompanying notes which are an integral part of the financial statements.
Statement of Operations
| | | Year ended February 28, 2019 |
| Investment Income | | |
| Dividends | | $8,610,346 |
| Income from Fidelity Central Funds (including $24,594 from security lending) | | 39,450 |
| Total income | | 8,649,796 |
| Expenses | | |
| Management fee | $2,578,371 | |
| Transfer agent fees | 786,344 | |
| Accounting and security lending fees | 186,669 | |
| Custodian fees and expenses | 9,441 | |
| Independent trustees' fees and expenses | 2,717 | |
| Registration fees | 34,402 | |
| Audit | 41,955 | |
| Legal | 5,431 | |
| Interest | 1,413 | |
| Miscellaneous | 3,844 | |
| Total expenses before reductions | 3,650,587 | |
| Expense reductions | (26,033) | |
| Total expenses after reductions | | 3,624,554 |
| Net investment income (loss) | | 5,025,242 |
| Realized and Unrealized Gain (Loss) | | |
| Net realized gain (loss) on: | | |
| Investment securities: | | |
| Unaffiliated issuers | 52,535,010 | |
| Fidelity Central Funds | 253 | |
| Foreign currency transactions | (598) | |
| Total net realized gain (loss) | | 52,534,665 |
| Change in net unrealized appreciation (depreciation) on: | | |
| Investment securities: | | |
| Unaffiliated issuers | (39,364,156) | |
| Fidelity Central Funds | 844 | |
| Assets and liabilities in foreign currencies | 18 | |
| Total change in net unrealized appreciation (depreciation) | | (39,363,294) |
| Net gain (loss) | | 13,171,371 |
| Net increase (decrease) in net assets resulting from operations | | $18,196,613 |
See accompanying notes which are an integral part of the financial statements.
Statement of Changes in Net Assets
| | Year ended February 28, 2019 | Year ended February 28, 2018 |
| Increase (Decrease) in Net Assets | | |
| Operations | | |
| Net investment income (loss) | $5,025,242 | $5,536,085 |
| Net realized gain (loss) | 52,534,665 | 64,226,711 |
| Change in net unrealized appreciation (depreciation) | (39,363,294) | 31,870,985 |
| Net increase (decrease) in net assets resulting from operations | 18,196,613 | 101,633,781 |
| Distributions to shareholders | (78,505,520) | – |
| Distributions to shareholders from net investment income | – | (4,166,156) |
| Distributions to shareholders from net realized gain | – | (27,657,199) |
| Total distributions | (78,505,520) | (31,823,355) |
| Share transactions | | |
| Proceeds from sales of shares | 71,865,525 | 243,148,042 |
| Reinvestment of distributions | 73,488,183 | 29,908,337 |
| Cost of shares redeemed | (156,662,466) | (201,277,044) |
| Net increase (decrease) in net assets resulting from share transactions | (11,308,758) | 71,779,335 |
| Redemption fees | 955 | 9,285 |
| Total increase (decrease) in net assets | (71,616,710) | 141,599,046 |
| Net Assets | | |
| Beginning of period | 544,539,628 | 402,940,582 |
| End of period | $472,922,918 | $544,539,628 |
| Other Information | | |
| Undistributed net investment income end of period | $– | $962,291 |
| Shares | | |
| Sold | 4,800,836 | 15,077,750 |
| Issued in reinvestment of distributions | 5,206,751 | 1,813,140 |
| Redeemed | (10,316,567) | (12,547,940) |
| Net increase (decrease) | (308,980) | 4,342,950 |
See accompanying notes which are an integral part of the financial statements.
Financial Highlights
Leisure Portfolio
| | | | | | |
| Years ended February 28, | 2019 | 2018 | 2017 | 2016 A | 2015 |
| Selected Per–Share DataB | | | | | |
| Net asset value, beginning of period | $16.58 | $14.14 | $12.83 | $14.01 | $13.51 |
| Income from Investment Operations | | | | | |
| Net investment income (loss)C | .16 | .18 | .16 | .15 | .13 |
| Net realized and unrealized gain (loss) | .39 | 3.31 | 1.29 | (.62) | 1.48 |
| Total from investment operations | .55 | 3.49 | 1.45 | (.47) | 1.61 |
| Distributions from net investment income | (.16) | (.14) | (.14) | (.13) | (.15) |
| Distributions from net realized gain | (2.44) | (.91) | – | (.58) | (.96) |
| Total distributions | (2.60) | (1.05) | (.14) | (.71) | (1.11) |
| Redemption fees added to paid in capitalC,D | – | – | – | – | – |
| Net asset value, end of period | $14.53 | $16.58 | $14.14 | $12.83 | $14.01 |
| Total ReturnE | 4.48% | 24.75% | 11.26% | (3.48)% | 12.91% |
| Ratios to Average Net AssetsF,G | | | | | |
| Expenses before reductions | .76% | .77% | .80% | .79% | .80% |
| Expenses net of fee waivers, if any | .76% | .77% | .79% | .79% | .80% |
| Expenses net of all reductions | .76% | .77% | .79% | .78% | .80% |
| Net investment income (loss) | 1.05% | 1.09% | 1.17% | 1.08% | 1.00% |
| Supplemental Data | | | | | |
| Net assets, end of period (000 omitted) | $472,923 | $544,540 | $402,941 | $416,771 | $445,296 |
| Portfolio turnover rateH | 41% | 56% | 23% | 48% | 32%I |
A For the year ended February 29.
B Per share amounts have been adjusted to reflect the impact of the 10 for 1 share split that occurred on August 10, 2018.
C Calculated based on average shares outstanding during the period.
D Amount represents less than $.005 per share.
E Total returns would have been lower if certain expenses had not been reduced during the applicable periods shown.
F Fees and expenses of any underlying Fidelity Central Funds are not included in the Fund's expense ratio. The Fund indirectly bears its proportionate share of the expenses of any underlying Fidelity Central Funds.
G Expense ratios reflect operating expenses of the Fund. Expenses before reductions do not reflect amounts reimbursed by the investment adviser or reductions from brokerage service arrangements or reductions from other expense offset arrangements and do not represent the amount paid by the Fund during periods when reimbursements or reductions occur. Expenses net of fee waivers reflect expenses after reimbursement by the investment adviser but prior to reductions from brokerage service arrangements or other expense offset arrangements. Expenses net of all reductions represent the net expenses paid by the Fund.
H Amount does not include the portfolio activity of any underlying Fidelity Central Funds.
I Portfolio turnover rate excludes securities received or delivered in-kind.
See accompanying notes which are an integral part of the financial statements.
Retailing Portfolio
Performance: The Bottom Line
Average annual total return reflects the change in the value of an investment, assuming reinvestment of distributions from dividend income and capital gains (the profits earned upon the sale of securities that have grown in value, if any) and assuming a constant rate of performance each year. The hypothetical investment and the average annual total returns do not reflect the deduction of taxes that a shareholder would pay on fund distributions or the redemption of fund shares. During periods of reimbursement by Fidelity, a fund’s total return will be greater than it would be had the reimbursement not occurred. How a fund did yesterday is no guarantee of how it will do tomorrow.
Average Annual Total Returns
| For the periods ended February 28, 2019 | Past 1 year | Past 5 years | Past 10 years |
| Retailing Portfolio | 6.83% | 14.71% | 23.32% |
$10,000 Over 10 Years
Let's say hypothetically that $10,000 was invested in Retailing Portfolio on February 28, 2009.
The chart shows how the value of your investment would have changed, and also shows how the S&P 500® Index performed over the same period.
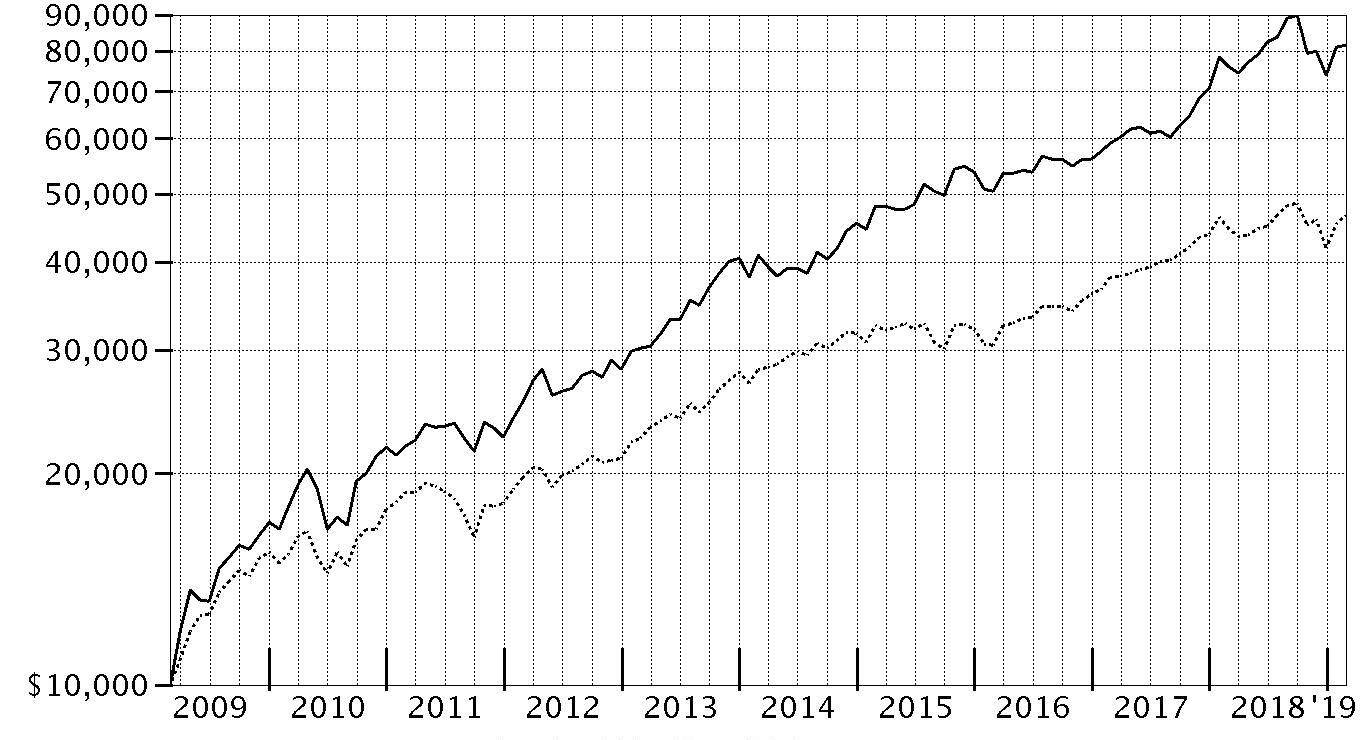
| Period Ending Values |
| $81,368 | Retailing Portfolio |
| $46,739 | S&P 500® Index |
Retailing Portfolio
Management's Discussion of Fund Performance
Market Recap: The S&P 500
® index gained 4.68% for the 12 months ending February 28, 2019, as the U.S. equity bellwether began the new year on a high note after enduring a final quarter of 2018 in which resurgent volatility upset the aging bull market. In October, rising U.S. Treasury yields and concern about peaking corporate earnings growth sent many investors fleeing from risk assets as they were still dealing with lingering uncertainty related to global trade and the U.S. Federal Reserve picking up the pace of interest rate hikes. The index returned -6.84% in October, at the time its largest monthly drop in seven years. But conditions worsened through Christmas, as jitters about the economy and another hike in rates led to a spike in market volatility and a -9.03% result for December. Sharply reversing course to begin 2019, the S&P 500
® gained 11.48% year-to-date, its strongest two-month opening since 1991, amid upbeat company earnings/outlooks and signs the Fed may pause on rates. For the full period, some economically sensitive sectors fared worst, with financials (-6%) and materials (-6%) both losing ground. Energy gained 1%, while communication services and industrials each rose roughly 2%. In contrast, the defensive utilities (+20%), real estate (+20%) and health care (+11%) sectors led the way, while consumer staples finished near the index. Information technology and consumer discretionary were rattled in the late-2018 downturn, but earlier strength contributed to advances of 9% and roughly 7%, respectively.
Comments from Portfolio Manager Boris Shepov: For the fiscal year, the fund gained 6.83%, trailing the 7.85% return of the MSCI U.S. IMI Retailing 25/50 Index, but outperforming the broad-based S&P 500
® index. Versus the MSCI industry index, stock selection in the internet & direct marketing retail group was the fund’s largest detractor the past 12 months, followed by picks in apparel, accessories & luxury goods. Not owning furniture and home goods online retailer Wayfair, an index component that gained 114%, was the biggest individual relative detractor. While I would’ve preferred to own Wayfair, there were internal capacity limits and regulatory considerations that constrained my ability to do so. An out-of-index stake in apparel company PVH (-26%), established this period, also hurt our relative result. The fund's position in cash – representing roughly 2% of assets, on average – detracted in an environment of positive equity markets. On the plus side, timely ownership of retailer Signet Jewelers, whose brands include Kay, Jared, Zales and others, was the leading contributor due to our position’s 22% gain prior to be eliminated from the fund. Lastly, an overweighting in Dollar General rose about 27%, further bolstering our relative result due to strong organic growth. Dollar General was among the fund’s largest holdings at the end of the fiscal year.
The views expressed above reflect those of the portfolio manager(s) only through the end of the period as stated on the cover of this report and do not necessarily represent the views of Fidelity or any other person in the Fidelity organization. Any such views are subject to change at any time based upon market or other conditions and Fidelity disclaims any responsibility to update such views. These views may not be relied on as investment advice and, because investment decisions for a Fidelity fund are based on numerous factors, may not be relied on as an indication of trading intent on behalf of any Fidelity fund.
Notes to Shareholders: On December 1, 2018, Nicola Stafford transitioned off of the fund, leaving Boris Shepov, who had assumed co-management responsibilities for the fund on May 1, 2018, as sole Portfolio Manager.
Retailing Portfolio
Investment Summary (Unaudited)
Top Ten Stocks as of February 28, 2019
| | % of fund's net assets |
| Amazon.com, Inc. | 23.6 |
| Home Depot, Inc. | 15.0 |
| Lowe's Companies, Inc. | 7.0 |
| TJX Companies, Inc. | 5.0 |
| The Booking Holdings, Inc. | 4.4 |
| Dollar General Corp. | 4.1 |
| Dollar Tree, Inc. | 3.6 |
| Ross Stores, Inc. | 3.5 |
| O'Reilly Automotive, Inc. | 2.7 |
| AutoZone, Inc. | 2.3 |
| | 71.2 |
Top Industries (% of fund's net assets)
| As of February 28, 2019 |
| | Specialty Retail | 44.0% |
| | Internet & Direct Marketing Retail | 32.5% |
| | Multiline Retail | 9.6% |
| | Textiles, Apparel & Luxury Goods | 4.2% |
| | Food & Staples Retailing | 3.5% |
| | All Others* | 6.2% |

* Includes short-term investments and net other assets (liabilities).
Retailing Portfolio
Schedule of Investments February 28, 2019
Showing Percentage of Net Assets
| Common Stocks - 99.4% | | | |
| | | Shares | Value |
| Distributors - 1.1% | | | |
| Distributors - 1.1% | | | |
| LKQ Corp. (a) | | 1,241,400 | $34,386,780 |
| Food & Staples Retailing - 3.5% | | | |
| Food Retail - 1.0% | | | |
| Kroger Co. | | 1,002,600 | 29,406,258 |
| Hypermarkets & Super Centers - 2.5% | | | |
| BJ's Wholesale Club Holdings, Inc. | | 2,289,792 | 57,977,533 |
| Walmart, Inc. | | 180,500 | 17,867,695 |
| | | | 75,845,228 |
|
| TOTAL FOOD & STAPLES RETAILING | | | 105,251,486 |
|
| Health Care Providers & Services - 0.6% | | | |
| Health Care Services - 0.6% | | | |
| CVS Health Corp. | | 314,000 | 18,158,620 |
| Hotels, Restaurants & Leisure - 1.5% | | | |
| Hotels, Resorts & Cruise Lines - 0.2% | | | |
| Hilton Grand Vacations, Inc. (a) | | 183,300 | 5,827,107 |
| Leisure Facilities - 0.3% | | | |
| Drive Shack, Inc. (a) | | 2,240,625 | 9,881,156 |
| Restaurants - 1.0% | | | |
| U.S. Foods Holding Corp. (a) | | 807,600 | 28,459,824 |
|
| TOTAL HOTELS, RESTAURANTS & LEISURE | | | 44,168,087 |
|
| Interactive Media & Services - 1.5% | | | |
| Interactive Media & Services - 1.5% | | | |
| Alphabet, Inc. Class A (a) | | 41,500 | 46,751,825 |
| Internet & Direct Marketing Retail - 32.5% | | | |
| Internet & Direct Marketing Retail - 32.5% | | | |
| Amazon.com, Inc. (a) | | 436,930 | 716,490,922 |
| eBay, Inc. | | 1,215,200 | 45,144,680 |
| Expedia, Inc. | | 131,100 | 16,165,941 |
| Liberty Interactive Corp. QVC Group Series A (a) | | 3,309,500 | 59,604,095 |
| MercadoLibre, Inc. (a) | | 31,700 | 14,543,643 |
| The Booking Holdings, Inc. (a) | | 78,580 | 133,353,403 |
| | | | 985,302,684 |
| Media - 0.5% | | | |
| Cable & Satellite - 0.5% | | | |
| Comcast Corp. Class A | | 365,500 | 14,133,885 |
| Multiline Retail - 9.6% | | | |
| Department Stores - 0.4% | | | |
| Macy's, Inc. | | 490,000 | 12,147,100 |
| General Merchandise Stores - 9.2% | | | |
| Big Lots, Inc. (b) | | 404,600 | 12,757,038 |
| Dollar General Corp. | | 1,053,500 | 124,797,610 |
| Dollar Tree, Inc. (a) | | 1,138,300 | 109,652,439 |
| Ollie's Bargain Outlet Holdings, Inc. (a) | | 111,400 | 9,827,708 |
| Target Corp. | | 321,000 | 23,317,440 |
| | | | 280,352,235 |
|
| TOTAL MULTILINE RETAIL | | | 292,499,335 |
|
| Personal Products - 0.1% | | | |
| Personal Products - 0.1% | | | |
| Coty, Inc. Class A | | 381,600 | 4,197,600 |
| Specialty Retail - 44.0% | | | |
| Apparel Retail - 10.8% | | | |
| Burlington Stores, Inc. (a) | | 258,794 | 43,927,694 |
| Ross Stores, Inc. | | 1,135,200 | 107,651,016 |
| The Children's Place Retail Stores, Inc. (b) | | 271,900 | 25,982,764 |
| TJX Companies, Inc. | | 2,954,000 | 151,510,660 |
| | | | 329,072,134 |
| Automotive Retail - 5.2% | | | |
| AutoZone, Inc. (a) | | 73,563 | 69,073,450 |
| CarMax, Inc. (a) | | 112,000 | 6,955,200 |
| O'Reilly Automotive, Inc. (a) | | 224,086 | 83,351,029 |
| | | | 159,379,679 |
| Computer & Electronics Retail - 2.0% | | | |
| Best Buy Co., Inc. | | 882,500 | 60,751,300 |
| Home Improvement Retail - 22.8% | | | |
| Floor & Decor Holdings, Inc. Class A (a)(b) | | 667,700 | 24,825,086 |
| Home Depot, Inc. | | 2,450,600 | 453,704,084 |
| Lowe's Companies, Inc. | | 2,026,800 | 212,996,412 |
| | | | 691,525,582 |
| Homefurnishing Retail - 0.2% | | | |
| At Home Group, Inc. (a) | | 211,900 | 5,187,312 |
| Specialty Stores - 3.0% | | | |
| Five Below, Inc. (a) | | 56,500 | 6,799,775 |
| Tiffany & Co., Inc. | | 600,800 | 57,100,032 |
| Ulta Beauty, Inc. (a) | | 86,600 | 27,061,634 |
| | | | 90,961,441 |
|
| TOTAL SPECIALTY RETAIL | | | 1,336,877,448 |
|
| Textiles, Apparel & Luxury Goods - 4.2% | | | |
| Apparel, Accessories & Luxury Goods - 4.2% | | | |
| adidas AG | | 69,300 | 16,837,081 |
| Capri Holdings Ltd. (a) | | 154,900 | 7,063,440 |
| lululemon athletica, Inc. (a) | | 82,757 | 12,448,308 |
| PVH Corp. | | 494,300 | 56,765,412 |
| Tapestry, Inc. | | 958,100 | 33,476,014 |
| | | | 126,590,255 |
| Trading Companies & Distributors - 0.3% | | | |
| Trading Companies & Distributors - 0.3% | | | |
| Bunzl PLC | | 234,400 | 7,377,572 |
| TOTAL COMMON STOCKS | | | |
| (Cost $1,924,978,995) | | | 3,015,695,577 |
|
| Money Market Funds - 1.4% | | | |
| Fidelity Cash Central Fund, 2.44% (c) | | 12,448,305 | 12,450,795 |
| Fidelity Securities Lending Cash Central Fund 2.45% (c)(d) | | 31,292,729 | 31,295,858 |
| TOTAL MONEY MARKET FUNDS | | | |
| (Cost $43,746,653) | | | 43,746,653 |
| TOTAL INVESTMENT IN SECURITIES - 100.8% | | | |
| (Cost $1,968,725,648) | | | 3,059,442,230 |
| NET OTHER ASSETS (LIABILITIES) - (0.8)% | | | (23,851,705) |
| NET ASSETS - 100% | | | $3,035,590,525 |
Legend
(a) Non-income producing
(b) Security or a portion of the security is on loan at period end.
(c) Affiliated fund that is generally available only to investment companies and other accounts managed by Fidelity Investments. The rate quoted is the annualized seven-day yield of the fund at period end. A complete unaudited listing of the fund's holdings as of its most recent quarter end is available upon request. In addition, each Fidelity Central Fund's financial statements, which are not covered by the Fund's Report of Independent Registered Public Accounting Firm, are available on the SEC's website or upon request.
(d) Investment made with cash collateral received from securities on loan.
Affiliated Central Funds
Information regarding fiscal year to date income earned by the Fund from investments in Fidelity Central Funds is as follows:
| Fund | Income earned |
| Fidelity Cash Central Fund | $1,085,814 |
| Fidelity Securities Lending Cash Central Fund | 30,268 |
| Total | $1,116,082 |
Amounts in the income column in the above table include any capital gain distributions from underlying funds, which are presented in the corresponding line-item in the Statement of Operations, if applicable.
Investment Valuation
All investments are categorized as Level 1 under the Fair Value Hierarchy. The inputs or methodology used for valuing securities may not be an indication of the risk associated with investing in those securities. For more information on valuation inputs please refer to the Investment Valuation section in the accompanying Notes to Financial Statements.
See accompanying notes which are an integral part of the financial statements.
Retailing Portfolio
Financial Statements
Statement of Assets and Liabilities
| | | February 28, 2019 |
| Assets | | |
Investment in securities, at value (including securities loaned of $30,382,797) — See accompanying schedule:
Unaffiliated issuers (cost $1,924,978,995) | $3,015,695,577 | |
| Fidelity Central Funds (cost $43,746,653) | 43,746,653 | |
| Total Investment in Securities (cost $1,968,725,648) | | $3,059,442,230 |
| Receivable for investments sold | | 21,654,795 |
| Receivable for fund shares sold | | 3,517,174 |
| Dividends receivable | | 1,234,135 |
| Distributions receivable from Fidelity Central Funds | | 34,625 |
| Prepaid expenses | | 19,949 |
| Other receivables | | 3,373 |
| Total assets | | 3,085,906,281 |
| Liabilities | | |
| Payable for investments purchased | $10,726,161 | |
| Payable for fund shares redeemed | 6,363,304 | |
| Accrued management fee | 1,373,933 | |
| Other affiliated payables | 517,387 | |
| Other payables and accrued expenses | 39,196 | |
| Collateral on securities loaned | 31,295,775 | |
| Total liabilities | | 50,315,756 |
| Net Assets | | $3,035,590,525 |
| Net Assets consist of: | | |
| Paid in capital | | $1,919,975,931 |
| Total distributable earnings (loss) | | 1,115,614,594 |
| Net Assets, for 202,195,590 shares outstanding | | $3,035,590,525 |
| Net Asset Value, offering price and redemption price per share ($3,035,590,525 ÷ 202,195,590 shares) | | $15.01 |
See accompanying notes which are an integral part of the financial statements.
Statement of Operations
| | | Year ended February 28, 2019 |
| Investment Income | | |
| Dividends | | $26,722,221 |
| Income from Fidelity Central Funds (including $30,268 from security lending) | | 1,116,082 |
| Total income | | 27,838,303 |
| Expenses | | |
| Management fee | $15,725,017 | |
| Transfer agent fees | 5,090,964 | |
| Accounting and security lending fees | 860,782 | |
| Custodian fees and expenses | 34,806 | |
| Independent trustees' fees and expenses | 15,771 | |
| Registration fees | 180,862 | |
| Audit | 41,785 | |
| Legal | 13,367 | |
| Interest | 18,671 | |
| Miscellaneous | 20,118 | |
| Total expenses before reductions | 22,002,143 | |
| Expense reductions | (123,869) | |
| Total expenses after reductions | | 21,878,274 |
| Net investment income (loss) | | 5,960,029 |
| Realized and Unrealized Gain (Loss) | | |
| Net realized gain (loss) on: | | |
| Investment securities: | | |
| Unaffiliated issuers | 71,844,835 | |
| Fidelity Central Funds | 3,654 | |
| Foreign currency transactions | 4,085 | |
| Total net realized gain (loss) | | 71,852,574 |
| Change in net unrealized appreciation (depreciation) on: | | |
| Investment securities: | | |
| Unaffiliated issuers | 36,475,082 | |
| Assets and liabilities in foreign currencies | (703) | |
| Total change in net unrealized appreciation (depreciation) | | 36,474,379 |
| Net gain (loss) | | 108,326,953 |
| Net increase (decrease) in net assets resulting from operations | | $114,286,982 |
See accompanying notes which are an integral part of the financial statements.
Statement of Changes in Net Assets
| | Year ended February 28, 2019 | Year ended February 28, 2018 |
| Increase (Decrease) in Net Assets | | |
| Operations | | |
| Net investment income (loss) | $5,960,029 | $5,508,530 |
| Net realized gain (loss) | 71,852,574 | 113,637,334 |
| Change in net unrealized appreciation (depreciation) | 36,474,379 | 368,019,971 |
| Net increase (decrease) in net assets resulting from operations | 114,286,982 | 487,165,835 |
| Distributions to shareholders | (56,366,884) | – |
| Distributions to shareholders from net investment income | – | (4,427,075) |
| Distributions to shareholders from net realized gain | – | (65,230,373) |
| Total distributions | (56,366,884) | (69,657,448) |
| Share transactions | | |
| Proceeds from sales of shares | 1,561,816,984 | 575,718,782 |
| Reinvestment of distributions | 53,788,995 | 66,546,015 |
| Cost of shares redeemed | (967,301,863) | (654,809,547) |
| Net increase (decrease) in net assets resulting from share transactions | 648,304,116 | (12,544,750) |
| Total increase (decrease) in net assets | 706,224,214 | 404,963,637 |
| Net Assets | | |
| Beginning of period | 2,329,366,311 | 1,924,402,674 |
| End of period | $3,035,590,525 | $2,329,366,311 |
| Other Information | | |
| Distributions in excess of net investment income end of period | $– | $(639,206) |
| Shares | | |
| Sold | 101,600,543 | 43,734,090 |
| Issued in reinvestment of distributions | 3,880,110 | 5,085,670 |
| Redeemed | (65,594,973) | (52,943,150) |
| Net increase (decrease) | 39,885,680 | (4,123,390) |
See accompanying notes which are an integral part of the financial statements.
Financial Highlights
Retailing Portfolio
| | | | | | |
| Years ended February 28, | 2019 | 2018 | 2017 | 2016A | 2015 |
| Selected Per–Share DataB | | | | | |
| Net asset value, beginning of period | $14.35 | $11.56 | $9.88 | $9.53 | $8.84 |
| Income from Investment Operations | | | | | |
| Net investment income (loss)C | .03 | .04 | .01 | .01D | .03E |
| Net realized and unrealized gain (loss) | .93 | 3.23 | 1.69 | .47 | 1.38 |
| Total from investment operations | .96 | 3.27 | 1.70 | .48 | 1.41 |
| Distributions from net investment income | (.02) | (.03) | (.02) | (.02) | (.02) |
| Distributions from net realized gain | (.27) | (.45) | – | (.11) | (.70) |
| Total distributions | (.30)F | (.48) | (.02) | (.13) | (.72) |
| Redemption fees added to paid in capitalC | – | – | –G | – | –G |
| Net asset value, end of period | $15.01 | $14.35 | $11.56 | $9.88 | $9.53 |
| Total ReturnH | 6.83% | 28.66% | 17.20% | 5.11% | 17.29% |
| Ratios to Average Net AssetsI,J | | | | | |
| Expenses before reductions | .76% | .78% | .78% | .81% | .81% |
| Expenses net of fee waivers, if any | .75% | .77% | .78% | .80% | .81% |
| Expenses net of all reductions | .75% | .77% | .78% | .80% | .81% |
| Net investment income (loss) | .20% | .29% | .07% | .14%D | .36%E |
| Supplemental Data | | | | | |
| Net assets, end of period (000 omitted) | $3,035,591 | $2,329,366 | $1,924,403 | $1,849,996 | $915,177 |
| Portfolio turnover rateK | 34% | 24% | 17% | 11% | 31% |
A For the year ended February 29.
B Per share amounts have been adjusted to reflect the impact of the 10 for 1 share split that occurred on May 11, 2018.
C Calculated based on average shares outstanding during the period.
D Net investment income per share reflects a large, non-recurring dividend which amounted to $.01 per share. Excluding this non-recurring dividend, the ratio of net investment income (loss) to average net assets would have been .02%.
E Net investment income per share reflects a large, non-recurring dividend which amounted to $.01 per share. Excluding this non-recurring dividend, the ratio of net investment income (loss) to average net assets would have been .22%.
F Total distributions of $.30 per share is comprised of distributions from net investment income of $.024 and distributions from net realized gain of $.272 per share.
G Amount represents less than $.005 per share.
H Total returns would have been lower if certain expenses had not been reduced during the applicable periods shown.
I Fees and expenses of any underlying Fidelity Central Funds are not included in the Fund's expense ratio. The Fund indirectly bears its proportionate share of the expenses of any underlying Fidelity Central Funds.
J Expense ratios reflect operating expenses of the Fund. Expenses before reductions do not reflect amounts reimbursed by the investment adviser or reductions from brokerage service arrangements or reductions from other expense offset arrangements and do not represent the amount paid by the Fund during periods when reimbursements or reductions occur. Expenses net of fee waivers reflect expenses after reimbursement by the investment adviser but prior to reductions from brokerage service arrangements or other expense offset arrangements. Expenses net of all reductions represent the net expenses paid by the Fund.
K Amount does not include the portfolio activity of any underlying Fidelity Central Funds.
See accompanying notes which are an integral part of the financial statements.
Notes to Financial Statements
For the period ended February 28, 2019
1. Organization.
Automotive Portfolio, Communication Services Portfolio (formerly Multimedia Portfolio), Construction and Housing Portfolio, Consumer Discretionary Portfolio, Leisure Portfolio, and Retailing Portfolio (the Funds) are non-diversified funds of Fidelity Select Portfolios (the Trust). The Trust is registered under the Investment Company Act of 1940, as amended (the 1940 Act), as an open-end management investment company organized as a Massachusetts business trust. Each Fund offers a single class of shares, with the exception of Communication Services Portfolio. Communication Services Portfolio offers Class A, Class M, Class C, Communication Services, Class I and Class Z shares, each of which has equal rights as to assets and voting privileges. Each class has exclusive voting rights with respect to matters that affect that class. Communication Services Portfolio commenced sale of Class A, Class M, Class C, Class I and Class Z on November 30, 2018. The Funds invest primarily in securities of companies whose principal business activities fall within specific industries. Each Fund is authorized to issue an unlimited number of shares. Share transactions on the Statement of Changes in Net Assets and Share Transactions note may contain exchanges between affiliated funds.
Effective August 10, 2018 and May 11, 2018, Leisure Portfolio and Retailing Portfolio underwent a 10 for 1 share split, respectively. The effect of the share split transaction was to multiply the number of outstanding shares of Leisure Portfolio and Retailing Portfolio by a split factor of 10:1, with a corresponding decrease in net asset value (NAV) per share. This event does not impact the overall net assets of Leisure Portfolio or Retailing Portfolio. The per share data presented in each Financial Highlights and Shares activity presented in each Statement of Changes in Net Assets for Leisure Portfolio and Retailing Portfolio have been retroactively adjusted to reflect this share split.
Effective March 1, 2019, Class C shares will automatically convert to Class A shares after a holding period of ten years from the initial date of purchase, with certain exceptions.
2. Investments in Fidelity Central Funds.
The Funds invest in Fidelity Central Funds, which are open-end investment companies generally available only to other investment companies and accounts managed by the investment adviser and its affiliates. The Funds' Schedules of Investments list each of the Fidelity Central Funds held as of period end, if any, as an investment of each Fund, but do not include the underlying holdings of each Fidelity Central Fund. As an Investing Fund, each Fund indirectly bears its proportionate share of the expenses of the underlying Fidelity Central Funds.
The Money Market Central Funds seek preservation of capital and current income and are managed by Fidelity Investments Money Management, Inc. (FIMM), an affiliate of the investment adviser. Annualized expenses of the Money Market Central Funds as of their most recent shareholder report date are less than .005%.
A complete unaudited list of holdings for each Fidelity Central Fund is available upon request or at the Securities and Exchange Commission (the SEC) website at www.sec.gov. In addition, the financial statements of the Fidelity Central Funds, which are not covered by the Funds' Report of Independent Registered Public Accounting Firm, are available on the SEC website or upon request.
3. Significant Accounting Policies.
Each Fund is an investment company and applies the accounting and reporting guidance of the Financial Accounting Standards Board (FASB) Accounting Standards Codification Topic 946 Financial Services – Investments Companies. The financial statements have been prepared in conformity with accounting principles generally accepted in the United States of America (GAAP), which require management to make certain estimates and assumptions at the date of the financial statements. Actual results could differ from those estimates. Subsequent events, if any, through the date that the financial statements were issued have been evaluated in the preparation of the financial statements. The following summarizes the significant accounting policies of the Funds:
Investment Valuation. Investments are valued as of 4:00 p.m. Eastern time on the last calendar day of the period. The Board of Trustees (the Board) has delegated the day to day responsibility for the valuation of each Fund's investments to the Fair Value Committee (the Committee) established by each Fund's investment adviser. In accordance with valuation policies and procedures approved by the Board, each Fund attempts to obtain prices from one or more third party pricing vendors or brokers to value its investments. When current market prices, quotations or currency exchange rates are not readily available or reliable, investments will be fair valued in good faith by the Committee, in accordance with procedures adopted by the Board. Factors used in determining fair value vary by investment type and may include market or investment specific events. The frequency with which these procedures are used cannot be predicted and they may be utilized to a significant extent. The Committee oversees each Fund's valuation policies and procedures and reports to the Board on the Committee's activities and fair value determinations. The Board monitors the appropriateness of the procedures used in valuing each Fund's investments and ratifies the fair value determinations of the Committee.
Each Fund categorizes the inputs to valuation techniques used to value its investments into a disclosure hierarchy consisting of three levels as shown below:
- Level 1 – quoted prices in active markets for identical investments
- Level 2 – other significant observable inputs (including quoted prices for similar investments, interest rates, prepayment speeds, etc.)
- Level 3 – unobservable inputs (including the Fund's own assumptions based on the best information available)
Valuation techniques used to value each Fund's investments by major category are as follows:
Equity securities, including restricted securities, for which market quotations are readily available, are valued at the last reported sale price or official closing price as reported by a third party pricing vendor on the primary market or exchange on which they are traded and are categorized as Level 1 in the hierarchy. In the event there were no sales during the day or closing prices are not available, securities are valued at the last quoted bid price or may be valued using the last available price and are generally categorized as Level 2 in the hierarchy. For foreign equity securities, when market or security specific events arise, comparisons to the valuation of American Depositary Receipts (ADRs), futures contracts, Exchange-Traded Funds (ETFs) and certain indexes as well as quoted prices for similar securities may be used and would be categorized as Level 2 in the hierarchy. For equity securities, including restricted securities, where observable inputs are limited, assumptions about market activity and risk are used and these securities may be categorized as Level 3 in the hierarchy.
Investments in open-end mutual funds, including the Fidelity Central Funds, are valued at their closing NAV each business day and are categorized as Level 1 in the hierarchy.
Changes in valuation techniques may result in transfers in or out of an assigned level within the disclosure hierarchy. The aggregate value of investments by input level as of February 28, 2019, is included at the end of each applicable Fund's Schedule of Investments.
Foreign Currency. The Funds may use foreign currency contracts to facilitate transactions in foreign-denominated securities. Gains and losses from these transactions may arise from changes in the value of the foreign currency or if the counterparties do not perform under the contracts' terms.
Foreign-denominated assets, including investment securities, and liabilities are translated into U.S. dollars at the exchange rates at period end. Purchases and sales of investment securities, income and dividends received and expenses denominated in foreign currencies are translated into U.S. dollars at the exchange rate in effect on the transaction date.
The effects of exchange rate fluctuations on investments are included with the net realized and unrealized gain (loss) on investment securities. Other foreign currency transactions resulting in realized and unrealized gain (loss) are disclosed separately.
Investment Transactions and Income. For financial reporting purposes, the Funds' investment holdings and NAV include trades executed through the end of the last business day of the period. The NAV per share for processing shareholder transactions is calculated as of the close of business of the New York Stock Exchange (NYSE), normally 4:00 p.m. Eastern time and includes trades executed through the end of the prior business day. Gains and losses on securities sold are determined on the basis of identified cost and for certain Funds include proceeds received from litigation. Dividend income is recorded on the ex-dividend date, except for certain dividends from foreign securities where the ex-dividend date may have passed, which are recorded as soon as the Funds are informed of the ex-dividend date. Non-cash dividends included in dividend income, if any, are recorded at the fair market value of the securities received. Income and capital gain distributions from Fidelity Central Funds, if any, are recorded on the ex-dividend date. Certain distributions received by the Funds represent a return of capital or capital gain. The Funds determine the components of these distributions subsequent to the ex-dividend date, based upon receipt of tax filings or other correspondence relating to the underlying investment. These distributions are recorded as a reduction of cost of investments and/or as a realized gain. Investment income is recorded net of foreign taxes withheld where recovery of such taxes is uncertain.
Class Allocations and Expenses. Expenses directly attributable to a fund are charged to that fund. Expenses attributable to more than one fund are allocated among the respective funds on the basis of relative net assets or other appropriate methods. Expense estimates are accrued in the period to which they relate and adjustments are made when actual amounts are known.
For Communication Services Portfolio, investment income, realized and unrealized capital gains and losses, common expenses of the Fund, and certain fund-level expense reductions, if any, are allocated daily on a pro-rata basis to each class based on the relative net assets of each class to the total net assets of the Fund. Each class differs with respect to transfer agent and distribution and service plan fees incurred. Certain expense reductions may also differ by class. For the reporting period, the allocated portion of income and expenses to each class as a percent of its average net assets may vary due to the timing of recording these transactions in relation to fluctuating net assets of the classes.
Income Tax Information and Distributions to Shareholders. Each year, each Fund intends to qualify as a regulated investment company under Subchapter M of the Internal Revenue Code, including distributing substantially all of its taxable income and realized gains. As a result, no provision for U.S. Federal income taxes is required. As of February 28, 2019, each Fund did not have any unrecognized tax benefits in the financial statements; nor is each Fund aware of any tax positions for which it is reasonably possible that the total amounts of unrecognized tax benefits will significantly change in the next twelve months. Each Fund files a U.S. federal tax return, in addition to state and local tax returns as required. Each Fund's federal income tax returns are subject to examination by the Internal Revenue Service (IRS) for a period of three fiscal years after they are filed. State and local tax returns may be subject to examination for an additional fiscal year depending on the jurisdiction. Foreign taxes are provided for based on each Fund's understanding of the tax rules and rates that exist in the foreign markets in which it invests.
Distributions are declared and recorded on the ex-dividend date. Income and capital gain distributions are declared separately for each class. Income and capital gain distributions are determined in accordance with income tax regulations, which may differ from GAAP. In addition, certain Funds claimed a portion of the payment made to redeeming shareholders as a distribution for income tax purposes.
Capital accounts within the financial statements are adjusted for permanent book-tax differences. These adjustments have no impact on net assets or the results of operations. Capital accounts are not adjusted for temporary book-tax differences which will reverse in a subsequent period.
Book-tax differences are primarily due to foreign currency transactions, passive foreign investment companies (PFIC), redemptions in kind, partnerships and losses deferred due to wash sales and excise tax regulations.
As of period end, the cost and unrealized appreciation (depreciation) in securities, and derivatives if applicable, for federal income tax purposes were as follows for each Fund:
| | Tax cost | Gross unrealized appreciation | Gross unrealized depreciation | Net unrealized appreciation (depreciation) |
| Automotive Portfolio | $32,376,886 | $11,331,621 | $(1,038,341) | $10,293,280 |
| Communication Services Portfolio | 481,527,843 | 106,966,131 | (12,240,900) | 94,725,231 |
| Construction and Housing Portfolio | 158,634,712 | 74,898,138 | (7,892,350) | 67,005,788 |
| Consumer Discretionary Portfolio | 337,793,957 | 111,556,672 | (19,130,848) | 92,425,824 |
| Leisure Portfolio | 310,821,114 | 174,636,066 | (13,461,287) | 161,174,779 |
| Retailing Portfolio | 1,973,079,343 | 1,185,452,336 | (99,089,449) | 1,086,362,887 |
The tax-based components of distributable earnings as of period end were as follows for each Fund:
| | Undistributed ordinary income | Undistributed long-term capital gain | Net unrealized appreciation (depreciation) on securities and other investments |
| Automotive Portfolio | $26,652 | $110,999 | $ 10,291,599 |
| Communication Services Portfolio | – | 143,068,277 | 94,725,231 |
| Construction and Housing Portfolio | 250,218 | 8,760,880 | 67,005,788 |
| Consumer Discretionary Portfolio | – | 9,389,553 | 92,424,560 |
| Leisure Portfolio | 81,151 | 355,975 | 161,174,797 |
| Retailing Portfolio | – | 61,504,033 | 1,086,362,893 |
Certain of the Funds intend to elect to defer to the next fiscal year capital losses recognized during the period November 1, 2018 to February 28, 2019, and ordinary losses recognized during the period January 1, 2019 to February 28, 2019. Loss deferrals were as follows:
| | Capital losses | Ordinary losses |
| Communication Services Portfolio | $– | $(189,476) |
| Consumer Discretionary Portfolio | (2,137,903) | (92,910) |
| Retailing Portfolio | (31,872,385) | – |
The tax character of distributions paid was as follows:
| February 28, 2019 | | | |
| | Ordinary Income | Long-term Capital Gains | Total |
| Automotive Portfolio | $449,847 | $2,618,495 | $3,068,342 |
| Communication Services Portfolio | 1,309,008 | 66,126,972 | 67,435,980 |
| Construction and Housing Portfolio | 2,337,765 | 31,447,145 | 33,784,910 |
| Consumer Discretionary Portfolio | 2,344,452 | 16,846,201 | 19,190,653 |
| Leisure Portfolio | 5,015,959 | 73,489,561 | 78,505,520 |
| Retailing Portfolio | 12,910,093 | 43,456,791 | 56,366,884 |
| February 28, 2018 | | | |
| | Ordinary Income | Long-term Capital Gains | Total |
| Automotive Portfolio | $298,505 | $8,188,561 | $8,487,066 |
| Communication Services Portfolio | 1,071,017 | 29,592,267 | 30,663,284 |
| Construction and Housing Portfolio | 1,543,811 | 46,308,729 | 47,852,540 |
| Consumer Discretionary Portfolio | 2,342,887 | 26,353,209 | 28,696,096 |
| Leisure Portfolio | 4,166,156 | 27,657,199 | 31,823,355 |
| Retailing Portfolio | 4,427,075 | 65,230,373 | 69,657,448 |
Restricted Securities. The Funds may invest in securities that are subject to legal or contractual restrictions on resale. These securities generally may be resold in transactions exempt from registration or to the public if the securities are registered. Disposal of these securities may involve time-consuming negotiations and expense, and prompt sale at an acceptable price may be difficult. Information regarding restricted securities is included at the end of each applicable Fund's Schedule of Investments.
New Rule Issuance. During August 2018, the U.S. Securities and Exchange Commission issued Final Rule Release No. 33-10532, Disclosure Update and Simplification. This Final Rule includes amendments specific to registered investment companies that are intended to eliminate overlap in disclosure requirements between Regulation S-X and GAAP. In accordance with these amendments, certain line-items in the Funds' financial statements have been combined or removed for the current period as outlined in the table below.
| Financial Statement | Current Line-Item Presentation (As Applicable) | Prior Line-Item Presentation (As Applicable) |
| Statement of Assets and Liabilities | Total distributable earnings (loss) | Undistributed/Distributions in excess of/Accumulated net investment income (loss)
Accumulated/Undistributed net realized gain (loss)
Net unrealized appreciation (depreciation) |
| Statement of Changes in Net Assets | N/A - removed | Undistributed/Distributions in excess of/Accumulated net investment income (loss) end of period |
| Statement of Changes in Net Assets | Distributions to shareholders | Distributions to shareholders from net investment income
Distributions to shareholders from net realized gain |
| Distributions to Shareholders Note to Financial Statements | Distributions to shareholders | Distributions to shareholders from net investment income
Distributions to shareholders from net realized gain |
4. Purchases and Sales of Investments.
Purchases and sales of securities, other than short-term securities and in-kind transactions, are noted in the table below.
| | Purchases ($) | Sales ($) |
| Automotive Portfolio | 13,337,836 | 26,282,465 |
| Communication Services Portfolio | 547,245,339 | 536,783,572 |
| Construction and Housing Portfolio | 234,123,570 | 346,233,645 |
| Consumer Discretionary Portfolio | 256,256,876 | 224,013,848 |
| Leisure Portfolio | 195,128,002 | 285,286,501 |
| Retailing Portfolio | 1,668,890,751 | 966,607,763 |
5. Fees and Other Transactions with Affiliates.
Management Fee. Fidelity SelectCo, LLC (the investment adviser) and its affiliates provide the Funds with investment management related services for which the Funds pay a monthly management fee. The management fee is the sum of an individual fund fee rate and an annualized group fee rate. The individual fund fee rate is applied to each Fund's average net assets. The group fee rate is based upon the average net assets of all the mutual funds advised by Fidelity Management & Research Company (FMR) and the investment adviser. The group fee rate decreases as assets under management increase and increases as assets under management decrease. For the reporting period, each Fund's annual management fee rate expressed as a percentage of each Fund's average net assets was as follows:
| | Individual Rate | Group Rate | Total |
| Automotive Portfolio | .30% | .24% | .54% |
| Communication Services Portfolio | .30% | .24% | .54% |
| Construction and Housing Portfolio | .30% | .24% | .54% |
| Consumer Discretionary Portfolio | .30% | .24% | .54% |
| Leisure Portfolio | .30% | .24% | .54% |
| Retailing Portfolio | .30% | .24% | .54% |
Distribution and Service Plan Fees. In accordance with Rule 12b-1 of the 1940 Act, Communication Services Portfolio has adopted separate Distribution and Service Plans for each class of shares. Certain classes pay Fidelity Distributors Corporation (FDC), an affiliate of the investment adviser, separate Distribution and Service Fees, each of which is based on an annual percentage of each class' average net assets. In addition, FDC may pay financial intermediaries for selling shares of each Fund and providing shareholder support services. For the period, the Distribution and Service Fee rates, total fees and amounts retained by FDC were as follows:
| | Distribution Fee | Service Fee | Total Fees | Retained by FDC |
| Communication Services Portfolio | | | | |
| Class A | -% | .25% | $192 | $192 |
| Class M | .25% | .25% | 252 | 252 |
| Class C | .75% | .25% | 447 | 447 |
| | | | $891 | $891 |
Sales Load. For Communication Services Portfolio, FDC may receive a front-end sales charge of up to 5.75% for selling Class A shares and 3.50% for selling Class M shares, some of which is paid to financial intermediaries for selling shares of the Fund. Depending on the holding period, FDC may receive contingent deferred sales charges levied on Class A, Class M and Class C redemptions. The deferred sales charges are 1.00% for Class C shares, 1.00% for certain purchases of Class A shares and .25% for certain purchases of Class M shares.
For the period, sales charge amounts retained by FDC were as follows:
| | Retained by FDC |
| Communication Services Portfolio | |
| Class A | $978 |
| Class M | 115 |
| | $1,093 |
Transfer Agent Fees. Fidelity Investments Institutional Operations Company, Inc., (FIIOC), an affiliate of the investment adviser, is the transfer, dividend disbursing and shareholder servicing agent for each class (Communication Services Portfolio) or Fund (all other Funds). FIIOC receives account fees and asset-based fees that vary according to the account size and type of account of the shareholders of the respective class or Fund, except for Class Z. FIIOC receives an asset-based fee of Class Z's average net assets. FIIOC pays for typesetting, printing and mailing of shareholder reports, except proxy statements. For the period, transfer agent fees were as follows:
| | Amount | % of Average Net Assets |
| Automotive Portfolio | $99,167 | .23 |
| Communication Services Portfolio | | |
| Class A | 221 | .29(a) |
| Class M | 135 | .27(a) |
| Class C | 120 | .27(a) |
| Communication Services | 978,144 | .20 |
| Class I | 63 | .11(a) |
| Class Z | 21 | .05(a) |
| | 978,704 | |
| Construction and Housing Portfolio | 500,592 | .19 |
| Consumer Discretionary Portfolio | 798,043 | .17 |
| Leisure Portfolio | 786,344 | .16 |
| Retailing Portfolio | 5,090,964 | .17 |
(a) Annualized
Accounting and Security Lending Fees. Fidelity Service Company, Inc. (FSC), an affiliate of the investment adviser, maintains each Fund's accounting records. The accounting fee is based on the level of average net assets for each month. Under a separate contract, FSC administers the security lending program. The security lending fee is based on the number and duration of lending transactions. For the period, the fees were equivalent to the following annual rates:
| | % of Average Net Assets |
| Automotive Portfolio | .04 |
| Communication Services Portfolio | .04 |
| Construction and Housing Portfolio | .04 |
| Consumer Discretionary Portfolio | .04 |
| Leisure Portfolio | .04 |
| Retailing Portfolio | .03 |
Brokerage Commissions. Certain Funds placed a portion of their portfolio transactions with brokerage firms which are affiliates of the investment adviser. Brokerage commissions are included in net realized gain (loss) and change in net unrealized appreciation (depreciation) in the Statement of Operations. The commissions paid to these affiliated firms were as follows:
| | Amount |
| Automotive Portfolio | $465 |
| Communication Services Portfolio | 13,105 |
| Construction and Housing Portfolio | 5,228 |
| Consumer Discretionary Portfolio | 3,022 |
| Leisure Portfolio | 3,434 |
| Retailing Portfolio | 15,672 |
Interfund Lending Program. Pursuant to an Exemptive Order issued by the SEC, the Funds, along with other registered investment companies having management contracts with Fidelity Management & Research Company (FMR) or other affiliated entities of FMR, may participate in an interfund lending program. This program provides an alternative credit facility allowing the funds to borrow from, or lend money to, other participating affiliated funds. At period end, there were no interfund loans outstanding. Each applicable fund's activity in this program during the period for which loans were outstanding was as follows:
| | Borrower or Lender | Average Loan Balance | Weighted Average Interest Rate | Interest Expense |
| Communication Services Portfolio | Borrower | $15,916,000 | 2.14% | $1,895 |
| Consumer Discretionary Portfolio | Borrower | $3,147,955 | 2.45% | 4,715 |
| Leisure Portfolio | Borrower | $4,679,000 | 2.17% | 1,413 |
| Retailing Portfolio | Borrower | $15,659,438 | 2.61% | 18,131 |
Interfund Trades. The Funds may purchase from or sell securities to other Fidelity Funds under procedures adopted by the Board. The procedures have been designed to ensure these interfund trades are executed in accordance with Rule 17a-7 of the 1940 Act. Interfund trades are included within the respective purchases and sales amounts shown in the Purchases and Sales of Investments note.
Affiliated Redemptions In-Kind. During the period, 10,019,311 shares of Consumer Discretionary Portfolio were redeemed in-kind for investments and cash with a value of $420,009,534. The net realized gain of $132,629,032 on investments delivered through in-kind redemptions is included in the accompanying Statement of Operations. The amount of the in-kind redemptions is included in share transactions in the accompanying Statement of Changes in Net Assets. Consumer Discretionary Portfolio recognized no gain or loss for federal income tax purposes.
Other. During the period, the investment adviser reimbursed the Consumer Discretionary Portfolio for certain losses in the amount of $3,721.
6. Committed Line of Credit.
Certain Funds participate with other funds managed by the investment adviser or an affiliate in a $4.25 billion credit facility (the "line of credit") to be utilized for temporary or emergency purposes to fund shareholder redemptions or for other short-term liquidity purposes. The participating funds have agreed to pay commitment fees on their pro-rata portion of the line of credit, which are reflected in Miscellaneous expenses on the Statement of Operations, and are as follows:
| Automotive Portfolio | $129 |
| Communication Services Portfolio | 1,357 |
| Construction and Housing Portfolio | 790 |
| Consumer Discretionary Portfolio | 1,478 |
| Leisure Portfolio | 1,351 |
| Retailing Portfolio | 7,359 |
During the period, the Funds did not borrow on this line of credit.
7. Security Lending.
Certain Funds lend portfolio securities through a lending agent from time to time in order to earn additional income. On the settlement date of the loan, each applicable Fund receives collateral (in the form of U.S. Treasury obligations, letters of credit and/or cash) against the loaned securities and maintains collateral in an amount not less than 100% of the market value of the loaned securities during the period of the loan. The market value of the loaned securities is determined at the close of business of the Funds and any additional required collateral is delivered to the Funds on the next business day. The Funds or borrower may terminate the loan at any time, and if the borrower defaults on its obligation to return the securities loaned because of insolvency or other reasons, the Funds may apply collateral received from the borrower against the obligation. The Funds may experience delays and costs in recovering the securities loaned. Any cash collateral received is invested in the Fidelity Securities Lending Cash Central Fund. The value of loaned securities and cash collateral at period end are disclosed on each applicable Fund's Statement of Assets and Liabilities. Security lending income represents the income earned on investing cash collateral, less rebates paid to borrowers and any lending agent fees associated with the loan, plus any premium payments received for lending certain types of securities. Security lending income is presented on each applicable Fund's Statement of Operations as a component of income from Fidelity Central Funds.
8. Bank Borrowings.
Each Fund is permitted to have bank borrowings for temporary or emergency purposes to fund shareholder redemptions or for other short-term liquidity requirements. Each Fund has established borrowing arrangements with certain banks. The interest rate on the borrowings is the bank's base rate, as revised from time to time. At period end, there were no bank borrowings outstanding. Each applicable Fund's activity in this program during the period for which loans were outstanding was as follows:
| | Average Loan Balance | Weighted Average Interest Rate | Interest Expense |
| Retailing Portfolio | $2,236,000 | 2.90% | $540 |
9. Expense Reductions.
Commissions paid to certain brokers with whom the investment adviser, or its affiliates, places trades on behalf of certain Funds include an amount in addition to trade execution, which may be rebated back to the Funds to offset certain expenses. In addition, through arrangements with each custodian and transfer agent, credits realized as a result of certain uninvested cash balances were used to reduce each applicable Fund's expenses. All of the applicable expense reductions are noted in the table below.
| | Brokerage Service reduction | Custody expense reduction | Transfer Agent expense reduction |
| Automotive Portfolio | $2,253 | $– | $– |
| Communication Services Portfolio | 27,860 | – | |
| Construction and Housing Portfolio | 26,764 | 420 | – |
| Leisure Portfolio | 21,756 | – | 158 |
| Retailing Portfolio | 102,364 | 1,119 | – |
In addition, during the period the investment adviser reimbursed and/or waived a portion of fund-level operating and class level operating expenses expenses as follows:
| | Fund-Level Amount |
| Automotive Portfolio | $420 |
| Communication Services Portfolio | 4,442 |
| Construction and Housing Portfolio | 2,444 |
| Consumer Discretionary Portfolio | 4,905 |
| Leisure Portfolio | 4,119 |
| Retailing Portfolio | 20,386 |
| | Class-Level Amount |
| Communication Services Portfolio | |
| Class A | $7 |
| Class M | 7 |
| Class C | 7 |
| Communication Services | 71,303 |
| Class I | 7 |
| Class Z | 7 |
10. Distributions to Shareholders.
Distributions to shareholders of each class were as follows:
| | Year ended
February 28, 2019(a) | Year ended
February 28, 2018 |
| Communication Services Portfolio | | |
| Distributions to shareholders | | |
| Class A | $7,552 | $– |
| Class M | 7,531 | – |
| Class C | 7,488 | – |
| Communication Services | 67,398,247 | – |
| Class I | 7,576 | – |
| Class Z | 7,586 | – |
| Total | $67,435,980 | $– |
| From net investment income | | |
| Communication Services | $– | $1,071,017 |
| From net realized gain | | |
| Communication Services | $– | $29,592,267 |
(a) Distributions for Class A, Class M, Class C, Class I and Class Z are for the period November 30, 2018 (commencement of sale of shares) to February 28, 2019.
11. Share Transactions.
Share transactions for each class were as follows and may contain automatic conversions between classes or exchanges between affiliated funds:
| | Shares | Shares | Dollars | Dollars |
| | Year ended February 28, 2019 (a) | Year ended February 28, 2018 | Year ended February 28, 2019(a) | Year ended February 28, 2018 |
| Communication Services Portfolio | | | | |
| Class A | | | | |
| Shares sold | 9,932 | – | $728,750 | $– |
| Reinvestment of distributions | 108 | – | 7,552 | – |
| Shares redeemed | (486) | – | (36,085) | – |
| Net increase (decrease) | 9,554 | – | $700,217 | $– |
| Class M | | | | |
| Shares sold | 6,375 | – | $476,789 | $– |
| Reinvestment of distributions | 108 | – | 7,531 | – |
| Net increase (decrease) | 6,483 | – | $484,320 | $– |
| Class C | | | | |
| Shares sold | 4,996 | – | $372,785 | $– |
| Reinvestment of distributions | 107 | – | 7,488 | – |
| Shares redeemed | (60) | – | (4,466) | – |
| Net increase (decrease) | 5,043 | – | $375,807 | $– |
| Communication Services | | | | |
| Shares sold | 2,437,944 | 658,481 | $187,426,841 | $53,712,116 |
| Reinvestment of distributions | 917,753 | 368,028 | 64,635,754 | 29,534,153 |
| Shares redeemed | (2,236,410) | (3,060,717) | (166,522,114) | (246,786,302) |
| Net increase (decrease) | 1,119,287 | (2,034,208) | $85,540,481 | $(163,540,033) |
| Class I | | | | |
| Shares sold | 7,326 | – | $539,797 | $– |
| Reinvestment of distributions | 109 | – | 7,576 | – |
| Shares redeemed | (1,396) | – | (102,385) | – |
| Net increase (decrease) | 6,039 | – | $444,988 | $– |
| Class Z | | | | |
| Shares sold | 6,958 | – | $516,550 | $– |
| Reinvestment of distributions | 109 | – | 7,586 | – |
| Net increase (decrease) | 7,067 | – | $524,136 | $– |
(a) Share transactions for Class A, Class M, Class C, Class I and Class Z are for the period November 30, 2018 (commencement of sale of shares) to February 28, 2019.
12. Other.
The Funds' organizational documents provide former and current trustees and officers with a limited indemnification against liabilities arising in connection with the performance of their duties to the Funds. In the normal course of business, the Funds may also enter into contracts that provide general indemnifications. The Funds' maximum exposure under these arrangements is unknown as this would be dependent on future claims that may be made against the Funds. The risk of material loss from such claims is considered remote.
Report of Independent Registered Public Accounting Firm
To the Board of Trustees of Fidelity Select Portfolios and Shareholders of Automotive Portfolio, Communication Services Portfolio, Construction and Housing Portfolio, Consumer Discretionary Portfolio, Leisure Portfolio and Retailing Portfolio:
Opinions on the Financial Statements
We have audited the accompanying statements of assets and liabilities, including the schedules of investments, of Automotive Portfolio, Communication Services Portfolio, Construction and Housing Portfolio, Consumer Discretionary Portfolio, Leisure Portfolio and Retailing Portfolio (six of the funds constituting Fidelity Select Portfolios, hereafter collectively referred to as the "Funds") as of February 28, 2019, the related statements of operations for the year ended February 28, 2019, the statements of changes in net assets for each of the two years in the period ended February 28, 2019, including the related notes, and the financial highlights for each of the periods indicated therein (collectively referred to as the “financial statements”). In our opinion, the financial statements present fairly, in all material respects, the financial position of each of the Funds as of February 28, 2019, the results of each of their operations for the year then ended, the changes in each of their net assets for each of the two years in the period ended February 28, 2019 of the financial highlights for each of the periods indicated therein in conformity with accounting principles generally accepted in the United States of America.
Basis for Opinions
These financial statements are the responsibility of the Funds' management. Our responsibility is to express an opinion on the Funds' financial statements based on our audits. We are a public accounting firm registered with the Public Company Accounting Oversight Board (United States) (PCAOB) and are required to be independent with respect to the Funds in accordance with the U.S. federal securities laws and the applicable rules and regulations of the Securities and Exchange Commission and the PCAOB.
We conducted our audits of these financial statements in accordance with the standards of the PCAOB. Those standards require that we plan and perform the audit to obtain reasonable assurance about whether the financial statements are free of material misstatement, whether due to error or fraud.
Our audits included performing procedures to assess the risks of material misstatement of the financial statements, whether due to error or fraud, and performing procedures that respond to those risks. Such procedures included examining, on a test basis, evidence regarding the amounts and disclosures in the financial statements. Our audits also included evaluating the accounting principles used and significant estimates made by management, as well as evaluating the overall presentation of the financial statements. Our procedures included confirmation of securities owned as of February 28, 2019 by correspondence with the custodian and brokers; when replies were not received from brokers, we performed other auditing procedures. We believe that our audits provide a reasonable basis for our opinions.
PricewaterhouseCoopers LLP
Boston, Massachusetts
April 15, 2019
We have served as the auditor of one or more investment companies in the Fidelity group of funds since 1932.
Trustees and Officers
The Trustees, Members of the Advisory Board (if any), and officers of the trusts and funds, as applicable, are listed below. The Board of Trustees governs each fund and is responsible for protecting the interests of shareholders. The Trustees are experienced executives who meet periodically throughout the year to oversee each fund's activities, review contractual arrangements with companies that provide services to each fund, oversee management of the risks associated with such activities and contractual arrangements, and review each fund's performance. Except for Michael E. Wiley, each of the Trustees oversees 287 funds. Mr. Wiley oversees 195 funds.
The Trustees hold office without limit in time except that (a) any Trustee may resign; (b) any Trustee may be removed by written instrument, signed by at least two-thirds of the number of Trustees prior to such removal; (c) any Trustee who requests to be retired or who has become incapacitated by illness or injury may be retired by written instrument signed by a majority of the other Trustees; and (d) any Trustee may be removed at any special meeting of shareholders by a two-thirds vote of the outstanding voting securities of the trust. Each Trustee who is not an interested person (as defined in the 1940 Act) of the trust and the funds is referred to herein as an Independent Trustee. Each Independent Trustee shall retire not later than the last day of the calendar year in which his or her 75th birthday occurs. The Independent Trustees may waive this mandatory retirement age policy with respect to individual Trustees. Officers and Advisory Board Members hold office without limit in time, except that any officer or Advisory Board Member may resign or may be removed by a vote of a majority of the Trustees at any regular meeting or any special meeting of the Trustees. Except as indicated, each individual has held the office shown or other offices in the same company for the past five years.
Each fund's Statement of Additional Information (SAI) includes more information about the Trustees. To request a free copy, call Fidelity at 1-800-544-8544 if you’re an individual investing directly with Fidelity, call 1-800-835-5092 if you’re a plan sponsor or participant with Fidelity as your recordkeeper or call 1-877-208-0098 on institutional accounts or if you’re an advisor or invest through one.
Experience, Skills, Attributes, and Qualifications of the Trustees. The Governance and Nominating Committee has adopted a statement of policy that describes the experience, qualifications, attributes, and skills that are necessary and desirable for potential Independent Trustee candidates (Statement of Policy). The Board believes that each Trustee satisfied at the time he or she was initially elected or appointed a Trustee, and continues to satisfy, the standards contemplated by the Statement of Policy. The Governance and Nominating Committee also engages professional search firms to help identify potential Independent Trustee candidates who have the experience, qualifications, attributes, and skills consistent with the Statement of Policy. From time to time, additional criteria based on the composition and skills of the current Independent Trustees, as well as experience or skills that may be appropriate in light of future changes to board composition, business conditions, and regulatory or other developments, have also been considered by the professional search firms and the Governance and Nominating Committee. In addition, the Board takes into account the Trustees' commitment and participation in Board and committee meetings, as well as their leadership of standing and ad hoc committees throughout their tenure.
In determining that a particular Trustee was and continues to be qualified to serve as a Trustee, the Board has considered a variety of criteria, none of which, in isolation, was controlling. The Board believes that, collectively, the Trustees have balanced and diverse experience, qualifications, attributes, and skills, which allow the Board to operate effectively in governing each fund and protecting the interests of shareholders. Information about the specific experience, skills, attributes, and qualifications of each Trustee, which in each case led to the Board's conclusion that the Trustee should serve (or continue to serve) as a trustee of the funds, is provided below.
Board Structure and Oversight Function. James C. Curvey is an interested person and currently serves as Chairman. The Trustees have determined that an interested Chairman is appropriate and benefits shareholders because an interested Chairman has a personal and professional stake in the quality and continuity of services provided to the funds. Independent Trustees exercise their informed business judgment to appoint an individual of their choosing to serve as Chairman, regardless of whether the Trustee happens to be independent or a member of management. The Independent Trustees have determined that they can act independently and effectively without having an Independent Trustee serve as Chairman and that a key structural component for assuring that they are in a position to do so is for the Independent Trustees to constitute a substantial majority for the Board. The Independent Trustees also regularly meet in executive session. Ned C. Lautenbach serves as Chairman of the Independent Trustees and as such (i) acts as a liaison between the Independent Trustees and management with respect to matters important to the Independent Trustees and (ii) with management prepares agendas for Board meetings.
Fidelity® funds are overseen by different Boards of Trustees. The funds' Board oversees Fidelity's high income and certain equity funds, and other Boards oversee Fidelity's investment-grade bond, money market, asset allocation, and other equity funds. The asset allocation funds may invest in Fidelity® funds overseen by the funds' Board. The use of separate Boards, each with its own committee structure, allows the Trustees of each group of Fidelity® funds to focus on the unique issues of the funds they oversee, including common research, investment, and operational issues. On occasion, the separate Boards establish joint committees to address issues of overlapping consequences for the Fidelity® funds overseen by each Board.
The Trustees operate using a system of committees to facilitate the timely and efficient consideration of all matters of importance to the Trustees, each fund, and fund shareholders and to facilitate compliance with legal and regulatory requirements and oversight of the funds' activities and associated risks. The Board, acting through its committees, has charged SelectCo and its affiliates with (i) identifying events or circumstances the occurrence of which could have demonstrably adverse effects on the funds' business and/or reputation; (ii) implementing processes and controls to lessen the possibility that such events or circumstances occur or to mitigate the effects of such events or circumstances if they do occur; and (iii) creating and maintaining a system designed to evaluate continuously business and market conditions in order to facilitate the identification and implementation processes described in (i) and (ii) above. Because the day-to-day operations and activities of the funds are carried out by or through SelectCo, its affiliates, and other service providers, the funds' exposure to risks is mitigated but not eliminated by the processes overseen by the Trustees. While each of the Board's committees has responsibility for overseeing different aspects of the funds' activities, oversight is exercised primarily through the Operations, Audit, and Compliance Committees. In addition, the Independent Trustees have worked with Fidelity to enhance the Board's oversight of investment and financial risks, legal and regulatory risks, technology risks, and operational risks, including the development of additional risk reporting to the Board. Appropriate personnel, including but not limited to the funds' Chief Compliance Officer (CCO), SelectCo's internal auditor, the independent accountants, the funds' Treasurer and portfolio management personnel, make periodic reports to the Board's committees, as appropriate, including an annual review of Fidelity's risk management program for the Fidelity® funds. The responsibilities of each standing committee, including their oversight responsibilities, are described further under "Standing Committees of the Trustees."
Interested Trustees*:
Correspondence intended for a Trustee who is an interested person may be sent to Fidelity Investments, 245 Summer Street, Boston, Massachusetts 02210.
Name, Year of Birth; Principal Occupations and Other Relevant Experience+
James C. Curvey (1935)
Year of Election or Appointment: 2018
Trustee
Chairman of the Board of Trustees
Mr. Curvey also serves as Trustee of other Fidelity® funds. Mr. Curvey is Vice Chairman (2007-present) and Director of FMR LLC (diversified financial services company). In addition, Mr. Curvey is an Overseer Emeritus for the Boston Symphony Orchestra, a Director of Artis-Naples, and a Trustee of Brewster Academy in Wolfeboro, New Hampshire. Previously, Mr. Curvey served as a Director of Fidelity Research & Analysis Co. (investment adviser firm, 2009-2018), Director of Fidelity Investments Money Management, Inc. (investment adviser firm, 2009-2014) and a Director of FMR and FMR Co., Inc. (investment adviser firms, 2007-2014).
* Determined to be an "Interested Trustee" by virtue of, among other things, his or her affiliation with the trusts or various entities under common control with SelectCo.
+ The information includes the Trustee's principal occupation during the last five years and other information relating to the experience, attributes, and skills relevant to the Trustee's qualifications to serve as a Trustee, which led to the conclusion that the Trustee should serve as a Trustee for each fund.
Independent Trustees:
Correspondence intended for an Independent Trustee may be sent to Fidelity Investments, P.O. Box 55235, Boston, Massachusetts 02205-5235.
Name, Year of Birth; Principal Occupations and Other Relevant Experience+
Dennis J. Dirks (1948)
Year of Election or Appointment: 2018
Trustee
Mr. Dirks also serves as Trustee of other Fidelity® funds. Prior to his retirement in May 2003, Mr. Dirks was Chief Operating Officer and a member of the Board of The Depository Trust & Clearing Corporation (DTCC). He also served as President, Chief Operating Officer, and Board member of The Depository Trust Company (DTC) and President and Board member of the National Securities Clearing Corporation (NSCC). In addition, Mr. Dirks served as Chief Executive Officer and Board member of the Government Securities Clearing Corporation, Chief Executive Officer and Board member of the Mortgage-Backed Securities Clearing Corporation, as a Trustee and a member of the Finance Committee of Manhattan College (2005-2008), as a Trustee and a member of the Finance Committee of AHRC of Nassau County (2006-2008), as a member of the Independent Directors Council (IDC) Governing Council (2010-2015), and as a member of the Board of Directors for The Brookville Center for Children’s Services, Inc. (2009-2017). Mr. Dirks is a member of the Finance Committee (2016-present) and Board of Directors (2017-present) and is Treasurer (2018-present) of the Asolo Repertory Theatre.
Donald F. Donahue (1950)
Year of Election or Appointment: 2018
Trustee
Mr. Donahue also serves as a Trustee of other Fidelity® funds. Mr. Donahue is President and Chief Executive Officer of Miranda Partners, LLC (risk consulting for the financial services industry, 2012-present). Previously, Mr. Donahue served as a Member of the Advisory Board of certain Fidelity® funds (2015-2018) and Chief Executive Officer (2006-2012), Chief Operating Officer (2003-2006), and Managing Director, Customer Marketing and Development (1999-2003) of The Depository Trust & Clearing Corporation (financial markets infrastructure). Mr. Donahue serves as a Member (2007-present) and Co-Chairman (2016-present) of the Board of Directors of United Way of New York, Member of the Board of Directors of NYC Leadership Academy (2012-present) and Member of the Board of Advisors of Ripple Labs, Inc. (financial services, 2015-present). He also served as Chairman (2010-2012) and Member of the Board of Directors (2012-2013) of Omgeo, LLC (financial services), Treasurer of United Way of New York (2012-2016), and Member of the Board of Directors of XBRL US (financial services non-profit, 2009-2012) and the International Securities Services Association (2009-2012).
Alan J. Lacy (1953)
Year of Election or Appointment: 2018
Trustee
Mr. Lacy also serves as Trustee of other Fidelity® funds. Mr. Lacy serves as a Director of Bristol-Myers Squibb Company (global pharmaceuticals, 2008-present). He is a Trustee of the California Chapter of The Nature Conservancy (2015-present) and a Director of the Center for Advanced Study in the Behavioral Sciences at Stanford University (2015-present). In addition, Mr. Lacy served as Senior Adviser (2007-2014) of Oak Hill Capital Partners, L.P. (private equity) and also served as Chief Executive Officer (2005) and Vice Chairman (2005-2006) of Sears Holdings Corporation (retail) and Chief Executive Officer and Chairman of the Board of Sears, Roebuck and Co. (retail, 2000-2005). Previously, Mr. Lacy served as Chairman (2014-2017) and a member (2010-2017) of the Board of Directors of Dave & Buster’s Entertainment, Inc. (restaurant and entertainment complexes), as Chairman (2008-2011) and a member (2006-2015) of the Board of Trustees of the National Parks Conservation Association, and as a member of the Board of Directors for The Hillman Companies, Inc. (hardware wholesalers, 2010-2014), Earth Fare, Inc. (retail grocery, 2010-2014), and The Western Union Company (global money transfer, 2006-2011).
Ned C. Lautenbach (1944)
Year of Election or Appointment: 2018
Trustee
Chairman of the Independent Trustees
Mr. Lautenbach also serves as Trustee of other Fidelity® funds. Mr. Lautenbach currently serves as Chair (2018-present) and Member (2013-present) of the Board of Governors, State University System of Florida and is a member of the Council on Foreign Relations (1994-present). He is also a member and has most recently served as Chairman of the Board of Directors of Artis-Naples (2012-present). Previously, Mr. Lautenbach served as a member and then Lead Director of the Board of Directors of Eaton Corporation (diversified industrial, 1997-2016). He was also a Partner and Advisory Partner at Clayton, Dubilier & Rice, LLC (private equity investment, 1998-2010), as well as a Director of Sony Corporation (2006-2007). In addition, Mr. Lautenbach also had a 30-year career with IBM (technology company) during which time he served as Senior Vice President and a member of the Corporate Executive Committee (1968-1998).
Joseph Mauriello (1944)
Year of Election or Appointment: 2018
Trustee
Mr. Mauriello also serves as Trustee of other Fidelity® funds. Prior to his retirement in January 2006, Mr. Mauriello served in numerous senior management positions including Deputy Chairman and Chief Operating Officer (2004-2005), and Vice Chairman of Financial Services (2002-2004) of KPMG LLP US (professional services, 1965-2005). Mr. Mauriello currently serves as a member of the Independent Directors Council (IDC) Governing Council (2015-present). Previously, Mr. Mauriello served as a member of the Board of Directors of XL Group plc. (global insurance and re-insurance, 2006-2018).
Cornelia M. Small (1944)
Year of Election or Appointment: 2018
Trustee
Ms. Small also serves as Trustee of other Fidelity® funds. Ms. Small is a member of the Board of Directors (2009-present) and Chair of the Investment Committee (2010-present) of the Teagle Foundation. Ms. Small also serves on the Investment Committee of the Berkshire Taconic Community Foundation (2008-present). Previously, Ms. Small served as Chairperson (2002-2008) and a member of the Investment Committee and Chairperson (2008-2012) and a member of the Board of Trustees of Smith College. In addition, Ms. Small served as Chief Investment Officer, Director of Global Equity Investments, and a member of the Board of Directors of Scudder, Stevens & Clark and Scudder Kemper Investments.
Garnett A. Smith (1947)
Year of Election or Appointment: 2013
Trustee
Mr. Smith also serves as Trustee of other Fidelity® funds. Prior to Mr. Smith's retirement, he served as Chairman and Chief Executive Officer of Inbrand Corp. (manufacturer of personal absorbent products, 1990-1997). He also served as President (1986-1990) of Inbrand Corp. Prior to his employment with Inbrand Corp., he was employed by a retail fabric chain and North Carolina National Bank. In addition, Mr. Smith served as a Member of the Advisory Board of certain Fidelity® funds (2012-2013) and as a board member of the Jackson Hole Land Trust (2009-2012).
David M. Thomas (1949)
Year of Election or Appointment: 2018
Trustee
Mr. Thomas also serves as Trustee of other Fidelity® funds. Mr. Thomas serves as Non-Executive Chairman of the Board of Directors of Fortune Brands Home and Security (home and security products, 2011-present) and as a member of the Board of Directors (2004-present) and Presiding Director (2013-present) of Interpublic Group of Companies, Inc. (marketing communication). Previously, Mr. Thomas served as Executive Chairman (2005-2006) and Chairman and Chief Executive Officer (2000-2005) of IMS Health, Inc. (pharmaceutical and healthcare information solutions), a Director of Fortune Brands, Inc. (consumer products, 2000-2011), and a member of the Board of Trustees of the University of Florida (2013-2018).
Michael E. Wiley (1950)
Year of Election or Appointment: 2008
Trustee
Mr. Wiley also serves as Trustee or Member of the Advisory Board of other Fidelity® funds. Mr. Wiley serves as a Director of High Point Resources (exploration and production, 2005-present). Previously, Mr. Wiley served as a Director of Andeavor Corporation (independent oil refiner and marketer, 2005-2018), a Director of Andeavor Logistics LP (natural resources logistics, 2015-2018), a Director of Post Oak Bank (privately-held bank, 2004-2018), a Director of Asia Pacific Exploration Consolidated (international oil and gas exploration and production, 2008-2013), a member of the Board of Trustees of the University of Tulsa (2000-2006; 2007-2010), a Senior Energy Advisor of Katzenbach Partners, LLC (consulting, 2006-2007), an Advisory Director of Riverstone Holdings (private investment), a Director of Spinnaker Exploration Company (exploration and production, 2001-2005) and Chairman, President, and CEO of Baker Hughes, Inc. (oilfield services, 2000-2004).
+ The information includes the Trustee's principal occupation during the last five years and other information relating to the experience, attributes, and skills relevant to the Trustee's qualifications to serve as a Trustee, which led to the conclusion that the Trustee should serve as a Trustee for each fund.
Advisory Board Members and Officers:
Correspondence intended for a Member of the Advisory Board (if any) may be sent to Fidelity Investments, P.O. Box 55235, Boston, Massachusetts 02205-5235. Correspondence intended for an officer or Peter S. Lynch may be sent to Fidelity Investments, 245 Summer Street, Boston, Massachusetts 02210. Officers appear below in alphabetical order.
Name, Year of Birth; Principal Occupation
Vicki L. Fuller (1957)
Year of Election or Appointment: 2018
Member of the Advisory Board
Ms. Fuller also serves as Member of the Advisory Board of other Fidelity® funds. Ms. Fuller serves as a member of the Board of Directors, Audit Committee, and Nominating and Governance Committee of The Williams Companies, Inc. (natural gas infrastructure, 2018-present). Previously, Ms. Fuller served as the Chief Investment Officer of the New York State Common Retirement Fund (2012-2018) and held a variety of positions at AllianceBernstein L.P. (global asset management, 1985-2012), including Managing Director (2006-2012) and Senior Vice President and Senior Portfolio Manager (2001-2006).
Peter S. Lynch (1944)
Year of Election or Appointment: 2018
Member of the Advisory Board
Mr. Lynch also serves as Member of the Advisory Board of other Fidelity® funds. Mr. Lynch is Vice Chairman and a Director of FMR (investment adviser firm) and FMR Co., Inc. (investment adviser firm). In addition, Mr. Lynch serves as a Trustee of Boston College and as the Chairman of the Inner-City Scholarship Fund. Previously, Mr. Lynch served on the Special Olympics International Board of Directors (1997-2006).
Carol B. Tomé (1957)
Year of Election or Appointment: 2017
Member of the Advisory Board
Ms. Tomé also serves as Member of the Advisory Board of other Fidelity® funds. Ms. Tomé is Chief Financial Officer (2001-present) and Executive Vice President of Corporate Services (2007-present) of The Home Depot, Inc. (home improvement retailer) and a Director (2003-present) and Chair of the Audit Committee (2004-present) of United Parcel Service, Inc. (package delivery and supply chain management). Previously, Ms. Tomé served as Trustee of certain Fidelity® funds (2017), Senior Vice President of Finance and Accounting/Treasurer (2000-2007) and Vice President and Treasurer (1995-2000) of The Home Depot, Inc. and Chair of the Board (2010-2012), Vice Chair of the Board (2009 and 2013), and a Director (2008-2013) of the Federal Reserve Bank of Atlanta. Ms. Tomé is also a director or trustee of many community and professional organizations.
Elizabeth Paige Baumann (1968)
Year of Election or Appointment: 2017
Anti-Money Laundering (AML) Officer
Ms. Baumann also serves as AML Officer of other funds. She is Chief AML Officer (2012-present) and Senior Vice President (2014-present) of FMR LLC (diversified financial services company) and is an employee of Fidelity Investments. Previously, Ms. Baumann served as AML Officer of the funds (2012-2016), and Vice President (2007-2014) and Deputy Anti-Money Laundering Officer (2007-2012) of FMR LLC.
Craig S. Brown (1977)
Year of Election or Appointment: 2019
Assistant Treasurer
Mr. Brown also serves as Assistant Treasurer of other funds. Mr. Brown is an employee of Fidelity Investments (2013-present).
John J. Burke III (1964)
Year of Election or Appointment: 2018
Chief Financial Officer
Mr. Burke also serves as Chief Financial Officer of other funds. Mr. Burke serves as Head of Investment Operations for Fidelity Fund and Investment Operations (2018-present) and is an employee of Fidelity Investments (1998-present). Previously Mr. Burke served as head of Asset Management Investment Operations (2012-2018).
William C. Coffey (1969)
Year of Election or Appointment: 2018
Secretary and Chief Legal Officer (CLO)
Mr. Coffey also serves as Secretary and CLO of other funds. Mr. Coffey serves as CLO, Secretary, and Senior Vice President of Fidelity Management & Research Company and FMR Co., Inc. (investment adviser firms, 2018-present); Secretary of Fidelity SelectCo, LLC and Fidelity Investments Money Management, Inc. (investment adviser firms, 2018-present); and CLO of Fidelity Management & Research (Hong Kong) Limited, FMR Investment Management (UK) Limited, and Fidelity Management & Research (Japan) Limited (investment adviser firms, 2018-present). He is Senior Vice President and Deputy General Counsel of FMR LLC (diversified financial services company, 2010-present), and is an employee of Fidelity Investments. Previously, Mr. Coffey served as Assistant Secretary of certain funds (2009-2018) and as Vice President and Associate General Counsel of FMR LLC (2005-2009).
Timothy M. Cohen (1969)
Year of Election or Appointment: 2018
Vice President
Mr. Cohen also serves as Vice President of other funds. Mr. Cohen serves as Co-Head of Global Equity Research (2016-present), a Director of Fidelity Management & Research (Japan) Limited (investment adviser firm, 2016-present), and is an employee of Fidelity Investments. Previously, Mr. Cohen served as Chief Investment Officer - Equity and a Director of Fidelity Management & Research (U.K.) Inc. (investment adviser firm, 2013-2015) and as a Director of Fidelity Management & Research (Hong Kong) Limited (investment adviser firm, 2017).
Jonathan Davis (1968)
Year of Election or Appointment: 2010
Assistant Treasurer
Mr. Davis also serves as Assistant Treasurer of other funds. Mr. Davis serves as Assistant Treasurer of FMR Capital, Inc. (2017-present) and is an employee of Fidelity Investments. Previously, Mr. Davis served as Vice President and Associate General Counsel of FMR LLC (diversified financial services company, 2003-2010).
Adrien E. Deberghes (1967)
Year of Election or Appointment: 2018
Assistant Treasurer
Mr. Deberghes also serves as an officer of other funds. He serves as Assistant Treasurer of FMR Capital, Inc. (2017-present), Executive Vice President of Fidelity Investments Money Management, Inc. (FIMM) (investment adviser firm, 2016-present), and is an employee of Fidelity Investments (2008-present). Previously, Mr. Deberghes served as President and Treasurer of certain Fidelity® funds (2013-2018). Prior to joining Fidelity Investments, Mr. Deberghes was Senior Vice President of Mutual Fund Administration at State Street Corporation (2007-2008), Senior Director of Mutual Fund Administration at Investors Bank & Trust (2005-2007), and Director of Finance for Dunkin' Brands (2000-2005). Previously, Mr. Deberghes served in other fund officer roles.
Laura M. Del Prato (1964)
Year of Election or Appointment: 2018
Assistant Treasurer
Ms. Del Prato also serves as an officer of other funds. Ms. Del Prato is an employee of Fidelity Investments (2017-present). Prior to joining Fidelity Investments, Ms. Del Prato served as a Managing Director and Treasurer of the JPMorgan Mutual Funds (2014-2017). Prior to JPMorgan, Ms. Del Prato served as a partner at Cohen Fund Audit Services (accounting firm, 2012-2013) and KPMG LLP (accounting firm, 2004-2012).
Colm A. Hogan (1973)
Year of Election or Appointment: 2018
Deputy Treasurer
Mr. Hogan also serves as an officer of other funds. Mr. Hogan serves as Assistant Treasurer of FMR Capital, Inc. (2017-present) and is an employee of Fidelity Investments (2005-present). Previously, Mr. Hogan served as Assistant Treasurer of certain Fidelity® funds (2016-2018).
Pamela R. Holding (1964)
Year of Election or Appointment: 2018
Vice President
Ms. Holding also serves as Vice President of other funds. Ms. Holding serves as Co-Head of Global Equity Research (2018-present) and is an employee of Fidelity Investments (2013-present).
Chris Maher (1972)
Year of Election or Appointment: 2013
Assistant Treasurer
Mr. Maher serves as Assistant Treasurer of other funds. Mr. Maher is Vice President of Valuation Oversight, serves as Assistant Treasurer of FMR Capital, Inc. (2017-present), and is an employee of Fidelity Investments. Previously, Mr. Maher served as Vice President of Asset Management Compliance (2013), Vice President of the Program Management Group of FMR (investment adviser firm, 2010-2013), and Vice President of Valuation Oversight (2008-2010).
Kenneth B. Robins (1969)
Year of Election or Appointment: 2018
Chief Compliance Officer
Mr. Robins also serves as an officer of other funds. Mr. Robins serves as Compliance Officer of Fidelity Management & Research Company and FMR Co., Inc. (investment adviser firms, 2016-present) and is an employee of Fidelity Investments (2004-present). Previously, Mr. Robins served as Executive Vice President of Fidelity Investments Money Management, Inc. (investment adviser firm, 2013-2016) and served in other fund officer roles.
Stacie M. Smith (1974)
Year of Election or Appointment: 2018
President and Treasurer
Ms. Smith also serves as an officer of other funds. Ms. Smith serves as Assistant Treasurer of FMR Capital, Inc. (2017-present), is an employee of Fidelity Investments (2009-present), and has served in other fund officer roles. Prior to joining Fidelity Investments, Ms. Smith served as Senior Audit Manager of Ernst & Young LLP (accounting firm, 1996-2009). Previously, Ms. Smith served as Assistant Treasurer (2013-2018) and Deputy Treasurer (2013-2016) of certain Fidelity® funds.
Marc L. Spector (1972)
Year of Election or Appointment: 2017
Assistant Treasurer
Mr. Spector also serves as an officer of other funds. Mr. Spector serves as Assistant Treasurer of FMR Capital, Inc. (2017-present) and is an employee of Fidelity Investments (2016-present). Prior to joining Fidelity Investments, Mr. Spector served as Director at the Siegfried Group (accounting firm, 2013-2016), and prior to Siegfried Group as audit senior manager at Deloitte & Touche (accounting firm, 2005-2013).
Jim Wegmann (1979)
Year of Election or Appointment: 2019
Assistant Treasurer
Mr. Wegmann also serves as Assistant Treasurer of other funds. Mr. Wegmann is an employee of Fidelity Investments (2011-present).
Shareholder Expense Example
As a shareholder of a Fund, you incur two types of costs: (1) transaction costs, including sales charges (loads) on purchase payments or redemption proceeds, and (2) ongoing costs, including management fees, distribution and/or service (12b-1) fees and other Fund expenses. This Example is intended to help you understand your ongoing costs (in dollars) of investing in the Funds and to compare these costs with the ongoing costs of investing in other mutual funds.
The actual expense Example is based on an investment of $1,000 invested at the beginning of the period and held for the entire period (September 1, 2018 to February 28, 2019), for Automotive Portfolio, Communication Services, Construction and Housing Portfolio, Consumer Discretionary Portfolio, Leisure Portfolio and Retailing Portfolio and for the period (November 30, 2018 to February 28, 2019) for Class A, Class M, Class C, Class I and Class Z in the Communication Services Portfolio. The hypothetical expense Example is based on an investment of $1,000 invested for the one-half year period (September 1, 2018 to February 28, 2019).
Actual Expenses
The first line of the accompanying table for each Class of each fund provides information about actual account values and actual expenses. You may use the information in this line, together with the amount you invested, to estimate the expenses that you paid over the period. Simply divide your account value by $1,000.00 (for example, an $8,600 account value divided by $1,000.00 = 8.6), then multiply the result by the number in the first line for a Class of the fund under the heading entitled "Expenses Paid During Period" to estimate the expenses you paid on your account during this period. In addition, each Fund, as a shareholder in the underlying Fidelity Central Funds, will indirectly bear its pro-rata share of the fees and expenses incurred by the underlying Fidelity Central Funds. These fees and expenses are not included in the Fund's annualized expense ratio used to calculate the expense estimate in the table below.
Hypothetical Example for Comparison Purposes
The second line of the accompanying table for each Class of each fund provides information about hypothetical account values and hypothetical expenses based on a Class' actual expense ratio and an assumed rate of return of 5% per year before expenses, which is not the Class' actual return. The hypothetical account values and expenses may not be used to estimate the actual ending account balance or expenses you paid for the period. You may use this information to compare the ongoing costs of investing in the Fund and other funds. To do so, compare this 5% hypothetical example with the 5% hypothetical examples that appear in the shareholder reports of the other funds. In addition, each Fund, as a shareholder in the underlying Fidelity Central Funds, will indirectly bear its pro-rata share of the fees and expenses incurred by the underlying Fidelity Central Funds. These fees and expenses are not included in the Fund's annualized expense ratio used to calculate the expense estimate in the table below.
Please note that the expenses shown in the table are meant to highlight your ongoing costs only and do not reflect any transaction costs. Therefore, the second line of the table is useful in comparing ongoing costs only, and will not help you determine the relative total costs of owning different funds. In addition, if these transactional costs were included, your costs would have been higher.
| | Annualized Expense Ratio-A | Beginning
Account Value
| Ending
Account Value
February 28, 2019 | Expenses Paid
During Period
|
| Automotive Portfolio | .98% | | | |
| Actual | | $1,000.00 | $980.60 | $4.81-B |
| Hypothetical-C | | $1,000.00 | $1,019.93 | $4.91-D |
| Communication Services Portfolio | | | | |
| Class A | 1.12% | | | |
| Actual | | $1,000.00 | $1,038.30 | $2.85-B |
| Hypothetical-C | | $1,000.00 | $1,019.24 | $5.61-D |
| Class M | 1.35% | | | |
| Actual | | $1,000.00 | $1,037.60 | $3.43-B |
| Hypothetical-C | | $1,000.00 | $1,018.10 | $6.76-D |
| Class C | 1.85% | | | |
| Actual | | $1,000.00 | $1,036.30 | $4.70-B |
| Hypothetical-C | | $1,000.00 | $1,015.62 | $9.25-D |
| Communication Services | .79% | | | |
| Actual | | $1,000.00 | $1,015.20 | $3.95-B |
| Hypothetical-C | | $1,000.00 | $1,020.88 | $3.96-D |
| Class I | .69% | | | |
| Actual | | $1,000.00 | $1,039.10 | $1.75-B |
| Hypothetical-C | | $1,000.00 | $1,021.37 | $3.46-D |
| Class Z | .62% | | | |
| Actual | | $1,000.00 | $1,039.20 | $1.58-B |
| Hypothetical-C | | $1,000.00 | $1,021.72 | $3.11-D |
| Construction and Housing Portfolio | .80% | | | |
| Actual | | $1,000.00 | $962.80 | $3.89-B |
| Hypothetical-C | | $1,000.00 | $1,020.83 | $4.01-D |
| Consumer Discretionary Portfolio | .78% | | | |
| Actual | | $1,000.00 | $943.00 | $3.76-B |
| Hypothetical-C | | $1,000.00 | $1,020.93 | $3.91-D |
| Leisure Portfolio | .76% | | | |
| Actual | | $1,000.00 | $1,028.80 | $3.82-B |
| Hypothetical-C | | $1,000.00 | $1,021.03 | $3.81-D |
| Retailing Portfolio | .75% | | | |
| Actual | | $1,000.00 | $915.30 | $3.56-B |
| Hypothetical-C | | $1,000.00 | $1,021.08 | $3.76-D |
A Annualized expense ratio reflects expenses net of applicable fee waivers.
B Actual expenses are equal to each Class' annualized expense ratio, multiplied by the average account value over the period, multiplied by 181/365 (to reflect the one-half year), for Automotive Portfolio, Communication Services, Construction and Housing Portfolio, Consumer Discretionary Portfolio, Leisure Portfolio and Retailing Portfolio and multiplied by 91/365 (to reflect the period November 30, 2018 to February 28, 2019) for Class A, Class M, Class C, Class I and Class Z in the Communication Services Portfolio.
C 5% return per year before expenses
D Hypothetical expenses are equal to each Class' annualized expense ratio, multiplied by the average account value over the period, multiplied by 181/365 (to reflect the one-half year period).
Distributions (Unaudited)
The Board of Trustees of each fund voted to pay to shareholders of record at the opening of business on record date, the following distributions per share derived from capital gains realized from sales of portfolio securities, and dividends derived from net investment income:
| | Pay Date | Record Date | Dividends | Capital Gains |
| Automotive Portfolio | 04/08/19 | 04/05/19 | $0.025 | $0.102 |
| Communication Services Portfolio | | | | |
| Class A | 04/15/19 | 04/12/19 | $0.000 | $18.854 |
| Class M | 04/15/19 | 04/12/19 | $0.000 | $18.854 |
| Class C | 04/15/19 | 04/12/19 | $0.000 | $18.854 |
| Communication Services | 04/15/19 | 04/12/19 | $0.000 | $18.854 |
| Class I | 04/15/19 | 04/12/19 | $0.000 | $18.854 |
| Class Z | 04/15/19 | 04/12/19 | $0.000 | $18.854 |
| Construction and Housing Portfolio | 04/08/19 | 04/05/19 | $0.060 | $2.093 |
| Consumer Discretionary Portfolio | 04/08/19 | 04/05/19 | $0.000 | $0.974 |
| Leisure Portfolio | 04/08/19 | 04/05/19 | $0.003 | $0.012 |
| Retailing Portfolio | 04/08/19 | 04/05/19 | $0.000 | $0.312 |
The funds hereby designate as capital gain dividend the amounts noted below for the taxable year ended February 28, 2019, or, if subsequently determined to be different, the net capital gain of such year.
| Automotive Portfolio | $1,129,343 |
| Communication Services Portfolio | $197,471,420 |
| Construction and Housing Portfolio | $30,015,562 |
| Consumer Discretionary Portfolio | $16,925,303 |
| Leisure Portfolio | $52,070,977 |
| Retailing Portfolio | $100,452,783 |
A percentage of the dividends distributed during the fiscal year for the following funds qualify for the dividends–received deduction for corporate shareholders:
| | April 2018 | December 2018 |
| Automotive Portfolio | 100% | 100% |
| Communication Services Portfolio | | |
| Class A | – | 100% |
| Class M | – | 100% |
| Class C | – | 100% |
| Communication Services | 100% | 100% |
| Class I | – | 99% |
| Class Z | – | 94% |
| Construction and Housing Portfolio | 100% | 100% |
| Consumer Discretionary Portfolio | 100% | 100% |
| Leisure Portfolio | 100% | 100% |
| Retailing Portfolio | – | 100% |
A percentage of the dividends distributed during the fiscal year for the following funds may be taken into account as a dividend for purposes of the maximum rate under section 1(h)(11) of the Internal Revenue Code.
| | April 2018 | December 2018 |
| Automotive Portfolio | 100% | 100% |
| Communication Services Portfolio | | |
| Class A | – | 100% |
| Class M | – | 100% |
| Class C | – | 100% |
| Communication Services | 100% | 100% |
| Class I | – | 99% |
| Class Z | – | 94% |
| Construction and Housing Portfolio | 100% | 100% |
| Consumer Discretionary Portfolio | 100% | 100% |
| Leisure Portfolio | 100% | 100% |
| Retailing Portfolio | – | 100% |
The funds will notify shareholders in January 2020 of amounts for use in preparing 2019 income tax returns.
Board Approval of Investment Advisory Contracts and Management Fees
Automotive Portfolio
Communication Services Portfolio
Construction and Housing Portfolio
Consumer Discretionary Portfolio
Leisure Portfolio
Retailing Portfolio
Each year, the Board of Trustees, including the Independent Trustees (together, the Board), votes on the renewal of the management contract with Fidelity SelectCo, LLC (SelectCo), an affiliate of Fidelity Management & Research Company (FMR), and the sub-advisory agreements with affiliates of FMR (together, the Advisory Contracts) for each fund. SelectCo and the sub-advisers are referred to herein as the Investment Advisers. The Board, assisted by the advice of fund counsel and Independent Trustees' counsel, requests and considers a broad range of information relevant to the renewal of the Advisory Contracts throughout the year.
The Board meets regularly and, at each of its meetings, covers an extensive agenda of topics and materials and considers factors that are relevant to its annual consideration of the renewal of each fund's Advisory Contracts, including the services and support provided to each fund and its shareholders. The Board has established various standing committees (Committees), each composed of and chaired by Independent Trustees with varying backgrounds, to which the Board has assigned specific subject matter responsibilities in order to enhance effective decision-making by the Board. The Board, acting directly and through its Committees, requests and receives information concerning the annual consideration of the renewal of each fund's Advisory Contracts. The Board also meets as needed to review matters specifically related to the Board's annual consideration of the renewal of the Advisory Contracts. Members of the Board may also meet with trustees of other Fidelity funds through joint ad hoc committees to discuss certain matters relevant to all of the Fidelity funds.
At its January 2019 meeting, the Board unanimously determined to renew each fund's Advisory Contracts. In reaching its determination, the Board considered all factors it believed relevant, including (i) the nature, extent, and quality of the services to be provided to each fund and its shareholders (including the investment performance of each fund); (ii) the competitiveness of each fund's management fee and total expense ratio relative to peer funds; (iii) the total costs of the services to be provided by and the profits to be realized by Fidelity from its relationships with each fund; and (iv) the extent to which, if any, economies of scale exist and would be realized as each fund grows, and whether any economies of scale are appropriately shared with fund shareholders.
In considering whether to renew the Advisory Contracts for each fund, the Board reached a determination, with the assistance of fund counsel and Independent Trustees' counsel and through the exercise of its business judgment, that the renewal of the Advisory Contracts was in the best interests of each fund and its shareholders and that the compensation payable under the Advisory Contracts was fair and reasonable. The Board's decision to renew the Advisory Contracts was not based on any single factor, but rather was based on a comprehensive consideration of all the information provided to the Board at its meetings throughout the year. The Board, in reaching its determination to renew the Advisory Contracts, was aware that shareholders of each fund have a broad range of investment choices available to them, including a wide choice among funds offered by Fidelity's competitors, and that each fund's shareholders, who have the opportunity to review and weigh the disclosure provided by the fund in its prospectus and other public disclosures, have chosen to invest in that fund, which is part of the Fidelity family of funds.
Nature, Extent, and Quality of Services Provided. The Board considered Fidelity's staffing as it relates to the funds, including the backgrounds of investment personnel of Fidelity, and also considered the funds' investment objectives, strategies, and related investment philosophies. The Independent Trustees also had discussions with senior management of Fidelity's investment operations and investment groups. The Board considered the structure of the investment personnel compensation program and whether this structure provides appropriate incentives to act in the best interests of each fund. Additionally, the Board considered the portfolio managers' investments, if any, in the funds that they manage.
Resources Dedicated to Investment Management and Support Services. The Board and the Fund Oversight and Research Committees reviewed the general qualifications and capabilities of Fidelity's investment staff, including its size, education, experience, and resources, as well as Fidelity's approach to recruiting, training, managing, and compensating investment personnel. The Board noted that Fidelity has continued to increase the resources devoted to non-U.S. offices, including expansion of Fidelity's global investment organization. The Board also noted that Fidelity's analysts have extensive resources, tools and capabilities that allow them to conduct sophisticated quantitative and fundamental analysis, as well as credit analysis of issuers, counterparties and guarantors. Further, the Board considered that Fidelity's investment professionals have sufficient access to global information and data so as to provide competitive investment results over time, and that those professionals also have access to sophisticated tools that permit them to assess portfolio construction and risk and performance attribution characteristics continuously, as well as to transmit new information and research conclusions rapidly around the world. Additionally, in its deliberations, the Board considered Fidelity's trading, risk management, compliance, and technology and operations capabilities and resources, which are integral parts of the investment management process.
Shareholder and Administrative Services. The Board considered (i) the nature, extent, quality, and cost of advisory, administrative, and shareholder services performed by the Investment Advisers and their affiliates under the Advisory Contracts and under separate agreements covering transfer agency, pricing and bookkeeping, and securities lending services for each fund; (ii) the nature and extent of the supervision of third party service providers, principally custodians, subcustodians, and pricing vendors; and (iii) the resources devoted to, and the record of compliance with, each fund's compliance policies and procedures. The Board also reviewed the allocation of fund brokerage, including allocations to brokers affiliated with the Investment Advisers, the use of brokerage commissions to pay fund expenses, and the use of "soft" commission dollars to pay for research services.
The Board noted that the growth of fund assets over time across the complex allows Fidelity to reinvest in the development of services designed to enhance the value and convenience of the Fidelity funds as investment vehicles. These services include 24-hour access to account information and market information through telephone representatives and over the Internet, investor education materials and asset allocation tools, and the expanded availability of Fidelity Investor Centers.
The Board noted that it and the boards of certain other Fidelity funds had formed an ad hoc Committee on Transfer Agency Fees to review the variety of transfer agency fee structures throughout the industry and Fidelity's competitive positioning with respect to industry participants.
Investment in a Large Fund Family. The Board considered the benefits to shareholders of investing in a Fidelity fund, including the benefits of investing in a fund that is part of a large family of funds offering a variety of investment disciplines and providing a large variety of mutual fund investor services. The Board noted that Fidelity had taken, or had made recommendations that resulted in the Fidelity funds taking, a number of actions over the previous year that benefited particular funds, including: (i) continuing to dedicate additional resources to Fidelity's investment research process, which includes meetings with management of issuers of securities in which the funds invest, and to the support of the senior management team that oversees asset management; (ii) continuing efforts to enhance Fidelity's global research capabilities; (iii) launching new funds and making other enhancements to meet client needs; (iv) launching new share classes of existing funds; (v) eliminating purchase minimums and broadening eligibility requirements for certain funds and share classes; (vi) reducing management fees and total expenses for certain growth equity funds and index funds; (vii) lowering expense caps for certain existing funds and classes, and converting certain voluntary expense caps to contractual caps, to reduce expenses borne by shareholders; (viii) eliminating short-term redemption fees for funds that had such fees; (ix) rationalizing product lines and gaining increased efficiencies from fund mergers and share class consolidations; (x) continuing to develop, acquire and implement systems and technology to improve services to the funds and shareholders, strengthen information security, and increase efficiency; and (xi) continuing to implement enhancements to further strengthen Fidelity's product line to increase investors' probability of success in achieving their investment goals, including retirement income goals.
Investment Performance. The Board considered whether each fund has operated in accordance with its investment objective, as well as its record of compliance with its investment restrictions and its performance history. Leisure Portfolio had a portfolio manager change in March 2018. Retailing Portfolio had a portfolio manager change in April 2018. The Board will continue to monitor closely each fund's performance, taking into account the portfolio manager changes.
The Board took into account discussions that occur at Board meetings throughout the year with representatives of the Investment Advisers about fund investment performance. In this regard the Board noted that as part of regularly scheduled fund reviews and other reports to the Board on fund performance, the Board considers annualized return information for each fund for different time periods, measured against an appropriate securities market index ("benchmark index"). In its evaluation of fund investment performance, the Board gave particular attention to information indicating changes in performance of certain Fidelity funds for specific time periods and discussed with the Investment Advisers the reasons for any overperformance or underperformance.
In addition to reviewing absolute and relative fund performance, the Independent Trustees periodically consider the appropriateness of fund performance metrics in evaluating the results achieved. In general, the Independent Trustees believe that fund performance should be evaluated based on net performance (after fees and expenses) of both the highest performing and lowest performing fund share classes, where applicable, compared to appropriate benchmark indices, over appropriate time periods that may include full market cycles, taking into account relevant factors including the following: general market conditions; issuer-specific information; and fund cash flows and other factors.
The Independent Trustees recognize that shareholders evaluate performance on a net basis over their own holding periods, for which one-, three-, and five-year periods are often used as a proxy. For this reason, the performance information reviewed by the Board also included net cumulative total return information for each fund and an appropriate benchmark index for the most recent one-, three-, and five-year periods ended June 30, 2018, as shown below.
Automotive Portfolio
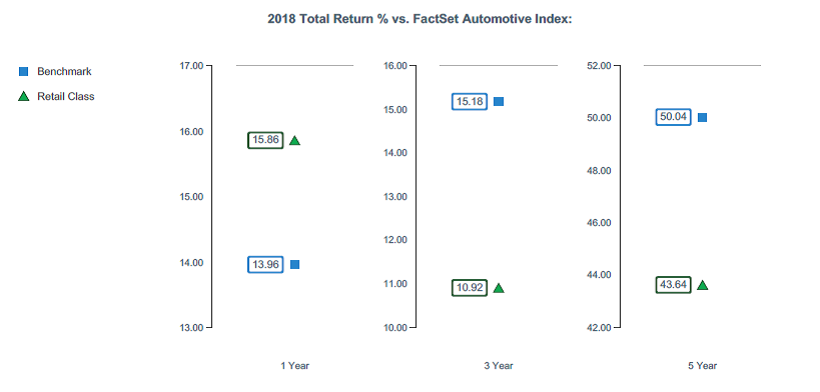
Communication Services Portfolio
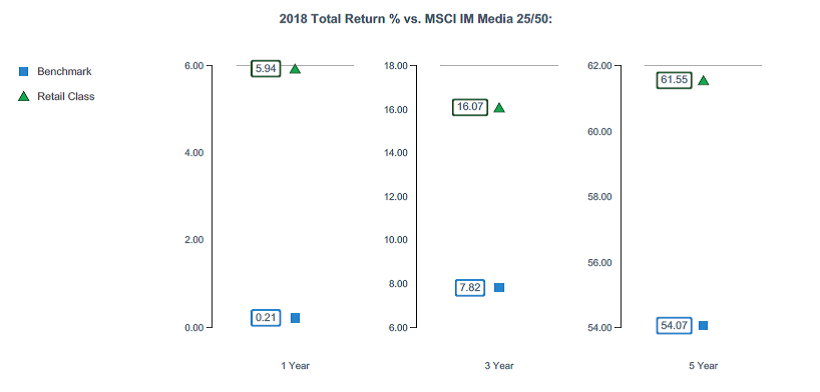
Construction and Housing Portfolio
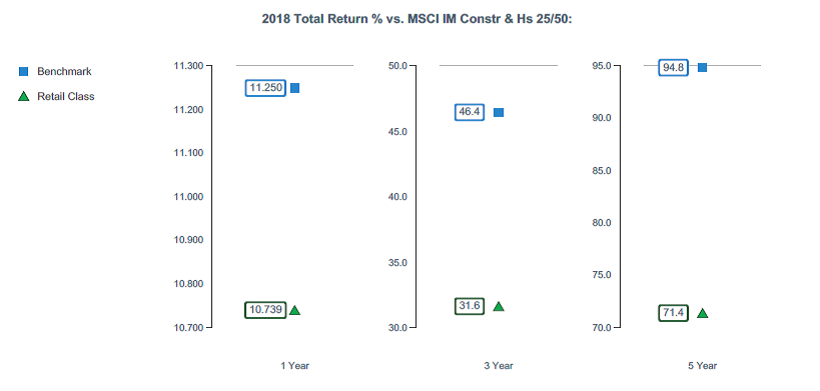
The Board considered the fund's underperformance for different time periods based on the June 30, 2018 data presented above and based on earlier periods ended prior to June 30, 2018. The Board noted that the fund's underperformance has continued since the Board approved the management contract in 2017 and 2018. The Board's discussions with SelectCo regarding underperformance cover topics including, but not limited to: the longer-term track record of a fund's portfolio manager(s); broader trends in the market that may adversely impact a fund's performance; attribution reports on contributors to the fund's underperformance; and the applicable portfolio manager's explanation of his or her underperformance. The Board engages with SelectCo on steps that might be taken to address a fund's underperformance. For a fund with underperformance over longer periods of time, the Board typically monitors the effect of any remedial actions and other relevant factors.
Consumer Discretionary Portfolio
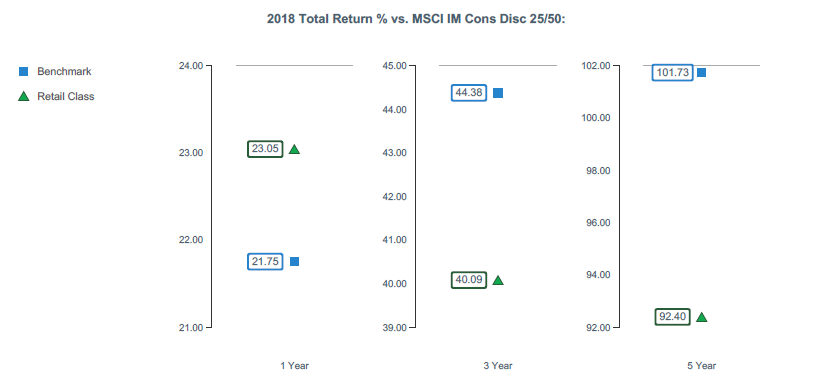
Leisure Portfolio
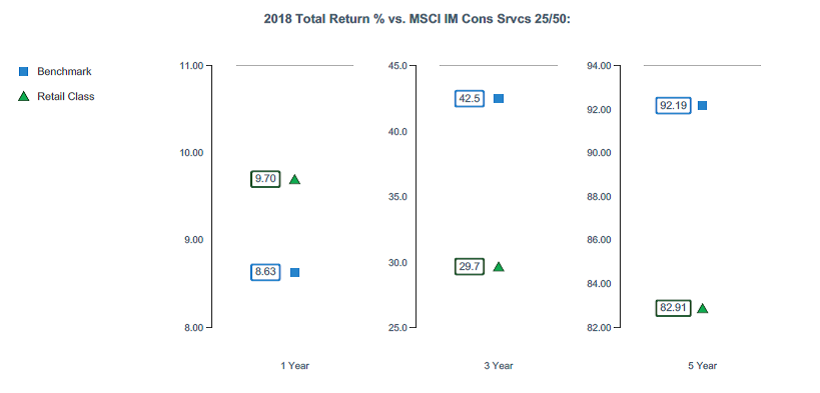
The Board considered the fund's underperformance for different time based on time periods ended prior to June 30, 2018 (which periods are not shown in the chart above). The Board noted that the fund's underperformance has continued since the Board approved the management contract in 2018. The Board's discussions with SelectCo regarding underperformance cover topics including, but not limited to: the longer-term track record of a fund's portfolio manager(s); broader trends in the market that may adversely impact a fund's performance; attribution reports on contributors to the fund's underperformance; and the applicable portfolio manager's explanation of his or her underperformance. The Board engages with SelectCo on steps that might be taken to address a fund's underperformance. The Board noted that the fund's more recent performance had improved.
Retailing Portfolio
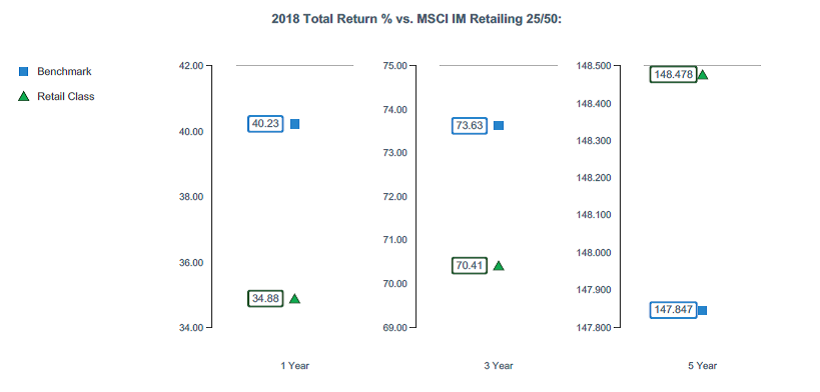
Based on its review, the Board concluded that the nature, extent, and quality of services provided to each fund under the Advisory Contracts should continue to benefit the shareholders of each fund.
Competitiveness of Management Fee and Total Expense Ratio. The Board considered each fund's management fee and total expense ratio compared to "mapped groups" of competitive funds and classes created for the purpose of facilitating the Trustees' competitive analysis of management fees and total expenses. Fidelity creates "mapped groups" by combining similar Lipper investment objective categories that have comparable investment mandates. For this purpose, all sector focused equity funds are grouped in the same mapped group. Combining Lipper investment objective categories aids the Board's management fee and total expense ratio comparisons by broadening the competitive group used for comparison.
Management Fee. The Board considered two proprietary management fee comparisons for the 12-month periods ended June 30 shown in basis points (BP) in the charts below. The group of Lipper funds used by the Board for management fee comparisons is referred to below as the "Total Mapped Group." The Total Mapped Group comparison focuses on a fund's standing in terms of gross management fees before expense reimbursements or caps relative to the total universe of funds with comparable investment mandates (i.e., sector equities), regardless of whether their management fee structures also are comparable. Funds with comparable management fee structures have similar management fee contractual arrangements (
e.g., flat rate charged for advisory services, all-inclusive fee rate,
etc.). "TMG %" represents the percentage of funds in the Total Mapped Group that had management fees that were lower than a fund's. For example, a hypothetical TMG % of 20% would mean that 80% of the funds in the Total Mapped Group had higher, and 20% had lower, management fees than a fund. The funds' actual TMG %s and the number of funds in the Total Mapped Group are in the charts below. The "Asset-Size Peer Group" (ASPG) comparison focuses on a fund's standing relative to a subset of non-Fidelity funds within the Total Mapped Group that are similar in size and management fee structure. For example, if a fund is in the first quartile of the ASPG, the fund's management fee ranks in the least expensive or lowest 25% of funds in the ASPG. The ASPG represents at least 15% of the funds in the Total Mapped Group with comparable asset size and management fee structures, subject to a minimum of 50 funds (or all funds in the Total Mapped Group if fewer than 50). Additional information, such as the ASPG quartile in which a fund's management fee rate ranked, is also included in the charts and was considered by the Board.
Automotive Portfolio
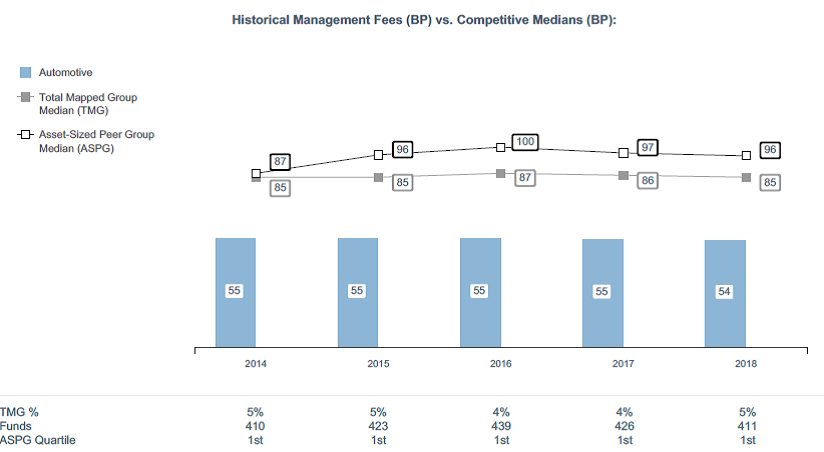
Communication Services Portfolio
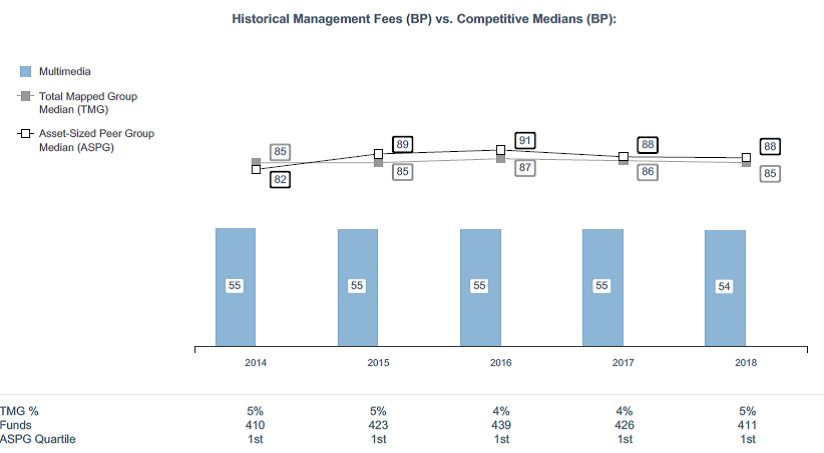
Construction and Housing Portfolio
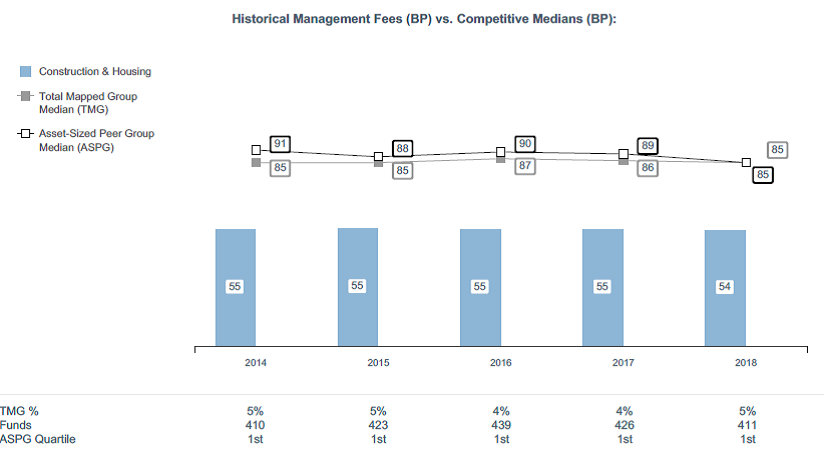
Consumer Discretionary Portfolio
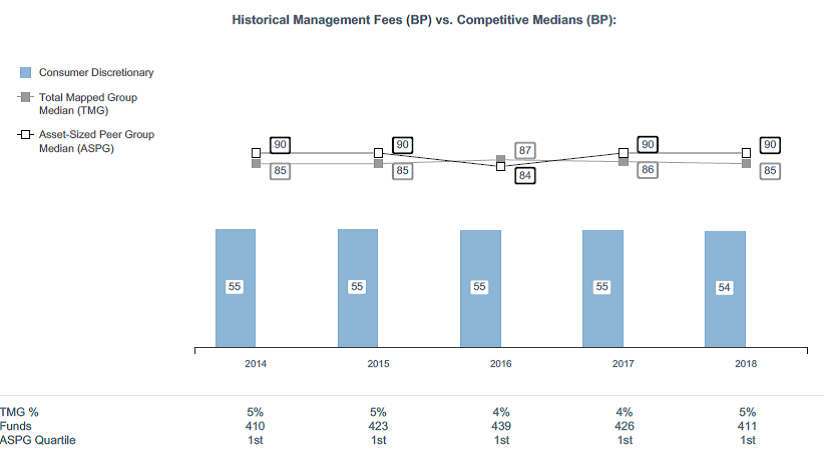
Leisure Portfolio

Retailing Portfolio
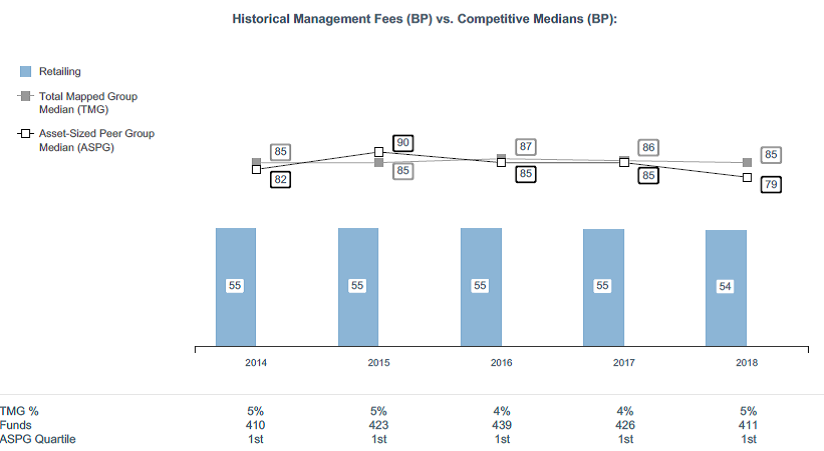
The Board noted that each fund's management fee rate ranked below the median of its Total Mapped Group and below the median of its ASPG for the 12-month period ended June 30, 2018.
The Board noted that it and the boards of other Fidelity funds formed an ad hoc Committee on Group Fee, which meets periodically, to conduct an in-depth review of the "group fee" component of the management fee of funds with such management fee structures. The Committee's focus included the mechanics of the group fee, the competitive landscape of group fee structures, Fidelity funds with no group fee component and investment products not included in group fee assets. The Board also considered that, for funds subject to the group fee, FMR agreed to voluntarily waive fees over a specified period of time in amounts designed to account for assets converted from certain funds to certain collective investment trusts.
Based on its review, the Board concluded that each fund's management fee is fair and reasonable in light of the services that the fund receives and the other factors considered.
Total Expense Ratio. In its review of each fund's total expense ratio, the Board considered the fund's management fee rate as well as other fund expenses, such as transfer agent fees, pricing and bookkeeping fees, and custodial, legal, and audit fees. The Board also noted that Fidelity may agree to waive fees and expenses from time to time, and the extent to which, if any, it has done so for each fund. As part of its review, the Board also considered the current and historical total expense ratios of each fund compared to competitive fund median expenses. Each fund is compared to those funds and classes in the Total Mapped Group (used by the Board for management fee comparisons) that have a similar sales load structure.
The Board noted that each fund's total expense ratio ranked below the competitive median for the 12-month period ended June 30, 2018.
Fees Charged to Other Fidelity Clients. The Board also considered Fidelity fee structures and other information with respect to clients of Fidelity, such as other funds advised or subadvised by Fidelity, pension plan clients, and other institutional clients with similar mandates. The Board noted that a joint ad hoc committee created by it and the boards of other Fidelity funds periodically reviews and compares Fidelity's institutional investment advisory business with its business of providing services to the Fidelity funds and also noted the most recent findings of the committee. The Board noted that the committee's review included a consideration of the differences in services provided, fees charged, and costs incurred, as well as competition in the markets serving the different categories of clients.
Based on its review of total expense ratios and fees charged to other Fidelity clients, the Board concluded that each fund's total expense ratio was reasonable in light of the services that the fund and its shareholders receive and the other factors considered.
Costs of the Services and Profitability. The Board considered the revenues earned and the expenses incurred by Fidelity in conducting the business of developing, marketing, distributing, managing, administering and servicing each fund and servicing each fund's shareholders. The Board also considered the level of Fidelity's profits in respect of all the Fidelity funds.
On an annual basis, Fidelity presents to the Board information about the profitability of its relationships with each fund. Fidelity calculates profitability information for each fund, as well as aggregate profitability information for groups of Fidelity funds and all Fidelity funds, using a series of detailed revenue and cost allocation methodologies which originate with the books and records of Fidelity on which Fidelity's audited financial statements are based. The Audit Committee of the Board reviews any significant changes from the prior year's methodologies.
PricewaterhouseCoopers LLP (PwC), auditor to Fidelity and certain Fidelity funds, has been engaged annually by the Board as part of the Board's assessment of Fidelity's profitability analysis. PwC's engagement includes the review and assessment of the methodologies used by Fidelity in determining the revenues and expenses attributable to Fidelity's mutual fund business, and completion of agreed-upon procedures in respect of the mathematical accuracy of the fund profitability information and its conformity to established allocation methodologies. After considering PwC's reports issued under the engagement and information provided by Fidelity, the Board concluded that while other allocation methods may also be reasonable, Fidelity's profitability methodologies are reasonable in all material respects.
The Board also reviewed Fidelity's non-fund businesses and potential indirect benefits such businesses may have received as a result of their association with Fidelity's mutual fund business (i.e., fall-out benefits) as well as cases where Fidelity's affiliates may benefit from the funds' business. The Board noted that changes to fall-out benefits year-over-year reflect business developments at Fidelity's various businesses.
The Board considered the costs of the services provided by and the profits realized by Fidelity in connection with the operation of each fund and was satisfied that the profitability was not excessive.
Economies of Scale. The Board considered whether there have been economies of scale in respect of the management of the Fidelity funds, whether the Fidelity funds (including each fund) have appropriately benefited from any such economies of scale, and whether there is potential for realization of any further economies of scale. The Board considered the extent to which each fund will benefit from economies of scale as assets grow through increased services to the fund, through waivers or reimbursements, or through fee or expense ratio reductions. The Board also noted that a committee (the Economies of Scale Committee) created by it and the boards of other Fidelity funds periodically analyzes whether Fidelity attains economies of scale in respect of the management and servicing of the Fidelity funds, whether the Fidelity funds have appropriately benefited from such economies of scale, and whether there is potential for realization of any further economies of scale.
The Board recognized that each fund's management contract incorporates a "group fee" structure, which provides for lower group fee rates as total group assets increase, and for higher group fee rates as total group assets decrease (with "group assets" defined to include fund assets under SelectCo's management plus assets under FMR's management). SelectCo calculates the group fee rates based on a tiered asset "breakpoint" schedule that varies based on asset class. The Board considered that the group fee is designed to deliver the benefits of economies of scale to fund shareholders when total group assets increase, even if assets of any particular fund are unchanged or have declined, because some portion of Fidelity's costs are attributable to services provided to all Fidelity funds, and all funds benefit if those costs can be allocated among more assets. The Board concluded that, given the group fee structure, fund shareholders will benefit from lower management fees as group assets increase at the fund complex level, regardless of whether Fidelity achieves any such economies of scale.
The Board concluded, taking into account the analysis of the Economies of Scale Committee, that economies of scale, if any, are being appropriately shared between fund shareholders and Fidelity.
Additional Information Requested by the Board. In order to develop fully the factual basis for consideration of the Fidelity funds' advisory contracts, the Board requested and received additional information on certain topics, including: (i) fund performance trends, in particular the underperformance of certain funds, and Fidelity's long-term strategies for certain funds; (ii) Fidelity's fund profitability methodology, profitability trends for certain funds, and the impact of certain factors on fund profitability results; (iii) metrics for evaluating index fund and ETF performance and information about ETF trading characteristics; (iv) the methodology with respect to the evaluation of competitive fund data and peer group classifications and fee comparisons; (v) the expense structures for different funds and classes; (vi) information regarding other accounts managed by Fidelity, including collective investment trusts; and (vii) Fidelity's philosophies and strategies for evaluating funds and classes with lower or declining asset levels.
Based on its evaluation of all of the conclusions noted above, and after considering all factors it believed relevant, the Board concluded that the advisory fee arrangements are fair and reasonable, and that each fund's Advisory Contracts should be renewed.
Proxy Voting Results
A special meeting of Communication Services Portfolio's shareholders was held on October 17, 2018. The results of votes taken among shareholders on the proposal before them are reported below. Each vote reported represents one dollar of net asset value held on the record date for the meeting.
PROPOSAL 1
To modify the fund's fundamental concentration policy.
| | # of
Votes | % of
Votes |
| For | 291,265,206.38 | 91.526 |
| Against | 14,552,941.89 | 4.573 |
| Abstain | 12,416,617.75 | 3.901 |
| TOTAL | 318,234,766.02 | 100.000 |

SELCON-ANN-0419
1.813633.114
Fidelity® Select Portfolios®
Energy Sector Energy Portfolio
Energy Service Portfolio
Natural Gas Portfolio
Natural Resources Portfolio
Annual Report February 28, 2019 |
|
Beginning on January 1, 2021, as permitted by regulations adopted by the Securities and Exchange Commission, paper copies of a fund’s shareholder reports will no longer be sent by mail, unless you specifically request paper copies of the reports from the fund or from your financial intermediary, such as a financial advisor, broker-dealer or bank. Instead, the reports will be made available on a website, and you will be notified by mail each time a report is posted and provided with a website link to access the report.
If you already elected to receive shareholder reports electronically, you will not be affected by this change and you need not take any action. You may elect to receive shareholder reports and other communications from a fund electronically, by contacting your financial intermediary. For Fidelity customers, visit Fidelity's web site or call Fidelity using the contact information listed below.
You may elect to receive all future reports in paper free of charge. If you wish to continue receiving paper copies of your shareholder reports, you may contact your financial intermediary or, if you are a Fidelity customer, visit Fidelity’s website, or call Fidelity at the applicable toll-free number listed below. Your election to receive reports in paper will apply to all funds held with the fund complex/your financial intermediary.
| Account Type | Website | Phone Number |
| Brokerage, Mutual Fund, or Annuity Contracts: | fidelity.com/mailpreferences | 1-800-343-3548 |
| Employer Provided Retirement Accounts: | netbenefits.fidelity.com/preferences (choose 'no' under Required Disclosures to continue to print) | 1-800-343-0860 |
| Advisor Sold Accounts Serviced Through Your Financial Intermediary: | Contact Your Financial Intermediary | Your Financial Intermediary's phone number |
| Advisor Sold Accounts Serviced by Fidelity: | institutional.fidelity.com | 1-877-208-0098 |
Contents
To view a fund's proxy voting guidelines and proxy voting record for the 12-month period ended June 30, visit http://www.fidelity.com/proxyvotingresults or visit the Securities and Exchange Commission's (SEC) web site at http://www.sec.gov.
You may also call 1-800-544-8544 to request a free copy of the proxy voting guidelines.
Standard & Poor's, S&P and S&P 500 are registered service marks of The McGraw-Hill Companies, Inc. and have been licensed for use by Fidelity Distributors Corporation.
Other third-party marks appearing herein are the property of their respective owners.
All other marks appearing herein are registered or unregistered trademarks or service marks of FMR LLC or an affiliated company. © 2019 FMR LLC. All rights reserved.
This report and the financial statements contained herein are submitted for the general information of the shareholders of the Funds. This report is not authorized for distribution to prospective investors in the Funds unless preceded or accompanied by an effective prospectus.
A fund files its complete schedule of portfolio holdings with the SEC for the first and third quarters of each fiscal year on Form N-Q. Forms N-Q are available on the SEC’s web site at http://www.sec.gov. A fund's Forms N-Q may be reviewed and copied at the SEC’s Public Reference Room in Washington, DC. Information regarding the operation of the SEC's Public Reference Room may be obtained by calling 1-800-SEC-0330.
For a complete list of a fund's portfolio holdings, view the most recent holdings listing, semiannual report, or annual report on Fidelity's web site at http://www.fidelity.com, http://www.institutional.fidelity.com, or http://www.401k.com, as applicable.
NOT FDIC INSURED •MAY LOSE VALUE •NO BANK GUARANTEE
Neither the Funds nor Fidelity Distributors Corporation is a bank.
Energy Portfolio
Performance: The Bottom Line
Average annual total return reflects the change in the value of an investment, assuming reinvestment of distributions from dividend income and capital gains (the profits earned upon the sale of securities that have grown in value, if any) and assuming a constant rate of performance each year. The hypothetical investment and the average annual total returns do not reflect the deduction of taxes that a shareholder would pay on fund distributions or the redemption of fund shares. During periods of reimbursement by Fidelity, a fund’s total return will be greater than it would be had the reimbursement not occurred. How a fund did yesterday is no guarantee of how it will do tomorrow.
Average Annual Total Returns
| For the periods ended February 28, 2019 | Past 1 year | Past 5 years | Past 10 years |
| Energy Portfolio | (7.30)% | (5.15)% | 6.21% |
$10,000 Over 10 Years
Let's say hypothetically that $10,000 was invested in Energy Portfolio on February 28, 2009.
The chart shows how the value of your investment would have changed, and also shows how the S&P 500® Index performed over the same period.
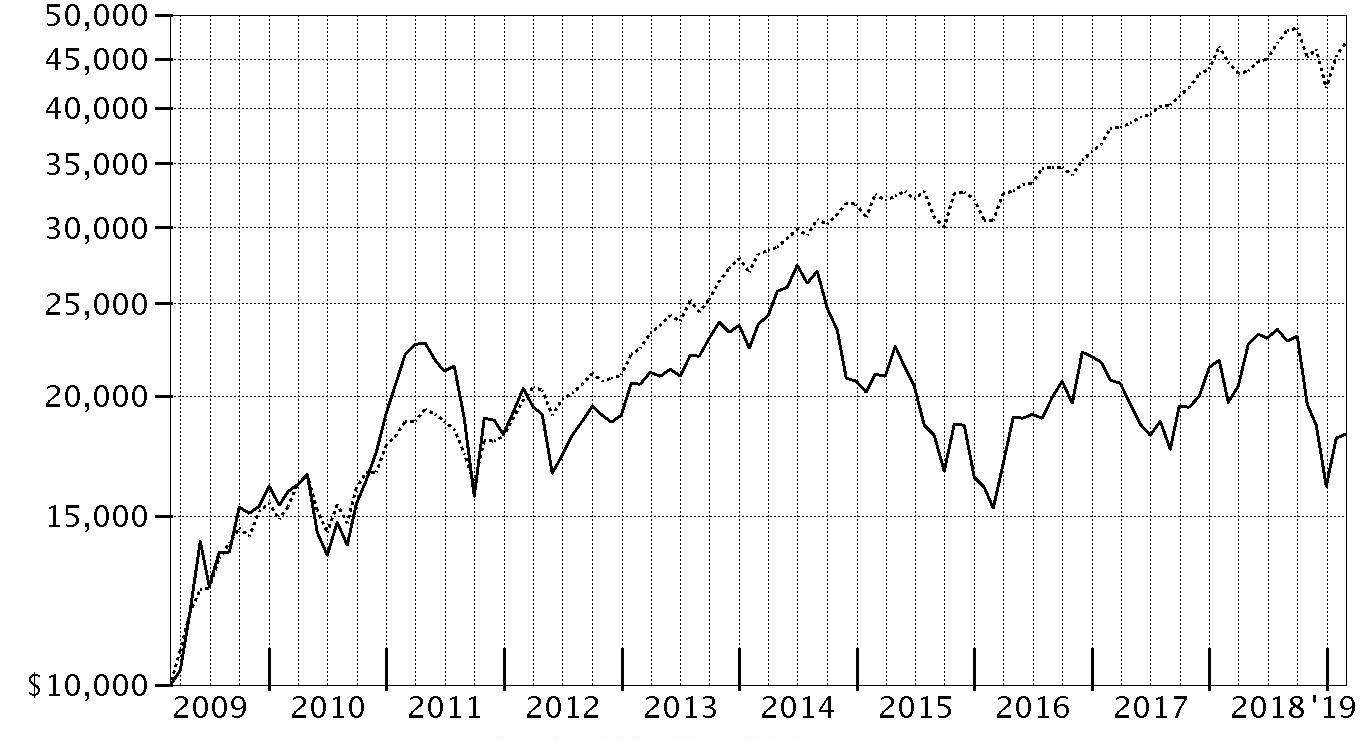
| Period Ending Values |
| $18,265 | Energy Portfolio |
| $46,739 | S&P 500® Index |
Energy Portfolio
Management's Discussion of Fund Performance
Market Recap: The S&P 500
® index gained 4.68% for the 12 months ending February 28, 2019, as the U.S. equity bellwether began the new year on a high note after enduring a final quarter of 2018 in which resurgent volatility upset the aging bull market. In October, rising U.S. Treasury yields and concern about peaking corporate earnings growth sent many investors fleeing from risk assets as they were still dealing with lingering uncertainty related to global trade and the U.S. Federal Reserve picking up the pace of interest rate hikes. The index returned -6.84% in October, at the time its largest monthly drop in seven years. But conditions worsened through Christmas, as jitters about the economy and another hike in rates led to a spike in market volatility and a -9.03% result for December. Sharply reversing course to begin 2019, the S&P 500
® gained 11.48% year-to-date, its strongest two-month opening since 1991, amid upbeat company earnings/outlooks and signs the Fed may pause on rates. For the full period, some economically sensitive sectors fared worst, with financials (-6%) and materials (-6%) both losing ground. Energy gained 1%, while communication services and industrials each rose roughly 2%. In contrast, the defensive utilities (+20%), real estate (+20%) and health care (+11%) sectors led the way, while consumer staples finished near the index. Information technology and consumer discretionary were rattled in the late-2018 downturn, but earlier strength contributed to advances of 9% and roughly 7%, respectively.
Comments from Portfolio Manager John Dowd: For the fiscal year, the fund returned -7.30%, trailing the -0.76% result of the MSCI U.S. IMI Energy 25/50 Index, as well as the broad-based S&P 500
® index. The backdrop for energy stocks was challenging the past year, due in large part to volatile U.S. crude-oil prices. In the fourth quarter of 2018, the West Texas Intermediate spot price, a proxy for U.S. crude, tumbled about 45% on a peak-to-trough basis, before rebounding some in early 2019. The decline occurred in large part because domestic production growth exceeded global demand, and because dynamic U.S. government policy regarding Iranian sanctions led to excess global supply. Versus the MSCI sector index, my longstanding strategy of overweighting oil & gas exploration & production (E&P) stocks and underweighting integrated oil & gas stocks notably detracted. Within the sector index, integrated oil & gas (+9%) held up much better than E&Ps (-7%) the past year. Positioning in the oil & gas storage and transportation group also hurt relative performance. The two biggest detractors versus the index were underweighted positions in integrated oil & gas giant Exxon Mobil and E&P ConocoPhillips. Conversely, favorable stock picking and an underweighting in the oil & gas equipment & services segment contributed most to our relative result. Here, a sizable underweighting in equipment and services firm Schlumberger was the top contributor versus the index. Non-index investments in E&P stocks Viper Energy Partners and Magnolia Oil & Gas also contributed.
The views expressed above reflect those of the portfolio manager(s) only through the end of the period as stated on the cover of this report and do not necessarily represent the views of Fidelity or any other person in the Fidelity organization. Any such views are subject to change at any time based upon market or other conditions and Fidelity disclaims any responsibility to update such views. These views may not be relied on as investment advice and, because investment decisions for a Fidelity fund are based on numerous factors, may not be relied on as an indication of trading intent on behalf of any Fidelity fund.
Energy Portfolio
Investment Summary (Unaudited)
Top Ten Stocks as of February 28, 2019
| | % of fund's net assets |
| Chevron Corp. | 10.7 |
| EOG Resources, Inc. | 7.5 |
| Valero Energy Corp. | 4.6 |
| Diamondback Energy, Inc. | 4.6 |
| Phillips 66 Co. | 4.1 |
| Exxon Mobil Corp. | 3.8 |
| Pioneer Natural Resources Co. | 3.7 |
| Anadarko Petroleum Corp. | 3.7 |
| Marathon Petroleum Corp. | 3.0 |
| Delek U.S. Holdings, Inc. | 2.8 |
| | 48.5 |
Top Industries (% of fund's net assets)
| As of February 28, 2019 |
| | Oil, Gas & Consumable Fuels | 90.2% |
| | Energy Equipment & Services | 8.5% |
| | Machinery | 0.9% |
| | Chemicals | 0.1% |
| | All Others* | 0.3% |

* Includes short-term investments and net other assets (liabilities).
Energy Portfolio
Schedule of Investments February 28, 2019
Showing Percentage of Net Assets
| Common Stocks - 99.7% | | | |
| | | Shares | Value |
| Chemicals - 0.1% | | | |
| Commodity Chemicals - 0.1% | | | |
| LG Chemical Ltd. | | 4,805 | $1,667,128 |
| Energy Equipment & Services - 8.5% | | | |
| Oil & Gas Drilling - 1.8% | | | |
| AKITA Drilling Ltd. Class A (non-vtg.) | | 511,864 | 1,524,759 |
| Nabors Industries Ltd. | | 2,321,236 | 7,520,805 |
| Odfjell Drilling Ltd. | | 968,380 | 2,891,565 |
| Precision Drilling Corp. (a) | | 1,527,300 | 3,853,213 |
| Shelf Drilling Ltd. (a)(b) | | 1,063,054 | 4,709,210 |
| | | | 20,499,552 |
| Oil & Gas Equipment & Services - 6.7% | | | |
| Baker Hughes, a GE Co. Class A | | 696,040 | 18,361,535 |
| Forum Energy Technologies, Inc. (a) | | 410,800 | 2,394,964 |
| Halliburton Co. | | 395,500 | 12,137,895 |
| Helix Energy Solutions Group, Inc. (a) | | 163,700 | 1,211,380 |
| Liberty Oilfield Services, Inc. Class A | | 321,600 | 5,267,808 |
| NCS Multistage Holdings, Inc. (a) | | 200,178 | 1,102,981 |
| RigNet, Inc. (a) | | 490,096 | 7,586,686 |
| Schlumberger Ltd. | | 584,758 | 25,764,437 |
| Smart Sand, Inc. (a)(c) | | 212,200 | 634,478 |
| Solaris Oilfield Infrastructure, Inc. Class A (c) | | 158,900 | 2,701,300 |
| | | | 77,163,464 |
|
| TOTAL ENERGY EQUIPMENT & SERVICES | | | 97,663,016 |
|
| Machinery - 0.9% | | | |
| Industrial Machinery - 0.9% | | | |
| Apergy Corp. (a) | | 34,200 | 1,435,716 |
| Cactus, Inc. (a) | | 90,600 | 3,285,156 |
| Gardner Denver Holdings, Inc. (a) | | 64,800 | 1,739,880 |
| ProPetro Holding Corp. (a) | | 224,500 | 4,458,570 |
| | | | 10,919,322 |
| Oil, Gas & Consumable Fuels - 90.2% | | | |
| Coal & Consumable Fuels - 0.4% | | | |
| Peabody Energy Corp. | | 159,700 | 4,926,745 |
| Integrated Oil & Gas - 18.9% | | | |
| Chevron Corp. | | 1,033,523 | 123,588,681 |
| Exxon Mobil Corp. | | 554,548 | 43,825,928 |
| Occidental Petroleum Corp. | | 334,100 | 22,100,715 |
| Suncor Energy, Inc. | | 828,600 | 28,561,340 |
| | | | 218,076,664 |
| Oil & Gas Exploration & Production - 50.9% | | | |
| Aker Bp ASA | | 124,300 | 4,212,747 |
| Anadarko Petroleum Corp. | | 974,215 | 42,378,353 |
| Antero Midstream GP LP (c) | | 88,500 | 1,130,145 |
| Berry Petroleum Corp. | | 1,100,700 | 14,011,911 |
| Cabot Oil & Gas Corp. | | 1,288,500 | 31,722,870 |
| Canadian Natural Resources Ltd. | | 173,300 | 4,922,644 |
| Centennial Resource Development, Inc. Class A (a)(c) | | 168,239 | 1,525,928 |
| Concho Resources, Inc. | | 224,628 | 24,709,080 |
| ConocoPhillips Co. | | 290,400 | 19,703,640 |
| Continental Resources, Inc. (a) | | 542,188 | 24,187,007 |
| Devon Energy Corp. | | 959,100 | 28,303,041 |
| Diamondback Energy, Inc. | | 516,947 | 53,209,355 |
| Encana Corp. | | 3,601,800 | 26,439,749 |
| Enerplus Corp. | | 72,700 | 641,214 |
| EOG Resources, Inc. | | 918,764 | 86,363,816 |
| Gran Tierra Energy, Inc. (U.S.) (a) | | 1,670,600 | 3,775,556 |
| Hess Corp. | | 425,400 | 24,609,390 |
| Kosmos Energy Ltd. | | 1,668,400 | 10,677,760 |
| Lundin Petroleum AB | | 145,900 | 4,770,658 |
| Magnolia Oil & Gas Corp. | | 909,000 | 11,180,700 |
| Magnolia Oil & Gas Corp. Class A (a)(c) | | 797,300 | 9,806,790 |
| National Energy Services Reunited Corp. (a) | | 13,900 | 119,540 |
| Noble Energy, Inc. | | 1,001,900 | 22,192,085 |
| Northern Oil & Gas, Inc. (a) | | 1,275,600 | 3,023,172 |
| Parex Resources, Inc. (a) | | 1,059,000 | 16,392,591 |
| Parsley Energy, Inc. Class A (a) | | 746,000 | 13,532,440 |
| PDC Energy, Inc. (a) | | 310,851 | 11,523,247 |
| Pioneer Natural Resources Co. | | 301,399 | 42,482,189 |
| Texas Pacific Land Trust (c) | | 1,100 | 817,982 |
| Viper Energy Partners LP | | 819,259 | 26,961,814 |
| W&T Offshore, Inc. (a) | | 523,400 | 2,726,914 |
| Whiting Petroleum Corp. (a) | | 600,400 | 14,631,748 |
| WPX Energy, Inc. (a) | | 266,000 | 3,282,440 |
| | | | 585,968,516 |
| Oil & Gas Refining & Marketing - 15.6% | | | |
| Delek U.S. Holdings, Inc. | | 918,231 | 32,487,013 |
| HollyFrontier Corp. | | 143,200 | 7,331,840 |
| Marathon Petroleum Corp. | | 549,792 | 34,092,602 |
| Phillips 66 Co. | | 490,073 | 47,223,434 |
| Reliance Industries Ltd. | | 322,432 | 5,603,189 |
| Valero Energy Corp. | | 654,500 | 53,381,020 |
| | | | 180,119,098 |
| Oil & Gas Storage & Transport - 4.4% | | | |
| Cheniere Energy, Inc. (a) | | 319,900 | 20,617,555 |
| Enterprise Products Partners LP | | 251,900 | 6,965,035 |
| Euronav NV (c) | | 723,941 | 5,668,458 |
| Golar LNG Ltd. | | 267,000 | 5,510,880 |
| Noble Midstream Partners LP (a)(d) | | 101,027 | 3,400,569 |
| Teekay LNG Partners LP | | 75,500 | 1,075,120 |
| The Williams Companies, Inc. | | 252,162 | 6,730,204 |
| | | | 49,967,821 |
|
| TOTAL OIL, GAS & CONSUMABLE FUELS | | | 1,039,058,844 |
|
| TOTAL COMMON STOCKS | | | |
| (Cost $1,076,524,442) | | | 1,149,308,310 |
|
| Money Market Funds - 0.9% | | | |
| Fidelity Cash Central Fund, 2.44% (e) | | 3,999,110 | 3,999,909 |
| Fidelity Securities Lending Cash Central Fund 2.45% (e)(f) | | 6,011,664 | 6,012,265 |
| TOTAL MONEY MARKET FUNDS | | | |
| (Cost $10,012,174) | | | 10,012,174 |
| TOTAL INVESTMENT IN SECURITIES - 100.6% | | | |
| (Cost $1,086,536,616) | | | 1,159,320,484 |
| NET OTHER ASSETS (LIABILITIES) - (0.6)% | | | (7,147,084) |
| NET ASSETS - 100% | | | $1,152,173,400 |
Legend
(a) Non-income producing
(b) Security exempt from registration under Rule 144A of the Securities Act of 1933. These securities may be resold in transactions exempt from registration, normally to qualified institutional buyers. At the end of the period, the value of these securities amounted to $4,709,210 or 0.4% of net assets.
(c) Security or a portion of the security is on loan at period end.
(d) Restricted securities - Investment in securities not registered under the Securities Act of 1933 (excluding 144A issues). At the end of the period, the value of restricted securities (excluding 144A issues) amounted to $3,400,569 or 0.3% of net assets.
(e) Affiliated fund that is generally available only to investment companies and other accounts managed by Fidelity Investments. The rate quoted is the annualized seven-day yield of the fund at period end. A complete unaudited listing of the fund's holdings as of its most recent quarter end is available upon request. In addition, each Fidelity Central Fund's financial statements , which are not covered by the Fund's Report of Independent Registered Public Accounting Firm, are available on the SEC's website or upon request.
(f) Investment made with cash collateral received from securities on loan.
Additional information on each restricted holding is as follows:
| Security | Acquisition Date | Acquisition Cost |
| Noble Midstream Partners LP | 6/21/17 | $4,086,542 |
Affiliated Central Funds
Information regarding fiscal year to date income earned by the Fund from investments in Fidelity Central Funds is as follows:
| Fund | Income earned |
| Fidelity Cash Central Fund | $176,112 |
| Fidelity Securities Lending Cash Central Fund | 141,443 |
| Total | $317,555 |
Amounts in the income column in the above table include any capital gain distributions from underlying funds, which are presented in the corresponding line-item in the Statement of Operations, if applicable.
Investment Valuation
All investments are categorized as Level 1 under the Fair Value Hierarchy. The inputs or methodology used for valuing securities may not be an indication of the risk associated with investing in those securities. For more information on valuation inputs please refer to the Investment Valuation section in the accompanying Notes to Financial Statements.
Other Information
Distribution of investments by country or territory of incorporation, as a percentage of Total Net Assets, is as follows (Unaudited):
| United States of America | 86.8% |
| Canada | 7.1% |
| Curacao | 2.2% |
| Bermuda | 1.5% |
| Others (Individually Less Than 1%) | 2.4% |
| | 100.0% |
See accompanying notes which are an integral part of the financial statements.
Energy Portfolio
Financial Statements
Statement of Assets and Liabilities
| | | February 28, 2019 |
| Assets | | |
Investment in securities, at value (including securities loaned of $5,671,480) — See accompanying schedule:
Unaffiliated issuers (cost $1,076,524,442) | $1,149,308,310 | |
| Fidelity Central Funds (cost $10,012,174) | 10,012,174 | |
| Total Investment in Securities (cost $1,086,536,616) | | $1,159,320,484 |
| Receivable for investments sold | | 1,620,401 |
| Receivable for fund shares sold | | 640,926 |
| Dividends receivable | | 3,544,860 |
| Distributions receivable from Fidelity Central Funds | | 24,967 |
| Prepaid expenses | | 15,027 |
| Other receivables | | 212,940 |
| Total assets | | 1,165,379,605 |
| Liabilities | | |
| Payable for investments purchased | $3,998,447 | |
| Payable for fund shares redeemed | 2,120,709 | |
| Accrued management fee | 521,618 | |
| Other affiliated payables | 243,409 | |
| Other payables and accrued expenses | 314,754 | |
| Collateral on securities loaned | 6,007,268 | |
| Total liabilities | | 13,206,205 |
| Net Assets | | $1,152,173,400 |
| Net Assets consist of: | | |
| Paid in capital | | $1,445,939,018 |
| Total distributable earnings (loss) | | (293,765,618) |
| Net Assets, for 30,725,903 shares outstanding | | $1,152,173,400 |
| Net Asset Value, offering price and redemption price per share ($1,152,173,400 ÷ 30,725,903 shares) | | $37.50 |
See accompanying notes which are an integral part of the financial statements.
Statement of Operations
| | | Year ended February 28, 2019 |
| Investment Income | | |
| Dividends | | $29,694,286 |
| Income from Fidelity Central Funds (including $141,443 from security lending) | | 317,555 |
| Total income | | 30,011,841 |
| Expenses | | |
| Management fee | $8,540,776 | |
| Transfer agent fees | 3,150,728 | |
| Accounting and security lending fees | 496,498 | |
| Custodian fees and expenses | 46,514 | |
| Independent trustees' fees and expenses | 9,236 | |
| Registration fees | 64,067 | |
| Audit | 55,312 | |
| Legal | 11,929 | |
| Interest | 12,916 | |
| Miscellaneous | 14,915 | |
| Total expenses before reductions | 12,402,891 | |
| Expense reductions | (161,192) | |
| Total expenses after reductions | | 12,241,699 |
| Net investment income (loss) | | 17,770,142 |
| Realized and Unrealized Gain (Loss) | | |
| Net realized gain (loss) on: | | |
| Investment securities: | | |
| Unaffiliated issuers (net of foreign taxes of $233,302) | (31,830,498) | |
| Redemptions in-kind with affiliated entities | 76,585,161 | |
| Fidelity Central Funds | 476 | |
| Foreign currency transactions | (70,800) | |
| Total net realized gain (loss) | | 44,684,339 |
| Change in net unrealized appreciation (depreciation) on: | | |
| Investment securities: | | |
| Unaffiliated issuers (net of decrease in deferred foreign taxes of $549,959) | (128,269,758) | |
| Assets and liabilities in foreign currencies | (5,490) | |
| Total change in net unrealized appreciation (depreciation) | | (128,275,248) |
| Net gain (loss) | | (83,590,909) |
| Net increase (decrease) in net assets resulting from operations | | $(65,820,767) |
See accompanying notes which are an integral part of the financial statements.
Statement of Changes in Net Assets
| | Year ended February 28, 2019 | Year ended February 28, 2018 |
| Increase (Decrease) in Net Assets | | |
| Operations | | |
| Net investment income (loss) | $17,770,142 | $35,506,693 |
| Net realized gain (loss) | 44,684,339 | 16,320,584 |
| Change in net unrealized appreciation (depreciation) | (128,275,248) | (167,310,997) |
| Net increase (decrease) in net assets resulting from operations | (65,820,767) | (115,483,720) |
| Distributions to shareholders | (15,141,238) | – |
| Distributions to shareholders from net investment income | – | (30,128,038) |
| Distributions to shareholders from net realized gain | – | (5,042,802) |
| Total distributions | (15,141,238) | (35,170,840) |
| Share transactions | | |
| Proceeds from sales of shares | 441,916,034 | 394,144,620 |
| Reinvestment of distributions | 14,307,440 | 33,787,233 |
| Cost of shares redeemed | (1,001,524,132) | (788,191,006) |
| Net increase (decrease) in net assets resulting from share transactions | (545,300,658) | (360,259,153) |
| Total increase (decrease) in net assets | (626,262,663) | (510,913,713) |
| Net Assets | | |
| Beginning of period | 1,778,436,063 | 2,289,349,776 |
| End of period | $1,152,173,400 | $1,778,436,063 |
| Other Information | | |
| Distributions in excess of net investment income end of period | $– | $(3,140,266) |
| Shares | | |
| Sold | 10,039,540 | 9,498,569 |
| Issued in reinvestment of distributions | 402,346 | 813,084 |
| Redeemed | (23,082,720) | (18,855,556) |
| Net increase (decrease) | (12,640,834) | (8,543,903) |
See accompanying notes which are an integral part of the financial statements.
Financial Highlights
Energy Portfolio
| | | | | | |
| Years ended February 28, | 2019 | 2018 | 2017 | 2016 A | 2015 |
| Selected Per–Share Data | | | | | |
| Net asset value, beginning of period | $41.01 | $44.10 | $32.63 | $45.64 | $56.25 |
| Income from Investment Operations | | | | | |
| Net investment income (loss)B | .49 | .75C | .18 | .42 | .46 |
| Net realized and unrealized gain (loss) | (3.51) | (3.06) | 11.58 | (12.98) | (6.37) |
| Total from investment operations | (3.02) | (2.31) | 11.76 | (12.56) | (5.91) |
| Distributions from net investment income | (.48) | (.68) | (.24) | (.39) | (.46) |
| Distributions from net realized gain | (.01) | (.10) | (.05) | (.07) | (4.23) |
| Total distributions | (.49) | (.78) | (.29) | (.45)D | (4.70)E |
| Redemption fees added to paid in capitalB | – | – | –F | –F | –F |
| Net asset value, end of period | $37.50 | $41.01 | $44.10 | $32.63 | $45.64 |
| Total ReturnG | (7.30)% | (5.27)% | 36.05% | (27.61)% | (11.25)% |
| Ratios to Average Net AssetsH,I | | | | | |
| Expenses before reductions | .78% | .79% | .79% | .80% | .79% |
| Expenses net of fee waivers, if any | .78% | .79% | .79% | .80% | .79% |
| Expenses net of all reductions | .77% | .78% | .78% | .79% | .79% |
| Net investment income (loss) | 1.12% | 1.82%C | .44% | 1.03% | .85% |
| Supplemental Data | | | | | |
| Net assets, end of period (000 omitted) | $1,152,173 | $1,778,436 | $2,289,350 | $1,928,897 | $2,179,828 |
| Portfolio turnover rateJ | 59%K | 59% | 93%K | 79% | 73%K |
A For the year ended February 29.
B Calculated based on average shares outstanding during the period.
C Net investment income per share reflects a large, non-recurring dividend which amounted to $.48 per share. Excluding this non-recurring dividend, the ratio of net investment income (loss) to average net assets would have been .66%.
D Total distributions of $.45 per share is comprised of distributions from net investment income of $.387 and distributions from net realized gain of $.066 per share.
E Total distributions of $4.70 per share is comprised of distributions from net investment income of $.463 and distributions from net realized gain of $4.233 per share.
F Amount represents less than $.005 per share.
G Total returns would have been lower if certain expenses had not been reduced during the applicable periods shown.
H Fees and expenses of any underlying Fidelity Central Funds are not included in the Fund's expense ratio. The Fund indirectly bears its proportionate share of the expenses of any underlying Fidelity Central Funds.
I Expense ratios reflect operating expenses of the Fund. Expenses before reductions do not reflect amounts reimbursed by the investment adviser or reductions from brokerage service arrangements or reductions from other expense offset arrangements and do not represent the amount paid by the Fund during periods when reimbursements or reductions occur. Expenses net of fee waivers reflect expenses after reimbursement by the investment adviser but prior to reductions from brokerage service arrangements or other expense offset arrangements. Expenses net of all reductions represent the net expenses paid by the Fund.
J Amount does not include the portfolio activity of any underlying Fidelity Central Funds.
K Portfolio turnover rate excludes securities received or delivered in-kind.
See accompanying notes which are an integral part of the financial statements.
Energy Service Portfolio
Performance: The Bottom Line
Average annual total return reflects the change in the value of an investment, assuming reinvestment of distributions from dividend income and capital gains (the profits earned upon the sale of securities that have grown in value, if any) and assuming a constant rate of performance each year. The hypothetical investment and the average annual total returns do not reflect the deduction of taxes that a shareholder would pay on fund distributions or the redemption of fund shares. During periods of reimbursement by Fidelity, a fund’s total return will be greater than it would be had the reimbursement not occurred. How a fund did yesterday is no guarantee of how it will do tomorrow.
Average Annual Total Returns
| For the periods ended February 28, 2019 | Past 1 year | Past 5 years | Past 10 years |
| Energy Service Portfolio | (26.36)% | (14.84)% | 1.34% |
$10,000 Over 10 Years
Let's say hypothetically that $10,000 was invested in Energy Service Portfolio on February 28, 2009.
The chart shows how the value of your investment would have changed, and also shows how the S&P 500® Index performed over the same period.
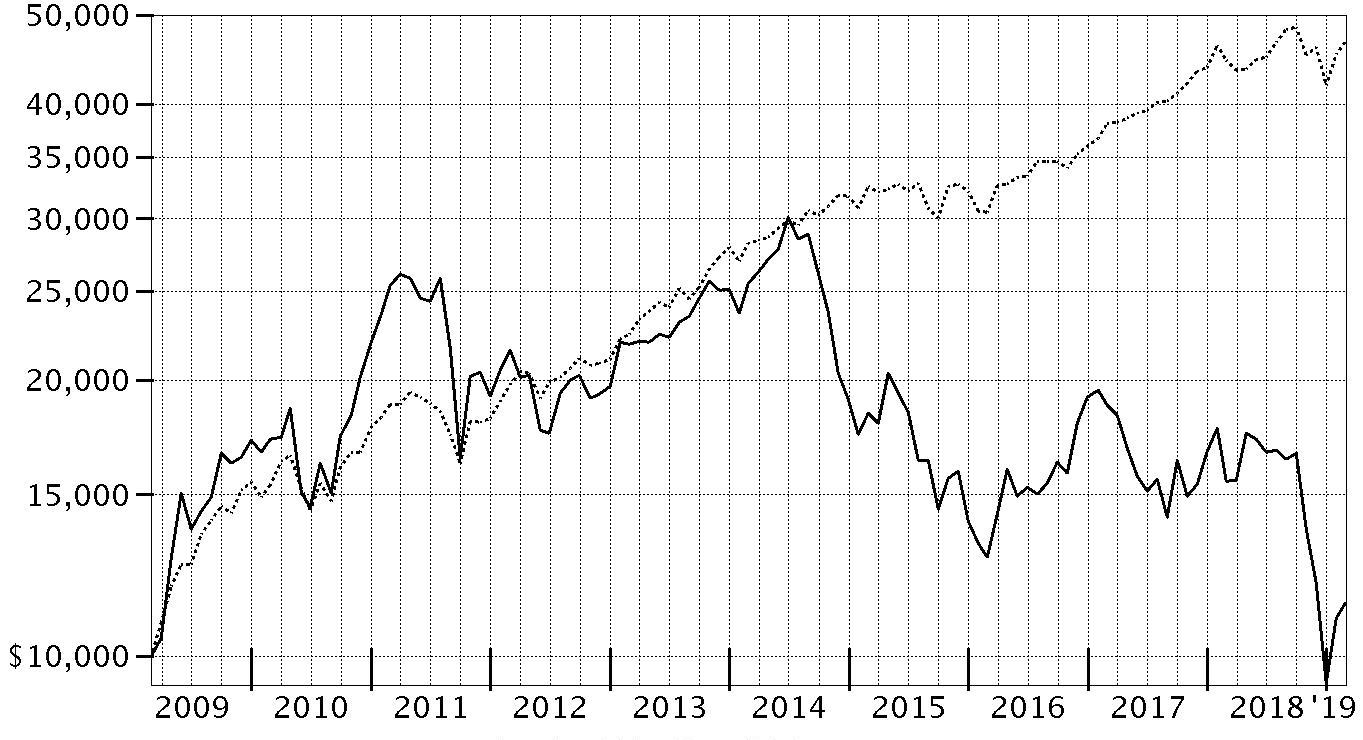
| Period Ending Values |
| $11,419 | Energy Service Portfolio |
| $46,739 | S&P 500® Index |
Energy Service Portfolio
Management's Discussion of Fund Performance
Market Recap: The S&P 500
® index gained 4.68% for the 12 months ending February 28, 2019, as the U.S. equity bellwether began the new year on a high note after enduring a final quarter of 2018 in which resurgent volatility upset the aging bull market. In October, rising U.S. Treasury yields and concern about peaking corporate earnings growth sent many investors fleeing from risk assets as they were still dealing with lingering uncertainty related to global trade and the U.S. Federal Reserve picking up the pace of interest rate hikes. The index returned -6.84% in October, at the time its largest monthly drop in seven years. But conditions worsened through Christmas, as jitters about the economy and another hike in rates led to a spike in market volatility and a -9.03% result for December. Sharply reversing course to begin 2019, the S&P 500
® gained 11.48% year-to-date, its strongest two-month opening since 1991, amid upbeat company earnings/outlooks and signs the Fed may pause on rates. For the full period, some economically sensitive sectors fared worst, with financials (-6%) and materials (-6%) both losing ground. Energy gained 1%, while communication services and industrials each rose roughly 2%. In contrast, the defensive utilities (+20%), real estate (+20%) and health care (+11%) sectors led the way, while consumer staples finished near the index. Information technology and consumer discretionary were rattled in the late-2018 downturn, but earlier strength contributed to advances of 9% and roughly 7%, respectively.
Comments from Portfolio Manager Maurice Fitzmaurice: For the fiscal year, the fund returned -26.36%, lagging the -25.65% result of the MSCI U.S. IMI Energy Equipment & Service 25/50 Index, as well as the broad-based S&P 500
® index. Declining crude oil prices proved to be a headwind for the profitability of energy producers this period, resulting in lower demand for oilfield and offshore equipment and services. U.S. crude prices, as reflected by the West Texas Intermediate spot price, fell 7% for the 12 months and about 15% for the past six months of the fiscal year. Versus the MSCI industry index, unfavorable security selection in oil & gas drilling was by far the biggest detractor. The fund’s largest individual relative detractor was oil well completion services firm NCS Multistage Holdings (-62%). The company was hurt by weak market conditions, pricing pressure, and slower-than-expected growth in its Canadian and U.S. markets. Oil and natural gas drilling sand provider Smart Sand returned -60% for the fund and also detracted, as the stock was hurt by weak pricing in the U.S. sand market due to softening demand and new supply. I’ll also note that the fund's foreign holdings detracted overall, hampered in part by a broadly stronger U.S. dollar. Conversely, security selection in the oil and gas equipment & services industry group contributed most to our performance versus the MSCI industry index. The fund’s top relative contributor was an overweighted stake in oilfield communication services firm RigNet (+15%), which experienced strong demand for its services. In addition, our larger-than-index position in Baker Hughes, a GE Co., rose 1% and helped, as the energy services company outperformed several peers due to exposure to the growing liquefied natural gas market.
The views expressed above reflect those of the portfolio manager(s) only through the end of the period as stated on the cover of this report and do not necessarily represent the views of Fidelity or any other person in the Fidelity organization. Any such views are subject to change at any time based upon market or other conditions and Fidelity disclaims any responsibility to update such views. These views may not be relied on as investment advice and, because investment decisions for a Fidelity fund are based on numerous factors, may not be relied on as an indication of trading intent on behalf of any Fidelity fund.
Note to shareholders: On August 31, 2018, Maurice Fitzmaurice assumed co-management responsibilities for the fund, joining Lead Manager Ben Shuleva. The two managed the fund together until March 1, 2019, when Maurice became sole portfolio manager.
Energy Service Portfolio
Investment Summary (Unaudited)
Top Ten Stocks as of February 28, 2019
| | % of fund's net assets |
| Schlumberger Ltd. | 20.2 |
| Halliburton Co. | 12.5 |
| Baker Hughes, a GE Co. Class A | 8.8 |
| Nabors Industries Ltd. | 4.8 |
| Shelf Drilling Ltd. | 4.3 |
| RigNet, Inc. | 4.1 |
| Oceaneering International, Inc. | 3.8 |
| Oil States International, Inc. | 2.8 |
| C&J Energy Services, Inc. | 2.8 |
| National Energy Services Reunited Corp. | 2.7 |
| | 66.8 |
Top Industries (% of fund's net assets)
| As of February 28, 2019 |
| | Energy Equipment & Services | 94.7% |
| | Oil, Gas & Consumable Fuels | 4.6% |
| | Construction & Engineering | 0.4% |
| | All Others* | 0.3% |

* Includes short-term investments and net other assets (liabilities).
Energy Service Portfolio
Schedule of Investments February 28, 2019
Showing Percentage of Net Assets
| Common Stocks - 99.7% | | | |
| | | Shares | Value |
| Construction & Engineering - 0.4% | | | |
| Construction & Engineering - 0.4% | | | |
| Enterprise Group, Inc. (a)(b)(c) | | 5,482,737 | $1,104,089 |
| Energy Equipment & Services - 94.7% | | | |
| Oil & Gas Drilling - 15.3% | | | |
| AKITA Drilling Ltd. Class A (non-vtg.) | | 1,196,868 | 3,565,274 |
| Borr Drilling Ltd. (a)(b) | | 460,564 | 1,259,511 |
| Helmerich & Payne, Inc. | | 6,800 | 368,560 |
| Independence Contract Drilling, Inc. (a) | | 665,955 | 2,064,461 |
| Nabors Industries Ltd. | | 4,480,878 | 14,518,045 |
| Odfjell Drilling Ltd. | | 2,107,082 | 6,291,708 |
| Patterson-UTI Energy, Inc. | | 225,200 | 2,986,152 |
| Rowan Companies PLC (a) | | 78,200 | 884,442 |
| Shelf Drilling Ltd. (a)(d) | | 2,982,776 | 13,213,363 |
| Transocean Ltd. (United States) (a) | | 165,600 | 1,352,952 |
| | | | 46,504,468 |
| Oil & Gas Equipment & Services - 79.4% | | | |
| Archrock, Inc. | | 366,816 | 3,580,124 |
| Baker Hughes, a GE Co. Class A | | 1,012,946 | 26,721,515 |
| Bristow Group, Inc. (a)(b) | | 167,300 | 197,414 |
| C&J Energy Services, Inc. (a) | | 490,051 | 8,463,181 |
| Core Laboratories NV (b) | | 28,200 | 1,827,642 |
| CSI Compressco LP | | 1,848,173 | 5,784,781 |
| Dril-Quip, Inc. (a) | | 162,000 | 6,902,820 |
| Forum Energy Technologies, Inc. (a) | | 1,386,097 | 8,080,946 |
| Frank's International NV (a)(b) | | 370,583 | 2,319,850 |
| FTS International, Inc. (a) | | 31,700 | 326,193 |
| Halliburton Co. | | 1,237,834 | 37,989,125 |
| Helix Energy Solutions Group, Inc. (a) | | 381,629 | 2,824,055 |
| McCoy Global, Inc. (a) | | 1,042,050 | 871,048 |
| McDermott International, Inc. (a)(b) | | 446,099 | 3,782,920 |
| National Oilwell Varco, Inc. | | 176,900 | 4,977,966 |
| NCS Multistage Holdings, Inc. (a)(b) | | 1,218,827 | 6,715,737 |
| Oceaneering International, Inc. (a) | | 744,325 | 11,499,821 |
| Oil States International, Inc. (a) | | 496,625 | 8,512,153 |
| Ranger Energy Services, Inc. Class A (a) | | 742,117 | 4,920,236 |
| RigNet, Inc. (a)(b) | | 806,135 | 12,478,970 |
| Schlumberger Ltd. | | 1,392,711 | 61,362,845 |
| SEACOR Marine Holdings, Inc. (a) | | 100 | 1,372 |
| Smart Sand, Inc. (a)(b) | | 1,585,490 | 4,740,615 |
| Superior Drilling Products, Inc. (a)(c) | | 2,409,569 | 3,855,310 |
| Superior Energy Services, Inc. (a) | | 460,600 | 2,155,608 |
| TechnipFMC PLC | | 49,262 | 1,098,050 |
| TETRA Technologies, Inc. (a) | | 3,037,422 | 7,259,439 |
| TETRA Technologies, Inc. warrants 12/14/21 (a) | | 300,100 | 73,825 |
| U.S. Silica Holdings, Inc. (b) | | 4,200 | 62,580 |
| Weatherford International PLC (a)(b) | | 2,220,666 | 1,433,662 |
| | | | 240,819,803 |
|
| TOTAL ENERGY EQUIPMENT & SERVICES | | | 287,324,271 |
|
| Oil, Gas & Consumable Fuels - 4.6% | | | |
| Oil & Gas Exploration & Production - 3.2% | | | |
| National Energy Services Reunited Corp. (a) | | 955,369 | 8,216,173 |
| Nine Energy Service, Inc. (a) | | 52,500 | 1,376,550 |
| | | | 9,592,723 |
| Oil & Gas Storage & Transport - 1.4% | | | |
| Golar LNG Ltd. | | 72,833 | 1,503,273 |
| StealthGas, Inc. (a) | | 871,835 | 2,824,745 |
| | | | 4,328,018 |
|
| TOTAL OIL, GAS & CONSUMABLE FUELS | | | 13,920,741 |
|
| TOTAL COMMON STOCKS | | | |
| (Cost $407,206,121) | | | 302,349,101 |
|
| Money Market Funds - 4.8% | | | |
| Fidelity Cash Central Fund, 2.44% (e) | | 475,412 | 475,507 |
| Fidelity Securities Lending Cash Central Fund 2.45% (e)(f) | | 14,111,279 | 14,112,690 |
| TOTAL MONEY MARKET FUNDS | | | |
| (Cost $14,587,800) | | | 14,588,197 |
| TOTAL INVESTMENT IN SECURITIES - 104.5% | | | |
| (Cost $421,793,921) | | | 316,937,298 |
| NET OTHER ASSETS (LIABILITIES) - (4.5)% | | | (13,587,802) |
| NET ASSETS - 100% | | | $303,349,496 |
Legend
(a) Non-income producing
(b) Security or a portion of the security is on loan at period end.
(c) Affiliated company
(d) Security exempt from registration under Rule 144A of the Securities Act of 1933. These securities may be resold in transactions exempt from registration, normally to qualified institutional buyers. At the end of the period, the value of these securities amounted to $13,213,363 or 4.4% of net assets.
(e) Affiliated fund that is generally available only to investment companies and other accounts managed by Fidelity Investments. The rate quoted is the annualized seven-day yield of the fund at period end. A complete unaudited listing of the fund's holdings as of its most recent quarter end is available upon request. In addition, each Fidelity Central Fund's financial statements , which are not covered by the Fund's Report of Independent Registered Public Accounting Firm, are available on the SEC's website or upon request.
(f) Investment made with cash collateral received from securities on loan.
Affiliated Central Funds
Information regarding fiscal year to date income earned by the Fund from investments in Fidelity Central Funds is as follows:
| Fund | Income earned |
| Fidelity Cash Central Fund | $11,405 |
| Fidelity Securities Lending Cash Central Fund | 255,208 |
| Total | $266,613 |
Amounts in the income column in the above table include any capital gain distributions from underlying funds, which are presented in the corresponding line-item in the Statement of Operations, if applicable.
Other Affiliated Issuers
An affiliated company is a company in which the Fund has ownership of at least 5% of the voting securities. Fiscal year to date transactions with companies which are or were affiliates are as follows:
| Affiliate | Value, beginning of period | Purchases | Sales Proceeds | Dividend Income | Realized Gain (loss) | Change in Unrealized appreciation (depreciation) | Value, end of period |
| Enterprise Group, Inc. | $1,669,745 | $-- | $29,758 | $-- | $(180,049) | $(355,849) | $1,104,089 |
| RigNet, Inc. | 12,615,390 | 2,890,490 | 4,770,931 | -- | 307,746 | 1,436,275 | -- |
| Smart Sand, Inc. | 9,281,173 | 9,781,851 | 6,094,157 | -- | (4,904,452) | (3,323,800) | -- |
| Superior Drilling Products, Inc. | 3,662,545 | -- | -- | -- | -- | 192,765 | 3,855,310 |
| Trinidad Drilling Ltd. | 15,876,309 | 4,676,929 | 20,812,809 | -- | 411,259 | (151,688) | -- |
| Xtreme Drilling & Coil Services Corp. | 7,164,828 | 22,835 | -- | -- | 15,019 | 5,047,518 | -- |
| Total | $50,269,990 | $17,372,105 | $31,707,655 | $-- | $(4,350.477) | $2,845,221 | $4,959,399 |
Investment Valuation
The following is a summary of the inputs used, as of February 28, 2019, involving the Fund's assets and liabilities carried at fair value. The inputs or methodology used for valuing securities may not be an indication of the risk associated with investing in those securities. For more information on valuation inputs, and their aggregation into the levels used below, please refer to the Investment Valuation section in the accompanying Notes to Financial Statements.
| | Valuation Inputs at Reporting Date: |
| Description | Total | Level 1 | Level 2 | Level 3 |
| Investments in Securities: | | | | |
| Common Stocks | $302,349,101 | $302,275,276 | $73,825 | $-- |
| Money Market Funds | 14,588,197 | 14,588,197 | -- | -- |
| Total Investments in Securities: | $316,937,298 | $316,863,473 | $73,825 | $-- |
Other Information
Distribution of investments by country or territory of incorporation, as a percentage of Total Net Assets, is as follows (Unaudited):
| United States of America | 58.0% |
| Curacao | 20.2% |
| Bermuda | 7.8% |
| Norway | 4.3% |
| British Virgin Islands | 2.7% |
| Canada | 1.9% |
| Netherlands | 1.4% |
| Panama | 1.2% |
| Others (Individually Less Than 1%) | 2.5% |
| | 100.0% |
See accompanying notes which are an integral part of the financial statements.
Energy Service Portfolio
Financial Statements
Statement of Assets and Liabilities
| | | February 28, 2019 |
| Assets | | |
Investment in securities, at value (including securities loaned of $12,538,063) — See accompanying schedule:
Unaffiliated issuers (cost $393,160,308) | $297,389,702 | |
| Fidelity Central Funds (cost $14,587,800) | 14,588,197 | |
| Other affiliated issuers (cost $14,045,813) | 4,959,399 | |
| Total Investment in Securities (cost $421,793,921) | | $316,937,298 |
| Receivable for investments sold | | 765,179 |
| Receivable for fund shares sold | | 909,416 |
| Dividends receivable | | 717,206 |
| Distributions receivable from Fidelity Central Funds | | 10,519 |
| Prepaid expenses | | 3,487 |
| Other receivables | | 50,487 |
| Total assets | | 319,393,592 |
| Liabilities | | |
| Payable to custodian bank | $1 | |
| Payable for investments purchased | 1,068,580 | |
| Payable for fund shares redeemed | 568,889 | |
| Accrued management fee | 135,071 | |
| Other affiliated payables | 71,191 | |
| Other payables and accrued expenses | 87,346 | |
| Collateral on securities loaned | 14,113,018 | |
| Total liabilities | | 16,044,096 |
| Net Assets | | $303,349,496 |
| Net Assets consist of: | | |
| Paid in capital | | $556,839,468 |
| Total distributable earnings (loss) | | (253,489,972) |
| Net Assets, for 9,909,108 shares outstanding | | $303,349,496 |
| Net Asset Value, offering price and redemption price per share ($303,349,496 ÷ 9,909,108 shares) | | $30.61 |
See accompanying notes which are an integral part of the financial statements.
Statement of Operations
| | | Year ended February 28, 2019 |
| Investment Income | | |
| Dividends | | $5,172,404 |
| Income from Fidelity Central Funds (including $255,208 from security lending) | | 266,613 |
| Total income | | 5,439,017 |
| Expenses | | |
| Management fee | $1,999,145 | |
| Transfer agent fees | 852,850 | |
| Accounting and security lending fees | 149,320 | |
| Custodian fees and expenses | 23,224 | |
| Independent trustees' fees and expenses | 2,153 | |
| Registration fees | 37,881 | |
| Audit | 50,383 | |
| Legal | 3,399 | |
| Interest | 263 | |
| Miscellaneous | 3,527 | |
| Total expenses before reductions | 3,122,145 | |
| Expense reductions | (115,139) | |
| Total expenses after reductions | | 3,007,006 |
| Net investment income (loss) | | 2,432,011 |
| Realized and Unrealized Gain (Loss) | | |
| Net realized gain (loss) on: | | |
| Investment securities: | | |
| Unaffiliated issuers | (27,785,760) | |
| Fidelity Central Funds | (927) | |
| Other affiliated issuers | (4,350,477) | |
| Foreign currency transactions | (3,933) | |
| Total net realized gain (loss) | | (32,141,097) |
| Change in net unrealized appreciation (depreciation) on: | | |
| Investment securities: | | |
| Unaffiliated issuers | (65,728,037) | |
| Fidelity Central Funds | (122) | |
| Other affiliated issuers | 2,845,221 | |
| Assets and liabilities in foreign currencies | (1,679) | |
| Total change in net unrealized appreciation (depreciation) | | (62,884,617) |
| Net gain (loss) | | (95,025,714) |
| Net increase (decrease) in net assets resulting from operations | | $(92,593,703) |
See accompanying notes which are an integral part of the financial statements.
Statement of Changes in Net Assets
| | Year ended February 28, 2019 | Year ended February 28, 2018 |
| Increase (Decrease) in Net Assets | | |
| Operations | | |
| Net investment income (loss) | $2,432,011 | $15,574,749 |
| Net realized gain (loss) | (32,141,097) | (66,289,758) |
| Change in net unrealized appreciation (depreciation) | (62,884,617) | (68,938,397) |
| Net increase (decrease) in net assets resulting from operations | (92,593,703) | (119,653,406) |
| Distributions to shareholders | (2,784,223) | – |
| Distributions to shareholders from net investment income | – | (16,191,879) |
| Distributions to shareholders from net realized gain | – | (13,061,204) |
| Total distributions | (2,784,223) | (29,253,083) |
| Share transactions | | |
| Proceeds from sales of shares | 135,703,149 | 170,298,959 |
| Reinvestment of distributions | 2,638,204 | 27,683,185 |
| Cost of shares redeemed | (152,668,531) | (370,145,317) |
| Net increase (decrease) in net assets resulting from share transactions | (14,327,178) | (172,163,173) |
| Redemption fees | – | 32,793 |
| Total increase (decrease) in net assets | (109,705,104) | (321,036,869) |
| Net Assets | | |
| Beginning of period | 413,054,600 | 734,091,469 |
| End of period | $303,349,496 | $413,054,600 |
| Other Information | | |
| Distributions in excess of net investment income end of period | $– | $(1,901,815) |
| Shares | | |
| Sold | 3,781,710 | 3,621,446 |
| Issued in reinvestment of distributions | 94,121 | 644,244 |
| Redeemed | (3,793,132) | (7,858,391) |
| Net increase (decrease) | 82,699 | (3,592,701) |
See accompanying notes which are an integral part of the financial statements.
Financial Highlights
Energy Service Portfolio
| | | | | | |
| Years ended February 28, | 2019 | 2018 | 2017 | 2016 A | 2015 |
| Selected Per–Share Data | | | | | |
| Net asset value, beginning of period | $42.04 | $54.70 | $37.54 | $54.34 | $86.13 |
| Income from Investment Operations | | | | | |
| Net investment income (loss)B | .26 | 1.41C | .17 | .45 | .45 |
| Net realized and unrealized gain (loss) | (11.37) | (10.86) | 17.22 | (16.85) | (23.10) |
| Total from investment operations | (11.11) | (9.45) | 17.39 | (16.40) | (22.65) |
| Distributions from net investment income | (.32) | (1.77) | (.23) | (.40) | (.39) |
| Distributions from net realized gain | – | (1.43) | – | – | (8.75) |
| Total distributions | (.32) | (3.21)D | (.23) | (.40) | (9.14) |
| Redemption fees added to paid in capitalB | – | –E | –E | –E | –E |
| Net asset value, end of period | $30.61 | $42.04 | $54.70 | $37.54 | $54.34 |
| Total ReturnF | (26.36)% | (17.41)% | 46.36% | (30.30)% | (27.82)% |
| Ratios to Average Net AssetsG,H | | | | | |
| Expenses before reductions | .84% | .84% | .85% | .85% | .79% |
| Expenses net of fee waivers, if any | .84% | .84% | .85% | .84% | .79% |
| Expenses net of all reductions | .81% | .82% | .84% | .81% | .79% |
| Net investment income (loss) | .65% | 3.04%C | .36% | .92% | .56% |
| Supplemental Data | | | | | |
| Net assets, end of period (000 omitted) | $303,349 | $413,055 | $734,091 | $435,375 | $698,803 |
| Portfolio turnover rateI | 80% | 62% | 96% | 58% | 55% |
A For the year ended February 29.
B Calculated based on average shares outstanding during the period.
C Net investment income per share reflects a large, non-recurring dividend which amounted to $1.34 per share. Excluding this non-recurring dividend, the ratio of net investment income (loss) to average net assets would have been .16%.
D Total distributions of $3.21 per share is comprised of distributions from net investment income of $1.774 and distributions from net realized gain of $1.431 per share.
E Amount represents less than $.005 per share.
F Total returns would have been lower if certain expenses had not been reduced during the applicable periods shown.
G Fees and expenses of any underlying Fidelity Central Funds are not included in the Fund's expense ratio. The Fund indirectly bears its proportionate share of the expenses of any underlying Fidelity Central Funds.
H Expense ratios reflect operating expenses of the Fund. Expenses before reductions do not reflect amounts reimbursed by the investment adviser or reductions from brokerage service arrangements or reductions from other expense offset arrangements and do not represent the amount paid by the Fund during periods when reimbursements or reductions occur. Expenses net of fee waivers reflect expenses after reimbursement by the investment adviser but prior to reductions from brokerage service arrangements or other expense offset arrangements. Expenses net of all reductions represent the net expenses paid by the Fund.
I Amount does not include the portfolio activity of any underlying Fidelity Central Funds.
See accompanying notes which are an integral part of the financial statements.
Natural Gas Portfolio
Performance: The Bottom Line
Average annual total return reflects the change in the value of an investment, assuming reinvestment of distributions from dividend income and capital gains (the profits earned upon the sale of securities that have grown in value, if any) and assuming a constant rate of performance each year. The hypothetical investment and the average annual total returns do not reflect the deduction of taxes that a shareholder would pay on fund distributions or the redemption of fund shares. During periods of reimbursement by Fidelity, a fund’s total return will be greater than it would be had the reimbursement not occurred. How a fund did yesterday is no guarantee of how it will do tomorrow.
Average Annual Total Returns
| For the periods ended February 28, 2019 | Past 1 year | Past 5 years | Past 10 years |
| Natural Gas Portfolio | (4.82)% | (10.69)% | 1.97% |
$10,000 Over 10 Years
Let's say hypothetically that $10,000 was invested in Natural Gas Portfolio on February 28, 2009.
The chart shows how the value of your investment would have changed, and also shows how the S&P 500® Index performed over the same period.
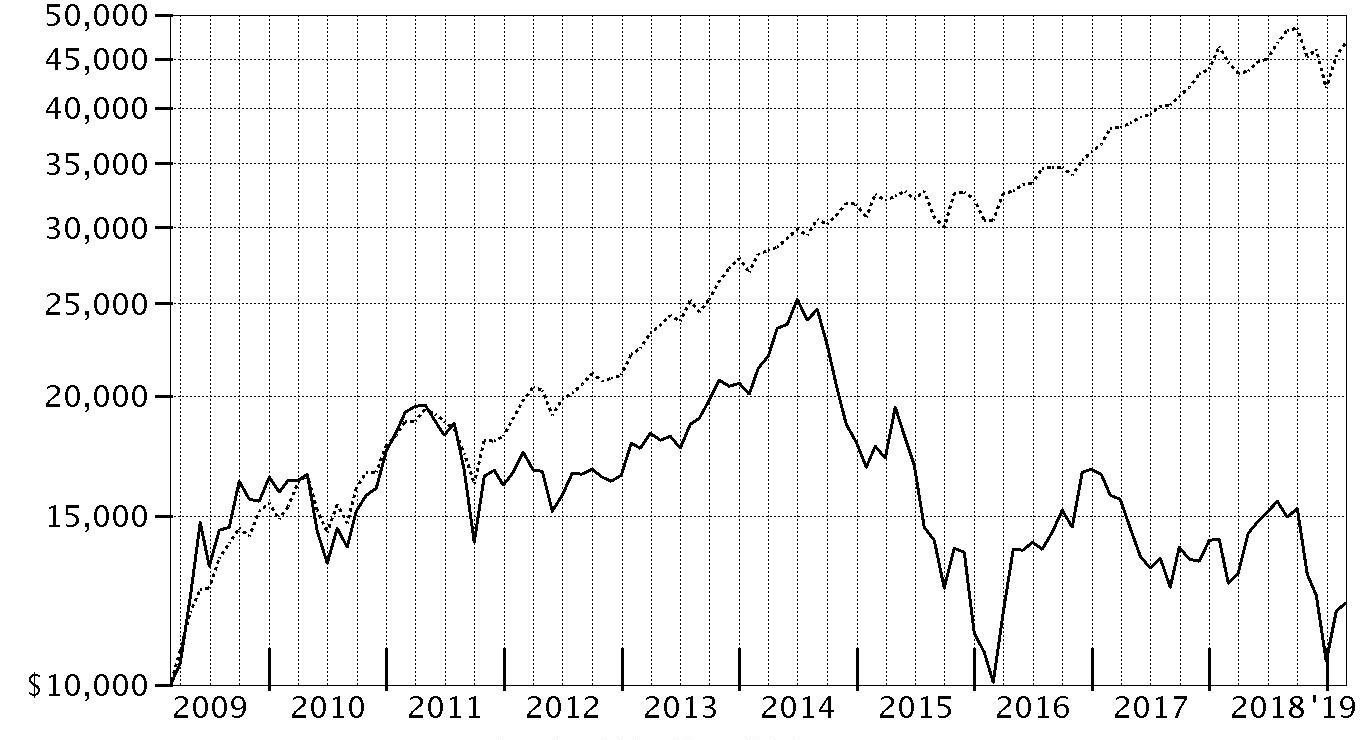
| Period Ending Values |
| $12,158 | Natural Gas Portfolio |
| $46,739 | S&P 500® Index |
Natural Gas Portfolio
Management's Discussion of Fund Performance
Market Recap: The S&P 500
® index gained 4.68% for the 12 months ending February 28, 2019, as the U.S. equity bellwether began the new year on a high note after enduring a final quarter of 2018 in which resurgent volatility upset the aging bull market. In October, rising U.S. Treasury yields and concern about peaking corporate earnings growth sent many investors fleeing from risk assets as they were still dealing with lingering uncertainty related to global trade and the U.S. Federal Reserve picking up the pace of interest rate hikes. The index returned -6.84% in October, at the time its largest monthly drop in seven years. But conditions worsened through Christmas, as jitters about the economy and another hike in rates led to a spike in market volatility and a -9.03% result for December. Sharply reversing course to begin 2019, the S&P 500
® gained 11.48% year-to-date, its strongest two-month opening since 1991, amid upbeat company earnings/outlooks and signs the Fed may pause on rates. For the full period, some economically sensitive sectors fared worst, with financials (-6%) and materials (-6%) both losing ground. Energy gained 1%, while communication services and industrials each rose roughly 2%. In contrast, the defensive utilities (+20%), real estate (+20%) and health care (+11%) sectors led the way, while consumer staples finished near the index. Information technology and consumer discretionary were rattled in the late-2018 downturn, but earlier strength contributed to advances of 9% and roughly 7%, respectively.
Comments from Portfolio Manager Ben Shuleva: For the fiscal year, the fund returned -4.82%, trailing the -2.86% result of the FactSet Natural Gas Linked Index, as well as the broad-based S&P 500
® index. Falling crude-oil prices pressured the profitability and stock prices of energy stocks the past year. Versus the FactSet index, security selection in the oil & gas exploration & production (E&P) category was the biggest detractor, followed by positioning in oil & gas drilling and utilities. The largest individual relative detractor was a non-index stake in Shelf Drilling, which we established this period. Shares of the shallow-water, jack-up rig provider returned -47% for the fund, as demand for offshore drilling services softened. A sizable overweighting in E&P Anadarko Petroleum also hurt. Shares of the company didn’t perform as I expected, returning about -22% despite a positive result from an election ballot initiative in Colorado and management’s solid execution. Conversely, stock picking in the oil & gas equipment & services group helped most versus the natural gas index. The top individual relative contributor was equipment and services provider Baker Hughes, a GE Co., which gained 2% for the fund the past year, as investors started to place greater value on the company’s niche in the turbo machinery business. We chose to overweight Baker Hughes and underweight several of its peers, including Halliburton and Schlumberger – two additional relative contributors. Meanwhile, the fund's foreign holdings contributed overall, despite the drag of a broadly stronger U.S. dollar.
The views expressed above reflect those of the portfolio manager(s) only through the end of the period as stated on the cover of this report and do not necessarily represent the views of Fidelity or any other person in the Fidelity organization. Any such views are subject to change at any time based upon market or other conditions and Fidelity disclaims any responsibility to update such views. These views may not be relied on as investment advice and, because investment decisions for a Fidelity fund are based on numerous factors, may not be relied on as an indication of trading intent on behalf of any Fidelity fund.
Natural Gas Portfolio
Investment Summary (Unaudited)
Top Ten Stocks as of February 28, 2019
| | % of fund's net assets |
| EOG Resources, Inc. | 8.3 |
| Anadarko Petroleum Corp. | 6.6 |
| The Williams Companies, Inc. | 5.9 |
| Devon Energy Corp. | 5.5 |
| Schlumberger Ltd. | 5.3 |
| Noble Energy, Inc. | 5.1 |
| PDC Energy, Inc. | 4.9 |
| RigNet, Inc. | 4.7 |
| Occidental Petroleum Corp. | 4.0 |
| Shelf Drilling Ltd. | 3.4 |
| | 53.7 |
Top Industries (% of fund's net assets)
| As of February 28, 2019 |
| | Oil, Gas & Consumable Fuels | 70.4% |
| | Energy Equipment & Services | 19.1% |
| | Gas Utilities | 5.4% |
| | Multi-Utilities | 3.4% |
| | All Others* | 1.7% |

* Includes short-term investments and net other assets (liabilities).
Natural Gas Portfolio
Schedule of Investments February 28, 2019
Showing Percentage of Net Assets
| Common Stocks - 100.1% | | | |
| | | Shares | Value |
| Energy Equipment & Services - 19.1% | | | |
| Oil & Gas Drilling - 4.0% | | | |
| Borr Drilling Ltd. (a) | | 24,000 | $65,633 |
| Nabors Industries Ltd. | | 355,000 | 1,150,200 |
| Shelf Drilling Ltd. (a)(b) | | 1,528,150 | 6,769,533 |
| | | | 7,985,366 |
| Oil & Gas Equipment & Services - 15.1% | | | |
| Baker Hughes, a GE Co. Class A | | 156,000 | 4,115,280 |
| C&J Energy Services, Inc. (a) | | 32,900 | 568,183 |
| Dril-Quip, Inc. (a) | | 6,300 | 268,443 |
| Forum Energy Technologies, Inc. (a) | | 32,100 | 187,143 |
| Halliburton Co. | | 85,500 | 2,623,995 |
| McDermott International, Inc. (a) | | 20,866 | 176,944 |
| NCS Multistage Holdings, Inc. (a) | | 131,254 | 723,210 |
| Oceaneering International, Inc. (a) | | 54,300 | 838,935 |
| Oil States International, Inc. (a) | | 22,100 | 378,794 |
| Pason Systems, Inc. | | 12,200 | 187,828 |
| Ranger Energy Services, Inc. Class A (a) | | 10,194 | 67,586 |
| RigNet, Inc. (a) | | 606,134 | 9,382,954 |
| Schlumberger Ltd. | | 242,018 | 10,663,313 |
| TETRA Technologies, Inc. (a) | | 61,663 | 147,375 |
| Weatherford International PLC (a) | | 265,800 | 171,600 |
| | | | 30,501,583 |
|
| TOTAL ENERGY EQUIPMENT & SERVICES | | | 38,486,949 |
|
| Gas Utilities - 5.4% | | | |
| Gas Utilities - 5.4% | | | |
| Atmos Energy Corp. | | 6,087 | 601,700 |
| Northwest Natural Holding Co. | | 4,800 | 308,256 |
| South Jersey Industries, Inc. | | 110,900 | 3,210,555 |
| Southwest Gas Holdings, Inc. | | 21,000 | 1,720,740 |
| Spire, Inc. | | 13,600 | 1,078,752 |
| UGI Corp. | | 7,500 | 411,750 |
| Valener, Inc. (c) | | 205,600 | 3,587,200 |
| | | | 10,918,953 |
| Multi-Utilities - 3.4% | | | |
| Multi-Utilities - 3.4% | | | |
| CenterPoint Energy, Inc. | | 120,700 | 3,637,898 |
| NiSource, Inc. | | 114,900 | 3,100,002 |
| | | | 6,737,900 |
| Oil, Gas & Consumable Fuels - 70.4% | | | |
| Integrated Oil & Gas - 4.0% | | | |
| Occidental Petroleum Corp. | | 122,700 | 8,116,605 |
| Oil & Gas Exploration & Production - 47.3% | | | |
| Advantage Oil & Gas Ltd. (a) | | 631,000 | 1,074,083 |
| Anadarko Petroleum Corp. | | 306,020 | 13,311,870 |
| ARC Resources Ltd. (c) | | 26,700 | 201,678 |
| Berry Petroleum Corp. | | 65,825 | 837,952 |
| Cabot Oil & Gas Corp. | | 38,400 | 945,408 |
| Cimarex Energy Co. | | 29,400 | 2,114,154 |
| Concho Resources, Inc. | | 12,300 | 1,353,000 |
| Devon Energy Corp. | | 375,587 | 11,083,572 |
| Encana Corp. | | 576,500 | 4,231,916 |
| Encana Corp. | | 886,803 | 6,429,322 |
| EOG Resources, Inc. | | 178,100 | 16,741,401 |
| EQT Corp. | | 96,723 | 1,752,621 |
| Extraction Oil & Gas, Inc. (a)(c) | | 343,400 | 1,442,280 |
| Hess Corp. | | 7,800 | 451,230 |
| Highpoint Resources, Inc. (a) | | 29,600 | 76,664 |
| Lekoil Ltd. (a) | | 4,892,206 | 655,042 |
| Magnolia Oil & Gas Corp. | | 120,000 | 1,476,000 |
| National Energy Services Reunited Corp. (a) | | 371,400 | 3,194,040 |
| Noble Energy, Inc. | | 464,600 | 10,290,890 |
| Northern Oil & Gas, Inc. (a) | | 39,500 | 93,615 |
| Oasis Petroleum, Inc. (a) | | 32,400 | 181,116 |
| PDC Energy, Inc. (a) | | 266,600 | 9,882,862 |
| Pioneer Natural Resources Co. | | 24,400 | 3,439,180 |
| Range Resources Corp. | | 98,700 | 1,056,090 |
| Savannah Petroleum PLC (a) | | 2,407,000 | 861,982 |
| Seven Generations Energy Ltd. (a) | | 37,000 | 270,481 |
| SRC Energy, Inc. (a) | | 57,900 | 266,340 |
| Surge Energy, Inc. (c) | | 340,700 | 372,817 |
| Whiting Petroleum Corp. (a) | | 12,300 | 299,751 |
| WPX Energy, Inc. (a) | | 54,300 | 670,062 |
| | | | 95,057,419 |
| Oil & Gas Storage & Transport - 19.1% | | | |
| Cheniere Energy, Inc. (a) | | 12,400 | 799,180 |
| Enbridge, Inc. | | 55,300 | 2,045,673 |
| Enterprise Products Partners LP | | 165,300 | 4,570,545 |
| Equitrans Midstream Corp. | | 43,938 | 775,066 |
| Keyera Corp. | | 31,700 | 778,318 |
| Kinder Morgan, Inc. | | 298,000 | 5,709,680 |
| Noble Midstream Partners LP | | 6,000 | 201,960 |
| ONEOK, Inc. | | 50,300 | 3,232,278 |
| Pembina Pipeline Corp. | | 27,200 | 995,442 |
| Targa Resources Corp. | | 95,100 | 3,826,824 |
| The Williams Companies, Inc. | | 440,400 | 11,754,276 |
| TransCanada Corp. | | 73,800 | 3,300,376 |
| TransCanada Corp. | | 8,100 | 362,232 |
| | | | 38,351,850 |
|
| TOTAL OIL, GAS & CONSUMABLE FUELS | | | 141,525,874 |
|
| Road & Rail - 1.7% | | | |
| Trucking - 1.7% | | | |
| Avenir LNG Ltd. (a)(d) | | 2,000,000 | 3,506,045 |
| Water Utilities - 0.1% | | | |
| Water Utilities - 0.1% | | | |
| Select Energy Services, Inc. Class A (a) | | 15,353 | 154,758 |
| TOTAL COMMON STOCKS | | | |
| (Cost $276,668,516) | | | 201,330,479 |
|
| Money Market Funds - 0.7% | | | |
| Fidelity Securities Lending Cash Central Fund 2.45% (e)(f) | | | |
| (Cost $1,378,912) | | 1,378,732 | 1,378,870 |
| TOTAL INVESTMENT IN SECURITIES - 100.8% | | | |
| (Cost $278,047,428) | | | 202,709,349 |
| NET OTHER ASSETS (LIABILITIES) - (0.8)% | | | (1,624,465) |
| NET ASSETS - 100% | | | $201,084,884 |
Legend
(a) Non-income producing
(b) Security exempt from registration under Rule 144A of the Securities Act of 1933. These securities may be resold in transactions exempt from registration, normally to qualified institutional buyers. At the end of the period, the value of these securities amounted to $6,769,533 or 3.4% of net assets.
(c) Security or a portion of the security is on loan at period end.
(d) Level 3 security
(e) Investment made with cash collateral received from securities on loan.
(f) Affiliated fund that is generally available only to investment companies and other accounts managed by Fidelity Investments. The rate quoted is the annualized seven-day yield of the fund at period end. A complete unaudited listing of the fund's holdings as of its most recent quarter end is available upon request. In addition, each Fidelity Central Fund's financial statements , which are not covered by the Fund's Report of Independent Registered Public Accounting Firm, are available on the SEC's website or upon request.
Affiliated Central Funds
Information regarding fiscal year to date income earned by the Fund from investments in Fidelity Central Funds is as follows:
| Fund | Income earned |
| Fidelity Cash Central Fund | $13,558 |
| Fidelity Securities Lending Cash Central Fund | 28,917 |
| Total | $42,475 |
Amounts in the income column in the above table include any capital gain distributions from underlying funds, which are presented in the corresponding line-item in the Statement of Operations, if applicable.
Investment Valuation
The following is a summary of the inputs used, as of February 28, 2019, involving the Fund's assets and liabilities carried at fair value. The inputs or methodology used for valuing securities may not be an indication of the risk associated with investing in those securities. For more information on valuation inputs, and their aggregation into the levels used below, please refer to the Investment Valuation section in the accompanying Notes to Financial Statements.
| | Valuation Inputs at Reporting Date: |
| Description | Total | Level 1 | Level 2 | Level 3 |
| Investments in Securities: | | | | |
| Common Stocks | $201,330,479 | $197,824,434 | $-- | $3,506,045 |
| Money Market Funds | 1,378,870 | 1,378,870 | -- | -- |
| Total Investments in Securities: | $202,709,349 | $199,203,304 | $-- | $3,506,045 |
The following is a reconciliation of Investments in Securities for which Level 3 inputs were used in determining value:
| Investments in Securities: | |
| Common Stocks | |
| Beginning Balance | $-- |
| Total Realized Gain (Loss) | -- |
| Total Unrealized Gain (Loss) | 1,506,045 |
| Cost of Purchases | 2,000,000 |
| Proceeds of Sales | -- |
| Amortization/Accretion | -- |
| Transfers in to Level 3 | -- |
| Transfers out of Level 3 | -- |
| Ending Balance | $3,506,045 |
| The change in unrealized gain (loss) for the period attributable to Level 3 securities held at February 28, 2019 | $1,506,045 |
The information used in the above reconciliation represents fiscal year to date activity for any Investments in Securities identified as using Level 3 inputs at either the beginning or the end of the current fiscal period includes securities. Transfers in or out of Level 3 represent the beginning value of any Security or Instrument where a change in the pricing level occurred from the beginning to the end of the period. The cost of purchases and the proceeds of sales may include securities received or delivered through corporate actions or exchanges. Realized and unrealized gains (losses) disclosed in the reconciliation are included in Net Gain (Loss) on the Fund's Statement of Operations.
Other Information
Distribution of investments by country or territory of incorporation, as a percentage of Total Net Assets, is as follows (Unaudited):
| United States of America | 74.6% |
| Canada | 11.9% |
| Curacao | 5.3% |
| Norway | 3.4% |
| Bermuda | 2.3% |
| British Virgin Islands | 1.6% |
| Others (Individually Less Than 1%) | 0.9% |
| | 100.0% |
See accompanying notes which are an integral part of the financial statements.
Natural Gas Portfolio
Financial Statements
Statement of Assets and Liabilities
| | | February 28, 2019 |
| Assets | | |
Investment in securities, at value (including securities loaned of $1,286,042) — See accompanying schedule:
Unaffiliated issuers (cost $276,668,516) | $201,330,479 | |
| Fidelity Central Funds (cost $1,378,912) | 1,378,870 | |
| Total Investment in Securities (cost $278,047,428) | | $202,709,349 |
| Receivable for investments sold | | 774,473 |
| Receivable for fund shares sold | | 180,336 |
| Dividends receivable | | 217,065 |
| Distributions receivable from Fidelity Central Funds | | 1,525 |
| Prepaid expenses | | 2,037 |
| Other receivables | | 50,523 |
| Total assets | | 203,935,308 |
| Liabilities | | |
| Payable to custodian bank | $600,735 | |
| Payable for investments purchased | 316,411 | |
| Payable for fund shares redeemed | 340,851 | |
| Accrued management fee | 90,213 | |
| Other affiliated payables | 54,368 | |
| Other payables and accrued expenses | 71,431 | |
| Collateral on securities loaned | 1,376,415 | |
| Total liabilities | | 2,850,424 |
| Net Assets | | $201,084,884 |
| Net Assets consist of: | | |
| Paid in capital | | $549,647,912 |
| Total distributable earnings (loss) | | (348,563,028) |
| Net Assets, for 9,832,693 shares outstanding | | $201,084,884 |
| Net Asset Value, offering price and redemption price per share ($201,084,884 ÷ 9,832,693 shares) | | $20.45 |
See accompanying notes which are an integral part of the financial statements.
Statement of Operations
| | | Year ended February 28, 2019 |
| Investment Income | | |
| Dividends | | $4,516,742 |
| Income from Fidelity Central Funds (including $28,917 from security lending) | | 42,475 |
| Total income | | 4,559,217 |
| Expenses | | |
| Management fee | $1,307,099 | |
| Transfer agent fees | 651,294 | |
| Accounting and security lending fees | 95,264 | |
| Custodian fees and expenses | 21,446 | |
| Independent trustees' fees and expenses | 1,381 | |
| Registration fees | 28,947 | |
| Audit | 41,432 | |
| Legal | 1,992 | |
| Interest | 1,261 | |
| Miscellaneous | 6,557 | |
| Total expenses before reductions | 2,156,673 | |
| Expense reductions | (70,465) | |
| Total expenses after reductions | | 2,086,208 |
| Net investment income (loss) | | 2,473,009 |
| Realized and Unrealized Gain (Loss) | | |
| Net realized gain (loss) on: | | |
| Investment securities: | | |
| Unaffiliated issuers | (42,871,384) | |
| Fidelity Central Funds | (327) | |
| Foreign currency transactions | (3,199) | |
| Total net realized gain (loss) | | (42,874,910) |
| Change in net unrealized appreciation (depreciation) on: | | |
| Investment securities: | | |
| Unaffiliated issuers | 33,850,525 | |
| Fidelity Central Funds | 342 | |
| Assets and liabilities in foreign currencies | 2,411 | |
| Total change in net unrealized appreciation (depreciation) | | 33,853,278 |
| Net gain (loss) | | (9,021,632) |
| Net increase (decrease) in net assets resulting from operations | | $(6,548,623) |
See accompanying notes which are an integral part of the financial statements.
Statement of Changes in Net Assets
| | Year ended February 28, 2019 | Year ended February 28, 2018 |
| Increase (Decrease) in Net Assets | | |
| Operations | | |
| Net investment income (loss) | $2,473,009 | $7,875,785 |
| Net realized gain (loss) | (42,874,910) | (56,974,170) |
| Change in net unrealized appreciation (depreciation) | 33,853,278 | (18,859,992) |
| Net increase (decrease) in net assets resulting from operations | (6,548,623) | (67,958,377) |
| Distributions to shareholders | (1,257,826) | – |
| Distributions to shareholders from net investment income | – | (8,092,750) |
| Distributions to shareholders from net realized gain | – | (3,721,773) |
| Total distributions | (1,257,826) | (11,814,523) |
| Share transactions | | |
| Proceeds from sales of shares | 73,386,071 | 91,904,830 |
| Reinvestment of distributions | 1,185,845 | 11,138,646 |
| Cost of shares redeemed | (104,048,790) | (264,791,683) |
| Net increase (decrease) in net assets resulting from share transactions | (29,476,874) | (161,748,207) |
| Redemption fees | – | 10,206 |
| Total increase (decrease) in net assets | (37,283,323) | (241,510,901) |
| Net Assets | | |
| Beginning of period | 238,368,207 | 479,879,108 |
| End of period | $201,084,884 | $238,368,207 |
| Other Information | | |
| Distributions in excess of net investment income end of period | $– | $(4,641,134) |
| Shares | | |
| Sold | 3,179,983 | 3,833,010 |
| Issued in reinvestment of distributions | 54,372 | 487,783 |
| Redeemed | (4,435,015) | (10,575,399) |
| Net increase (decrease) | (1,200,660) | (6,254,606) |
See accompanying notes which are an integral part of the financial statements.
Financial Highlights
Natural Gas Portfolio
| | | | | | |
| Years ended February 28, | 2019 | 2018 | 2017 | 2016 A | 2015 |
| Selected Per–Share Data | | | | | |
| Net asset value, beginning of period | $21.60 | $27.76 | $17.83 | $32.05 | $39.16 |
| Income from Investment Operations | | | | | |
| Net investment income (loss)B | .24 | .61C | .13 | .33 | .34 |
| Net realized and unrealized gain (loss) | (1.27) | (5.83) | 9.98 | (14.16) | (7.03) |
| Total from investment operations | (1.03) | (5.22) | 10.11 | (13.83) | (6.69) |
| Distributions from net investment income | – | (.65) | (.15) | (.39) | (.38) |
| Distributions from net realized gain | (.12) | (.29) | (.03) | – | (.04) |
| Total distributions | (.12) | (.94) | (.18) | (.39) | (.42) |
| Redemption fees added to paid in capitalB | – | –D | –D | –D | –D |
| Net asset value, end of period | $20.45 | $21.60 | $27.76 | $17.83 | $32.05 |
| Total ReturnE | (4.82)% | (18.97)% | 56.75% | (43.29)% | (17.15)% |
| Ratios to Average Net AssetsF,G | | | | | |
| Expenses before reductions | .89% | .89% | .87% | .89% | .82% |
| Expenses net of fee waivers, if any | .89% | .89% | .87% | .88% | .82% |
| Expenses net of all reductions | .86% | .87% | .87% | .88% | .82% |
| Net investment income (loss) | 1.02% | 2.52%C | .50% | 1.24% | .84% |
| Supplemental Data | | | | | |
| Net assets, end of period (000 omitted) | $201,085 | $238,368 | $479,879 | $255,990 | $530,285 |
| Portfolio turnover rateH | 86% | 69% | 76% | 62% | 147%I |
A For the year ended February 29.
B Calculated based on average shares outstanding during the period.
C Net investment income per share reflects a large, non-recurring dividend which amounted to $.45 per share. Excluding this non-recurring dividend, the ratio of net investment income (loss) to average net assets would have been .66%.
D Amount represents less than $.005 per share.
E Total returns would have been lower if certain expenses had not been reduced during the applicable periods shown.
F Fees and expenses of any underlying Fidelity Central Funds are not included in the Fund's expense ratio. The Fund indirectly bears its proportionate share of the expenses of any underlying Fidelity Central Funds.
G Expense ratios reflect operating expenses of the Fund. Expenses before reductions do not reflect amounts reimbursed by the investment adviser or reductions from brokerage service arrangements or reductions from other expense offset arrangements and do not represent the amount paid by the Fund during periods when reimbursements or reductions occur. Expenses net of fee waivers reflect expenses after reimbursement by the investment adviser but prior to reductions from brokerage service arrangements or other expense offset arrangements. Expenses net of all reductions represent the net expenses paid by the Fund.
H Amount does not include the portfolio activity of any underlying Fidelity Central Funds.
I Portfolio turnover rate excludes securities received or delivered in-kind.
See accompanying notes which are an integral part of the financial statements.
Natural Resources Portfolio
Performance: The Bottom Line
Average annual total return reflects the change in the value of an investment, assuming reinvestment of distributions from dividend income and capital gains (the profits earned upon the sale of securities that have grown in value, if any) and assuming a constant rate of performance each year. The hypothetical investment and the average annual total returns do not reflect the deduction of taxes that a shareholder would pay on fund distributions or the redemption of fund shares. During periods of reimbursement by Fidelity, a fund’s total return will be greater than it would be had the reimbursement not occurred. How a fund did yesterday is no guarantee of how it will do tomorrow.
Average Annual Total Returns
| For the periods ended February 28, 2019 | Past 1 year | Past 5 years | Past 10 years |
| Natural Resources Portfolio | (6.06)% | (5.63)% | 5.61% |
$10,000 Over 10 Years
Let's say hypothetically that $10,000 was invested in Natural Resources Portfolio on February 28, 2009.
The chart shows how the value of your investment would have changed, and also shows how the S&P 500® Index performed over the same period.
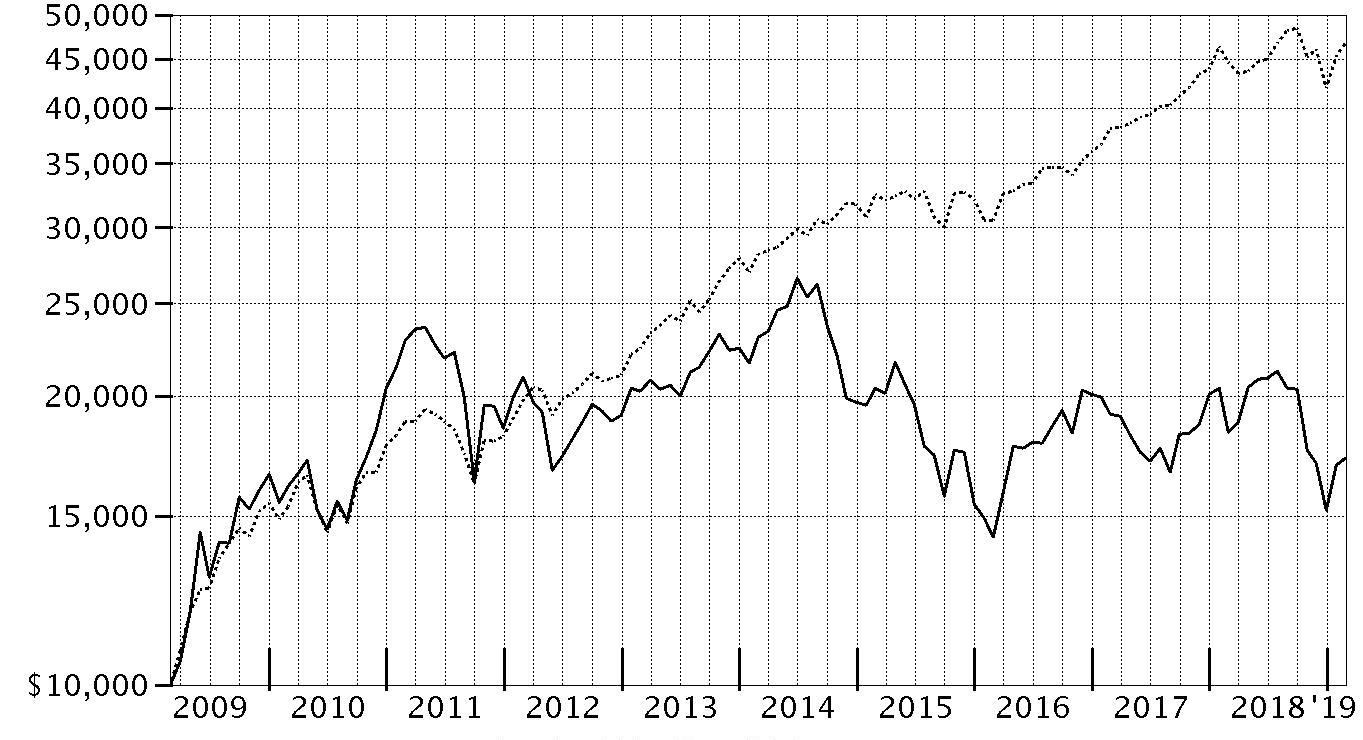
| Period Ending Values |
| $17,258 | Natural Resources Portfolio |
| $46,739 | S&P 500® Index |
Natural Resources Portfolio
Management's Discussion of Fund Performance
Market Recap: The S&P 500
® index gained 4.68% for the 12 months ending February 28, 2019, as the U.S. equity bellwether began the new year on a high note after enduring a final quarter of 2018 in which resurgent volatility upset the aging bull market. In October, rising U.S. Treasury yields and concern about peaking corporate earnings growth sent many investors fleeing from risk assets as they were still dealing with lingering uncertainty related to global trade and the U.S. Federal Reserve picking up the pace of interest rate hikes. The index returned -6.84% in October, at the time its largest monthly drop in seven years. But conditions worsened through Christmas, as jitters about the economy and another hike in rates led to a spike in market volatility and a -9.03% result for December. Sharply reversing course to begin 2019, the S&P 500
® gained 11.48% year-to-date, its strongest two-month opening since 1991, amid upbeat company earnings/outlooks and signs the Fed may pause on rates. For the full period, some economically sensitive sectors fared worst, with financials (-6%) and materials (-6%) both losing ground. Energy gained 1%, while communication services and industrials each rose roughly 2%. In contrast, the defensive utilities (+20%), real estate (+20%) and health care (+11%) sectors led the way, while consumer staples finished near the index. Information technology and consumer discretionary were rattled in the late-2018 downturn, but earlier strength contributed to advances of 9% and roughly 7%, respectively.
Comments from Portfolio Manager Nathan Strik: For the fiscal year, the fund returned -6.06%, trailing the -2.29% result of the S&P
® North American Natural Resources Sector Index, as well as the broad-based S&P 500
® index. Versus the natural resources index, security selection in the oil & gas exploration & production (E&P) category was the biggest detractor the past 12 months, followed by positioning in oil & gas storage & transportation and an underweighting in integrated oil & gas. The fund’s biggest individual relative detractor was underexposure to E&P ConocoPhillips. We established a sizable position this period, but remained underweighted as of February 28. In storage & transportation, avoiding pipeline company and index component Enbridge held back the fund’s relative result, as the stock gained about 24%. Similarly, not owning integrated oil & gas giant and index stock Exxon Mobil (+9%) also hurt our relative result. Conversely, stock picking in the oil & gas equipment & services group contributed most, followed by positioning in gold-related stocks. An underweighting in energy services firm Schlumberger and a non-index stake in E&P Magnolia Oil & Gas were the fund’s biggest contributors versus the natural resources index. Our modest position in cash also helped in a down market. Lastly, the fund's foreign holdings contributed overall, despite the drag of a broadly stronger U.S. dollar.
The views expressed above reflect those of the portfolio manager(s) only through the end of the period as stated on the cover of this report and do not necessarily represent the views of Fidelity or any other person in the Fidelity organization. Any such views are subject to change at any time based upon market or other conditions and Fidelity disclaims any responsibility to update such views. These views may not be relied on as investment advice and, because investment decisions for a Fidelity fund are based on numerous factors, may not be relied on as an indication of trading intent on behalf of any Fidelity fund.
Natural Resources Portfolio
Investment Summary (Unaudited)
Top Ten Stocks as of February 28, 2019
| | % of fund's net assets |
| Chevron Corp. | 9.2 |
| Suncor Energy, Inc. | 5.5 |
| Cenovus Energy, Inc. (Canada) | 4.8 |
| The Williams Companies, Inc. | 4.8 |
| ConocoPhillips Co. | 4.2 |
| Anadarko Petroleum Corp. | 4.1 |
| Cheniere Energy, Inc. | 3.4 |
| Franco-Nevada Corp. | 3.2 |
| EOG Resources, Inc. | 3.1 |
| Pioneer Natural Resources Co. | 3.0 |
| | 45.3 |
Top Industries (% of fund's net assets)
| As of February 28, 2019 |
| | Oil, Gas & Consumable Fuels | 73.6% |
| | Energy Equipment & Services | 8.1% |
| | Metals & Mining | 8.0% |
| | Containers & Packaging | 7.2% |
| | Construction Materials | 1.0% |
| | All Others* | 2.1% |

* Includes short-term investments and net other assets (liabilities).
Natural Resources Portfolio
Schedule of Investments February 28, 2019
Showing Percentage of Net Assets
| Common Stocks - 99.0% | | | |
| | | Shares | Value |
| Construction Materials - 1.0% | | | |
| Construction Materials - 1.0% | | | |
| Eagle Materials, Inc. | | 46,600 | $3,562,104 |
| Summit Materials, Inc. (a) | | 51,100 | 868,700 |
| | | | 4,430,804 |
| Containers & Packaging - 7.2% | | | |
| Metal & Glass Containers - 3.8% | | | |
| Aptargroup, Inc. | | 57,800 | 5,879,994 |
| Crown Holdings, Inc. (a) | | 186,300 | 10,114,227 |
| | | | 15,994,221 |
| Paper Packaging - 3.4% | | | |
| Avery Dennison Corp. | | 82,600 | 8,924,104 |
| Graphic Packaging Holding Co. | | 135,400 | 1,649,172 |
| Packaging Corp. of America | | 42,100 | 4,024,339 |
| | | | 14,597,615 |
|
| TOTAL CONTAINERS & PACKAGING | | | 30,591,836 |
|
| Energy Equipment & Services - 8.1% | | | |
| Oil & Gas Drilling - 1.1% | | | |
| Nabors Industries Ltd. | | 139,520 | 452,045 |
| Odfjell Drilling Ltd. | | 178,700 | 533,595 |
| Shelf Drilling Ltd. (a)(b) | | 759,800 | 3,365,829 |
| | | | 4,351,469 |
| Oil & Gas Equipment & Services - 7.0% | | | |
| Baker Hughes, a GE Co. Class A | | 422,200 | 11,137,636 |
| Dril-Quip, Inc. (a) | | 31,425 | 1,339,019 |
| Halliburton Co. | | 215,800 | 6,622,903 |
| National Oilwell Varco, Inc. | | 60,900 | 1,713,726 |
| NCS Multistage Holdings, Inc. (a) | | 49,500 | 272,745 |
| Oceaneering International, Inc. (a) | | 49,600 | 766,320 |
| RigNet, Inc. (a) | | 270,230 | 4,183,160 |
| Schlumberger Ltd. | | 48,565 | 2,139,774 |
| Tenaris SA sponsored ADR (c) | | 61,200 | 1,624,860 |
| | | | 29,800,143 |
|
| TOTAL ENERGY EQUIPMENT & SERVICES | | | 34,151,612 |
|
| Machinery - 0.2% | | | |
| Industrial Machinery - 0.2% | | | |
| ProPetro Holding Corp. (a) | | 43,600 | 865,896 |
| Metals & Mining - 8.0% | | | |
| Gold - 8.0% | | | |
| Agnico Eagle Mines Ltd. (Canada) (c) | | 239,700 | 10,194,923 |
| Barrick Gold Corp. (c) | | 786,532 | 9,941,764 |
| Franco-Nevada Corp. | | 180,100 | 13,568,231 |
| | | | 33,704,918 |
| Oil, Gas & Consumable Fuels - 73.6% | | | |
| Coal & Consumable Fuels - 0.3% | | | |
| Pinnacle Renewable Energy, Inc. | | 157,200 | 1,261,470 |
| Integrated Oil & Gas - 19.5% | | | |
| Cenovus Energy, Inc. (Canada) | | 2,221,900 | 20,362,562 |
| Chevron Corp. | | 326,998 | 39,102,422 |
| Suncor Energy, Inc. | | 680,400 | 23,452,976 |
| | | | 82,917,960 |
| Oil & Gas Exploration & Production - 33.7% | | | |
| Anadarko Petroleum Corp. | | 395,700 | 17,212,950 |
| Cabot Oil & Gas Corp. | | 231,600 | 5,701,992 |
| Canadian Natural Resources Ltd. | | 400,500 | 11,376,336 |
| Centennial Resource Development, Inc. Class A (a)(c) | | 106,600 | 966,862 |
| ConocoPhillips Co. | | 263,900 | 17,905,615 |
| Crescent Point Energy Corp. | | 311,600 | 1,006,345 |
| Devon Energy Corp. | | 195,700 | 5,775,107 |
| Diamondback Energy, Inc. | | 93,900 | 9,665,127 |
| Encana Corp. | | 1,457,700 | 10,700,545 |
| EOG Resources, Inc. | | 138,400 | 13,009,600 |
| Kosmos Energy Ltd. | | 167,900 | 1,074,560 |
| Magnolia Oil & Gas Corp. | | 1,000,000 | 12,300,000 |
| Noble Energy, Inc. | | 405,000 | 8,970,750 |
| Parsley Energy, Inc. Class A (a) | | 252,000 | 4,571,280 |
| PDC Energy, Inc. (a) | | 135,300 | 5,015,571 |
| Pioneer Natural Resources Co. | | 91,400 | 12,882,830 |
| PrairieSky Royalty Ltd. | | 71,238 | 1,037,754 |
| Viper Energy Partners LP | | 116,500 | 3,834,015 |
| | | | 143,007,239 |
| Oil & Gas Refining & Marketing - 7.0% | | | |
| Delek U.S. Holdings, Inc. | | 200,204 | 7,083,218 |
| Marathon Petroleum Corp. | | 65,298 | 4,049,129 |
| Phillips 66 Co. | | 105,016 | 10,119,342 |
| Reliance Industries Ltd. | | 137,286 | 2,385,742 |
| Valero Energy Corp. | | 75,100 | 6,125,156 |
| | | | 29,762,587 |
| Oil & Gas Storage & Transport - 13.1% | | | |
| Cheniere Energy, Inc. (a) | | 225,000 | 14,501,250 |
| Enterprise Products Partners LP | | 420,700 | 11,632,355 |
| Equitrans Midstream Corp. | | 80,800 | 1,425,312 |
| Golar LNG Ltd. | | 132,400 | 2,732,736 |
| Noble Midstream Partners LP | | 99,337 | 3,343,683 |
| Noble Midstream Partners LP (a)(d) | | 43,718 | 1,471,548 |
| The Williams Companies, Inc. | | 761,500 | 20,324,435 |
| | | | 55,431,319 |
|
| TOTAL OIL, GAS & CONSUMABLE FUELS | | | 312,380,575 |
|
| Paper & Forest Products - 0.9% | | | |
| Forest Products - 0.9% | | | |
| Western Forest Products, Inc. | | 2,625,200 | 3,630,734 |
| TOTAL COMMON STOCKS | | | |
| (Cost $416,956,400) | | | 419,756,375 |
|
| Money Market Funds - 3.9% | | | |
| Fidelity Cash Central Fund, 2.44% (e) | | 1,044,440 | 1,044,649 |
| Fidelity Securities Lending Cash Central Fund 2.45% (e)(f) | | 15,652,806 | 15,654,371 |
| TOTAL MONEY MARKET FUNDS | | | |
| (Cost $16,699,020) | | | 16,699,020 |
| TOTAL INVESTMENT IN SECURITIES - 102.9% | | | |
| (Cost $433,655,420) | | | 436,455,395 |
| NET OTHER ASSETS (LIABILITIES) - (2.9)% | | | (12,288,537) |
| NET ASSETS - 100% | | | $424,166,858 |
Legend
(a) Non-income producing
(b) Security exempt from registration under Rule 144A of the Securities Act of 1933. These securities may be resold in transactions exempt from registration, normally to qualified institutional buyers. At the end of the period, the value of these securities amounted to $3,365,829 or 0.8% of net assets.
(c) Security or a portion of the security is on loan at period end.
(d) Restricted securities - Investment in securities not registered under the Securities Act of 1933 (excluding 144A issues). At the end of the period, the value of restricted securities (excluding 144A issues) amounted to $1,471,548 or 0.3% of net assets.
(e) Affiliated fund that is generally available only to investment companies and other accounts managed by Fidelity Investments. The rate quoted is the annualized seven-day yield of the fund at period end. A complete unaudited listing of the fund's holdings as of its most recent quarter end is available upon request. In addition, each Fidelity Central Fund's financial statements , which are not covered by the Fund's Report of Independent Registered Public Accounting Firm, are available on the SEC's website or upon request.
(f) Includes investment made with cash collateral received from securities on loan.
Additional information on each restricted holding is as follows:
| Security | Acquisition Date | Acquisition Cost |
| Noble Midstream Partners LP | 6/21/17 | $1,768,393 |
Affiliated Central Funds
Information regarding fiscal year to date income earned by the Fund from investments in Fidelity Central Funds is as follows:
| Fund | Income earned |
| Fidelity Cash Central Fund | $359,919 |
| Fidelity Securities Lending Cash Central Fund | 33,576 |
| Total | $393,495 |
Amounts in the income column in the above table include any capital gain distributions from underlying funds, which are presented in the corresponding line-item in the Statement of Operations, if applicable.
Investment Valuation
All investments are categorized as Level 1 under the Fair Value Hierarchy. The inputs or methodology used for valuing securities may not be an indication of the risk associated with investing in those securities. For more information on valuation inputs please refer to the Investment Valuation section in the accompanying Notes to Financial Statements.
Other Information
Distribution of investments by country or territory of incorporation, as a percentage of Total Net Assets, is as follows (Unaudited):
| United States of America | 71.6% |
| Canada | 25.1% |
| Bermuda | 1.0% |
| Others (Individually Less Than 1%) | 2.3% |
| | 100.0% |
See accompanying notes which are an integral part of the financial statements.
Natural Resources Portfolio
Financial Statements
Statement of Assets and Liabilities
| | | February 28, 2019 |
| Assets | | |
Investment in securities, at value (including securities loaned of $14,798,234) — See accompanying schedule:
Unaffiliated issuers (cost $416,956,400) | $419,756,375 | |
| Fidelity Central Funds (cost $16,699,020) | 16,699,020 | |
| Total Investment in Securities (cost $433,655,420) | | $436,455,395 |
| Foreign currency held at value (cost $7) | | 7 |
| Receivable for investments sold | | 3,760,758 |
| Receivable for fund shares sold | | 556,380 |
| Dividends receivable | | 888,151 |
| Distributions receivable from Fidelity Central Funds | | 2,870 |
| Prepaid expenses | | 7,790 |
| Other receivables | | 64,185 |
| Total assets | | 441,735,536 |
| Liabilities | | |
| Payable for investments purchased | $1,105,051 | |
| Payable for fund shares redeemed | 361,906 | |
| Accrued management fee | 189,554 | |
| Other affiliated payables | 131,335 | |
| Other payables and accrued expenses | 126,382 | |
| Collateral on securities loaned | 15,654,450 | |
| Total liabilities | | 17,568,678 |
| Net Assets | | $424,166,858 |
| Net Assets consist of: | | |
| Paid in capital | | $636,697,170 |
| Total distributable earnings (loss) | | (212,530,312) |
| Net Assets, for 16,599,941 shares outstanding | | $424,166,858 |
| Net Asset Value, offering price and redemption price per share ($424,166,858 ÷ 16,599,941 shares) | | $25.55 |
See accompanying notes which are an integral part of the financial statements.
Statement of Operations
| | | Year ended February 28, 2019 |
| Investment Income | | |
| Dividends | | $16,830,295 |
| Income from Fidelity Central Funds (including $33,576 from security lending) | | 393,495 |
| Total income | | 17,223,790 |
| Expenses | | |
| Management fee | $5,066,054 | |
| Transfer agent fees | 2,063,024 | |
| Accounting and security lending fees | 316,723 | |
| Custodian fees and expenses | 25,776 | |
| Independent trustees' fees and expenses | 5,500 | |
| Registration fees | 60,744 | |
| Audit | 50,928 | |
| Legal | 5,922 | |
| Interest | 2,706 | |
| Miscellaneous | 20,982 | |
| Total expenses before reductions | 7,618,359 | |
| Expense reductions | (70,776) | |
| Total expenses after reductions | | 7,547,583 |
| Net investment income (loss) | | 9,676,207 |
| Realized and Unrealized Gain (Loss) | | |
| Net realized gain (loss) on: | | |
| Investment securities: | | |
| Unaffiliated issuers | (66,203,317) | |
| Fidelity Central Funds | 2,029 | |
| Foreign currency transactions | (103,335) | |
| Total net realized gain (loss) | | (66,304,623) |
| Change in net unrealized appreciation (depreciation) on: | | |
| Investment securities: | | |
| Unaffiliated issuers (net of decrease in deferred foreign taxes of $296,505) | (26,353,550) | |
| Fidelity Central Funds | (356) | |
| Assets and liabilities in foreign currencies | 127 | |
| Total change in net unrealized appreciation (depreciation) | | (26,353,779) |
| Net gain (loss) | | (92,658,402) |
| Net increase (decrease) in net assets resulting from operations | | $(82,982,195) |
See accompanying notes which are an integral part of the financial statements.
Statement of Changes in Net Assets
| | Year ended February 28, 2019 | Year ended February 28, 2018 |
| Increase (Decrease) in Net Assets | | |
| Operations | | |
| Net investment income (loss) | $9,676,207 | $13,842,090 |
| Net realized gain (loss) | (66,304,623) | 33,612,671 |
| Change in net unrealized appreciation (depreciation) | (26,353,779) | (80,935,670) |
| Net increase (decrease) in net assets resulting from operations | (82,982,195) | (33,480,909) |
| Distributions to shareholders | (10,282,640) | – |
| Distributions to shareholders from net investment income | – | (12,904,948) |
| Distributions to shareholders from net realized gain | – | (719,094) |
| Total distributions | (10,282,640) | (13,624,042) |
| Share transactions | | |
| Proceeds from sales of shares | 379,536,177 | 293,810,856 |
| Reinvestment of distributions | 9,981,955 | 13,165,643 |
| Cost of shares redeemed | (782,819,915) | (261,241,461) |
| Net increase (decrease) in net assets resulting from share transactions | (393,301,783) | 45,735,038 |
| Redemption fees | – | 13,793 |
| Total increase (decrease) in net assets | (486,566,618) | (1,356,120) |
| Net Assets | | |
| Beginning of period | 910,733,476 | 912,089,596 |
| End of period | $424,166,858 | $910,733,476 |
| Other Information | | |
| Distributions in excess of net investment income end of period | $– | $(1,256,817) |
| Shares | | |
| Sold | 13,740,663 | 10,604,222 |
| Issued in reinvestment of distributions | 414,331 | 472,915 |
| Redeemed | (30,659,455) | (9,288,677) |
| Net increase (decrease) | (16,504,461) | 1,788,460 |
See accompanying notes which are an integral part of the financial statements.
Financial Highlights
Natural Resources Portfolio
| | | | | | |
| Years ended February 28, | 2019 | 2018 | 2017 | 2016 A | 2015 |
| Selected Per–Share Data | | | | | |
| Net asset value, beginning of period | $27.51 | $29.13 | $21.80 | $31.49 | $37.85 |
| Income from Investment Operations | | | | | |
| Net investment income (loss)B | .29 | .43C | .10 | .18 | .21 |
| Net realized and unrealized gain (loss) | (1.97) | (1.64) | 7.42 | (9.69) | (4.55) |
| Total from investment operations | (1.68) | (1.21) | 7.52 | (9.51) | (4.34) |
| Distributions from net investment income | (.28) | (.39) | (.11) | (.18) | (.15) |
| Distributions from net realized gain | –D | (.02) | (.08) | – | (1.87) |
| Total distributions | (.28) | (.41) | (.19) | (.18) | (2.02) |
| Redemption fees added to paid in capitalB | – | –D | –D | –D | –D |
| Net asset value, end of period | $25.55 | $27.51 | $29.13 | $21.80 | $31.49 |
| Total ReturnE | (6.06)% | (4.16)% | 34.54% | (30.22)% | (11.45)% |
| Ratios to Average Net AssetsF,G | | | | | |
| Expenses before reductions | .81% | .83% | .84% | .86% | .82% |
| Expenses net of fee waivers, if any | .81% | .83% | .84% | .86% | .82% |
| Expenses net of all reductions | .80% | .82% | .83% | .85% | .82% |
| Net investment income (loss) | 1.02% | 1.54%C | .35% | .66% | .55% |
| Supplemental Data | | | | | |
| Net assets, end of period (000 omitted) | $424,167 | $910,733 | $912,090 | $462,869 | $761,078 |
| Portfolio turnover rateH | 26% | 78% | 84% | 78% | 87% |
A For the year ended February 29.
B Calculated based on average shares outstanding during the period.
C Net investment income per share reflects a large, non-recurring dividends which amounted to $.31 per share. Excluding this non-recurring dividend, the ratio of net investment income (loss) to average net assets would have been .41%.
D Amount represents less than $.005 per share.
E Total returns would have been lower if certain expenses had not been reduced during the applicable periods shown.
F Fees and expenses of any underlying Fidelity Central Funds are not included in the Fund's expense ratio. The Fund indirectly bears its proportionate share of the expenses of any underlying Fidelity Central Funds.
G Expense ratios reflect operating expenses of the Fund. Expenses before reductions do not reflect amounts reimbursed by the investment adviser or reductions from brokerage service arrangements or reductions from other expense offset arrangements and do not represent the amount paid by the Fund during periods when reimbursements or reductions occur. Expenses net of fee waivers reflect expenses after reimbursement by the investment adviser but prior to reductions from brokerage service arrangements or other expense offset arrangements. Expenses net of all reductions represent the net expenses paid by the Fund.
H Amount does not include the portfolio activity of any underlying Fidelity Central Funds.
See accompanying notes which are an integral part of the financial statements.
Notes to Financial Statements
For the period ended February 28, 2019
1. Organization.
Energy Portfolio, Energy Service Portfolio, Natural Gas Portfolio, and Natural Resources Portfolio (the Funds) are non-diversified funds of Fidelity Select Portfolios (the Trust). The Trust is registered under the Investment Company Act of 1940, as amended (the 1940 Act), as an open-end management investment company organized as a Massachusetts business trust. The Funds invest primarily in securities of companies whose principal business activities fall within specific industries. Each Fund is authorized to issue an unlimited number of shares. Share transactions on the Statement of Changes in Net Assets may contain exchanges between affiliated funds. The Natural Resources Portfolio may also invest in certain precious metals. Certain Funds' investments in emerging markets can be subject to social, economic, regulatory, and political uncertainties and can be extremely volatile.
2. Investments in Fidelity Central Funds.
The Funds invest in Fidelity Central Funds, which are open-end investment companies generally available only to other investment companies and accounts managed by the investment adviser and its affiliates. The Funds' Schedules of Investments list each of the Fidelity Central Funds held as of period end, if any, as an investment of the Fund, but does not include the underlying holdings of each Fidelity Central Fund. As an Investing Fund, each Fund indirectly bears its proportionate share of the expenses of the underlying Fidelity Central Funds.
The Money Market Central Funds seek preservation of capital and current income and are managed by Fidelity Investments Money Management, Inc. (FIMM), an affiliate of the investment adviser. Annualized expenses of the Money Market Central Funds as of their most recent shareholder report date are less than .005%.
A complete unaudited list of holdings for each Fidelity Central Fund is available upon request or at the Securities and Exchange Commission (the SEC) website at www.sec.gov. In addition, the financial statements of the Fidelity Central Funds, which are not covered by the Funds' Report of Independent Registered Public Accounting Firm, are available on the SEC website or upon request.
3. Significant Accounting Policies.
Each Fund is an investment company and applies the accounting and reporting guidance of the Financial Accounting Standards Board (FASB) Accounting Standards Codification Topic 946 Financial Services – Investments Companies. The financial statements have been prepared in conformity with accounting principles generally accepted in the United States of America (GAAP), which require management to make certain estimates and assumptions at the date of the financial statements. Actual results could differ from those estimates. Subsequent events, if any, through the date that the financial statements were issued have been evaluated in the preparation of the financial statements. The following summarizes the significant accounting policies of the Funds:
Investment Valuation. Investments are valued as of 4:00 p.m. Eastern time on the last calendar day of the period. The Board of Trustees (the Board) has delegated the day to day responsibility for the valuation of each Fund's investments to the Fair Value Committee (the Committee) established by each Fund's investment adviser. In accordance with valuation policies and procedures approved by the Board, each Fund attempts to obtain prices from one or more third party pricing vendors or brokers to value its investments. When current market prices, quotations or currency exchange rates are not readily available or reliable, investments will be fair valued in good faith by the Committee, in accordance with procedures adopted by the Board. Factors used in determining fair value vary by investment type and may include market or investment specific events. The frequency with which these procedures are used cannot be predicted and they may be utilized to a significant extent. The Committee oversees each Fund's valuation policies and procedures and reports to the Board on the Committee's activities and fair value determinations. The Board monitors the appropriateness of the procedures used in valuing each Fund's investments and ratifies the fair value determinations of the Committee.
Each Fund categorizes the inputs to valuation techniques used to value its investments into a disclosure hierarchy consisting of three levels as shown below:
- Level 1 – quoted prices in active markets for identical investments
- Level 2 – other significant observable inputs (including quoted prices for similar investments, interest rates, prepayment speeds, etc.)
- Level 3 – unobservable inputs (including the Fund's own assumptions based on the best information available)
Valuation techniques used to value each Fund's investments by major category are as follows:
Equity securities, including restricted securities, for which market quotations are readily available, are valued at the last reported sale price or official closing price as reported by a third party pricing vendor on the primary market or exchange on which they are traded and are categorized as Level 1 in the hierarchy. In the event there were no sales during the day or closing prices are not available, securities are valued at the last quoted bid price or may be valued using the last available price and are generally categorized as Level 2 in the hierarchy. For foreign equity securities, when market or security specific events arise, comparisons to the valuation of American Depositary Receipts (ADRs), futures contracts, Exchange-Traded Funds (ETFs) and certain indexes as well as quoted prices for similar securities may be used and would be categorized as Level 2 in the hierarchy. For equity securities, including restricted securities, where observable inputs are limited, assumptions about market activity and risk are used and these securities may be categorized as Level 3 in the hierarchy.
Independent prices obtained from a single source or broker are evaluated by management and may be categorized as Level 3 in the hierarchy.
Investments in open-end mutual funds, including the Fidelity Central Funds, are valued at their closing net asset value (NAV) each business day and are categorized as Level 1 in the hierarchy.
Changes in valuation techniques may result in transfers in or out of an assigned level within the disclosure hierarchy. The aggregate value of investments by input level as of February 28, 2019, as well as a roll forward of Level 3 investments, is included at the end of each Fund's Schedule of Investments.
Foreign Currency. The Funds may use foreign currency contracts to facilitate transactions in foreign-denominated securities. Gains and losses from these transactions may arise from changes in the value of the foreign currency or if the counterparties do not perform under the contracts' terms.
Foreign-denominated assets, including investment securities, and liabilities are translated into U.S. dollars at the exchange rates at period end. Purchases and sales of investment securities, income and dividends received and expenses denominated in foreign currencies are translated into U.S. dollars at the exchange rate in effect on the transaction date.
The effects of exchange rate fluctuations on investments are included with the net realized and unrealized gain (loss) on investment securities. Other foreign currency transactions resulting in realized and unrealized gain (loss) are disclosed separately.
Investment Transactions and Income. For financial reporting purposes, the Funds' investment holdings and NAV include trades executed through the end of the last business day of the period. The NAV per share for processing shareholder transactions is calculated as of the close of business of the New York Stock Exchange (NYSE), normally 4:00 p.m. Eastern time and includes trades executed through the end of the prior business day. Gains and losses on securities sold are determined on the basis of identified cost and for certain Funds include proceeds received from litigation. Dividend income is recorded on the ex-dividend date, except for certain dividends from foreign securities where the ex-dividend date may have passed, which are recorded as soon as the Funds are informed of the ex-dividend date. Non-cash dividends included in dividend income, if any, are recorded at the fair market value of the securities received. Income and capital gain distributions from Fidelity Central Funds, if any, are recorded on the ex-dividend date. Certain distributions received by the Funds represent a return of capital or capital gain. The Funds determine the components of these distributions subsequent to the ex-dividend date, based upon receipt of tax filings or other correspondence relating to the underlying investment. These distributions are recorded as a reduction of cost of investments and/or as a realized gain. Investment income is recorded net of foreign taxes withheld where recovery of such taxes is uncertain.
Expenses. Expenses directly attributable to a fund are charged to that fund. Expenses attributable to more than one fund are allocated among the respective funds on the basis of relative net assets or other appropriate methods. Expense estimates are accrued in the period to which they relate and adjustments are made when actual amounts are known.
Deferred Trustee Compensation. Under a Deferred Compensation Plan (the Plan) for the Funds, certain independent Trustees have elected to defer receipt of a portion of their annual compensation. Deferred amounts are invested in a cross-section of Fidelity funds, are marked-to-market and remain in each Fund until distributed in accordance with the Plan. The investment of deferred amounts and the offsetting payable to the Trustees presented below are included in each accompanying Statement of Assets and Liabilities in other receivables and other payables and accrued expenses, respectively.
| Energy Portfolio | $149,683 |
| Energy Service Portfolio | 50,487 |
| Natural Gas Portfolio | 36,591 |
| Natural Resources Portfolio | 58,687 |
Income Tax Information and Distributions to Shareholders. Each year, each Fund intends to qualify as a regulated investment company under Subchapter M of the Internal Revenue Code, including distributing substantially all of its taxable income and realized gains. As a result, no provision for U.S. Federal income taxes is required. As of February 28, 2019, each Fund did not have any unrecognized tax benefits in the financial statements; nor is each Fund aware of any tax positions for which it is reasonably possible that the total amounts of unrecognized tax benefits will significantly change in the next twelve months. Each Fund files a U.S. federal tax return, in addition to state and local tax returns as required. Each Fund's federal income tax returns are subject to examination by the Internal Revenue Service (IRS) for a period of three fiscal years after they are filed. State and local tax returns may be subject to examination for an additional fiscal year depending on the jurisdiction. Foreign taxes are provided for based on each Fund's understanding of the tax rules and rates that exist in the foreign markets in which it invests. Energy Portfolio and Natural Resources Portfolio are subject to a tax imposed on capital gains by certain countries in which they invest. An estimated deferred tax liability for net unrealized appreciation on the applicable securities is included in Other payables and accrued expenses on each applicable Fund's Statement of Assets & Liabilities.
Distributions are declared and recorded on the ex-dividend date. Income and capital gain distributions are determined in accordance with income tax regulations, which may differ from GAAP. In addition, certain Funds claimed a portion of the payment made to redeeming shareholders as a distribution for income tax purposes.
Capital accounts within the financial statements are adjusted for permanent book-tax differences. These adjustments have no impact on net assets or the results of operations. Capital accounts are not adjusted for temporary book-tax differences which will reverse in a subsequent period.
Book-tax differences are primarily due to foreign currency transactions, net operating losses, expiring capital loss carryforwards, certain foreign taxes, redemptions in-kind, passive foreign investment companies (PFIC), partnerships, deferred trustees compensation, capital loss carryforwards, and losses deferred due to wash sales and excise tax regulations.
As of period end, the cost and unrealized appreciation (depreciation) in securities, and derivatives if applicable, for federal income tax purposes were as follows for each Fund:
| | Tax cost | Gross unrealized appreciation | Gross unrealized depreciation | Net unrealized appreciation (depreciation) |
| Energy Portfolio | $1,093,049,354 | $173,939,001 | $(107,667,871) | $66,271,130 |
| Energy Service Portfolio | 427,134,858 | 11,788,318 | (121,985,878) | (110,197,560) |
| Natural Gas Portfolio | 281,764,993 | 5,402,108 | (84,457,752) | (79,055,644) |
| Natural Resources Portfolio | 433,736,177 | 47,995,675 | (45,276,457) | 2,719,218 |
The tax-based components of distributable earnings as of period end were as follows for each Fund:
| | Undistributed ordinary income | Capital loss carryforward | Net unrealized appreciation (depreciation) on securities and other investments |
| Energy Portfolio | $1,547,899 | $(357,000,293) | $61,958,425 |
| Energy Service Portfolio | – | (139,447,875) | (113,308,761) |
| Natural Gas Portfolio | – | (268,822,031) | (79,324,109) |
| Natural Resources Portfolio | 1,208,925 | (213,054,589) | (595,790) |
The fund intends to elect to defer to its next fiscal year ordinary losses recognized during the period January 1, 2019 to February 28, 2019:
| | Ordinary Losses |
| Energy Service Portfolio | $682,849 |
| Natural Gas Portfolio | $380,297 |
Capital loss carryforwards are only available to offset future capital gains of the Funds to the extent provided by regulations and may be limited. Under the Regulated Investment Company Modernization Act of 2010 (the Act), the Funds are permitted to carry forward capital losses incurred in taxable years beginning after December 22, 2010 for an unlimited period and such capital losses are required to be used prior to any losses that expire. The capital loss carryforward information presented below, including any applicable limitation, is estimated as of fiscal period end and is subject to adjustment.
| | No expiration | | | |
| | Short-term | Long-term | Total no expiration | Total capital loss carryfoward |
| Energy Portfolio | $(236,660,242) | $(120,340,051) | $(357,000,293) | $(357,000,293) |
| Energy Service Portfolio | (24,393,961) | (115,053,914) | (139,447,875) | (139,447,875) |
| Natural Gas Portfolio | (58,829,181) | (209,992,850) | (268,822,031) | (268,822,031) |
| Natural Resources Portfolio | (93,211,364) | (119,843,225) | (213,054,589) | (213,054,589) |
The tax character of distributions paid was as follows:
| February 28, 2019 | | |
| | Ordinary Income | Total |
| Energy Portfolio | $15,141,238 | $15,141,238 |
| Energy Service Portfolio | 2,784,223 | 2,784,223 |
| Natural Gas Portfolio | 1,257,826 | 1,257,826 |
| Natural Resources Portfolio | 10,282,640 | 10,282,640 |
| February 28,2018 | | |
| | Ordinary Income | Total |
| Energy Portfolio | $35,170,840 | $35,170,840 |
| Energy Service Portfolio | 29,253,083 | 29,253,083 |
| Natural Gas Portfolio | 11,814,523 | 11,814,523 |
| Natural Resources Portfolio | 13,624,042 | 13,624,042 |
Restricted Securities. The Funds may invest in securities that are subject to legal or contractual restrictions on resale. These securities generally may be resold in transactions exempt from registration or to the public if the securities are registered. Disposal of these securities may involve time-consuming negotiations and expense, and prompt sale at an acceptable price may be difficult. Information regarding restricted securities is included at the end of each applicable Fund's Schedule of Investments.
New Rule Issuance. During August 2018, the U.S. Securities and Exchange Commission issued Final Rule Release No. 33-10532, Disclosure Update and Simplification. This Final Rule includes amendments specific to registered investment companies that are intended to eliminate overlap in disclosure requirements between Regulation S-X and GAAP. In accordance with these amendments, certain line-items in the Funds' financial statements have been combined or removed for the current period as outlined in the table below.
| Financial Statement | Current Line-Item Presentation (As Applicable) | Prior Line-Item Presentation (As Applicable) |
| Statement of Assets and Liabilities | Total distributable earnings (loss) | Undistributed/Distributions in excess of/Accumulated net investment income (loss)
Accumulated/Undistributed net realized gain (loss)
Net unrealized appreciation (depreciation) |
| Statement of Changes in Net Assets | N/A - removed | Undistributed/Distributions in excess of/Accumulated net investment income (loss) end of period |
| Statement of Changes in Net Assets | Distributions to shareholders | Distributions to shareholders from net investment income
Distributions to shareholders from net realized gain |
4. Purchases and Sales of Investments.
Purchases and sales of securities, other than short -term securities and in-kind transactions, are noted in the table below.
| | Purchases ($) | Sales ($) |
| Energy Portfolio | 925,101,759 | 1,219,246,062 |
| Energy Service Portfolio | 293,145,737 | 304,863,481 |
| Natural Gas Portfolio | 206,477,642 | 233,474,574 |
| Natural Resources Portfolio | 231,643,823 | 619,934,265 |
5. Fees and Other Transactions with Affiliates.
Management Fee. Fidelity SelectCo, LLC (the investment adviser) and its affiliates provide the Funds with investment management related services for which the Funds pay a monthly management fee. The management fee is the sum of an individual fund fee rate and an annualized group fee rate. The individual fund fee rate is applied to each Fund's average net assets. The group fee rate is based upon the average net assets of all the mutual funds advised by Fidelity Management & Research Company (FMR) and the investment adviser. The group fee rate decreases as assets under management increase and increases as assets under management decrease. For the reporting period, each Fund's annual management fee rate expressed as a percentage of each Fund's average net assets was as follows:
| | Individual Rate | Group Rate | Total |
| Energy Portfolio | .30% | .24% | .54% |
| Energy Service Portfolio | .30% | .24% | .54% |
| Natural Gas Portfolio | .30% | .24% | .54% |
| Natural Resources Portfolio | .30% | .24% | .54% |
Transfer Agent Fees. Fidelity Investments Institutional Operations Company, Inc. (FIIOC), an affiliate of the investment adviser, is the Funds' transfer, dividend disbursing and shareholder servicing agent. FIIOC receives account fees and asset-based fees that vary according to account size and type of account. FIIOC pays for typesetting, printing and mailing of shareholder reports, except proxy statements. For the period, transfer agent fees were equivalent to the following annual rates expressed as a percentage of average net assets:
| Energy Portfolio | .20% |
| Energy Service Portfolio | .23% |
| Natural Gas Portfolio | .27% |
| Natural Resources Portfolio | .22% |
Accounting and Security Lending Fees. Fidelity Service Company, Inc. (FSC), an affiliate of the investment adviser, maintains each Fund's accounting records. The accounting fee is based on the level of average net assets for each month. Under a separate contract, FSC administers the security lending program. The security lending fee is based on the number and duration of lending transactions. For the period, the fees were equivalent to the following annual rates:
| | % of Average Net Assets |
| Energy Portfolio | .03 |
| Energy Service Portfolio | .04 |
| Natural Gas Portfolio | .04 |
| Natural Resources Portfolio | .03 |
Brokerage Commissions. Certain Funds placed a portion of their portfolio transactions with brokerage firms which are affiliates of the investment adviser. Brokerage commissions are included in net realized gain (loss) and change in net unrealized appreciation (depreciation) in the Statement of Operations. The commissions paid to these affiliated firms were as follows:
| | Amount |
| Energy Portfolio | $32,981 |
| Energy Service Portfolio | 16,646 |
| Natural Gas Portfolio | 5,642 |
| Natural Resources Portfolio | 6,721 |
Interfund Lending Program. Pursuant to an Exemptive Order issued by the SEC, the Funds, along with other registered investment companies having management contracts with Fidelity Management & Research Company (FMR) or other affiliated entities of FMR, may participate in an interfund lending program. This program provides an alternative credit facility allowing the funds to borrow from, or lend money to, other participating affiliated funds. At period end, there were no interfund loans outstanding. Each applicable fund's activity in this program during the period for which loans were outstanding was as follows:
| | Borrower or Lender | Average Loan Balance | Weighted Average Interest Rate | Interest Expense |
| Energy Portfolio | Borrower | $8,059,292 | 2.40% | $12,916 |
| Energy Service Portfolio | Borrower | $2,834,500 | 1.67% | $263 |
| Natural Gas Portfolio | Borrower | $2,656,571 | 2.43% | $1,261 |
| Natural Resources Portfolio | Borrower | $6,161,333 | 2.64% | $2,706 |
Interfund Trades. The Funds may purchase from or sell securities to other Fidelity Funds under procedures adopted by the Board. The procedures have been designed to ensure these interfund trades are executed in accordance with Rule 17a-7 of the 1940 Act. Interfund trades are included within the respective purchases and sales amounts shown in the Purchases and Sales of Investments note.
Other. During the period, the investment adviser reimbursed the Funds for certain losses as follows:
| | Amount |
| Energy Portfolio | 16,683 |
| Natural Resources Portfolio | 7,336 |
Affiliated Redemptions In-Kind. During the period, 5,345,534 shares of Energy Portfolio were redeemed in-kind for investments and cash with a value of $239,961,028. The net realized gain of $76,585,161 on investments delivered through in-kind redemptions is included in the accompanying Statement of Operations. The amount of the in-kind redemptions is included in share transactions in the accompanying Statement of Changes in Net Assets. The Fund recognized no gain or loss for federal income tax purposes.
6. Committed Line of Credit.
Certain Funds participate with other funds managed by the investment adviser or an affiliate in a $4.25 billion credit facility (the "line of credit") to be utilized for temporary or emergency purposes to fund shareholder redemptions or for other short-term liquidity purposes. The participating funds have agreed to pay commitment fees on their pro-rata portion of the line of credit, which are reflected in Miscellaneous expenses on the Statement of Operations, and are as follows:
| Energy Portfolio | $4,713 |
| Energy Service Portfolio | 1,101 |
| Natural Gas Portfolio | 697 |
| Natural Resources Portfolio | 2,738 |
During the period, the Funds did not borrow on this line of credit.
7. Security Lending.
Certain Funds lend portfolio securities through a lending agent from time to time in order to earn additional income. On the settlement date of the loan, each applicable Fund receives collateral (in the form of U.S. Treasury obligations, letters of credit and/or cash) against the loaned securities and maintains collateral in an amount not less than 100% of the market value of the loaned securities during the period of the loan. The market value of the loaned securities is determined at the close of business of the Funds and any additional required collateral is delivered to the Funds on the next business day. The Funds or borrower may terminate the loan at any time, and if the borrower defaults on its obligation to return the securities loaned because of insolvency or other reasons, the Funds may apply collateral received from the borrower against the obligation. The Funds may experience delays and costs in recovering the securities loaned. Any cash collateral received is invested in the Fidelity Securities Lending Cash Central Fund. The value of loaned securities and cash collateral at period end are disclosed on each applicable Fund's Statement of Assets and Liabilities. Security lending income represents the income earned on investing cash collateral, less rebates paid to borrowers and any lending agent fees associated with the loan, plus any premium payments received for lending certain types of securities. Security lending income is presented on each applicable Fund's Statement of Operations as a component of income from Fidelity Central Funds.
8. Bank Borrowings.
Each Fund is permitted to have bank borrowings for temporary or emergency purposes to fund shareholder redemptions or for other short-term liquidity requirements. Each Fund has established borrowing arrangements with certain banks. The interest rate on the borrowings is the bank's base rate, as revised from time to time. At period end, there were no bank borrowings outstanding. Each applicable Fund's activity in this program during the period for which loans were outstanding was as follows:
| | Average Loan Balance | Weighted Average Interest Rate | Interest Expense |
| Natural Gas Portfolio | $62,000 | 2.68% | $5 |
9. Expense Reductions.
Commissions paid to certain brokers with whom the investment adviser, or its affiliates, places trades on behalf of certain Funds include an amount in addition to trade execution, which may be rebated back to the Funds to offset certain expenses. In addition, through arrangements with each applicable Fund's custodian, credits realized as a result of certain uninvested cash balances were used to reduce each applicable Fund's expenses. All of the applicable expense reductions are noted in the table below.
| | Brokerage Service reduction | Transfer Agent expense reduction |
| Energy Portfolio | $147,857 | $269 |
| Energy Service Portfolio | 111,851 | 438 |
| Natural Gas Portfolio | 68,380 | – |
| Natural Resources Portfolio | 62,880 | – |
In addition, during the period the investment adviser reimbursed and/or waived a portion of operating expenses as follows:
| | Amount |
| Energy Portfolio | $13,066 |
| Energy Service Portfolio | 2,850 |
| Natural Gas Portfolio | 2,085 |
| Natural Resources Portfolio | 7,896 |
10. Other.
The Funds' organizational documents provide former and current trustees and officers with a limited indemnification against liabilities arising in connection with the performance of their duties to the Funds. In the normal course of business, the Funds may also enter into contracts that provide general indemnifications. The Funds' maximum exposure under these arrangements is unknown as this would be dependent on future claims that may be made against the Funds. The risk of material loss from such claims is considered remote.
Report of Independent Registered Public Accounting Firm
To the Board of Trustees of Fidelity Select Portfolios and Shareholders of Energy Portfolio, Energy Service Portfolio, Natural Gas Portfolio and Natural Resources Portfolio:
Opinions on the Financial Statements
We have audited the accompanying statements of assets and liabilities, including the schedules of investments, of Energy Portfolio, Energy Service Portfolio, Natural Gas Portfolio and Natural Resources Portfolio (four of the funds constituting Fidelity Select Portfolios, hereafter collectively referred to as the "Funds") as of February 28, 2019, the related statements of operations for the year ended February 28, 2019, the statements of changes in net assets for each of the two years in the period ended February 28, 2019, including the related notes, and the financial highlights for each of the five years in the period ended February 28, 2019 (collectively referred to as the “financial statements”). In our opinion, the financial statements present fairly, in all material respects, the financial position of each of the Funds as of February 28, 2019, the results of each of their operations for the year then ended, the changes in each of their net assets for each of the two years in the period ended February 28, 2019 and each of the financial highlights for each of the five years in the period ended February 28, 2019 in conformity with accounting principles generally accepted in the United States of America.
Basis for Opinions
These financial statements are the responsibility of the Funds' management. Our responsibility is to express an opinion on the Funds' financial statements based on our audits. We are a public accounting firm registered with the Public Company Accounting Oversight Board (United States) (PCAOB) and are required to be independent with respect to the Funds in accordance with the U.S. federal securities laws and the applicable rules and regulations of the Securities and Exchange Commission and the PCAOB.
We conducted our audits of these financial statements in accordance with the standards of the PCAOB. Those standards require that we plan and perform the audit to obtain reasonable assurance about whether the financial statements are free of material misstatement, whether due to error or fraud.
Our audits included performing procedures to assess the risks of material misstatement of the financial statements, whether due to error or fraud, and performing procedures that respond to those risks. Such procedures included examining, on a test basis, evidence regarding the amounts and disclosures in the financial statements. Our audits also included evaluating the accounting principles used and significant estimates made by management, as well as evaluating the overall presentation of the financial statements. Our procedures included confirmation of securities owned as of February 28, 2019 by correspondence with the custodian, and brokers; when replies were not received from brokers, we performed other auditing procedures. We believe that our audits provide a reasonable basis for our opinions.
PricewaterhouseCoopers LLP
Boston, Massachusetts
April 11, 2019
We have served as the auditor of one or more investment companies in the Fidelity group of funds since 1932.
Trustees and Officers
The Trustees, Members of the Advisory Board (if any), and officers of the trust and funds, as applicable, are listed below. The Board of Trustees governs each fund and is responsible for protecting the interests of shareholders. The Trustees are experienced executives who meet periodically throughout the year to oversee each fund's activities, review contractual arrangements with companies that provide services to each fund, oversee management of the risks associated with such activities and contractual arrangements, and review each fund's performance. Except for Michael E. Wiley, each of the Trustees oversees 287 funds. Wiley oversees 195 funds.
The Trustees hold office without limit in time except that (a) any Trustee may resign; (b) any Trustee may be removed by written instrument, signed by at least two-thirds of the number of Trustees prior to such removal; (c) any Trustee who requests to be retired or who has become incapacitated by illness or injury may be retired by written instrument signed by a majority of the other Trustees; and (d) any Trustee may be removed at any special meeting of shareholders by a two-thirds vote of the outstanding voting securities of the trust. Each Trustee who is not an interested person (as defined in the 1940 Act) of the trust and the funds is referred to herein as an Independent Trustee. Each Independent Trustee shall retire not later than the last day of the calendar year in which his or her 75th birthday occurs. The Independent Trustees may waive this mandatory retirement age policy with respect to individual Trustees. Officers and Advisory Board Members hold office without limit in time, except that any officer or Advisory Board Member may resign or may be removed by a vote of a majority of the Trustees at any regular meeting or any special meeting of the Trustees. Except as indicated, each individual has held the office shown or other offices in the same company for the past five years.
Each fund’s Statement of Additional Information (SAI) includes more information about the Trustees. To request a free copy, call Fidelity at 1-800-544-8544.
Experience, Skills, Attributes, and Qualifications of the Trustees. The Governance and Nominating Committee has adopted a statement of policy that describes the experience, qualifications, attributes, and skills that are necessary and desirable for potential Independent Trustee candidates (Statement of Policy). The Board believes that each Trustee satisfied at the time he or she was initially elected or appointed a Trustee, and continues to satisfy, the standards contemplated by the Statement of Policy. The Governance and Nominating Committee also engages professional search firms to help identify potential Independent Trustee candidates who have the experience, qualifications, attributes, and skills consistent with the Statement of Policy. From time to time, additional criteria based on the composition and skills of the current Independent Trustees, as well as experience or skills that may be appropriate in light of future changes to board composition, business conditions, and regulatory or other developments, have also been considered by the professional search firms and the Governance and Nominating Committee. In addition, the Board takes into account the Trustees' commitment and participation in Board and committee meetings, as well as their leadership of standing and ad hoc committees throughout their tenure.
In determining that a particular Trustee was and continues to be qualified to serve as a Trustee, the Board has considered a variety of criteria, none of which, in isolation, was controlling. The Board believes that, collectively, the Trustees have balanced and diverse experience, qualifications, attributes, and skills, which allow the Board to operate effectively in governing each fund and protecting the interests of shareholders. Information about the specific experience, skills, attributes, and qualifications of each Trustee, which in each case led to the Board's conclusion that the Trustee should serve (or continue to serve) as a trustee of the funds, is provided below.
Board Structure and Oversight Function. James C. Curvey is an interested person and currently serves as Chairman. The Trustees have determined that an interested Chairman is appropriate and benefits shareholders because an interested Chairman has a personal and professional stake in the quality and continuity of services provided to the funds. Independent Trustees exercise their informed business judgment to appoint an individual of their choosing to serve as Chairman, regardless of whether the Trustee happens to be independent or a member of management. The Independent Trustees have determined that they can act independently and effectively without having an Independent Trustee serve as Chairman and that a key structural component for assuring that they are in a position to do so is for the Independent Trustees to constitute a substantial majority for the Board. The Independent Trustees also regularly meet in executive session. Ned C. Lautenbach serves as Chairman of the Independent Trustees and as such (i) acts as a liaison between the Independent Trustees and management with respect to matters important to the Independent Trustees and (ii) with management prepares agendas for Board meetings.
Fidelity® funds are overseen by different Boards of Trustees. The funds' Board oversees Fidelity's high income and certain equity funds, and other Boards oversee Fidelity's investment-grade bond, money market, asset allocation, and other equity funds. The asset allocation funds may invest in Fidelity® funds overseen by the funds' Board. The use of separate Boards, each with its own committee structure, allows the Trustees of each group of Fidelity® funds to focus on the unique issues of the funds they oversee, including common research, investment, and operational issues. On occasion, the separate Boards establish joint committees to address issues of overlapping consequences for the Fidelity® funds overseen by each Board.
The Trustees operate using a system of committees to facilitate the timely and efficient consideration of all matters of importance to the Trustees, each fund, and fund shareholders and to facilitate compliance with legal and regulatory requirements and oversight of the funds' activities and associated risks. The Board, acting through its committees, has charged SelectCo and its affiliates with (i) identifying events or circumstances the occurrence of which could have demonstrably adverse effects on the funds' business and/or reputation; (ii) implementing processes and controls to lessen the possibility that such events or circumstances occur or to mitigate the effects of such events or circumstances if they do occur; and (iii) creating and maintaining a system designed to evaluate continuously business and market conditions in order to facilitate the identification and implementation processes described in (i) and (ii) above. Because the day-to-day operations and activities of the funds are carried out by or through SelectCo, its affiliates, and other service providers, the funds' exposure to risks is mitigated but not eliminated by the processes overseen by the Trustees. While each of the Board's committees has responsibility for overseeing different aspects of the funds' activities, oversight is exercised primarily through the Operations, Audit, and Compliance Committees. In addition, the Independent Trustees have worked with Fidelity to enhance the Board's oversight of investment and financial risks, legal and regulatory risks, technology risks, and operational risks, including the development of additional risk reporting to the Board. Appropriate personnel, including but not limited to the funds' Chief Compliance Officer (CCO), SelectCo's internal auditor, the independent accountants, the funds' Treasurer and portfolio management personnel, make periodic reports to the Board's committees, as appropriate, including an annual review of Fidelity's risk management program for the Fidelity® funds. The responsibilities of each standing committee, including their oversight responsibilities, are described further under "Standing Committees of the Trustees."
Interested Trustees*:
Correspondence intended for a Trustee who is an interested person may be sent to Fidelity Investments, 245 Summer Street, Boston, Massachusetts 02210.
Name, Year of Birth; Principal Occupations and Other Relevant Experience+
James C. Curvey (1935)
Year of Election or Appointment: 2018
Trustee
Chairman of the Board of Trustees
Mr. Curvey also serves as Trustee of other Fidelity® funds. Mr. Curvey is Vice Chairman (2007-present) and Director of FMR LLC (diversified financial services company). In addition, Mr. Curvey is an Overseer Emeritus for the Boston Symphony Orchestra, a Director of Artis-Naples, and a Trustee of Brewster Academy in Wolfeboro, New Hampshire. Previously, Mr. Curvey served as a Director of Fidelity Research & Analysis Co. (investment adviser firm, 2009-2018), Director of Fidelity Investments Money Management, Inc. (investment adviser firm, 2009-2014) and a Director of FMR and FMR Co., Inc. (investment adviser firms, 2007-2014).
* Determined to be an "Interested Trustee" by virtue of, among other things, his or her affiliation with the trust[s] or various entities under common control with SelectCo.
+ The information includes the Trustee's principal occupation during the last five years and other information relating to the experience, attributes, and skills relevant to the Trustee's qualifications to serve as a Trustee, which led to the conclusion that the Trustee should serve as a Trustee for each fund.
Independent Trustees:
Correspondence intended for an Independent Trustee may be sent to Fidelity Investments, P.O. Box 55235, Boston, Massachusetts 02205-5235.
Name, Year of Birth; Principal Occupations and Other Relevant Experience+
Dennis J. Dirks (1948)
Year of Election or Appointment: 2018
Trustee
Mr. Dirks also serves as Trustee of other Fidelity® funds. Prior to his retirement in May 2003, Mr. Dirks was Chief Operating Officer and a member of the Board of The Depository Trust & Clearing Corporation (DTCC). He also served as President, Chief Operating Officer, and Board member of The Depository Trust Company (DTC) and President and Board member of the National Securities Clearing Corporation (NSCC). In addition, Mr. Dirks served as Chief Executive Officer and Board member of the Government Securities Clearing Corporation, Chief Executive Officer and Board member of the Mortgage-Backed Securities Clearing Corporation, as a Trustee and a member of the Finance Committee of Manhattan College (2005-2008), as a Trustee and a member of the Finance Committee of AHRC of Nassau County (2006-2008), as a member of the Independent Directors Council (IDC) Governing Council (2010-2015), and as a member of the Board of Directors for The Brookville Center for Children’s Services, Inc. (2009-2017). Mr. Dirks is a member of the Finance Committee (2016-present) and Board of Directors (2017-present) and is Treasurer (2018-present) of the Asolo Repertory Theatre.
Donald F. Donahue (1950)
Year of Election or Appointment: 2018
Trustee
Mr. Donahue also serves as a Trustee of other Fidelity® funds. Mr. Donahue is President and Chief Executive Officer of Miranda Partners, LLC (risk consulting for the financial services industry, 2012-present). Previously, Mr. Donahue served as a Member of the Advisory Board of certain Fidelity® funds (2015-2018) and Chief Executive Officer (2006-2012), Chief Operating Officer (2003-2006), and Managing Director, Customer Marketing and Development (1999-2003) of The Depository Trust & Clearing Corporation (financial markets infrastructure). Mr. Donahue serves as a Member (2007-present) and Co-Chairman (2016-present) of the Board of Directors of United Way of New York, Member of the Board of Directors of NYC Leadership Academy (2012-present) and Member of the Board of Advisors of Ripple Labs, Inc. (financial services, 2015-present). He also served as Chairman (2010-2012) and Member of the Board of Directors (2012-2013) of Omgeo, LLC (financial services), Treasurer of United Way of New York (2012-2016), and Member of the Board of Directors of XBRL US (financial services non-profit, 2009-2012) and the International Securities Services Association (2009-2012).
Alan J. Lacy (1953)
Year of Election or Appointment: 2018
Trustee
Mr. Lacy also serves as Trustee of other Fidelity® funds. Mr. Lacy serves as a Director of Bristol-Myers Squibb Company (global pharmaceuticals, 2008-present). He is a Trustee of the California Chapter of The Nature Conservancy (2015-present) and a Director of the Center for Advanced Study in the Behavioral Sciences at Stanford University (2015-present). In addition, Mr. Lacy served as Senior Adviser (2007-2014) of Oak Hill Capital Partners, L.P. (private equity) and also served as Chief Executive Officer (2005) and Vice Chairman (2005-2006) of Sears Holdings Corporation (retail) and Chief Executive Officer and Chairman of the Board of Sears, Roebuck and Co. (retail, 2000-2005). Previously, Mr. Lacy served as Chairman (2014-2017) and a member (2010-2017) of the Board of Directors of Dave & Buster’s Entertainment, Inc. (restaurant and entertainment complexes), as Chairman (2008-2011) and a member (2006-2015) of the Board of Trustees of the National Parks Conservation Association, and as a member of the Board of Directors for The Hillman Companies, Inc. (hardware wholesalers, 2010-2014), Earth Fare, Inc. (retail grocery, 2010-2014), and The Western Union Company (global money transfer, 2006-2011).
Ned C. Lautenbach (1944)
Year of Election or Appointment: 2018
Trustee
Chairman of the Independent Trustees
Mr. Lautenbach also serves as Trustee of other Fidelity® funds. Mr. Lautenbach currently serves as Chair (2018-present) and Member (2013-present) of the Board of Governors, State University System of Florida and is a member of the Council on Foreign Relations (1994-present). He is also a member and has most recently served as Chairman of the Board of Directors of Artis-Naples (2012-present). Previously, Mr. Lautenbach served as a member and then Lead Director of the Board of Directors of Eaton Corporation (diversified industrial, 1997-2016). He was also a Partner and Advisory Partner at Clayton, Dubilier & Rice, LLC (private equity investment, 1998-2010), as well as a Director of Sony Corporation (2006-2007). In addition, Mr. Lautenbach also had a 30-year career with IBM (technology company) during which time he served as Senior Vice President and a member of the Corporate Executive Committee (1968-1998).
Joseph Mauriello (1944)
Year of Election or Appointment: 2018
Trustee
Mr. Mauriello also serves as Trustee of other Fidelity® funds. Prior to his retirement in January 2006, Mr. Mauriello served in numerous senior management positions including Deputy Chairman and Chief Operating Officer (2004-2005), and Vice Chairman of Financial Services (2002-2004) of KPMG LLP US (professional services, 1965-2005). Mr. Mauriello currently serves as a member of the Independent Directors Council (IDC) Governing Council (2015-present). Previously, Mr. Mauriello served as a member of the Board of Directors of XL Group plc. (global insurance and re-insurance, 2006-2018).
Cornelia M. Small (1944)
Year of Election or Appointment: 2018
Trustee
Ms. Small also serves as Trustee of other Fidelity® funds. Ms. Small is a member of the Board of Directors (2009-present) and Chair of the Investment Committee (2010-present) of the Teagle Foundation. Ms. Small also serves on the Investment Committee of the Berkshire Taconic Community Foundation (2008-present). Previously, Ms. Small served as Chairperson (2002-2008) and a member of the Investment Committee and Chairperson (2008-2012) and a member of the Board of Trustees of Smith College. In addition, Ms. Small served as Chief Investment Officer, Director of Global Equity Investments, and a member of the Board of Directors of Scudder, Stevens & Clark and Scudder Kemper Investments.
Garnett A. Smith (1947)
Year of Election or Appointment: 2013
Trustee
Mr. Smith also serves as Trustee of other Fidelity® funds. Prior to Mr. Smith's retirement, he served as Chairman and Chief Executive Officer of Inbrand Corp. (manufacturer of personal absorbent products, 1990-1997). He also served as President (1986-1990) of Inbrand Corp. Prior to his employment with Inbrand Corp., he was employed by a retail fabric chain and North Carolina National Bank. In addition, Mr. Smith served as a Member of the Advisory Board of certain Fidelity® funds (2012-2013) and as a board member of the Jackson Hole Land Trust (2009-2012).
David M. Thomas (1949)
Year of Election or Appointment: 2018
Trustee
Mr. Thomas also serves as Trustee of other Fidelity® funds. Mr. Thomas serves as Non-Executive Chairman of the Board of Directors of Fortune Brands Home and Security (home and security products, 2011-present) and as a member of the Board of Directors (2004-present) and Presiding Director (2013-present) of Interpublic Group of Companies, Inc. (marketing communication). Previously, Mr. Thomas served as Executive Chairman (2005-2006) and Chairman and Chief Executive Officer (2000-2005) of IMS Health, Inc. (pharmaceutical and healthcare information solutions), a Director of Fortune Brands, Inc. (consumer products, 2000-2011), and a member of the Board of Trustees of the University of Florida (2013-2018).
Michael E. Wiley (1950)
Year of Election or Appointment: 2008
Trustee
Mr. Wiley also serves as Trustee or Member of the Advisory Board of other Fidelity® funds. Mr. Wiley serves as a Director of High Point Resources (exploration and production, 2005-present). Previously, Mr. Wiley served as a Director of Andeavor Corporation (independent oil refiner and marketer, 2005-2018), a Director of Andeavor Logistics LP (natural resources logistics, 2015-2018), a Director of Post Oak Bank (privately-held bank, 2004-2018), a Director of Asia Pacific Exploration Consolidated (international oil and gas exploration and production, 2008-2013), a member of the Board of Trustees of the University of Tulsa (2000-2006; 2007-2010), a Senior Energy Advisor of Katzenbach Partners, LLC (consulting, 2006-2007), an Advisory Director of Riverstone Holdings (private investment), a Director of Spinnaker Exploration Company (exploration and production, 2001-2005) and Chairman, President, and CEO of Baker Hughes, Inc. (oilfield services, 2000-2004).
+ The information includes the Trustee's principal occupation during the last five years and other information relating to the experience, attributes, and skills relevant to the Trustee's qualifications to serve as a Trustee, which led to the conclusion that the Trustee should serve as a Trustee for each fund.
Advisory Board Members and Officers:
Correspondence intended for a Member of the Advisory Board (if any) may be sent to Fidelity Investments, P.O. Box 55235, Boston, Massachusetts 02205-5235. Correspondence intended for an officer or Peter S. Lynch may be sent to Fidelity Investments, 245 Summer Street, Boston, Massachusetts 02210. Officers appear below in alphabetical order.
Name, Year of Birth; Principal Occupation
Vicki L. Fuller (1957)
Year of Election or Appointment: 2018
Member of the Advisory Board
Ms. Fuller also serves as Member of the Advisory Board of other Fidelity® funds. Ms. Fuller serves as a member of the Board of Directors, Audit Committee, and Nominating and Governance Committee of The Williams Companies, Inc. (natural gas infrastructure, 2018-present). Previously, Ms. Fuller served as the Chief Investment Officer of the New York State Common Retirement Fund (2012-2018) and held a variety of positions at AllianceBernstein L.P. (global asset management, 1985-2012), including Managing Director (2006-2012) and Senior Vice President and Senior Portfolio Manager (2001-2006).
Peter S. Lynch (1944)
Year of Election or Appointment: 2018
Member of the Advisory Board
Mr. Lynch also serves as Member of the Advisory Board of other Fidelity® funds. Mr. Lynch is Vice Chairman and a Director of FMR (investment adviser firm) and FMR Co., Inc. (investment adviser firm). In addition, Mr. Lynch serves as a Trustee of Boston College and as the Chairman of the Inner-City Scholarship Fund. Previously, Mr. Lynch served on the Special Olympics International Board of Directors (1997-2006).
Carol B. Tomé (1957)
Year of Election or Appointment: 2017
Member of the Advisory Board
Ms. Tomé also serves as Member of the Advisory Board of other Fidelity® funds. Ms. Tomé is Chief Financial Officer (2001-present) and Executive Vice President of Corporate Services (2007-present) of The Home Depot, Inc. (home improvement retailer) and a Director (2003-present) and Chair of the Audit Committee (2004-present) of United Parcel Service, Inc. (package delivery and supply chain management). Previously, Ms. Tomé served as Trustee of certain Fidelity® funds (2017), Senior Vice President of Finance and Accounting/Treasurer (2000-2007) and Vice President and Treasurer (1995-2000) of The Home Depot, Inc. and Chair of the Board (2010-2012), Vice Chair of the Board (2009 and 2013), and a Director (2008-2013) of the Federal Reserve Bank of Atlanta. Ms. Tomé is also a director or trustee of many community and professional organizations.
Elizabeth Paige Baumann (1968)
Year of Election or Appointment: 2017
Anti-Money Laundering (AML) Officer
Ms. Baumann also serves as AML Officer of other funds. She is Chief AML Officer (2012-present) and Senior Vice President (2014-present) of FMR LLC (diversified financial services company) and is an employee of Fidelity Investments. Previously, Ms. Baumann served as AML Officer of the funds (2012-2016), and Vice President (2007-2014) and Deputy Anti-Money Laundering Officer (2007-2012) of FMR LLC.
Craig S. Brown (1977)
Year of Election or Appointment: 2019
Assistant Treasurer
Mr. Brown also serves as Assistant Treasurer of other funds. Mr. Brown is an employee of Fidelity Investments (2013-present).
John J. Burke III (1964)
Year of Election or Appointment: 2018
Chief Financial Officer
Mr. Burke also serves as Chief Financial Officer of other funds. Mr. Burke serves as Head of Investment Operations for Fidelity Fund and Investment Operations (2018-present) and is an employee of Fidelity Investments (1998-present). Previously Mr. Burke served as head of Asset Management Investment Operations (2012-2018).
William C. Coffey (1969)
Year of Election or Appointment: 2018
Secretary and Chief Legal Officer (CLO)
Mr. Coffey also serves as Secretary and CLO of other funds. Mr. Coffey serves as CLO, Secretary, and Senior Vice President of Fidelity Management & Research Company and FMR Co., Inc. (investment adviser firms, 2018-present); Secretary of Fidelity SelectCo, LLC and Fidelity Investments Money Management, Inc. (investment adviser firms, 2018-present); and CLO of Fidelity Management & Research (Hong Kong) Limited, FMR Investment Management (UK) Limited, and Fidelity Management & Research (Japan) Limited (investment adviser firms, 2018-present). He is Senior Vice President and Deputy General Counsel of FMR LLC (diversified financial services company, 2010-present), and is an employee of Fidelity Investments. Previously, Mr. Coffey served as Assistant Secretary of certain funds (2009-2018) and as Vice President and Associate General Counsel of FMR LLC (2005-2009).
Timothy M. Cohen (1969)
Year of Election or Appointment: 2018
Vice President
Mr. Cohen also serves as Vice President of other funds. Mr. Cohen serves as Co-Head of Global Equity Research (2016-present), a Director of Fidelity Management & Research (Japan) Limited (investment adviser firm, 2016-present), and is an employee of Fidelity Investments. Previously, Mr. Cohen served as Chief Investment Officer - Equity and a Director of Fidelity Management & Research (U.K.) Inc. (investment adviser firm, 2013-2015) and as a Director of Fidelity Management & Research (Hong Kong) Limited (investment adviser firm, 2017).
Jonathan Davis (1968)
Year of Election or Appointment: 2010
Assistant Treasurer
Mr. Davis also serves as Assistant Treasurer of other funds. Mr. Davis serves as Assistant Treasurer of FMR Capital, Inc. (2017-present) and is an employee of Fidelity Investments. Previously, Mr. Davis served as Vice President and Associate General Counsel of FMR LLC (diversified financial services company, 2003-2010).
Adrien E. Deberghes (1967)
Year of Election or Appointment: 2018
Assistant Treasurer
Mr. Deberghes also serves as an officer of other funds. He serves as Assistant Treasurer of FMR Capital, Inc. (2017-present), Executive Vice President of Fidelity Investments Money Management, Inc. (FIMM) (investment adviser firm, 2016-present), and is an employee of Fidelity Investments (2008-present). Previously, Mr. Deberghes served as President and Treasurer of certain Fidelity® funds (2013-2018). Prior to joining Fidelity Investments, Mr. Deberghes was Senior Vice President of Mutual Fund Administration at State Street Corporation (2007-2008), Senior Director of Mutual Fund Administration at Investors Bank & Trust (2005-2007), and Director of Finance for Dunkin' Brands (2000-2005). Previously, Mr. Deberghes served in other fund officer roles.
Laura M. Del Prato (1964)
Year of Election or Appointment: 2018
Assistant Treasurer
Ms. Del Prato also serves as an officer of other funds. Ms. Del Prato is an employee of Fidelity Investments (2017-present). Prior to joining Fidelity Investments, Ms. Del Prato served as a Managing Director and Treasurer of the JPMorgan Mutual Funds (2014-2017). Prior to JPMorgan, Ms. Del Prato served as a partner at Cohen Fund Audit Services (accounting firm, 2012-2013) and KPMG LLP (accounting firm, 2004-2012).
Colm A. Hogan (1973)
Year of Election or Appointment: 2018
Deputy Treasurer
Mr. Hogan also serves as an officer of other funds. Mr. Hogan serves as Assistant Treasurer of FMR Capital, Inc. (2017-present) and is an employee of Fidelity Investments (2005-present). Previously, Mr. Hogan served as Assistant Treasurer of certain Fidelity® funds (2016-2018).
Pamela R. Holding (1964)
Year of Election or Appointment: 2018
Vice President
Ms. Holding also serves as Vice President of other funds. Ms. Holding serves as Co-Head of Global Equity Research (2018-present) and is an employee of Fidelity Investments (2013-present).
Chris Maher (1972)
Year of Election or Appointment: 2013
Assistant Treasurer
Mr. Maher serves as Assistant Treasurer of other funds. Mr. Maher is Vice President of Valuation Oversight, serves as Assistant Treasurer of FMR Capital, Inc. (2017-present), and is an employee of Fidelity Investments. Previously, Mr. Maher served as Vice President of Asset Management Compliance (2013), Vice President of the Program Management Group of FMR (investment adviser firm, 2010-2013), and Vice President of Valuation Oversight (2008-2010).
Kenneth B. Robins (1969)
Year of Election or Appointment: 2018
Chief Compliance Officer
Mr. Robins also serves as an officer of other funds. Mr. Robins serves as Compliance Officer of Fidelity Management & Research Company and FMR Co., Inc. (investment adviser firms, 2016-present) and is an employee of Fidelity Investments (2004-present). Previously, Mr. Robins served as Executive Vice President of Fidelity Investments Money Management, Inc. (investment adviser firm, 2013-2016) and served in other fund officer roles.
Stacie M. Smith (1974)
Year of Election or Appointment: 2018
President and Treasurer
Ms. Smith also serves as an officer of other funds. Ms. Smith serves as Assistant Treasurer of FMR Capital, Inc. (2017-present), is an employee of Fidelity Investments (2009-present), and has served in other fund officer roles. Prior to joining Fidelity Investments, Ms. Smith served as Senior Audit Manager of Ernst & Young LLP (accounting firm, 1996-2009). Previously, Ms. Smith served as Assistant Treasurer (2013-2018) and Deputy Treasurer (2013-2016) of certain Fidelity® funds.
Marc L. Spector (1972)
Year of Election or Appointment: 2017
Assistant Treasurer
Mr. Spector also serves as an officer of other funds. Mr. Spector serves as Assistant Treasurer of FMR Capital, Inc. (2017-present) and is an employee of Fidelity Investments (2016-present). Prior to joining Fidelity Investments, Mr. Spector served as Director at the Siegfried Group (accounting firm, 2013-2016), and prior to Siegfried Group as audit senior manager at Deloitte & Touche (accounting firm, 2005-2013).
Jim Wegmann (1979)
Year of Election or Appointment: 2019
Assistant Treasurer
Mr. Wegmann also serves as Assistant Treasurer of other funds. Mr. Wegmann is an employee of Fidelity Investments (2011-present).
Shareholder Expense Example
As a shareholder of a Fund, you incur two types of costs: (1) transaction costs, including and (2) ongoing costs, including management fees and other Fund expenses. This Example is intended to help you understand your ongoing costs (in dollars) of investing in the Funds and to compare these costs with the ongoing costs of investing in other mutual funds.
The Example is based on an investment of $1,000 invested at the beginning of the period and held for the entire period (September 1, 2018 to February 28, 2019).
Actual Expenses
The first line of the accompanying table for each fund provides information about actual account values and actual expenses. You may use the information in this line, together with the amount you invested, to estimate the expenses that you paid over the period. Simply divide your account value by $1,000.00 (for example, an $8,600 account value divided by $1,000.00 = 8.6), then multiply the result by the number in the first line for a fund under the heading entitled "Expenses Paid During Period" to estimate the expenses you paid on your account during this period. In addition, each Fund, as a shareholder in the underlying Fidelity Central Funds, will indirectly bear its pro-rata share of the fees and expenses incurred by the underlying Fidelity Central Funds. These fees and expenses are not included in the Fund's annualized expense ratio used to calculate the expense estimate in the table below.
Hypothetical Example for Comparison Purposes
The second line of the accompanying table for each fund provides information about hypothetical account values and hypothetical expenses based on a fund's actual expense ratio and an assumed rate of return of 5% per year before expenses, which is not the Fund's actual return. The hypothetical account values and expenses may not be used to estimate the actual ending account balance or expenses you paid for the period. You may use this information to compare the ongoing costs of investing in the Fund and other funds. To do so, compare this 5% hypothetical example with the 5% hypothetical examples that appear in the shareholder reports of the other funds. In addition, each Fund, as a shareholder in the underlying Fidelity Central Funds, will indirectly bear its pro-rata share of the fees and expenses incurred by the underlying Fidelity Central Funds. These fees and expenses are not included in the Fund's annualized expense ratio used to calculate the expense estimate in the table below.
Please note that the expenses shown in the table are meant to highlight your ongoing costs only and do not reflect any transaction costs. Therefore, the second line of the table is useful in comparing ongoing costs only, and will not help you determine the relative total costs of owning different funds. In addition, if these transactional costs were included, your costs would have been higher.
| | Annualized Expense Ratio-A | Beginning
Account Value
September 1, 2018 | Ending
Account Value
February 28, 2019 | Expenses Paid
During Period-B
September 1, 2018
to February 28, 2019 |
| Energy Portfolio | .79% | | | |
| Actual | | $1,000.00 | $800.70 | $3.53 |
| Hypothetical-C | | $1,000.00 | $1,020.88 | $3.96 |
| Energy Service Portfolio | .85% | | | |
| Actual | | $1,000.00 | $697.40 | $3.58 |
| Hypothetical-C | | $1,000.00 | $1,020.58 | $4.26 |
| Natural Gas Portfolio | .90% | | | |
| Actual | | $1,000.00 | $812.80 | $4.05 |
| Hypothetical-C | | $1,000.00 | $1,020.33 | $4.51 |
| Natural Resources Portfolio | .81% | | | |
| Actual | | $1,000.00 | $846.60 | $3.71 |
| Hypothetical-C | | $1,000.00 | $1,020.78 | $4.06 |
A Annualized expense ratio reflects expenses net of applicable fee waivers.
B Expenses are equal to each Fund's annualized expense ratio, multiplied by the average account value over the period, multiplied by 181/ 365 (to reflect the one-half year period).
C 5% return per year before expenses
Distributions (Unaudited)
The Board of Trustees of each fund voted to pay to shareholders of record at the opening of business on record date, the following distributions per share derived from capital gains realized from sales of portfolio securities, and dividends derived from net investment income:
| | Pay Date | Record Date | Dividends | Capital Gains |
| Energy Portfolio | 04/08/19 | 04/05/19 | $0.053 | $0.000 |
| Energy Service Portfolio | 04/08/19 | 04/05/19 | $0.000 | $0.000 |
| Natural Gas Portfolio | 04/08/19 | 04/05/19 | $0.000 | $0.000 |
| Natural Resources Portfolio | 04/08/19 | 04/05/19 | $0.000 | $0.075 |
A percentage of the dividends distributed during the fiscal year for the following funds qualify for the dividends–received deduction for corporate shareholders:
| | April 2018 | December 2018 |
| Energy Portfolio | –% | 100% |
| Energy Service Portfolio | –% | 53% |
| Natural Gas Portfolio | 38% | –% |
| Natural Resources Portfolio | 100% | 100% |
A percentage of the dividends distributed during the fiscal year for the following funds may be taken into account as a dividend for purposes of the maximum rate under section 1(h)(11) of the Internal Revenue Code.
| | April 2018 | December 2018 |
| Energy Portfolio | –% | 100% |
| Energy Service Portfolio | –% | 100% |
| Natural Gas Portfolio | 42% | –% |
| Natural Resources Portfolio | 100% | 100% |
The funds will notify shareholders in January 2020 of amounts for use in preparing 2019 income tax returns.
Board Approval of Investment Advisory Contracts and Management Fees
Energy Portfolio
Energy Service Portfolio
Natural Gas Portfolio
Natural Resources Portfolio
Each year, the Board of Trustees, including the Independent Trustees (together, the Board), votes on the renewal of the management contract with Fidelity SelectCo, LLC (SelectCo), an affiliate of Fidelity Management & Research Company (FMR), and the sub-advisory agreements with affiliates of FMR (together, the Advisory Contracts) for each fund. SelectCo and the sub-advisers are referred to herein as the Investment Advisers. The Board, assisted by the advice of fund counsel and Independent Trustees' counsel, requests and considers a broad range of information relevant to the renewal of the Advisory Contracts throughout the year.
The Board meets regularly and, at each of its meetings, covers an extensive agenda of topics and materials and considers factors that are relevant to its annual consideration of the renewal of each fund's Advisory Contracts, including the services and support provided to each fund and its shareholders. The Board has established various standing committees (Committees), each composed of and chaired by Independent Trustees with varying backgrounds, to which the Board has assigned specific subject matter responsibilities in order to enhance effective decision-making by the Board. The Board, acting directly and through its Committees, requests and receives information concerning the annual consideration of the renewal of each fund's Advisory Contracts. The Board also meets as needed to review matters specifically related to the Board's annual consideration of the renewal of the Advisory Contracts. Members of the Board may also meet with trustees of other Fidelity funds through joint ad hoc committees to discuss certain matters relevant to all of the Fidelity funds.
At its January 2019 meeting, the Board unanimously determined to renew each fund's Advisory Contracts. In reaching its determination, the Board considered all factors it believed relevant, including (i) the nature, extent, and quality of the services to be provided to each fund and its shareholders (including the investment performance of each fund); (ii) the competitiveness of each fund's management fee and total expense ratio relative to peer funds; (iii) the total costs of the services to be provided by and the profits to be realized by Fidelity from its relationships with each fund; and (iv) the extent to which, if any, economies of scale exist and would be realized as each fund grows, and whether any economies of scale are appropriately shared with fund shareholders.
In considering whether to renew the Advisory Contracts for each fund, the Board reached a determination, with the assistance of fund counsel and Independent Trustees' counsel and through the exercise of its business judgment, that the renewal of the Advisory Contracts was in the best interests of each fund and its shareholders and that the compensation payable under the Advisory Contracts was fair and reasonable. The Board's decision to renew the Advisory Contracts was not based on any single factor, but rather was based on a comprehensive consideration of all the information provided to the Board at its meetings throughout the year. The Board, in reaching its determination to renew the Advisory Contracts, was aware that shareholders of each fund have a broad range of investment choices available to them, including a wide choice among funds offered by Fidelity's competitors, and that each fund's shareholders, who have the opportunity to review and weigh the disclosure provided by the fund in its prospectus and other public disclosures, have chosen to invest in that fund, which is part of the Fidelity family of funds.
Nature, Extent, and Quality of Services Provided. The Board considered Fidelity's staffing as it relates to the funds, including the backgrounds of investment personnel of Fidelity, and also considered the funds' investment objectives, strategies, and related investment philosophies. The Independent Trustees also had discussions with senior management of Fidelity's investment operations and investment groups. The Board considered the structure of the investment personnel compensation program and whether this structure provides appropriate incentives to act in the best interests of each fund. Additionally, the Board considered the portfolio managers' investments, if any, in the funds that they manage.
Resources Dedicated to Investment Management and Support Services. The Board and the Fund Oversight and Research Committees reviewed the general qualifications and capabilities of Fidelity's investment staff, including its size, education, experience, and resources, as well as Fidelity's approach to recruiting, training, managing, and compensating investment personnel. The Board noted that Fidelity has continued to increase the resources devoted to non-U.S. offices, including expansion of Fidelity's global investment organization. The Board also noted that Fidelity's analysts have extensive resources, tools and capabilities that allow them to conduct sophisticated quantitative and fundamental analysis, as well as credit analysis of issuers, counterparties and guarantors. Further, the Board considered that Fidelity's investment professionals have sufficient access to global information and data so as to provide competitive investment results over time, and that those professionals also have access to sophisticated tools that permit them to assess portfolio construction and risk and performance attribution characteristics continuously, as well as to transmit new information and research conclusions rapidly around the world. Additionally, in its deliberations, the Board considered Fidelity's trading, risk management, compliance, and technology and operations capabilities and resources, which are integral parts of the investment management process.
Shareholder and Administrative Services. The Board considered (i) the nature, extent, quality, and cost of advisory, administrative, and shareholder services performed by the Investment Advisers and their affiliates under the Advisory Contracts and under separate agreements covering transfer agency, pricing and bookkeeping, and securities lending services for each fund; (ii) the nature and extent of the supervision of third party service providers, principally custodians, subcustodians, and pricing vendors; and (iii) the resources devoted to, and the record of compliance with, each fund's compliance policies and procedures. The Board also reviewed the allocation of fund brokerage, including allocations to brokers affiliated with the Investment Advisers, the use of brokerage commissions to pay fund expenses, and the use of "soft" commission dollars to pay for research services.
The Board noted that the growth of fund assets over time across the complex allows Fidelity to reinvest in the development of services designed to enhance the value and convenience of the Fidelity funds as investment vehicles. These services include 24-hour access to account information and market information through telephone representatives and over the Internet, investor education materials and asset allocation tools, and the expanded availability of Fidelity Investor Centers.
The Board noted that it and the boards of certain other Fidelity funds had formed an ad hoc Committee on Transfer Agency Fees to review the variety of transfer agency fee structures throughout the industry and Fidelity's competitive positioning with respect to industry participants.
Investment in a Large Fund Family. The Board considered the benefits to shareholders of investing in a Fidelity fund, including the benefits of investing in a fund that is part of a large family of funds offering a variety of investment disciplines and providing a large variety of mutual fund investor services. The Board noted that Fidelity had taken, or had made recommendations that resulted in the Fidelity funds taking, a number of actions over the previous year that benefited particular funds, including: (i) continuing to dedicate additional resources to Fidelity's investment research process, which includes meetings with management of issuers of securities in which the funds invest, and to the support of the senior management team that oversees asset management; (ii) continuing efforts to enhance Fidelity's global research capabilities; (iii) launching new funds and making other enhancements to meet client needs; (iv) launching new share classes of existing funds; (v) eliminating purchase minimums and broadening eligibility requirements for certain funds and share classes; (vi) reducing management fees and total expenses for certain growth equity funds and index funds; (vii) lowering expense caps for certain existing funds and classes, and converting certain voluntary expense caps to contractual caps, to reduce expenses borne by shareholders; (viii) eliminating short-term redemption fees for funds that had such fees; (ix) rationalizing product lines and gaining increased efficiencies from fund mergers and share class consolidations; (x) continuing to develop, acquire and implement systems and technology to improve services to the funds and shareholders, strengthen information security, and increase efficiency; and (xi) continuing to implement enhancements to further strengthen Fidelity's product line to increase investors' probability of success in achieving their investment goals, including retirement income goals.
Investment Performance. The Board considered whether each fund has operated in accordance with its investment objective, as well as its record of compliance with its investment restrictions and its performance history. Natural Gas Portfolio had portfolio manager changes in October 2017 and January 2018. The Board will continue to monitor closely the fund's performance, taking into account the portfolio manager changes.
The Board took into account discussions that occur at Board meetings throughout the year with representatives of the Investment Advisers about fund investment performance. In this regard the Board noted that as part of regularly scheduled fund reviews and other reports to the Board on fund performance, the Board considers annualized return information for each fund for different time periods, measured against an appropriate securities market index ("benchmark index"). In its evaluation of fund investment performance, the Board gave particular attention to information indicating changes in performance of certain Fidelity funds for specific time periods and discussed with the Investment Advisers the reasons for any overperformance or underperformance.
In addition to reviewing absolute and relative fund performance, the Independent Trustees periodically consider the appropriateness of fund performance metrics in evaluating the results achieved. In general, the Independent Trustees believe that fund performance should be evaluated based on net performance (after fees and expenses) of both the highest performing and lowest performing fund share classes, where applicable, compared to appropriate benchmark indices, over appropriate time periods that may include full market cycles, taking into account relevant factors including the following: general market conditions; issuer-specific information; and fund cash flows and other factors.
The Independent Trustees recognize that shareholders evaluate performance on a net basis over their own holding periods, for which one-, three-, and five-year periods are often used as a proxy. For this reason, the performance information reviewed by the Board also included net cumulative total return information for each fund and an appropriate benchmark index for the most recent one-, three-, and five-year periods ended June 30, 2018, as shown below.
Energy Portfolio
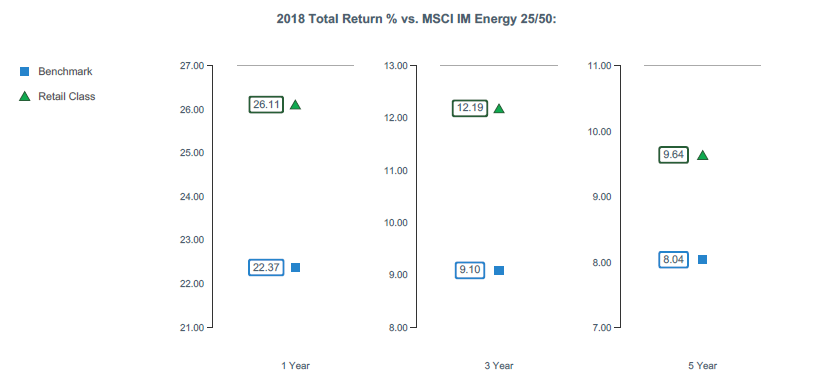
Energy Service Portfolio
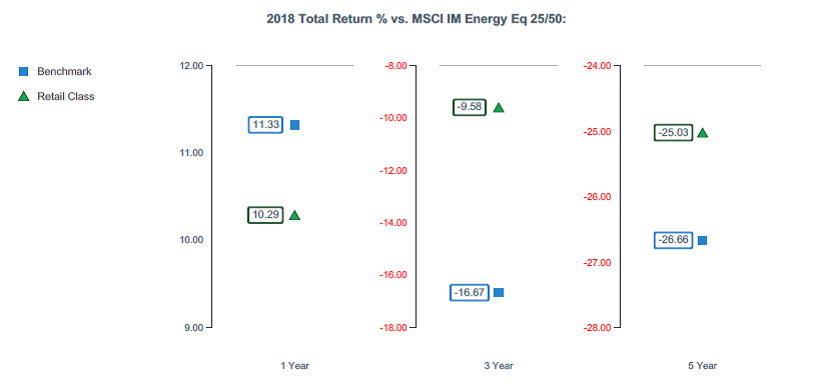
Natural Gas Portfolio
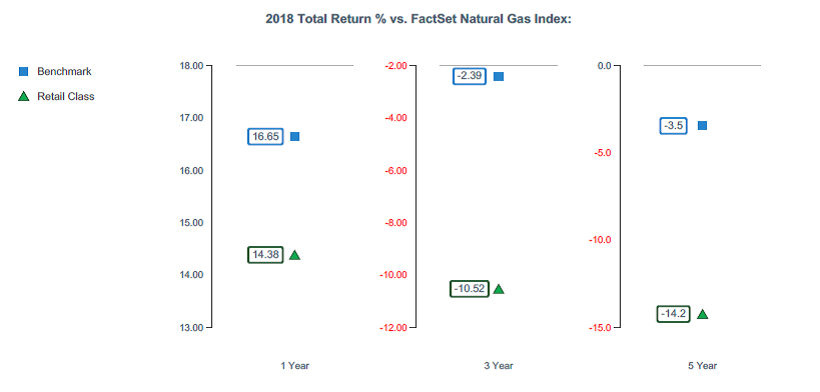
The Board considered the fund's underperformance for different time periods based on the June 30, 2018 data presented above and based on earlier periods ended prior to June 30, 2018. The Board noted that the fund's underperformance has continued since the Board approved the management contract in 2017 and 2018. The Board's discussions with SelectCo regarding underperformance cover topics including, but not limited to: the longer-term track record of a fund's portfolio manager(s); broader trends in the market that may adversely impact a fund's performance; attribution reports on contributors to the fund's underperformance; and the applicable portfolio manager's explanation of his or her underperformance. The Board engages with SelectCo on steps that might be taken to address a fund's underperformance. For a fund with underperformance over longer periods of time, the Board typically monitors the effect of any remedial actions and other relevant factors.
Natural Resources Portfolio
Based on its review, the Board concluded that the nature, extent, and quality of services provided to each fund under the Advisory Contracts should continue to benefit the shareholders of each fund.
Competitiveness of Management Fee and Total Expense Ratio. The Board considered each fund's management fee and total expense ratio compared to "mapped groups" of competitive funds and classes created for the purpose of facilitating the Trustees' competitive analysis of management fees and total expenses. Fidelity creates "mapped groups" by combining similar Lipper investment objective categories that have comparable investment mandates. For this purpose, all sector focused equity funds are grouped in the same mapped group. Combining Lipper investment objective categories aids the Board's management fee and total expense ratio comparisons by broadening the competitive group used for comparison.
Management Fee. The Board considered two proprietary management fee comparisons for the 12-month periods ended June 30 shown in basis points (BP) in the charts below. The group of Lipper funds used by the Board for management fee comparisons is referred to below as the "Total Mapped Group." The Total Mapped Group comparison focuses on a fund's standing in terms of gross management fees before expense reimbursements or caps relative to the total universe of funds with comparable investment mandates (i.e., sector equities), regardless of whether their management fee structures also are comparable. Funds with comparable management fee structures have similar management fee contractual arrangements (
e.g., flat rate charged for advisory services, all-inclusive fee rate,
etc.). "TMG %" represents the percentage of funds in the Total Mapped Group that had management fees that were lower than a fund's. For example, a hypothetical TMG % of 20% would mean that 80% of the funds in the Total Mapped Group had higher, and 20% had lower, management fees than a fund. The funds' actual TMG %s and the number of funds in the Total Mapped Group are in the charts below. The "Asset-Size Peer Group" (ASPG) comparison focuses on a fund's standing relative to a subset of non-Fidelity funds within the Total Mapped Group that are similar in size and management fee structure. For example, if a fund is in the first quartile of the ASPG, the fund's management fee ranks in the least expensive or lowest 25% of funds in the ASPG. The ASPG represents at least 15% of the funds in the Total Mapped Group with comparable asset size and management fee structures, subject to a minimum of 50 funds (or all funds in the Total Mapped Group if fewer than 50). Additional information, such as the ASPG quartile in which a fund's management fee rate ranked, is also included in the charts and was considered by the Board.
Energy Portfolio
Energy Service Portfolio
Natural Gas Portfolio
Natural Resources Portfolio

The Board noted that each fund's management fee rate ranked below the median of its Total Mapped Group and below the median of its ASPG for the 12-month period ended June 30, 2018.
The Board noted that it and the boards of other Fidelity funds formed an ad hoc Committee on Group Fee, which meets periodically, to conduct an in-depth review of the "group fee" component of the management fee of funds with such management fee structures. The Committee's focus included the mechanics of the group fee, the competitive landscape of group fee structures, Fidelity funds with no group fee component and investment products not included in group fee assets. The Board also considered that, for funds subject to the group fee, FMR agreed to voluntarily waive fees over a specified period of time in amounts designed to account for assets converted from certain funds to certain collective investment trusts.
Based on its review, the Board concluded that each fund's management fee is fair and reasonable in light of the services that the fund receives and the other factors considered.
Total Expense Ratio. In its review of each fund's total expense ratio, the Board considered the fund's management fee rate as well as other fund expenses, such as transfer agent fees, pricing and bookkeeping fees, and custodial, legal, and audit fees. The Board also noted that Fidelity may agree to waive fees and expenses from time to time, and the extent to which, if any, it has done so for each fund. As part of its review, the Board also considered the current and historical total expense ratios of each fund compared to competitive fund median expenses. Each fund is compared to those funds and classes in the Total Mapped Group (used by the Board for management fee comparisons) that have a similar sales load structure.
The Board noted that each fund's total expense ratio ranked below the competitive median for the 12-month period ended June 30, 2018.
Fees Charged to Other Fidelity Clients. The Board also considered Fidelity fee structures and other information with respect to clients of Fidelity, such as other funds advised or subadvised by Fidelity, pension plan clients, and other institutional clients with similar mandates. The Board noted that a joint ad hoc committee created by it and the boards of other Fidelity funds periodically reviews and compares Fidelity's institutional investment advisory business with its business of providing services to the Fidelity funds and also noted the most recent findings of the committee. The Board noted that the committee's review included a consideration of the differences in services provided, fees charged, and costs incurred, as well as competition in the markets serving the different categories of clients.
Based on its review of total expense ratios and fees charged to other Fidelity clients, the Board concluded that each fund's total expense ratio was reasonable in light of the services that the fund and its shareholders receive and the other factors considered.
Costs of the Services and Profitability. The Board considered the revenues earned and the expenses incurred by Fidelity in conducting the business of developing, marketing, distributing, managing, administering and servicing each fund and servicing each fund's shareholders. The Board also considered the level of Fidelity's profits in respect of all the Fidelity funds.
On an annual basis, Fidelity presents to the Board information about the profitability of its relationships with each fund. Fidelity calculates profitability information for each fund, as well as aggregate profitability information for groups of Fidelity funds and all Fidelity funds, using a series of detailed revenue and cost allocation methodologies which originate with the books and records of Fidelity on which Fidelity's audited financial statements are based. The Audit Committee of the Board reviews any significant changes from the prior year's methodologies.
PricewaterhouseCoopers LLP (PwC), auditor to Fidelity and certain Fidelity funds, has been engaged annually by the Board as part of the Board's assessment of Fidelity's profitability analysis. PwC's engagement includes the review and assessment of the methodologies used by Fidelity in determining the revenues and expenses attributable to Fidelity's mutual fund business, and completion of agreed-upon procedures in respect of the mathematical accuracy of the fund profitability information and its conformity to established allocation methodologies. After considering PwC's reports issued under the engagement and information provided by Fidelity, the Board concluded that while other allocation methods may also be reasonable, Fidelity's profitability methodologies are reasonable in all material respects.
The Board also reviewed Fidelity's non-fund businesses and potential indirect benefits such businesses may have received as a result of their association with Fidelity's mutual fund business (i.e., fall-out benefits) as well as cases where Fidelity's affiliates may benefit from the funds' business. The Board noted that changes to fall-out benefits year-over-year reflect business developments at Fidelity's various businesses.
The Board considered the costs of the services provided by and the profits realized by Fidelity in connection with the operation of each fund and was satisfied that the profitability was not excessive.
Economies of Scale. The Board considered whether there have been economies of scale in respect of the management of the Fidelity funds, whether the Fidelity funds (including each fund) have appropriately benefited from any such economies of scale, and whether there is potential for realization of any further economies of scale. The Board considered the extent to which each fund will benefit from economies of scale as assets grow through increased services to the fund, through waivers or reimbursements, or through fee or expense ratio reductions. The Board also noted that a committee (the Economies of Scale Committee) created by it and the boards of other Fidelity funds periodically analyzes whether Fidelity attains economies of scale in respect of the management and servicing of the Fidelity funds, whether the Fidelity funds have appropriately benefited from such economies of scale, and whether there is potential for realization of any further economies of scale.
The Board recognized that each fund's management contract incorporates a "group fee" structure, which provides for lower group fee rates as total group assets increase, and for higher group fee rates as total group assets decrease (with "group assets" defined to include fund assets under SelectCo's management plus assets under FMR's management). SelectCo calculates the group fee rates based on a tiered asset "breakpoint" schedule that varies based on asset class. The Board considered that the group fee is designed to deliver the benefits of economies of scale to fund shareholders when total group assets increase, even if assets of any particular fund are unchanged or have declined, because some portion of Fidelity's costs are attributable to services provided to all Fidelity funds, and all funds benefit if those costs can be allocated among more assets. The Board concluded that, given the group fee structure, fund shareholders will benefit from lower management fees as group assets increase at the fund complex level, regardless of whether Fidelity achieves any such economies of scale.
The Board concluded, taking into account the analysis of the Economies of Scale Committee, that economies of scale, if any, are being appropriately shared between fund shareholders and Fidelity.
Additional Information Requested by the Board. In order to develop fully the factual basis for consideration of the Fidelity funds' advisory contracts, the Board requested and received additional information on certain topics, including: (i) fund performance trends, in particular the underperformance of certain funds, and Fidelity's long-term strategies for certain funds; (ii) Fidelity's fund profitability methodology, profitability trends for certain funds, and the impact of certain factors on fund profitability results; (iii) metrics for evaluating index fund and ETF performance and information about ETF trading characteristics; (iv) the methodology with respect to the evaluation of competitive fund data and peer group classifications and fee comparisons; (v) the expense structures for different funds and classes; (vi) information regarding other accounts managed by Fidelity, including collective investment trusts; and (vii) Fidelity's philosophies and strategies for evaluating funds and classes with lower or declining asset levels.
Based on its evaluation of all of the conclusions noted above, and after considering all factors it believed relevant, the Board concluded that the advisory fee arrangements are fair and reasonable, and that each fund's Advisory Contracts should be renewed.
SELNR-ANN-0419
1.813649.114
Fidelity® Select Portfolios®
Financials Sector Banking Portfolio
Brokerage and Investment Management Portfolio
Consumer Finance Portfolio
Financial Services Portfolio
Insurance Portfolio
Annual Report February 28, 2019 |
|
Beginning on January 1, 2021, as permitted by regulations adopted by the Securities and Exchange Commission, paper copies of a fund’s shareholder reports will no longer be sent by mail, unless you specifically request paper copies of the reports from the fund or from your financial intermediary, such as a financial advisor, broker-dealer or bank. Instead, the reports will be made available on a website, and you will be notified by mail each time a report is posted and provided with a website link to access the report.
If you already elected to receive shareholder reports electronically, you will not be affected by this change and you need not take any action. You may elect to receive shareholder reports and other communications from a fund electronically, by contacting your financial intermediary. For Fidelity customers, visit Fidelity's web site or call Fidelity using the contact information listed below.
You may elect to receive all future reports in paper free of charge. If you wish to continue receiving paper copies of your shareholder reports, you may contact your financial intermediary or, if you are a Fidelity customer, visit Fidelity’s website, or call Fidelity at the applicable toll-free number listed below. Your election to receive reports in paper will apply to all funds held with the fund complex/your financial intermediary.
| Account Type | Website | Phone Number |
| Brokerage, Mutual Fund, or Annuity Contracts: | fidelity.com/mailpreferences | 1-800-343-3548 |
| Employer Provided Retirement Accounts: | netbenefits.fidelity.com/preferences (choose 'no' under Required Disclosures to continue to print) | 1-800-343-0860 |
| Advisor Sold Accounts Serviced Through Your Financial Intermediary: | Contact Your Financial Intermediary | Your Financial Intermediary's phone number |
| Advisor Sold Accounts Serviced by Fidelity: | institutional.fidelity.com | 1-877-208-0098 |
Contents
To view a fund's proxy voting guidelines and proxy voting record for the 12-month period ended June 30, visit http://www.fidelity.com/proxyvotingresults or visit the Securities and Exchange Commission's (SEC) web site at http://www.sec.gov.
You may also call 1-800-544-8544 to request a free copy of the proxy voting guidelines.
Standard & Poor's, S&P and S&P 500 are registered service marks of The McGraw-Hill Companies, Inc. and have been licensed for use by Fidelity Distributors Corporation.
Other third-party marks appearing herein are the property of their respective owners.
All other marks appearing herein are registered or unregistered trademarks or service marks of FMR LLC or an affiliated company. © 2019 FMR LLC. All rights reserved.
This report and the financial statements contained herein are submitted for the general information of the shareholders of the Funds. This report is not authorized for distribution to prospective investors in the Funds unless preceded or accompanied by an effective prospectus.
A fund files its complete schedule of portfolio holdings with the SEC for the first and third quarters of each fiscal year on Form N-Q. Forms N-Q are available on the SEC’s web site at http://www.sec.gov. A fund's Forms N-Q may be reviewed and copied at the SEC’s Public Reference Room in Washington, DC. Information regarding the operation of the SEC's Public Reference Room may be obtained by calling 1-800-SEC-0330.
For a complete list of a fund's portfolio holdings, view the most recent holdings listing, semiannual report, or annual report on Fidelity's web site at http://www.fidelity.com, http://www.institutional.fidelity.com, or http://www.401k.com, as applicable.
NOT FDIC INSURED •MAY LOSE VALUE •NO BANK GUARANTEE
Neither the Funds nor Fidelity Distributors Corporation is a bank.
Banking Portfolio
Performance: The Bottom Line
Average annual total return reflects the change in the value of an investment, assuming reinvestment of distributions from dividend income and capital gains (the profits earned upon the sale of securities that have grown in value, if any) and assuming a constant rate of performance each year. The hypothetical investment and the average annual total returns do not reflect the deduction of taxes that a shareholder would pay on fund distributions or the redemption of fund shares. During periods of reimbursement by Fidelity, a fund’s total return will be greater than it would be had the reimbursement not occurred. How a fund did yesterday is no guarantee of how it will do tomorrow.
Average Annual Total Returns
| For the periods ended February 28, 2019 | Past 1 year | Past 5 years | Past 10 years |
| Banking Portfolio | (6.57)% | 8.57% | 16.58% |
$10,000 Over 10 Years
Let's say hypothetically that $10,000 was invested in Banking Portfolio on February 28, 2009.
The chart shows how the value of your investment would have changed, and also shows how the S&P 500® Index performed over the same period.
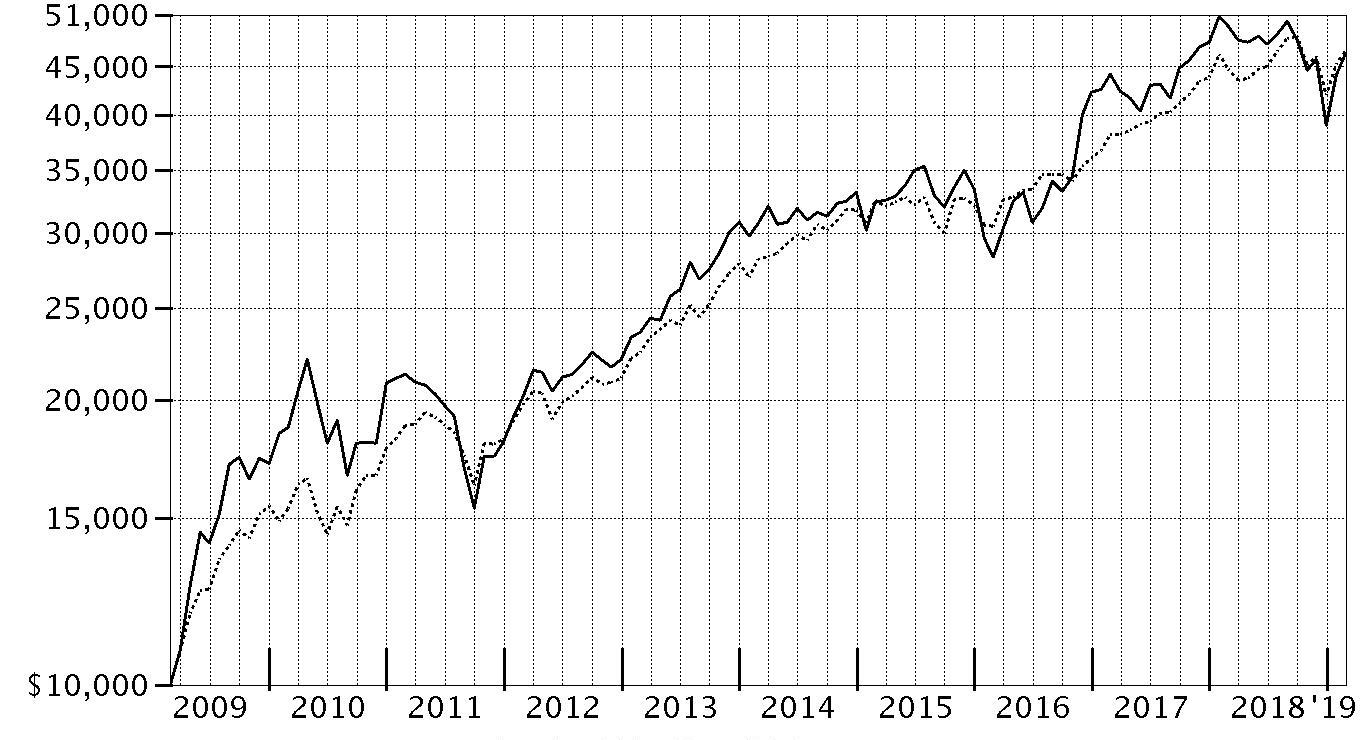
| Period Ending Values |
| $46,371 | Banking Portfolio |
| $46,739 | S&P 500® Index |
Banking Portfolio
Management's Discussion of Fund Performance
Market Recap: The S&P 500
® index gained 4.68% for the 12 months ending February 28, 2019, as the U.S. equity bellwether began the new year on a high note after enduring a final quarter of 2018 in which resurgent volatility upset the aging bull market. In October, rising U.S. Treasury yields and concern about peaking corporate earnings growth sent many investors fleeing from risk assets as they were still dealing with lingering uncertainty related to global trade and the U.S. Federal Reserve picking up the pace of interest rate hikes. The index returned -6.84% in October, at the time its largest monthly drop in seven years. But conditions worsened through Christmas, as jitters about the economy and another hike in rates led to a spike in market volatility and a -9.03% result for December. Sharply reversing course to begin 2019, the S&P 500
® gained 11.48% year-to-date, its strongest two-month opening since 1991, amid upbeat company earnings/outlooks and signs the Fed may pause on rates. For the full period, some economically sensitive sectors fared worst, with financials (-6%) and materials (-6%) both losing ground. Energy gained 1%, while communication services and industrials each rose roughly 2%. In contrast, the defensive utilities (+20%), real estate (+20%) and health care (+11%) sectors led the way, while consumer staples finished near the index. Information technology and consumer discretionary were rattled in the late-2018 downturn, but earlier strength contributed to advances of 9% and roughly 7%, respectively.
Comments from Portfolio Manager Matthew Reed: For the fiscal year, the fund returned -6.57%, trailing the -4.46% result of the MSCI U.S. IMI Banks 5% Capped Linked Index, and also lagging the S&P 500
®. Versus the MSCI industry index, stock selection in regional banks was the biggest detractor the past 12 months. Non-index exposure to asset management & custody banks weighed on our relative result to a lesser extent. Bank OZK – formerly Bank of the Ozarks – is a lender based in Arkansas and was the fund’s largest individual detractor this period. Growth slowed a bit, as construction funding got more competitive and the bank maintained its credit standards. In October, the company reported a disappointing quarter that included charge-offs on two large real estate loans dating back to the last recession, which hurt the stock. Other notable detractors included an out-of-index stake in asset management and custody bank State Street and an overweighting in Cadence Bancorp. Conversely, picks in thrifts & mortgage finance contributed to relative performance, as did positioning in diversified banks. Within the former group, our positioning in mortgage-insurance provider Essent Group made that stock the fund’s largest relative contributor. NMI Holdings was another contributor from the same category. Lastly, subprime consumer-installment lender OneMain Holdings helped as well. OneMain was a non-index holding.
The views expressed above reflect those of the portfolio manager(s) only through the end of the period as stated on the cover of this report and do not necessarily represent the views of Fidelity or any other person in the Fidelity organization. Any such views are subject to change at any time based upon market or other conditions and Fidelity disclaims any responsibility to update such views. These views may not be relied on as investment advice and, because investment decisions for a Fidelity fund are based on numerous factors, may not be relied on as an indication of trading intent on behalf of any Fidelity fund.
Banking Portfolio
Investment Summary (Unaudited)
Top Ten Stocks as of February 28, 2019
| | % of fund's net assets |
| Wells Fargo & Co. | 8.7 |
| Bank of America Corp. | 8.7 |
| SunTrust Banks, Inc. | 5.6 |
| Citigroup, Inc. | 5.2 |
| PNC Financial Services Group, Inc. | 5.0 |
| Huntington Bancshares, Inc. | 4.7 |
| KeyCorp | 3.7 |
| First Hawaiian, Inc. | 3.1 |
| Capital One Financial Corp. | 3.1 |
| First Horizon National Corp. | 2.6 |
| | 50.4 |
Top Industries (% of fund's net assets)
| As of February 28, 2019 |
| | Banks | 86.4% |
| | Consumer Finance | 4.8% |
| | Thrifts & Mortgage Finance | 4.8% |
| | Capital Markets | 3.0% |
| | Software | 0.5% |
| | All Others* | 0.5% |

* Includes short-term investments and net other assets (liabilities).
Banking Portfolio
Schedule of Investments February 28, 2019
Showing Percentage of Net Assets
| Common Stocks - 99.5% | | | |
| | | Shares | Value |
| Banks - 86.4% | | | |
| Diversified Banks - 22.6% | | | |
| Bank of America Corp. | | 1,536,276 | $44,674,906 |
| Citigroup, Inc. | | 422,000 | 26,999,560 |
| Wells Fargo & Co. | | 895,492 | 44,676,097 |
| | | | 116,350,563 |
| Regional Banks - 63.8% | | | |
| 1st Source Corp. | | 85,460 | 4,063,623 |
| American National Bankshares, Inc. | | 78,286 | 2,802,639 |
| Bank OZK | | 377,900 | 12,395,120 |
| BayCom Corp. | | 147,182 | 3,395,489 |
| Cadence Bancorp Class A | | 510,528 | 10,205,455 |
| Camden National Corp. | | 88,132 | 3,952,720 |
| Community Trust Bancorp, Inc. | | 152,876 | 6,540,035 |
| ConnectOne Bancorp, Inc. | | 130,500 | 2,814,885 |
| Cullen/Frost Bankers, Inc. | | 20,000 | 2,073,600 |
| East West Bancorp, Inc. | | 167,100 | 9,125,331 |
| Fidelity Southern Corp. | | 117,800 | 3,837,924 |
| First Citizens Bancshares, Inc. | | 24,500 | 10,696,210 |
| First Hawaiian, Inc. | | 597,300 | 16,103,208 |
| First Horizon National Corp. | | 863,000 | 13,488,690 |
| First Interstate Bancsystem, Inc. | | 247,000 | 10,285,080 |
| Great Western Bancorp, Inc. | | 136,700 | 5,133,085 |
| Hanmi Financial Corp. | | 171,800 | 3,965,144 |
| Hilltop Holdings, Inc. | | 403,900 | 7,762,958 |
| Huntington Bancshares, Inc. | | 1,674,500 | 24,129,545 |
| KeyCorp | | 1,089,400 | 19,238,804 |
| Lakeland Financial Corp. | | 99,700 | 4,817,504 |
| M&T Bank Corp. | | 77,400 | 13,394,844 |
| Northrim Bancorp, Inc. | | 37,400 | 1,402,874 |
| PacWest Bancorp | | 197,536 | 8,102,927 |
| PNC Financial Services Group, Inc. | | 204,891 | 25,820,364 |
| Popular, Inc. | | 44,737 | 2,522,272 |
| Preferred Bank, Los Angeles | | 79,595 | 4,076,856 |
| Prosperity Bancshares, Inc. | | 38,000 | 2,829,100 |
| Sierra Bancorp | | 88,000 | 2,371,600 |
| Signature Bank | | 95,900 | 13,019,384 |
| SunTrust Banks, Inc. | | 445,700 | 28,912,559 |
| SVB Financial Group (a) | | 11,900 | 2,941,204 |
| Trico Bancshares | | 151,887 | 6,108,895 |
| UMB Financial Corp. | | 106,566 | 7,332,806 |
| Univest Corp. of Pennsylvania | | 176,900 | 4,689,619 |
| WesBanco, Inc. | | 159,300 | 6,759,099 |
| Wintrust Financial Corp. | | 174,400 | 12,848,048 |
| Zions Bancorporation | | 167,050 | 8,536,255 |
| | | | 328,495,755 |
|
| TOTAL BANKS | | | 444,846,318 |
|
| Capital Markets - 3.0% | | | |
| Asset Management & Custody Banks - 3.0% | | | |
| Northern Trust Corp. | | 55,400 | 5,163,280 |
| State Street Corp. | | 143,100 | 10,284,597 |
| | | | 15,447,877 |
| Consumer Finance - 4.8% | | | |
| Consumer Finance - 4.8% | | | |
| Capital One Financial Corp. | | 189,500 | 15,838,410 |
| OneMain Holdings, Inc. | | 259,200 | 8,553,600 |
| | | | 24,392,010 |
| Software - 0.5% | | | |
| Application Software - 0.5% | | | |
| Cardlytics, Inc. (a) | | 138,794 | 2,445,550 |
| Thrifts & Mortgage Finance - 4.8% | | | |
| Thrifts & Mortgage Finance - 4.8% | | | |
| Essent Group Ltd. (a) | | 227,929 | 9,832,857 |
| LendingTree, Inc. (a)(b) | | 6,500 | 2,073,175 |
| Meridian Bancorp, Inc. Maryland | | 188,165 | 3,065,208 |
| MGIC Investment Corp. (a) | | 251,700 | 3,267,066 |
| NMI Holdings, Inc. (a) | | 36,402 | 879,108 |
| Radian Group, Inc. | | 279,836 | 5,697,461 |
| | | | 24,814,875 |
| TOTAL COMMON STOCKS | | | |
| (Cost $424,010,814) | | | 511,946,630 |
|
| Money Market Funds - 0.6% | | | |
| Fidelity Cash Central Fund, 2.44% (c) | | 1,778,112 | 1,778,467 |
| Fidelity Securities Lending Cash Central Fund 2.45% (c)(d) | | 1,375,362 | 1,375,500 |
| TOTAL MONEY MARKET FUNDS | | | |
| (Cost $3,153,967) | | | 3,153,967 |
| TOTAL INVESTMENT IN SECURITIES - 100.1% | | | |
| (Cost $427,164,781) | | | 515,100,597 |
| NET OTHER ASSETS (LIABILITIES) - (0.1)% | | | (451,063) |
| NET ASSETS - 100% | | | $514,649,534 |
Legend
(a) Non-income producing
(b) Security or a portion of the security is on loan at period end.
(c) Affiliated fund that is generally available only to investment companies and other accounts managed by Fidelity Investments. The rate quoted is the annualized seven-day yield of the fund at period end. A complete unaudited listing of the fund's holdings as of its most recent quarter end is available upon request. In addition, each Fidelity Central Fund's financial statements, which are not covered by the Fund's Report of Independent Registered Public Accounting Firm, are available on the SEC's website or upon request.
(d) Includes investment made with cash collateral received from securities on loan.
Affiliated Central Funds
Information regarding fiscal year to date income earned by the Fund from investments in Fidelity Central Funds is as follows:
| Fund | Income earned |
| Fidelity Cash Central Fund | $40,212 |
| Fidelity Securities Lending Cash Central Fund | 1,023 |
| Total | $41,235 |
Amounts in the income column in the above table include any capital gain distributions from underlying funds, which are presented in the corresponding line-item in the Statement of Operations, if applicable.
Investment Valuation
All investments are categorized as Level 1 under the Fair Value Hierarchy. The inputs or methodology used for valuing securities may not be an indication of the risk associated with investing in those securities. For more information on valuation inputs please refer to the Investment Valuation section in the accompanying Notes to Financial Statements.
See accompanying notes which are an integral part of the financial statements.
Banking Portfolio
Financial Statements
Statement of Assets and Liabilities
| | | February 28, 2019 |
| Assets | | |
Investment in securities, at value (including securities loaned of $1,339,590) — See accompanying schedule:
Unaffiliated issuers (cost $424,010,814) | $511,946,630 | |
| Fidelity Central Funds (cost $3,153,967) | 3,153,967 | |
| Total Investment in Securities (cost $427,164,781) | | $515,100,597 |
| Receivable for investments sold | | 288,607 |
| Receivable for fund shares sold | | 293,083 |
| Dividends receivable | | 1,199,375 |
| Distributions receivable from Fidelity Central Funds | | 4,005 |
| Prepaid expenses | | 6,852 |
| Total assets | | 516,892,519 |
| Liabilities | | |
| Payable for investments purchased | $85,624 | |
| Payable for fund shares redeemed | 425,487 | |
| Accrued management fee | 228,399 | |
| Other affiliated payables | 91,493 | |
| Other payables and accrued expenses | 36,482 | |
| Collateral on securities loaned | 1,375,500 | |
| Total liabilities | | 2,242,985 |
| Net Assets | | $514,649,534 |
| Net Assets consist of: | | |
| Paid in capital | | $418,386,576 |
| Total distributable earnings (loss) | | 96,262,958 |
| Net Assets, for 19,477,965 shares outstanding | | $514,649,534 |
| Net Asset Value, offering price and redemption price per share ($514,649,534 ÷ 19,477,965 shares) | | $26.42 |
See accompanying notes which are an integral part of the financial statements.
Statement of Operations
| | | Year ended February 28, 2019 |
| Investment Income | | |
| Dividends | | $14,585,282 |
| Income from Fidelity Central Funds | | 41,235 |
| Total income | | 14,626,517 |
| Expenses | | |
| Management fee | $3,410,640 | |
| Transfer agent fees | 1,125,807 | |
| Accounting and security lending fees | 230,317 | |
| Custodian fees and expenses | 12,354 | |
| Independent trustees' fees and expenses | 3,706 | |
| Registration fees | 44,970 | |
| Audit | 44,380 | |
| Legal | 5,351 | |
| Interest | 5,215 | |
| Miscellaneous | 6,315 | |
| Total expenses before reductions | 4,889,055 | |
| Expense reductions | (51,067) | |
| Total expenses after reductions | | 4,837,988 |
| Net investment income (loss) | | 9,788,529 |
| Realized and Unrealized Gain (Loss) | | |
| Net realized gain (loss) on: | | |
| Investment securities: | | |
| Unaffiliated issuers | 102,235,352 | |
| Fidelity Central Funds | (335) | |
| Foreign currency transactions | 568 | |
| Total net realized gain (loss) | | 102,235,585 |
| Change in net unrealized appreciation (depreciation) on investment securities | | (165,933,677) |
| Net gain (loss) | | (63,698,092) |
| Net increase (decrease) in net assets resulting from operations | | $(53,909,563) |
See accompanying notes which are an integral part of the financial statements.
Statement of Changes in Net Assets
| | Year ended February 28, 2019 | Year ended February 28, 2018 |
| Increase (Decrease) in Net Assets | | |
| Operations | | |
| Net investment income (loss) | $9,788,529 | $12,317,869 |
| Net realized gain (loss) | 102,235,585 | 103,324,632 |
| Change in net unrealized appreciation (depreciation) | (165,933,677) | (46,490,051) |
| Net increase (decrease) in net assets resulting from operations | (53,909,563) | 69,152,450 |
| Distributions to shareholders | (139,846,212) | – |
| Distributions to shareholders from net investment income | – | (7,600,446) |
| Distributions to shareholders from net realized gain | – | (13,137,423) |
| Total distributions | (139,846,212) | (20,737,869) |
| Share transactions | | |
| Proceeds from sales of shares | 151,956,223 | 415,824,225 |
| Reinvestment of distributions | 131,871,083 | 19,534,739 |
| Cost of shares redeemed | (405,666,643) | (915,429,348) |
| Net increase (decrease) in net assets resulting from share transactions | (121,839,337) | (480,070,384) |
| Redemption fees | – | 41,261 |
| Total increase (decrease) in net assets | (315,595,112) | (431,614,542) |
| Net Assets | | |
| Beginning of period | 830,244,646 | 1,261,859,188 |
| End of period | $514,649,534 | $830,244,646 |
| Other Information | | |
| Undistributed net investment income end of period | | $3,597,671 |
| Shares | | |
| Sold | 4,816,713 | 12,143,322 |
| Issued in reinvestment of distributions | 5,072,697 | 553,617 |
| Redeemed | (12,960,820) | (27,674,968) |
| Net increase (decrease) | (3,071,410) | (14,978,029) |
See accompanying notes which are an integral part of the financial statements.
Financial Highlights
Banking Portfolio
| | | | | | |
| Years ended February 28, | 2019 | 2018 | 2017 | 2016 A | 2015 |
| Selected Per–Share Data | | | | | |
| Net asset value, beginning of period | $36.82 | $33.63 | $21.70 | $26.24 | $26.11 |
| Income from Investment Operations | | | | | |
| Net investment income (loss)B | .49 | .42 | .33 | .33 | .30 |
| Net realized and unrealized gain (loss) | (3.62) | 3.68 | 11.85 | (3.43) | 1.04 |
| Total from investment operations | (3.13) | 4.10 | 12.18 | (3.10) | 1.34 |
| Distributions from net investment income | (.54) | (.33) | (.25) | (.28) | (.34) |
| Distributions from net realized gain | (6.73) | (.58) | – | (1.16) | (.87) |
| Total distributions | (7.27) | (.91) | (.25) | (1.44) | (1.21) |
| Redemption fees added to paid in capitalB | – | –C | –C | –C | –C |
| Net asset value, end of period | $26.42 | $36.82 | $33.63 | $21.70 | $26.24 |
| Total ReturnD | (6.57)% | 12.31% | 56.16% | (12.57)% | 5.30% |
| Ratios to Average Net AssetsE,F | | | | | |
| Expenses before reductions | .77% | .77% | .79% | .79% | .80% |
| Expenses net of fee waivers, if any | .77% | .77% | .79% | .79% | .80% |
| Expenses net of all reductions | .76% | .77% | .79% | .79% | .79% |
| Net investment income (loss) | 1.54% | 1.26% | 1.20% | 1.27% | 1.14% |
| Supplemental Data | | | | | |
| Net assets, end of period (000 omitted) | $514,650 | $830,245 | $1,261,859 | $565,479 | $584,635 |
| Portfolio turnover rateG | 44% | 35% | 34% | 63% | 65% |
A For the year ended February 29.
B Calculated based on average shares outstanding during the period.
C Amount represents less than $.005 per share.
D Total returns would have been lower if certain expenses had not been reduced during the applicable periods shown.
E Fees and expenses of any underlying Fidelity Central Funds are not included in the Fund's expense ratio. The Fund indirectly bears its proportionate share of the expenses of any underlying Fidelity Central Funds.
F Expense ratios reflect operating expenses of the Fund. Expenses before reductions do not reflect amounts reimbursed by the investment adviser or reductions from brokerage service arrangements or reductions from other expense offset arrangements and do not represent the amount paid by the Fund during periods when reimbursements or reductions occur. Expenses net of fee waivers reflect expenses after reimbursement by the investment adviser but prior to reductions from brokerage service arrangements or other expense offset arrangements. Expenses net of all reductions represent the net expenses paid by the Fund.
G Amount does not include the portfolio activity of any underlying Fidelity Central Funds.
See accompanying notes which are an integral part of the financial statements.
Brokerage and Investment Management Portfolio
Performance: The Bottom Line
Average annual total return reflects the change in the value of an investment, assuming reinvestment of distributions from dividend income and capital gains (the profits earned upon the sale of securities that have grown in value, if any) and assuming a constant rate of performance each year. The hypothetical investment and the average annual total returns do not reflect the deduction of taxes that a shareholder would pay on fund distributions or the redemption of fund shares. During periods of reimbursement by Fidelity, a fund’s total return will be greater than it would be had the reimbursement not occurred. How a fund did yesterday is no guarantee of how it will do tomorrow.
Average Annual Total Returns
| For the periods ended February 28, 2019 | Past 1 year | Past 5 years | Past 10 years |
| Brokerage and Investment Management Portfolio | (8.04)% | 5.24% | 13.89% |
$10,000 Over 10 Years
Let's say hypothetically that $10,000 was invested in Brokerage and Investment Management Portfolio on February 28, 2009.
The chart shows how the value of your investment would have changed, and also shows how the S&P 500® Index performed over the same period.
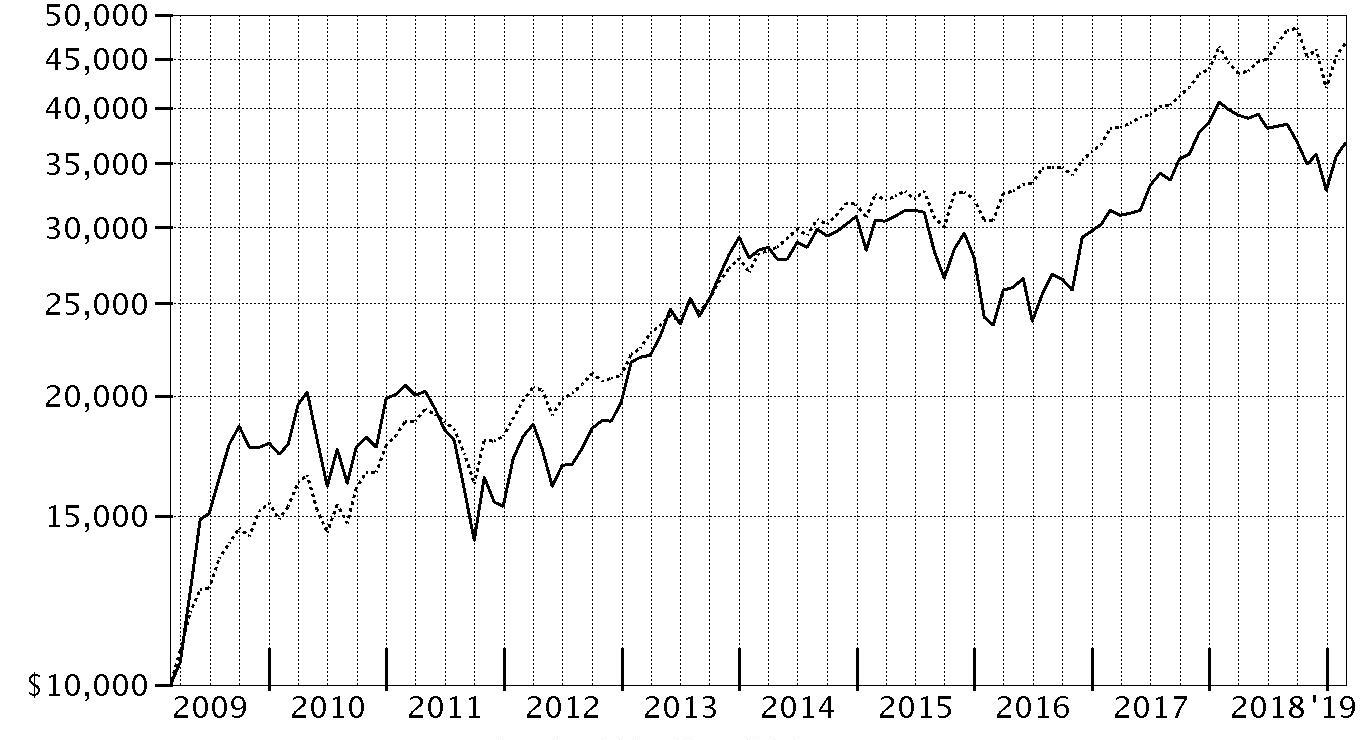
| Period Ending Values |
| $36,706 | Brokerage and Investment Management Portfolio |
| $46,739 | S&P 500® Index |
Brokerage and Investment Management Portfolio
Management's Discussion of Fund Performance
Market Recap: The S&P 500
® index gained 4.68% for the 12 months ending February 28, 2019, as the U.S. equity bellwether began the new year on a high note after enduring a final quarter of 2018 in which resurgent volatility upset the aging bull market. In October, rising U.S. Treasury yields and concern about peaking corporate earnings growth sent many investors fleeing from risk assets as they were still dealing with lingering uncertainty related to global trade and the U.S. Federal Reserve picking up the pace of interest rate hikes. The index returned -6.84% in October, at the time its largest monthly drop in seven years. But conditions worsened through Christmas, as jitters about the economy and another hike in rates led to a spike in market volatility and a -9.03% result for December. Sharply reversing course to begin 2019, the S&P 500
® gained 11.48% year-to-date, its strongest two-month opening since 1991, amid upbeat company earnings/outlooks and signs the Fed may pause on rates. For the full period, some economically sensitive sectors fared worst, with financials (-6%) and materials (-6%) both losing ground. Energy gained 1%, while communication services and industrials each rose roughly 2%. In contrast, the defensive utilities (+20%), real estate (+20%) and health care (+11%) sectors led the way, while consumer staples finished near the index. Information technology and consumer discretionary were rattled in the late-2018 downturn, but earlier strength contributed to advances of 9% and roughly 7%, respectively.
Comments from Portfolio Manager Charlie Ackerman: For the fiscal year, the fund returned -8.04%, lagging the -7.48% result of the MSCI U.S. IMI Capital Markets 5% Capped Linked Index, and well behind the broad-based S&P 500
® index. The fund's underperformance of the MSCI industry index was primarily due to security selection in the financial exchanges & data group. Here, the biggest individual detractor was untimely ownership of Intercontinental Exchange (ICE), a sizable index component that was not held in the fund until my predecessor purchased it in October. As a result, we missed out on some of the stock’s 7% gain for the year. Looking at the asset management & brokerage category, we had too much exposure to two notable laggards, BlackRock and Legg Mason. Each struggled amid fee pressure and investors’ shifting preferences for passively managed investment products. For these reasons, Legg Mason was sold from the portfolio in August. By contrast, security selection in the investment banking & brokerage group added value versus the industry index, led by LPL Financial Holdings, one of the fund’s largest contributors for the period. The top contributor was Investment Technology Group (ITG), a provider of options, derivatives and other trading products. The stock gained 35% while held in the fund beginning in June, including an uptrend in early November when the firm announced it had reached an agreement to be acquired by Virtu Financial.
The views expressed above reflect those of the portfolio manager(s) only through the end of the period as stated on the cover of this report and do not necessarily represent the views of Fidelity or any other person in the Fidelity organization. Any such views are subject to change at any time based upon market or other conditions and Fidelity disclaims any responsibility to update such views. These views may not be relied on as investment advice and, because investment decisions for a Fidelity fund are based on numerous factors, may not be relied on as an indication of trading intent on behalf of any Fidelity fund.
Note to shareholders: On November 1, 2018, Charlie Ackerman assumed co-management responsibilities for the fund, joining Co-Manager Daniel Dittler. On January 1, 2019, Dan left the firm, leaving Charlie as sole Portfolio Manager.
Brokerage and Investment Management Portfolio
Investment Summary (Unaudited)
Top Ten Stocks as of February 28, 2019
| | % of fund's net assets |
| BlackRock, Inc. Class A | 7.4 |
| TD Ameritrade Holding Corp. | 7.3 |
| Charles Schwab Corp. | 7.0 |
| Morgan Stanley | 5.8 |
| S&P Global, Inc. | 5.7 |
| LPL Financial | 5.2 |
| CME Group, Inc. | 5.2 |
| IntercontinentalExchange, Inc. | 4.9 |
| MSCI, Inc. | 4.6 |
| The NASDAQ OMX Group, Inc. | 4.3 |
| | 57.4 |
Top Industries (% of fund's net assets)
| As of February 28, 2019 |
| | Capital Markets | 97.8% |
| | All Others* | 2.2% |

* Includes short-term investments and net other assets (liabilities).
Brokerage and Investment Management Portfolio
Schedule of Investments February 28, 2019
Showing Percentage of Net Assets
| Common Stocks - 97.8% | | | |
| | | Shares | Value |
| Capital Markets - 97.8% | | | |
| Asset Management & Custody Banks - 24.7% | | | |
| Ameriprise Financial, Inc. | | 106,700 | $14,044,921 |
| Apollo Global Management LLC Class A | | 237,000 | 6,944,100 |
| Bank of New York Mellon Corp. | | 205,100 | 10,763,648 |
| BlackRock, Inc. Class A | | 55,000 | 24,377,099 |
| Northern Trust Corp. | | 60,900 | 5,675,880 |
| State Street Corp. | | 116,300 | 8,358,481 |
| T. Rowe Price Group, Inc. | | 106,500 | 10,695,795 |
| | | | 80,859,924 |
| Financial Exchanges & Data - 32.7% | | | |
| Cboe Global Markets, Inc. | | 126,538 | 12,136,260 |
| CME Group, Inc. | | 93,600 | 17,026,776 |
| IntercontinentalExchange, Inc. | | 208,700 | 16,101,205 |
| MarketAxess Holdings, Inc. | | 23,900 | 5,828,732 |
| Moody's Corp. | | 46,600 | 8,067,392 |
| MSCI, Inc. | | 80,800 | 14,925,376 |
| S&P Global, Inc. | | 93,600 | 18,754,632 |
| The NASDAQ OMX Group, Inc. | | 153,400 | 14,046,838 |
| | | | 106,887,211 |
| Investment Banking & Brokerage - 40.4% | | | |
| BGC Partners, Inc. Class A | | 468,100 | 2,869,453 |
| Charles Schwab Corp. | | 497,780 | 22,902,858 |
| E*TRADE Financial Corp. | | 194,500 | 9,528,555 |
| Goldman Sachs Group, Inc. | | 24,200 | 4,760,140 |
| Investment Technology Group, Inc. | | 97,700 | 2,953,471 |
| LPL Financial | | 226,500 | 17,080,365 |
| Moelis & Co. Class A | | 69,700 | 3,109,317 |
| Morgan Stanley | | 452,500 | 18,995,950 |
| PJT Partners, Inc. | | 202,312 | 9,352,884 |
| Raymond James Financial, Inc. | | 107,300 | 8,860,834 |
| TD Ameritrade Holding Corp. | | 425,000 | 23,940,250 |
| Virtu Financial, Inc. Class A | | 311,200 | 7,823,568 |
| | | | 132,177,645 |
|
| TOTAL CAPITAL MARKETS | | | 319,924,780 |
|
| Real Estate Management & Development - 0.0% | | | |
| Real Estate Services - 0.0% | | | |
| Newmark Group, Inc. | | 49 | 454 |
| TOTAL COMMON STOCKS | | | |
| (Cost $259,464,346) | | | 319,925,234 |
|
| Money Market Funds - 2.2% | | | |
| Fidelity Cash Central Fund, 2.44% (a) | | | |
| (Cost $7,270,583) | | 7,269,139 | 7,270,593 |
| TOTAL INVESTMENT IN SECURITIES - 100.0% | | | |
| (Cost $266,734,929) | | | 327,195,827 |
| NET OTHER ASSETS (LIABILITIES) - 0.0% | | | (68,136) |
| NET ASSETS - 100% | | | $327,127,691 |
Legend
(a) Affiliated fund that is generally available only to investment companies and other accounts managed by Fidelity Investments. The rate quoted is the annualized seven-day yield of the fund at period end. A complete unaudited listing of the fund's holdings as of its most recent quarter end is available upon request. In addition, each Fidelity Central Fund's financial statements, which are not covered by the Fund's Report of Independent Registered Public Accounting Firm, are available on the SEC's website or upon request.
Affiliated Central Funds
Information regarding fiscal year to date income earned by the Fund from investments in Fidelity Central Funds is as follows:
| Fund | Income earned |
| Fidelity Cash Central Fund | $64,102 |
| Fidelity Securities Lending Cash Central Fund | 33,746 |
| Total | $97,848 |
Amounts in the income column in the above table include any capital gain distributions from underlying funds, which are presented in the corresponding line-item in the Statement of Operations, if applicable.
Investment Valuation
All investments are categorized as Level 1 under the Fair Value Hierarchy. The inputs or methodology used for valuing securities may not be an indication of the risk associated with investing in those securities. For more information on valuation inputs please refer to the Investment Valuation section in the accompanying Notes to Financial Statements.
See accompanying notes which are an integral part of the financial statements.
Brokerage and Investment Management Portfolio
Financial Statements
Statement of Assets and Liabilities
| | | February 28, 2019 |
| Assets | | |
Investment in securities, at value — See accompanying schedule:
Unaffiliated issuers (cost $259,464,346) | $319,925,234 | |
| Fidelity Central Funds (cost $7,270,583) | 7,270,593 | |
| Total Investment in Securities (cost $266,734,929) | | $327,195,827 |
| Receivable for fund shares sold | | 28,214 |
| Dividends receivable | | 441,229 |
| Distributions receivable from Fidelity Central Funds | | 15,843 |
| Prepaid expenses | | 3,843 |
| Other receivables | | 35,500 |
| Total assets | | 327,720,456 |
| Liabilities | | |
| Payable for fund shares redeemed | $320,337 | |
| Accrued management fee | 146,058 | |
| Transfer agent fee payable | 47,429 | |
| Other affiliated payables | 10,522 | |
| Other payables and accrued expenses | 68,419 | |
| Total liabilities | | 592,765 |
| Net Assets | | $327,127,691 |
| Net Assets consist of: | | |
| Paid in capital | | $262,123,217 |
| Total distributable earnings (loss) | | 65,004,474 |
| Net Assets, for 4,561,989 shares outstanding | | $327,127,691 |
| Net Asset Value, offering price and redemption price per share ($327,127,691 ÷ 4,561,989 shares) | | $71.71 |
See accompanying notes which are an integral part of the financial statements.
Statement of Operations
| | | Year ended February 28, 2019 |
| Investment Income | | |
| Dividends | | $6,545,913 |
| Income from Fidelity Central Funds | | 97,848 |
| Total income | | 6,643,761 |
| Expenses | | |
| Management fee | $2,005,616 | |
| Transfer agent fees | 649,515 | |
| Accounting and security lending fees | 145,322 | |
| Custodian fees and expenses | 6,543 | |
| Independent trustees' fees and expenses | 2,154 | |
| Registration fees | 29,104 | |
| Audit | 42,546 | |
| Legal | 3,648 | |
| Interest | 573 | |
| Miscellaneous | 3,178 | |
| Total expenses before reductions | 2,888,199 | |
| Expense reductions | (22,699) | |
| Total expenses after reductions | | 2,865,500 |
| Net investment income (loss) | | 3,778,261 |
| Realized and Unrealized Gain (Loss) | | |
| Net realized gain (loss) on: | | |
| Investment securities: | | |
| Unaffiliated issuers | 11,467,385 | |
| Fidelity Central Funds | 940 | |
| Foreign currency transactions | (27) | |
| Total net realized gain (loss) | | 11,468,298 |
| Change in net unrealized appreciation (depreciation) on: | | |
| Investment securities: | | |
| Unaffiliated issuers | (49,106,364) | |
| Fidelity Central Funds | 10 | |
| Assets and liabilities in foreign currencies | (1,992) | |
| Total change in net unrealized appreciation (depreciation) | | (49,108,346) |
| Net gain (loss) | | (37,640,048) |
| Net increase (decrease) in net assets resulting from operations | | $(33,861,787) |
See accompanying notes which are an integral part of the financial statements.
Statement of Changes in Net Assets
| | Year ended February 28, 2019 | Year ended February 28, 2018 |
| Increase (Decrease) in Net Assets | | |
| Operations | | |
| Net investment income (loss) | $3,778,261 | $6,530,952 |
| Net realized gain (loss) | 11,468,298 | 45,743,147 |
| Change in net unrealized appreciation (depreciation) | (49,108,346) | 51,881,187 |
| Net increase (decrease) in net assets resulting from operations | (33,861,787) | 104,155,286 |
| Distributions to shareholders | (30,375,735) | – |
| Distributions to shareholders from net investment income | – | (4,145,029) |
| Distributions to shareholders from net realized gain | – | (25,376,935) |
| Total distributions | (30,375,735) | (29,521,964) |
| Share transactions | | |
| Proceeds from sales of shares | 45,360,056 | 145,843,098 |
| Reinvestment of distributions | 28,526,962 | 27,880,043 |
| Cost of shares redeemed | (144,502,646) | (191,663,677) |
| Net increase (decrease) in net assets resulting from share transactions | (70,615,628) | (17,940,536) |
| Redemption fees | – | 5,197 |
| Total increase (decrease) in net assets | (134,853,150) | 56,697,983 |
| Net Assets | | |
| Beginning of period | 461,980,841 | 405,282,858 |
| End of period | $327,127,691 | $461,980,841 |
| Other Information | | |
| Undistributed net investment income end of period | | $987,434 |
| Shares | | |
| Sold | 587,267 | 1,846,524 |
| Issued in reinvestment of distributions | 390,034 | 357,771 |
| Redeemed | (1,884,257) | (2,432,909) |
| Net increase (decrease) | (906,956) | (228,614) |
See accompanying notes which are an integral part of the financial statements.
Financial Highlights
Brokerage and Investment Management Portfolio
| | | | | | |
| Years ended February 28, | 2019 | 2018 | 2017 | 2016 A | 2015 |
| Selected Per–Share Data | | | | | |
| Net asset value, beginning of period | $84.47 | $71.13 | $54.65 | $74.78 | $71.99 |
| Income from Investment Operations | | | | | |
| Net investment income (loss)B | .77 | 1.15 | .89 | .72 | .96 |
| Net realized and unrealized gain (loss) | (7.60) | 17.88 | 16.44 | (16.77) | 4.39 |
| Total from investment operations | (6.83) | 19.03 | 17.33 | (16.05) | 5.35 |
| Distributions from net investment income | (.96) | (.82) | (.83) | (.74) | (.83) |
| Distributions from net realized gain | (4.96) | (4.87) | (.01) | (3.34) | (1.73) |
| Total distributions | (5.93)C | (5.69) | (.85)D | (4.08) | (2.56) |
| Redemption fees added to paid in capitalB | – | –E | –E | –E | –E |
| Net asset value, end of period | $71.71 | $84.47 | $71.13 | $54.65 | $74.78 |
| Total ReturnF | (8.04)% | 27.51% | 31.76% | (22.23)% | 7.43% |
| Ratios to Average Net AssetsG,H | | | | | |
| Expenses before reductions | .78% | .79% | .82% | .79% | .79% |
| Expenses net of fee waivers, if any | .77% | .79% | .82% | .79% | .79% |
| Expenses net of all reductions | .77% | .78% | .80% | .78% | .79% |
| Net investment income (loss) | 1.01% | 1.49% | 1.43% | 1.02% | 1.32% |
| Supplemental Data | | | | | |
| Net assets, end of period (000 omitted) | $327,128 | $461,981 | $405,283 | $310,570 | $577,953 |
| Portfolio turnover rateI | 30% | 75% | 146% | 67% | 31% |
A For the year ended February 29.
B Calculated based on average shares outstanding during the period.
C Total distributions of $5.93 per share is comprised of distributions from net investment income of $.963 and distributions from net realized gain of $4.962 per share.
D Total distributions of $.85 per share is comprised of distributions from net investment income of $.831 and distributions from net realized gain of $.014 per share.
E Amount represents less than $.005 per share.
F Total returns would have been lower if certain expenses had not been reduced during the applicable periods shown.
G Fees and expenses of any underlying Fidelity Central Funds are not included in the Fund's expense ratio. The Fund indirectly bears its proportionate share of the expenses of any underlying Fidelity Central Funds.
H Expense ratios reflect operating expenses of the Fund. Expenses before reductions do not reflect amounts reimbursed by the investment adviser or reductions from brokerage service arrangements or reductions from other expense offset arrangements and do not represent the amount paid by the Fund during periods when reimbursements or reductions occur. Expenses net of fee waivers reflect expenses after reimbursement by the investment adviser but prior to reductions from brokerage service arrangements or other expense offset arrangements. Expenses net of all reductions represent the net expenses paid by the Fund.
I Amount does not include the portfolio activity of any underlying Fidelity Central Funds.
See accompanying notes which are an integral part of the financial statements.
Consumer Finance Portfolio
Performance: The Bottom Line
Average annual total return reflects the change in the value of an investment, assuming reinvestment of distributions from dividend income and capital gains (the profits earned upon the sale of securities that have grown in value, if any) and assuming a constant rate of performance each year. The hypothetical investment and the average annual total returns do not reflect the deduction of taxes that a shareholder would pay on fund distributions or the redemption of fund shares. During periods of reimbursement by Fidelity, a fund’s total return will be greater than it would be had the reimbursement not occurred. How a fund did yesterday is no guarantee of how it will do tomorrow.
Average Annual Total Returns
| For the periods ended February 28, 2019 | Past 1 year | Past 5 years | Past 10 years |
| Consumer Finance Portfolio | 4.83% | 8.89% | 14.52% |
Prior to December 1, 2010, the fund was named Home Finance Portfolio, and the fund operated under certain different investment policies and compared its performance to a different additional index. The fund's historical performance may not represent its current investment policies.
$10,000 Over 10 Years
Let's say hypothetically that $10,000 was invested in Consumer Finance Portfolio on February 28, 2009.
The chart shows how the value of your investment would have changed, and also shows how the S&P 500® Index performed over the same period.
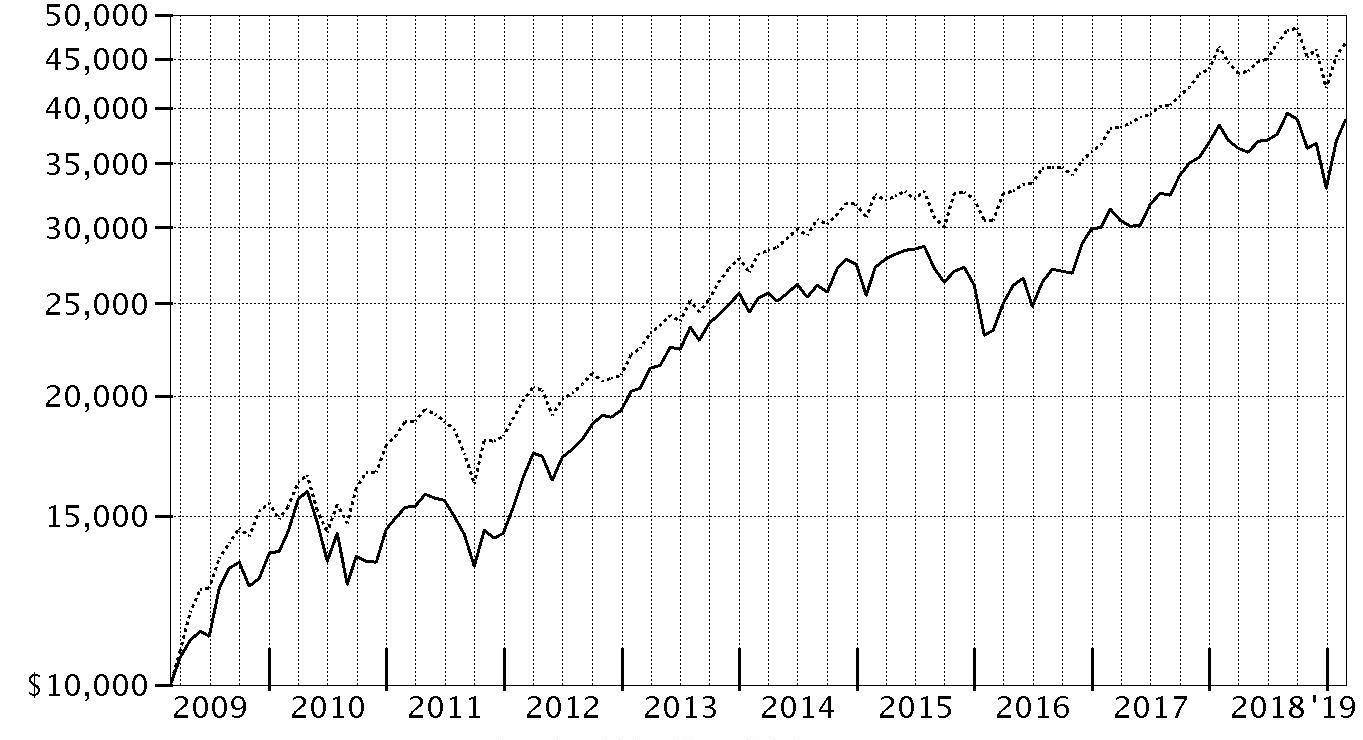
| Period Ending Values |
| $38,797 | Consumer Finance Portfolio |
| $46,739 | S&P 500® Index |
Consumer Finance Portfolio
Management's Discussion of Fund Performance
Market Recap: The S&P 500
® index gained 4.68% for the 12 months ending February 28, 2019, as the U.S. equity bellwether began the new year on a high note after enduring a final quarter of 2018 in which resurgent volatility upset the aging bull market. In October, rising U.S. Treasury yields and concern about peaking corporate earnings growth sent many investors fleeing from risk assets as they were still dealing with lingering uncertainty related to global trade and the U.S. Federal Reserve picking up the pace of interest rate hikes. The index returned -6.84% in October, at the time its largest monthly drop in seven years. But conditions worsened through Christmas, as jitters about the economy and another hike in rates led to a spike in market volatility and a -9.03% result for December. Sharply reversing course to begin 2019, the S&P 500
® gained 11.48% year-to-date, its strongest two-month opening since 1991, amid upbeat company earnings/outlooks and signs the Fed may pause on rates. For the full period, some economically sensitive sectors fared worst, with financials (-6%) and materials (-6%) both losing ground. Energy gained 1%, while communication services and industrials each rose roughly 2%. In contrast, the defensive utilities (+20%), real estate (+20%) and health care (+11%) sectors led the way, while consumer staples finished near the index. Information technology and consumer discretionary were rattled in the late-2018 downturn, but earlier strength contributed to advances of 9% and roughly 7%, respectively.
Comments from Portfolio Manager Chuck Culp: For the fiscal year, the fund gained 4.83%, lagging the 6.21% advance of the S&P
® Consumer Finance Index and slightly ahead of the broad-based S&P 500
®. Within the S&P industry index, data processing & outsourced services rose 25% and mortgage REITs (real estate investment trusts) increased 15% the past 12 months, while most other groups posted a flattish return. Stock picking overall detracted from performance versus the consumer finance index, especially in consumer finance, thrifts & mortgage finance, and data processing & outsourced services. The largest individual relative detractor was private-label card company and top holding Synchrony Financial (-8%), which was pressured by the loss of a large customer contract. An underweighting in large, diversified mortgage REIT Annaly Capital Management also hurt. By contrast, a sizable overweighting in data processing & outsourced services and large underweighting in thrifts & mortgage finance aided relative performance. The top individual relative contributor was a non-index stake in Germany-based payment processor Adyen, which gained 54% for the fund after we established a position this period.
The views expressed above reflect those of the portfolio manager(s) only through the end of the period as stated on the cover of this report and do not necessarily represent the views of Fidelity or any other person in the Fidelity organization. Any such views are subject to change at any time based upon market or other conditions and Fidelity disclaims any responsibility to update such views. These views may not be relied on as investment advice and, because investment decisions for a Fidelity fund are based on numerous factors, may not be relied on as an indication of trading intent on behalf of any Fidelity fund.
Note to shareholders: On March 1, 2019, Chuck Culp assumed sole management responsibilities for the fund, succeeding former Co-Manager Shilpa Mehra.
Consumer Finance Portfolio
Investment Summary (Unaudited)
Top Ten Stocks as of February 28, 2019
| | % of fund's net assets |
| Synchrony Financial | 6.6 |
| MasterCard, Inc. Class A | 6.6 |
| Visa, Inc. Class A | 6.5 |
| AGNC Investment Corp. | 6.5 |
| Ally Financial, Inc. | 5.8 |
| Capital One Financial Corp. | 5.6 |
| Credit Acceptance Corp. | 5.0 |
| American Express Co. | 4.0 |
| New Residential Investment Corp. | 3.9 |
| Discover Financial Services | 3.7 |
| | 54.2 |
Top Industries (% of fund's net assets)
| As of February 28, 2019 |
| | Consumer Finance | 44.3% |
| | IT Services | 19.0% |
| | Mortgage Real Estate Investment Trusts | 18.3% |
| | Thrifts & Mortgage Finance | 12.4% |
| | Banks | 3.9% |
| | All Others* | 2.1% |

* Includes short-term investments and net other assets (liabilities).
Consumer Finance Portfolio
Schedule of Investments February 28, 2019
Showing Percentage of Net Assets
| Common Stocks - 98.6% | | | |
| | | Shares | Value |
| Banks - 3.9% | | | |
| Diversified Banks - 1.3% | | | |
| Merchants Bancorp/IN | | 16,400 | $341,940 |
| Wells Fargo & Co. | | 19,000 | 947,910 |
| | | | 1,289,850 |
| Regional Banks - 2.6% | | | |
| Huntington Bancshares, Inc. | | 73,700 | 1,062,017 |
| Signature Bank | | 11,600 | 1,574,816 |
| | | | 2,636,833 |
|
| TOTAL BANKS | | | 3,926,683 |
|
| Consumer Finance - 44.3% | | | |
| Consumer Finance - 44.3% | | | |
| Ally Financial, Inc. | | 218,200 | 5,911,038 |
| American Express Co. | | 37,900 | 4,083,346 |
| Capital One Financial Corp. | | 68,700 | 5,741,946 |
| Credit Acceptance Corp. (a) | | 11,675 | 5,135,366 |
| Discover Financial Services | | 52,900 | 3,788,169 |
| First Cash Financial Services, Inc. | | 29,911 | 2,621,998 |
| LendingClub Corp. (a) | | 48,500 | 144,045 |
| Navient Corp. | | 102,500 | 1,252,550 |
| OneMain Holdings, Inc. | | 108,400 | 3,577,200 |
| Santander Consumer U.S.A. Holdings, Inc. | | 164,200 | 3,372,668 |
| SLM Corp. | | 264,800 | 2,926,040 |
| Synchrony Financial | | 208,200 | 6,789,403 |
| | | | 45,343,769 |
| IT Services - 19.0% | | | |
| Data Processing & Outsourced Services - 19.0% | | | |
| Adyen BV (b) | | 322 | 241,731 |
| Alliance Data Systems Corp. | | 2,700 | 467,100 |
| FleetCor Technologies, Inc. (a) | | 2,400 | 559,872 |
| MasterCard, Inc. Class A | | 30,000 | 6,743,100 |
| PayPal Holdings, Inc. (a) | | 13,300 | 1,304,331 |
| Total System Services, Inc. | | 12,200 | 1,151,680 |
| Visa, Inc. Class A | | 44,936 | 6,655,920 |
| WEX, Inc. (a) | | 6,000 | 1,068,360 |
| Worldpay, Inc. (a) | | 13,300 | 1,274,140 |
| | | | 19,466,234 |
| Mortgage Real Estate Investment Trusts - 18.3% | | | |
| Mortgage REITs - 18.3% | | | |
| AGNC Investment Corp. | | 374,600 | 6,611,690 |
| Annaly Capital Management, Inc. | | 320,915 | 3,250,869 |
| Invesco Mortgage Capital, Inc. | | 91,757 | 1,460,771 |
| MFA Financial, Inc. | | 315,600 | 2,294,412 |
| New Residential Investment Corp. | | 241,050 | 3,986,967 |
| Redwood Trust, Inc. | | 75,100 | 1,149,030 |
| | | | 18,753,739 |
| Software - 0.7% | | | |
| Application Software - 0.7% | | | |
| Black Knight, Inc. (a) | | 13,500 | 705,375 |
| Thrifts & Mortgage Finance - 12.4% | | | |
| Thrifts & Mortgage Finance - 12.4% | | | |
| Axos Financial, Inc. (a) | | 46,100 | 1,488,108 |
| MGIC Investment Corp. (a) | | 258,128 | 3,350,501 |
| New York Community Bancorp, Inc. | | 22,300 | 278,973 |
| NMI Holdings, Inc. (a) | | 11,200 | 270,480 |
| Northwest Bancshares, Inc. | | 30,700 | 571,020 |
| Radian Group, Inc. | | 58,765 | 1,196,455 |
| TFS Financial Corp. | | 116,300 | 1,992,219 |
| Washington Federal, Inc. | | 64,700 | 1,984,996 |
| WSFS Financial Corp. | | 35,900 | 1,553,752 |
| | | | 12,686,504 |
| TOTAL COMMON STOCKS | | | |
| (Cost $75,169,197) | | | 100,882,304 |
|
| Money Market Funds - 1.2% | | | |
| Fidelity Cash Central Fund, 2.44% (c) | | | |
| (Cost $1,284,596) | | 1,284,339 | 1,284,596 |
| TOTAL INVESTMENT IN SECURITIES - 99.8% | | | |
| (Cost $76,453,793) | | | 102,166,900 |
| NET OTHER ASSETS (LIABILITIES) - 0.2% | | | 167,127 |
| NET ASSETS - 100% | | | $102,334,027 |
Legend
(a) Non-income producing
(b) Security exempt from registration under Rule 144A of the Securities Act of 1933. These securities may be resold in transactions exempt from registration, normally to qualified institutional buyers. At the end of the period, the value of these securities amounted to $241,731 or 0.2% of net assets.
(c) Affiliated fund that is generally available only to investment companies and other accounts managed by Fidelity Investments. The rate quoted is the annualized seven-day yield of the fund at period end. A complete unaudited listing of the fund's holdings as of its most recent quarter end is available upon request. In addition, each Fidelity Central Fund's financial statements, which are not covered by the Fund's Report of Independent Registered Public Accounting Firm, are available on the SEC's website or upon request.
Affiliated Central Funds
Information regarding fiscal year to date income earned by the Fund from investments in Fidelity Central Funds is as follows:
| Fund | Income earned |
| Fidelity Cash Central Fund | $24,531 |
| Fidelity Securities Lending Cash Central Fund | 5,124 |
| Total | $29,655 |
Amounts in the income column in the above table include any capital gain distributions from underlying funds, which are presented in the corresponding line-item in the Statement of Operations, if applicable.
Investment Valuation
All investments are categorized as Level 1 under the Fair Value Hierarchy. The inputs or methodology used for valuing securities may not be an indication of the risk associated with investing in those securities. For more information on valuation inputs please refer to the Investment Valuation section in the accompanying Notes to Financial Statements.
See accompanying notes which are an integral part of the financial statements.
Consumer Finance Portfolio
Financial Statements
Statement of Assets and Liabilities
| | | February 28, 2019 |
| Assets | | |
Investment in securities, at value — See accompanying schedule:
Unaffiliated issuers (cost $75,169,197) | $100,882,304 | |
| Fidelity Central Funds (cost $1,284,596) | 1,284,596 | |
| Total Investment in Securities (cost $76,453,793) | | $102,166,900 |
| Receivable for fund shares sold | | 89,661 |
| Dividends receivable | | 143,970 |
| Distributions receivable from Fidelity Central Funds | | 2,290 |
| Prepaid expenses | | 873 |
| Other receivables | | 51,267 |
| Total assets | | 102,454,961 |
| Liabilities | | |
| Payable for fund shares redeemed | $22,064 | |
| Accrued management fee | 44,873 | |
| Transfer agent fee payable | 17,684 | |
| Other affiliated payables | 3,233 | |
| Other payables and accrued expenses | 33,080 | |
| Total liabilities | | 120,934 |
| Net Assets | | $102,334,027 |
| Net Assets consist of: | | |
| Paid in capital | | $76,963,404 |
| Total distributable earnings (loss) | | 25,370,623 |
| Net Assets, for 6,476,536 shares outstanding | | $102,334,027 |
| Net Asset Value, offering price and redemption price per share ($102,334,027 ÷ 6,476,536 shares) | | $15.80 |
See accompanying notes which are an integral part of the financial statements.
Statement of Operations
| | | Year ended February 28, 2019 |
| Investment Income | | |
| Dividends | | $2,381,727 |
| Income from Fidelity Central Funds | | 29,655 |
| Total income | | 2,411,382 |
| Expenses | | |
| Management fee | $536,538 | |
| Transfer agent fees | 220,898 | |
| Accounting and security lending fees | 39,031 | |
| Custodian fees and expenses | 3,110 | |
| Independent trustees' fees and expenses | 557 | |
| Registration fees | 23,917 | |
| Audit | 42,799 | |
| Legal | 1,312 | |
| Miscellaneous | 1,196 | |
| Total expenses before reductions | 869,358 | |
| Expense reductions | (15,323) | |
| Total expenses after reductions | | 854,035 |
| Net investment income (loss) | | 1,557,347 |
| Realized and Unrealized Gain (Loss) | | |
| Net realized gain (loss) on: | | |
| Investment securities: | | |
| Unaffiliated issuers | 3,278,343 | |
| Fidelity Central Funds | (41) | |
| Foreign currency transactions | 651 | |
| Total net realized gain (loss) | | 3,278,953 |
| Change in net unrealized appreciation (depreciation) on: | | |
| Investment securities: | | |
| Unaffiliated issuers | (547,554) | |
| Fidelity Central Funds | 89 | |
| Total change in net unrealized appreciation (depreciation) | | (547,465) |
| Net gain (loss) | | 2,731,488 |
| Net increase (decrease) in net assets resulting from operations | | $4,288,835 |
See accompanying notes which are an integral part of the financial statements.
Statement of Changes in Net Assets
| | Year ended February 28, 2019 | Year ended February 28, 2018 |
| Increase (Decrease) in Net Assets | | |
| Operations | | |
| Net investment income (loss) | $1,557,347 | $1,353,349 |
| Net realized gain (loss) | 3,278,953 | 14,541,035 |
| Change in net unrealized appreciation (depreciation) | (547,465) | 116,425 |
| Net increase (decrease) in net assets resulting from operations | 4,288,835 | 16,010,809 |
| Distributions to shareholders | (7,207,802) | – |
| Distributions to shareholders from net investment income | – | (1,603,897) |
| Total distributions | (7,207,802) | (1,603,897) |
| Share transactions | | |
| Proceeds from sales of shares | 21,726,183 | 22,638,327 |
| Reinvestment of distributions | 6,892,942 | 1,541,855 |
| Cost of shares redeemed | (27,471,352) | (36,306,154) |
| Net increase (decrease) in net assets resulting from share transactions | 1,147,773 | (12,125,972) |
| Redemption fees | – | 1,316 |
| Total increase (decrease) in net assets | (1,771,194) | 2,282,256 |
| Net Assets | | |
| Beginning of period | 104,105,221 | 101,822,965 |
| End of period | $102,334,027 | $104,105,221 |
| Other Information | | |
| Distributions in excess of net investment income end of period | | $(124,037) |
| Shares | | |
| Sold | 1,401,562 | 1,464,790 |
| Issued in reinvestment of distributions | 473,065 | 97,268 |
| Redeemed | (1,787,915) | (2,436,648) |
| Net increase (decrease) | 86,712 | (874,590) |
See accompanying notes which are an integral part of the financial statements.
Financial Highlights
Consumer Finance Portfolio
| | | | | | |
| Years ended February 28, | 2019 | 2018 | 2017 | 2016 A | 2015 |
| Selected Per–Share Data | | | | | |
| Net asset value, beginning of period | $16.29 | $14.02 | $10.94 | $14.01 | $16.16 |
| Income from Investment Operations | | | | | |
| Net investment income (loss)B | .24 | .20 | .21 | .20 | .22 |
| Net realized and unrealized gain (loss) | .43 | 2.33C | 3.38 | (1.99) | .95 |
| Total from investment operations | .67 | 2.53 | 3.59 | (1.79) | 1.17 |
| Distributions from net investment income | (.20) | (.26) | (.23) | (.20) | (.30) |
| Distributions from net realized gain | (.95) | – | (.28) | (1.08) | (3.03) |
| Total distributions | (1.16)D | (.26) | (.51) | (1.28) | (3.32)E |
| Redemption fees added to paid in capitalB | – | –F | –F | –F | –F |
| Net asset value, end of period | $15.80 | $16.29 | $14.02 | $10.94 | $14.01 |
| Total ReturnG | 4.83% | 18.07%C | 33.57% | (14.01)% | 7.69% |
| Ratios to Average Net AssetsH,I | | | | | |
| Expenses before reductions | .87% | .90% | .94% | .90% | .88% |
| Expenses net of fee waivers, if any | .87% | .89% | .94% | .89% | .88% |
| Expenses net of all reductions | .86% | .89% | .93% | .89% | .88% |
| Net investment income (loss) | 1.57% | 1.38% | 1.72% | 1.53% | 1.45% |
| Supplemental Data | | | | | |
| Net assets, end of period (000 omitted) | $102,334 | $104,105 | $101,823 | $86,643 | $134,569 |
| Portfolio turnover rateJ | 32% | 81% | 44% | 48% | 71% |
A For the year ended February 29.
B Calculated based on average shares outstanding during the period.
C Net realized and unrealized gain (loss) per share reflects proceeds received from litigation which amounted to $.28 per share. Excluding these litigation proceeds, the total return would have been 16.18%.
D Total distributions of $1.16 per share is comprised of distributions from net investment income of $.201 and distributions from net realized gain of $.954 per share.
E Total distributions of $3.32 per share is comprised of distributions from net investment income of $.296 and distributions from net realized gain of $3.026 per share.
F Amount represents less than $.005 per share.
G Total returns would have been lower if certain expenses had not been reduced during the applicable periods shown.
H Fees and expenses of any underlying Fidelity Central Funds are not included in the Fund's expense ratio. The Fund indirectly bears its proportionate share of the expenses of any underlying Fidelity Central Funds.
I Expense ratios reflect operating expenses of the Fund. Expenses before reductions do not reflect amounts reimbursed by the investment adviser or reductions from brokerage service arrangements or reductions from other expense offset arrangements and do not represent the amount paid by the Fund during periods when reimbursements or reductions occur. Expenses net of fee waivers reflect expenses after reimbursement by the investment adviser but prior to reductions from brokerage service arrangements or other expense offset arrangements. Expenses net of all reductions represent the net expenses paid by the Fund.
J Amount does not include the portfolio activity of any underlying Fidelity Central Funds.
See accompanying notes which are an integral part of the financial statements.
Financial Services Portfolio
Performance: The Bottom Line
Average annual total return reflects the change in the value of an investment, assuming reinvestment of distributions from dividend income and capital gains (the profits earned upon the sale of securities that have grown in value, if any) and assuming a constant rate of performance each year. The hypothetical investment and the average annual total returns do not reflect the deduction of taxes that a shareholder would pay on fund distributions or the redemption of fund shares. During periods of reimbursement by Fidelity, a fund’s total return will be greater than it would be had the reimbursement not occurred. How a fund did yesterday is no guarantee of how it will do tomorrow.
Average Annual Total Returns
| For the periods ended February 28, 2019 | Past 1 year | Past 5 years | Past 10 years |
| Financial Services Portfolio | (6.91)% | 7.98% | 13.96% |
$10,000 Over 10 Years
Let's say hypothetically that $10,000 was invested in Financial Services Portfolio on February 28, 2009.
The chart shows how the value of your investment would have changed, and also shows how the S&P 500® Index performed over the same period.
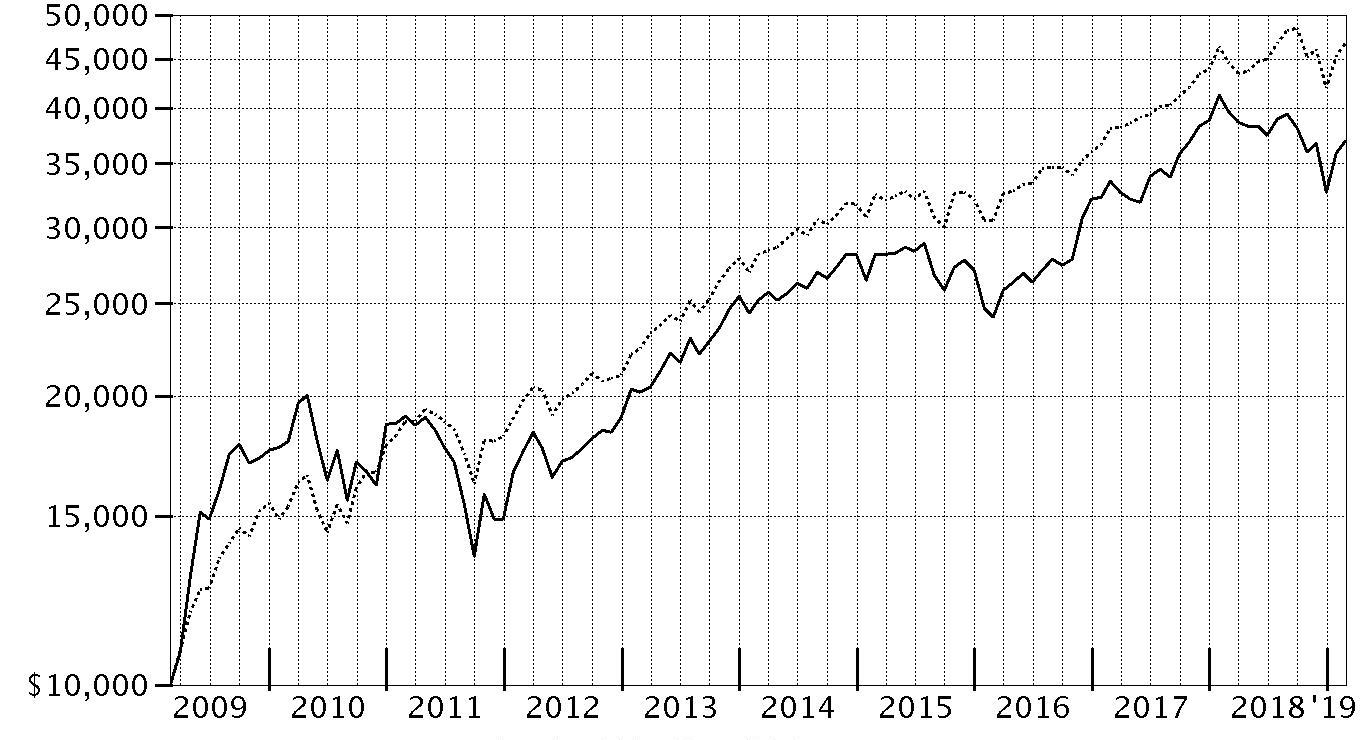
| Period Ending Values |
| $36,943 | Financial Services Portfolio |
| $46,739 | S&P 500® Index |
Financial Services Portfolio
Management's Discussion of Fund Performance
Market Recap: The S&P 500
® index gained 4.68% for the 12 months ending February 28, 2019, as the U.S. equity bellwether began the new year on a high note after enduring a final quarter of 2018 in which resurgent volatility upset the aging bull market. In October, rising U.S. Treasury yields and concern about peaking corporate earnings growth sent many investors fleeing from risk assets as they were still dealing with lingering uncertainty related to global trade and the U.S. Federal Reserve picking up the pace of interest rate hikes. The index returned -6.84% in October, at the time its largest monthly drop in seven years. But conditions worsened through Christmas, as jitters about the economy and another hike in rates led to a spike in market volatility and a -9.03% result for December. Sharply reversing course to begin 2019, the S&P 500
® gained 11.48% year-to-date, its strongest two-month opening since 1991, amid upbeat company earnings/outlooks and signs the Fed may pause on rates. For the full period, some economically sensitive sectors fared worst, with financials (-6%) and materials (-6%) both losing ground. Energy gained 1%, while communication services and industrials each rose roughly 2%. In contrast, the defensive utilities (+20%), real estate (+20%) and health care (+11%) sectors led the way, while consumer staples finished near the index. Information technology and consumer discretionary were rattled in the late-2018 downturn, but earlier strength contributed to advances of 9% and roughly 7%, respectively.
Comments from Portfolio Manager Christopher Lee: For the fiscal year, the fund returned -6.91%, lagging the -4.02% result of the MSCI U.S. IMI Financials 5% Capped Index and also notably trailing the broad-based S&P 500
®. Trade tensions, increased market volatility and reduced prospects for near-term interest rate increases early in 2019 weighed on the sector index return. Within the index, the asset management & custody banks and investment banking & brokerage segments posted sizable declines, while more-defensive stocks, including property & casualty (P&C) insurance, rose. Security selection in consumer finance and P&C insurance, along with positioning in the financial exchanges & data segment, drove the fund’s underperformance versus the sector index. Key individual detractors included private label card company Synchrony Financial (-17%), which declined due to the loss of a large customer contract and was sold before the end of the fiscal year. Consumer finance company American Express (-1%), a new addition to the fund during the fourth-quarter market downturn, also hampered relative performance. Conversely, choices in the investment banking & brokerage and asset management & custody banks groups had a positive impact on the portfolio’s relative result. Here, an overweighting in electronic market maker Investment Technology Group (ITG), benefited from a buyout offer this period. Our ITG shares returned 50%, leading us to lock in profits and part ways with the stock prior to February 28.
The views expressed above reflect those of the portfolio manager(s) only through the end of the period as stated on the cover of this report and do not necessarily represent the views of Fidelity or any other person in the Fidelity organization. Any such views are subject to change at any time based upon market or other conditions and Fidelity disclaims any responsibility to update such views. These views may not be relied on as investment advice and, because investment decisions for a Fidelity fund are based on numerous factors, may not be relied on as an indication of trading intent on behalf of any Fidelity fund.
Financial Services Portfolio
Investment Summary (Unaudited)
Top Ten Stocks as of February 28, 2019
| | % of fund's net assets |
| Citigroup, Inc. | 6.3 |
| Bank of America Corp. | 5.7 |
| Wells Fargo & Co. | 4.7 |
| Capital One Financial Corp. | 4.0 |
| The Travelers Companies, Inc. | 3.6 |
| Hartford Financial Services Group, Inc. | 3.6 |
| Cboe Global Markets, Inc. | 3.5 |
| Huntington Bancshares, Inc. | 3.4 |
| Bank of New York Mellon Corp. | 3.2 |
| PNC Financial Services Group, Inc. | 3.2 |
| | 41.2 |
Top Industries (% of fund's net assets)
| As of February 28, 2019 |
| | Banks | 34.7% |
| | Insurance | 24.8% |
| | Capital Markets | 16.3% |
| | Consumer Finance | 10.8% |
| | Mortgage Real Estate Investment Trusts | 3.0% |
| | All Others* | 10.4% |

* Includes short-term investments and net other assets (liabilities).
Financial Services Portfolio
Schedule of Investments February 28, 2019
Showing Percentage of Net Assets
| Common Stocks - 97.4% | | | |
| | | Shares | Value |
| Banks - 34.7% | | | |
| Diversified Banks - 18.9% | | | |
| Bank of America Corp. | | 1,100,000 | $31,988,000 |
| Citigroup, Inc. | | 550,000 | 35,188,999 |
| JPMorgan Chase & Co. | | 105,000 | 10,957,800 |
| U.S. Bancorp | | 25,000 | 1,292,250 |
| Wells Fargo & Co. | | 530,300 | 26,456,667 |
| | | | 105,883,716 |
| Regional Banks - 15.8% | | | |
| BOK Financial Corp. | | 30,000 | 2,713,200 |
| First Citizens Bancshares, Inc. | | 9,500 | 4,147,510 |
| First Hawaiian, Inc. | | 150,000 | 4,044,000 |
| First Horizon National Corp. | | 465,000 | 7,267,950 |
| First Republic Bank | | 40,000 | 4,199,200 |
| Huntington Bancshares, Inc. | | 1,300,000 | 18,733,000 |
| M&T Bank Corp. | | 55,000 | 9,518,300 |
| PNC Financial Services Group, Inc. | | 140,000 | 17,642,800 |
| Popular, Inc. | | 115,000 | 6,483,700 |
| Signature Bank | | 50,000 | 6,788,000 |
| SunTrust Banks, Inc. | | 100,000 | 6,487,000 |
| | | | 88,024,660 |
|
| TOTAL BANKS | | | 193,908,376 |
|
| Capital Markets - 16.3% | | | |
| Asset Management & Custody Banks - 4.1% | | | |
| Bank of New York Mellon Corp. | | 343,400 | 18,021,632 |
| Oaktree Capital Group LLC Class A | | 120,000 | 5,084,400 |
| | | | 23,106,032 |
| Financial Exchanges & Data - 3.5% | | | |
| Cboe Global Markets, Inc. | | 202,800 | 19,450,548 |
| Investment Banking & Brokerage - 8.7% | | | |
| E*TRADE Financial Corp. | | 287,900 | 14,104,221 |
| Goldman Sachs Group, Inc. | | 15,000 | 2,950,500 |
| Hamilton Lane, Inc. Class A | | 110,000 | 5,134,800 |
| Morgan Stanley | | 135,000 | 5,667,300 |
| PJT Partners, Inc. | | 65,000 | 3,004,950 |
| TD Ameritrade Holding Corp. | | 244,800 | 13,789,584 |
| Virtu Financial, Inc. Class A | | 160,500 | 4,034,970 |
| | | | 48,686,325 |
|
| TOTAL CAPITAL MARKETS | | | 91,242,905 |
|
| Consumer Finance - 10.8% | | | |
| Consumer Finance - 10.8% | | | |
| American Express Co. | | 135,000 | 14,544,900 |
| Capital One Financial Corp. | | 262,600 | 21,948,108 |
| OneMain Holdings, Inc. | | 275,000 | 9,075,000 |
| SLM Corp. | | 1,317,400 | 14,557,270 |
| | | | 60,125,278 |
| Diversified Financial Services - 2.5% | | | |
| Multi-Sector Holdings - 2.5% | | | |
| Berkshire Hathaway, Inc. Class B (a) | | 68,800 | 13,849,440 |
| Household Durables - 0.9% | | | |
| Homebuilding - 0.9% | | | |
| D.R. Horton, Inc. | | 125,000 | 4,861,250 |
| Insurance - 24.8% | | | |
| Insurance Brokers - 2.5% | | | |
| Willis Group Holdings PLC | | 80,000 | 13,761,600 |
| Life & Health Insurance - 3.9% | | | |
| MetLife, Inc. | | 250,000 | 11,297,500 |
| Torchmark Corp. | | 125,000 | 10,320,000 |
| | | | 21,617,500 |
| Multi-Line Insurance - 5.8% | | | |
| American International Group, Inc. | | 290,000 | 12,528,000 |
| Hartford Financial Services Group, Inc. | | 404,000 | 19,941,440 |
| | | | 32,469,440 |
| Property & Casualty Insurance - 9.9% | | | |
| Axis Capital Holdings Ltd. | | 125,000 | 7,133,750 |
| Beazley PLC | | 600,000 | 4,357,060 |
| FNF Group | | 491,800 | 17,257,262 |
| Hiscox Ltd. | | 218,900 | 4,642,505 |
| RSA Insurance Group PLC | | 300,000 | 2,033,295 |
| The Travelers Companies, Inc. | | 151,500 | 20,135,865 |
| | | | 55,559,737 |
| Reinsurance - 2.7% | | | |
| Reinsurance Group of America, Inc. | | 105,300 | 15,214,797 |
|
| TOTAL INSURANCE | | | 138,623,074 |
|
| IT Services - 1.1% | | | |
| Data Processing & Outsourced Services - 1.1% | | | |
| Visa, Inc. Class A | | 40,000 | 5,924,800 |
| Mortgage Real Estate Investment Trusts - 3.0% | | | |
| Mortgage REITs - 3.0% | | | |
| AGNC Investment Corp. | | 413,400 | 7,296,510 |
| MFA Financial, Inc. | | 1,264,600 | 9,193,642 |
| | | | 16,490,152 |
| Software - 0.8% | | | |
| Application Software - 0.8% | | | |
| Black Knight, Inc. (a) | | 90,700 | 4,739,075 |
| Thrifts & Mortgage Finance - 2.5% | | | |
| Thrifts & Mortgage Finance - 2.5% | | | |
| Essent Group Ltd. (a) | | 160,000 | 6,902,400 |
| MGIC Investment Corp. (a) | | 550,000 | 7,139,000 |
| | | | 14,041,400 |
| TOTAL COMMON STOCKS | | | |
| (Cost $475,920,650) | | | 543,805,750 |
|
| Money Market Funds - 2.3% | | | |
| Fidelity Cash Central Fund, 2.44% (b) | | | |
| (Cost $12,945,841) | | 12,943,386 | 12,945,975 |
| TOTAL INVESTMENT IN SECURITIES - 99.7% | | | |
| (Cost $488,866,491) | | | 556,751,725 |
| NET OTHER ASSETS (LIABILITIES) - 0.3% | | | 1,676,988 |
| NET ASSETS - 100% | | | $558,428,713 |
Legend
(a) Non-income producing
(b) Affiliated fund that is generally available only to investment companies and other accounts managed by Fidelity Investments. The rate quoted is the annualized seven-day yield of the fund at period end. A complete unaudited listing of the fund's holdings as of its most recent quarter end is available upon request. In addition, each Fidelity Central Fund's financial statements, which are not covered by the Fund's Report of Independent Registered Public Accounting Firm, are available on the SEC's website or upon request.
Affiliated Central Funds
Information regarding fiscal year to date income earned by the Fund from investments in Fidelity Central Funds is as follows:
| Fund | Income earned |
| Fidelity Cash Central Fund | $278,551 |
| Fidelity Securities Lending Cash Central Fund | 2,218 |
| Total | $280,769 |
Amounts in the income column in the above table include any capital gain distributions from underlying funds, which are presented in the corresponding line-item in the Statement of Operations, if applicable.
Investment Valuation
All investments are categorized as Level 1 under the Fair Value Hierarchy. The inputs or methodology used for valuing securities may not be an indication of the risk associated with investing in those securities. For more information on valuation inputs please refer to the Investment Valuation section in the accompanying Notes to Financial Statements.
See accompanying notes which are an integral part of the financial statements.
Financial Services Portfolio
Financial Statements
Statement of Assets and Liabilities
| | | February 28, 2019 |
| Assets | | |
Investment in securities, at value — See accompanying schedule:
Unaffiliated issuers (cost $475,920,650) | $543,805,750 | |
| Fidelity Central Funds (cost $12,945,841) | 12,945,975 | |
| Total Investment in Securities (cost $488,866,491) | | $556,751,725 |
| Receivable for investments sold | | 1,464,878 |
| Receivable for fund shares sold | | 518,965 |
| Dividends receivable | | 966,019 |
| Distributions receivable from Fidelity Central Funds | | 26,803 |
| Prepaid expenses | | 10,479 |
| Other receivables | | 12,574 |
| Total assets | | 559,751,443 |
| Liabilities | | |
| Payable for fund shares redeemed | $937,808 | |
| Accrued management fee | 249,594 | |
| Transfer agent fee payable | 82,288 | |
| Other affiliated payables | 17,461 | |
| Other payables and accrued expenses | 35,579 | |
| Total liabilities | | 1,322,730 |
| Net Assets | | $558,428,713 |
| Net Assets consist of: | | |
| Paid in capital | | $491,683,965 |
| Total distributable earnings (loss) | | 66,744,748 |
| Net Assets, for 57,853,872 shares outstanding | | $558,428,713 |
| Net Asset Value, offering price and redemption price per share ($558,428,713 ÷ 57,853,872 shares) | | $9.65 |
See accompanying notes which are an integral part of the financial statements.
Statement of Operations
| | | Year ended February 28, 2019 |
| Investment Income | | |
| Dividends | | $14,710,928 |
| Income from Fidelity Central Funds | | 280,769 |
| Total income | | 14,991,697 |
| Expenses | | |
| Management fee | $3,972,623 | |
| Transfer agent fees | 1,258,383 | |
| Accounting and security lending fees | 259,492 | |
| Custodian fees and expenses | 14,466 | |
| Independent trustees' fees and expenses | 4,518 | |
| Registration fees | 38,739 | |
| Audit | 44,777 | |
| Legal | 6,118 | |
| Interest | 1,277 | |
| Miscellaneous | 8,111 | |
| Total expenses before reductions | 5,608,504 | |
| Expense reductions | (70,935) | |
| Total expenses after reductions | | 5,537,569 |
| Net investment income (loss) | | 9,454,128 |
| Realized and Unrealized Gain (Loss) | | |
| Net realized gain (loss) on: | | |
| Investment securities: | | |
| Unaffiliated issuers | 49,054,369 | |
| Redemptions in-kind with affiliated entities | 122,035,415 | |
| Fidelity Central Funds | (521) | |
| Foreign currency transactions | 6,316 | |
| Total net realized gain (loss) | | 171,095,579 |
| Change in net unrealized appreciation (depreciation) on: | | |
| Investment securities: | | |
| Unaffiliated issuers | (251,132,260) | |
| Fidelity Central Funds | 134 | |
| Assets and liabilities in foreign currencies | (138) | |
| Total change in net unrealized appreciation (depreciation) | | (251,132,264) |
| Net gain (loss) | | (80,036,685) |
| Net increase (decrease) in net assets resulting from operations | | $(70,582,557) |
See accompanying notes which are an integral part of the financial statements.
Statement of Changes in Net Assets
| | Year ended February 28, 2019 | Year ended February 28, 2018 |
| Increase (Decrease) in Net Assets | | |
| Operations | | |
| Net investment income (loss) | $9,454,128 | $9,547,835 |
| Net realized gain (loss) | 171,095,579 | 63,339,801 |
| Change in net unrealized appreciation (depreciation) | (251,132,264) | 116,792,492 |
| Net increase (decrease) in net assets resulting from operations | (70,582,557) | 189,680,128 |
| Distributions to shareholders | (77,410,363) | – |
| Distributions to shareholders from net investment income | – | (7,413,422) |
| Distributions to shareholders from net realized gain | – | (42,209,545) |
| Total distributions | (77,410,363) | (49,622,967) |
| Share transactions | | |
| Proceeds from sales of shares | 123,696,998 | 503,440,101 |
| Reinvestment of distributions | 73,815,465 | 48,197,971 |
| Cost of shares redeemed | (799,345,128) | (403,096,639) |
| Net increase (decrease) in net assets resulting from share transactions | (601,832,665) | 148,541,433 |
| Total increase (decrease) in net assets | (749,825,585) | 288,598,594 |
| Net Assets | | |
| Beginning of period | 1,308,254,298 | 1,019,655,704 |
| End of period | $558,428,713 | $1,308,254,298 |
| Other Information | | |
| Undistributed net investment income end of period | | $2,042,926 |
| Shares(a) | | |
| Sold | 11,614,796 | 46,843,520 |
| Issued in reinvestment of distributions | 7,838,384 | 4,434,960 |
| Redeemed | (73,744,698) | (38,077,110) |
| Net increase (decrease) | (54,291,518) | 13,201,370 |
(a) Share activity prior to August 10, 2018 has been adjusted to reflect the impact of the 10 for 1 share split that occurred on that date.
See accompanying notes which are an integral part of the financial statements.
Financial Highlights
Financial Services Portfolio
| | | | | | |
| Years ended February 28, | 2019 | 2018 | 2017 | 2016 A | 2015 |
| Selected Per–Share DataB | | | | | |
| Net asset value, beginning of period | $11.67 | $10.31 | $7.50 | $8.88 | $8.09 |
| Income from Investment Operations | | | | | |
| Net investment income (loss)C | .14 | .09 | .10 | .09 | .08 |
| Net realized and unrealized gain (loss) | (1.04) | 1.76 | 2.81 | (1.33) | .88 |
| Total from investment operations | (.90) | 1.85 | 2.91 | (1.24) | .96 |
| Distributions from net investment income | (.14) | (.07) | (.10) | (.08) | (.09) |
| Distributions from net realized gain | (.98) | (.42) | – | (.06) | (.08) |
| Total distributions | (1.12) | (.49) | (.10) | (.14) | (.17) |
| Redemption fees added to paid in capitalC | – | – | –D | –D | –D |
| Net asset value, end of period | $9.65 | $11.67 | $10.31 | $7.50 | $8.88 |
| Total ReturnE | (6.91)% | 18.33% | 38.78% | (14.18)% | 11.87% |
| Ratios to Average Net AssetsF,G | | | | | |
| Expenses before reductions | .76% | .77% | .77% | .76% | .78% |
| Expenses net of fee waivers, if any | .76% | .77% | .77% | .76% | .78% |
| Expenses net of all reductions | .75% | .76% | .76% | .75% | .78% |
| Net investment income (loss) | 1.28% | .87% | 1.10% | 1.01% | .99% |
| Supplemental Data | | | | | |
| Net assets, end of period (000 omitted) | $558,429 | $1,308,254 | $1,019,656 | $1,043,574 | $1,385,490 |
| Portfolio turnover rateH | 49%I | 54% | 84%I | 55% | 42%I |
A For the year ended February 29.
B Per share amounts have been adjusted to reflect the impact of the 10 to 1 share split that occurred on August 10, 2018.
C Calculated based on average shares outstanding during the period.
D Amount represents less than $.005 per share.
E Total returns would have been lower if certain expenses had not been reduced during the applicable periods shown.
F Fees and expenses of any underlying Fidelity Central Funds are not included in the Fund's expense ratio. The Fund indirectly bears its proportionate share of the expenses of any underlying Fidelity Central Funds.
G Expense ratios reflect operating expenses of the Fund. Expenses before reductions do not reflect amounts reimbursed by the investment adviser or reductions from brokerage service arrangements or reductions from other expense offset arrangements and do not represent the amount paid by the Fund during periods when reimbursements or reductions occur. Expenses net of fee waivers reflect expenses after reimbursement by the investment adviser but prior to reductions from brokerage service arrangements or other expense offset arrangements. Expenses net of all reductions represent the net expenses paid by the Fund.
H Amount does not include the portfolio activity of any underlying Fidelity Central Funds.
I Portfolio turnover rate excludes securities received or delivered in-kind.
See accompanying notes which are an integral part of the financial statements.
Insurance Portfolio
Performance: The Bottom Line
Average annual total return reflects the change in the value of an investment, assuming reinvestment of distributions from dividend income and capital gains (the profits earned upon the sale of securities that have grown in value, if any) and assuming a constant rate of performance each year. The hypothetical investment and the average annual total returns do not reflect the deduction of taxes that a shareholder would pay on fund distributions or the redemption of fund shares. During periods of reimbursement by Fidelity, a fund’s total return will be greater than it would be had the reimbursement not occurred. How a fund did yesterday is no guarantee of how it will do tomorrow.
Average Annual Total Returns
| For the periods ended February 28, 2019 | Past 1 year | Past 5 years | Past 10 years |
| Insurance Portfolio | (0.29)% | 9.64% | 17.43% |
$10,000 Over 10 Years
Let's say hypothetically that $10,000 was invested in Insurance Portfolio on February 28, 2009.
The chart shows how the value of your investment would have changed, and also shows how the S&P 500® Index performed over the same period.
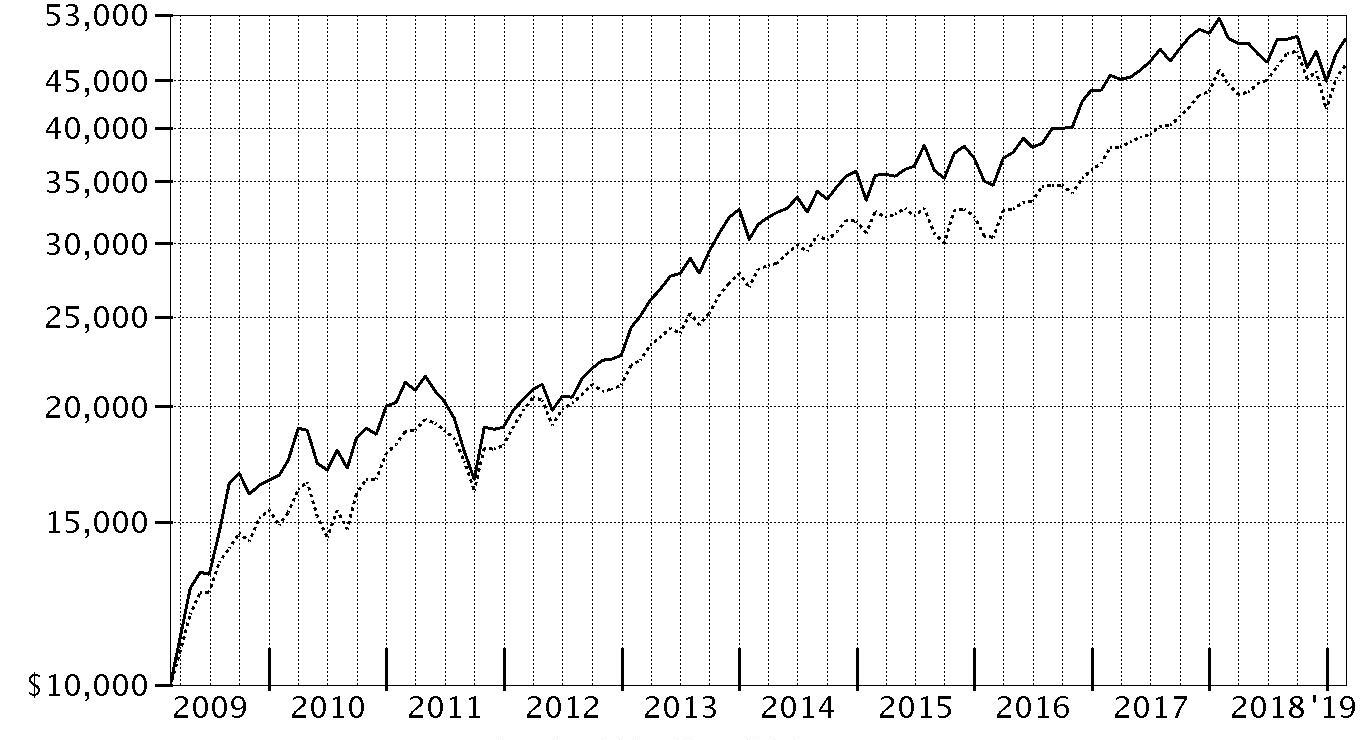
| Period Ending Values |
| $49,856 | Insurance Portfolio |
| $46,739 | S&P 500® Index |
Insurance Portfolio
Management's Discussion of Fund Performance
Market Recap: The S&P 500
® index gained 4.68% for the 12 months ending February 28, 2019, as the U.S. equity bellwether began the new year on a high note after enduring a final quarter of 2018 in which resurgent volatility upset the aging bull market. In October, rising U.S. Treasury yields and concern about peaking corporate earnings growth sent many investors fleeing from risk assets as they were still dealing with lingering uncertainty related to global trade and the U.S. Federal Reserve picking up the pace of interest rate hikes. The index returned -6.84% in October, at the time its largest monthly drop in seven years. But conditions worsened through Christmas, as jitters about the economy and another hike in rates led to a spike in market volatility and a -9.03% result for December. Sharply reversing course to begin 2019, the S&P 500
® gained 11.48% year-to-date, its strongest two-month opening since 1991, amid upbeat company earnings/outlooks and signs the Fed may pause on rates. For the full period, some economically sensitive sectors fared worst, with financials (-6%) and materials (-6%) both losing ground. Energy gained 1%, while communication services and industrials each rose roughly 2%. In contrast, the defensive utilities (+20%), real estate (+20%) and health care (+11%) sectors led the way, while consumer staples finished near the index. Information technology and consumer discretionary were rattled in the late-2018 downturn, but earlier strength contributed to advances of 9% and roughly 7%, respectively.
Comments from Portfolio Manager Peter Deutsch: For the fiscal year, the fund returned -0.29%, notably trailing the 3.58% gain of the MSCI U.S. IMI Insurance 25/50 Index, as well as the broad-based S&P 500
® index. The insurance industry was pressured by a number of key themes the past 12 months, including a higher frequency of auto accidents and natural disasters. Against this backdrop, the fund’s underperformance of the MSCI industry index was primarily due to unfavorable stock picking, particularly among property & casualty (P&C) companies. Here, my decision to not own index components Progressive (+31%) and XL Group (+37%) were the two biggest individual relative detractors. An overweight position in multi-line insurer AIG – one of the portfolio’s largest holdings – returned -23% and was another key detractor. Conversely, three of the fund’s top four contributors versus the MSCI insurance index were life & health insurance firms. Leading the way was my decision to not own index constituent Lincoln National, which returned -16% this period, and underweighting Prudential Financial (-6%). Both of these life & health insurers faltered due to outsized exposure to market risk through their asset-management businesses.
The views expressed above reflect those of the portfolio manager(s) only through the end of the period as stated on the cover of this report and do not necessarily represent the views of Fidelity or any other person in the Fidelity organization. Any such views are subject to change at any time based upon market or other conditions and Fidelity disclaims any responsibility to update such views. These views may not be relied on as investment advice and, because investment decisions for a Fidelity fund are based on numerous factors, may not be relied on as an indication of trading intent on behalf of any Fidelity fund.
Insurance Portfolio
Investment Summary (Unaudited)
Top Ten Stocks as of February 28, 2019
| | % of fund's net assets |
| Chubb Ltd. | 11.2 |
| The Travelers Companies, Inc. | 8.6 |
| American International Group, Inc. | 7.3 |
| MetLife, Inc. | 6.6 |
| Marsh & McLennan Companies, Inc. | 5.4 |
| Allstate Corp. | 4.6 |
| Hartford Financial Services Group, Inc. | 3.3 |
| Prudential Financial, Inc. | 3.2 |
| AFLAC, Inc. | 3.1 |
| Arthur J. Gallagher & Co. | 3.1 |
| | 56.4 |
Top Industries (% of fund's net assets)
| As of February 28, 2019 |
| | Insurance | 89.9% |
| | Diversified Financial Services | 5.0% |
| | Capital Markets | 3.0% |
| | Software | 0.5% |
| | Consumer Finance | 0.3% |
| | All Others* | 1.3% |

* Includes short-term investments and net other assets (liabilities).
Insurance Portfolio
Schedule of Investments February 28, 2019
Showing Percentage of Net Assets
| Common Stocks - 98.7% | | | |
| | | Shares | Value |
| Banks - 0.0% | | | |
| Regional Banks - 0.0% | | | |
| Hilltop Holdings, Inc. | | 500 | $9,610 |
| Capital Markets - 3.0% | | | |
| Asset Management & Custody Banks - 3.0% | | | |
| Apollo Global Management LLC Class A | | 81,144 | 2,377,519 |
| Ares Management Corp. | | 149,614 | 3,533,883 |
| Brighthouse Financial, Inc. (a) | | 18,306 | 708,808 |
| | | | 6,620,210 |
| Consumer Finance - 0.3% | | | |
| Consumer Finance - 0.3% | | | |
| OneMain Holdings, Inc. | | 21,900 | 722,700 |
| Diversified Financial Services - 5.0% | | | |
| Multi-Sector Holdings - 2.5% | | | |
| Berkshire Hathaway, Inc. Class B (a) | | 28,200 | 5,676,660 |
| Other Diversified Financial Services - 2.5% | | | |
| Cannae Holdings, Inc. (a) | | 16,099 | 368,989 |
| Voya Financial, Inc. | | 101,800 | 5,148,026 |
| | | | 5,517,015 |
|
| TOTAL DIVERSIFIED FINANCIAL SERVICES | | | 11,193,675 |
|
| Insurance - 89.9% | | | |
| Insurance Brokers - 16.4% | | | |
| Aon PLC | | 39,400 | 6,758,282 |
| Arthur J. Gallagher & Co. | | 85,500 | 6,863,940 |
| Brown & Brown, Inc. | | 202,000 | 5,983,240 |
| Marsh & McLennan Companies, Inc. | | 130,000 | 12,092,600 |
| Willis Group Holdings PLC | | 27,828 | 4,786,973 |
| | | | 36,485,035 |
| Life & Health Insurance - 23.6% | | | |
| AFLAC, Inc. | | 140,700 | 6,913,998 |
| CNO Financial Group, Inc. | | 195,700 | 3,332,771 |
| FBL Financial Group, Inc. Class A | | 300 | 20,961 |
| Genworth Financial, Inc. Class A (a) | | 282,100 | 1,091,727 |
| MetLife, Inc. | | 326,375 | 14,748,886 |
| Primerica, Inc. | | 30,500 | 3,813,720 |
| Principal Financial Group, Inc. | | 124,100 | 6,532,624 |
| Prudential Financial, Inc. | | 73,189 | 7,015,166 |
| Sony Financial Holdings, Inc. | | 204,500 | 3,882,776 |
| Torchmark Corp. | | 21,700 | 1,791,552 |
| Unum Group | | 93,761 | 3,502,911 |
| | | | 52,647,092 |
| Multi-Line Insurance - 13.1% | | | |
| American International Group, Inc. | | 375,350 | 16,215,120 |
| Assurant, Inc. | | 17,200 | 1,771,428 |
| Hartford Financial Services Group, Inc. | | 151,000 | 7,453,360 |
| Loews Corp. | | 63,500 | 3,023,870 |
| Zurich Insurance Group Ltd. | | 2,296 | 757,422 |
| | | | 29,221,200 |
| Property & Casualty Insurance - 33.8% | | | |
| Allstate Corp. | | 108,400 | 10,230,792 |
| Arch Capital Group Ltd. (a) | | 139,600 | 4,560,732 |
| Argo Group International Holdings, Ltd. | | 12,168 | 845,798 |
| Assured Guaranty Ltd. | | 68,200 | 2,848,032 |
| Axis Capital Holdings Ltd. | | 11,100 | 633,477 |
| Chubb Ltd. | | 187,205 | 25,066,749 |
| First American Financial Corp. | | 58,300 | 2,961,057 |
| FNF Group | | 68,300 | 2,396,647 |
| Hanover Insurance Group, Inc. | | 27,000 | 3,205,170 |
| Markel Corp. (a) | | 2,870 | 2,884,006 |
| MBIA, Inc. (a) | | 59,000 | 585,870 |
| Mercury General Corp. | | 200 | 10,594 |
| The Travelers Companies, Inc. | | 144,700 | 19,232,077 |
| | | | 75,461,001 |
| Reinsurance - 3.0% | | | |
| Everest Re Group Ltd. | | 3,400 | 768,774 |
| Maiden Holdings Ltd. | | 700 | 861 |
| Muenchener Rueckversicherungs AG | | 4,900 | 1,154,017 |
| Reinsurance Group of America, Inc. | | 30,933 | 4,469,509 |
| Third Point Reinsurance Ltd. (a) | | 29,400 | 314,286 |
| | | | 6,707,447 |
|
| TOTAL INSURANCE | | | 200,521,775 |
|
| Software - 0.5% | | | |
| Application Software - 0.5% | | | |
| Black Knight, Inc. (a) | | 20,457 | 1,068,878 |
| TOTAL COMMON STOCKS | | | |
| (Cost $127,838,126) | | | 220,136,848 |
|
| Nonconvertible Preferred Stocks - 0.0% | | | |
| Insurance - 0.0% | | | |
| Life & Health Insurance - 0.0% | | | |
| Torchmark Corp. 6.125% | | | |
| (Cost $76,079) | | 3,059 | 80,773 |
|
| Money Market Funds - 1.3% | | | |
| Fidelity Cash Central Fund, 2.44% (b) | | | |
| (Cost $2,870,483) | | 2,869,909 | 2,870,483 |
| TOTAL INVESTMENT IN SECURITIES - 100.0% | | | |
| (Cost $130,784,688) | | | 223,088,104 |
| NET OTHER ASSETS (LIABILITIES) - 0.0% | | | (7,078) |
| NET ASSETS - 100% | | | $223,081,026 |
Legend
(a) Non-income producing
(b) Affiliated fund that is generally available only to investment companies and other accounts managed by Fidelity Investments. The rate quoted is the annualized seven-day yield of the fund at period end. A complete unaudited listing of the fund's holdings as of its most recent quarter end is available upon request. In addition, each Fidelity Central Fund's financial statements, which are not covered by the Fund's Report of Independent Registered Public Accounting Firm, are available on the SEC's website or upon request.
Affiliated Central Funds
Information regarding fiscal year to date income earned by the Fund from investments in Fidelity Central Funds is as follows:
| Fund | Income earned |
| Fidelity Cash Central Fund | $81,779 |
| Fidelity Securities Lending Cash Central Fund | 14,606 |
| Total | $96,385 |
Amounts in the income column in the above table include any capital gain distributions from underlying funds, which are presented in the corresponding line-item in the Statement of Operations, if applicable.
Investment Valuation
The following is a summary of the inputs used, as of February 28, 2019, involving the Fund's assets and liabilities carried at fair value. The inputs or methodology used for valuing securities may not be an indication of the risk associated with investing in those securities. For more information on valuation inputs, and their aggregation into the levels used below, please refer to the Investment Valuation section in the accompanying Notes to Financial Statements.
| | Valuation Inputs at Reporting Date: |
| Description | Total | Level 1 | Level 2 | Level 3 |
| Investments in Securities: | | | | |
| Common Stocks | $220,136,848 | $214,342,633 | $5,794,215 | $-- |
| Nonconvertible Preferred Stocks | 80,773 | 80,773 | -- | -- |
| Money Market Funds | 2,870,483 | 2,870,483 | -- | -- |
| Total Investments in Securities: | $223,088,104 | $217,293,889 | $5,794,215 | $-- |
Other Information
Distribution of investments by country or territory of incorporation, as a percentage of Total Net Assets, is as follows (Unaudited):
| United States of America | 78.8% |
| Switzerland | 11.5% |
| Bermuda | 4.5% |
| United Kingdom | 3.0% |
| Japan | 1.7% |
| Others (Individually Less Than 1%) | 0.5% |
| | 100.0% |
See accompanying notes which are an integral part of the financial statements.
Insurance Portfolio
Financial Statements
Statement of Assets and Liabilities
| | | February 28, 2019 |
| Assets | | |
Investment in securities, at value — See accompanying schedule:
Unaffiliated issuers (cost $127,914,205) | $220,217,621 | |
| Fidelity Central Funds (cost $2,870,483) | 2,870,483 | |
| Total Investment in Securities (cost $130,784,688) | | $223,088,104 |
| Receivable for investments sold | | 2,228,476 |
| Receivable for fund shares sold | | 83,457 |
| Dividends receivable | | 400,180 |
| Distributions receivable from Fidelity Central Funds | | 5,179 |
| Prepaid expenses | | 2,793 |
| Total assets | | 225,808,189 |
| Liabilities | | |
| Payable for investments purchased | $2,236,827 | |
| Payable for fund shares redeemed | 312,204 | |
| Accrued management fee | 99,569 | |
| Other affiliated payables | 44,501 | |
| Other payables and accrued expenses | 34,062 | |
| Total liabilities | | 2,727,163 |
| Net Assets | | $223,081,026 |
| Net Assets consist of: | | |
| Paid in capital | | $122,787,846 |
| Total distributable earnings (loss) | | 100,293,180 |
| Net Assets, for 3,764,108 shares outstanding | | $223,081,026 |
| Net Asset Value, offering price and redemption price per share ($223,081,026 ÷ 3,764,108 shares) | | $59.27 |
See accompanying notes which are an integral part of the financial statements.
Statement of Operations
| | | Year ended February 28, 2019 |
| Investment Income | | |
| Dividends | | $5,630,550 |
| Income from Fidelity Central Funds | | 96,385 |
| Total income | | 5,726,935 |
| Expenses | | |
| Management fee | $1,345,719 | |
| Transfer agent fees | 511,288 | |
| Accounting and security lending fees | 97,105 | |
| Custodian fees and expenses | 6,272 | |
| Independent trustees' fees and expenses | 1,461 | |
| Registration fees | 28,126 | |
| Audit | 42,801 | |
| Legal | 2,353 | |
| Miscellaneous | 2,711 | |
| Total expenses before reductions | 2,037,836 | |
| Expense reductions | (10,256) | |
| Total expenses after reductions | | 2,027,580 |
| Net investment income (loss) | | 3,699,355 |
| Realized and Unrealized Gain (Loss) | | |
| Net realized gain (loss) on: | | |
| Investment securities: | | |
| Unaffiliated issuers | 40,683,703 | |
| Fidelity Central Funds | 818 | |
| Foreign currency transactions | (2,777) | |
| Total net realized gain (loss) | | 40,681,744 |
| Change in net unrealized appreciation (depreciation) on: | | |
| Investment securities: | | |
| Unaffiliated issuers | (48,055,226) | |
| Fidelity Central Funds | (679) | |
| Assets and liabilities in foreign currencies | (2,516) | |
| Total change in net unrealized appreciation (depreciation) | | (48,058,421) |
| Net gain (loss) | | (7,376,677) |
| Net increase (decrease) in net assets resulting from operations | | $(3,677,322) |
See accompanying notes which are an integral part of the financial statements.
Statement of Changes in Net Assets
| | Year ended February 28, 2019 | Year ended February 28, 2018 |
| Increase (Decrease) in Net Assets | | |
| Operations | | |
| Net investment income (loss) | $3,699,355 | $6,380,706 |
| Net realized gain (loss) | 40,681,744 | 104,187,408 |
| Change in net unrealized appreciation (depreciation) | (48,058,421) | (62,969,761) |
| Net increase (decrease) in net assets resulting from operations | (3,677,322) | 47,598,353 |
| Distributions to shareholders | (67,803,862) | – |
| Distributions to shareholders from net investment income | – | (4,424,878) |
| Distributions to shareholders from net realized gain | – | (38,464,528) |
| Total distributions | (67,803,862) | (42,889,406) |
| Share transactions | | |
| Proceeds from sales of shares | 36,330,834 | 99,965,121 |
| Reinvestment of distributions | 64,608,201 | 40,826,311 |
| Cost of shares redeemed | (148,119,349) | (451,552,577) |
| Net increase (decrease) in net assets resulting from share transactions | (47,180,314) | (310,761,145) |
| Redemption fees | – | 7,580 |
| Total increase (decrease) in net assets | (118,661,498) | (306,044,618) |
| Net Assets | | |
| Beginning of period | 341,742,524 | 647,787,142 |
| End of period | $223,081,026 | $341,742,524 |
| Other Information | | |
| Undistributed net investment income end of period | | $1,375,797 |
| Shares | | |
| Sold | 576,823 | 1,208,317 |
| Issued in reinvestment of distributions | 1,067,443 | 512,930 |
| Redeemed | (2,234,071) | (5,404,508) |
| Net increase (decrease) | (589,805) | (3,683,261) |
See accompanying notes which are an integral part of the financial statements.
Financial Highlights
Insurance Portfolio
| | | | | | |
| Years ended February 28, | 2019 | 2018 | 2017 | 2016 A | 2015 |
| Selected Per–Share Data | | | | | |
| Net asset value, beginning of period | $78.49 | $80.60 | $63.15 | $66.87 | $66.08 |
| Income from Investment Operations | | | | | |
| Net investment income (loss)B | .98 | 1.08 | .99 | .89 | .96 |
| Net realized and unrealized gain (loss) | (2.40) | 6.76 | 18.64 | (2.50) | 7.13 |
| Total from investment operations | (1.42) | 7.84 | 19.63 | (1.61) | 8.09 |
| Distributions from net investment income | (1.16) | (.96) | (.89) | (.74) | (.96) |
| Distributions from net realized gain | (16.63) | (8.99) | (1.29) | (1.37) | (6.34) |
| Total distributions | (17.80)C | (9.95) | (2.18) | (2.11) | (7.30) |
| Redemption fees added to paid in capitalB | – | –D | –D | –D | –D |
| Net asset value, end of period | $59.27 | $78.49 | $80.60 | $63.15 | $66.87 |
| Total ReturnE | (.29)% | 9.62% | 31.60% | (2.54)% | 13.01% |
| Ratios to Average Net AssetsF,G | | | | | |
| Expenses before reductions | .82% | .79% | .80% | .80% | .81% |
| Expenses net of fee waivers, if any | .81% | .79% | .79% | .80% | .81% |
| Expenses net of all reductions | .81% | .79% | .79% | .80% | .81% |
| Net investment income (loss) | 1.48% | 1.30% | 1.37% | 1.32% | 1.44% |
| Supplemental Data | | | | | |
| Net assets, end of period (000 omitted) | $223,081 | $341,743 | $647,787 | $459,854 | $401,818 |
| Portfolio turnover rateH | 9% | 21% | 16% | 25% | 26% |
A For the year ended February 29.
B Calculated based on average shares outstanding during the period.
C Total distributions of $17.80 per share is comprised of distributions from net investment income of $1.162 and distributions from net realized gain of $16.633 per share.
D Amount represents less than $.005 per share.
E Total returns would have been lower if certain expenses had not been reduced during the applicable periods shown.
F Fees and expenses of any underlying Fidelity Central Funds are not included in the Fund's expense ratio. The Fund indirectly bears its proportionate share of the expenses of any underlying Fidelity Central Funds.
G Expense ratios reflect operating expenses of the Fund. Expenses before reductions do not reflect amounts reimbursed by the investment adviser or reductions from brokerage service arrangements or reductions from other expense offset arrangements and do not represent the amount paid by the Fund during periods when reimbursements or reductions occur. Expenses net of fee waivers reflect expenses after reimbursement by the investment adviser but prior to reductions from brokerage service arrangements or other expense offset arrangements. Expenses net of all reductions represent the net expenses paid by the Fund.
H Amount does not include the portfolio activity of any underlying Fidelity Central Funds.
See accompanying notes which are an integral part of the financial statements.
Notes to Financial Statements
For the period ended February 28, 2019
1. Organization.
Banking Portfolio, Brokerage and Investment Management Portfolio, Financial Services Portfolio, Consumer Finance Portfolio, and Insurance Portfolio (the Funds) are non-diversified funds of Fidelity Select Portfolios (the Trust). The Trust is registered under the Investment Company Act of 1940, as amended (the 1940 Act), as an open-end management investment company organized as a Massachusetts business trust. The Funds invest primarily in securities of companies whose principal business activities fall within specific industries. Each Fund is authorized to issue an unlimited number of shares. Share transactions on the Statement of Changes in Net Assets may contain exchanges between affiliated funds.
Effective August 10, 2018, Financial Services Portfolio underwent a 10 for 1 share split. The effect of the share split transaction was to multiply the number of outstanding shares of Financial Services Portfolio by a split factor of 10:1, with a corresponding decrease in net asset value (NAV) per share. This event does not impact the overall net assets of Financial Services Portfolio. The per share data presented in the Financial Highlights and Share activity presented in the Statements of Changes in Net Assets for Financial Services Portfolio have been retroactively adjusted to reflect this share split.
2. Investments in Fidelity Central Funds.
The Funds invest in Fidelity Central Funds, which are open-end investment companies generally available only to other investment companies and accounts managed by the investment adviser and its affiliates. The Funds' Schedules of Investments list each of the Fidelity Central Funds held as of period end, if any, as an investment of each Fund, but does not include the underlying holdings of each Fidelity Central Fund. As an Investing Fund, each Fund indirectly bears its proportionate share of the expenses of the underlying Fidelity Central Funds.
The Money Market Central Funds seek preservation of capital and current income and are managed by Fidelity Investments Money Management, Inc. (FIMM), an affiliate of the investment adviser. Annualized expenses of the Money Market Central Funds as of their most recent shareholder report date are less than .005%.
A complete unaudited list of holdings for each Fidelity Central Fund is available upon request or at the Securities and Exchange Commission (the SEC) website at www.sec.gov. In addition, the financial statements of the Fidelity Central Funds, which are not covered by the Funds' Report of Independent Registered Public Accounting Firm, are available on the SEC website or upon request.
3. Significant Accounting Policies.
Each Fund is an investment company and applies the accounting and reporting guidance of the Financial Accounting Standards Board (FASB) Accounting Standards Codification Topic 946 Financial Services – Investments Companies. The financial statements have been prepared in conformity with accounting principles generally accepted in the United States of America (GAAP), which require management to make certain estimates and assumptions at the date of the financial statements. Actual results could differ from those estimates. Subsequent events, if any, through the date that the financial statements were issued have been evaluated in the preparation of the financial statements. The following summarizes the significant accounting policies of the Funds:
Investment Valuation. Investments are valued as of 4:00 p.m. Eastern time on the last calendar day of the period. The Board of Trustees (the Board) has delegated the day to day responsibility for the valuation of each Fund's investments to the Fair Value Committee (the Committee) established by each Fund's investment adviser. In accordance with valuation policies and procedures approved by the Board, each Fund attempts to obtain prices from one or more third party pricing vendors or brokers to value its investments. When current market prices, quotations or currency exchange rates are not readily available or reliable, investments will be fair valued in good faith by the Committee, in accordance with procedures adopted by the Board. Factors used in determining fair value vary by investment type and may include market or investment specific events. The frequency with which these procedures are used cannot be predicted and they may be utilized to a significant extent. The Committee oversees each Fund's valuation policies and procedures and reports to the Board on the Committee's activities and fair value determinations. The Board monitors the appropriateness of the procedures used in valuing each Fund's investments and ratifies the fair value determinations of the Committee.
Each Fund categorizes the inputs to valuation techniques used to value its investments into a disclosure hierarchy consisting of three levels as shown below:
- Level 1 – quoted prices in active markets for identical investments
- Level 2 – other significant observable inputs (including quoted prices for similar investments, interest rates, prepayment speeds, etc.)
- Level 3 – unobservable inputs (including the Fund's own assumptions based on the best information available)
Valuation techniques used to value each Fund's investments by major category are as follows:
Equity securities, including restricted securities, for which market quotations are readily available, are valued at the last reported sale price or official closing price as reported by a third party pricing vendor on the primary market or exchange on which they are traded and are categorized as Level 1 in the hierarchy. In the event there were no sales during the day or closing prices are not available, securities are valued at the last quoted bid price or may be valued using the last available price and are generally categorized as Level 2 in the hierarchy. For foreign equity securities, when market or security specific events arise, comparisons to the valuation of American Depositary Receipts (ADRs), futures contracts, Exchange-Traded Funds (ETFs) and certain indexes as well as quoted prices for similar securities may be used and would be categorized as Level 2 in the hierarchy. For equity securities, including restricted securities, where observable inputs are limited, assumptions about market activity and risk are used and these securities may be categorized as Level 3 in the hierarchy.
Investments in open-end mutual funds, including the Fidelity Central Funds, are valued at their closing net asset value (NAV) each business day and are categorized as Level 1 in the hierarchy.
Changes in valuation techniques may result in transfers in or out of an assigned level within the disclosure hierarchy. The aggregate value of investments by input level as of February 28, 2019 is included at the end of each applicable Fund's Schedule of Investments.
Foreign Currency. The Funds may use foreign currency contracts to facilitate transactions in foreign-denominated securities. Gains and losses from these transactions may arise from changes in the value of the foreign currency or if the counterparties do not perform under the contracts' terms.
Foreign-denominated assets, including investment securities, and liabilities are translated into U.S. dollars at the exchange rates at period end. Purchases and sales of investment securities, income and dividends received and expenses denominated in foreign currencies are translated into U.S. dollars at the exchange rate in effect on the transaction date.
The effects of exchange rate fluctuations on investments are included with the net realized and unrealized gain (loss) on investment securities. Other foreign currency transactions resulting in realized and unrealized gain (loss) are disclosed separately.
Investment Transactions and Income. For financial reporting purposes, the Funds' investment holdings and NAV include trades executed through the end of the last business day of the period. The NAV per share for processing shareholder transactions is calculated as of the close of business of the New York Stock Exchange (NYSE), normally 4:00 p.m. Eastern time and includes trades executed through the end of the prior business day. Gains and losses on securities sold are determined on the basis of identified cost and for certain Funds include proceeds received from litigation. Dividend income is recorded on the ex-dividend date, except for certain dividends from foreign securities where the ex-dividend date may have passed, which are recorded as soon as the Funds are informed of the ex-dividend date. Non-cash dividends included in dividend income, if any, are recorded at the fair market value of the securities received. Income and capital gain distributions from Fidelity Central Funds, if any, are recorded on the ex-dividend date. Certain distributions received by the Funds represent a return of capital or capital gain. The Funds determine the components of these distributions subsequent to the ex-dividend date, based upon receipt of tax filings or other correspondence relating to the underlying investment. These distributions are recorded as a reduction of cost of investments and/or as a realized gain. Investment income is recorded net of foreign taxes withheld where recovery of such taxes is uncertain.
Expenses. Expenses directly attributable to a fund are charged to that fund. Expenses attributable to more than one fund are allocated among the respective funds on the basis of relative net assets or other appropriate methods. Expense estimates are accrued in the period to which they relate and adjustments are made when actual amounts are known.
Deferred Trustee Compensation. Under a Deferred Compensation Plan (the Plan) Brokerage and Investment Management Portfolio, certain independent Trustees have elected to defer receipt of a portion of their annual compensation. Deferred amounts are invested in a cross-section of Fidelity funds, are marked-to-market and remain in each Fund until distributed in accordance with the Plan. The investment of deferred amounts and the offsetting payable to the Trustees presented below are included in each accompanying Statement of Assets and Liabilities in other receivables and other payables and accrued expenses, respectively.
| Brokerage and Investment Management Portfolio | $35,072 |
Income Tax Information and Distributions to Shareholders. Each year, each Fund intends to qualify as a regulated investment company under Subchapter M of the Internal Revenue Code, including distributing substantially all of its taxable income and realized gains. As a result, no provision for U.S. Federal income taxes is required. As of February 28, 2019, each Fund did not have any unrecognized tax benefits in the financial statements; nor is each Fund aware of any tax positions for which it is reasonably possible that the total amounts of unrecognized tax benefits will significantly change in the next twelve months. Each Fund files a U.S. federal tax return, in addition to state and local tax returns as required. Each Fund's federal income tax returns are subject to examination by the Internal Revenue Service (IRS) for a period of three fiscal years after they are filed. State and local tax returns may be subject to examination for an additional fiscal year depending on the jurisdiction. Foreign taxes are provided for based on each Fund's understanding of the tax rules and rates that exist in the foreign markets in which it invests.
Distributions are declared and recorded on the ex-dividend date. Income and capital gain distributions are determined in accordance with income tax regulations, which may differ from GAAP. In addition, certain Funds claimed a portion of the payment made to redeeming shareholders as a distribution for income tax purposes.
Capital accounts within the financial statements are adjusted for permanent book-tax differences. These adjustments have no impact on net assets or the results of operations. Capital accounts are not adjusted for temporary book-tax differences which will reverse in a subsequent period.
Book-tax differences are primarily due to foreign currency transactions, equity-debt classifications, redemptions in kind, partnerships, deferred trustees compensation, capital loss carryforwards and losses deferred due to wash sales and excise tax regulations.
As of period end, the cost and unrealized appreciation (depreciation) in securities, and derivatives if applicable, for federal income tax purposes were as follows for each Fund:
| | Tax cost | Gross unrealized appreciation | Gross unrealized depreciation | Net unrealized appreciation (depreciation) |
| Banking Portfolio | $429,345,612 | $140,928,763 | $(55,173,778) | $85,754,985 |
| Brokerage and Investment Management Portfolio | 267,434,456 | 68,873,376 | (9,112,005) | 59,761,371 |
| Consumer Finance Portfolio | 76,884,192 | 27,102,381 | (1,819,673) | 25,282,708 |
| Financial Services Portfolio | 490,006,031 | 80,604,377 | (13,858,683) | 66,745,694 |
| Insurance Portfolio | 131,238,002 | 92,241,205 | (391,103) | 91,850,102 |
The tax-based components of distributable earnings as of period end were as follows for each Fund:
| | Undistributed ordinary income | Undistributed long-term capital gain | Net unrealized appreciation (depreciation) on securities and other investments |
| Banking Portfolio | $1,059,806 | $9,448,166 | $85,754,985 |
| Brokerage and Investment Management Portfolio | 221,131 | 5,056,714 | 59,761,701 |
| Consumer Finance Portfolio | 41,624 | 46,290 | 25,282,708 |
| Financial Services Portfolio | – | – | 66,744,748 |
| Insurance Portfolio | 432,968 | 8,011,118 | 91,849,093 |
The tax character of distributions paid was as follows:
| February 28, 2019 | | | |
| | Ordinary Income | Long-term Capital Gains | Total |
| Banking Portfolio | $10,214,085 | $129,632,127 | $139,846,212 |
| Brokerage and Investment Management Portfolio | 7,442,857 | 22,932,878 | 30,375,735 |
| Consumer Finance Portfolio | 1,245,766 | 5,962,036 | 7,207,802 |
| Financial Services Portfolio | 13,540,641 | 63,869,722 | 77,410,363 |
| Insurance Portfolio | 4,162,505 | 63,641,357 | 67,803,862 |
| February 28, 2018 | | | |
| | Ordinary Income | Long-term Capital Gains | Total |
| Banking Portfolio | $7,600,446 | $13,137,423 | $20,737,869 |
| Brokerage and Investment Management Portfolio | 12,545,512 | 16,976,452 | 29,521,964 |
| Consumer Finance Portfolio | 1,603,897 | – | 1,603,897 |
| Financial Services Portfolio | 15,047,099 | 34,575,868 | 49,622,967 |
| Insurance Portfolio | 4,597,869 | 38,291,537 | 42,889,406 |
Restricted Securities. The Funds may invest in securities that are subject to legal or contractual restrictions on resale. These securities generally may be resold in transactions exempt from registration or to the public if the securities are registered. Disposal of these securities may involve time-consuming negotiations and expense, and prompt sale at an acceptable price may be difficult. Information regarding restricted securities is included at the end of each applicable Fund's Schedule of Investments.
New Rule Issuance. During August 2018, the U.S. Securities and Exchange Commission issued Final Rule Release No. 33-10532, Disclosure Update and Simplification. This Final Rule includes amendments specific to registered investment companies that are intended to eliminate overlap in disclosure requirements between Regulation S-X and GAAP. In accordance with these amendments, certain line-items in the Funds' financial statements have been combined or removed for the current period as outlined in the table below.
| Financial Statement | Current Line-Item Presentation (As Applicable) | Prior Line-Item Presentation (As Applicable) |
| Statement of Assets and Liabilities | Total distributable earnings (loss) | Undistributed/Distributions in excess of/Accumulated net investment income (loss)
Accumulated/Undistributed net realized gain (loss)
Net unrealized appreciation (depreciation) |
| Statement of Changes in Net Assets | N/A - removed | Undistributed/Distributions in excess of/Accumulated net investment income (loss) end of period |
| Statement of Changes in Net Assets | Distributions to shareholders | Distributions to shareholders from net investment income
Distributions to shareholders from net realized gain |
4. Purchases and Sales of Investments.
Purchases and sales of securities, other than short-term securities and in-kind transactions, are noted in the table below.
| | Purchases ($) | Sales ($) |
| Banking Portfolio | 276,565,964 | 523,689,852 |
| Brokerage and Investment Management Portfolio | 110,727,392 | 211,352,483 |
| Consumer Finance Portfolio | 31,393,269 | 36,532,682 |
| Financial Services Portfolio | 360,313,030 | 587,277,539 |
| Insurance Portfolio | 21,937,327 | 121,399,965 |
5. Fees and Other Transactions with Affiliates.
Management Fee. Fidelity SelectCo, LLC (the investment adviser) and its affiliates provide the Funds with investment management related services for which the Funds pay a monthly management fee. The management fee is the sum of an individual fund fee rate and an annualized group fee rate. The individual fund fee rate is applied to each Fund's average net assets. The group fee rate is based upon the average net assets of all the mutual funds advised by Fidelity Management & Research Company (FMR) and the investment adviser. The group fee rate decreases as assets under management increase and increases as assets under management decrease. For the reporting period, each Fund's annual management fee rate expressed as a percentage of each Fund's average net assets was as follows:
| | Individual Rate | Group Rate | Total |
| Banking Portfolio | .30% | .24% | .54% |
| Brokerage and Investment Management Portfolio | .30% | .24% | .54% |
| Consumer Finance Portfolio | .30% | .24% | .54% |
| Financial Services Portfolio | .30% | .24% | .54% |
| Insurance Portfolio | .30% | .24% | .54% |
Transfer Agent Fees. Fidelity Investments Institutional Operations Company, Inc. (FIIOC), an affiliate of the investment adviser, is the Funds' transfer, dividend disbursing and shareholder servicing agent. FIIOC receives account fees and asset-based fees that vary according to account size and type of account. FIIOC pays for typesetting, printing and mailing of shareholder reports, except proxy statements. For the period, transfer agent fees were equivalent to the following annual rates expressed as a percentage of average net assets:
| Banking Portfolio | .18% |
| Brokerage and Investment Management Portfolio | .17% |
| Consumer Finance Portfolio | .22% |
| Financial Services Portfolio | .17% |
| Insurance Portfolio | .20% |
Accounting and Security Lending Fees. Fidelity Service Company, Inc. (FSC), an affiliate of the investment adviser, maintains each Fund's accounting records. The accounting fee is based on the level of average net assets for each month. Under a separate contract, FSC administers the security lending program. The security lending fee is based on the number and duration of lending transactions. For the period, the fees were equivalent to the following annual rates:
| | % of Average Net Assets |
| Banking Portfolio | .04 |
| Brokerage and Investment Management Portfolio | .04 |
| Consumer Finance Portfolio | .04 |
| Financial Services Portfolio | .04 |
| Insurance Portfolio | .04 |
Brokerage Commissions. Certain Funds placed a portion of their portfolio transactions with brokerage firms which are affiliates of the investment adviser. Brokerage commissions are included in net realized gain (loss) and change in net unrealized appreciation (depreciation) in the Statement of Operations. The commissions paid to these affiliated firms were as follows:
| | Amount |
| Banking Portfolio | $8,115 |
| Brokerage and Investment Management Portfolio | 3,840 |
| Consumer Finance Portfolio | 599 |
| Financial Services Portfolio | 9,578 |
| Insurance Portfolio | 627 |
Interfund Lending Program. Pursuant to an Exemptive Order issued by the SEC, the Funds, along with other registered investment companies having management contracts with Fidelity Management & Research Company (FMR) or other affiliated entities of FMR, may participate in an interfund lending program. This program provides an alternative credit facility allowing the funds to borrow from, or lend money to, other participating affiliated funds. At period end, there were no interfund loans outstanding. Each applicable fund's activity in this program during the period for which loans were outstanding was as follows:
| | Borrower or Lender | Average Loan Balance | Weighted Average Interest Rate | Interest Expense |
| Banking Portfolio | Borrower | $9,894,778 | 2.11% | $5,215 |
| Brokerage and Investment Management Portfolio | Borrower | $10,628,000 | 1.94% | $573 |
| Financial Services Portfolio | Borrower | $11,816,500 | 1.95% | $1,277 |
Interfund Trades. The Funds may purchase from or sell securities to other Fidelity Funds under procedures adopted by the Board. The procedures have been designed to ensure these interfund trades are executed in accordance with Rule 17a-7 of the 1940 Act. Interfund trades are included within the respective purchases and sales amounts shown in the Purchases and Sales of Investments note.
Affiliated Redemptions In-Kind. During the period, 42,927,330* shares of Financial Services Portfolio were redeemed in-kind for investments and cash with a value of $473,016,260. The net realized gain of $122,035,415 on investments delivered through in-kind redemptions is included in the accompanying Statement of Operations. The amount of the in-kind redemptions is included in share transactions in the accompanying Statement of Changes in Net Assets. Financial Services Portfolio recognized no gain or loss for federal income tax purposes.
* Share activity prior to August 10, 2018 has been adjusted to reflect the impact of the 10 to 1 share split that occurred on that date.
Other. During the period, the investment adviser reimbursed Insurance Portfolio for certain losses in the amount of $1,176.
6. Committed Line of Credit.
Certain Funds participate with other funds managed by the investment adviser or an affiliate in a $4.25 billion credit facility (the "line of credit") to be utilized for temporary or emergency purposes to fund shareholder redemptions or for other short-term liquidity purposes. The participating funds have agreed to pay commitment fees on their pro-rata portion of the line of credit, which are reflected in Miscellaneous expenses on the Statement of Operations, and are as follows:
| Banking Portfolio | $1,890 |
| Brokerage and Investment Management Portfolio | 1,086 |
| Consumer Finance Portfolio | 275 |
| Financial Services Portfolio | 2,401 |
| Insurance Portfolio | 756 |
During the period, the Funds did not borrow on this line of credit.
7. Security Lending.
Certain Funds lend portfolio securities through a lending agent from time to time in order to earn additional income. On the settlement date of the loan, each applicable Fund receives collateral (in the form of U.S. Treasury obligations, letters of credit and/or cash) against the loaned securities and maintains collateral in an amount not less than 100% of the market value of the loaned securities during the period of the loan. The market value of the loaned securities is determined at the close of business of the Funds and any additional required collateral is delivered to the Funds on the next business day. The Funds or borrower may terminate the loan at any time, and if the borrower defaults on its obligation to return the securities loaned because of insolvency or other reasons, the Funds may apply collateral received from the borrower against the obligation. The Funds may experience delays and costs in recovering the securities loaned. Any cash collateral received is invested in the Fidelity Securities Lending Cash Central Fund. The value of loaned securities and cash collateral at period end are disclosed on each applicable Fund's Statement of Assets and Liabilities. Security lending income represents the income earned on investing cash collateral, less rebates paid to borrowers and any lending agent fees associated with the loan, plus any premium payments received for lending certain types of securities. Security lending income is presented on each applicable Fund's Statement of Operations as a component of income from Fidelity Central Funds. Security lending activity was as follows:
| | Total Security Lending Income |
| Banking Portfolio | $1,023 |
| Brokerage and Investment Management Portfolio | 33,746 |
| Consumer Finance Portfolio | 5,124 |
| Financial Services Portfolio | 2,218 |
| Insurance Portfolio | 14,606 |
8. Expense Reductions.
Commissions paid to certain brokers with whom the investment adviser, or its affiliates, places trades on behalf of certain Funds include an amount in addition to trade execution, which may be rebated back to the Funds to offset certain expenses. In addition, through arrangements with each applicable Fund's custodian, credits realized as a result of certain uninvested cash balances were used to reduce each applicable Fund's expenses. All of the applicable expense reductions are noted in the table below.
| | Brokerage Service reduction | Custody expense reduction | Transfer Agent expense reduction |
| Banking Portfolio | $45,488 | $– | $2 |
| Brokerage and Investment Management Portfolio | 19,531 | – | – |
| Consumer Finance Portfolio | 14,514 | – | – |
| Financial Services Portfolio | 63,005 | 278 | – |
| Insurance Portfolio | 7,794 | – | – |
In addition, during the period the investment adviser reimbursed and/or waived a portion of operating expenses as follows:
| | Amount |
| Banking Portfolio | $5,577 |
| Brokerage and Investment Management Portfolio | 3,168 |
| Consumer Finance Portfolio | 809 |
| Financial Services Portfolio | 7,652 |
| Insurance Portfolio | 2,462 |
9. Other.
The Funds' organizational documents provide former and current trustees and officers with a limited indemnification against liabilities arising in connection with the performance of their duties to the Funds. In the normal course of business, the Funds may also enter into contracts that provide general indemnifications. The Funds' maximum exposure under these arrangements is unknown as this would be dependent on future claims that may be made against the Funds. The risk of material loss from such claims is considered remote.
Report of Independent Registered Public Accounting Firm
To the Board of Trustees of Fidelity Select Portfolios and Shareholders of Banking Portfolio, Brokerage and Investment Management Portfolio, Consumer Finance Portfolio, Financial Services Portfolio and Insurance Portfolio:
Opinions on the Financial Statements
We have audited the accompanying statements of assets and liabilities, including the schedules of investments, of Banking Portfolio, Brokerage and Investment Management Portfolio, Consumer Finance Portfolio, Financial Services Portfolio and Insurance Portfolio (five of the funds constituting Fidelity Select Portfolios, hereafter collectively referred to as the "Funds") as of February 28, 2019, the related statements of operations for the year ended February 28, 2019, the statements of changes in net assets for each of the two years in the period ended February 28, 2019, including the related notes, and the financial highlights for each of the five years in the period ended February 28, 2019 (collectively referred to as the “financial statements”). In our opinion, the financial statements present fairly, in all material respects, the financial position of each of the Funds as of February 28, 2019, the results of each of their operations for the year then ended, the changes in each of their net assets for each of the two years in the period ended February 28, 2019 and each of the financial highlights for each of the five years in the period ended February 28, 2019 in conformity with accounting principles generally accepted in the United States of America.
Basis for Opinions
These financial statements are the responsibility of the Funds' management. Our responsibility is to express an opinion on the Funds' financial statements based on our audits. We are a public accounting firm registered with the Public Company Accounting Oversight Board (United States) (PCAOB) and are required to be independent with respect to the Funds in accordance with the U.S. federal securities laws and the applicable rules and regulations of the Securities and Exchange Commission and the PCAOB.
We conducted our audits of these financial statements in accordance with the standards of the PCAOB. Those standards require that we plan and perform the audit to obtain reasonable assurance about whether the financial statements are free of material misstatement, whether due to error or fraud.
Our audits included performing procedures to assess the risks of material misstatement of the financial statements, whether due to error or fraud, and performing procedures that respond to those risks. Such procedures included examining, on a test basis, evidence regarding the amounts and disclosures in the financial statements. Our audits also included evaluating the accounting principles used and significant estimates made by management, as well as evaluating the overall presentation of the financial statements. Our procedures included confirmation of securities owned as of February 28, 2019 by correspondence with the custodian, and brokers; when replies were not received from brokers, we performed other auditing procedures. We believe that our audits provide a reasonable basis for our opinions.
PricewaterhouseCoopers LLP
Boston, Massachusetts
April 15, 2019
We have served as the auditor of one or more investment companies in the Fidelity group of funds since 1932.
Trustees and Officers
The Trustees, Members of the Advisory Board (if any), and officers of the trust and funds, as applicable, are listed below. The Board of Trustees governs each fund and is responsible for protecting the interests of shareholders. The Trustees are experienced executives who meet periodically throughout the year to oversee each fund's activities, review contractual arrangements with companies that provide services to each fund, oversee management of the risks associated with such activities and contractual arrangements, and review each fund's performance. Except for Michael E. Wiley, each of the Trustees oversees 287 funds. Mr. Wiley oversees 195 funds.
The Trustees hold office without limit in time except that (a) any Trustee may resign; (b) any Trustee may be removed by written instrument, signed by at least two-thirds of the number of Trustees prior to such removal; (c) any Trustee who requests to be retired or who has become incapacitated by illness or injury may be retired by written instrument signed by a majority of the other Trustees; and (d) any Trustee may be removed at any special meeting of shareholders by a two-thirds vote of the outstanding voting securities of the trust. Each Trustee who is not an interested person (as defined in the 1940 Act) of the trust and the funds is referred to herein as an Independent Trustee. Each Independent Trustee shall retire not later than the last day of the calendar year in which his or her 75th birthday occurs. The Independent Trustees may waive this mandatory retirement age policy with respect to individual Trustees. Officers and Advisory Board Members hold office without limit in time, except that any officer or Advisory Board Member may resign or may be removed by a vote of a majority of the Trustees at any regular meeting or any special meeting of the Trustees. Except as indicated, each individual has held the office shown or other offices in the same company for the past five years.
Each fund’s Statement of Additional Information (SAI) includes more information about the Trustees. To request a free copy, call Fidelity at 1-800-544-8544.
Experience, Skills, Attributes, and Qualifications of the Trustees. The Governance and Nominating Committee has adopted a statement of policy that describes the experience, qualifications, attributes, and skills that are necessary and desirable for potential Independent Trustee candidates (Statement of Policy). The Board believes that each Trustee satisfied at the time he or she was initially elected or appointed a Trustee, and continues to satisfy, the standards contemplated by the Statement of Policy. The Governance and Nominating Committee also engages professional search firms to help identify potential Independent Trustee candidates who have the experience, qualifications, attributes, and skills consistent with the Statement of Policy. From time to time, additional criteria based on the composition and skills of the current Independent Trustees, as well as experience or skills that may be appropriate in light of future changes to board composition, business conditions, and regulatory or other developments, have also been considered by the professional search firms and the Governance and Nominating Committee. In addition, the Board takes into account the Trustees' commitment and participation in Board and committee meetings, as well as their leadership of standing and ad hoc committees throughout their tenure.
In determining that a particular Trustee was and continues to be qualified to serve as a Trustee, the Board has considered a variety of criteria, none of which, in isolation, was controlling. The Board believes that, collectively, the Trustees have balanced and diverse experience, qualifications, attributes, and skills, which allow the Board to operate effectively in governing each fund and protecting the interests of shareholders. Information about the specific experience, skills, attributes, and qualifications of each Trustee, which in each case led to the Board's conclusion that the Trustee should serve (or continue to serve) as a trustee of the funds, is provided below.
Board Structure and Oversight Function. James C. Curvey is an interested person and currently serves as Chairman. The Trustees have determined that an interested Chairman is appropriate and benefits shareholders because an interested Chairman has a personal and professional stake in the quality and continuity of services provided to the funds. Independent Trustees exercise their informed business judgment to appoint an individual of their choosing to serve as Chairman, regardless of whether the Trustee happens to be independent or a member of management. The Independent Trustees have determined that they can act independently and effectively without having an Independent Trustee serve as Chairman and that a key structural component for assuring that they are in a position to do so is for the Independent Trustees to constitute a substantial majority for the Board. The Independent Trustees also regularly meet in executive session. Ned C. Lautenbach serves as Chairman of the Independent Trustees and as such (i) acts as a liaison between the Independent Trustees and management with respect to matters important to the Independent Trustees and (ii) with management prepares agendas for Board meetings.
Fidelity® funds are overseen by different Boards of Trustees. The funds' Board oversees Fidelity's high income and certain equity funds, and other Boards oversee Fidelity's investment-grade bond, money market, asset allocation, and other equity funds. The asset allocation funds may invest in Fidelity® funds overseen by the funds' Board. The use of separate Boards, each with its own committee structure, allows the Trustees of each group of Fidelity® funds to focus on the unique issues of the funds they oversee, including common research, investment, and operational issues. On occasion, the separate Boards establish joint committees to address issues of overlapping consequences for the Fidelity® funds overseen by each Board.
The Trustees operate using a system of committees to facilitate the timely and efficient consideration of all matters of importance to the Trustees, each fund, and fund shareholders and to facilitate compliance with legal and regulatory requirements and oversight of the funds' activities and associated risks. The Board, acting through its committees, has charged SelectCo and its affiliates with (i) identifying events or circumstances the occurrence of which could have demonstrably adverse effects on the funds' business and/or reputation; (ii) implementing processes and controls to lessen the possibility that such events or circumstances occur or to mitigate the effects of such events or circumstances if they do occur; and (iii) creating and maintaining a system designed to evaluate continuously business and market conditions in order to facilitate the identification and implementation processes described in (i) and (ii) above. Because the day-to-day operations and activities of the funds are carried out by or through SelectCo, its affiliates, and other service providers, the funds' exposure to risks is mitigated but not eliminated by the processes overseen by the Trustees. While each of the Board's committees has responsibility for overseeing different aspects of the funds' activities, oversight is exercised primarily through the Operations, Audit, and Compliance Committees. In addition, the Independent Trustees have worked with Fidelity to enhance the Board's oversight of investment and financial risks, legal and regulatory risks, technology risks, and operational risks, including the development of additional risk reporting to the Board. Appropriate personnel, including but not limited to the funds' Chief Compliance Officer (CCO), SelectCo's internal auditor, the independent accountants, the funds' Treasurer and portfolio management personnel, make periodic reports to the Board's committees, as appropriate, including an annual review of Fidelity's risk management program for the Fidelity® funds. The responsibilities of each standing committee, including their oversight responsibilities, are described further under "Standing Committees of the Trustees."
Interested Trustees*:
Correspondence intended for a Trustee who is an interested person may be sent to Fidelity Investments, 245 Summer Street, Boston, Massachusetts 02210.
Name, Year of Birth; Principal Occupations and Other Relevant Experience+
James C. Curvey (1935)
Year of Election or Appointment: 2018
Trustee
Chairman of the Board of Trustees
Mr. Curvey also serves as Trustee of other Fidelity® funds. Mr. Curvey is Vice Chairman (2007-present) and Director of FMR LLC (diversified financial services company). In addition, Mr. Curvey is an Overseer Emeritus for the Boston Symphony Orchestra, a Director of Artis-Naples, and a Trustee of Brewster Academy in Wolfeboro, New Hampshire. Previously, Mr. Curvey served as a Director of Fidelity Research & Analysis Co. (investment adviser firm, 2009-2018), Director of Fidelity Investments Money Management, Inc. (investment adviser firm, 2009-2014) and a Director of FMR and FMR Co., Inc. (investment adviser firms, 2007-2014).
* Determined to be an "Interested Trustee" by virtue of, among other things, his or her affiliation with the trust or various entities under common control with SelectCo.
+ The information includes the Trustee's principal occupation during the last five years and other information relating to the experience, attributes, and skills relevant to the Trustee's qualifications to serve as a Trustee, which led to the conclusion that the Trustee should serve as a Trustee for each fund.
Independent Trustees:
Correspondence intended for an Independent Trustee may be sent to Fidelity Investments, P.O. Box 55235, Boston, Massachusetts 02205-5235.
Name, Year of Birth; Principal Occupations and Other Relevant Experience+
Dennis J. Dirks (1948)
Year of Election or Appointment: 2018
Trustee
Mr. Dirks also serves as Trustee of other Fidelity® funds. Prior to his retirement in May 2003, Mr. Dirks was Chief Operating Officer and a member of the Board of The Depository Trust & Clearing Corporation (DTCC). He also served as President, Chief Operating Officer, and Board member of The Depository Trust Company (DTC) and President and Board member of the National Securities Clearing Corporation (NSCC). In addition, Mr. Dirks served as Chief Executive Officer and Board member of the Government Securities Clearing Corporation, Chief Executive Officer and Board member of the Mortgage-Backed Securities Clearing Corporation, as a Trustee and a member of the Finance Committee of Manhattan College (2005-2008), as a Trustee and a member of the Finance Committee of AHRC of Nassau County (2006-2008), as a member of the Independent Directors Council (IDC) Governing Council (2010-2015), and as a member of the Board of Directors for The Brookville Center for Children’s Services, Inc. (2009-2017). Mr. Dirks is a member of the Finance Committee (2016-present) and Board of Directors (2017-present) and is Treasurer (2018-present) of the Asolo Repertory Theatre.
Donald F. Donahue (1950)
Year of Election or Appointment: 2018
Trustee
Mr. Donahue also serves as a Trustee of other Fidelity® funds. Mr. Donahue is President and Chief Executive Officer of Miranda Partners, LLC (risk consulting for the financial services industry, 2012-present). Previously, Mr. Donahue served as a Member of the Advisory Board of certain Fidelity® funds (2015-2018) and Chief Executive Officer (2006-2012), Chief Operating Officer (2003-2006), and Managing Director, Customer Marketing and Development (1999-2003) of The Depository Trust & Clearing Corporation (financial markets infrastructure). Mr. Donahue serves as a Member (2007-present) and Co-Chairman (2016-present) of the Board of Directors of United Way of New York, Member of the Board of Directors of NYC Leadership Academy (2012-present) and Member of the Board of Advisors of Ripple Labs, Inc. (financial services, 2015-present). He also served as Chairman (2010-2012) and Member of the Board of Directors (2012-2013) of Omgeo, LLC (financial services), Treasurer of United Way of New York (2012-2016), and Member of the Board of Directors of XBRL US (financial services non-profit, 2009-2012) and the International Securities Services Association (2009-2012).
Alan J. Lacy (1953)
Year of Election or Appointment: 2018
Trustee
Mr. Lacy also serves as Trustee of other Fidelity® funds. Mr. Lacy serves as a Director of Bristol-Myers Squibb Company (global pharmaceuticals, 2008-present). He is a Trustee of the California Chapter of The Nature Conservancy (2015-present) and a Director of the Center for Advanced Study in the Behavioral Sciences at Stanford University (2015-present). In addition, Mr. Lacy served as Senior Adviser (2007-2014) of Oak Hill Capital Partners, L.P. (private equity) and also served as Chief Executive Officer (2005) and Vice Chairman (2005-2006) of Sears Holdings Corporation (retail) and Chief Executive Officer and Chairman of the Board of Sears, Roebuck and Co. (retail, 2000-2005). Previously, Mr. Lacy served as Chairman (2014-2017) and a member (2010-2017) of the Board of Directors of Dave & Buster’s Entertainment, Inc. (restaurant and entertainment complexes), as Chairman (2008-2011) and a member (2006-2015) of the Board of Trustees of the National Parks Conservation Association, and as a member of the Board of Directors for The Hillman Companies, Inc. (hardware wholesalers, 2010-2014), Earth Fare, Inc. (retail grocery, 2010-2014), and The Western Union Company (global money transfer, 2006-2011).
Ned C. Lautenbach (1944)
Year of Election or Appointment: 2018
Trustee
Chairman of the Independent Trustees
Mr. Lautenbach also serves as Trustee of other Fidelity® funds. Mr. Lautenbach currently serves as Chair (2018-present) and Member (2013-present) of the Board of Governors, State University System of Florida and is a member of the Council on Foreign Relations (1994-present). He is also a member and has most recently served as Chairman of the Board of Directors of Artis-Naples (2012-present). Previously, Mr. Lautenbach served as a member and then Lead Director of the Board of Directors of Eaton Corporation (diversified industrial, 1997-2016). He was also a Partner and Advisory Partner at Clayton, Dubilier & Rice, LLC (private equity investment, 1998-2010), as well as a Director of Sony Corporation (2006-2007). In addition, Mr. Lautenbach also had a 30-year career with IBM (technology company) during which time he served as Senior Vice President and a member of the Corporate Executive Committee (1968-1998).
Joseph Mauriello (1944)
Year of Election or Appointment: 2018
Trustee
Mr. Mauriello also serves as Trustee of other Fidelity® funds. Prior to his retirement in January 2006, Mr. Mauriello served in numerous senior management positions including Deputy Chairman and Chief Operating Officer (2004-2005), and Vice Chairman of Financial Services (2002-2004) of KPMG LLP US (professional services, 1965-2005). Mr. Mauriello currently serves as a member of the Independent Directors Council (IDC) Governing Council (2015-present). Previously, Mr. Mauriello served as a member of the Board of Directors of XL Group plc. (global insurance and re-insurance, 2006-2018).
Cornelia M. Small (1944)
Year of Election or Appointment: 2018
Trustee
Ms. Small also serves as Trustee of other Fidelity® funds. Ms. Small is a member of the Board of Directors (2009-present) and Chair of the Investment Committee (2010-present) of the Teagle Foundation. Ms. Small also serves on the Investment Committee of the Berkshire Taconic Community Foundation (2008-present). Previously, Ms. Small served as Chairperson (2002-2008) and a member of the Investment Committee and Chairperson (2008-2012) and a member of the Board of Trustees of Smith College. In addition, Ms. Small served as Chief Investment Officer, Director of Global Equity Investments, and a member of the Board of Directors of Scudder, Stevens & Clark and Scudder Kemper Investments.
Garnett A. Smith (1947)
Year of Election or Appointment: 2013
Trustee
Mr. Smith also serves as Trustee of other Fidelity® funds. Prior to Mr. Smith's retirement, he served as Chairman and Chief Executive Officer of Inbrand Corp. (manufacturer of personal absorbent products, 1990-1997). He also served as President (1986-1990) of Inbrand Corp. Prior to his employment with Inbrand Corp., he was employed by a retail fabric chain and North Carolina National Bank. In addition, Mr. Smith served as a Member of the Advisory Board of certain Fidelity® funds (2012-2013) and as a board member of the Jackson Hole Land Trust (2009-2012).
David M. Thomas (1949)
Year of Election or Appointment: 2018
Trustee
Mr. Thomas also serves as Trustee of other Fidelity® funds. Mr. Thomas serves as Non-Executive Chairman of the Board of Directors of Fortune Brands Home and Security (home and security products, 2011-present) and as a member of the Board of Directors (2004-present) and Presiding Director (2013-present) of Interpublic Group of Companies, Inc. (marketing communication). Previously, Mr. Thomas served as Executive Chairman (2005-2006) and Chairman and Chief Executive Officer (2000-2005) of IMS Health, Inc. (pharmaceutical and healthcare information solutions), a Director of Fortune Brands, Inc. (consumer products, 2000-2011), and a member of the Board of Trustees of the University of Florida (2013-2018).
Michael E. Wiley (1950)
Year of Election or Appointment: 2008
Trustee
Mr. Wiley also serves as Trustee or Member of the Advisory Board of other Fidelity® funds. Mr. Wiley serves as a Director of High Point Resources (exploration and production, 2005-present). Previously, Mr. Wiley served as a Director of Andeavor Corporation (independent oil refiner and marketer, 2005-2018), a Director of Andeavor Logistics LP (natural resources logistics, 2015-2018), a Director of Post Oak Bank (privately-held bank, 2004-2018), a Director of Asia Pacific Exploration Consolidated (international oil and gas exploration and production, 2008-2013), a member of the Board of Trustees of the University of Tulsa (2000-2006; 2007-2010), a Senior Energy Advisor of Katzenbach Partners, LLC (consulting, 2006-2007), an Advisory Director of Riverstone Holdings (private investment), a Director of Spinnaker Exploration Company (exploration and production, 2001-2005) and Chairman, President, and CEO of Baker Hughes, Inc. (oilfield services, 2000-2004).
+ The information includes the Trustee's principal occupation during the last five years and other information relating to the experience, attributes, and skills relevant to the Trustee's qualifications to serve as a Trustee, which led to the conclusion that the Trustee should serve as a Trustee for each fund.
Advisory Board Members and Officers:
Correspondence intended for a Member of the Advisory Board (if any) may be sent to Fidelity Investments, P.O. Box 55235, Boston, Massachusetts 02205-5235. Correspondence intended for an officer or Peter S. Lynch may be sent to Fidelity Investments, 245 Summer Street, Boston, Massachusetts 02210. Officers appear below in alphabetical order.
Name, Year of Birth; Principal Occupation
Vicki L. Fuller (1957)
Year of Election or Appointment: 2018
Member of the Advisory Board
Ms. Fuller also serves as Member of the Advisory Board of other Fidelity® funds. Ms. Fuller serves as a member of the Board of Directors, Audit Committee, and Nominating and Governance Committee of The Williams Companies, Inc. (natural gas infrastructure, 2018-present). Previously, Ms. Fuller served as the Chief Investment Officer of the New York State Common Retirement Fund (2012-2018) and held a variety of positions at AllianceBernstein L.P. (global asset management, 1985-2012), including Managing Director (2006-2012) and Senior Vice President and Senior Portfolio Manager (2001-2006).
Peter S. Lynch (1944)
Year of Election or Appointment: 2018
Member of the Advisory Board
Mr. Lynch also serves as Member of the Advisory Board of other Fidelity® funds. Mr. Lynch is Vice Chairman and a Director of FMR (investment adviser firm) and FMR Co., Inc. (investment adviser firm). In addition, Mr. Lynch serves as a Trustee of Boston College and as the Chairman of the Inner-City Scholarship Fund. Previously, Mr. Lynch served on the Special Olympics International Board of Directors (1997-2006).
Carol B. Tomé (1957)
Year of Election or Appointment: 2017
Member of the Advisory Board
Ms. Tomé also serves as Member of the Advisory Board of other Fidelity® funds. Ms. Tomé is Chief Financial Officer (2001-present) and Executive Vice President of Corporate Services (2007-present) of The Home Depot, Inc. (home improvement retailer) and a Director (2003-present) and Chair of the Audit Committee (2004-present) of United Parcel Service, Inc. (package delivery and supply chain management). Previously, Ms. Tomé served as Trustee of certain Fidelity® funds (2017), Senior Vice President of Finance and Accounting/Treasurer (2000-2007) and Vice President and Treasurer (1995-2000) of The Home Depot, Inc. and Chair of the Board (2010-2012), Vice Chair of the Board (2009 and 2013), and a Director (2008-2013) of the Federal Reserve Bank of Atlanta. Ms. Tomé is also a director or trustee of many community and professional organizations.
Elizabeth Paige Baumann (1968)
Year of Election or Appointment: 2017
Anti-Money Laundering (AML) Officer
Ms. Baumann also serves as AML Officer of other funds. She is Chief AML Officer (2012-present) and Senior Vice President (2014-present) of FMR LLC (diversified financial services company) and is an employee of Fidelity Investments. Previously, Ms. Baumann served as AML Officer of the funds (2012-2016), and Vice President (2007-2014) and Deputy Anti-Money Laundering Officer (2007-2012) of FMR LLC.
Craig S. Brown (1977)
Year of Election or Appointment: 2019
Assistant Treasurer
Mr. Brown also serves as Assistant Treasurer of other funds. Mr. Brown is an employee of Fidelity Investments (2013-present).
John J. Burke III (1964)
Year of Election or Appointment: 2018
Chief Financial Officer
Mr. Burke also serves as Chief Financial Officer of other funds. Mr. Burke serves as Head of Investment Operations for Fidelity Fund and Investment Operations (2018-present) and is an employee of Fidelity Investments (1998-present). Previously Mr. Burke served as head of Asset Management Investment Operations (2012-2018).
William C. Coffey (1969)
Year of Election or Appointment: 2018
Secretary and Chief Legal Officer (CLO)
Mr. Coffey also serves as Secretary and CLO of other funds. Mr. Coffey serves as CLO, Secretary, and Senior Vice President of Fidelity Management & Research Company and FMR Co., Inc. (investment adviser firms, 2018-present); Secretary of Fidelity SelectCo, LLC and Fidelity Investments Money Management, Inc. (investment adviser firms, 2018-present); and CLO of Fidelity Management & Research (Hong Kong) Limited, FMR Investment Management (UK) Limited, and Fidelity Management & Research (Japan) Limited (investment adviser firms, 2018-present). He is Senior Vice President and Deputy General Counsel of FMR LLC (diversified financial services company, 2010-present), and is an employee of Fidelity Investments. Previously, Mr. Coffey served as Assistant Secretary of certain funds (2009-2018) and as Vice President and Associate General Counsel of FMR LLC (2005-2009).
Timothy M. Cohen (1969)
Year of Election or Appointment: 2018
Vice President
Mr. Cohen also serves as Vice President of other funds. Mr. Cohen serves as Co-Head of Global Equity Research (2016-present), a Director of Fidelity Management & Research (Japan) Limited (investment adviser firm, 2016-present), and is an employee of Fidelity Investments. Previously, Mr. Cohen served as Chief Investment Officer - Equity and a Director of Fidelity Management & Research (U.K.) Inc. (investment adviser firm, 2013-2015) and as a Director of Fidelity Management & Research (Hong Kong) Limited (investment adviser firm, 2017).
Jonathan Davis (1968)
Year of Election or Appointment: 2010
Assistant Treasurer
Mr. Davis also serves as Assistant Treasurer of other funds. Mr. Davis serves as Assistant Treasurer of FMR Capital, Inc. (2017-present) and is an employee of Fidelity Investments. Previously, Mr. Davis served as Vice President and Associate General Counsel of FMR LLC (diversified financial services company, 2003-2010).
Adrien E. Deberghes (1967)
Year of Election or Appointment: 2018
Assistant Treasurer
Mr. Deberghes also serves as an officer of other funds. He serves as Assistant Treasurer of FMR Capital, Inc. (2017-present), Executive Vice President of Fidelity Investments Money Management, Inc. (FIMM) (investment adviser firm, 2016-present), and is an employee of Fidelity Investments (2008-present). Previously, Mr. Deberghes served as President and Treasurer of certain Fidelity® funds (2013-2018). Prior to joining Fidelity Investments, Mr. Deberghes was Senior Vice President of Mutual Fund Administration at State Street Corporation (2007-2008), Senior Director of Mutual Fund Administration at Investors Bank & Trust (2005-2007), and Director of Finance for Dunkin' Brands (2000-2005). Previously, Mr. Deberghes served in other fund officer roles.
Laura M. Del Prato (1964)
Year of Election or Appointment: 2018
Assistant Treasurer
Ms. Del Prato also serves as an officer of other funds. Ms. Del Prato is an employee of Fidelity Investments (2017-present). Prior to joining Fidelity Investments, Ms. Del Prato served as a Managing Director and Treasurer of the JPMorgan Mutual Funds (2014-2017). Prior to JPMorgan, Ms. Del Prato served as a partner at Cohen Fund Audit Services (accounting firm, 2012-2013) and KPMG LLP (accounting firm, 2004-2012).
Colm A. Hogan (1973)
Year of Election or Appointment: 2018
Deputy Treasurer
Mr. Hogan also serves as an officer of other funds. Mr. Hogan serves as Assistant Treasurer of FMR Capital, Inc. (2017-present) and is an employee of Fidelity Investments (2005-present). Previously, Mr. Hogan served as Assistant Treasurer of certain Fidelity® funds (2016-2018).
Pamela R. Holding (1964)
Year of Election or Appointment: 2018
Vice President
Ms. Holding also serves as Vice President of other funds. Ms. Holding serves as Co-Head of Global Equity Research (2018-present) and is an employee of Fidelity Investments (2013-present).
Chris Maher (1972)
Year of Election or Appointment: 2013
Assistant Treasurer
Mr. Maher serves as Assistant Treasurer of other funds. Mr. Maher is Vice President of Valuation Oversight, serves as Assistant Treasurer of FMR Capital, Inc. (2017-present), and is an employee of Fidelity Investments. Previously, Mr. Maher served as Vice President of Asset Management Compliance (2013), Vice President of the Program Management Group of FMR (investment adviser firm, 2010-2013), and Vice President of Valuation Oversight (2008-2010).
Kenneth B. Robins (1969)
Year of Election or Appointment: 2018
Chief Compliance Officer
Mr. Robins also serves as an officer of other funds. Mr. Robins serves as Compliance Officer of Fidelity Management & Research Company and FMR Co., Inc. (investment adviser firms, 2016-present) and is an employee of Fidelity Investments (2004-present). Previously, Mr. Robins served as Executive Vice President of Fidelity Investments Money Management, Inc. (investment adviser firm, 2013-2016) and served in other fund officer roles.
Stacie M. Smith (1974)
Year of Election or Appointment: 2018
President and Treasurer
Ms. Smith also serves as an officer of other funds. Ms. Smith serves as Assistant Treasurer of FMR Capital, Inc. (2017-present), is an employee of Fidelity Investments (2009-present), and has served in other fund officer roles. Prior to joining Fidelity Investments, Ms. Smith served as Senior Audit Manager of Ernst & Young LLP (accounting firm, 1996-2009). Previously, Ms. Smith served as Assistant Treasurer (2013-2018) and Deputy Treasurer (2013-2016) of certain Fidelity® funds.
Marc L. Spector (1972)
Year of Election or Appointment: 2017
Assistant Treasurer
Mr. Spector also serves as an officer of other funds. Mr. Spector serves as Assistant Treasurer of FMR Capital, Inc. (2017-present) and is an employee of Fidelity Investments (2016-present). Prior to joining Fidelity Investments, Mr. Spector served as Director at the Siegfried Group (accounting firm, 2013-2016), and prior to Siegfried Group as audit senior manager at Deloitte & Touche (accounting firm, 2005-2013).
Jim Wegmann (1979)
Year of Election or Appointment: 2019
Assistant Treasurer
Mr. Wegmann also serves as Assistant Treasurer of other funds. Mr. Wegmann is an employee of Fidelity Investments (2011-present).
Shareholder Expense Example
As a shareholder of a Fund, you incur two types of costs: (1) transaction costs, including and (2) ongoing costs, including management fees and other Fund expenses. This Example is intended to help you understand your ongoing costs (in dollars) of investing in the Funds and to compare these costs with the ongoing costs of investing in other mutual funds.
The Example is based on an investment of $1,000 invested at the beginning of the period and held for the entire period (September 1, 2018 to February 28, 2019).
Actual Expenses
The first line of the accompanying table for each fund provides information about actual account values and actual expenses. You may use the information in this line, together with the amount you invested, to estimate the expenses that you paid over the period. Simply divide your account value by $1,000.00 (for example, an $8,600 account value divided by $1,000.00 = 8.6), then multiply the result by the number in the first line for a fund under the heading entitled "Expenses Paid During Period" to estimate the expenses you paid on your account during this period. In addition, each Fund, as a shareholder in the underlying Fidelity Central Funds, will indirectly bear its pro-rata share of the fees and expenses incurred by the underlying Fidelity Central Funds. These fees and expenses are not included in the Fund's annualized expense ratio used to calculate the expense estimate in the table below.
Hypothetical Example for Comparison Purposes
The second line of the accompanying table for each fund provides information about hypothetical account values and hypothetical expenses based on a fund's actual expense ratio and an assumed rate of return of 5% per year before expenses, which is not the Fund's actual return. The hypothetical account values and expenses may not be used to estimate the actual ending account balance or expenses you paid for the period. You may use this information to compare the ongoing costs of investing in the Fund and other funds. To do so, compare this 5% hypothetical example with the 5% hypothetical examples that appear in the shareholder reports of the other funds. In addition, each Fund, as a shareholder in the underlying Fidelity Central Funds, will indirectly bear its pro-rata share of the fees and expenses incurred by the underlying Fidelity Central Funds. These fees and expenses are not included in the Fund's annualized expense ratio used to calculate the expense estimate in the table below.
Please note that the expenses shown in the table are meant to highlight your ongoing costs only and do not reflect any transaction costs. Therefore, the second line of the table is useful in comparing ongoing costs only, and will not help you determine the relative total costs of owning different funds. In addition, if these transactional costs were included, your costs would have been higher.
| | Annualized Expense Ratio-A | Beginning
Account Value
September 1, 2018 | Ending
Account Value
February 28, 2019 | Expenses Paid
During Period-B
September 1, 2018
to February 28, 2019 |
| Banking Portfolio | .77% | | | |
| Actual | | $1,000.00 | $923.80 | $3.67 |
| Hypothetical-C | | $1,000.00 | $1,020.98 | $3.86 |
| Brokerage and Investment Management Portfolio | .78% | | | |
| Actual | | $1,000.00 | $954.40 | $3.78 |
| Hypothetical-C | | $1,000.00 | $1,020.93 | $3.91 |
| Consumer Finance Portfolio | .86% | | | |
| Actual | | $1,000.00 | $983.20 | $4.23 |
| Hypothetical-C | | $1,000.00 | $1,020.53 | $4.31 |
| Financial Services Portfolio | .77% | | | |
| Actual | | $1,000.00 | $937.70 | $3.70 |
| Hypothetical-C | | $1,000.00 | $1,020.98 | $3.86 |
| Insurance Portfolio | .82% | | | |
| Actual | | $1,000.00 | $999.80 | $4.07 |
| Hypothetical-C | | $1,000.00 | $1,020.73 | $4.11 |
A Annualized expense ratio reflects expenses net of applicable fee waivers.
B Expenses are equal to each Fund's annualized expense ratio, multiplied by the average account value over the period, multiplied by 181/ 365 (to reflect the one-half year period).
C 5% return per year before expenses
Distributions (Unaudited)
The Board of Trustees of each fund voted to pay to shareholders of record at the opening of business on record date, the following distributions per share derived from capital gains realized from sales of portfolio securities, and dividends derived from net investment income:
| | Pay Date | Record Date | Dividends | Capital Gains |
| Banking Portfolio | 04/08/19 | 04/05/19 | $0.057 | $0.509 |
| Brokerage and Investment Management Portfolio | 04/08/19 | 04/05/19 | $0.051 | $1.165 |
| Consumer Finance Portfolio | 04/08/19 | 04/05/19 | $0.006 | $0.008 |
| Financial Services Portfolio | 04/08/19 | 04/05/19 | – | – |
| Insurance Portfolio | 04/08/19 | 04/05/19 | $0.121 | $2.239 |
The funds hereby designate as capital gain dividend the amounts noted below for the taxable year ended February 28, 2019, or, if subsequently determined to be different, the net capital gain of such year.
| Banking Portfolio | $102,169,416 |
| Brokerage and Investment Management Portfolio | $11,529,096 |
| Consumer Finance Portfolio | $1,919,333 |
| Financial Services Portfolio | $49,275,761 |
| Insurance Portfolio | $39,350,786 |
A percentage of the dividends distributed during the fiscal year for the following funds qualify for the dividends–received deduction for corporate shareholders:
| Banking Portfolio | |
| April 2018 | 100% |
| December 2018 | 100% |
| Brokerage and Investment Management Portfolio | |
| April 2018 | 29% |
| December 2018 | 100% |
| Consumer Finance Portfolio | |
| April 2018 | – |
| December 2018 | 78% |
| Financial Services Portfolio | |
| April 2018 | 40% |
| December 2018 | 100% |
| Insurance Portfolio | |
| April 2018 | 100% |
| December 2018 | 100% |
A percentage of the dividends distributed during the fiscal year for the following funds may be taken into account as a dividend for purposes of the maximum rate under section 1(h)(11) of the Internal Revenue Code.
| Banking Portfolio | |
| April 2018 | 100% |
| December 2018 | 100% |
| Brokerage and Investment Management Portfolio | |
| April 2018 | 43% |
| December 2018 | 100% |
| Consumer Finance Portfolio | |
| April 2018 | – |
| December 2018 | 79% |
| Financial Services Portfolio | |
| April 2018 | 47% |
| December 2018 | 100% |
| Insurance Portfolio | |
| April 2018 | 100% |
| December 2018 | 100% |
Consumer Finance Portfolio designates 22% of the dividend distributed during the fiscal year as a section 199A dividend.
The funds will notify shareholders in January 2020 of amounts for use in preparing 2019 income tax returns.
Board Approval of Investment Advisory Contracts and Management Fees
Banking Portfolio
Brokerage and Investment Management Portfolio
Consumer Finance Portfolio
Financial Services Portfolio
Insurance Portfolio
Each year, the Board of Trustees, including the Independent Trustees (together, the Board), votes on the renewal of the management contract with Fidelity SelectCo, LLC (SelectCo), an affiliate of Fidelity Management & Research Company (FMR), and the sub-advisory agreements with affiliates of FMR (together, the Advisory Contracts) for each fund. SelectCo and the sub-advisers are referred to herein as the Investment Advisers. The Board, assisted by the advice of fund counsel and Independent Trustees' counsel, requests and considers a broad range of information relevant to the renewal of the Advisory Contracts throughout the year.
The Board meets regularly and, at each of its meetings, covers an extensive agenda of topics and materials and considers factors that are relevant to its annual consideration of the renewal of each fund's Advisory Contracts, including the services and support provided to each fund and its shareholders. The Board has established various standing committees (Committees), each composed of and chaired by Independent Trustees with varying backgrounds, to which the Board has assigned specific subject matter responsibilities in order to enhance effective decision-making by the Board. The Board, acting directly and through its Committees, requests and receives information concerning the annual consideration of the renewal of each fund's Advisory Contracts. The Board also meets as needed to review matters specifically related to the Board's annual consideration of the renewal of the Advisory Contracts. Members of the Board may also meet with trustees of other Fidelity funds through joint ad hoc committees to discuss certain matters relevant to all of the Fidelity funds.
At its January 2019 meeting, the Board unanimously determined to renew each fund's Advisory Contracts. In reaching its determination, the Board considered all factors it believed relevant, including (i) the nature, extent, and quality of the services to be provided to each fund and its shareholders (including the investment performance of each fund); (ii) the competitiveness of each fund's management fee and total expense ratio relative to peer funds; (iii) the total costs of the services to be provided by and the profits to be realized by Fidelity from its relationships with each fund; and (iv) the extent to which, if any, economies of scale exist and would be realized as each fund grows, and whether any economies of scale are appropriately shared with fund shareholders.
In considering whether to renew the Advisory Contracts for each fund, the Board reached a determination, with the assistance of fund counsel and Independent Trustees' counsel and through the exercise of its business judgment, that the renewal of the Advisory Contracts was in the best interests of each fund and its shareholders and that the compensation payable under the Advisory Contracts was fair and reasonable. The Board's decision to renew the Advisory Contracts was not based on any single factor, but rather was based on a comprehensive consideration of all the information provided to the Board at its meetings throughout the year. The Board, in reaching its determination to renew the Advisory Contracts, was aware that shareholders of each fund have a broad range of investment choices available to them, including a wide choice among funds offered by Fidelity's competitors, and that each fund's shareholders, who have the opportunity to review and weigh the disclosure provided by the fund in its prospectus and other public disclosures, have chosen to invest in that fund, which is part of the Fidelity family of funds.
Nature, Extent, and Quality of Services Provided. The Board considered Fidelity's staffing as it relates to the funds, including the backgrounds of investment personnel of Fidelity, and also considered the funds' investment objectives, strategies, and related investment philosophies. The Independent Trustees also had discussions with senior management of Fidelity's investment operations and investment groups. The Board considered the structure of the investment personnel compensation program and whether this structure provides appropriate incentives to act in the best interests of each fund. Additionally, the Board considered the portfolio managers' investments, if any, in the funds that they manage.
Resources Dedicated to Investment Management and Support Services. The Board and the Fund Oversight and Research Committees reviewed the general qualifications and capabilities of Fidelity's investment staff, including its size, education, experience, and resources, as well as Fidelity's approach to recruiting, training, managing, and compensating investment personnel. The Board noted that Fidelity has continued to increase the resources devoted to non-U.S. offices, including expansion of Fidelity's global investment organization. The Board also noted that Fidelity's analysts have extensive resources, tools and capabilities that allow them to conduct sophisticated quantitative and fundamental analysis, as well as credit analysis of issuers, counterparties and guarantors. Further, the Board considered that Fidelity's investment professionals have sufficient access to global information and data so as to provide competitive investment results over time, and that those professionals also have access to sophisticated tools that permit them to assess portfolio construction and risk and performance attribution characteristics continuously, as well as to transmit new information and research conclusions rapidly around the world. Additionally, in its deliberations, the Board considered Fidelity's trading, risk management, compliance, and technology and operations capabilities and resources, which are integral parts of the investment management process.
Shareholder and Administrative Services. The Board considered (i) the nature, extent, quality, and cost of advisory, administrative, and shareholder services performed by the Investment Advisers and their affiliates under the Advisory Contracts and under separate agreements covering transfer agency, pricing and bookkeeping, and securities lending services for each fund; (ii) the nature and extent of the supervision of third party service providers, principally custodians, subcustodians, and pricing vendors; and (iii) the resources devoted to, and the record of compliance with, each fund's compliance policies and procedures. The Board also reviewed the allocation of fund brokerage, including allocations to brokers affiliated with the Investment Advisers, the use of brokerage commissions to pay fund expenses, and the use of "soft" commission dollars to pay for research services.
The Board noted that the growth of fund assets over time across the complex allows Fidelity to reinvest in the development of services designed to enhance the value and convenience of the Fidelity funds as investment vehicles. These services include 24-hour access to account information and market information through telephone representatives and over the Internet, investor education materials and asset allocation tools, and the expanded availability of Fidelity Investor Centers.
The Board noted that it and the boards of certain other Fidelity funds had formed an ad hoc Committee on Transfer Agency Fees to review the variety of transfer agency fee structures throughout the industry and Fidelity's competitive positioning with respect to industry participants.
Investment in a Large Fund Family. The Board considered the benefits to shareholders of investing in a Fidelity fund, including the benefits of investing in a fund that is part of a large family of funds offering a variety of investment disciplines and providing a large variety of mutual fund investor services. The Board noted that Fidelity had taken, or had made recommendations that resulted in the Fidelity funds taking, a number of actions over the previous year that benefited particular funds, including: (i) continuing to dedicate additional resources to Fidelity's investment research process, which includes meetings with management of issuers of securities in which the funds invest, and to the support of the senior management team that oversees asset management; (ii) continuing efforts to enhance Fidelity's global research capabilities; (iii) launching new funds and making other enhancements to meet client needs; (iv) launching new share classes of existing funds; (v) eliminating purchase minimums and broadening eligibility requirements for certain funds and share classes; (vi) reducing management fees and total expenses for certain growth equity funds and index funds; (vii) lowering expense caps for certain existing funds and classes, and converting certain voluntary expense caps to contractual caps, to reduce expenses borne by shareholders; (viii) eliminating short-term redemption fees for funds that had such fees; (ix) rationalizing product lines and gaining increased efficiencies from fund mergers and share class consolidations; (x) continuing to develop, acquire and implement systems and technology to improve services to the funds and shareholders, strengthen information security, and increase efficiency; and (xi) continuing to implement enhancements to further strengthen Fidelity's product line to increase investors' probability of success in achieving their investment goals, including retirement income goals.
Investment Performance. The Board considered whether each fund has operated in accordance with its investment objective, as well as its record of compliance with its investment restrictions and its performance history. Brokerage and Investment Management Portfolio had a portfolio manager change in October 2018. Consumer Finance Portfolio had a portfolio manager change in August 2018. The Board will continue to monitor closely each fund's performance, taking into account the portfolio manager changes.
The Board took into account discussions that occur at Board meetings throughout the year with representatives of the Investment Advisers about fund investment performance. In this regard the Board noted that as part of regularly scheduled fund reviews and other reports to the Board on fund performance, the Board considers annualized return information for each fund for different time periods, measured against an appropriate securities market index ("benchmark index"). In its evaluation of fund investment performance, the Board gave particular attention to information indicating changes in performance of certain Fidelity funds for specific time periods and discussed with the Investment Advisers the reasons for any overperformance or underperformance.
In addition to reviewing absolute and relative fund performance, the Independent Trustees periodically consider the appropriateness of fund performance metrics in evaluating the results achieved. In general, the Independent Trustees believe that fund performance should be evaluated based on net performance (after fees and expenses) of both the highest performing and lowest performing fund share classes, where applicable, compared to appropriate benchmark indices, over appropriate time periods that may include full market cycles, taking into account relevant factors including the following: general market conditions; issuer-specific information; and fund cash flows and other factors.
The Independent Trustees recognize that shareholders evaluate performance on a net basis over their own holding periods, for which one-, three-, and five-year periods are often used as a proxy. For this reason, the performance information reviewed by the Board also included net cumulative total return information for each fund and an appropriate benchmark index for the most recent one-, three-, and five-year periods ended June 30, 2018, as shown below.
Banking Portfolio
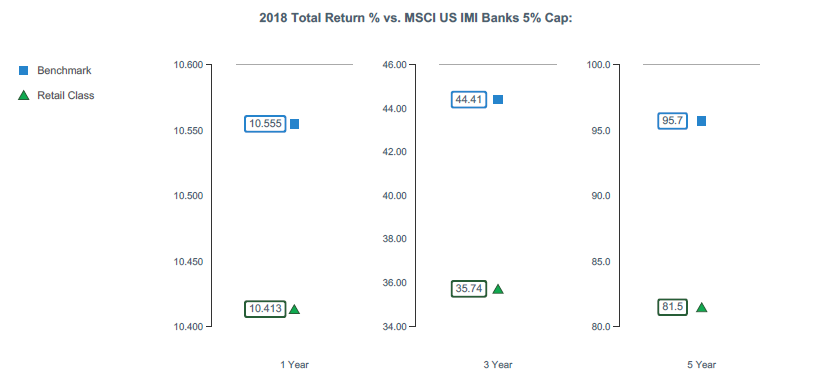
The Board considered the fund's underperformance for different time periods based on the June 30, 2018 data presented above and noted that the fund's underperformance has continued since the Board approved the management contract in in 2017 and 2018. The Board's discussions with SelectCo regarding underperformance cover topics including, but not limited to: the longer-term track record of a fund's portfolio manager(s); broader trends in the market that may adversely impact a fund's performance; attribution reports on contributors to the fund's underperformance; and the applicable portfolio manager's explanation of his or her underperformance. The Board engages with SelectCo on steps that might be taken to address a fund's underperformance. For a fund with underperformance over longer periods of time, the Board typically monitors the effect of any remedial actions and other relevant factors.
Brokerage and Investment Management Portfolio
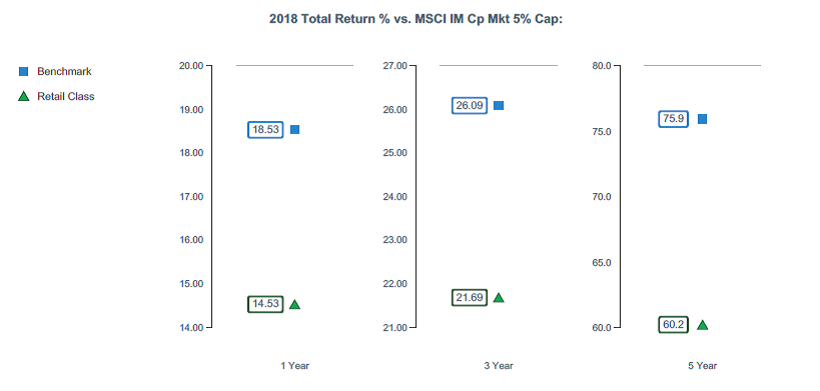
The Board considered the fund's underperformance for different time periods based on the June 30, 2018 data presented above and based on earlier periods ended prior to June 30, 2018. The Board noted that the fund's underperformance has continued since the Board approved the management contract in 2018. The Board's discussions with SelectCo regarding underperformance cover topics including, but not limited to: the longer-term track record of a fund's portfolio manager(s); broader trends in the market that may adversely impact a fund's performance; attribution reports on contributors to the fund's underperformance; and the applicable portfolio manager's explanation of his or her underperformance. The Board engages with SelectCo on steps that might be taken to address a fund's underperformance. For a fund with underperformance over longer periods of time, the Board typically monitors the effect of any remedial actions and other relevant factors.
Consumer Finance Portfolio
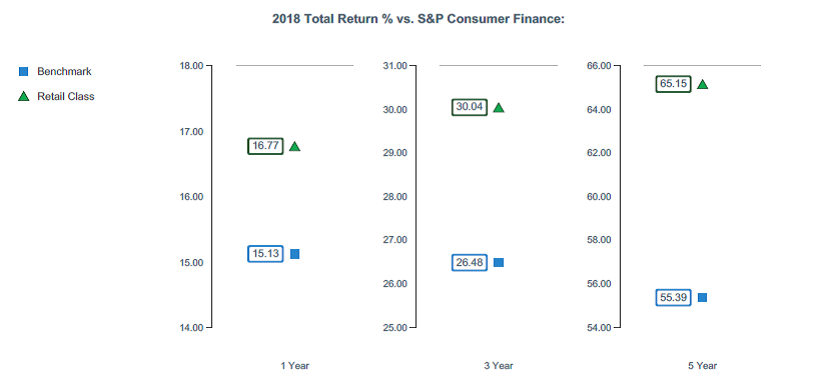
Financial Services Portfolio
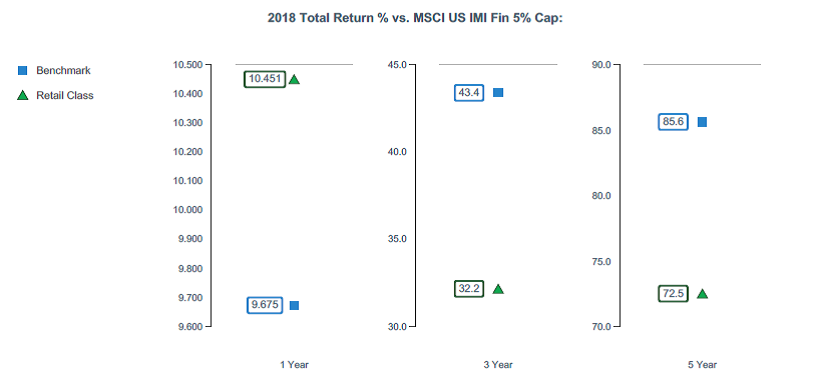
Insurance Portfolio
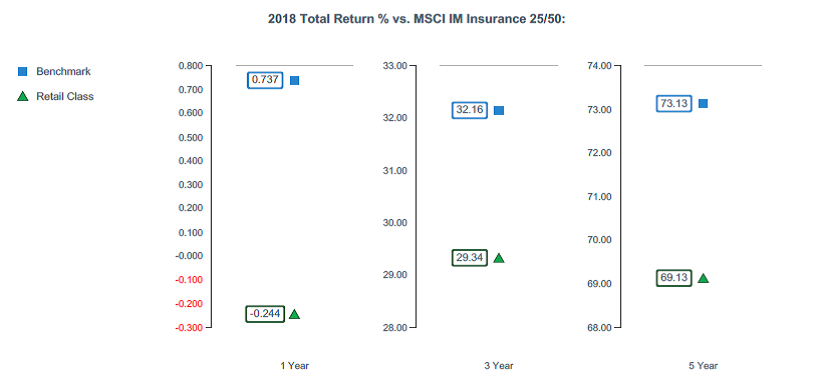
The Board considered the fund’s underperformance for different time periods based on the June 30, 2018 data presented above and based on earlier periods ended prior to June 30, 2018. The Board noted that the fund’s underperformance has continued since the Board approved the management contract in 2018. The Board’s discussions with SelectCo regarding underperformance cover topics including, but not limited to: the longer-term track record of a fund’s portfolio manager(s); broader trends in the market that may adversely impact a fund’s performance; attribution reports on contributors to the fund’s underperformance; and the applicable portfolio manager’s explanation of his or her underperformance. The Board engages with SelectCo on steps that might be taken to address a fund’s underperformance. For a fund with underperformance over longer periods of time, the Board typically monitors the effect of any remedial actions and other relevant factors
Based on its review, the Board concluded that the nature, extent, and quality of services provided to each fund under the Advisory Contracts should continue to benefit the shareholders of each fund.
Competitiveness of Management Fee and Total Expense Ratio. The Board considered each fund's management fee and total expense ratio compared to "mapped groups" of competitive funds and classes created for the purpose of facilitating the Trustees' competitive analysis of management fees and total expenses. Fidelity creates "mapped groups" by combining similar Lipper investment objective categories that have comparable investment mandates. For this purpose, all sector focused equity funds are grouped in the same mapped group. Combining Lipper investment objective categories aids the Board's management fee and total expense ratio comparisons by broadening the competitive group used for comparison.
Management Fee. The Board considered two proprietary management fee comparisons for the 12-month periods ended June 30 shown in basis points (BP) in the charts below. The group of Lipper funds used by the Board for management fee comparisons is referred to below as the "Total Mapped Group." The Total Mapped Group comparison focuses on a fund's standing in terms of gross management fees before expense reimbursements or caps relative to the total universe of funds with comparable investment mandates (i.e., sector equities), regardless of whether their management fee structures also are comparable. Funds with comparable management fee structures have similar management fee contractual arrangements (
e.g., flat rate charged for advisory services, all-inclusive fee rate,
etc.). "TMG %" represents the percentage of funds in the Total Mapped Group that had management fees that were lower than a fund's. For example, a hypothetical TMG % of 20% would mean that 80% of the funds in the Total Mapped Group had higher, and 20% had lower, management fees than a fund. The funds' actual TMG %s and the number of funds in the Total Mapped Group are in the charts below. The "Asset-Size Peer Group" (ASPG) comparison focuses on a fund's standing relative to a subset of non-Fidelity funds within the Total Mapped Group that are similar in size and management fee structure. For example, if a fund is in the first quartile of the ASPG, the fund's management fee ranks in the least expensive or lowest 25% of funds in the ASPG. The ASPG represents at least 15% of the funds in the Total Mapped Group with comparable asset size and management fee structures, subject to a minimum of 50 funds (or all funds in the Total Mapped Group if fewer than 50). Additional information, such as the ASPG quartile in which a fund's management fee rate ranked, is also included in the charts and was considered by the Board.
Banking Portfolio
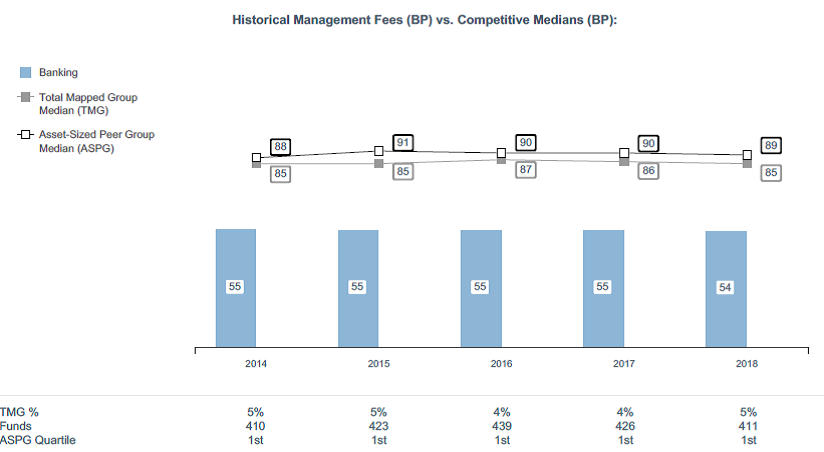
Brokerage and Investment Management Portfolio
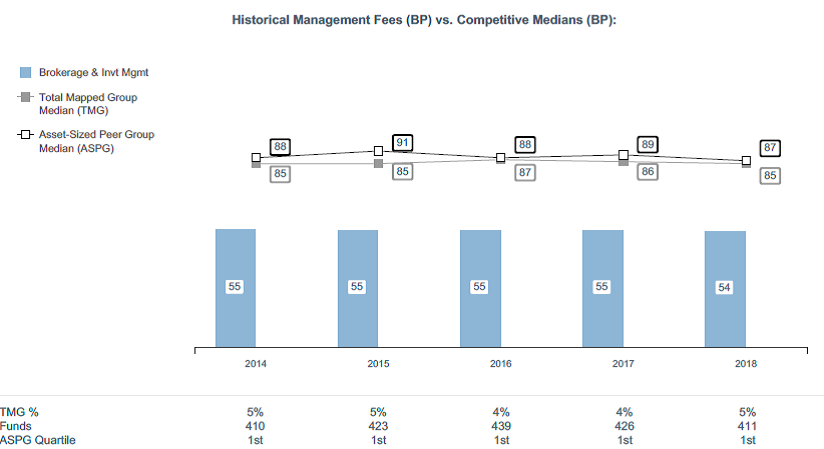
Consumer Finance Portfolio
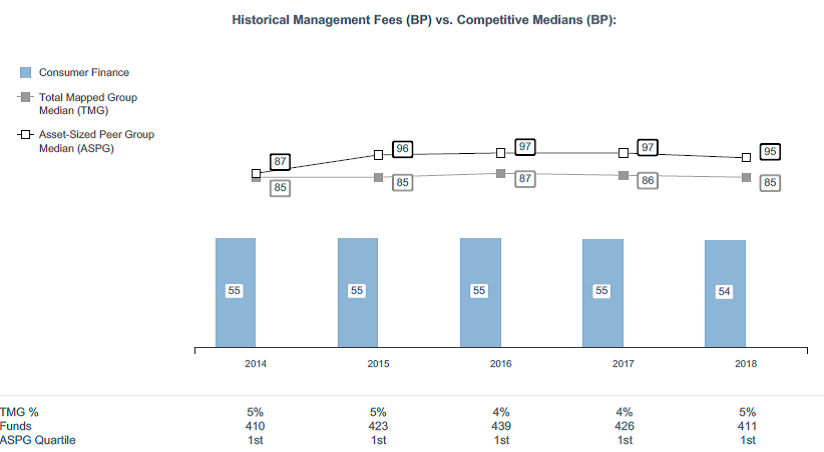
Financial Services Portfolio
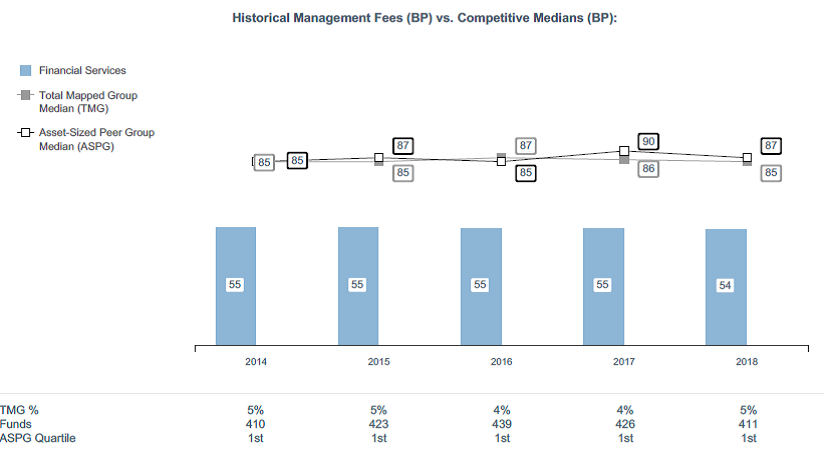
Insurance Portfolio
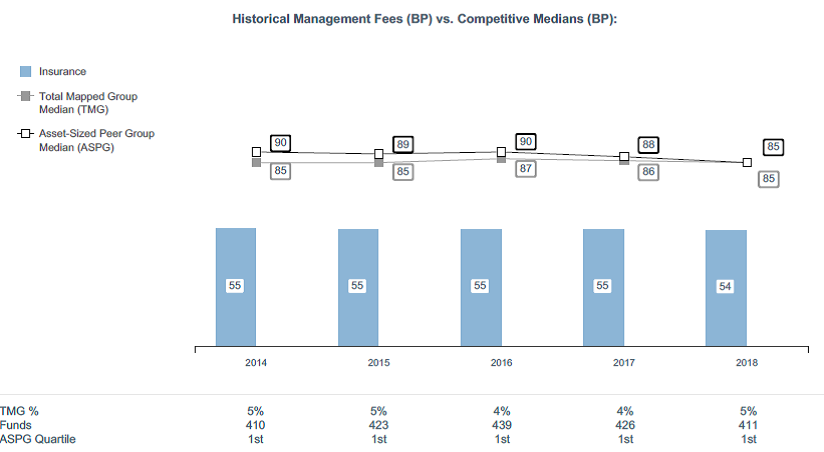
The Board noted that each fund's management fee rate ranked below the median of its Total Mapped Group and below the median of its ASPG for the 12-month period ended June 30, 2018.
The Board noted that it and the boards of other Fidelity funds formed an ad hoc Committee on Group Fee, which meets periodically, to conduct an in-depth review of the "group fee" component of the management fee of funds with such management fee structures. The Committee's focus included the mechanics of the group fee, the competitive landscape of group fee structures, Fidelity funds with no group fee component and investment products not included in group fee assets. The Board also considered that, for funds subject to the group fee, FMR agreed to voluntarily waive fees over a specified period of time in amounts designed to account for assets converted from certain funds to certain collective investment trusts.
Based on its review, the Board concluded that each fund's management fee is fair and reasonable in light of the services that the fund receives and the other factors considered.
Total Expense Ratio. In its review of each fund's total expense ratio, the Board considered the fund's management fee rate as well as other fund expenses, such as transfer agent fees, pricing and bookkeeping fees, and custodial, legal, and audit fees. The Board also noted that Fidelity may agree to waive fees and expenses from time to time, and the extent to which, if any, it has done so for each fund. As part of its review, the Board also considered the current and historical total expense ratios of each fund compared to competitive fund median expenses. Each fund is compared to those funds and classes in the Total Mapped Group (used by the Board for management fee comparisons) that have a similar sales load structure.
The Board noted that each fund's total expense ratio ranked below the competitive median for the 12-month period ended June 30, 2018.
Fees Charged to Other Fidelity Clients. The Board also considered Fidelity fee structures and other information with respect to clients of Fidelity, such as other funds advised or subadvised by Fidelity, pension plan clients, and other institutional clients with similar mandates. The Board noted that a joint ad hoc committee created by it and the boards of other Fidelity funds periodically reviews and compares Fidelity's institutional investment advisory business with its business of providing services to the Fidelity funds and also noted the most recent findings of the committee. The Board noted that the committee's review included a consideration of the differences in services provided, fees charged, and costs incurred, as well as competition in the markets serving the different categories of clients.
Based on its review of total expense ratios and fees charged to other Fidelity clients, the Board concluded that each fund's total expense ratio was reasonable in light of the services that the fund and its shareholders receive and the other factors considered.
Costs of the Services and Profitability. The Board considered the revenues earned and the expenses incurred by Fidelity in conducting the business of developing, marketing, distributing, managing, administering and servicing each fund and servicing each fund's shareholders. The Board also considered the level of Fidelity's profits in respect of all the Fidelity funds.
On an annual basis, Fidelity presents to the Board information about the profitability of its relationships with each fund. Fidelity calculates profitability information for each fund, as well as aggregate profitability information for groups of Fidelity funds and all Fidelity funds, using a series of detailed revenue and cost allocation methodologies which originate with the books and records of Fidelity on which Fidelity's audited financial statements are based. The Audit Committee of the Board reviews any significant changes from the prior year's methodologies.
PricewaterhouseCoopers LLP (PwC), auditor to Fidelity and certain Fidelity funds, has been engaged annually by the Board as part of the Board's assessment of Fidelity's profitability analysis. PwC's engagement includes the review and assessment of the methodologies used by Fidelity in determining the revenues and expenses attributable to Fidelity's mutual fund business, and completion of agreed-upon procedures in respect of the mathematical accuracy of the fund profitability information and its conformity to established allocation methodologies. After considering PwC's reports issued under the engagement and information provided by Fidelity, the Board concluded that while other allocation methods may also be reasonable, Fidelity's profitability methodologies are reasonable in all material respects.
The Board also reviewed Fidelity's non-fund businesses and potential indirect benefits such businesses may have received as a result of their association with Fidelity's mutual fund business (i.e., fall-out benefits) as well as cases where Fidelity's affiliates may benefit from the funds' business. The Board noted that changes to fall-out benefits year-over-year reflect business developments at Fidelity's various businesses.
The Board considered the costs of the services provided by and the profits realized by Fidelity in connection with the operation of each fund and was satisfied that the profitability was not excessive.
Economies of Scale. The Board considered whether there have been economies of scale in respect of the management of the Fidelity funds, whether the Fidelity funds (including each fund) have appropriately benefited from any such economies of scale, and whether there is potential for realization of any further economies of scale. The Board considered the extent to which each fund will benefit from economies of scale as assets grow through increased services to the fund, through waivers or reimbursements, or through fee or expense ratio reductions. The Board also noted that a committee (the Economies of Scale Committee) created by it and the boards of other Fidelity funds periodically analyzes whether Fidelity attains economies of scale in respect of the management and servicing of the Fidelity funds, whether the Fidelity funds have appropriately benefited from such economies of scale, and whether there is potential for realization of any further economies of scale.
The Board recognized that each fund's management contract incorporates a "group fee" structure, which provides for lower group fee rates as total group assets increase, and for higher group fee rates as total group assets decrease (with "group assets" defined to include fund assets under SelectCo's management plus assets under FMR's management). SelectCo calculates the group fee rates based on a tiered asset "breakpoint" schedule that varies based on asset class. The Board considered that the group fee is designed to deliver the benefits of economies of scale to fund shareholders when total group assets increase, even if assets of any particular fund are unchanged or have declined, because some portion of Fidelity's costs are attributable to services provided to all Fidelity funds, and all funds benefit if those costs can be allocated among more assets. The Board concluded that, given the group fee structure, fund shareholders will benefit from lower management fees as group assets increase at the fund complex level, regardless of whether Fidelity achieves any such economies of scale.
The Board concluded, taking into account the analysis of the Economies of Scale Committee, that economies of scale, if any, are being appropriately shared between fund shareholders and Fidelity.
Additional Information Requested by the Board. In order to develop fully the factual basis for consideration of the Fidelity funds' advisory contracts, the Board requested and received additional information on certain topics, including: (i) fund performance trends, in particular the underperformance of certain funds, and Fidelity's long-term strategies for certain funds; (ii) Fidelity's fund profitability methodology, profitability trends for certain funds, and the impact of certain factors on fund profitability results; (iii) metrics for evaluating index fund and ETF performance and information about ETF trading characteristics; (iv) the methodology with respect to the evaluation of competitive fund data and peer group classifications and fee comparisons; (v) the expense structures for different funds and classes; (vi) information regarding other accounts managed by Fidelity, including collective investment trusts; and (vii) Fidelity's philosophies and strategies for evaluating funds and classes with lower or declining asset levels.
Based on its evaluation of all of the conclusions noted above, and after considering all factors it believed relevant, the Board concluded that the advisory fee arrangements are fair and reasonable, and that each fund's Advisory Contracts should be renewed.
SELFIN-ANN-0419
1.813663.114
Fidelity® Select Portfolios®
Health Care Sector Biotechnology Portfolio
Health Care Portfolio
Health Care Services Portfolio
Medical Technology and Devices Portfolio
Pharmaceuticals Portfolio
Annual Report February 28, 2019 |
|
Beginning on January 1, 2021, as permitted by regulations adopted by the Securities and Exchange Commission, paper copies of a fund’s shareholder reports will no longer be sent by mail, unless you specifically request paper copies of the reports from the fund or from your financial intermediary, such as a financial advisor, broker-dealer or bank. Instead, the reports will be made available on a website, and you will be notified by mail each time a report is posted and provided with a website link to access the report.
If you already elected to receive shareholder reports electronically, you will not be affected by this change and you need not take any action. You may elect to receive shareholder reports and other communications from a fund electronically, by contacting your financial intermediary. For Fidelity customers, visit Fidelity's web site or call Fidelity using the contact information listed below.
You may elect to receive all future reports in paper free of charge. If you wish to continue receiving paper copies of your shareholder reports, you may contact your financial intermediary or, if you are a Fidelity customer, visit Fidelity’s website, or call Fidelity at the applicable toll-free number listed below. Your election to receive reports in paper will apply to all funds held with the fund complex/your financial intermediary.
| Account Type | Website | Phone Number |
| Brokerage, Mutual Fund, or Annuity Contracts: | fidelity.com/mailpreferences | 1-800-343-3548 |
| Employer Provided Retirement Accounts: | netbenefits.fidelity.com/preferences (choose 'no' under Required Disclosures to continue to print) | 1-800-343-0860 |
| Advisor Sold Accounts Serviced Through Your Financial Intermediary: | Contact Your Financial Intermediary | Your Financial Intermediary's phone number |
| Advisor Sold Accounts Serviced by Fidelity: | institutional.fidelity.com | 1-877-208-0098 |
Contents
To view a fund's proxy voting guidelines and proxy voting record for the 12-month period ended June 30, visit http://www.fidelity.com/proxyvotingresults or visit the Securities and Exchange Commission's (SEC) web site at http://www.sec.gov.
You may also call 1-800-544-8544 to request a free copy of the proxy voting guidelines.
Standard & Poor's, S&P and S&P 500 are registered service marks of The McGraw-Hill Companies, Inc. and have been licensed for use by Fidelity Distributors Corporation.
Other third-party marks appearing herein are the property of their respective owners.
All other marks appearing herein are registered or unregistered trademarks or service marks of FMR LLC or an affiliated company. © 2019 FMR LLC. All rights reserved.
This report and the financial statements contained herein are submitted for the general information of the shareholders of the Funds. This report is not authorized for distribution to prospective investors in the Funds unless preceded or accompanied by an effective prospectus.
A fund files its complete schedule of portfolio holdings with the SEC for the first and third quarters of each fiscal year on Form N-Q. Forms N-Q are available on the SEC’s web site at http://www.sec.gov. A fund's Forms N-Q may be reviewed and copied at the SEC’s Public Reference Room in Washington, DC. Information regarding the operation of the SEC's Public Reference Room may be obtained by calling 1-800-SEC-0330.
For a complete list of a fund's portfolio holdings, view the most recent holdings listing, semiannual report, or annual report on Fidelity's web site at http://www.fidelity.com, http://www.institutional.fidelity.com, or http://www.401k.com, as applicable.
NOT FDIC INSURED •MAY LOSE VALUE •NO BANK GUARANTEE
Neither the Funds nor Fidelity Distributors Corporation is a bank.
Biotechnology Portfolio
Performance: The Bottom Line
Average annual total return reflects the change in the value of an investment, assuming reinvestment of distributions from dividend income and capital gains (the profits earned upon the sale of securities that have grown in value, if any) and assuming a constant rate of performance each year. The hypothetical investment and the average annual total returns do not reflect the deduction of taxes that a shareholder would pay on fund distributions or the redemption of fund shares. During periods of reimbursement by Fidelity, a fund’s total return will be greater than it would be had the reimbursement not occurred. How a fund did yesterday is no guarantee of how it will do tomorrow.
Average Annual Total Returns
| For the periods ended February 28, 2019 | Past 1 year | Past 5 years | Past 10 years |
| Biotechnology Portfolio | (0.46)% | 5.50% | 18.99% |
$10,000 Over 10 Years
Let's say hypothetically that $10,000 was invested in Biotechnology Portfolio on February 29, 2009.
The chart shows how the value of your investment would have changed, and also shows how the S&P 500® Index performed over the same period.
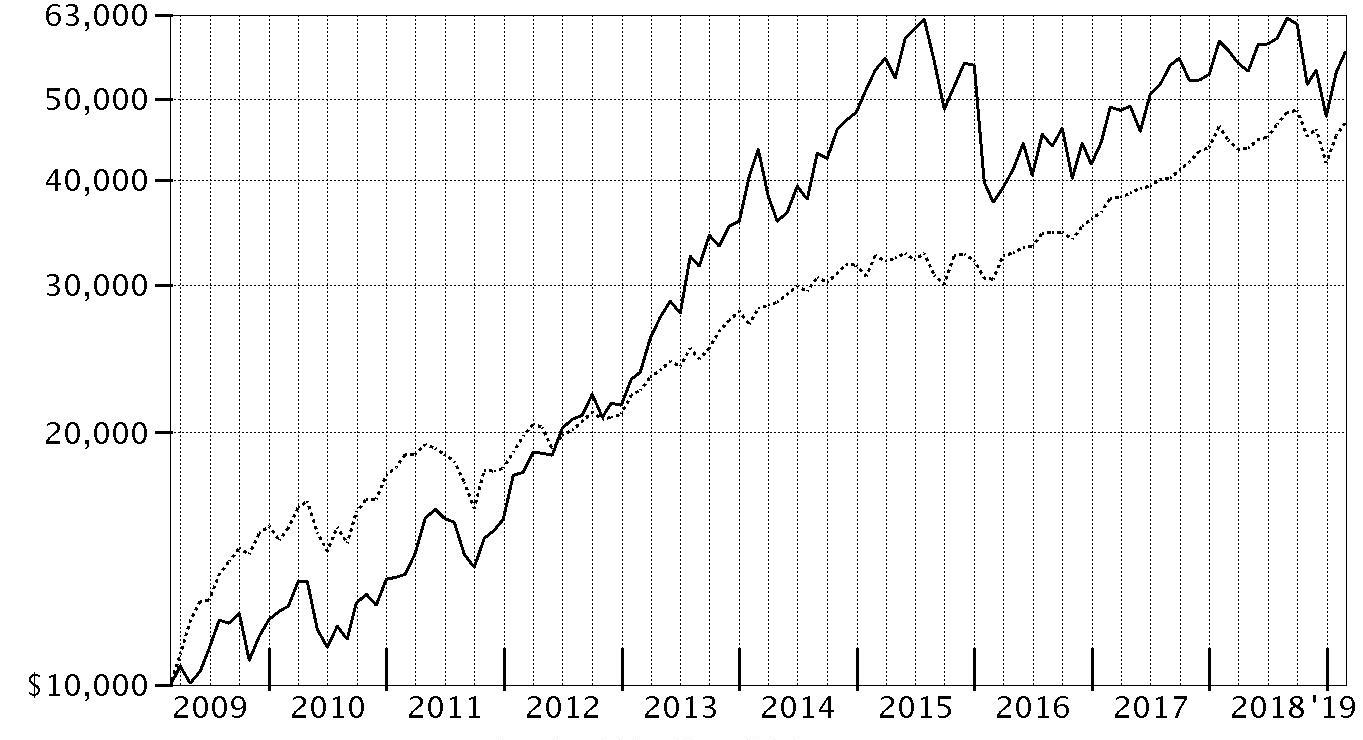
| Period Ending Values |
| $56,899 | Biotechnology Portfolio |
| $46,739 | S&P 500® Index |
Biotechnology Portfolio
Management's Discussion of Fund Performance
Market Recap: The S&P 500
® index gained 4.68% for the 12 months ending February 28, 2019, as the U.S. equity bellwether began the new year on a high note after enduring a final quarter of 2018 in which resurgent volatility upset the aging bull market. In October, rising U.S. Treasury yields and concern about peaking corporate earnings growth sent many investors fleeing from risk assets as they were still dealing with lingering uncertainty related to global trade and the U.S. Federal Reserve picking up the pace of interest rate hikes. The index returned -6.84% in October, at the time its largest monthly drop in seven years. But conditions worsened through Christmas, as jitters about the economy and another hike in rates led to a spike in market volatility and a -9.03% result for December. Sharply reversing course to begin 2019, the S&P 500
® gained 11.48% year-to-date, its strongest two-month opening since 1991, amid upbeat company earnings/outlooks and signs the Fed may pause on rates. For the full period, some economically sensitive sectors fared worst, with financials (-6%) and materials (-6%) both losing ground. Energy gained 1%, while communication services and industrials each rose roughly 2%. In contrast, the defensive utilities (+20%), real estate (+20%) and health care (+11%) sectors led the way, while consumer staples finished near the index. Information technology and consumer discretionary were rattled in the late-2018 downturn, but earlier strength contributed to advances of 9% and roughly 7%, respectively.
Comments from Portfolio Manager Rajiv Kaul: For the fiscal year, the fund returned -0.46%, well ahead of the -3.77% result of the MSCI U.S. IMI Biotechnology 25/50 Index, but behind the broad-based S&P 500
®. Versus the MSCI index, stock selection in the fund’s core category of biotechnology represented virtually all of the fund’s outperformance the past 12 months. Modest non-index exposure to health care equipment also helped a bit. The top individual relative contributor was a sizable underweighting in AbbVie, as its shares suffered a sizable drop in late March, after the company announced that it wouldn't be seeking an accelerated approval for Rova-T, its expensive experimental lung-cancer drug. I exited most of our AbbVie position in the first half of the period. However, I added to our holdings here later, when I thought selling in AbbVie became overdone, although it remained an underweighting at period end. Timely ownership of Loxo Oncology, which I exited by February 28, also helped, as did an overweighting in Spark Therapeutics. Conversely, non-index holdings in pharmaceuticals stocks detracted versus the index this period. A sizable underweighting in the strong-performing stock of Amgen was the biggest individual relative detractor. I thought there were better opportunities elsewhere. A small non-index stake in Nektar Therapeutics also detracted from our relative result, as did an overweighting in La Jolla Pharmaceutical.
The views expressed above reflect those of the portfolio manager(s) only through the end of the period as stated on the cover of this report and do not necessarily represent the views of Fidelity or any other person in the Fidelity organization. Any such views are subject to change at any time based upon market or other conditions and Fidelity disclaims any responsibility to update such views. These views may not be relied on as investment advice and, because investment decisions for a Fidelity fund are based on numerous factors, may not be relied on as an indication of trading intent on behalf of any Fidelity fund.
Biotechnology Portfolio
Investment Summary (Unaudited)
Top Ten Stocks as of February 28, 2019
| | % of fund's net assets |
| Amgen, Inc. | 7.9 |
| AbbVie, Inc. | 4.8 |
| Gilead Sciences, Inc. | 4.6 |
| Alexion Pharmaceuticals, Inc. | 4.1 |
| Biogen, Inc. | 3.8 |
| Regeneron Pharmaceuticals, Inc. | 3.1 |
| Vertex Pharmaceuticals, Inc. | 2.6 |
| Ionis Pharmaceuticals, Inc. | 2.4 |
| Sarepta Therapeutics, Inc. | 2.2 |
| Neurocrine Biosciences, Inc. | 1.8 |
| | 37.3 |
Top Industries (% of fund's net assets)
| As of February 28, 2019 |
| | Biotechnology | 89.2% |
| | Pharmaceuticals | 7.7% |
| | Health Care Equipment & Supplies | 0.7% |
| | Health Care Providers & Services | 0.2% |
| | Health Care Technology | 0.2% |
| | All Others* | 2.0% |

* Includes short-term investments and net other assets (liabilities).
Biotechnology Portfolio
Schedule of Investments February 28, 2019
Showing Percentage of Net Assets
| Common Stocks - 97.1% | | | |
| | | Shares | Value |
| Biotechnology - 88.4% | | | |
| Biotechnology - 88.4% | | | |
| AbbVie, Inc. | | 4,574,700 | $362,499,228 |
| Abeona Therapeutics, Inc. (a) | | 104,573 | 734,102 |
| AC Immune SA (a)(b) | | 1,008,632 | 4,659,880 |
| ACADIA Pharmaceuticals, Inc. (a)(b) | | 2,882,880 | 76,396,320 |
| Acceleron Pharma, Inc. (a) | | 1,994,958 | 87,857,950 |
| Acorda Therapeutics, Inc. (a) | | 1,876,490 | 27,659,463 |
| Agios Pharmaceuticals, Inc. (a)(b) | | 782,733 | 50,775,890 |
| Aimmune Therapeutics, Inc. (a)(b) | | 929,243 | 22,385,464 |
| Akebia Therapeutics, Inc. (a) | | 211,668 | 1,540,943 |
| Albireo Pharma, Inc. (a) | | 420,100 | 11,813,212 |
| Alder Biopharmaceuticals, Inc. (a) | | 570,448 | 7,313,143 |
| Aldeyra Therapeutics, Inc. (a)(c) | | 1,895,633 | 15,316,715 |
| Alector, Inc. | | 661,607 | 12,960,881 |
| Alexion Pharmaceuticals, Inc. (a) | | 2,296,660 | 310,806,998 |
| Alkermes PLC (a) | | 896,174 | 29,815,709 |
| Allakos, Inc. (a)(b) | | 662,753 | 26,483,610 |
| Allena Pharmaceuticals, Inc. (a)(c) | | 41,840 | 302,085 |
| Allena Pharmaceuticals, Inc. (c)(d) | | 1,447,443 | 10,450,538 |
| Allogene Therapeutics, Inc. (b) | | 131,766 | 4,175,665 |
| Alnylam Pharmaceuticals, Inc. (a) | | 1,485,678 | 126,282,630 |
| Amarin Corp. PLC ADR (a)(b) | | 701,531 | 14,360,340 |
| Amgen, Inc. | | 3,169,122 | 602,386,708 |
| Amicus Therapeutics, Inc. (a) | | 4,608,894 | 55,767,617 |
| AnaptysBio, Inc. (a) | | 465,116 | 32,032,539 |
| Anchiano Therapeutics Ltd. ADR | | 43,000 | 344,000 |
| Apellis Pharmaceuticals, Inc. (a) | | 363,134 | 5,501,480 |
| Arena Pharmaceuticals, Inc. (a) | | 1,002,973 | 50,068,412 |
| Argenx SE ADR (a) | | 896,586 | 119,505,948 |
| Array BioPharma, Inc. (a) | | 5,262,449 | 120,720,580 |
| Arrowhead Pharmaceuticals, Inc. (a)(b) | | 1,712,445 | 33,426,926 |
| Ascendis Pharma A/S sponsored ADR (a) | | 546,977 | 39,830,865 |
| Atara Biotherapeutics, Inc. (a) | | 1,054,543 | 37,763,185 |
| aTyr Pharma, Inc. (a)(b) | | 970,388 | 465,786 |
| Audentes Therapeutics, Inc. (a) | | 508,414 | 15,567,637 |
| Bellicum Pharmaceuticals, Inc. (a) | | 756,358 | 2,427,909 |
| BioCryst Pharmaceuticals, Inc. (a) | | 3,328,837 | 27,496,194 |
| Biogen, Inc. (a) | | 867,344 | 284,497,505 |
| Biohaven Pharmaceutical Holding Co. Ltd. (a) | | 456,090 | 20,058,838 |
| BioMarin Pharmaceutical, Inc. (a) | | 869,571 | 81,096,191 |
| bluebird bio, Inc. (a) | | 437,819 | 67,958,265 |
| Blueprint Medicines Corp. (a) | | 1,569,611 | 129,006,328 |
| Cara Therapeutics, Inc. (a)(b) | | 575,786 | 9,817,151 |
| ChemoCentryx, Inc. (a) | | 644,305 | 6,926,279 |
| Chimerix, Inc. (a) | | 1,849,867 | 3,755,230 |
| Clovis Oncology, Inc. (a)(b) | | 917,270 | 27,774,936 |
| Coherus BioSciences, Inc. (a) | | 602,387 | 8,638,230 |
| Constellation Pharmaceuticals, Inc. | | 271,700 | 2,744,170 |
| Corbus Pharmaceuticals Holdings, Inc. (a)(b) | | 1,550,467 | 10,760,241 |
| Corvus Pharmaceuticals, Inc. (a) | | 845,556 | 4,092,491 |
| Crinetics Pharmaceuticals, Inc. (a)(b) | | 994,400 | 23,766,160 |
| CRISPR Therapeutics AG (a)(b) | | 62,936 | 2,227,305 |
| Cytokinetics, Inc. (a) | | 728,649 | 5,260,846 |
| CytomX Therapeutics, Inc. (a) | | 120,181 | 1,348,431 |
| CytomX Therapeutics, Inc. (a)(d) | | 287,485 | 3,225,582 |
| Denali Therapeutics, Inc. (a)(b) | | 651,052 | 14,166,892 |
| Dicerna Pharmaceuticals, Inc. (a) | | 884,748 | 10,802,773 |
| Dynavax Technologies Corp. (a)(b) | | 1,087,298 | 10,003,142 |
| Eagle Pharmaceuticals, Inc. (a)(b) | | 164,108 | 8,216,888 |
| Editas Medicine, Inc. (a)(b) | | 113,518 | 2,341,876 |
| Emergent BioSolutions, Inc. (a) | | 420,050 | 24,509,918 |
| Enanta Pharmaceuticals, Inc. (a) | | 222,457 | 22,810,741 |
| Epizyme, Inc. (a) | | 2,837,946 | 36,779,780 |
| Equillium, Inc. (b) | | 647,243 | 5,093,802 |
| Esperion Therapeutics, Inc. (a)(b) | | 393,884 | 18,158,052 |
| Evelo Biosciences, Inc. (b) | | 89,800 | 789,342 |
| Exact Sciences Corp. (a) | | 1,200,800 | 109,272,800 |
| Exelixis, Inc. (a) | | 1,879,440 | 42,080,662 |
| Fate Therapeutics, Inc. (a) | | 1,323,187 | 20,787,268 |
| FibroGen, Inc. (a) | | 1,359,619 | 78,585,978 |
| Five Prime Therapeutics, Inc. (a) | | 460,300 | 5,330,274 |
| Forty Seven, Inc. | | 270,500 | 4,517,350 |
| Galapagos Genomics NV sponsored ADR (a) | | 371,032 | 36,220,144 |
| Genmab A/S (a) | | 289,883 | 50,029,526 |
| Genomic Health, Inc. (a) | | 446,639 | 33,931,165 |
| Geron Corp. (a)(b)(c) | | 15,536,850 | 22,683,801 |
| Gilead Sciences, Inc. | | 5,386,081 | 350,202,987 |
| Global Blood Therapeutics, Inc. (a) | | 1,237,343 | 64,960,508 |
| Gossamer Bio, Inc. | | 117,200 | 2,558,476 |
| Gritstone Oncology, Inc. (b) | | 1,248,800 | 16,059,568 |
| Halozyme Therapeutics, Inc. (a) | | 2,204,326 | 38,024,624 |
| Heron Therapeutics, Inc. (a)(b) | | 2,130,274 | 56,388,353 |
| Homology Medicines, Inc. (a) | | 26,567 | 783,195 |
| ImmunoGen, Inc. (a) | | 3,846,227 | 18,154,191 |
| Immunomedics, Inc. (a)(b) | | 4,732,183 | 74,579,204 |
| Incyte Corp. (a) | | 620,109 | 53,471,999 |
| Insmed, Inc. (a) | | 566,345 | 16,792,129 |
| Intellia Therapeutics, Inc. (a)(b) | | 91,632 | 1,395,555 |
| Intercept Pharmaceuticals, Inc. (a)(b) | | 720,325 | 71,845,216 |
| Ionis Pharmaceuticals, Inc. (a) | | 2,524,877 | 179,241,018 |
| Iovance Biotherapeutics, Inc. (a) | | 986,200 | 10,128,274 |
| Ironwood Pharmaceuticals, Inc. Class A (a) | | 3,443,420 | 49,034,301 |
| Jounce Therapeutics, Inc. (a) | | 715,474 | 3,183,859 |
| Kaleido Biosciences, Inc. (a) | | 66,633 | 948,188 |
| Kalvista Pharmaceuticals, Inc. (a) | | 46,924 | 1,064,236 |
| Karyopharm Therapeutics, Inc. (a) | | 1,533,800 | 6,334,594 |
| Kezar Life Sciences, Inc. | | 855,972 | 17,419,030 |
| Krystal Biotech, Inc. (a)(b)(c) | | 1,235,400 | 27,623,544 |
| Kura Oncology, Inc. (a)(c) | | 1,959,414 | 29,861,469 |
| La Jolla Pharmaceutical Co. (a)(b) | | 1,189,798 | 6,781,849 |
| Leap Therapeutics, Inc. (a) | | 840,724 | 1,311,529 |
| Lexicon Pharmaceuticals, Inc. (a)(b) | | 1,448,504 | 7,706,041 |
| Ligand Pharmaceuticals, Inc. Class B (a)(b) | | 245,898 | 30,511,024 |
| Macrogenics, Inc. (a) | | 1,222,331 | 24,446,620 |
| Madrigal Pharmaceuticals, Inc. (a)(b) | | 34,241 | 4,495,158 |
| MannKind Corp. (a)(b) | | 1,402,861 | 2,511,121 |
| MediciNova, Inc. (a)(b) | | 96,484 | 882,829 |
| Minerva Neurosciences, Inc. (a)(c) | | 2,776,114 | 22,014,584 |
| Miragen Therapeutics, Inc. (a)(b)(c) | | 2,888,656 | 8,088,237 |
| Mirati Therapeutics, Inc. (a) | | 653,067 | 47,543,278 |
| Moderna, Inc. | | 1,400 | 31,640 |
| Moderna, Inc. | | 2,189,866 | 44,541,874 |
| Momenta Pharmaceuticals, Inc. (a) | | 1,314,056 | 18,515,049 |
| Morphosys AG (a) | | 141,175 | 14,500,329 |
| Morphosys AG sponsored ADR | | 835,595 | 21,499,859 |
| Natera, Inc. (a) | | 798,331 | 12,645,563 |
| Neon Therapeutics, Inc. (b) | | 407,398 | 2,538,090 |
| Neurocrine Biosciences, Inc. (a) | | 1,766,051 | 136,427,440 |
| Oragenics, Inc. (a) | | 155,806 | 137,468 |
| Pharming Group NV (a)(b) | | 19,512,456 | 20,574,249 |
| Portola Pharmaceuticals, Inc. (a)(b) | | 477,303 | 14,657,975 |
| Principia Biopharma, Inc. | | 427,001 | 15,124,375 |
| ProQR Therapeutics BV (a)(b) | | 958,286 | 12,764,370 |
| Protagonist Therapeutics, Inc. (a) | | 630,863 | 5,059,521 |
| Prothena Corp. PLC (a) | | 769,935 | 10,317,129 |
| PTC Therapeutics, Inc. (a) | | 2,242,247 | 77,447,211 |
| Puma Biotechnology, Inc. (a) | | 662,466 | 18,423,179 |
| Ra Pharmaceuticals, Inc. (a) | | 466,834 | 8,995,891 |
| Radius Health, Inc. (a) | | 853,728 | 16,186,683 |
| Regeneron Pharmaceuticals, Inc. (a) | | 546,386 | 235,350,306 |
| REGENXBIO, Inc. (a) | | 743,308 | 38,451,323 |
| Repligen Corp. (a) | | 504,186 | 30,009,151 |
| Replimune Group, Inc. (a) | | 474,410 | 6,508,905 |
| Retrophin, Inc. (a) | | 573,045 | 12,927,895 |
| Rigel Pharmaceuticals, Inc. (a) | | 904,339 | 1,980,502 |
| Rocket Pharmaceuticals, Inc. (a)(b) | | 1,464,787 | 25,501,942 |
| Rubius Therapeutics, Inc. | | 81,800 | 1,298,984 |
| Sage Therapeutics, Inc. (a) | | 844,793 | 134,533,285 |
| Sangamo Therapeutics, Inc. (a)(b) | | 2,444,721 | 22,026,936 |
| Sarepta Therapeutics, Inc. (a) | | 1,151,605 | 166,107,505 |
| Scholar Rock Holding Corp. (b)(c) | | 1,506,547 | 28,051,905 |
| Seattle Genetics, Inc. (a) | | 857,190 | 63,672,073 |
| Selecta Biosciences, Inc. (a)(b) | | 33,646 | 66,956 |
| Seres Therapeutics, Inc. (a)(c) | | 2,320,475 | 14,224,512 |
| Sienna Biopharmaceuticals, Inc. (a)(b) | | 213,431 | 544,249 |
| Solid Biosciences, Inc. (a)(b) | | 317,997 | 3,399,388 |
| Spark Therapeutics, Inc. (a) | | 603,637 | 68,392,072 |
| Spectrum Pharmaceuticals, Inc. (a) | | 2,128,803 | 23,012,360 |
| Stemline Therapeutics, Inc. (a) | | 915,698 | 10,045,207 |
| Surface Oncology, Inc. | | 44,796 | 189,487 |
| Synthorx, Inc. | | 795,878 | 15,845,931 |
| Syros Pharmaceuticals, Inc. (a) | | 617,861 | 4,195,276 |
| Syros Pharmaceuticals, Inc. (a)(d) | | 303,621 | 2,061,587 |
| TG Therapeutics, Inc. (a)(b) | | 2,402,037 | 16,333,852 |
| Translate Bio, Inc. (b) | | 863,951 | 8,812,300 |
| Translate Bio, Inc. (d) | | 1,014,146 | 10,344,289 |
| Twist Bioscience Corp. | | 1,021,131 | 21,118,521 |
| Ultragenyx Pharmaceutical, Inc. (a) | | 1,404,537 | 90,087,003 |
| uniQure B.V. (a) | | 296,462 | 16,005,983 |
| United Therapeutics Corp. (a) | | 82,925 | 10,472,598 |
| UNITY Biotechnology, Inc. | | 51,400 | 514,000 |
| Vanda Pharmaceuticals, Inc. (a) | | 788,692 | 15,963,126 |
| Verastem, Inc. (a)(b) | | 3,282,979 | 9,881,767 |
| Vertex Pharmaceuticals, Inc. (a) | | 1,036,289 | 195,599,549 |
| Viking Therapeutics, Inc. (a)(b) | | 637,500 | 5,361,375 |
| Voyager Therapeutics, Inc. (a) | | 738,062 | 11,070,930 |
| Xencor, Inc. (a) | | 1,349,543 | 40,945,135 |
| Y-mAbs Therapeutics, Inc. (b) | | 1,265,742 | 27,403,314 |
| Zafgen, Inc. (a) | | 1,529,546 | 6,837,071 |
| Zealand Pharma A/S (a)(b) | | 239,844 | 3,543,169 |
| Zymeworks, Inc. (a) | | 578,800 | 8,751,456 |
| | | | 6,702,140,763 |
| Capital Markets - 0.1% | | | |
| Asset Management & Custody Banks - 0.1% | | | |
| Arix Bioscience PLC (a)(d) | | 2,049,700 | 4,309,012 |
| Health Care Equipment & Supplies - 0.7% | | | |
| Health Care Equipment - 0.7% | | | |
| Novocure Ltd. (a) | | 335,689 | 18,029,856 |
| Novocure Ltd. (a)(d) | | 701,713 | 37,689,005 |
| | | | 55,718,861 |
| Health Care Providers & Services - 0.2% | | | |
| Health Care Services - 0.2% | | | |
| G1 Therapeutics, Inc. (a) | | 789,800 | 14,579,708 |
| OptiNose, Inc. (a) | | 162,115 | 1,202,893 |
| Precipio, Inc. (a)(e) | | 7,883 | 1,249 |
| | | | 15,783,850 |
| Life Sciences Tools & Services - 0.0% | | | |
| Life Sciences Tools & Services - 0.0% | | | |
| Evotec OAI AG (a) | | 159,200 | 3,741,155 |
| Personal Products - 0.0% | | | |
| Personal Products - 0.0% | | | |
| MYOS Corp. (a) | | 33,334 | 49,001 |
| Pharmaceuticals - 7.7% | | | |
| Pharmaceuticals - 7.7% | | | |
| Adimab LLC (a)(e)(f)(g) | | 1,954,526 | 82,109,637 |
| Aerie Pharmaceuticals, Inc. (a) | | 643,025 | 30,009,977 |
| Afferent Pharmaceuticals, Inc. rights 12/31/24 (a)(g) | | 8,274,568 | 12,329,106 |
| Akcea Therapeutics, Inc. (a) | | 431,800 | 14,694,154 |
| Aradigm Corp. (a) | | 11,945 | 1,433 |
| Aradigm Corp. (a) | | 148,009 | 17,761 |
| Arvinas Holding Co. LLC (a)(b) | | 611,000 | 11,828,960 |
| Assembly Biosciences, Inc. (a) | | 294,833 | 6,306,478 |
| BioXcel Therapeutics, Inc. (a)(b)(c) | | 841,245 | 7,133,758 |
| Chiasma, Inc. (a)(c) | | 1,553,299 | 6,554,922 |
| Chiasma, Inc. warrants 12/16/24 (a) | | 382,683 | 466,471 |
| Corcept Therapeutics, Inc. (a)(b) | | 764,795 | 9,536,994 |
| Dova Pharmaceuticals, Inc. (a)(b) | | 1,028,720 | 7,900,570 |
| Horizon Pharma PLC (a) | | 1,008,119 | 29,245,532 |
| Idorsia Ltd. (a)(b) | | 432,921 | 7,395,725 |
| Intra-Cellular Therapies, Inc. (a) | | 603,348 | 8,217,600 |
| Kolltan Pharmaceuticals, Inc. rights (a)(g) | | 10,639,609 | 106 |
| Melinta Therapeutics, Inc. (a)(b) | | 280,072 | 1,492,784 |
| MyoKardia, Inc. (a) | | 1,016,601 | 45,594,555 |
| Nektar Therapeutics (a) | | 794,851 | 32,223,260 |
| NeurogesX, Inc. (a)(g) | | 2,550,000 | 26 |
| ObsEva SA (a) | | 1,373,362 | 17,125,824 |
| Ocular Therapeutix, Inc. (a) | | 1,560,999 | 6,946,446 |
| Odonate Therapeutics, Inc. (a)(b) | | 418,294 | 6,893,485 |
| Reata Pharmaceuticals, Inc. (a) | | 205,897 | 19,424,323 |
| RedHill Biopharma Ltd. sponsored ADR (a) | | 93,300 | 712,812 |
| Rhythm Pharmaceuticals, Inc. (a) | | 729,107 | 20,910,789 |
| RPI International Holdings LP (a)(e)(g) | | 54,958 | 8,525,085 |
| Spero Therapeutics, Inc. (a) | | 389,252 | 4,593,174 |
| Stemcentrx, Inc. rights 12/31/21 (a)(g) | | 876,163 | 1,068,919 |
| Sutro Biopharma, Inc. (a) | | 400,000 | 3,520,000 |
| The Medicines Company (a)(b) | | 977,308 | 24,110,188 |
| TherapeuticsMD, Inc. (a)(b) | | 3,638,842 | 20,814,176 |
| Theravance Biopharma, Inc. (a)(b) | | 354,600 | 8,606,142 |
| Tricida, Inc. | | 1,092,465 | 25,268,715 |
| UroGen Pharma Ltd. (a)(b) | | 588,203 | 22,634,051 |
| Urovant Sciences Ltd. (a)(b) | | 1,332,701 | 16,285,606 |
| Verrica Pharmaceuticals, Inc. (a) | | 621,800 | 7,038,776 |
| WAVE Life Sciences (a)(b) | | 355,712 | 14,915,004 |
| Xeris Pharmaceuticals, Inc. | | 387,931 | 3,883,189 |
| Zogenix, Inc. (a) | | 775,521 | 40,893,222 |
| | | | 587,229,735 |
| TOTAL COMMON STOCKS | | | |
| (Cost $4,969,755,320) | | | 7,368,972,377 |
|
| Preferred Stocks - 1.0% | | | |
| Convertible Preferred Stocks - 0.9% | | | |
| Biotechnology - 0.7% | | | |
| Biotechnology - 0.7% | | | |
| 23andMe, Inc. Series E (a)(e)(g) | | 1,505,457 | 29,085,429 |
| Axcella Health, Inc. Series C (a)(e)(g) | | 1,642,272 | 18,344,178 |
| Immunocore Ltd. Series A (a)(e)(g) | | 73,318 | 9,467,805 |
| | | | 56,897,412 |
| Health Care Technology - 0.2% | | | |
| Health Care Technology - 0.2% | | | |
| Codiak Biosciences, Inc.: | | | |
| Series A 8.00% (a)(e)(g) | | 856,366 | 3,108,609 |
| Series B 8.00% (a)(e)(g) | | 2,783,187 | 10,102,969 |
| | | | 13,211,578 |
| Pharmaceuticals - 0.0% | | | |
| Pharmaceuticals - 0.0% | | | |
| Afferent Pharmaceuticals, Inc. Series C (a)(e)(g) | | 8,274,568 | 83 |
|
| TOTAL CONVERTIBLE PREFERRED STOCKS | | | 70,109,073 |
|
| Nonconvertible Preferred Stocks - 0.1% | | | |
| Biotechnology - 0.1% | | | |
| Biotechnology - 0.1% | | | |
| Yumanity Holdings LLC Class A (a)(e)(g) | | 588,700 | 3,879,533 |
| TOTAL PREFERRED STOCKS | | | |
| (Cost $59,835,788) | | | 73,988,606 |
|
| Money Market Funds - 8.0% | | | |
| Fidelity Cash Central Fund, 2.44% (h) | | 42,638,764 | 42,647,292 |
| Fidelity Securities Lending Cash Central Fund 2.45% (h)(i) | | 563,319,196 | 563,375,528 |
| TOTAL MONEY MARKET FUNDS | | | |
| (Cost $605,985,043) | | | 606,022,820 |
| TOTAL INVESTMENT IN SECURITIES - 106.1% | | | |
| (Cost $5,635,576,151) | | | 8,048,983,803 |
| NET OTHER ASSETS (LIABILITIES) - (6.1)% | | | (465,261,652) |
| NET ASSETS - 100% | | | $7,583,722,151 |
Legend
(a) Non-income producing
(b) Security or a portion of the security is on loan at period end.
(c) Affiliated company
(d) Security exempt from registration under Rule 144A of the Securities Act of 1933. These securities may be resold in transactions exempt from registration, normally to qualified institutional buyers. At the end of the period, the value of these securities amounted to $68,080,013 or 0.9% of net assets.
(e) Restricted securities - Investment in securities not registered under the Securities Act of 1933 (excluding 144A issues). At the end of the period, the value of restricted securities (excluding 144A issues) amounted to $164,624,577 or 2.2% of net assets.
(f) Investment is owned by a wholly-owned subsidiary (Subsidiary) that is treated as a corporation for U.S. tax purposes.
(g) Level 3 security
(h) Affiliated fund that is generally available only to investment companies and other accounts managed by Fidelity Investments. The rate quoted is the annualized seven-day yield of the fund at period end. A complete unaudited listing of the fund's holdings as of its most recent quarter end is available upon request. In addition, each Fidelity Central Fund's financial statements, which are not covered by the Fund's Report of Independent Registered Public Accounting Firm, are available on the SEC's website or upon request.
(i) Investment made with cash collateral received from securities on loan.
Additional information on each restricted holding is as follows:
| Security | Acquisition Date | Acquisition Cost |
| 23andMe, Inc. Series E | 6/18/15 | $16,299,991 |
| Adimab LLC | 9/17/14 - 6/5/15 | $31,094,459 |
| Afferent Pharmaceuticals, Inc. Series C | 7/1/15 | $0 |
| Axcella Health, Inc. Series C | 1/30/15 | $16,554,102 |
| Codiak Biosciences, Inc. Series A 8.00% | 11/12/15 | $856,366 |
| Codiak Biosciences, Inc. Series B 8.00% | 11/12/15 | $8,349,561 |
| Immunocore Ltd. Series A | 7/27/15 | $13,796,921 |
| Precipio, Inc. | 2/3/12 | $2,828,200 |
| RPI International Holdings LP | 5/21/15 | $6,479,548 |
| Yumanity Holdings LLC Class A | 2/8/16 | $3,978,847 |
Affiliated Central Funds
Information regarding fiscal year to date income earned by the Fund from investments in Fidelity Central Funds is as follows:
| Fund | Income earned |
| Fidelity Cash Central Fund | $1,370,625 |
| Fidelity Securities Lending Cash Central Fund | 8,678,459 |
| Total | $10,049,084 |
Amounts in the income column in the above table include any capital gain distributions from underlying funds, which are presented in the corresponding line-item in the Statement of Operations, if applicable.
Other Affiliated Issuers
An affiliated company is a company in which the Fund has ownership of at least 5% of the voting securities. Fiscal year to date transactions with companies which are or were affiliates are as follows:
| Affiliate | Value, beginning of period | Purchases | Sales Proceeds | Dividend Income | Realized Gain (loss) | Change in Unrealized appreciation (depreciation) | Value, end of period |
| Aldeyra Therapeutics, Inc. | $8,880,729 | $24,999,989 | $8,244,955 | $-- | $(3,592,070) | $(6,726,978) | $15,316,715 |
| Allena Pharmaceuticals, Inc. | 2,253,708 | -- | 3,900,499 | -- | (146,915) | 2,095,791 | 302,085 |
| Allena Pharmaceuticals, Inc. | -- | -- | -- | -- | -- | (5,559,784) | 10,450,538 |
| Allena Pharmaceuticals, Inc. | 9,364,232 | -- | -- | -- | -- | 6,646,090 | -- |
| Arena Pharmaceuticals, Inc. | 87,894,769 | 10,673,385 | 61,387,466 | -- | 17,244,624 | (4,356,900) | -- |
| Atara Biotherapeutics, Inc. | 76,813,457 | -- | 37,017,613 | -- | 11,132,254 | (13,164,913) | -- |
| Bellicum Pharmaceuticals, Inc. | 11,972,188 | -- | 5,622,249 | -- | (8,589,274) | 4,667,244 | -- |
| BioXcel Therapeutics, Inc. | -- | 14,053,226 | 3,198,550 | -- | (1,600,981) | (2,119,937) | 7,133,758 |
| Chiasma, Inc. | 2,407,613 | 1 | -- | -- | -- | 4,147,308 | 6,554,922 |
| Chiasma, Inc. warrants 12/16/24 | 80,670 | -- | -- | -- | -- | 385,801 | -- |
| Cidara Therapeutics, Inc. | 978,200 | -- | 4,484,874 | -- | (9,565,874) | 1,028,205 | -- |
| Cidara Therapeutics, Inc. | 7,147,466 | -- | -- | -- | -- | 4,896,877 | -- |
| Corbus Pharmaceuticals Holdings, Inc. | 24,909,636 | 1,787,500 | 12,298,582 | -- | (4,575,686) | 937,373 | -- |
| Corvus Pharmaceuticals, Inc. | 8,827,067 | 7,671,846 | 8,446,097 | -- | (7,616,737) | 3,656,412 | -- |
| Epizyme, Inc. | 70,991,549 | 3,961,340 | 22,154,612 | -- | (11,766,627) | (4,251,870) | -- |
| Fate Therapeutics, Inc. | 31,591,720 | 1,012,520 | 19,613,364 | -- | 9,463,765 | (1,667,373) | -- |
| Geron Corp. | 35,032,769 | 14,228,556 | 45,851,102 | -- | (5,731,131) | 25,004,709 | 22,683,801 |
| Infinity Pharmaceuticals, Inc. | 5,251,731 | -- | 4,603,817 | -- | (3,357,697) | 2,709,783 | -- |
| Karyopharm Therapeutics, Inc. | 42,678,077 | 10,922,686 | 30,600,443 | -- | (19,539,076) | 2,873,350 | -- |
| Kezar Life Sciences, Inc. | -- | 17,769,939 | 3,263,537 | -- | (22,296) | 2,934,924 | -- |
| Krystal Biotech, Inc. | 8,961,132 | 6,000,000 | -- | -- | -- | 12,662,412 | 27,623,544 |
| Kura Oncology, Inc. | 53,806,464 | -- | 6,553,703 | -- | (1,397,961) | (15,993,331) | 29,861,469 |
| Leap Therapeutics, Inc. | -- | 6,310,377 | -- | -- | -- | (4,998,848) | -- |
| Macrogenics, Inc. | 61,866,847 | -- | 23,716,758 | -- | (9,180,492) | (4,522,977) | -- |
| Melinta Therapeutics, Inc. | 9,723,126 | 17,355,500 | 12,857,603 | -- | (80,165,318) | 67,437,079 | -- |
| Minerva Neurosciences, Inc. | 16,540,724 | -- | 2,789,452 | -- | (1,071,728) | 9,335,040 | 22,014,584 |
| Miragen Therapeutics, Inc. | 16,032,041 | -- | -- | -- | -- | (7,943,804) | 8,088,237 |
| NeurogesX, Inc. | 26 | -- | -- | -- | -- | -- | -- |
| Ocular Therapeutix, Inc. | 12,522,707 | -- | 4,578,669 | -- | (5,817,221) | 4,819,628 | -- |
| Scholar Rock Holding Corp. | 15,394,824 | -- | -- | -- | -- | (2,565,804) | -- |
| Scholar Rock Holding Corp. | -- | 546,000 | 729,745 | -- | 304,145 | 15,102,485 | 28,051,905 |
| Seres Therapeutics, Inc. | 9,770,180 | -- | -- | -- | -- | (11,260,948) | 14,224,512 |
| Seres Therapeutics, Inc. | 12,274,333 | -- | 1 | -- | -- | 3,440,948 | -- |
| Stemline Therapeutics, Inc. | 30,800,508 | -- | 11,825,037 | -- | 835,024 | (9,765,288) | -- |
| Vermillion, Inc. | 5,391,860 | -- | 2,594,052 | -- | (4,451,312) | 1,653,504 | -- |
| Voyager Therapeutics, Inc. | 65,380,114 | -- | 25,331,480 | -- | 4,521,424 | (33,499,128) | -- |
| Zafgen, Inc. | 21,319,040 | -- | 7,901,871 | -- | (23,188,768) | 16,608,670 | -- |
| Total | $766,859,507 | $137,292,865 | $369,566,131 | $-- | $(157,875,928) | $64,645,750 | $192,306,070 |
Investment Valuation
The following is a summary of the inputs used, as of February 28, 2019, involving the Fund's assets and liabilities carried at fair value. The inputs or methodology used for valuing securities may not be an indication of the risk associated with investing in those securities. For more information on valuation inputs, and their aggregation into the levels used below, please refer to the Investment Valuation section in the accompanying Notes to Financial Statements.
| | Valuation Inputs at Reporting Date: |
| Description | Total | Level 1 | Level 2 | Level 3 |
| Investments in Securities: | | | | |
| Common Stocks | $7,368,972,377 | $7,148,783,106 | $116,156,392 | $104,032,879 |
| Preferred Stocks | 73,988,606 | -- | -- | 73,988,606 |
| Money Market Funds | 606,022,820 | 606,022,820 | -- | -- |
| Total Investments in Securities: | $8,048,983,803 | $7,754,805,926 | $116,156,392 | $178,021,485 |
The following is a reconciliation of Investments in Securities and Derivative Instruments for which Level 3 inputs were used in determining value:
| Investments in Securities: | |
| Common Stocks | |
| Beginning Balance | $95,437,618 |
| Total Realized Gain (Loss) | 5,403,067 |
| Total Unrealized Gain (Loss) | 16,149,120 |
| Cost of Purchases | 58,744 |
| Proceeds of Sales | (13,015,670) |
| Amortization/Accretion | -- |
| Transfers in to Level 3 | -- |
| Transfers out of Level 3 | -- |
| Ending Balance | $104,032,879 |
| The change in unrealized gain (loss) for the period attributable to Level 3 securities held at February 28, 2019 | $16,149,120 |
| Preferred Stocks | |
| Beginning Balance | $178,519,654 |
| Total Realized Gain (Loss) | -- |
| Total Unrealized Gain (Loss) | (48,106,176) |
| Cost of Purchases | -- |
| Proceeds of Sales | (56,424,872) |
| Amortization/Accretion | -- |
| Transfers in to Level 3 | -- |
| Transfers out of Level 3 | -- |
| Ending Balance | $73,988,606 |
| The change in unrealized gain (loss) for the period attributable to Level 3 securities held at February 28, 2019 | $(16,508,600) |
The information used in the above reconciliations represents fiscal year to date activity for any Investments in Securities identified as using Level 3 inputs at either the beginning or the end of the current fiscal period. Transfers in or out of Level 3 represent the beginning value of any Security or Instrument where a change in the pricing level occurred from the beginning to the end of the period. The cost of purchases and the proceeds of sales may include securities received or delivered through corporate actions or exchanges. Realized and unrealized gains (losses) disclosed in the reconciliations are included in Net Gain (Loss) on the Fund's Statement of Operations.
See accompanying notes which are an integral part of the financial statements.
Biotechnology Portfolio
Financial Statements
Statement of Assets and Liabilities
| | | February 28, 2019 |
| Assets | | |
Investment in securities, at value (including securities loaned of $541,230,024) — See accompanying schedule:
Unaffiliated issuers (cost $4,804,962,575) | $7,250,654,913 | |
| Fidelity Central Funds (cost $605,985,043) | 606,022,820 | |
| Other affiliated issuers (cost $224,628,533) | 192,306,070 | |
| Total Investment in Securities (cost $5,635,576,151) | | $8,048,983,803 |
| Cash | | 6 |
| Restricted cash | | 15,576 |
| Receivable for investments sold | | 100,412,895 |
| Receivable for fund shares sold | | 4,956,743 |
| Dividends receivable | | 4,649,892 |
| Distributions receivable from Fidelity Central Funds | | 324,980 |
| Prepaid expenses | | 75,047 |
| Other receivables | | 766,438 |
| Total assets | | 8,160,185,380 |
| Liabilities | | |
| Payable for investments purchased | $2,075,679 | |
| Payable for fund shares redeemed | 5,886,416 | |
| Accrued management fee | 3,299,597 | |
| Other affiliated payables | 1,102,783 | |
| Other payables and accrued expenses | 861,554 | |
| Collateral on securities loaned | 563,237,200 | |
| Total liabilities | | 576,463,229 |
| Net Assets | | $7,583,722,151 |
| Net Assets consist of: | | |
| Paid in capital | | $4,932,329,219 |
| Total distributable earnings (loss) | | 2,651,392,932 |
| Net Assets, for 358,724,060 shares outstanding | | $7,583,722,151 |
| Net Asset Value, offering price and redemption price per share ($7,583,722,151 ÷ 358,724,060 shares) | | $21.14 |
See accompanying notes which are an integral part of the financial statements.
Statement of Operations
| | | Year ended February 28, 2019 |
| Investment Income | | |
| Dividends | | $32,580,946 |
| Income from Fidelity Central Funds (including $8,678,459 from security lending) | | 10,049,084 |
| Total income | | 42,630,030 |
| Expenses | | |
| Management fee | $44,133,435 | |
| Transfer agent fees | 13,358,518 | |
| Accounting and security lending fees | 1,328,991 | |
| Custodian fees and expenses | 173,586 | |
| Independent trustees' fees and expenses | 46,490 | |
| Registration fees | 73,720 | |
| Audit | 84,608 | |
| Legal | 59,011 | |
| Miscellaneous | 71,068 | |
| Total expenses before reductions | 59,329,427 | |
| Expense reductions | (423,965) | |
| Total expenses after reductions | | 58,905,462 |
| Net investment income (loss) | | (16,275,432) |
| Realized and Unrealized Gain (Loss) | | |
| Net realized gain (loss) on: | | |
| Investment securities: | | |
| Unaffiliated issuers | 881,803,372 | |
| Fidelity Central Funds | 14,522 | |
| Other affiliated issuers | (157,875,928) | |
| Foreign currency transactions | 40,799 | |
| Total net realized gain (loss) | | 723,982,765 |
| Change in net unrealized appreciation (depreciation) on: | | |
| Investment securities: | | |
| Unaffiliated issuers | (852,850,279) | |
| Fidelity Central Funds | (11,698) | |
| Other affiliated issuers | 67,211,554 | |
| Assets and liabilities in foreign currencies | (9,052) | |
| Total change in net unrealized appreciation (depreciation) | | (785,659,475) |
| Net gain (loss) | | (61,676,710) |
| Net increase (decrease) in net assets resulting from operations | | $(77,952,142) |
See accompanying notes which are an integral part of the financial statements.
Statement of Changes in Net Assets
| | Year ended February 28, 2019 | Year ended February 28, 2018 |
| Increase (Decrease) in Net Assets | | |
| Operations | | |
| Net investment income (loss) | $(16,275,432) | $(22,746,925) |
| Net realized gain (loss) | 723,982,765 | 639,341,344 |
| Change in net unrealized appreciation (depreciation) | (785,659,475) | 801,191,224 |
| Net increase (decrease) in net assets resulting from operations | (77,952,142) | 1,417,785,643 |
| Distributions to shareholders | (723,235,576) | – |
| Distributions to shareholders from net realized gain | – | (123,724,434) |
| Total distributions | (723,235,576) | (123,724,434) |
| Share transactions | | |
| Proceeds from sales of shares | 600,449,390 | 1,080,604,327 |
| Reinvestment of distributions | 680,697,509 | 117,018,605 |
| Cost of shares redeemed | (1,837,003,918) | (3,124,598,001) |
| Net increase (decrease) in net assets resulting from share transactions | (555,857,019) | (1,926,975,069) |
| Total increase (decrease) in net assets | (1,357,044,737) | (632,913,860) |
| Net Assets | | |
| Beginning of period | 8,940,766,888 | 9,573,680,748 |
| End of period | $7,583,722,151 | $8,940,766,888 |
| Other Information | | |
| Accumulated net investment loss end of period | | $(2,099,767) |
| Shares(a) | | |
| Sold | 27,380,941 | 49,832,930 |
| Issued in reinvestment of distributions | 34,822,262 | 5,414,020 |
| Redeemed | (84,784,313) | (145,064,750) |
| Net increase (decrease) | (22,581,110) | (89,817,800) |
(a) Share activity prior to August 10, 2018 has been adjusted to reflect the impact of the 10 for 1 share split that occurred on that date.
See accompanying notes which are an integral part of the financial statements.
Financial Highlights
Biotechnology Portfolio
| | | | | | |
| Years ended February 28, | 2019 | 2018 | 2017 | 2016 A | 2015 |
| Selected Per–Share DataB | | | | | |
| Net asset value, beginning of period | $23.45 | $20.32 | $16.20 | $24.80 | $22.15 |
| Income from Investment Operations | | | | | |
| Net investment income (loss)C | (.04) | (.05) | (.08) | (.10) | (.09) |
| Net realized and unrealized gain (loss) | (.29)D | 3.49 | 4.80 | (6.92) | 5.12 |
| Total from investment operations | (.33) | 3.44 | 4.72 | (7.02) | 5.03 |
| Distributions from net investment income | – | – | – | – | – |
| Distributions from net realized gain | (1.98) | (.31) | (.60) | (1.58) | (2.38) |
| Total distributions | (1.98) | (.31) | (.60) | (1.58) | (2.38) |
| Redemption fees added to paid in capitalC | – | – | –E | –E | –E |
| Net asset value, end of period | $21.14 | $23.45 | $20.32 | $16.20 | $24.80 |
| Total ReturnF | (.46)%D | 17.04% | 29.67% | (30.35)% | 24.21% |
| Ratios to Average Net AssetsG,H | | | | | |
| Expenses before reductions | .72% | .74% | .75% | .73% | .74% |
| Expenses net of fee waivers, if any | .72% | .74% | .75% | .73% | .74% |
| Expenses net of all reductions | .72% | .73% | .74% | .73% | .74% |
| Net investment income (loss) | (.20)% | (.25)% | (.43)% | (.39)% | (.41)% |
| Supplemental Data | | | | | |
| Net assets, end of period (000 omitted) | $7,583,722 | $8,940,767 | $9,573,681 | $9,723,599 | $13,277,052 |
| Portfolio turnover rateI | 37% | 26% | 28% | 35% | 61% |
A For the year ended February 29.
B Per share amounts have been adjusted to reflect the impact of the 10 for 1 share split that occurred on August 10, 2018.
C Calculated based on average shares outstanding during the period.
D Net realized and unrealized gain (loss) per share reflects proceeds received from litigation which amounted to $0.01 per share. Excluding these litigation proceeds, the total return would have been (0.53) %.
E Amount represents less than $.005 per share.
F Total returns would have been lower if certain expenses had not been reduced during the applicable periods shown.
G Fees and expenses of any underlying Fidelity Central Funds are not included in the Fund's expense ratio. The Fund indirectly bears its proportionate share of the expenses of any underlying Fidelity Central Funds.
H Expense ratios reflect operating expenses of the Fund. Expenses before reductions do not reflect amounts reimbursed by the investment adviser or reductions from brokerage service arrangements or reductions from other expense offset arrangements and do not represent the amount paid by the Fund during periods when reimbursements or reductions occur. Expenses net of fee waivers reflect expenses after reimbursement by the investment adviser but prior to reductions from brokerage service arrangements or other expense offset arrangements. Expenses net of all reductions represent the net expenses paid by the Fund.
I Amount does not include the portfolio activity of any underlying Fidelity Central Funds.
See accompanying notes which are an integral part of the financial statements.
Health Care Portfolio
Performance: The Bottom Line
Average annual total return reflects the change in the value of an investment, assuming reinvestment of distributions from dividend income and capital gains (the profits earned upon the sale of securities that have grown in value, if any) and assuming a constant rate of performance each year. The hypothetical investment and the average annual total returns do not reflect the deduction of taxes that a shareholder would pay on fund distributions or the redemption of fund shares. During periods of reimbursement by Fidelity, a fund’s total return will be greater than it would be had the reimbursement not occurred. How a fund did yesterday is no guarantee of how it will do tomorrow.
Average Annual Total Returns
| For the periods ended February 28, 2019 | Past 1 year | Past 5 years | Past 10 years |
| Health Care Portfolio | 13.30% | 10.22% | 20.59% |
$10,000 Over 10 Years
Let's say hypothetically that $10,000 was invested in Health Care Portfolio on February 28, 2009.
The chart shows how the value of your investment would have changed, and also shows how the S&P 500® Index performed over the same period.
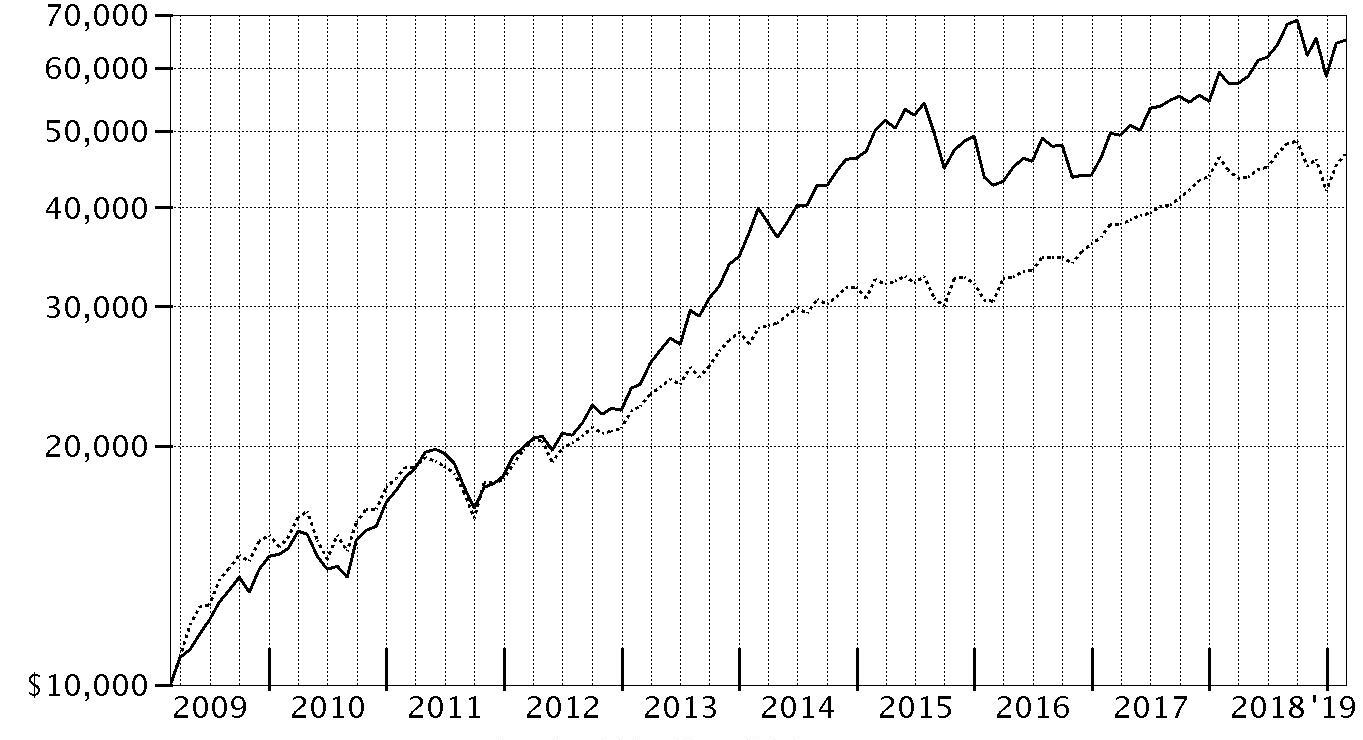
| Period Ending Values |
| $65,030 | Health Care Portfolio |
| $46,739 | S&P 500® Index |
Health Care Portfolio
Management's Discussion of Fund Performance
Market Recap: The S&P 500
® index gained 4.68% for the 12 months ending February 28, 2019, as the U.S. equity bellwether began the new year on a high note after enduring a final quarter of 2018 in which resurgent volatility upset the aging bull market. In October, rising U.S. Treasury yields and concern about peaking corporate earnings growth sent many investors fleeing from risk assets as they were still dealing with lingering uncertainty related to global trade and the U.S. Federal Reserve picking up the pace of interest rate hikes. The index returned -6.84% in October, at the time its largest monthly drop in seven years. But conditions worsened through Christmas, as jitters about the economy and another hike in rates led to a spike in market volatility and a -9.03% result for December. Sharply reversing course to begin 2019, the S&P 500
® gained 11.48% year-to-date, its strongest two-month opening since 1991, amid upbeat company earnings/outlooks and signs the Fed may pause on rates. For the full period, some economically sensitive sectors fared worst, with financials (-6%) and materials (-6%) both losing ground. Energy gained 1%, while communication services and industrials each rose roughly 2%. In contrast, the defensive utilities (+20%), real estate (+20%) and health care (+11%) sectors led the way, while consumer staples finished near the index. Information technology and consumer discretionary were rattled in the late-2018 downturn, but earlier strength contributed to advances of 9% and roughly 7%, respectively.
Comments from Portfolio Manager Eddie Yoon: For the fiscal year, the fund gained 13.30%, outpacing the 11.18% result of the MSCI U.S. IMI Health Care 25/50 Index, and well ahead of the broad-based S&P 500. The health care sector topped the broader equity market the past 12 months, as companies continued to benefit from strong demand for products amid positive secular trends, including an aging population. Companies and several industries here also were boosted by strong fundamentals, new innovations and accelerating growth. Versus the MSCI sector index, favorable security selection was the biggest contributor, especially choices in biotechnology. Stock picks and an overweighting in health care equipment also were helpful. I’ll also note that the fund's foreign holdings contributed overall, despite the drag of a broadly stronger U.S. dollar. Conversely, choices in pharmaceuticals were a significant relative detractor, while an underweighting in the group hurt to a much lesser extent. Not owning index component AbbVie boosted our relative result most. Shares of the biopharmaceutical company returned -29%, as investors became increasingly concerned about competition for its blockbuster drug for rheumatoid arthritis. A large position in medical device maker Boston Scientific (+47%) was another key contributor. Conversely, it hurt most to avoid index component and pharma giant Merck, as the stock gained about 55%, helped by the strong performance of and positive regulatory developments for its cancer drug. An overweighting in clinical-stage biopharma firm Nektar Therapeutics was another detractor, as shares of the company returned about -53%.
The views expressed above reflect those of the portfolio manager(s) only through the end of the period as stated on the cover of this report and do not necessarily represent the views of Fidelity or any other person in the Fidelity organization. Any such views are subject to change at any time based upon market or other conditions and Fidelity disclaims any responsibility to update such views. These views may not be relied on as investment advice and, because investment decisions for a Fidelity fund are based on numerous factors, may not be relied on as an indication of trading intent on behalf of any Fidelity fund.
Health Care Portfolio
Investment Summary (Unaudited)
Top Ten Stocks as of February 28, 2019
| | % of fund's net assets |
| UnitedHealth Group, Inc. | 8.1 |
| Becton, Dickinson & Co. | 7.4 |
| Boston Scientific Corp. | 6.9 |
| Humana, Inc. | 4.2 |
| AstraZeneca PLC (United Kingdom) | 4.2 |
| Roche Holding AG (participation certificate) | 4.1 |
| Cigna Corp. | 3.5 |
| Vertex Pharmaceuticals, Inc. | 3.4 |
| Sarepta Therapeutics, Inc. | 3.1 |
| Alexion Pharmaceuticals, Inc. | 3.0 |
| | 47.9 |
Top Industries (% of fund's net assets)
| As of February 28, 2019 |
| | Health Care Equipment & Supplies | 28.6% |
| | Biotechnology | 25.9% |
| | Health Care Providers & Services | 25.7% |
| | Pharmaceuticals | 16.3% |
| | Software | 1.3% |
| | All Others* | 2.2% |

* Includes short-term investments and net other assets (liabilities).
Health Care Portfolio
Schedule of Investments February 28, 2019
Showing Percentage of Net Assets
| Common Stocks - 97.7% | | | |
| | | Shares | Value |
| Biotechnology - 25.1% | | | |
| Biotechnology - 25.1% | | | |
| Abeona Therapeutics, Inc. (a)(b) | | 1,800,000 | $12,636,000 |
| Acceleron Pharma, Inc. (a) | | 800,000 | 35,232,000 |
| Acorda Therapeutics, Inc. (a) | | 1,080,000 | 15,919,200 |
| Alexion Pharmaceuticals, Inc. (a) | | 1,640,000 | 221,941,200 |
| Allakos, Inc. (a) | | 280,000 | 11,188,800 |
| Alnylam Pharmaceuticals, Inc. (a) | | 500,000 | 42,500,000 |
| Amgen, Inc. | | 820,000 | 155,865,600 |
| Amicus Therapeutics, Inc. (a) | | 1,900,000 | 22,990,000 |
| AnaptysBio, Inc. (a) | | 552,350 | 38,040,345 |
| Argenx SE ADR (a) | | 600,000 | 79,974,000 |
| Array BioPharma, Inc. (a) | | 2,800,000 | 64,232,000 |
| Ascendis Pharma A/S sponsored ADR (a) | | 690,000 | 50,245,800 |
| Atara Biotherapeutics, Inc. (a) | | 1,000,000 | 35,810,000 |
| BeiGene Ltd. ADR (a) | | 380,000 | 52,079,000 |
| bluebird bio, Inc. (a) | | 280,000 | 43,461,600 |
| Blueprint Medicines Corp. (a) | | 804,300 | 66,105,417 |
| Cellectis SA sponsored ADR (a) | | 694,721 | 12,421,611 |
| CytomX Therapeutics, Inc. (a) | | 476,960 | 5,351,491 |
| FibroGen, Inc. (a) | | 900,000 | 52,020,000 |
| GlycoMimetics, Inc. (a) | | 1,120,000 | 13,764,800 |
| Gritstone Oncology, Inc. | | 324,100 | 4,167,926 |
| Immunomedics, Inc. (a)(b) | | 2,300,000 | 36,248,000 |
| Insmed, Inc. (a)(b) | | 2,600,000 | 77,090,000 |
| Intercept Pharmaceuticals, Inc. (a) | | 350,000 | 34,909,000 |
| La Jolla Pharmaceutical Co. (a) | | 500,000 | 2,850,000 |
| Momenta Pharmaceuticals, Inc. (a) | | 482,313 | 6,795,790 |
| Morphosys AG (a) | | 180,000 | 18,488,112 |
| Morphosys AG sponsored ADR | | 199 | 5,120 |
| Neurocrine Biosciences, Inc. (a) | | 1,000,000 | 77,250,000 |
| Principia Biopharma, Inc. | | 112,306 | 3,977,879 |
| Sage Therapeutics, Inc. (a) | | 71,253 | 11,347,040 |
| Sarepta Therapeutics, Inc. (a) | | 1,600,000 | 230,784,000 |
| Scholar Rock Holding Corp. | | 36,843 | 686,017 |
| uniQure B.V. (a) | | 480,000 | 25,915,200 |
| Vertex Pharmaceuticals, Inc. (a) | | 1,330,000 | 251,037,500 |
| Viking Therapeutics, Inc. (a)(b) | | 1,200,000 | 10,092,000 |
| Xencor, Inc. (a) | | 1,180,778 | 35,824,805 |
| Zymeworks, Inc. (a) | | 676,765 | 10,232,687 |
| | | | 1,869,479,940 |
| Diversified Consumer Services - 0.2% | | | |
| Specialized Consumer Services - 0.2% | | | |
| Carriage Services, Inc. | | 651,800 | 13,694,318 |
| Health Care Equipment & Supplies - 28.5% | | | |
| Health Care Equipment - 28.1% | | | |
| Atricure, Inc. (a) | | 1,500,000 | 47,910,000 |
| Becton, Dickinson & Co. | | 2,220,000 | 552,313,800 |
| Boston Scientific Corp. (a) | | 12,800,000 | 513,536,000 |
| Danaher Corp. | | 740,000 | 93,994,800 |
| Genmark Diagnostics, Inc. (a) | | 2,500,000 | 19,225,000 |
| Hologic, Inc. (a) | | 1,550,000 | 73,082,500 |
| Insulet Corp. (a) | | 1,040,000 | 97,666,400 |
| Integra LifeSciences Holdings Corp. (a) | | 1,000,000 | 55,090,000 |
| Intuitive Surgical, Inc. (a) | | 284,000 | 155,521,240 |
| Masimo Corp. (a) | | 600,000 | 78,768,000 |
| Penumbra, Inc. (a) | | 600,000 | 80,202,000 |
| Stryker Corp. | | 1,000,000 | 188,510,000 |
| Teleflex, Inc. | | 212,000 | 61,446,080 |
| Wright Medical Group NV (a) | | 2,500,000 | 78,275,000 |
| | | | 2,095,540,820 |
| Health Care Supplies - 0.4% | | | |
| Align Technology, Inc. (a) | | 120,000 | 31,076,400 |
|
| TOTAL HEALTH CARE EQUIPMENT & SUPPLIES | | | 2,126,617,220 |
|
| Health Care Providers & Services - 25.4% | | | |
| Health Care Distributors & Services - 1.5% | | | |
| AmerisourceBergen Corp. | | 500,000 | 41,650,000 |
| Covetrus, Inc. (a) | | 900,000 | 32,202,000 |
| EBOS Group Ltd. | | 2,840,000 | 41,291,754 |
| | | | 115,143,754 |
| Health Care Facilities - 2.7% | | | |
| HCA Holdings, Inc. | | 1,450,000 | 201,608,000 |
| Health Care Services - 4.0% | | | |
| Cigna Corp. | | 1,475,000 | 257,299,000 |
| G1 Therapeutics, Inc. (a) | | 900,000 | 16,614,000 |
| Premier, Inc. (a) | | 600,000 | 21,948,000 |
| | | | 295,861,000 |
| Managed Health Care - 17.2% | | | |
| Centene Corp. (a) | | 800,000 | 48,712,000 |
| Humana, Inc. | | 1,086,403 | 309,668,311 |
| Molina Healthcare, Inc. (a) | | 675,000 | 90,875,250 |
| Notre Dame Intermedica Participacoes SA | | 7,000,000 | 61,909,136 |
| UnitedHealth Group, Inc. | | 2,500,000 | 605,549,999 |
| Wellcare Health Plans, Inc. (a) | | 640,000 | 162,291,200 |
| | | | 1,279,005,896 |
|
| TOTAL HEALTH CARE PROVIDERS & SERVICES | | | 1,891,618,650 |
|
| Health Care Technology - 0.8% | | | |
| Health Care Technology - 0.8% | | | |
| Castlight Health, Inc. (a) | | 1,875,650 | 5,983,324 |
| Castlight Health, Inc. Class B (a) | | 3,400,000 | 10,846,000 |
| Teladoc Health, Inc. (a)(b) | | 600,000 | 38,616,000 |
| | | | 55,445,324 |
| Life Sciences Tools & Services - 0.6% | | | |
| Life Sciences Tools & Services - 0.6% | | | |
| Lonza Group AG | | 170,000 | 47,267,171 |
| Pharmaceuticals - 16.1% | | | |
| Pharmaceuticals - 16.1% | | | |
| Allergan PLC | | 540,000 | 74,363,400 |
| Amneal Pharmaceuticals, Inc. (c) | | 1,621,622 | 21,940,546 |
| AstraZeneca PLC (United Kingdom) | | 3,800,000 | 309,413,579 |
| Bristol-Myers Squibb Co. | | 2,200,000 | 113,652,000 |
| Dechra Pharmaceuticals PLC | | 1,700,000 | 55,738,532 |
| Eli Lilly & Co. (b) | | 690,000 | 87,140,100 |
| Mylan NV (a) | | 320,000 | 8,444,800 |
| MyoKardia, Inc. (a) | | 368,449 | 16,524,938 |
| Nektar Therapeutics (a) | | 1,500,000 | 60,810,000 |
| Recordati SpA | | 620,000 | 23,321,592 |
| Roche Holding AG (participation certificate) | | 1,100,000 | 305,276,701 |
| RPI International Holdings LP (a)(c)(d) | | 199,753 | 30,985,685 |
| The Medicines Company (a)(b) | | 1,140,300 | 28,131,201 |
| Theravance Biopharma, Inc. (a)(b) | | 1,292,500 | 31,368,975 |
| Zogenix, Inc. (a) | | 634,896 | 33,478,066 |
| | | | 1,200,590,115 |
| Software - 1.0% | | | |
| Application Software - 1.0% | | | |
| Benefitfocus, Inc. (a)(b) | | 1,500,000 | 73,680,000 |
| TOTAL COMMON STOCKS | | | |
| (Cost $5,205,303,141) | | | 7,278,392,738 |
|
| Convertible Preferred Stocks - 1.7% | | | |
| Biotechnology - 0.8% | | | |
| Biotechnology - 0.8% | | | |
| 10X Genomics, Inc.: | | | |
| Series C (a)(c)(d) | | 2,958,778 | 37,665,244 |
| Series D (c)(d) | | 60,000 | 763,800 |
| BioNTech AG Series A (a)(c)(d) | | 78,748 | 22,738,726 |
| Generation Bio Series B (c)(d) | | 130,800 | 1,188,972 |
| | | | 62,356,742 |
| Health Care Equipment & Supplies - 0.1% | | | |
| Health Care Equipment - 0.1% | | | |
| Shockwave Medical, Inc. Series C (a)(c) | | 608,679 | 9,312,789 |
| Health Care Providers & Services - 0.3% | | | |
| Health Care Services - 0.3% | | | |
| 1Life Healthcare, Inc. Series G (a)(c)(d) | | 1,639,892 | 20,383,858 |
| Pharmaceuticals - 0.2% | | | |
| Pharmaceuticals - 0.2% | | | |
| Harmony Biosciences II, Inc. Series A (a)(c)(d) | | 10,935,215 | 10,935,215 |
| Software - 0.3% | | | |
| Application Software - 0.3% | | | |
| Outset Medical, Inc. Series B (a)(c)(d) | | 8,159,125 | 25,374,879 |
| TOTAL CONVERTIBLE PREFERRED STOCKS | | | |
| (Cost $80,002,165) | | | 128,363,483 |
|
| Money Market Funds - 2.4% | | | |
| Fidelity Cash Central Fund, 2.44% (e) | | 70,443,669 | 70,457,757 |
| Fidelity Securities Lending Cash Central Fund 2.45% (e)(f) | | 110,870,535 | 110,881,622 |
| TOTAL MONEY MARKET FUNDS | | | |
| (Cost $181,336,684) | | | 181,339,379 |
| TOTAL INVESTMENT IN SECURITIES - 101.8% | | | |
| (Cost $5,466,641,990) | | | 7,588,095,600 |
| NET OTHER ASSETS (LIABILITIES) - (1.8)% | | | (137,388,501) |
| NET ASSETS - 100% | | | $7,450,707,099 |
Legend
(a) Non-income producing
(b) Security or a portion of the security is on loan at period end.
(c) Restricted securities - Investment in securities not registered under the Securities Act of 1933 (excluding 144A issues). At the end of the period, the value of restricted securities (excluding 144A issues) amounted to $181,289,714 or 2.4% of net assets.
(d) Level 3 security
(e) Affiliated fund that is generally available only to investment companies and other accounts managed by Fidelity Investments. The rate quoted is the annualized seven-day yield of the fund at period end. A complete unaudited listing of the fund's holdings as of its most recent quarter end is available upon request. In addition, each Fidelity Central Fund's financial statements, which are not covered by the Fund's Report of Independent Registered Public Accounting Firm, are available on the SEC's website or upon request.
(f) Investment made with cash collateral received from securities on loan.
Additional information on each restricted holding is as follows:
| Security | Acquisition Date | Acquisition Cost |
| 10X Genomics, Inc. Series C | 2/23/16 - 4/3/17 | $13,250,000 |
| 10X Genomics, Inc. Series D | 4/10/18 | $574,200 |
| 1Life Healthcare, Inc. Series G | 4/10/14 | $10,800,001 |
| Amneal Pharmaceuticals, Inc. | 5/4/18 | $29,594,602 |
| BioNTech AG Series A | 12/29/17 | $17,246,491 |
| Generation Bio Series B | 2/21/18 | $1,196,258 |
| Harmony Biosciences II, Inc. Series A | 9/22/17 | $10,935,215 |
| Outset Medical, Inc. Series B | 5/5/15 | $18,500,000 |
| RPI International Holdings LP | 5/21/15 - 3/23/16 | $26,504,031 |
| Shockwave Medical, Inc. Series C | 9/27/17 | $7,500,000 |
Affiliated Central Funds
Information regarding fiscal year to date income earned by the Fund from investments in Fidelity Central Funds is as follows:
| Fund | Income earned |
| Fidelity Cash Central Fund | $1,314,450 |
| Fidelity Securities Lending Cash Central Fund | 1,034,553 |
| Total | $2,349,003 |
Amounts in the income column in the above table include any capital gain distributions from underlying funds, which are presented in the corresponding line-item in the Statement of Operations, if applicable.
Other Affiliated Issuers
An affiliated company is a company in which the Fund has ownership of at least 5% of the voting securities. Fiscal year to date transactions with companies which are or were affiliates are as follows:
| Affiliate | Value, beginning of period | Purchases | Sales Proceeds(a) | Dividend Income | Realized Gain (loss) | Change in Unrealized appreciation (depreciation) | Value, end of period |
| Benefitfocus, Inc. | $43,414,800 | $7,941,024 | $14,927,344 | $-- | $(985,744) | $38,237,264 | $-- |
| Total | $43,414,800 | $7,941,024 | $14,927,344 | $-- | $(985,744) | $38,237,264 | $-- |
(a) Includes the value of securities delivered through in-kind transactions, if applicable.
Investment Valuation
The following is a summary of the inputs used, as of February 28, 2019, involving the Fund's assets and liabilities carried at fair value. The inputs or methodology used for valuing securities may not be an indication of the risk associated with investing in those securities. For more information on valuation inputs, and their aggregation into the levels used below, please refer to the Investment Valuation section in the accompanying Notes to Financial Statements.
| | Valuation Inputs at Reporting Date: |
| Description | Total | Level 1 | Level 2 | Level 3 |
| Investments in Securities: | | | | |
| Common Stocks | $7,278,392,738 | $6,942,130,352 | $305,276,701 | $30,985,685 |
| Convertible Preferred Stocks | 128,363,483 | -- | 9,312,789 | 119,050,694 |
| Money Market Funds | 181,339,379 | 181,339,379 | -- | -- |
| Total Investments in Securities: | $7,588,095,600 | $7,123,469,731 | $314,589,490 | $150,036,379 |
The following is a reconciliation of Investments in Securities and Derivative Instruments for which Level 3 inputs were used in determining value:
| Investments in Securities: | |
| Convertible Preferred Stocks | |
| Beginning Balance | $85,231,129 |
| Total Realized Gain (Loss) | -- |
| Total Unrealized Gain (Loss) | 40,745,365 |
| Cost of Purchases | 574,200 |
| Proceeds of Sales | -- |
| Amortization/Accretion | -- |
| Transfers in to Level 3 | -- |
| Transfers out of Level 3 | (7,500,000) |
| Ending Balance | $119,050,694 |
| The change in unrealized gain (loss) for the period attributable to Level 3 securities held at February 28, 2019 | $40,745,365 |
| Other Investments in Securities | |
| Beginning Balance | $28,424,852 |
| Total Realized Gain (Loss) | -- |
| Total Unrealized Gain (Loss) | 2,560,833 |
| Cost of Purchases | -- |
| Proceeds of Sales | -- |
| Amortization/Accretion | -- |
| Transfers in to Level 3 | -- |
| Transfers out of Level 3 | -- |
| Ending Balance | $30,985,685 |
| The change in unrealized gain (loss) for the period attributable to Level 3 securities held at February 28, 2019 | $2,560,833 |
The information used in the above reconciliations represents fiscal year to date activity for any Investments in Securities identified as using Level 3 inputs at either the beginning or the end of the current fiscal period. Transfers in or out of Level 3 represent the beginning value of any Security or Instrument where a change in the pricing level occurred from the beginning to the end of the period. The cost of purchases and the proceeds of sales may include securities received or delivered through corporate actions or exchanges. Realized and unrealized gains (losses) disclosed in the reconciliations are included in Net Gain (Loss) on the Fund's Statement of Operations.
Other Information
Distribution of investments by country or territory of incorporation, as a percentage of Total Net Assets, is as follows (Unaudited):
| United States of America | 82.3% |
| United Kingdom | 4.9% |
| Switzerland | 4.7% |
| Netherlands | 2.5% |
| Cayman Islands | 1.5% |
| Ireland | 1.0% |
| Others (Individually Less Than 1%) | 3.1% |
| | 100.0% |
See accompanying notes which are an integral part of the financial statements.
Health Care Portfolio
Financial Statements
Statement of Assets and Liabilities
| | | February 28, 2019 |
| Assets | | |
Investment in securities, at value (including securities loaned of $104,026,489) — See accompanying schedule:
Unaffiliated issuers (cost $5,285,305,306) | $7,406,756,221 | |
| Fidelity Central Funds (cost $181,336,684) | 181,339,379 | |
| Total Investment in Securities (cost $5,466,641,990) | | $7,588,095,600 |
| Cash | | 35,530 |
| Receivable for investments sold | | 27,516,216 |
| Receivable for fund shares sold | | 4,783,234 |
| Dividends receivable | | 12,051,840 |
| Distributions receivable from Fidelity Central Funds | | 78,842 |
| Prepaid expenses | | 58,190 |
| Other receivables | | 541,494 |
| Total assets | | 7,633,160,946 |
| Liabilities | | |
| Payable for investments purchased | $59,829,065 | |
| Payable for fund shares redeemed | 6,806,452 | |
| Accrued management fee | 3,353,755 | |
| Other affiliated payables | 989,814 | |
| Other payables and accrued expenses | 613,114 | |
| Collateral on securities loaned | 110,861,647 | |
| Total liabilities | | 182,453,847 |
| Net Assets | | $7,450,707,099 |
| Net Assets consist of: | | |
| Paid in capital | | $5,429,429,426 |
| Total distributable earnings (loss) | | 2,021,277,673 |
| Net Assets, for 304,338,221 shares outstanding | | $7,450,707,099 |
| Net Asset Value, offering price and redemption price per share ($7,450,707,099 ÷ 304,338,221 shares) | | $24.48 |
See accompanying notes which are an integral part of the financial statements.
Statement of Operations
| | | Year ended February 28, 2019 |
| Investment Income | | |
| Dividends | | $55,494,197 |
| Income from Fidelity Central Funds (including $1,034,553 from security lending) | | 2,349,003 |
| Total income | | 57,843,200 |
| Expenses | | |
| Management fee | $38,731,470 | |
| Transfer agent fees | 10,708,416 | |
| Accounting and security lending fees | 1,199,431 | |
| Custodian fees and expenses | 221,605 | |
| Independent trustees' fees and expenses | 39,659 | |
| Registration fees | 155,318 | |
| Audit | 52,838 | |
| Legal | 40,051 | |
| Interest | 524 | |
| Miscellaneous | 55,745 | |
| Total expenses before reductions | 51,205,057 | |
| Expense reductions | (462,336) | |
| Total expenses after reductions | | 50,742,721 |
| Net investment income (loss) | | 7,100,479 |
| Realized and Unrealized Gain (Loss) | | |
| Net realized gain (loss) on: | | |
| Investment securities: | | |
| Unaffiliated issuers | 325,133,555 | |
| Redemptions in-kind with affiliated entities | 233,538,287 | |
| Fidelity Central Funds | 9,756 | |
| Other affiliated issuers | (985,744) | |
| Foreign currency transactions | (335,016) | |
| Total net realized gain (loss) | | 557,360,838 |
| Change in net unrealized appreciation (depreciation) on: | | |
| Investment securities: | | |
| Unaffiliated issuers | 237,993,248 | |
| Fidelity Central Funds | (1,689) | |
| Other affiliated issuers | 38,237,264 | |
| Assets and liabilities in foreign currencies | (59,066) | |
| Total change in net unrealized appreciation (depreciation) | | 276,169,757 |
| Net gain (loss) | | 833,530,595 |
| Net increase (decrease) in net assets resulting from operations | | $840,631,074 |
See accompanying notes which are an integral part of the financial statements.
Statement of Changes in Net Assets
| | Year ended February 28, 2019 | Year ended February 28, 2018 |
| Increase (Decrease) in Net Assets | | |
| Operations | | |
| Net investment income (loss) | $7,100,479 | $15,688,493 |
| Net realized gain (loss) | 557,360,838 | 477,734,418 |
| Change in net unrealized appreciation (depreciation) | 276,169,757 | 472,747,918 |
| Net increase (decrease) in net assets resulting from operations | 840,631,074 | 966,170,829 |
| Distributions to shareholders | (587,162,015) | – |
| Distributions to shareholders from net investment income | – | (11,041,879) |
| Distributions to shareholders from net realized gain | – | (148,657,217) |
| Total distributions | (587,162,015) | (159,699,096) |
| Share transactions | | |
| Proceeds from sales of shares | 1,445,029,108 | 830,480,092 |
| Reinvestment of distributions | 550,453,790 | 150,559,655 |
| Cost of shares redeemed | (1,721,649,295) | (1,492,988,701) |
| Net increase (decrease) in net assets resulting from share transactions | 273,833,603 | (511,948,954) |
| Total increase (decrease) in net assets | 527,302,662 | 294,522,779 |
| Net Assets | | |
| Beginning of period | 6,923,404,437 | 6,628,881,658 |
| End of period | $7,450,707,099 | $6,923,404,437 |
| Other Information | | |
| Undistributed net investment income end of period | | $4,015,387 |
| Shares(a) | | |
| Sold | 58,505,582 | 36,864,240 |
| Issued in reinvestment of distributions | 24,271,579 | 6,703,760 |
| Redeemed | (72,356,020) | (66,953,880) |
| Net increase (decrease) | 10,421,141 | (23,385,880) |
(a) Share activity prior to August 10, 2018 has been adjusted to reflect the impact of the 10 for 1 share split that occurred on that date.
See accompanying notes which are an integral part of the financial statements.
Financial Highlights
Health Care Portfolio
| | | | | | |
| Years ended February 28, | 2019 | 2018 | 2017 | 2016 A | 2015 |
| Selected Per–Share DataB | | | | | |
| Net asset value, beginning of period | $23.56 | $20.89 | $18.05 | $23.64 | $21.69 |
| Income from Investment Operations | | | | | |
| Net investment income (loss)C | .02 | .05 | .02 | (.01) | (.04) |
| Net realized and unrealized gain (loss) | 2.90 | 3.17 | 2.93 | (3.16) | 5.00 |
| Total from investment operations | 2.92 | 3.22 | 2.95 | (3.17) | 4.96 |
| Distributions from net investment income | (.03) | (.04) | (.02) | – | – |
| Distributions from net realized gain | (1.97) | (.51) | (.09) | (2.42) | (3.01) |
| Total distributions | (2.00) | (.55) | (.11) | (2.42) | (3.01) |
| Redemption fees added to paid in capitalC | – | – | –D | –D | –D |
| Net asset value, end of period | $24.48 | $23.56 | $20.89 | $18.05 | $23.64 |
| Total ReturnE | 13.30% | 15.49% | 16.43% | (14.90)% | 25.44% |
| Ratios to Average Net AssetsF,G | | | | | |
| Expenses before reductions | .71% | .73% | .74% | .73% | .74% |
| Expenses net of fee waivers, if any | .71% | .73% | .73% | .73% | .74% |
| Expenses net of all reductions | .71% | .72% | .73% | .72% | .74% |
| Net investment income (loss) | .10% | .23% | .12% | (.03)% | (.18)% |
| Supplemental Data | | | | | |
| Net assets, end of period (000 omitted) | $7,450,707 | $6,923,404 | $6,628,882 | $7,439,085 | $9,831,808 |
| Portfolio turnover rateH | 60%I | 75% | 49%I | 76% | 98%I |
A For the year ended February 29.
B Per share amounts have been adjusted to reflect the impact of the 10 for 1 share split that occurred on August 10, 2018.
C Calculated based on average shares outstanding during the period.
D Amount represents less than $.005 per share.
E Total returns would have been lower if certain expenses had not been reduced during the applicable periods shown.
F Fees and expenses of any underlying Fidelity Central Funds are not included in the Fund's expense ratio. The Fund indirectly bears its proportionate share of the expenses of any underlying Fidelity Central Funds.
G Expense ratios reflect operating expenses of the Fund. Expenses before reductions do not reflect amounts reimbursed by the investment adviser or reductions from brokerage service arrangements or reductions from other expense offset arrangements and do not represent the amount paid by the Fund during periods when reimbursements or reductions occur. Expenses net of fee waivers reflect expenses after reimbursement by the investment adviser but prior to reductions from brokerage service arrangements or other expense offset arrangements. Expenses net of all reductions represent the net expenses paid by the Fund.
H Amount does not include the portfolio activity of any underlying Fidelity Central Funds.
I Portfolio turnover rate excludes securities received or delivered in-kind.
See accompanying notes which are an integral part of the financial statements.
Health Care Services Portfolio
Performance: The Bottom Line
Average annual total return reflects the change in the value of an investment, assuming reinvestment of distributions from dividend income and capital gains (the profits earned upon the sale of securities that have grown in value, if any) and assuming a constant rate of performance each year. The hypothetical investment and the average annual total returns do not reflect the deduction of taxes that a shareholder would pay on fund distributions or the redemption of fund shares. During periods of reimbursement by Fidelity, a fund’s total return will be greater than it would be had the reimbursement not occurred. How a fund did yesterday is no guarantee of how it will do tomorrow.
Average Annual Total Returns
| For the periods ended February 28, 2019 | Past 1 year | Past 5 years | Past 10 years |
| Health Care Services Portfolio | 9.61% | 12.79% | 19.75% |
$10,000 Over 10 Years
Let's say hypothetically that $10,000 was invested in Health Care Services Portfolio on February 28, 2009.
The chart shows how the value of your investment would have changed, and also shows how the S&P 500® Index performed over the same period.
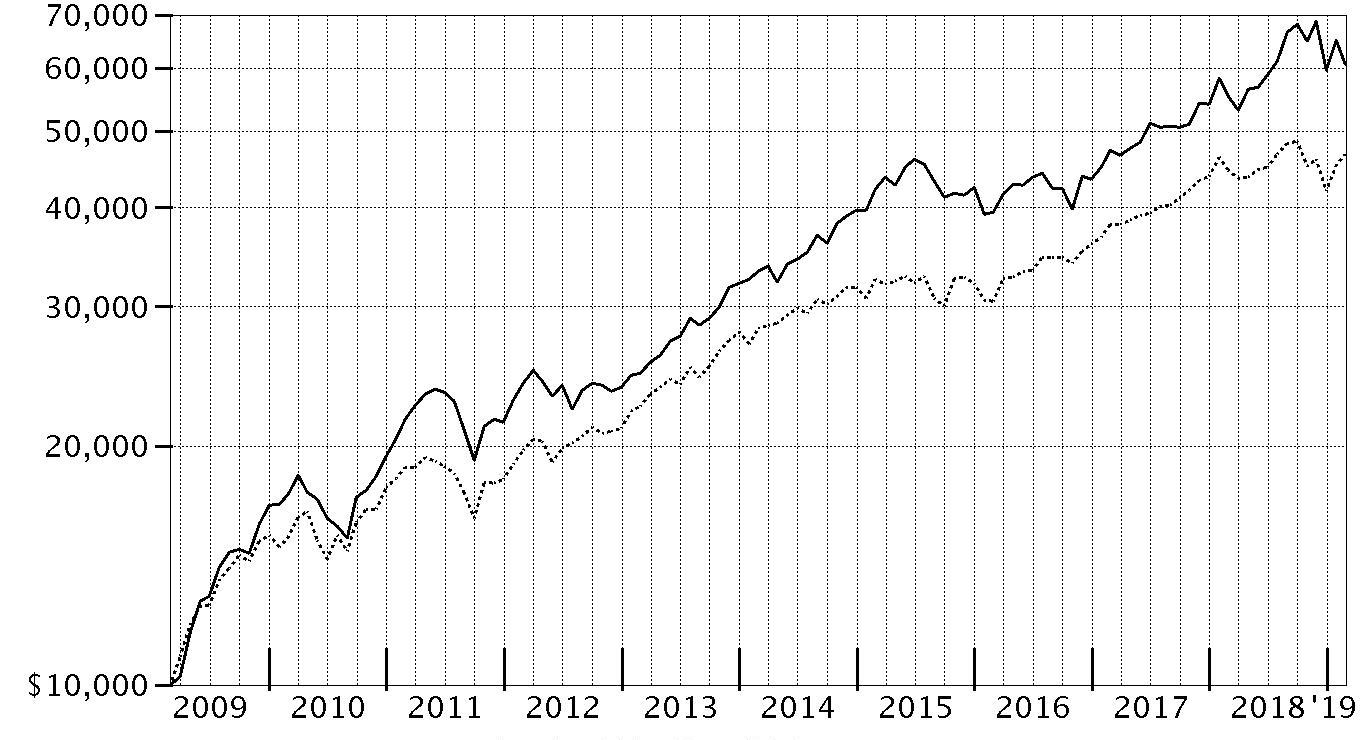
| Period Ending Values |
| $60,657 | Health Care Services Portfolio |
| $46,739 | S&P 500® Index |
Health Care Services Portfolio
Management's Discussion of Fund Performance
Market Recap: The S&P 500
® index gained 4.68% for the 12 months ending February 28, 2019, as the U.S. equity bellwether began the new year on a high note after enduring a final quarter of 2018 in which resurgent volatility upset the aging bull market. In October, rising U.S. Treasury yields and concern about peaking corporate earnings growth sent many investors fleeing from risk assets as they were still dealing with lingering uncertainty related to global trade and the U.S. Federal Reserve picking up the pace of interest rate hikes. The index returned -6.84% in October, at the time its largest monthly drop in seven years. But conditions worsened through Christmas, as jitters about the economy and another hike in rates led to a spike in market volatility and a -9.03% result for December. Sharply reversing course to begin 2019, the S&P 500
® gained 11.48% year-to-date, its strongest two-month opening since 1991, amid upbeat company earnings/outlooks and signs the Fed may pause on rates. For the full period, some economically sensitive sectors fared worst, with financials (-6%) and materials (-6%) both losing ground. Energy gained 1%, while communication services and industrials each rose roughly 2%. In contrast, the defensive utilities (+20%), real estate (+20%) and health care (+11%) sectors led the way, while consumer staples finished near the index. Information technology and consumer discretionary were rattled in the late-2018 downturn, but earlier strength contributed to advances of 9% and roughly 7%, respectively.
Comments from Portfolio Manager Justin Segalini: For the fiscal year, the fund gained 9.61%, outpacing the 5.90% advance of the MSCI U.S. IMI Health Care Providers 25/50 Index, and well ahead of the broad-based S&P 500
®. The industry was boosted by strong earnings growth and positive earnings-estimate revisions for managed care providers, as well as consolidation within the industry. Versus the MSCI industry index, the fund’s outperformance was driven by investment choices within the managed health care group – the fund's largest area of investment, at 53% of assets, on average. Security selection and an underweighting in health care distributors also contributed, as did non-index picks among health care technology firms. Managed care provider Molina Healthcare (+86%) was by far the fund's leading individual contributor and one of its largest holdings. The company's continued efforts to turn around its business – including reducing debt and improving efficiency – resulted in second- and third-quarter financial results that substantially exceeded market expectations. Another big contributor was our out-of-index stake in Teladoc Health (+59%), which enables patients to engage in clinical interaction via the phone, video chat or web applications. Conversely, the fund’s underexposure to managed care provider and major index component Anthem (+29%) detracted most as the stock jumped in January following better-than-anticipated fourth-quarter results and 2019 guidance that included expectations of profitability. Lastly, shares of Diplomat Pharmacy (-69%) – the largest independent provider of specialty pharmacy services in the country – suffered after the company reported disappointing third-quarter revenue and earnings results in November.
The views expressed above reflect those of the portfolio manager(s) only through the end of the period as stated on the cover of this report and do not necessarily represent the views of Fidelity or any other person in the Fidelity organization. Any such views are subject to change at any time based upon market or other conditions and Fidelity disclaims any responsibility to update such views. These views may not be relied on as investment advice and, because investment decisions for a Fidelity fund are based on numerous factors, may not be relied on as an indication of trading intent on behalf of any Fidelity fund.
Health Care Services Portfolio
Investment Summary (Unaudited)
Top Ten Stocks as of February 28, 2019
| | % of fund's net assets |
| UnitedHealth Group, Inc. | 22.9 |
| CVS Health Corp. | 9.4 |
| Cigna Corp. | 8.5 |
| Humana, Inc. | 8.2 |
| HCA Holdings, Inc. | 5.0 |
| AmerisourceBergen Corp. | 5.0 |
| Anthem, Inc. | 5.0 |
| Wellcare Health Plans, Inc. | 4.8 |
| Centene Corp. | 4.7 |
| Molina Healthcare, Inc. | 4.1 |
| | 77.6 |
Top Industries (% of fund's net assets)
| As of February 28, 2019 |
| | Health Care Providers & Services | 96.8% |
| | Health Care Technology | 1.1% |
| | Diversified Consumer Services | 0.7% |
| | Insurance | 0.7% |
| | Professional Services | 0.3% |
| | All Others* | 0.4% |

* Includes short-term investments and net other assets (liabilities).
Health Care Services Portfolio
Schedule of Investments February 28, 2019
Showing Percentage of Net Assets
| Common Stocks - 99.9% | | | |
| | | Shares | Value |
| Diversified Consumer Services - 0.7% | | | |
| Specialized Consumer Services - 0.7% | | | |
| Service Corp. International | | 209,400 | $8,656,596 |
| Health Care Providers & Services - 96.8% | | | |
| Health Care Distributors & Services - 8.3% | | | |
| AmerisourceBergen Corp. | | 814,100 | 67,814,530 |
| Covetrus, Inc. (a) | | 225,600 | 8,071,968 |
| McKesson Corp. | | 280,565 | 35,676,645 |
| | | | 111,563,143 |
| Health Care Facilities - 9.2% | | | |
| Brookdale Senior Living, Inc. (a) | | 1,813,500 | 12,259,260 |
| Encompass Health Corp. | | 57,600 | 3,636,864 |
| HCA Holdings, Inc. | | 488,600 | 67,934,944 |
| Surgery Partners, Inc. (a)(b) | | 534,500 | 6,691,940 |
| U.S. Physical Therapy, Inc. | | 76,400 | 8,422,336 |
| Universal Health Services, Inc. Class B | | 182,200 | 25,294,826 |
| | | | 124,240,170 |
| Health Care Services - 28.3% | | | |
| 1Life Healthcare, Inc. (a)(c)(d) | | 810,794 | 10,078,169 |
| Amedisys, Inc. (a) | | 150,000 | 18,645,000 |
| Chemed Corp. | | 70,700 | 23,295,650 |
| Cigna Corp. | | 655,872 | 114,410,312 |
| CVS Health Corp. | | 2,187,200 | 126,485,776 |
| DaVita HealthCare Partners, Inc. (a) | | 537,150 | 30,563,835 |
| Diplomat Pharmacy, Inc. (a) | | 687,366 | 4,433,511 |
| LHC Group, Inc. (a) | | 264,444 | 29,006,862 |
| Quest Diagnostics, Inc. | | 271,200 | 23,472,360 |
| | | | 380,391,475 |
| Managed Health Care - 51.0% | | | |
| Anthem, Inc. | | 222,402 | 66,882,953 |
| Centene Corp. (a) | | 1,039,100 | 63,270,799 |
| Humana, Inc. | | 385,900 | 109,996,936 |
| Molina Healthcare, Inc. (a) | | 412,700 | 55,561,801 |
| Notre Dame Intermedica Participacoes SA | | 1,910,800 | 16,899,425 |
| UnitedHealth Group, Inc. | | 1,269,750 | 307,558,846 |
| Wellcare Health Plans, Inc. (a) | | 252,960 | 64,145,597 |
| | | | 684,316,357 |
|
| TOTAL HEALTH CARE PROVIDERS & SERVICES | | | 1,300,511,145 |
|
| Health Care Technology - 1.1% | | | |
| Health Care Technology - 1.1% | | | |
| Teladoc Health, Inc. (a)(b) | | 226,929 | 14,605,150 |
| Insurance - 0.7% | | | |
| Insurance Brokers - 0.7% | | | |
| eHealth, Inc. (a) | | 187,100 | 9,993,011 |
| Professional Services - 0.3% | | | |
| Human Resource & Employment Services - 0.3% | | | |
| WageWorks, Inc. (a) | | 118,000 | 3,882,200 |
| Software - 0.3% | | | |
| Application Software - 0.3% | | | |
| Benefitfocus, Inc. (a) | | 90,500 | 4,445,360 |
| TOTAL COMMON STOCKS | | | |
| (Cost $1,034,054,833) | | | 1,342,093,462 |
|
| Money Market Funds - 1.4% | | | |
| Fidelity Cash Central Fund, 2.44% (e) | | 409,570 | 409,652 |
| Fidelity Securities Lending Cash Central Fund 2.45% (e)(f) | | 17,600,416 | 17,602,176 |
| TOTAL MONEY MARKET FUNDS | | | |
| (Cost $18,011,828) | | | 18,011,828 |
| TOTAL INVESTMENT IN SECURITIES - 101.3% | | | |
| (Cost $1,052,066,661) | | | 1,360,105,290 |
| NET OTHER ASSETS (LIABILITIES) - (1.3)% | | | (17,035,336) |
| NET ASSETS - 100% | | | $1,343,069,954 |
Legend
(a) Non-income producing
(b) Security or a portion of the security is on loan at period end.
(c) Level 3 security
(d) Restricted securities - Investment in securities not registered under the Securities Act of 1933 (excluding 144A issues). At the end of the period, the value of restricted securities (excluding 144A issues) amounted to $10,078,169 or 0.8% of net assets.
(e) Affiliated fund that is generally available only to investment companies and other accounts managed by Fidelity Investments. The rate quoted is the annualized seven-day yield of the fund at period end. A complete unaudited listing of the fund's holdings as of its most recent quarter end is available upon request. In addition, each Fidelity Central Fund's financial statements, which are not covered by the Fund's Report of Independent Registered Public Accounting Firm, are available on the SEC's website or upon request.
(f) Investment made with cash collateral received from securities on loan.
Additional information on each restricted holding is as follows:
| Security | Acquisition Date | Acquisition Cost |
| 1Life Healthcare, Inc. | 10/24/18 | $10,078,169 |
Affiliated Central Funds
Information regarding fiscal year to date income earned by the Fund from investments in Fidelity Central Funds is as follows:
| Fund | Income earned |
| Fidelity Cash Central Fund | $394,658 |
| Fidelity Securities Lending Cash Central Fund | 153,572 |
| Total | $548,230 |
Amounts in the income column in the above table include any capital gain distributions from underlying funds, which are presented in the corresponding line-item in the Statement of Operations, if applicable.
Investment Valuation
The following is a summary of the inputs used, as of February 28, 2019, involving the Fund's assets and liabilities carried at fair value. The inputs or methodology used for valuing securities may not be an indication of the risk associated with investing in those securities. For more information on valuation inputs, and their aggregation into the levels used below, please refer to the Investment Valuation section in the accompanying Notes to Financial Statements.
| | Valuation Inputs at Reporting Date: |
| Description | Total | Level 1 | Level 2 | Level 3 |
| Investments in Securities: | | | | |
| Common Stocks | $1,342,093,462 | $1,332,015,293 | $-- | $10,078,169 |
| Money Market Funds | 18,011,828 | 18,011,828 | -- | -- |
| Total Investments in Securities: | $1,360,105,290 | $1,350,027,121 | $-- | $10,078,169 |
See accompanying notes which are an integral part of the financial statements.
Health Care Services Portfolio
Financial Statements
Statement of Assets and Liabilities
| | | February 28, 2019 |
| Assets | | |
Investment in securities, at value (including securities loaned of $16,314,994) — See accompanying schedule:
Unaffiliated issuers (cost $1,034,054,833) | $1,342,093,462 | |
| Fidelity Central Funds (cost $18,011,828) | 18,011,828 | |
| Total Investment in Securities (cost $1,052,066,661) | | $1,360,105,290 |
| Receivable for investments sold | | 16,664,481 |
| Receivable for fund shares sold | | 2,612,134 |
| Dividends receivable | | 657,292 |
| Distributions receivable from Fidelity Central Funds | | 54,568 |
| Prepaid expenses | | 7,008 |
| Other receivables | | 58,966 |
| Total assets | | 1,380,159,739 |
| Liabilities | | |
| Payable for fund shares redeemed | $18,503,966 | |
| Accrued management fee | 660,468 | |
| Other affiliated payables | 229,659 | |
| Other payables and accrued expenses | 94,420 | |
| Collateral on securities loaned | 17,601,272 | |
| Total liabilities | | 37,089,785 |
| Net Assets | | $1,343,069,954 |
| Net Assets consist of: | | |
| Paid in capital | | $1,070,241,051 |
| Total distributable earnings (loss) | | 272,828,903 |
| Net Assets, for 15,043,801 shares outstanding | | $1,343,069,954 |
| Net Asset Value, offering price and redemption price per share ($1,343,069,954 ÷ 15,043,801 shares) | | $89.28 |
See accompanying notes which are an integral part of the financial statements.
Statement of Operations
| | | Year ended February 28, 2019 |
| Investment Income | | |
| Dividends | | $8,992,102 |
| Income from Fidelity Central Funds (including $153,572 from security lending) | | 548,230 |
| Total income | | 9,540,332 |
| Expenses | | |
| Management fee | $5,789,971 | |
| Transfer agent fees | 1,739,672 | |
| Accounting and security lending fees | 356,677 | |
| Custodian fees and expenses | 17,622 | |
| Independent trustees' fees and expenses | 5,612 | |
| Registration fees | 135,442 | |
| Audit | 41,488 | |
| Legal | 4,969 | |
| Interest | 8,415 | |
| Miscellaneous | 7,078 | |
| Total expenses before reductions | 8,106,946 | |
| Expense reductions | (35,282) | |
| Total expenses after reductions | | 8,071,664 |
| Net investment income (loss) | | 1,468,668 |
| Realized and Unrealized Gain (Loss) | | |
| Net realized gain (loss) on: | | |
| Investment securities: | | |
| Unaffiliated issuers | 62,014,532 | |
| Fidelity Central Funds | 2,519 | |
| Foreign currency transactions | 53,865 | |
| Total net realized gain (loss) | | 62,070,916 |
| Change in net unrealized appreciation (depreciation) on: | | |
| Investment securities: | | |
| Unaffiliated issuers | (28,935,592) | |
| Assets and liabilities in foreign currencies | (573) | |
| Total change in net unrealized appreciation (depreciation) | | (28,936,165) |
| Net gain (loss) | | 33,134,751 |
| Net increase (decrease) in net assets resulting from operations | | $34,603,419 |
See accompanying notes which are an integral part of the financial statements.
Statement of Changes in Net Assets
| | Year ended February 28, 2019 | Year ended February 28, 2018 |
| Increase (Decrease) in Net Assets | | |
| Operations | | |
| Net investment income (loss) | $1,468,668 | $998,456 |
| Net realized gain (loss) | 62,070,916 | 117,943,750 |
| Change in net unrealized appreciation (depreciation) | (28,936,165) | 1,356,212 |
| Net increase (decrease) in net assets resulting from operations | 34,603,419 | 120,298,418 |
| Distributions to shareholders | (130,842,102) | – |
| Distributions to shareholders from net investment income | – | (817,273) |
| Distributions to shareholders from net realized gain | – | (99,374,269) |
| Total distributions | (130,842,102) | (100,191,542) |
| Share transactions | | |
| Proceeds from sales of shares | 924,676,252 | 183,784,680 |
| Reinvestment of distributions | 124,342,856 | 94,963,099 |
| Cost of shares redeemed | (439,402,544) | (229,288,607) |
| Net increase (decrease) in net assets resulting from share transactions | 609,616,564 | 49,459,172 |
| Redemption fees | – | 18,350 |
| Total increase (decrease) in net assets | 513,377,881 | 69,584,398 |
| Net Assets | | |
| Beginning of period | 829,692,073 | 760,107,675 |
| End of period | $1,343,069,954 | $829,692,073 |
| Other Information | | |
| Accumulated net investment loss end of period | | $(251,495) |
| Shares | | |
| Sold | 9,355,084 | 1,992,122 |
| Issued in reinvestment of distributions | 1,381,139 | 1,078,902 |
| Redeemed | (4,690,557) | (2,525,002) |
| Net increase (decrease) | 6,045,666 | 546,022 |
See accompanying notes which are an integral part of the financial statements.
Financial Highlights
Health Care Services Portfolio
| | | | | | |
| Years ended February 28, | 2019 | 2018 | 2017 | 2016A | 2015 |
| Selected Per–Share Data | | | | | |
| Net asset value, beginning of period | $92.21 | $89.93 | $78.59 | $87.26 | $75.55 |
| Income from Investment Operations | | | | | |
| Net investment income (loss)B | .13 | .11 | .12 | (.03) | (.09) |
| Net realized and unrealized gain (loss) | 8.27 | 14.23 | 15.03 | (5.21) | 19.25 |
| Total from investment operations | 8.40 | 14.34 | 15.15 | (5.24) | 19.16 |
| Distributions from net investment income | (.10) | (.10) | (.13) | (.02) | – |
| Distributions from net realized gain | (11.23) | (11.96) | (3.68) | (3.41) | (7.45) |
| Total distributions | (11.33) | (12.06) | (3.81) | (3.43) | (7.45) |
| Redemption fees added to paid in capitalB | – | –C | –C | –C | –C |
| Net asset value, end of period | $89.28 | $92.21 | $89.93 | $78.59 | $87.26 |
| Total ReturnD | 9.61% | 17.03% | 19.71% | (6.30)% | 26.88% |
| Ratios to Average Net AssetsE,F | | | | | |
| Expenses before reductions | .76% | .77% | .78% | .77% | .79% |
| Expenses net of fee waivers, if any | .76% | .77% | .78% | .77% | .79% |
| Expenses net of all reductions | .76% | .76% | .78% | .77% | .79% |
| Net investment income (loss) | .14% | .12% | .15% | (.03)% | (.12)% |
| Supplemental Data | | | | | |
| Net assets, end of period (000 omitted) | $1,343,070 | $829,692 | $760,108 | $837,518 | $878,416 |
| Portfolio turnover rateG | 60% | 65% | 26% | 39% | 44% |
A For the year ended February 29.
B Calculated based on average shares outstanding during the period.
C Amount represents less than $.005 per share.
D Total returns would have been lower if certain expenses had not been reduced during the applicable periods shown.
E Fees and expenses of any underlying Fidelity Central Funds are not included in the Fund's expense ratio. The Fund indirectly bears its proportionate share of the expenses of any underlying Fidelity Central Funds.
F Expense ratios reflect operating expenses of the Fund. Expenses before reductions do not reflect amounts reimbursed by the investment adviser or reductions from brokerage service arrangements or reductions from other expense offset arrangements and do not represent the amount paid by the Fund during periods when reimbursements or reductions occur. Expenses net of fee waivers reflect expenses after reimbursement by the investment adviser but prior to reductions from brokerage service arrangements or other expense offset arrangements. Expenses net of all reductions represent the net expenses paid by the Fund.
G Amount does not include the portfolio activity of any underlying Fidelity Central Funds.
See accompanying notes which are an integral part of the financial statements.
Medical Technology and Devices Portfolio
Performance: The Bottom Line
Average annual total return reflects the change in the value of an investment, assuming reinvestment of distributions from dividend income and capital gains (the profits earned upon the sale of securities that have grown in value, if any) and assuming a constant rate of performance each year. The hypothetical investment and the average annual total returns do not reflect the deduction of taxes that a shareholder would pay on fund distributions or the redemption of fund shares. During periods of reimbursement by Fidelity, a fund’s total return will be greater than it would be had the reimbursement not occurred. How a fund did yesterday is no guarantee of how it will do tomorrow.
Average Annual Total Returns
| For the periods ended February 28, 2019 | Past 1 year | Past 5 years | Past 10 years |
| Medical Technology and Devices Portfolio | 23.85% | 17.94% | 19.84% |
Prior to January 1, 2018, the fund was named Medical Equipment and Systems Portfolio, and the fund operated under certain different investment policies and compared its performance to a different index. The fund's historical performance may not represent its current investment policies.
$10,000 Over 10 Years
Let's say hypothetically that $10,000 was invested in Medical Technology and Devices Portfolio on February 28, 2009.
The chart shows how the value of your investment would have changed, and also shows how the S&P 500® Index performed over the same period.
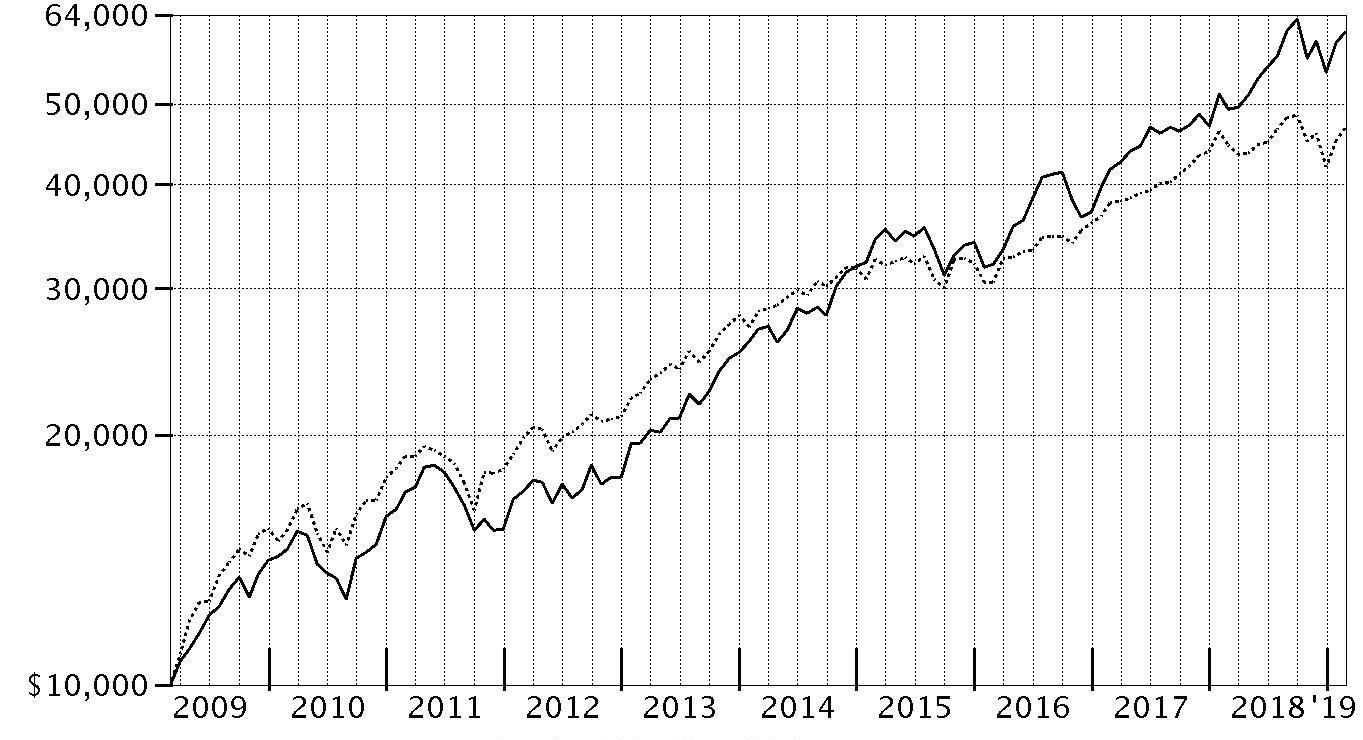
| Period Ending Values |
| $61,089 | Medical Technology and Devices Portfolio |
| $46,739 | S&P 500® Index |
Medical Technology and Devices Portfolio
Management's Discussion of Fund Performance
Market Recap: The S&P 500
® index gained 4.68% for the 12 months ending February 28, 2019, as the U.S. equity bellwether began the new year on a high note after enduring a final quarter of 2018 in which resurgent volatility upset the aging bull market. In October, rising U.S. Treasury yields and concern about peaking corporate earnings growth sent many investors fleeing from risk assets as they were still dealing with lingering uncertainty related to global trade and the U.S. Federal Reserve picking up the pace of interest rate hikes. The index returned -6.84% in October, at the time its largest monthly drop in seven years. But conditions worsened through Christmas, as jitters about the economy and another hike in rates led to a spike in market volatility and a -9.03% result for December. Sharply reversing course to begin 2019, the S&P 500
® gained 11.48% year-to-date, its strongest two-month opening since 1991, amid upbeat company earnings/outlooks and signs the Fed may pause on rates. For the full period, some economically sensitive sectors fared worst, with financials (-6%) and materials (-6%) both losing ground. Energy gained 1%, while communication services and industrials each rose roughly 2%. In contrast, the defensive utilities (+20%), real estate (+20%) and health care (+11%) sectors led the way, while consumer staples finished near the index. Information technology and consumer discretionary were rattled in the late-2018 downturn, but earlier strength contributed to advances of 9% and roughly 7%, respectively.
Comments from Portfolio Manager Eddie Yoon: For the fiscal year, the fund gained 23.85%, outpacing the 22.17% advance of the MSCI U.S. IMI Custom Health Care Technology and Equipment 25/50 Linked Index, and well ahead of the broad-based S&P 500
®. The industry far exceeded the U.S. stock market as a whole the past 12 months, benefiting from solid corporate fundamentals, largely driven by strong employment and health care utilization trends globally. Innovation remained a key driver in establishing new product cycles, while rising demand for products and services also supported the industry. Versus the MSCI sector index, favorable security selection drove the fund's outperformance, especially picks in the health care equipment segment. Choices in health care technology also boosted relative performance to a lesser extent. Among individual stocks, device maker Boston Scientific (+47%) was by far the fund’s leading contributor and one of our largest positions at period end. The stock rose as the market gained confidence in the firm’s emerging pipeline of new medical devices across its many business units. Shares of Dexcom (+148%), a market leader in continuous glucose-monitoring sensors, surged in August after the firm reported better-than-expected second-quarter financial results. Conversely, underweighting index heavyweight Abbott Laboratories was the fund's largest relative detractor as the stock gained 31% during the fiscal year due to investor excitement about the prospects for accelerating organic growth driven by strong product cycles from its St. Jude Medical acquisition, as well as the FreeStyle Libre launch for diabetes. Another laggard within the portfolio was its largest holding and material overweight in Becton Dickinson, a global supplier of syringes and other widely used medical devices that was up 14% the past 12 months.
The views expressed above reflect those of the portfolio manager(s) only through the end of the period as stated on the cover of this report and do not necessarily represent the views of Fidelity or any other person in the Fidelity organization. Any such views are subject to change at any time based upon market or other conditions and Fidelity disclaims any responsibility to update such views. These views may not be relied on as investment advice and, because investment decisions for a Fidelity fund are based on numerous factors, may not be relied on as an indication of trading intent on behalf of any Fidelity fund.
Medical Technology and Devices Portfolio
Investment Summary (Unaudited)
Top Ten Stocks as of February 28, 2019
| | % of fund's net assets |
| Becton, Dickinson & Co. | 12.1 |
| Boston Scientific Corp. | 10.3 |
| Thermo Fisher Scientific, Inc. | 6.5 |
| Stryker Corp. | 6.3 |
| Medtronic PLC | 5.3 |
| Intuitive Surgical, Inc. | 5.2 |
| Danaher Corp. | 4.1 |
| Abbott Laboratories | 3.2 |
| Hologic, Inc. | 3.2 |
| Teleflex, Inc. | 3.1 |
| | 59.3 |
Top Industries (% of fund's net assets)
| As of February 28, 2019 |
| | Health Care Equipment & Supplies | 73.9% |
| | Life Sciences Tools & Services | 11.9% |
| | Health Care Providers & Services | 8.5% |
| | Biotechnology | 1.9% |
| | Health Care Technology | 1.5% |
| | All Others* | 2.3% |

* Includes short-term investments and net other assets (liabilities).
Medical Technology and Devices Portfolio
Schedule of Investments February 28, 2019
Showing Percentage of Net Assets
| Common Stocks - 98.8% | | | |
| | | Shares | Value |
| Biotechnology - 1.8% | | | |
| Biotechnology - 1.8% | | | |
| Calyxt, Inc. (a) | | 673,358 | $10,793,929 |
| Natera, Inc. (a) | | 1,440,000 | 22,809,600 |
| Polarityte, Inc. (a)(b)(c) | | 1,200,000 | 14,532,000 |
| Sarepta Therapeutics, Inc. (a) | | 500,000 | 72,120,000 |
| | | | 120,255,529 |
| Health Care Equipment & Supplies - 73.8% | | | |
| Health Care Equipment - 70.2% | | | |
| Abbott Laboratories | | 2,800,000 | 217,336,000 |
| Atricure, Inc. (a)(c) | | 2,080,000 | 66,435,200 |
| Baxter International, Inc. | | 500,000 | 37,365,000 |
| Becton, Dickinson & Co. | | 3,300,000 | 821,006,999 |
| Boston Scientific Corp. (a) | | 17,450,000 | 700,094,000 |
| Danaher Corp. | | 2,200,000 | 279,444,000 |
| DexCom, Inc. (a) | | 190,000 | 26,472,700 |
| Edwards Lifesciences Corp. (a) | | 260,000 | 44,015,400 |
| Fisher & Paykel Healthcare Corp. | | 5,000,000 | 50,053,500 |
| Genmark Diagnostics, Inc. (a) | | 2,100,000 | 16,149,000 |
| Hologic, Inc. (a) | | 4,550,000 | 214,532,500 |
| IDEXX Laboratories, Inc. (a) | | 200,000 | 42,206,000 |
| Insulet Corp. (a)(b) | | 1,250,000 | 117,387,500 |
| Integra LifeSciences Holdings Corp. (a) | | 1,420,000 | 78,227,800 |
| Intuitive Surgical, Inc. (a) | | 640,000 | 350,470,400 |
| LivaNova PLC (a) | | 540,000 | 50,328,000 |
| Masimo Corp. (a) | | 1,330,000 | 174,602,400 |
| Medtronic PLC | | 4,000,000 | 362,000,000 |
| Nakanishi, Inc. | | 1,000,000 | 17,871,081 |
| Penumbra, Inc. (a) | | 917,232 | 122,606,401 |
| ResMed, Inc. | | 800,000 | 81,944,000 |
| Smith & Nephew PLC sponsored ADR (b) | | 1,140,000 | 44,049,600 |
| Steris PLC | | 360,000 | 43,545,600 |
| Stryker Corp. | | 2,250,000 | 424,147,500 |
| Teleflex, Inc. | | 720,000 | 208,684,800 |
| Varian Medical Systems, Inc. (a) | | 340,000 | 45,682,400 |
| Wright Medical Group NV (a) | | 4,000,000 | 125,240,000 |
| | | | 4,761,897,781 |
| Health Care Supplies - 3.6% | | | |
| Align Technology, Inc. (a) | | 430,000 | 111,357,100 |
| ICU Medical, Inc. (a) | | 320,000 | 78,643,200 |
| Nanosonics Ltd. (a)(b)(c) | | 19,600,000 | 57,698,529 |
| | | | 247,698,829 |
|
| TOTAL HEALTH CARE EQUIPMENT & SUPPLIES | | | 5,009,596,610 |
|
| Health Care Providers & Services - 8.4% | | | |
| Health Care Distributors & Services - 0.5% | | | |
| Covetrus, Inc. (a) | | 900,000 | 32,202,000 |
| Health Care Facilities - 1.5% | | | |
| HCA Holdings, Inc. | | 750,000 | 104,280,000 |
| Health Care Services - 1.2% | | | |
| 1Life Healthcare, Inc. (a)(d)(e) | | 606,058 | 7,533,301 |
| Cigna Corp. | | 425,000 | 74,137,000 |
| | | | 81,670,301 |
| Managed Health Care - 5.2% | | | |
| Humana, Inc. | | 550,000 | 156,772,000 |
| UnitedHealth Group, Inc. | | 800,000 | 193,776,000 |
| | | | 350,548,000 |
|
| TOTAL HEALTH CARE PROVIDERS & SERVICES | | | 568,700,301 |
|
| Health Care Technology - 1.5% | | | |
| Health Care Technology - 1.5% | | | |
| Castlight Health, Inc. (a) | | 999,300 | 3,187,767 |
| Castlight Health, Inc. Class B (a) | | 3,000,000 | 9,570,000 |
| HTG Molecular Diagnostics (a)(b)(c) | | 2,392,976 | 6,580,684 |
| Teladoc Health, Inc. (a)(b) | | 770,000 | 49,557,200 |
| Veeva Systems, Inc. Class A (a) | | 260,000 | 30,656,600 |
| | | | 99,552,251 |
| Insurance - 0.3% | | | |
| Insurance Brokers - 0.3% | | | |
| eHealth, Inc. (a) | | 360,000 | 19,227,600 |
| Life Sciences Tools & Services - 11.9% | | | |
| Life Sciences Tools & Services - 11.9% | | | |
| Agilent Technologies, Inc. | | 800,000 | 63,552,000 |
| Bruker Corp. | | 2,000,000 | 76,420,000 |
| Lonza Group AG | | 372,899 | 103,681,652 |
| PerkinElmer, Inc. | | 1,000,000 | 94,160,000 |
| Sartorius Stedim Biotech | | 240,000 | 28,254,258 |
| Thermo Fisher Scientific, Inc. | | 1,700,000 | 441,269,000 |
| | | | 807,336,910 |
| Pharmaceuticals - 0.2% | | | |
| Pharmaceuticals - 0.2% | | | |
| Nektar Therapeutics (a) | | 400,000 | 16,216,000 |
| Software - 0.9% | | | |
| Application Software - 0.9% | | | |
| Benefitfocus, Inc. (a)(b) | | 1,290,000 | 63,364,800 |
| TOTAL COMMON STOCKS | | | |
| (Cost $4,959,066,512) | | | 6,704,250,001 |
|
| Convertible Preferred Stocks - 0.5% | | | |
| Biotechnology - 0.1% | | | |
| Biotechnology - 0.1% | | | |
| 10X Genomics, Inc. Series D1 (d)(e) | | 392,772 | 4,999,988 |
| Health Care Equipment & Supplies - 0.1% | | | |
| Health Care Equipment - 0.1% | | | |
| Shockwave Medical, Inc. Series C (a)(e) | | 608,679 | 9,312,789 |
| Health Care Providers & Services - 0.1% | | | |
| Health Care Services - 0.1% | | | |
| 1Life Healthcare, Inc. Series G (a)(d)(e) | | 455,526 | 5,662,188 |
| Software - 0.2% | | | |
| Application Software - 0.2% | | | |
| Outset Medical, Inc.: | | | |
| Series B (a)(d)(e) | | 3,307,754 | 10,287,115 |
| Series D (d)(e) | | 1,607,717 | 5,000,000 |
| | | | 15,287,115 |
| TOTAL CONVERTIBLE PREFERRED STOCKS | | | |
| (Cost $27,999,992) | | | 35,262,080 |
|
| Money Market Funds - 4.8% | | | |
| Fidelity Cash Central Fund, 2.44% (f) | | 179,279,196 | 179,315,052 |
| Fidelity Securities Lending Cash Central Fund 2.45% (f)(g) | | 149,343,607 | 149,358,541 |
| TOTAL MONEY MARKET FUNDS | | | |
| (Cost $328,671,273) | | | 328,673,593 |
| TOTAL INVESTMENT IN SECURITIES - 104.1% | | | |
| (Cost $5,315,737,777) | | | 7,068,185,674 |
| NET OTHER ASSETS (LIABILITIES) - (4.1)% | | | (280,540,789) |
| NET ASSETS - 100% | | | $6,787,644,885 |
Legend
(a) Non-income producing
(b) Security or a portion of the security is on loan at period end.
(c) Affiliated company
(d) Level 3 security
(e) Restricted securities - Investment in securities not registered under the Securities Act of 1933 (excluding 144A issues). At the end of the period, the value of restricted securities (excluding 144A issues) amounted to $42,795,381 or 0.6% of net assets.
(f) Affiliated fund that is generally available only to investment companies and other accounts managed by Fidelity Investments. The rate quoted is the annualized seven-day yield of the fund at period end. A complete unaudited listing of the fund's holdings as of its most recent quarter end is available upon request. In addition, each Fidelity Central Fund's financial statements, which are not covered by the Fund's Report of Independent Registered Public Accounting Firm, are available on the SEC's website or upon request.
(g) Investment made with cash collateral received from securities on loan.
Additional information on each restricted holding is as follows:
| Security | Acquisition Date | Acquisition Cost |
| 10X Genomics, Inc. Series D1 | 10/18/18 | $4,999,988 |
| 1Life Healthcare, Inc. | 9/28/18 | $7,533,301 |
| 1Life Healthcare, Inc. Series G | 4/10/14 | $3,000,003 |
| Outset Medical, Inc. Series B | 5/5/15 - 6/5/15 | $7,500,001 |
| Outset Medical, Inc. Series D | 8/20/18 | $5,000,000 |
| Shockwave Medical, Inc. Series C | 9/27/17 | $7,500,000 |
Affiliated Central Funds
Information regarding fiscal year to date income earned by the Fund from investments in Fidelity Central Funds is as follows:
| Fund | Income earned |
| Fidelity Cash Central Fund | $1,210,712 |
| Fidelity Securities Lending Cash Central Fund | 1,644,243 |
| Total | $2,854,955 |
Amounts in the income column in the above table include any capital gain distributions from underlying funds, which are presented in the corresponding line-item in the Statement of Operations, if applicable.
Other Affiliated Issuers
An affiliated company is a company in which the Fund has ownership of at least 5% of the voting securities. Fiscal year to date transactions with companies which are or were affiliates are as follows:
| Affiliate | Value, beginning of period | Purchases | Sales Proceeds | Dividend Income | Realized Gain (loss) | Change in Unrealized appreciation (depreciation) | Value, end of period |
| Atricure, Inc. | $34,668,540 | $3,216,066 | $-- | $-- | $-- | $28,550,594 | $66,435,200 |
| HTG Molecular Diagnostics | 10,983,760 | -- | -- | -- | -- | (4,403,076) | 6,580,684 |
| Nanosonics Ltd. | 20,912,757 | 20,828,768 | -- | -- | -- | 15,957,004 | 57,698,529 |
| Polarityte, Inc. | -- | 20,921,356 | -- | -- | -- | (6,389,356) | 14,532,000 |
| Total | $66,565,057 | $44,966,190 | $-- | $-- | $-- | $33,715,166 | $145,246,413 |
Investment Valuation
The following is a summary of the inputs used, as of February 28, 2019, involving the Fund's assets and liabilities carried at fair value. The inputs or methodology used for valuing securities may not be an indication of the risk associated with investing in those securities. For more information on valuation inputs, and their aggregation into the levels used below, please refer to the Investment Valuation section in the accompanying Notes to Financial Statements.
| | Valuation Inputs at Reporting Date: |
| Description | Total | Level 1 | Level 2 | Level 3 |
| Investments in Securities: | | | | |
| Common Stocks | $6,704,250,001 | $6,696,716,700 | $-- | $7,533,301 |
| Convertible Preferred Stocks | 35,262,080 | -- | 9,312,789 | 25,949,291 |
| Money Market Funds | 328,673,593 | 328,673,593 | -- | -- |
| Total Investments in Securities: | $7,068,185,674 | $7,025,390,293 | $9,312,789 | $33,482,592 |
Other Information
Distribution of investments by country or territory of incorporation, as a percentage of Total Net Assets, is as follows (Unaudited):
| United States of America | 87.2% |
| Ireland | 5.3% |
| United Kingdom | 2.0% |
| Netherlands | 1.8% |
| Switzerland | 1.5% |
| Others (Individually Less Than 1%) | 2.2% |
| | 100.0% |
See accompanying notes which are an integral part of the financial statements.
Medical Technology and Devices Portfolio
Financial Statements
Statement of Assets and Liabilities
| | | February 28, 2019 |
| Assets | | |
Investment in securities, at value (including securities loaned of $142,433,741) — See accompanying schedule:
Unaffiliated issuers (cost $4,875,054,948) | $6,594,265,668 | |
| Fidelity Central Funds (cost $328,671,273) | 328,673,593 | |
| Other affiliated issuers (cost $112,011,556) | 145,246,413 | |
| Total Investment in Securities (cost $5,315,737,777) | | $7,068,185,674 |
| Foreign currency held at value (cost $3,836,912) | | 3,836,912 |
| Receivable for investments sold | | 2,949,243 |
| Receivable for fund shares sold | | 13,410,783 |
| Dividends receivable | | 1,224,653 |
| Distributions receivable from Fidelity Central Funds | | 493,101 |
| Prepaid expenses | | 34,875 |
| Other receivables | | 182,328 |
| Total assets | | 7,090,317,569 |
| Liabilities | | |
| Payable for investments purchased | $139,975,880 | |
| Payable for fund shares redeemed | 9,233,318 | |
| Accrued management fee | 2,971,915 | |
| Other affiliated payables | 925,040 | |
| Other payables and accrued expenses | 221,258 | |
| Collateral on securities loaned | 149,345,273 | |
| Total liabilities | | 302,672,684 |
| Net Assets | | $6,787,644,885 |
| Net Assets consist of: | | |
| Paid in capital | | $5,055,528,830 |
| Total distributable earnings (loss) | | 1,732,116,055 |
| Net Assets, for 128,267,631 shares outstanding | | $6,787,644,885 |
| Net Asset Value, offering price and redemption price per share ($6,787,644,885 ÷ 128,267,631 shares) | | $52.92 |
See accompanying notes which are an integral part of the financial statements.
Statement of Operations
| | | Year ended February 28, 2019 |
| Investment Income | | |
| Dividends | | $32,379,202 |
| Income from Fidelity Central Funds (including $1,644,243 from security lending) | | 2,854,955 |
| Total income | | 35,234,157 |
| Expenses | | |
| Management fee | $28,969,901 | |
| Transfer agent fees | 8,724,085 | |
| Accounting and security lending fees | 1,113,691 | |
| Custodian fees and expenses | 93,311 | |
| Independent trustees' fees and expenses | 28,463 | |
| Registration fees | 295,540 | |
| Audit | 43,366 | |
| Legal | 26,045 | |
| Interest | 1,554 | |
| Miscellaneous | 35,628 | |
| Total expenses before reductions | 39,331,584 | |
| Expense reductions | (220,147) | |
| Total expenses after reductions | | 39,111,437 |
| Net investment income (loss) | | (3,877,280) |
| Realized and Unrealized Gain (Loss) | | |
| Net realized gain (loss) on: | | |
| Investment securities: | | |
| Unaffiliated issuers | 196,888,966 | |
| Fidelity Central Funds | (1,340) | |
| Foreign currency transactions | (23,232) | |
| Total net realized gain (loss) | | 196,864,394 |
| Change in net unrealized appreciation (depreciation) on: | | |
| Investment securities: | | |
| Unaffiliated issuers | 811,080,048 | |
| Fidelity Central Funds | 2,320 | |
| Other affiliated issuers | 33,715,166 | |
| Assets and liabilities in foreign currencies | (11,755) | |
| Total change in net unrealized appreciation (depreciation) | | 844,785,779 |
| Net gain (loss) | | 1,041,650,173 |
| Net increase (decrease) in net assets resulting from operations | | $1,037,772,893 |
See accompanying notes which are an integral part of the financial statements.
Statement of Changes in Net Assets
| | Year ended February 28, 2019 | Year ended February 28, 2018 |
| Increase (Decrease) in Net Assets | | |
| Operations | | |
| Net investment income (loss) | $(3,877,280) | $4,308,032 |
| Net realized gain (loss) | 196,864,394 | 430,133,960 |
| Change in net unrealized appreciation (depreciation) | 844,785,779 | 177,625,912 |
| Net increase (decrease) in net assets resulting from operations | 1,037,772,893 | 612,067,904 |
| Distributions to shareholders | (356,492,522) | – |
| Distributions to shareholders from net investment income | – | (6,689,760) |
| Distributions to shareholders from net realized gain | – | (221,756,409) |
| Total distributions | (356,492,522) | (228,446,169) |
| Share transactions | | |
| Proceeds from sales of shares | 3,069,361,368 | 1,701,778,731 |
| Reinvestment of distributions | 339,089,973 | 218,219,113 |
| Cost of shares redeemed | (1,366,012,756) | (1,374,069,760) |
| Net increase (decrease) in net assets resulting from share transactions | 2,042,438,585 | 545,928,084 |
| Total increase (decrease) in net assets | 2,723,718,956 | 929,549,819 |
| Net Assets | | |
| Beginning of period | 4,063,925,929 | 3,134,376,110 |
| End of period | $6,787,644,885 | $4,063,925,929 |
| Other Information | | |
| Distributions in excess of net investment income end of period | | $(2,470,902) |
| Shares | | |
| Sold | 60,281,432 | 37,902,629 |
| Issued in reinvestment of distributions | 7,362,903 | 4,910,884 |
| Redeemed | (27,541,203) | (30,209,252) |
| Net increase (decrease) | 40,103,132 | 12,604,261 |
See accompanying notes which are an integral part of the financial statements.
Financial Highlights
Medical Technology and Devices Portfolio
| | | | | | |
| Years ended February 28, | 2019 | 2018 | 2017 | 2016A | 2015 |
| Selected Per–Share Data | | | | | |
| Net asset value, beginning of period | $46.09 | $41.48 | $33.75 | $41.90 | $38.03 |
| Income from Investment Operations | | | | | |
| Net investment income (loss)B | (.04) | .05 | .01 | (.03) | .04 |
| Net realized and unrealized gain (loss) | 10.40 | 7.31 | 9.87 | (2.25) | 9.86 |
| Total from investment operations | 10.36 | 7.36 | 9.88 | (2.28) | 9.90 |
| Distributions from net investment income | – | (.08) | – | (.01) | (.05) |
| Distributions from net realized gain | (3.53) | (2.67) | (2.15) | (5.86) | (5.98) |
| Total distributions | (3.53) | (2.75) | (2.15) | (5.87) | (6.03) |
| Redemption fees added to paid in capitalB | – | – | –C | –C | –C |
| Net asset value, end of period | $52.92 | $46.09 | $41.48 | $33.75 | $41.90 |
| Total ReturnD | 23.85% | 18.01% | 30.13% | (6.63)% | 28.52% |
| Ratios to Average Net AssetsE,F | | | | | |
| Expenses before reductions | .73% | .76% | .76% | .76% | .77% |
| Expenses net of fee waivers, if any | .73% | .76% | .76% | .76% | .77% |
| Expenses net of all reductions | .73% | .75% | .76% | .75% | .77% |
| Net investment income (loss) | (.07)% | .11% | .01% | (.09)% | .11% |
| Supplemental Data | | | | | |
| Net assets, end of period (000 omitted) | $6,787,645 | $4,063,926 | $3,134,376 | $1,915,772 | $2,107,515 |
| Portfolio turnover rateG | 43% | 77% | 55% | 46% | 106% |
A For the year ended February 29.
B Calculated based on average shares outstanding during the period.
C Amount represents less than $.005 per share.
D Total returns would have been lower if certain expenses had not been reduced during the applicable periods shown.
E Fees and expenses of any underlying Fidelity Central Funds are not included in the Fund's expense ratio. The Fund indirectly bears its proportionate share of the expenses of any underlying Fidelity Central Funds.
F Expense ratios reflect operating expenses of the Fund. Expenses before reductions do not reflect amounts reimbursed by the investment adviser or reductions from brokerage service arrangements or reductions from other expense offset arrangements and do not represent the amount paid by the Fund during periods when reimbursements or reductions occur. Expenses net of fee waivers reflect expenses after reimbursement by the investment adviser but prior to reductions from brokerage service arrangements or other expense offset arrangements. Expenses net of all reductions represent the net expenses paid by the Fund.
G Amount does not include the portfolio activity of any underlying Fidelity Central Funds.
See accompanying notes which are an integral part of the financial statements.
Pharmaceuticals Portfolio
Performance: The Bottom Line
Average annual total return reflects the change in the value of an investment, assuming reinvestment of distributions from dividend income and capital gains (the profits earned upon the sale of securities that have grown in value, if any) and assuming a constant rate of performance each year. The hypothetical investment and the average annual total returns do not reflect the deduction of taxes that a shareholder would pay on fund distributions or the redemption of fund shares. During periods of reimbursement by Fidelity, a fund’s total return will be greater than it would be had the reimbursement not occurred. How a fund did yesterday is no guarantee of how it will do tomorrow.
Average Annual Total Returns
| For the periods ended February 28, 2019 | Past 1 year | Past 5 years | Past 10 years |
| Pharmaceuticals Portfolio | 14.15% | 5.23% | 16.14% |
$10,000 Over 10 Years
Let's say hypothetically that $10,000 was invested in Pharmaceuticals Portfolio on February 28, 2009.
The chart shows how the value of your investment would have changed, and also shows how the S&P 500® Index performed over the same period.
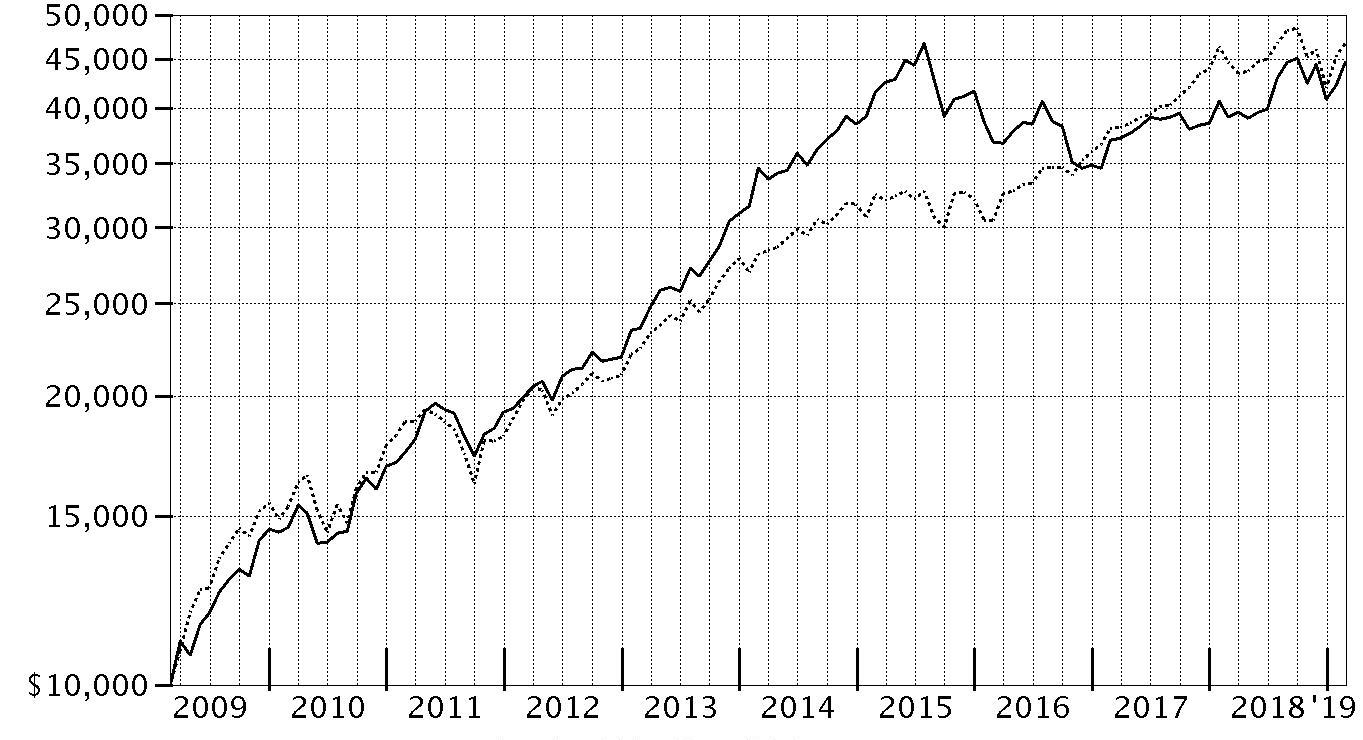
| Period Ending Values |
| $44,643 | Pharmaceuticals Portfolio |
| $46,739 | S&P 500® Index |
Pharmaceuticals Portfolio
Management's Discussion of Fund Performance
Market Recap: The S&P 500
® index gained 4.68% for the 12 months ending February 28, 2019, as the U.S. equity bellwether began the new year on a high note after enduring a final quarter of 2018 in which resurgent volatility upset the aging bull market. In October, rising U.S. Treasury yields and concern about peaking corporate earnings growth sent many investors fleeing from risk assets as they were still dealing with lingering uncertainty related to global trade and the U.S. Federal Reserve picking up the pace of interest rate hikes. The index returned -6.84% in October, at the time its largest monthly drop in seven years. But conditions worsened through Christmas, as jitters about the economy and another hike in rates led to a spike in market volatility and a -9.03% result for December. Sharply reversing course to begin 2019, the S&P 500
® gained 11.48% year-to-date, its strongest two-month opening since 1991, amid upbeat company earnings/outlooks and signs the Fed may pause on rates. For the full period, some economically sensitive sectors fared worst, with financials (-6%) and materials (-6%) both losing ground. Energy gained 1%, while communication services and industrials each rose roughly 2%. In contrast, the defensive utilities (+20%), real estate (+20%) and health care (+11%) sectors led the way, while consumer staples finished near the index. Information technology and consumer discretionary were rattled in the late-2018 downturn, but earlier strength contributed to advances of 9% and roughly 7%, respectively.
Comments from Portfolio Manager Karim Suwwan de Felipe: For the fiscal year, the fund gained 14.15%, outpacing the 12.63% result of the MSCI U.S. North American IMI + ADR Custom Pharmaceuticals 25/50 Linked Index and well ahead of the broad-market S&P 500 index. During the past year, the business fundamentals for pharmaceutical firms continued to slowly improve. Versus the sector index, security selection among out-of-benchmark biotechnology and health care equipment companies drove the fund’s outperformance this period. Among individual stocks, a non-index stake in gene therapy firm Sarepta Therapeutics contributed more than any other fund position versus the industry benchmark, driven by early-stage trial data for its gene-therapy programs treating orphan indications such as Duchenne muscular dystrophy. AstraZeneca and Roche Holdings, two of the fund’s largest pharma holdings, also added value. Conversely, Nektar Therapeutics, a clinical-stage biopharma firm that reported underwhelming preliminary results for its lead drug candidate this period, detracted notably. It also hurt to not own index components Canopy Growth and Cronos Group, two Canadian companies focused on commercializing medical and recreational marijuana.
The views expressed above reflect those of the portfolio manager(s) only through the end of the period as stated on the cover of this report and do not necessarily represent the views of Fidelity or any other person in the Fidelity organization. Any such views are subject to change at any time based upon market or other conditions and Fidelity disclaims any responsibility to update such views. These views may not be relied on as investment advice and, because investment decisions for a Fidelity fund are based on numerous factors, may not be relied on as an indication of trading intent on behalf of any Fidelity fund.
Note to Shareholders: On July 31, 2018, Asher Anolic transitioned off of the fund, leaving Karim Suwwan de Felipe as sole portfolio manager.
Pharmaceuticals Portfolio
Investment Summary (Unaudited)
Top Ten Stocks as of February 28, 2019
| | % of fund's net assets |
| AstraZeneca PLC sponsored ADR | 12.5 |
| Johnson & Johnson | 9.2 |
| Bristol-Myers Squibb Co. | 7.4 |
| Roche Holding AG (participation certificate) | 7.0 |
| Sanofi SA sponsored ADR | 6.9 |
| Merck & Co., Inc. | 6.3 |
| Eli Lilly & Co. | 4.9 |
| Allergan PLC | 4.7 |
| Novartis AG sponsored ADR | 4.6 |
| Sarepta Therapeutics, Inc. | 3.3 |
| | 66.8 |
Top Industries (% of fund's net assets)
| As of February 28, 2019 |
| | Pharmaceuticals | 79.6% |
| | Biotechnology | 14.2% |
| | Health Care Equipment & Supplies | 4.4% |
| | All Others* | 1.8% |

* Includes short-term investments and net other assets (liabilities).
Pharmaceuticals Portfolio
Schedule of Investments February 28, 2019
Showing Percentage of Net Assets
| Common Stocks - 98.2% | | | |
| | | Shares | Value |
| Biotechnology - 14.2% | | | |
| Biotechnology - 14.2% | | | |
| Abeona Therapeutics, Inc. (a) | | 134,400 | $943,488 |
| Acceleron Pharma, Inc. (a) | | 69,600 | 3,065,184 |
| Alnylam Pharmaceuticals, Inc. (a) | | 33,200 | 2,822,000 |
| Amgen, Inc. | | 75,800 | 14,408,064 |
| AnaptysBio, Inc. (a) | | 17,300 | 1,191,451 |
| Argenx SE (a) | | 25,300 | 3,364,082 |
| Array BioPharma, Inc. (a) | | 275,100 | 6,310,794 |
| Ascendis Pharma A/S sponsored ADR (a) | | 45,900 | 3,342,438 |
| Celgene Corp. (a) | | 365 | 30,339 |
| CRISPR Therapeutics AG (a)(b) | | 30,400 | 1,075,856 |
| Cytokinetics, Inc. (a) | | 111,000 | 801,420 |
| FibroGen, Inc. (a) | | 38,200 | 2,207,960 |
| Galapagos Genomics NV sponsored ADR (a) | | 24,400 | 2,381,928 |
| Global Blood Therapeutics, Inc. (a) | | 93,600 | 4,914,000 |
| GlycoMimetics, Inc. (a) | | 133,300 | 1,638,257 |
| Gritstone Oncology, Inc. | | 24,000 | 308,640 |
| Immunomedics, Inc. (a)(b) | | 508,100 | 8,007,656 |
| Kalvista Pharmaceuticals, Inc. (a) | | 92,600 | 2,100,168 |
| Kezar Life Sciences, Inc. | | 74,300 | 1,512,005 |
| Leap Therapeutics, Inc. (a)(b) | | 722,400 | 1,126,944 |
| Leap Therapeutics, Inc. warrants 1/31/26 (a) | | 606,000 | 452,989 |
| Mirati Therapeutics, Inc. (a) | | 48,700 | 3,545,360 |
| Moderna, Inc. (b) | | 103,700 | 2,343,620 |
| Momenta Pharmaceuticals, Inc. (a) | | 67,267 | 947,792 |
| Morphosys AG sponsored ADR | | 105,100 | 2,704,223 |
| Olivo Labs (a)(c)(d) | | 6,851 | 0 |
| PTC Therapeutics, Inc. (a) | | 64,100 | 2,214,014 |
| REGENXBIO, Inc. (a) | | 46,400 | 2,400,272 |
| Sarepta Therapeutics, Inc. (a) | | 168,441 | 24,295,930 |
| Synthorx, Inc. (b) | | 125,200 | 2,492,732 |
| Xencor, Inc. (a) | | 66,468 | 2,016,639 |
| Zai Lab Ltd. ADR (a) | | 33,088 | 953,596 |
| | | | 105,919,841 |
| Health Care Equipment & Supplies - 4.4% | | | |
| Health Care Equipment - 4.4% | | | |
| Becton, Dickinson & Co. | | 74,300 | 18,485,097 |
| Boston Scientific Corp. (a) | | 371,600 | 14,908,592 |
| | | | 33,393,689 |
| Personal Products - 0.0% | | | |
| Personal Products - 0.0% | | | |
| MYOS Corp. (a) | | 40,000 | 58,800 |
| Pharmaceuticals - 79.6% | | | |
| Pharmaceuticals - 79.6% | | | |
| Allergan PLC | | 254,038 | 34,983,573 |
| Ascletis Pharma, Inc. (a)(e) | | 1,831,000 | 1,630,458 |
| AstraZeneca PLC sponsored ADR | | 2,239,400 | 93,114,253 |
| Bausch Health Cos., Inc. (Canada) (a) | | 214,900 | 5,104,885 |
| Bristol-Myers Squibb Co. | | 1,078,180 | 55,698,779 |
| CymaBay Therapeutics, Inc. (a) | | 122,700 | 1,449,087 |
| Eli Lilly & Co. | | 293,000 | 37,002,970 |
| GW Pharmaceuticals PLC ADR (a)(b) | | 20,800 | 3,577,808 |
| Horizon Pharma PLC (a) | | 308,000 | 8,935,080 |
| Johnson & Johnson | | 503,750 | 68,832,400 |
| Merck & Co., Inc. | | 575,036 | 46,744,676 |
| Mylan NV (a) | | 283,400 | 7,478,926 |
| MyoKardia, Inc. (a) | | 89,600 | 4,018,560 |
| Nektar Therapeutics (a) | | 213,533 | 8,656,628 |
| Novartis AG sponsored ADR | | 374,248 | 34,142,645 |
| Novo Nordisk A/S Series B sponsored ADR | | 234,400 | 11,473,880 |
| Ocular Therapeutix, Inc. (a)(b) | | 279,300 | 1,242,885 |
| Perrigo Co. PLC | | 77,000 | 3,749,900 |
| Pfizer, Inc. | | 462,288 | 20,040,185 |
| Reata Pharmaceuticals, Inc. (a) | | 60,800 | 5,735,872 |
| Revance Therapeutics, Inc. (a) | | 64,300 | 1,089,242 |
| Roche Holding AG (participation certificate) | | 188,476 | 52,306,665 |
| Sanofi SA sponsored ADR | | 1,234,822 | 51,368,595 |
| The Medicines Company (a)(b) | | 173,184 | 4,272,449 |
| Theravance Biopharma, Inc. (a) | | 68,697 | 1,667,276 |
| Tonghua Dongbao Pharmaceutical Co. Ltd. (A Shares) | | 833,109 | 1,815,774 |
| WAVE Life Sciences (a)(b) | | 73,700 | 3,090,241 |
| Zoetis, Inc. Class A | | 231,300 | 21,795,399 |
| Zogenix, Inc. (a) | | 77,900 | 4,107,667 |
| | | | 595,126,758 |
| TOTAL COMMON STOCKS | | | |
| (Cost $559,489,104) | | | 734,499,088 |
|
| Money Market Funds - 3.2% | | | |
| Fidelity Cash Central Fund, 2.44% (f) | | 1,708,267 | 1,708,608 |
| Fidelity Securities Lending Cash Central Fund 2.45% (f)(g) | | 22,035,110 | 22,037,314 |
| TOTAL MONEY MARKET FUNDS | | | |
| (Cost $23,745,922) | | | 23,745,922 |
| TOTAL INVESTMENT IN SECURITIES - 101.4% | | | |
| (Cost $583,235,026) | | | 758,245,010 |
| NET OTHER ASSETS (LIABILITIES) - (1.4)% | | | (10,641,086) |
| NET ASSETS - 100% | | | $747,603,924 |
Legend
(a) Non-income producing
(b) Security or a portion of the security is on loan at period end.
(c) Level 3 security
(d) Restricted securities - Investment in securities not registered under the Securities Act of 1933 (excluding 144A issues). At the end of the period, the value of restricted securities (excluding 144A issues) amounted to $0 or 0.0% of net assets.
(e) Security exempt from registration under Rule 144A of the Securities Act of 1933. These securities may be resold in transactions exempt from registration, normally to qualified institutional buyers. At the end of the period, the value of these securities amounted to $1,630,458 or 0.2% of net assets.
(f) Affiliated fund that is generally available only to investment companies and other accounts managed by Fidelity Investments. The rate quoted is the annualized seven-day yield of the fund at period end. A complete unaudited listing of the fund's holdings as of its most recent quarter end is available upon request. In addition, each Fidelity Central Fund's financial statements, which are not covered by the Fund's Report of Independent Registered Public Accounting Firm, are available on the SEC's website or upon request.
(g) Investment made with cash collateral received from securities on loan.
Additional information on each restricted holding is as follows:
| Security | Acquisition Date | Acquisition Cost |
| Olivo Labs | 2/8/17 | $8,290 |
Affiliated Central Funds
Information regarding fiscal year to date income earned by the Fund from investments in Fidelity Central Funds is as follows:
| Fund | Income earned |
| Fidelity Cash Central Fund | $70,087 |
| Fidelity Securities Lending Cash Central Fund | 255,541 |
| Total | $325,628 |
Amounts in the income column in the above table include any capital gain distributions from underlying funds, which are presented in the corresponding line-item in the Statement of Operations, if applicable.
Investment Valuation
The following is a summary of the inputs used, as of February 28, 2019, involving the Fund's assets and liabilities carried at fair value. The inputs or methodology used for valuing securities may not be an indication of the risk associated with investing in those securities. For more information on valuation inputs, and their aggregation into the levels used below, please refer to the Investment Valuation section in the accompanying Notes to Financial Statements.
| | Valuation Inputs at Reporting Date: |
| Description | Total | Level 1 | Level 2 | Level 3 |
| Investments in Securities: | | | | |
| Common Stocks | $734,499,088 | $678,375,352 | $56,123,736 | $-- |
| Money Market Funds | 23,745,922 | 23,745,922 | -- | -- |
| Total Investments in Securities: | $758,245,010 | $702,121,274 | $56,123,736 | $-- |
Other Information
Distribution of investments by country or territory of incorporation, as a percentage of Total Net Assets, is as follows (Unaudited):
| United States of America | 56.1% |
| United Kingdom | 13.0% |
| Switzerland | 11.7% |
| France | 6.9% |
| Ireland | 6.4% |
| Denmark | 1.9% |
| Netherlands | 1.5% |
| Others (Individually Less Than 1%) | 2.5% |
| | 100.0% |
See accompanying notes which are an integral part of the financial statements.
Pharmaceuticals Portfolio
Financial Statements
Statement of Assets and Liabilities
| | | February 28, 2019 |
| Assets | | |
Investment in securities, at value (including securities loaned of $20,900,627) — See accompanying schedule:
Unaffiliated issuers (cost $559,489,104) | $734,499,088 | |
| Fidelity Central Funds (cost $23,745,922) | 23,745,922 | |
| Total Investment in Securities (cost $583,235,026) | | $758,245,010 |
| Receivable for investments sold | | 12,332,288 |
| Receivable for fund shares sold | | 511,809 |
| Dividends receivable | | 4,162,984 |
| Distributions receivable from Fidelity Central Funds | | 14,184 |
| Prepaid expenses | | 6,237 |
| Other receivables | | 100,639 |
| Total assets | | 775,373,151 |
| Liabilities | | |
| Payable for investments purchased | $3,190,042 | |
| Payable for fund shares redeemed | 1,939,167 | |
| Accrued management fee | 328,559 | |
| Other affiliated payables | 143,882 | |
| Other payables and accrued expenses | 138,804 | |
| Collateral on securities loaned | 22,028,773 | |
| Total liabilities | | 27,769,227 |
| Net Assets | | $747,603,924 |
| Net Assets consist of: | | |
| Paid in capital | | $555,558,902 |
| Total distributable earnings (loss) | | 192,045,022 |
| Net Assets, for 35,478,884 shares outstanding | | $747,603,924 |
| Net Asset Value, offering price and redemption price per share ($747,603,924 ÷ 35,478,884 shares) | | $21.07 |
See accompanying notes which are an integral part of the financial statements.
Statement of Operations
| | | Year ended February 28, 2019 |
| Investment Income | | |
| Dividends | | $17,647,837 |
| Income from Fidelity Central Funds (including $255,541 from security lending) | | 325,628 |
| Income before foreign taxes withheld | | 17,973,465 |
| Less foreign taxes withheld | | (1,177,028) |
| Total income | | 16,796,437 |
| Expenses | | |
| Management fee | $3,995,173 | |
| Transfer agent fees | 1,513,758 | |
| Accounting and security lending fees | 264,638 | |
| Custodian fees and expenses | 20,462 | |
| Independent trustees' fees and expenses | 4,133 | |
| Registration fees | 32,348 | |
| Audit | 47,837 | |
| Legal | 7,332 | |
| Interest | 499 | |
| Miscellaneous | 6,282 | |
| Total expenses before reductions | 5,892,462 | |
| Expense reductions | (35,614) | |
| Total expenses after reductions | | 5,856,848 |
| Net investment income (loss) | | 10,939,589 |
| Realized and Unrealized Gain (Loss) | | |
| Net realized gain (loss) on: | | |
| Investment securities: | | |
| Unaffiliated issuers | 48,998,404 | |
| Fidelity Central Funds | (974) | |
| Foreign currency transactions | 1,198 | |
| Total net realized gain (loss) | | 48,998,628 |
| Change in net unrealized appreciation (depreciation) on: | | |
| Investment securities: | | |
| Unaffiliated issuers | 37,042,551 | |
| Assets and liabilities in foreign currencies | (29,110) | |
| Total change in net unrealized appreciation (depreciation) | | 37,013,441 |
| Net gain (loss) | | 86,012,069 |
| Net increase (decrease) in net assets resulting from operations | | $96,951,658 |
See accompanying notes which are an integral part of the financial statements.
Statement of Changes in Net Assets
| | Year ended February 28, 2019 | Year ended February 28, 2018 |
| Increase (Decrease) in Net Assets | | |
| Operations | | |
| Net investment income (loss) | $10,939,589 | $12,772,769 |
| Net realized gain (loss) | 48,998,628 | 73,004,810 |
| Change in net unrealized appreciation (depreciation) | 37,013,441 | (34,184,441) |
| Net increase (decrease) in net assets resulting from operations | 96,951,658 | 51,593,138 |
| Distributions to shareholders | (14,056,846) | – |
| Distributions to shareholders from net investment income | – | (10,710,598) |
| Distributions to shareholders from net realized gain | – | (2,243,362) |
| Total distributions | (14,056,846) | (12,953,960) |
| Share transactions | | |
| Proceeds from sales of shares | 102,161,790 | 58,835,440 |
| Reinvestment of distributions | 13,373,472 | 12,347,170 |
| Cost of shares redeemed | (195,388,778) | (366,196,350) |
| Net increase (decrease) in net assets resulting from share transactions | (79,853,516) | (295,013,740) |
| Total increase (decrease) in net assets | 3,041,296 | (256,374,562) |
| Net Assets | | |
| Beginning of period | 744,562,628 | 1,000,937,190 |
| End of period | $747,603,924 | $744,562,628 |
| Other Information | | |
| Undistributed net investment income end of period | | $2,249,703 |
| Shares | | |
| Sold | 5,084,653 | 3,133,485 |
| Issued in reinvestment of distributions | 688,424 | 667,263 |
| Redeemed | (9,855,467) | (19,523,339) |
| Net increase (decrease) | (4,082,390) | (15,722,591) |
See accompanying notes which are an integral part of the financial statements.
Financial Highlights
Pharmaceuticals Portfolio
| | | | | | |
| Years ended February 28, | 2019 | 2018 | 2017 | 2016A | 2015 |
| Selected Per–Share Data | | | | | |
| Net asset value, beginning of period | $18.82 | $18.11 | $18.20 | $23.08 | $21.39 |
| Income from Investment Operations | | | | | |
| Net investment income (loss)B | .29 | .27 | .22 | .24 | .14 |
| Net realized and unrealized gain (loss) | 2.34 | .74 | (.13) | (2.52) | 3.76 |
| Total from investment operations | 2.63 | 1.01 | .09 | (2.28) | 3.90 |
| Distributions from net investment income | (.28) | (.25) | (.18) | (.17) | (.18) |
| Distributions from net realized gain | (.10) | (.05) | – | (2.43) | (2.03) |
| Total distributions | (.38) | (.30) | (.18) | (2.60) | (2.21) |
| Redemption fees added to paid in capitalB | – | – | –C | –C | –C |
| Net asset value, end of period | $21.07 | $18.82 | $18.11 | $18.20 | $23.08 |
| Total ReturnD | 14.15% | 5.61% | .57% | (11.33)% | 20.04% |
| Ratios to Average Net AssetsE,F | | | | | |
| Expenses before reductions | .80% | .81% | .80% | .78% | .79% |
| Expenses net of fee waivers, if any | .79% | .81% | .80% | .78% | .79% |
| Expenses net of all reductions | .79% | .80% | .79% | .77% | .79% |
| Net investment income (loss) | 1.48% | 1.44% | 1.16% | 1.09% | .66% |
| Supplemental Data | | | | | |
| Net assets, end of period (000 omitted) | $747,604 | $744,563 | $1,000,937 | $1,693,410 | $1,892,865 |
| Portfolio turnover rateG | 55% | 89% | 77% | 77% | 72%H |
A For the year ended February 29.
B Calculated based on average shares outstanding during the period.
C Amount represents less than $.005 per share.
D Total returns would have been lower if certain expenses had not been reduced during the applicable periods shown.
E Fees and expenses of any underlying Fidelity Central Funds are not included in the Fund's expense ratio. The Fund indirectly bears its proportionate share of the expenses of any underlying Fidelity Central Funds.
F Expense ratios reflect operating expenses of the Fund. Expenses before reductions do not reflect amounts reimbursed by the investment adviser or reductions from brokerage service arrangements or reductions from other expense offset arrangements and do not represent the amount paid by the Fund during periods when reimbursements or reductions occur. Expenses net of fee waivers reflect expenses after reimbursement by the investment adviser but prior to reductions from brokerage service arrangements or other expense offset arrangements. Expenses net of all reductions represent the net expenses paid by the Fund.
G Amount does not include the portfolio activity of any underlying Fidelity Central Funds.
H Portfolio turnover rate excludes securities received or delivered in-kind.
See accompanying notes which are an integral part of the financial statements.
Notes to Financial Statements
For the period ended February 28, 2019
1. Organization.
Biotechnology Portfolio, Health Care Portfolio, Health Care Services Portfolio, Medical Technology and Devices Portfolio, and Pharmaceuticals Portfolio (the Funds) are non-diversified funds of Fidelity Select Portfolios (the Trust). The Trust is registered under the Investment Company Act of 1940, as amended (the 1940 Act), as an open-end management investment company organized as a Massachusetts business trust. The Funds invest primarily in securities of companies whose principal business activities fall within specific industries. Each Fund is authorized to issue an unlimited number of shares. Share transactions on the Statement of Changes in Net Assets may contain exchanges between affiliated funds.
Effective August 10, 2018, Biotechnology Portfolio and Health Care Portfolio underwent a 10 for 1 share split. The effect of the share split transaction was to multiply the number of outstanding shares of Biotechnology Portfolio and Health Care Portfolio by a split factor of 10:1, with a corresponding decrease in net asset value (NAV) per share. This event does not impact the overall net assets of Biotechnology Portfolio and Health Care Portfolio. The per share data presented in each Financial Highlights and Shares activity presented in each Statement of Changes in Net Assets for Biotechnology Portfolio and Health Care Portfolio have been retroactively adjusted to reflect this share split.
In March 2019, the Board approved to close Medical Technology and Devices Portfolio to new accounts with certain exceptions effective after the close of business on March 29, 2019.
2. Investments in Fidelity Central Funds.
The Funds invest in Fidelity Central Funds, which are open-end investment companies generally available only to other investment companies and accounts managed by the investment adviser and its affiliates. The Funds' Schedules of Investments list each of the Fidelity Central Funds held as of period end, if any, as an investment of each Fund, but do not include the underlying holdings of each Fidelity Central Fund. As an Investing Fund, each Fund indirectly bears its proportionate share of the expenses of the underlying Fidelity Central Funds.
The Money Market Central Funds seek preservation of capital and current income and are managed by Fidelity Investments Money Management, Inc. (FIMM), an affiliate of the investment adviser. Annualized expenses of the Money Market Central Funds as of their most recent shareholder report date are less than .005%.
A complete unaudited list of holdings for each Fidelity Central Fund is available upon request or at the Securities and Exchange Commission (the SEC) website at www.sec.gov. In addition, the financial statements of the Fidelity Central Funds, which are not covered by the Funds' Report of Independent Registered Public Accounting Firm, are available on the SEC website or upon request.
3. Significant Accounting Policies.
Each Fund is an investment company and applies the accounting and reporting guidance of the Financial Accounting Standards Board (FASB) Accounting Standards Codification Topic 946 Financial Services – Investments Companies. The financial statements have been prepared in conformity with accounting principles generally accepted in the United States of America (GAAP), which require management to make certain estimates and assumptions at the date of the financial statements. Actual results could differ from those estimates. Subsequent events, if any, through the date that the financial statements were issued have been evaluated in the preparation of the financial statements. The following summarizes the significant accounting policies of the Funds:
Investment Valuation. Investments are valued as of 4:00 p.m. Eastern time on the last calendar day of the period. The Board of Trustees (the Board) has delegated the day to day responsibility for the valuation of each Fund's investments to the Fair Value Committee (the Committee) established by each Fund's investment adviser. In accordance with valuation policies and procedures approved by the Board, each Fund attempts to obtain prices from one or more third party pricing vendors or brokers to value its investments. When current market prices, quotations or currency exchange rates are not readily available or reliable, investments will be fair valued in good faith by the Committee, in accordance with procedures adopted by the Board. Factors used in determining fair value vary by investment type and may include market or investment specific events. The frequency with which these procedures are used cannot be predicted and they may be utilized to a significant extent. The Committee oversees each Fund's valuation policies and procedures and reports to the Board on the Committee's activities and fair value determinations. The Board monitors the appropriateness of the procedures used in valuing each Fund's investments and ratifies the fair value determinations of the Committee.
Each Fund categorizes the inputs to valuation techniques used to value its investments into a disclosure hierarchy consisting of three levels as shown below:
- Level 1 – quoted prices in active markets for identical investments
- Level 2 – other significant observable inputs (including quoted prices for similar investments, interest rates, prepayment speeds, etc.)
- Level 3 – unobservable inputs (including the Fund's own assumptions based on the best information available)
Valuation techniques used to value each Fund's investments by major category are as follows:
Equity securities, including restricted securities, for which market quotations are readily available, are valued at the last reported sale price or official closing price as reported by a third party pricing vendor on the primary market or exchange on which they are traded and are categorized as Level 1 in the hierarchy. In the event there were no sales during the day or closing prices are not available, securities are valued at the last quoted bid price or may be valued using the last available price and are generally categorized as Level 2 in the hierarchy. For foreign equity securities, when market or security specific events arise, comparisons to the valuation of American Depositary Receipts (ADRs), futures contracts, Exchange-Traded Funds (ETFs)and certain indexes as well as quoted prices for similar securities may be used and would be categorized as Level 2 in the hierarchy. For equity securities, including restricted securities, where observable inputs are limited, assumptions about market activity and risk are used and these securities may be categorized as Level 3 in the hierarchy. Equity securities, including restricted securities, for which observable inputs are not available are valued using alternate valuation approaches, including the market approach and the income approach and are categorized as Level 3 in the hierarchy. The market approach generally consists of using comparable market transactions while the income approach generally consists of using the net present value of estimated future cash flows, adjusted as appropriate for liquidity, credit, market and/or other risk factors.
Investments in open-end mutual funds, including the Fidelity Central Funds, are valued at their closing net asset value (NAV) each business day and are categorized as Level 1 in the hierarchy.
The following provides information on Level 3 securities held by the Fund that were valued at period end based on unobservable inputs. These amounts exclude valuations provided by a broker.
Biotechnology Portfolio:
| Asset Type | Fair Value | Valuation Technique(s) | Unobservable Input | Amount or Range/Weighted Average | Impact to Valuation from an Increase in Input(a) |
| Equities | $178,021,485 | Recovery Value | Recovery Value | 0.0% | Increase |
| | | Market Comparable | Enterprise value/Sales multiple (EV/S) | 4.9 | Increase |
| | | | Transaction Price | $3.79-$132.98/34.44 | Increase |
| | | | Discount Rate | 2.8% | Decrease |
| | | | Proxy Discount | 4.2%-26.8%/14.8% | Decrease |
| | | Market Approach | Transaction Price | $155.12 | Increase |
| | | Discount Cash Flow | Discount Rate | 8.0%-11.0%/10.3% | Decrease |
| | | | Discount for lack of marketability | 10.0% | Decrease |
| | | | Growth Rate | 3.5% | Increase |
| | | | Probability Rate | 6.3% | Increase |
(a) Represents the directional change in the fair value of the Level 3 investments that could have resulted from an increase in the corresponding input as of period end. A decrease to the unobservable input would have had the opposite effect. Significant changes in these inputs may have resulted in a significantly higher or lower fair value measurement at period end.
Health Care Portfolio:
| Asset Type | Fair Value | Valuation Technique(s) | Unobservable Input | Amount or Range/Weighted Average | Impact to Valuation from an Increase in Input(a) |
| Equities | $150,036,379 | Market Comparable | Transaction Price | $1.00-$287.39/$188.07 | Increase |
| | | | Proxy Discount | 0.6% | Decrease |
| | | Market Approach | Transaction Price | $3.11-$155.12/$48.87 | Increase |
(a) Represents the directional change in the fair value of the Level 3 investments that could have resulted from an increase in the corresponding input as of period end. A decrease to the unobservable input would have had the opposite effect. Significant changes in these inputs may have resulted in a significantly higher or lower fair value measurement at period end.
Changes in valuation techniques may result in transfers in or out of an assigned level within the disclosure hierarchy. The aggregate value of investments by input level as of February 28, 2019, as well as a roll forward of Level 3 investments, is included at the end of each applicable Fund's Schedule of Investments.
Foreign Currency. The Funds may use foreign currency contracts to facilitate transactions in foreign-denominated securities. Gains and losses from these transactions may arise from changes in the value of the foreign currency or if the counterparties do not perform under the contracts' terms.
Foreign-denominated assets, including investment securities, and liabilities are translated into U.S. dollars at the exchange rates at period end. Purchases and sales of investment securities, income and dividends received and expenses denominated in foreign currencies are translated into U.S. dollars at the exchange rate in effect on the transaction date.
The effects of exchange rate fluctuations on investments are included with the net realized and unrealized gain (loss) on investment securities. Other foreign currency transactions resulting in realized and unrealized gain (loss) are disclosed separately.
Investment Transactions and Income. For financial reporting purposes, the Funds' investment holdings and NAV include trades executed through the end of the last business day of the period. The NAV per share for processing shareholder transactions is calculated as of the close of business of the New York Stock Exchange (NYSE), normally 4:00 p.m. Eastern time and includes trades executed through the end of the prior business day. Gains and losses on securities sold are determined on the basis of identified cost and for certain Funds include proceeds received from litigation. Dividend income is recorded on the ex-dividend date, except for certain dividends from foreign securities where the ex-dividend date may have passed, which are recorded as soon as the Funds are informed of the ex-dividend date. Non-cash dividends included in dividend income, if any, are recorded at the fair market value of the securities received. Income and capital gain distributions from Fidelity Central Funds, if any, are recorded on the ex-dividend date. Certain distributions received by the Funds represent a return of capital or capital gain. The Funds determine the components of these distributions subsequent to the ex-dividend date, based upon receipt of tax filings or other correspondence relating to the underlying investment. These distributions are recorded as a reduction of cost of investments and/or as a realized gain. Investment income is recorded net of foreign taxes withheld where recovery of such taxes is uncertain.
Expenses. Expenses directly attributable to a fund are charged to that fund. Expenses attributable to more than one fund are allocated among the respective funds on the basis of relative net assets or other appropriate methods. Expense estimates are accrued in the period to which they relate and adjustments are made when actual amounts are known.
Deferred Trustee Compensation. Under a Deferred Compensation Plan (the Plan) the Funds, certain independent Trustees have elected to defer receipt of a portion of their annual compensation. Deferred amounts are invested in a cross-section of Fidelity funds, are marked-to-market and remain in each Fund until distributed in accordance with the Plan. The investment of deferred amounts and the offsetting payable to the Trustees presented below are included in each accompanying Statement of Assets and Liabilities in other receivables and other payables and accrued expenses, respectively.
| Biotechnology Portfolio | $733,746 |
| Health Care Portfolio | 514,163 |
| Health Care Services Portfolio | 56,211 |
| Medical Technology and Devices Portfolio | 169,316 |
| Pharmaceuticals Portfolio | 100,639 |
Income Tax Information and Distributions to Shareholders. Each year, each Fund intends to qualify as a regulated investment company under Subchapter M of the Internal Revenue Code, including distributing substantially all of its taxable income and realized gains. As a result, no provision for U.S. Federal income taxes is required. As of February 28, 2019, each Fund did not have any unrecognized tax benefits in the financial statements; nor is each Fund aware of any tax positions for which it is reasonably possible that the total amounts of unrecognized tax benefits will significantly change in the next twelve months. Each Fund files a U.S. federal tax return, in addition to state and local tax returns as required. Each Fund's federal income tax returns are subject to examination by the Internal Revenue Service (IRS) for a period of three fiscal years after they are filed. State and local tax returns may be subject to examination for an additional fiscal year depending on the jurisdiction. Foreign taxes are provided for based on each Fund's understanding of the tax rules and rates that exist in the foreign markets in which it invests.
Distributions are declared and recorded on the ex-dividend date. Income and capital gain distributions are determined in accordance with income tax regulations, which may differ from GAAP. These differences resulted in distribution reclassifications. In addition, the Funds claimed a portion of the payment made to redeeming shareholders as a distribution for income tax purposes.
Capital accounts within the financial statements are adjusted for permanent book-tax differences. These adjustments have no impact on net assets or the results of operations. Capital accounts are not adjusted for temporary book-tax differences which will reverse in a subsequent period.
Book-tax differences are primarily due to redemptions in-kind, foreign currency transactions, passive foreign investment companies (PFIC), partnerships, deferred trustees compensation, net operating losses, certain deemed dividends, capital loss carryforwards and losses deferred due to wash sales and excise tax regulations.
As of period end, the cost and unrealized appreciation (depreciation) in securities, and derivatives if applicable, for federal income tax purposes were as follows for each Fund:
| | Tax cost | Gross unrealized appreciation | Gross unrealized depreciation | Net unrealized appreciation (depreciation) |
| Biotechnology Portfolio | $5,660,637,134 | $2,998,933,998 | $(610,587,329) | $2,388,346,669 |
| Health Care Portfolio | 5,513,692,851 | 2,287,689,873 | (213,287,124) | 2,074,402,749 |
| Health Care Services Portfolio | 1,079,673,120 | 368,469,120 | (88,036,950) | 280,432,170 |
| Medical Technology and Devices Portfolio | 5,326,627,331 | 1,813,867,788 | (72,309,445) | 1,741,558,343 |
| Pharmaceuticals Portfolio | 585,512,397 | 187,373,698 | (14,641,085) | 172,732,613 |
The tax-based components of distributable earnings as of period end were as follows for each Fund:
| | Undistributed ordinary income | Undistributed long-term capital gain | Net unrealized appreciation (depreciation) on securities and other investments |
| Biotechnology Portfolio | $– | $273,248,717 | $2,388,346,669 |
| Health Care Portfolio | – | – | 2,074,343,052 |
| Health Care Services Portfolio | – | – | 280,430,661 |
| Medical Technology and Devices Portfolio | – | – | 1,741,554,846 |
| Pharmaceuticals Portfolio | 2,852,973 | 16,570,201 | 172,722,488 |
Certain of the Funds intend to elect to defer to the next fiscal year capital and currency losses recognized during the period November 1, 2018 to February 28, 2019, and ordinary losses recognized during the period January 1, 2019 to February 28, 2019. Loss deferrals were as follows:
| | Capital losses | Ordinary losses |
| Biotechnology Portfolio | $(9,468,707) | $-– |
| Health Care Portfolio | (52,551,216) | -– |
| Health Care Services Portfolio | (7,545,546) | -– |
| Medical Technology and Devices Portfolio | (4,763,866) | (4,505,609) |
The tax character of distributions paid was as follows:
| February 28, 2019 | | | |
| | Ordinary Income | Long-term Capital Gains | Total |
| Biotechnology Portfolio | $30,806,733 | $692,428,843 | $723,235,576 |
| Health Care Portfolio | 30,290,441 | 556,871,574 | 587,162,015 |
| Health Care Services Portfolio | 32,550,071 | 98,292,031 | 130,842,102 |
| Medical Technology and Devices Portfolio | – | 356,492,522 | 356,492,522 |
| Pharmaceuticals Portfolio | 12,320,224 | 1,736,622 | 14,056,846 |
| February 28, 2018 | | | |
| | Ordinary Income | Long-term Capital Gains | Total |
| Biotechnology Portfolio | $– | $123,724,434 | $123,724,434 |
| Health Care Portfolio | 21,379,940 | 138,319,156 | 159,699,096 |
| Health Care Services Portfolio | 817,273 | 99,374,269 | 100,191,542 |
| Medical Technology and Devices Portfolio | 6,689,760 | 221,756,409 | 228,446,169 |
| Pharmaceuticals Portfolio | 12,953,960 | – | 12,953,960 |
Restricted Securities. The Funds may invest in securities that are subject to legal or contractual restrictions on resale. These securities generally may be resold in transactions exempt from registration or to the public if the securities are registered. Disposal of these securities may involve time-consuming negotiations and expense, and prompt sale at an acceptable price may be difficult. Information regarding restricted securities is included at the end of each applicable Fund's Schedule of Investments.
Consolidated Subsidiary. Biotechnology Portfolio invests in certain investments through a wholly-owned subsidiary ("Subsidiary"), which may be subject to federal and state taxes upon disposition.
As of period end, Biotechnology Portfolio held an investment of $82,125,213 in this Subsidiary, representing 1.08% of the Fund's net assets. The financial statements have been consolidated and include accounts of the Fund and the Subsidiary. Accordingly, all inter-company transactions and balances have been eliminated.
Any cash held by the Subsidiary is restricted as to its use and is presented as Restricted cash in the Statement of Assets and Liabilities.
New Rule Issuance. During August 2018, the U.S. Securities and Exchange Commission issued Final Rule Release No. 33-10532, Disclosure Update and Simplification. This Final Rule includes amendments specific to registered investment companies that are intended to eliminate overlap in disclosure requirements between Regulation S-X and GAAP. In accordance with these amendments, certain line-items in the Funds' financial statements have been combined or removed for the current period as outlined in the table below.
| Financial Statement | Current Line-Item Presentation (As Applicable) | Prior Line-Item Presentation (As Applicable) |
| Statement of Assets and Liabilities | Total distributable earnings (loss) | Undistributed/Distributions in excess of/Accumulated net investment income (loss)
Accumulated/Undistributed net realized gain (loss)
Net unrealized appreciation (depreciation) |
| Statement of Changes in Net Assets | N/A - removed | Undistributed/Distributions in excess of/Accumulated net investment income (loss) end of period |
| Statement of Changes in Net Assets | Distributions to shareholders | Distributions to shareholders from net investment income
Distributions to shareholders from net realized gain |
4. Purchases and Sales of Investments.
Purchases and sales of securities, other than short-term securities and in-kind transactions, are noted in the table below.
| | Purchases ($) | Sales ($) |
| Biotechnology Portfolio | 3,012,749,006 | 4,375,967,297 |
| Health Care Portfolio | 4,461,709,557 | 4,236,201,486 |
| Health Care Services Portfolio | 1,122,613,748 | 633,868,412 |
| Medical Technology and Devices Portfolio | 3,970,598,292 | 2,289,894,061 |
| Pharmaceuticals Portfolio | 404,324,624 | 494,773,343 |
5. Fees and Other Transactions with Affiliates.
Management Fee. Fidelity SelectCo, LLC (the investment adviser) and its affiliates provide the Funds with investment management related services for which the Funds pay a monthly management fee. The management fee is the sum of an individual fund fee rate and an annualized group fee rate. The individual fund fee rate is applied to each Fund's average net assets. The group fee rate is based upon the average net assets of all the mutual funds advised by Fidelity Management & Research Company (FMR) and the investment adviser. The group fee rate decreases as assets under management increase and increases as assets under management decrease. For the reporting period, each Fund's annual management fee rate expressed as a percentage of each Fund's average net assets was as follows:
| | Individual Rate | Group Rate | Total |
| Biotechnology Portfolio | .30% | .24% | .54% |
| Health Care Portfolio | .30% | .24% | .54% |
| Health Care Services Portfolio | .30% | .24% | .54% |
| Medical Technology and Devices Portfolio | .30% | .24% | .54% |
| Pharmaceuticals Portfolio | .30% | .24% | .54% |
Transfer Agent Fees. Fidelity Investments Institutional Operations Company, Inc. (FIIOC), an affiliate of the investment adviser, is the Funds' transfer, dividend disbursing and shareholder servicing agent. FIIOC receives account fees and asset-based fees that vary according to account size and type of account. FIIOC pays for typesetting, printing and mailing of shareholder reports, except proxy statements. For the period, transfer agent fees were equivalent to the following annual rates expressed as a percentage of average net assets:
| Biotechnology Portfolio | .16% |
| Health Care Portfolio | .15% |
| Health Care Services Portfolio | .16% |
| Medical Technology and Devices Portfolio | .16% |
| Pharmaceuticals Portfolio | .20% |
Accounting and Security Lending Fees. Fidelity Service Company, Inc. (FSC), an affiliate of the investment adviser, maintains each Fund's accounting records. The accounting fee is based on the level of average net assets for each month. Under a separate contract, FSC administers the security lending program. The security lending fee is based on the number and duration of lending transactions. For the period, the fees were equivalent to the following annual rates:
| | % of Average Net Assets |
| Biotechnology Portfolio | .02 |
| Health Care Portfolio | .02 |
| Health Care Services Portfolio | .03 |
| Medical Technology and Devices Portfolio | .02 |
| Pharmaceuticals Portfolio | .04 |
Brokerage Commissions. Certain Funds placed a portion of their portfolio transactions with brokerage firms which are affiliates of the investment adviser. Brokerage commissions are included in net realized gain (loss) and change in net unrealized appreciation (depreciation) in the Statement of Operations. The commissions paid to these affiliated firms were as follows:
| | Amount |
| Biotechnology Portfolio | $242,280 |
| Health Care Portfolio | 95,201 |
| Health Care Services Portfolio | 23,776 |
| Medical Technology and Devices Portfolio | 62,773 |
| Pharmaceuticals Portfolio | 14,157 |
Interfund Lending Program. Pursuant to an Exemptive Order issued by the SEC, the Funds, along with other registered investment companies having management contracts with Fidelity Management & Research Company (FMR) or other affiliated entities of FMR, may participate in an interfund lending program. This program provides an alternative credit facility allowing the funds to borrow from, or lend money to, other participating affiliated funds. At period end, there were no interfund loans outstanding. Each applicable fund's activity in this program during the period for which loans were outstanding was as follows:
| | Borrower or Lender | Average Loan Balance | Weighted Average Interest Rate | Interest Expense |
| Health Care Portfolio | Borrower | $7,102,000 | 2.66% | $524 |
| Health Care Services Portfolio | Borrower | $8,699,500 | 2.49% | $8,415 |
| Medical Technology and Devices Portfolio | Borrower | $7,659,000 | 2.44% | $1,554 |
| Pharmaceuticals Portfolio | Borrower | $6,815,000 | 2.64% | $499 |
Interfund Trades. The Funds may purchase from or sell securities to other Fidelity Funds under procedures adopted by the Board. The procedures have been designed to ensure these interfund trades are executed in accordance with Rule 17a-7 of the 1940 Act. Interfund trades are included within the respective purchases and sales amounts shown in the Purchases and Sales of Investments note.
Affiliated Redemptions In-Kind. During the period, 23,409,830* shares of Health Care Portfolio were redeemed in-kind for investments and cash with a value of $541,001,090. The net realized gain of $233,538,287 on investments delivered through in-kind redemptions is included in the accompanying Statement of Operations. The amount of the in-kind redemptions is included in share transactions in the accompanying Statement of Changes in Net Assets. Health Care Portfolio recognized no gain or loss for federal income tax purposes.
* Share activity prior to August 10, 2018 has been adjusted to reflect the impact of the 10 for 1 share split that occurred on that date.
Other. During the period, the investment adviser reimbursed the Funds for certain losses as follows:
| Biotechnology Portfolio | $3,308 |
| Health Care Portfolio | 26,917 |
| Medical Technology and Devices Portfolio | 9,534 |
6. Committed Line of Credit.
Certain Funds participate with other funds managed by the investment adviser or an affiliate in a $4.25 billion credit facility (the "line of credit") to be utilized for temporary or emergency purposes to fund shareholder redemptions or for other short-term liquidity purposes. The participating funds have agreed to pay commitment fees on their pro-rata portion of the line of credit, which are reflected in Miscellaneous expenses on the Statement of Operations, and are as follows:
| Biotechnology Portfolio | $22,949 |
| Health Care Portfolio | 19,194 |
| Health Care Services Portfolio | 2,617 |
| Medical Technology and Devices Portfolio | 13,261 |
| Pharmaceuticals Portfolio | 2,035 |
During the period, the Funds did not borrow on this line of credit.
7. Security Lending.
Certain Funds lend portfolio securities through a lending agent from time to time in order to earn additional income. On the settlement date of the loan, each applicable Fund receives collateral (in the form of U.S. Treasury obligations, letters of credit and/or cash) against the loaned securities and maintains collateral in an amount not less than 100% of the market value of the loaned securities during the period of the loan. The market value of the loaned securities is determined at the close of business of the Funds and any additional required collateral is delivered to the Funds on the next business day. The Funds or borrower may terminate the loan at any time, and if the borrower defaults on its obligation to return the securities loaned because of insolvency or other reasons, the Funds may apply collateral received from the borrower against the obligation. The Funds may experience delays and costs in recovering the securities loaned. Any cash collateral received is invested in the Fidelity Securities Lending Cash Central Fund. The value of loaned securities and cash collateral at period end are disclosed on each applicable Fund's Statement of Assets and Liabilities. Security lending income represents the income earned on investing cash collateral, less rebates paid to borrowers and any lending agent fees associated with the loan, plus any premium payments received for lending certain types of securities. Security lending income is presented on each applicable Fund's Statement of Operations as a component of income from Fidelity Central Funds.
8. Expense Reductions.
Commissions paid to certain brokers with whom the investment adviser, or its affiliates, places trades on behalf of certain Funds include an amount in addition to trade execution, which may be rebated back to the Funds to offset certain expenses. In addition, through arrangements with each applicable Fund's custodian, and transfer agent credits realized as a result of certain uninvested cash balances were used to reduce each applicable Fund's expenses. All of the applicable expense reductions are noted in the table below.
| | Brokerage Service reduction | Custody expense reduction | Transfer Agent expense reduction |
| Biotechnology Portfolio | $355,987 | $1,295 | $310 |
| Health Care Portfolio | 389,495 | 13,145 | 1,895 |
| Health Care Services Portfolio | 25,632 | 824 | – |
| Medical Technology and Devices Portfolio | 177,816 | 1,980 | – |
| Pharmaceuticals Portfolio | 29,192 | – | – |
In addition, during the period the investment adviser reimbursed and/or waived a portion of operating expenses as follows:
| | Amount |
| Biotechnology Portfolio | $66,373 |
| Health Care Portfolio | 57,801 |
| Health Care Services Portfolio | 8,826 |
| Medical Technology and Devices Portfolio | 40,351 |
| Pharmaceuticals Portfolio | 6,422 |
9. Other.
The Funds' organizational documents provide former and current trustees and officers with a limited indemnification against liabilities arising in connection with the performance of their duties to the Funds. In the normal course of business, the Funds may also enter into contracts that provide general indemnifications. The Funds' maximum exposure under these arrangements is unknown as this would be dependent on future claims that may be made against the Funds. The risk of material loss from such claims is considered remote.
Report of Independent Registered Public Accounting Firm
To the Board of Trustees of Fidelity Select Portfolios and Shareholders of Biotechnology Portfolio, Health Care Portfolio, Health Care Services Portfolio, Medical Technology and Devices Portfolio, and Pharmaceuticals Portfolio:
Opinions on the Financial Statements
We have audited the accompanying statements of assets and liabilities, including the schedules of investments, of Biotechnology Portfolio, Health Care Portfolio, Health Care Services Portfolio, Medical Technology and Devices Portfolio, and Pharmaceuticals Portfolio (five of the funds constituting Fidelity Select Portfolios, hereafter collectively referred to as the "Funds") as of February 28, 2019, the related statements of operations for the year ended February 28, 2019, the statements of changes in net assets for each of the two years in the period ended February 28, 2019, including the related notes, and the financial highlights for each of the five years in the period ended February 28, 2019 (collectively referred to as the “financial statements”). In our opinion, the financial statements present fairly, in all material respects, the financial position of each of the Funds as of February 28, 2019, the results of each of their operations for the year then ended, the changes in each of their net assets for each of the two years in the period ended February 28, 2019 and each of the financial highlights for each of the five years in the period ended February 28, 2019 in conformity with accounting principles generally accepted in the United States of America.
Basis for Opinions
These financial statements are the responsibility of the Funds' management. Our responsibility is to express an opinion on the Funds' financial statements based on our audits. We are a public accounting firm registered with the Public Company Accounting Oversight Board (United States) (PCAOB) and are required to be independent with respect to the Funds in accordance with the U.S. federal securities laws and the applicable rules and regulations of the Securities and Exchange Commission and the PCAOB.
We conducted our audits of these financial statements in accordance with the standards of the PCAOB. Those standards require that we plan and perform the audit to obtain reasonable assurance about whether the financial statements are free of material misstatement, whether due to error or fraud.
Our audits included performing procedures to assess the risks of material misstatement of the financial statements, whether due to error or fraud, and performing procedures that respond to those risks. Such procedures included examining, on a test basis, evidence regarding the amounts and disclosures in the financial statements. Our audits also included evaluating the accounting principles used and significant estimates made by management, as well as evaluating the overall presentation of the financial statements. Our procedures included confirmation of securities owned as of February 28, 2019 by correspondence with the custodian and brokers; when replies were not received from brokers, we performed other auditing procedures. We believe that our audits provide a reasonable basis for our opinions.
PricewaterhouseCoopers LLP
Boston, Massachusetts
April 16, 2019
We have served as the auditor of one or more investment companies in the Fidelity group of funds since 1932.
Trustees and Officers
The Trustees, Members of the Advisory Board (if any), and officers of the trust and funds, as applicable, are listed below. The Board of Trustees governs each fund and is responsible for protecting the interests of shareholders. The Trustees are experienced executives who meet periodically throughout the year to oversee each fund's activities, review contractual arrangements with companies that provide services to each fund, oversee management of the risks associated with such activities and contractual arrangements, and review each fund's performance. Except for Michael E. Wiley, each of the Trustees oversees 287 funds. Mr. Wiley oversees 195 funds.
The Trustees hold office without limit in time except that (a) any Trustee may resign; (b) any Trustee may be removed by written instrument, signed by at least two-thirds of the number of Trustees prior to such removal; (c) any Trustee who requests to be retired or who has become incapacitated by illness or injury may be retired by written instrument signed by a majority of the other Trustees; and (d) any Trustee may be removed at any special meeting of shareholders by a two-thirds vote of the outstanding voting securities of the trust. Each Trustee who is not an interested person (as defined in the 1940 Act) of the trust and the funds is referred to herein as an Independent Trustee. Each Independent Trustee shall retire not later than the last day of the calendar year in which his or her 75th birthday occurs. The Independent Trustees may waive this mandatory retirement age policy with respect to individual Trustees. Officers and Advisory Board Members hold office without limit in time, except that any officer or Advisory Board Member may resign or may be removed by a vote of a majority of the Trustees at any regular meeting or any special meeting of the Trustees. Except as indicated, each individual has held the office shown or other offices in the same company for the past five years.
Each fund’s Statement of Additional Information (SAI) includes more information about the Trustees. To request a free copy, call Fidelity at 1-800-544-8544.
Experience, Skills, Attributes, and Qualifications of the Trustees. The Governance and Nominating Committee has adopted a statement of policy that describes the experience, qualifications, attributes, and skills that are necessary and desirable for potential Independent Trustee candidates (Statement of Policy). The Board believes that each Trustee satisfied at the time he or she was initially elected or appointed a Trustee, and continues to satisfy, the standards contemplated by the Statement of Policy. The Governance and Nominating Committee also engages professional search firms to help identify potential Independent Trustee candidates who have the experience, qualifications, attributes, and skills consistent with the Statement of Policy. From time to time, additional criteria based on the composition and skills of the current Independent Trustees, as well as experience or skills that may be appropriate in light of future changes to board composition, business conditions, and regulatory or other developments, have also been considered by the professional search firms and the Governance and Nominating Committee. In addition, the Board takes into account the Trustees' commitment and participation in Board and committee meetings, as well as their leadership of standing and ad hoc committees throughout their tenure.
In determining that a particular Trustee was and continues to be qualified to serve as a Trustee, the Board has considered a variety of criteria, none of which, in isolation, was controlling. The Board believes that, collectively, the Trustees have balanced and diverse experience, qualifications, attributes, and skills, which allow the Board to operate effectively in governing each fund and protecting the interests of shareholders. Information about the specific experience, skills, attributes, and qualifications of each Trustee, which in each case led to the Board's conclusion that the Trustee should serve (or continue to serve) as a trustee of the funds, is provided below.
Board Structure and Oversight Function. James C. Curvey is an interested person and currently serves as Chairman. The Trustees have determined that an interested Chairman is appropriate and benefits shareholders because an interested Chairman has a personal and professional stake in the quality and continuity of services provided to the funds. Independent Trustees exercise their informed business judgment to appoint an individual of their choosing to serve as Chairman, regardless of whether the Trustee happens to be independent or a member of management. The Independent Trustees have determined that they can act independently and effectively without having an Independent Trustee serve as Chairman and that a key structural component for assuring that they are in a position to do so is for the Independent Trustees to constitute a substantial majority for the Board. The Independent Trustees also regularly meet in executive session. Ned C. Lautenbach serves as Chairman of the Independent Trustees and as such (i) acts as a liaison between the Independent Trustees and management with respect to matters important to the Independent Trustees and (ii) with management prepares agendas for Board meetings.
Fidelity® funds are overseen by different Boards of Trustees. The funds' Board oversees Fidelity's high income and certain equity funds, and other Boards oversee Fidelity's investment-grade bond, money market, asset allocation, and other equity funds. The asset allocation funds may invest in Fidelity® funds overseen by the funds' Board. The use of separate Boards, each with its own committee structure, allows the Trustees of each group of Fidelity® funds to focus on the unique issues of the funds they oversee, including common research, investment, and operational issues. On occasion, the separate Boards establish joint committees to address issues of overlapping consequences for the Fidelity® funds overseen by each Board.
The Trustees operate using a system of committees to facilitate the timely and efficient consideration of all matters of importance to the Trustees, each fund, and fund shareholders and to facilitate compliance with legal and regulatory requirements and oversight of the funds' activities and associated risks. The Board, acting through its committees, has charged SelectCo and its affiliates with (i) identifying events or circumstances the occurrence of which could have demonstrably adverse effects on the funds' business and/or reputation; (ii) implementing processes and controls to lessen the possibility that such events or circumstances occur or to mitigate the effects of such events or circumstances if they do occur; and (iii) creating and maintaining a system designed to evaluate continuously business and market conditions in order to facilitate the identification and implementation processes described in (i) and (ii) above. Because the day-to-day operations and activities of the funds are carried out by or through SelectCo, its affiliates, and other service providers, the funds' exposure to risks is mitigated but not eliminated by the processes overseen by the Trustees. While each of the Board's committees has responsibility for overseeing different aspects of the funds' activities, oversight is exercised primarily through the Operations, Audit, and Compliance Committees. In addition, the Independent Trustees have worked with Fidelity to enhance the Board's oversight of investment and financial risks, legal and regulatory risks, technology risks, and operational risks, including the development of additional risk reporting to the Board. Appropriate personnel, including but not limited to the funds' Chief Compliance Officer (CCO), SelectCo's internal auditor, the independent accountants, the funds' Treasurer and portfolio management personnel, make periodic reports to the Board's committees, as appropriate, including an annual review of Fidelity's risk management program for the Fidelity® funds. The responsibilities of each standing committee, including their oversight responsibilities, are described further under "Standing Committees of the Trustees."
Interested Trustees*:
Correspondence intended for a Trustee who is an interested person may be sent to Fidelity Investments, 245 Summer Street, Boston, Massachusetts 02210.
Name, Year of Birth; Principal Occupations and Other Relevant Experience+
James C. Curvey (1935)
Year of Election or Appointment: 2018
Trustee
Chairman of the Board of Trustees
Mr. Curvey also serves as Trustee of other Fidelity® funds. Mr. Curvey is Vice Chairman (2007-present) and Director of FMR LLC (diversified financial services company). In addition, Mr. Curvey is an Overseer Emeritus for the Boston Symphony Orchestra, a Director of Artis-Naples, and a Trustee of Brewster Academy in Wolfeboro, New Hampshire. Previously, Mr. Curvey served as a Director of Fidelity Research & Analysis Co. (investment adviser firm, 2009-2018), Director of Fidelity Investments Money Management, Inc. (investment adviser firm, 2009-2014) and a Director of FMR and FMR Co., Inc. (investment adviser firms, 2007-2014).
* Determined to be an "Interested Trustee" by virtue of, among other things, his or her affiliation with the trusts or various entities under common control with SelectCo.
+ The information includes the Trustee's principal occupation during the last five years and other information relating to the experience, attributes, and skills relevant to the Trustee's qualifications to serve as a Trustee, which led to the conclusion that the Trustee should serve as a Trustee for each fund.
Independent Trustees:
Correspondence intended for an Independent Trustee may be sent to Fidelity Investments, P.O. Box 55235, Boston, Massachusetts 02205-5235.
Name, Year of Birth; Principal Occupations and Other Relevant Experience+
Dennis J. Dirks (1948)
Year of Election or Appointment: 2018
Trustee
Mr. Dirks also serves as Trustee of other Fidelity® funds. Prior to his retirement in May 2003, Mr. Dirks was Chief Operating Officer and a member of the Board of The Depository Trust & Clearing Corporation (DTCC). He also served as President, Chief Operating Officer, and Board member of The Depository Trust Company (DTC) and President and Board member of the National Securities Clearing Corporation (NSCC). In addition, Mr. Dirks served as Chief Executive Officer and Board member of the Government Securities Clearing Corporation, Chief Executive Officer and Board member of the Mortgage-Backed Securities Clearing Corporation, as a Trustee and a member of the Finance Committee of Manhattan College (2005-2008), as a Trustee and a member of the Finance Committee of AHRC of Nassau County (2006-2008), as a member of the Independent Directors Council (IDC) Governing Council (2010-2015), and as a member of the Board of Directors for The Brookville Center for Children’s Services, Inc. (2009-2017). Mr. Dirks is a member of the Finance Committee (2016-present) and Board of Directors (2017-present) and is Treasurer (2018-present) of the Asolo Repertory Theatre.
Donald F. Donahue (1950)
Year of Election or Appointment: 2018
Trustee
Mr. Donahue also serves as a Trustee of other Fidelity® funds. Mr. Donahue is President and Chief Executive Officer of Miranda Partners, LLC (risk consulting for the financial services industry, 2012-present). Previously, Mr. Donahue served as a Member of the Advisory Board of certain Fidelity® funds (2015-2018) and Chief Executive Officer (2006-2012), Chief Operating Officer (2003-2006), and Managing Director, Customer Marketing and Development (1999-2003) of The Depository Trust & Clearing Corporation (financial markets infrastructure). Mr. Donahue serves as a Member (2007-present) and Co-Chairman (2016-present) of the Board of Directors of United Way of New York, Member of the Board of Directors of NYC Leadership Academy (2012-present) and Member of the Board of Advisors of Ripple Labs, Inc. (financial services, 2015-present). He also served as Chairman (2010-2012) and Member of the Board of Directors (2012-2013) of Omgeo, LLC (financial services), Treasurer of United Way of New York (2012-2016), and Member of the Board of Directors of XBRL US (financial services non-profit, 2009-2012) and the International Securities Services Association (2009-2012).
Alan J. Lacy (1953)
Year of Election or Appointment: 2018
Trustee
Mr. Lacy also serves as Trustee of other Fidelity® funds. Mr. Lacy serves as a Director of Bristol-Myers Squibb Company (global pharmaceuticals, 2008-present). He is a Trustee of the California Chapter of The Nature Conservancy (2015-present) and a Director of the Center for Advanced Study in the Behavioral Sciences at Stanford University (2015-present). In addition, Mr. Lacy served as Senior Adviser (2007-2014) of Oak Hill Capital Partners, L.P. (private equity) and also served as Chief Executive Officer (2005) and Vice Chairman (2005-2006) of Sears Holdings Corporation (retail) and Chief Executive Officer and Chairman of the Board of Sears, Roebuck and Co. (retail, 2000-2005). Previously, Mr. Lacy served as Chairman (2014-2017) and a member (2010-2017) of the Board of Directors of Dave & Buster’s Entertainment, Inc. (restaurant and entertainment complexes), as Chairman (2008-2011) and a member (2006-2015) of the Board of Trustees of the National Parks Conservation Association, and as a member of the Board of Directors for The Hillman Companies, Inc. (hardware wholesalers, 2010-2014), Earth Fare, Inc. (retail grocery, 2010-2014), and The Western Union Company (global money transfer, 2006-2011).
Ned C. Lautenbach (1944)
Year of Election or Appointment: 2018
Trustee
Chairman of the Independent Trustees
Mr. Lautenbach also serves as Trustee of other Fidelity® funds. Mr. Lautenbach currently serves as Chair (2018-present) and Member (2013-present) of the Board of Governors, State University System of Florida and is a member of the Council on Foreign Relations (1994-present). He is also a member and has most recently served as Chairman of the Board of Directors of Artis-Naples (2012-present). Previously, Mr. Lautenbach served as a member and then Lead Director of the Board of Directors of Eaton Corporation (diversified industrial, 1997-2016). He was also a Partner and Advisory Partner at Clayton, Dubilier & Rice, LLC (private equity investment, 1998-2010), as well as a Director of Sony Corporation (2006-2007). In addition, Mr. Lautenbach also had a 30-year career with IBM (technology company) during which time he served as Senior Vice President and a member of the Corporate Executive Committee (1968-1998).
Joseph Mauriello (1944)
Year of Election or Appointment: 2018
Trustee
Mr. Mauriello also serves as Trustee of other Fidelity® funds. Prior to his retirement in January 2006, Mr. Mauriello served in numerous senior management positions including Deputy Chairman and Chief Operating Officer (2004-2005), and Vice Chairman of Financial Services (2002-2004) of KPMG LLP US (professional services, 1965-2005). Mr. Mauriello currently serves as a member of the Independent Directors Council (IDC) Governing Council (2015-present). Previously, Mr. Mauriello served as a member of the Board of Directors of XL Group plc. (global insurance and re-insurance, 2006-2018).
Cornelia M. Small (1944)
Year of Election or Appointment: 2018
Trustee
Ms. Small also serves as Trustee of other Fidelity® funds. Ms. Small is a member of the Board of Directors (2009-present) and Chair of the Investment Committee (2010-present) of the Teagle Foundation. Ms. Small also serves on the Investment Committee of the Berkshire Taconic Community Foundation (2008-present). Previously, Ms. Small served as Chairperson (2002-2008) and a member of the Investment Committee and Chairperson (2008-2012) and a member of the Board of Trustees of Smith College. In addition, Ms. Small served as Chief Investment Officer, Director of Global Equity Investments, and a member of the Board of Directors of Scudder, Stevens & Clark and Scudder Kemper Investments.
Garnett A. Smith (1947)
Year of Election or Appointment: 2013
Trustee
Mr. Smith also serves as Trustee of other Fidelity® funds. Prior to Mr. Smith's retirement, he served as Chairman and Chief Executive Officer of Inbrand Corp. (manufacturer of personal absorbent products, 1990-1997). He also served as President (1986-1990) of Inbrand Corp. Prior to his employment with Inbrand Corp., he was employed by a retail fabric chain and North Carolina National Bank. In addition, Mr. Smith served as a Member of the Advisory Board of certain Fidelity® funds (2012-2013) and as a board member of the Jackson Hole Land Trust (2009-2012).
David M. Thomas (1949)
Year of Election or Appointment: 2018
Trustee
Mr. Thomas also serves as Trustee of other Fidelity® funds. Mr. Thomas serves as Non-Executive Chairman of the Board of Directors of Fortune Brands Home and Security (home and security products, 2011-present) and as a member of the Board of Directors (2004-present) and Presiding Director (2013-present) of Interpublic Group of Companies, Inc. (marketing communication). Previously, Mr. Thomas served as Executive Chairman (2005-2006) and Chairman and Chief Executive Officer (2000-2005) of IMS Health, Inc. (pharmaceutical and healthcare information solutions), a Director of Fortune Brands, Inc. (consumer products, 2000-2011), and a member of the Board of Trustees of the University of Florida (2013-2018).
Michael E. Wiley (1950)
Year of Election or Appointment: 2008
Trustee
Mr. Wiley also serves as Trustee or Member of the Advisory Board of other Fidelity® funds. Mr. Wiley serves as a Director of High Point Resources (exploration and production, 2005-present). Previously, Mr. Wiley served as a Director of Andeavor Corporation (independent oil refiner and marketer, 2005-2018), a Director of Andeavor Logistics LP (natural resources logistics, 2015-2018), a Director of Post Oak Bank (privately-held bank, 2004-2018), a Director of Asia Pacific Exploration Consolidated (international oil and gas exploration and production, 2008-2013), a member of the Board of Trustees of the University of Tulsa (2000-2006; 2007-2010), a Senior Energy Advisor of Katzenbach Partners, LLC (consulting, 2006-2007), an Advisory Director of Riverstone Holdings (private investment), a Director of Spinnaker Exploration Company (exploration and production, 2001-2005) and Chairman, President, and CEO of Baker Hughes, Inc. (oilfield services, 2000-2004).
+ The information includes the Trustee's principal occupation during the last five years and other information relating to the experience, attributes, and skills relevant to the Trustee's qualifications to serve as a Trustee, which led to the conclusion that the Trustee should serve as a Trustee for each fund.
Advisory Board Members and Officers:
Correspondence intended for a Member of the Advisory Board (if any) may be sent to Fidelity Investments, P.O. Box 55235, Boston, Massachusetts 02205-5235. Correspondence intended for an officer or Peter S. Lynch may be sent to Fidelity Investments, 245 Summer Street, Boston, Massachusetts 02210. Officers appear below in alphabetical order.
Name, Year of Birth; Principal Occupation
Vicki L. Fuller (1957)
Year of Election or Appointment: 2018
Member of the Advisory Board
Ms. Fuller also serves as Member of the Advisory Board of other Fidelity® funds. Ms. Fuller serves as a member of the Board of Directors, Audit Committee, and Nominating and Governance Committee of The Williams Companies, Inc. (natural gas infrastructure, 2018-present). Previously, Ms. Fuller served as the Chief Investment Officer of the New York State Common Retirement Fund (2012-2018) and held a variety of positions at AllianceBernstein L.P. (global asset management, 1985-2012), including Managing Director (2006-2012) and Senior Vice President and Senior Portfolio Manager (2001-2006).
Peter S. Lynch (1944)
Year of Election or Appointment: 2018
Member of the Advisory Board
Mr. Lynch also serves as Member of the Advisory Board of other Fidelity® funds. Mr. Lynch is Vice Chairman and a Director of FMR (investment adviser firm) and FMR Co., Inc. (investment adviser firm). In addition, Mr. Lynch serves as a Trustee of Boston College and as the Chairman of the Inner-City Scholarship Fund. Previously, Mr. Lynch served on the Special Olympics International Board of Directors (1997-2006).
Carol B. Tomé (1957)
Year of Election or Appointment: 2017
Member of the Advisory Board
Ms. Tomé also serves as Member of the Advisory Board of other Fidelity® funds. Ms. Tomé is Chief Financial Officer (2001-present) and Executive Vice President of Corporate Services (2007-present) of The Home Depot, Inc. (home improvement retailer) and a Director (2003-present) and Chair of the Audit Committee (2004-present) of United Parcel Service, Inc. (package delivery and supply chain management). Previously, Ms. Tomé served as Trustee of certain Fidelity® funds (2017), Senior Vice President of Finance and Accounting/Treasurer (2000-2007) and Vice President and Treasurer (1995-2000) of The Home Depot, Inc. and Chair of the Board (2010-2012), Vice Chair of the Board (2009 and 2013), and a Director (2008-2013) of the Federal Reserve Bank of Atlanta. Ms. Tomé is also a director or trustee of many community and professional organizations.
Elizabeth Paige Baumann (1968)
Year of Election or Appointment: 2017
Anti-Money Laundering (AML) Officer
Ms. Baumann also serves as AML Officer of other funds. She is Chief AML Officer (2012-present) and Senior Vice President (2014-present) of FMR LLC (diversified financial services company) and is an employee of Fidelity Investments. Previously, Ms. Baumann served as AML Officer of the funds (2012-2016), and Vice President (2007-2014) and Deputy Anti-Money Laundering Officer (2007-2012) of FMR LLC.
Craig S. Brown (1977)
Year of Election or Appointment: 2019
Assistant Treasurer
Mr. Brown also serves as Assistant Treasurer of other funds. Mr. Brown is an employee of Fidelity Investments (2013-present).
John J. Burke III (1964)
Year of Election or Appointment: 2018
Chief Financial Officer
Mr. Burke also serves as Chief Financial Officer of other funds. Mr. Burke serves as Head of Investment Operations for Fidelity Fund and Investment Operations (2018-present) and is an employee of Fidelity Investments (1998-present). Previously Mr. Burke served as head of Asset Management Investment Operations (2012-2018).
William C. Coffey (1969)
Year of Election or Appointment: 2018
Secretary and Chief Legal Officer (CLO)
Mr. Coffey also serves as Secretary and CLO of other funds. Mr. Coffey serves as CLO, Secretary, and Senior Vice President of Fidelity Management & Research Company and FMR Co., Inc. (investment adviser firms, 2018-present); Secretary of Fidelity SelectCo, LLC and Fidelity Investments Money Management, Inc. (investment adviser firms, 2018-present); and CLO of Fidelity Management & Research (Hong Kong) Limited, FMR Investment Management (UK) Limited, and Fidelity Management & Research (Japan) Limited (investment adviser firms, 2018-present). He is Senior Vice President and Deputy General Counsel of FMR LLC (diversified financial services company, 2010-present), and is an employee of Fidelity Investments. Previously, Mr. Coffey served as Assistant Secretary of certain funds (2009-2018) and as Vice President and Associate General Counsel of FMR LLC (2005-2009).
Timothy M. Cohen (1969)
Year of Election or Appointment: 2018
Vice President
Mr. Cohen also serves as Vice President of other funds. Mr. Cohen serves as Co-Head of Global Equity Research (2016-present), a Director of Fidelity Management & Research (Japan) Limited (investment adviser firm, 2016-present), and is an employee of Fidelity Investments. Previously, Mr. Cohen served as Chief Investment Officer - Equity and a Director of Fidelity Management & Research (U.K.) Inc. (investment adviser firm, 2013-2015) and as a Director of Fidelity Management & Research (Hong Kong) Limited (investment adviser firm, 2017).
Jonathan Davis (1968)
Year of Election or Appointment: 2010
Assistant Treasurer
Mr. Davis also serves as Assistant Treasurer of other funds. Mr. Davis serves as Assistant Treasurer of FMR Capital, Inc. (2017-present) and is an employee of Fidelity Investments. Previously, Mr. Davis served as Vice President and Associate General Counsel of FMR LLC (diversified financial services company, 2003-2010).
Adrien E. Deberghes (1967)
Year of Election or Appointment: 2018
Assistant Treasurer
Mr. Deberghes also serves as an officer of other funds. He serves as Assistant Treasurer of FMR Capital, Inc. (2017-present), Executive Vice President of Fidelity Investments Money Management, Inc. (FIMM) (investment adviser firm, 2016-present), and is an employee of Fidelity Investments (2008-present). Previously, Mr. Deberghes served as President and Treasurer of certain Fidelity® funds (2013-2018). Prior to joining Fidelity Investments, Mr. Deberghes was Senior Vice President of Mutual Fund Administration at State Street Corporation (2007-2008), Senior Director of Mutual Fund Administration at Investors Bank & Trust (2005-2007), and Director of Finance for Dunkin' Brands (2000-2005). Previously, Mr. Deberghes served in other fund officer roles.
Laura M. Del Prato (1964)
Year of Election or Appointment: 2018
Assistant Treasurer
Ms. Del Prato also serves as an officer of other funds. Ms. Del Prato is an employee of Fidelity Investments (2017-present). Prior to joining Fidelity Investments, Ms. Del Prato served as a Managing Director and Treasurer of the JPMorgan Mutual Funds (2014-2017). Prior to JPMorgan, Ms. Del Prato served as a partner at Cohen Fund Audit Services (accounting firm, 2012-2013) and KPMG LLP (accounting firm, 2004-2012).
Colm A. Hogan (1973)
Year of Election or Appointment: 2018
Deputy Treasurer
Mr. Hogan also serves as an officer of other funds. Mr. Hogan serves as Assistant Treasurer of FMR Capital, Inc. (2017-present) and is an employee of Fidelity Investments (2005-present). Previously, Mr. Hogan served as Assistant Treasurer of certain Fidelity® funds (2016-2018).
Pamela R. Holding (1964)
Year of Election or Appointment: 2018
Vice President
Ms. Holding also serves as Vice President of other funds. Ms. Holding serves as Co-Head of Global Equity Research (2018-present) and is an employee of Fidelity Investments (2013-present).
Chris Maher (1972)
Year of Election or Appointment: 2013
Assistant Treasurer
Mr. Maher serves as Assistant Treasurer of other funds. Mr. Maher is Vice President of Valuation Oversight, serves as Assistant Treasurer of FMR Capital, Inc. (2017-present), and is an employee of Fidelity Investments. Previously, Mr. Maher served as Vice President of Asset Management Compliance (2013), Vice President of the Program Management Group of FMR (investment adviser firm, 2010-2013), and Vice President of Valuation Oversight (2008-2010).
Kenneth B. Robins (1969)
Year of Election or Appointment: 2018
Chief Compliance Officer
Mr. Robins also serves as an officer of other funds. Mr. Robins serves as Compliance Officer of Fidelity Management & Research Company and FMR Co., Inc. (investment adviser firms, 2016-present) and is an employee of Fidelity Investments (2004-present). Previously, Mr. Robins served as Executive Vice President of Fidelity Investments Money Management, Inc. (investment adviser firm, 2013-2016) and served in other fund officer roles.
Stacie M. Smith (1974)
Year of Election or Appointment: 2018
President and Treasurer
Ms. Smith also serves as an officer of other funds. Ms. Smith serves as Assistant Treasurer of FMR Capital, Inc. (2017-present), is an employee of Fidelity Investments (2009-present), and has served in other fund officer roles. Prior to joining Fidelity Investments, Ms. Smith served as Senior Audit Manager of Ernst & Young LLP (accounting firm, 1996-2009). Previously, Ms. Smith served as Assistant Treasurer (2013-2018) and Deputy Treasurer (2013-2016) of certain Fidelity® funds.
Marc L. Spector (1972)
Year of Election or Appointment: 2017
Assistant Treasurer
Mr. Spector also serves as an officer of other funds. Mr. Spector serves as Assistant Treasurer of FMR Capital, Inc. (2017-present) and is an employee of Fidelity Investments (2016-present). Prior to joining Fidelity Investments, Mr. Spector served as Director at the Siegfried Group (accounting firm, 2013-2016), and prior to Siegfried Group as audit senior manager at Deloitte & Touche (accounting firm, 2005-2013).
Jim Wegmann (1979)
Year of Election or Appointment: 2019
Assistant Treasurer
Mr. Wegmann also serves as Assistant Treasurer of other funds. Mr. Wegmann is an employee of Fidelity Investments (2011-present).
Shareholder Expense Example
As a shareholder of a Fund, you incur two types of costs: (1) transaction costs, including and (2) ongoing costs, including management fees and other Fund expenses. This Example is intended to help you understand your ongoing costs (in dollars) of investing in the Funds and to compare these costs with the ongoing costs of investing in other mutual funds.
The Example is based on an investment of $1,000 invested at the beginning of the period and held for the entire period (September 1, 2018 to February 28, 2019).
Actual Expenses
The first line of the accompanying table for each fund provides information about actual account values and actual expenses. You may use the information in this line, together with the amount you invested, to estimate the expenses that you paid over the period. Simply divide your account value by $1,000.00 (for example, an $8,600 account value divided by $1,000.00 = 8.6), then multiply the result by the number in the first line for a fund under the heading entitled "Expenses Paid During Period" to estimate the expenses you paid on your account during this period. In addition, each Fund, as a shareholder in the underlying Fidelity Central Funds, will indirectly bear its pro-rata share of the fees and expenses incurred by the underlying Fidelity Central Funds. These fees and expenses are not included in the Fund's annualized expense ratio used to calculate the expense estimate in the table below.
Hypothetical Example for Comparison Purposes
The second line of the accompanying table for each fund provides information about hypothetical account values and hypothetical expenses based on a fund's actual expense ratio and an assumed rate of return of 5% per year before expenses, which is not the Fund's actual return. The hypothetical account values and expenses may not be used to estimate the actual ending account balance or expenses you paid for the period. You may use this information to compare the ongoing costs of investing in the Fund and other funds. To do so, compare this 5% hypothetical example with the 5% hypothetical examples that appear in the shareholder reports of the other funds. In addition, each Fund, as a shareholder in the underlying Fidelity Central Funds, will indirectly bear its pro-rata share of the fees and expenses incurred by the underlying Fidelity Central Funds. These fees and expenses are not included in the Fund's annualized expense ratio used to calculate the expense estimate in the table below.
Please note that the expenses shown in the table are meant to highlight your ongoing costs only and do not reflect any transaction costs. Therefore, the second line of the table is useful in comparing ongoing costs only, and will not help you determine the relative total costs of owning different funds. In addition, if these transactional costs were included, your costs would have been higher.
| | Annualized Expense RatioB | Beginning
Account Value
September 1, 2018 | Ending
Account Value
February 28, 2019 | Expenses Paid
During Period-A
September 1, 2018
to February 28, 2019 |
| Biotechnology Portfolio | .73% | | | |
| Actual | | $1,000.00 | $910.70 | $3.46 |
| Hypothetical-B | | $1,000.00 | $1,021.17 | $3.66 |
| Health Care Portfolio | .71% | | | |
| Actual | | $1,000.00 | $953.00 | $3.44 |
| Hypothetical-B | | $1,000.00 | $1,021.27 | $3.56 |
| Health Care Services Portfolio | .76% | | | |
| Actual | | $1,000.00 | $911.90 | $3.60 |
| Hypothetical-B | | $1,000.00 | $1,021.03 | $3.81 |
| Medical Technology and Devices Portfolio | .73% | | | |
| Actual | | $1,000.00 | $995.70 | $3.61 |
| Hypothetical-B | | $1,000.00 | $1,021.17 | $3.66 |
| Pharmaceuticals Portfolio | .79% | | | |
| Actual | | $1,000.00 | $1,000.00 | $3.92 |
| Hypothetical-B | | $1,000.00 | $1,020.88 | $3.96 |
A Expenses are equal to each Fund's annualized expense ratio, multiplied by the average account value over the period, multiplied by 181/ 365 (to reflect the one-half year period).
B 5% return per year before expenses
Distributions (Unaudited)
The Board of Trustees of each fund voted to pay to shareholders of record at the opening of business on record date, the following distributions per share derived from capital gains realized from sales of portfolio securities, and dividends derived from net investment income:
| | Pay Date | Record Date | Dividends | Capital Gains |
| Biotechnology Portfolio | 04/08/19 | 04/05/19 | $0.000 | $0.772 |
| Health Care Portfolio | 04/08/19 | 04/05/19 | $0.000 | $0.000 |
| Health Care Services Portfolio | 04/08/19 | 04/05/19 | $0.000 | $0.000 |
| Medical Technology and Devices Portfolio | 04/08/19 | 04/05/19 | $0.000 | $0.000 |
| Pharmaceuticals Portfolio | 04/08/19 | 04/05/19 | $ 0.081 | $0.471 |
|
The funds hereby designate as capital gain dividend the amounts noted below for the taxable year ended February 28, 2019, or, if subsequently determined to be different, the net capital gain of such year.
| Biotechnology Portfolio | $686,739,739 |
| Health Care Portfolio | $364,493,828 |
| Health Care Services Portfolio | $55,328,040 |
| Medical Technology and Devices Portfolio | $187,763,262 |
| Pharmaceuticals Portfolio | $19,501,820 |
|
A percentage of the dividends distributed during the fiscal year for the following funds qualify for the dividends–received deduction for corporate shareholders:
| Biotechnology Portfolio | |
| December 2018 | 87% |
| Health Care Portfolio | |
| April 2018 | 66% |
| December 2018 | 100% |
| Health Care Services Portfolio | |
| December 2018 | 100% |
| Pharmaceuticals Portfolio | |
| April 2018 | 91% |
| December 2018 | 81% |
|
A percentage of the dividends distributed during the fiscal year for the following funds may be taken into account as a dividend for purposes of the maximum rate under section 1(h)(11) of the Internal Revenue Code.
| Biotechnology Portfolio | |
| December 2018 | 87% |
| Health Care Portfolio | |
| April 2018 | 100% |
| December 2018 | 100% |
| Health Care Services Portfolio | |
| December 2018 | 100% |
| Pharmaceuticals Portfolio | |
| April 2018 | 100% |
| December 2018 | 100% |
|
The funds will notify shareholders in January 2020 of amounts for use in preparing 2019 income tax returns.
Board Approval of Investment Advisory Contracts and Management Fees
Biotechnology Portfolio
Health Care Portfolio
Health Care Services Portfolio
Medical Technology and Devices Portfolio
Pharmaceuticals Portfolio
Each year, the Board of Trustees, including the Independent Trustees (together, the Board), votes on the renewal of the management contract with Fidelity SelectCo, LLC (SelectCo), an affiliate of Fidelity Management & Research Company (FMR), and the sub-advisory agreements with affiliates of FMR (together, the Advisory Contracts) for each fund. SelectCo and the sub-advisers are referred to herein as the Investment Advisers. The Board, assisted by the advice of fund counsel and Independent Trustees' counsel, requests and considers a broad range of information relevant to the renewal of the Advisory Contracts throughout the year.
The Board meets regularly and, at each of its meetings, covers an extensive agenda of topics and materials and considers factors that are relevant to its annual consideration of the renewal of each fund's Advisory Contracts, including the services and support provided to each fund and its shareholders. The Board has established various standing committees (Committees), each composed of and chaired by Independent Trustees with varying backgrounds, to which the Board has assigned specific subject matter responsibilities in order to enhance effective decision-making by the Board. The Board, acting directly and through its Committees, requests and receives information concerning the annual consideration of the renewal of each fund's Advisory Contracts. The Board also meets as needed to review matters specifically related to the Board's annual consideration of the renewal of the Advisory Contracts. Members of the Board may also meet with trustees of other Fidelity funds through joint ad hoc committees to discuss certain matters relevant to all of the Fidelity funds.
At its January 2019 meeting, the Board unanimously determined to renew each fund's Advisory Contracts. In reaching its determination, the Board considered all factors it believed relevant, including (i) the nature, extent, and quality of the services to be provided to each fund and its shareholders (including the investment performance of each fund); (ii) the competitiveness of each fund's management fee and total expense ratio relative to peer funds; (iii) the total costs of the services to be provided by and the profits to be realized by Fidelity from its relationships with each fund; and (iv) the extent to which, if any, economies of scale exist and would be realized as each fund grows, and whether any economies of scale are appropriately shared with fund shareholders.
In considering whether to renew the Advisory Contracts for each fund, the Board reached a determination, with the assistance of fund counsel and Independent Trustees' counsel and through the exercise of its business judgment, that the renewal of the Advisory Contracts was in the best interests of each fund and its shareholders and that the compensation payable under the Advisory Contracts was fair and reasonable. The Board's decision to renew the Advisory Contracts was not based on any single factor, but rather was based on a comprehensive consideration of all the information provided to the Board at its meetings throughout the year. The Board, in reaching its determination to renew the Advisory Contracts, was aware that shareholders of each fund have a broad range of investment choices available to them, including a wide choice among funds offered by Fidelity's competitors, and that each fund's shareholders, who have the opportunity to review and weigh the disclosure provided by the fund in its prospectus and other public disclosures, have chosen to invest in that fund, which is part of the Fidelity family of funds.
Nature, Extent, and Quality of Services Provided. The Board considered Fidelity's staffing as it relates to the funds, including the backgrounds of investment personnel of Fidelity, and also considered the funds' investment objectives, strategies, and related investment philosophies. The Independent Trustees also had discussions with senior management of Fidelity's investment operations and investment groups. The Board considered the structure of the investment personnel compensation program and whether this structure provides appropriate incentives to act in the best interests of each fund. Additionally, the Board considered the portfolio managers' investments, if any, in the funds that they manage.
Resources Dedicated to Investment Management and Support Services. The Board and the Fund Oversight and Research Committees reviewed the general qualifications and capabilities of Fidelity's investment staff, including its size, education, experience, and resources, as well as Fidelity's approach to recruiting, training, managing, and compensating investment personnel. The Board noted that Fidelity has continued to increase the resources devoted to non-U.S. offices, including expansion of Fidelity's global investment organization. The Board also noted that Fidelity's analysts have extensive resources, tools and capabilities that allow them to conduct sophisticated quantitative and fundamental analysis, as well as credit analysis of issuers, counterparties and guarantors. Further, the Board considered that Fidelity's investment professionals have sufficient access to global information and data so as to provide competitive investment results over time, and that those professionals also have access to sophisticated tools that permit them to assess portfolio construction and risk and performance attribution characteristics continuously, as well as to transmit new information and research conclusions rapidly around the world. Additionally, in its deliberations, the Board considered Fidelity's trading, risk management, compliance, and technology and operations capabilities and resources, which are integral parts of the investment management process.
Shareholder and Administrative Services. The Board considered (i) the nature, extent, quality, and cost of advisory, administrative, and shareholder services performed by the Investment Advisers and their affiliates under the Advisory Contracts and under separate agreements covering transfer agency, pricing and bookkeeping, and securities lending services for each fund; (ii) the nature and extent of the supervision of third party service providers, principally custodians, subcustodians, and pricing vendors; and (iii) the resources devoted to, and the record of compliance with, each fund's compliance policies and procedures. The Board also reviewed the allocation of fund brokerage, including allocations to brokers affiliated with the Investment Advisers, the use of brokerage commissions to pay fund expenses, and the use of "soft" commission dollars to pay for research services.
The Board noted that the growth of fund assets over time across the complex allows Fidelity to reinvest in the development of services designed to enhance the value and convenience of the Fidelity funds as investment vehicles. These services include 24-hour access to account information and market information through telephone representatives and over the Internet, investor education materials and asset allocation tools, and the expanded availability of Fidelity Investor Centers.
The Board noted that it and the boards of certain other Fidelity funds had formed an ad hoc Committee on Transfer Agency Fees to review the variety of transfer agency fee structures throughout the industry and Fidelity's competitive positioning with respect to industry participants.
Investment in a Large Fund Family. The Board considered the benefits to shareholders of investing in a Fidelity fund, including the benefits of investing in a fund that is part of a large family of funds offering a variety of investment disciplines and providing a large variety of mutual fund investor services. The Board noted that Fidelity had taken, or had made recommendations that resulted in the Fidelity funds taking, a number of actions over the previous year that benefited particular funds, including: (i) continuing to dedicate additional resources to Fidelity's investment research process, which includes meetings with management of issuers of securities in which the funds invest, and to the support of the senior management team that oversees asset management; (ii) continuing efforts to enhance Fidelity's global research capabilities; (iii) launching new funds and making other enhancements to meet client needs; (iv) launching new share classes of existing funds; (v) eliminating purchase minimums and broadening eligibility requirements for certain funds and share classes; (vi) reducing management fees and total expenses for certain growth equity funds and index funds; (vii) lowering expense caps for certain existing funds and classes, and converting certain voluntary expense caps to contractual caps, to reduce expenses borne by shareholders; (viii) eliminating short-term redemption fees for funds that had such fees; (ix) rationalizing product lines and gaining increased efficiencies from fund mergers and share class consolidations; (x) continuing to develop, acquire and implement systems and technology to improve services to the funds and shareholders, strengthen information security, and increase efficiency; and (xi) continuing to implement enhancements to further strengthen Fidelity's product line to increase investors' probability of success in achieving their investment goals, including retirement income goals.
Investment Performance. The Board considered whether each fund has operated in accordance with its investment objective, as well as its record of compliance with its investment restrictions and its performance history.
The Board took into account discussions that occur at Board meetings throughout the year with representatives of the Investment Advisers about fund investment performance. In this regard the Board noted that as part of regularly scheduled fund reviews and other reports to the Board on fund performance, the Board considers annualized return information for each fund for different time periods, measured against an appropriate securities market index ("benchmark index"). In its evaluation of fund investment performance, the Board gave particular attention to information indicating changes in performance of certain Fidelity funds for specific time periods and discussed with the Investment Advisers the reasons for any overperformance or underperformance.
In addition to reviewing absolute and relative fund performance, the Independent Trustees periodically consider the appropriateness of fund performance metrics in evaluating the results achieved. In general, the Independent Trustees believe that fund performance should be evaluated based on net performance (after fees and expenses) of both the highest performing and lowest performing fund share classes, where applicable, compared to appropriate benchmark indices, over appropriate time periods that may include full market cycles, taking into account relevant factors including the following: general market conditions; issuer-specific information; and fund cash flows and other factors.
The Independent Trustees recognize that shareholders evaluate performance on a net basis over their own holding periods, for which one-, three-, and five-year periods are often used as a proxy. For this reason, the performance information reviewed by the Board also included net cumulative total return information for each fund and an appropriate benchmark index for the most recent one-, three-, and five-year periods ended June 30, 2018, as shown below.
Biotechnology Portfolio
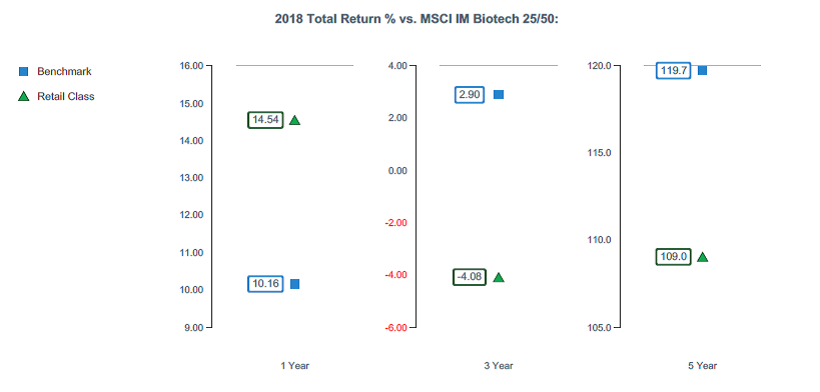
The Board considered the fund's underperformance for different time based on time periods ended prior to June 30, 2018 (which periods are not shown in the chart above). The Board noted that the fund's underperformance has continued since the Board approved the management contract in 2017 and 2018. The Board's discussions with SelectCo regarding underperformance cover topics including, but not limited to: the longer-term track record of a fund's portfolio manager(s); broader trends in the market that may adversely impact a fund's performance; attribution reports on contributors to the fund's underperformance; and the applicable portfolio manager's explanation of his or her underperformance. The Board engages with SelectCo on steps that might be taken to address a fund's underperformance. The Board noted that the fund's more recent performance had improved.
Health Care Portfolio
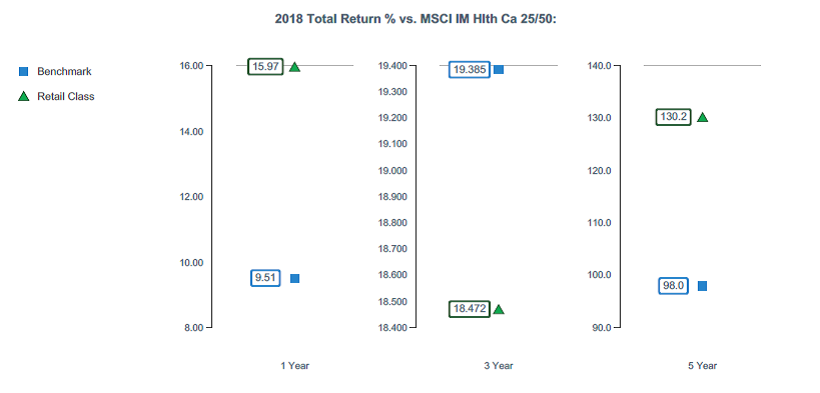
Health Care Services Portfolio
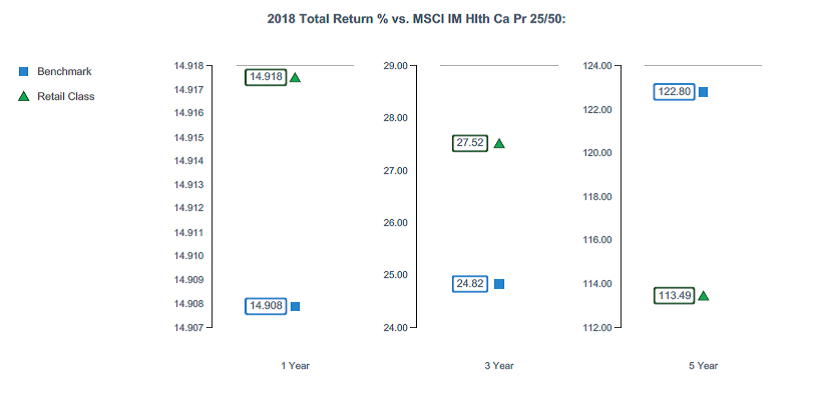
The Board considered the fund's underperformance for different time based on time periods ended prior to June 30, 2018 (which periods are not shown in the chart above). The Board's discussions with SelectCo regarding underperformance cover topics including, but not limited to: the longer-term track record of a fund's portfolio manager(s); broader trends in the market that may adversely impact a fund's performance; attribution reports on contributors to the fund's underperformance; and the applicable portfolio manager's explanation of his or her underperformance. The Board engages with SelectCo on steps that might be taken to address a fund's underperformance. The Board noted that the fund's more recent performance had improved.
Medical Technology and Devices Portfolio
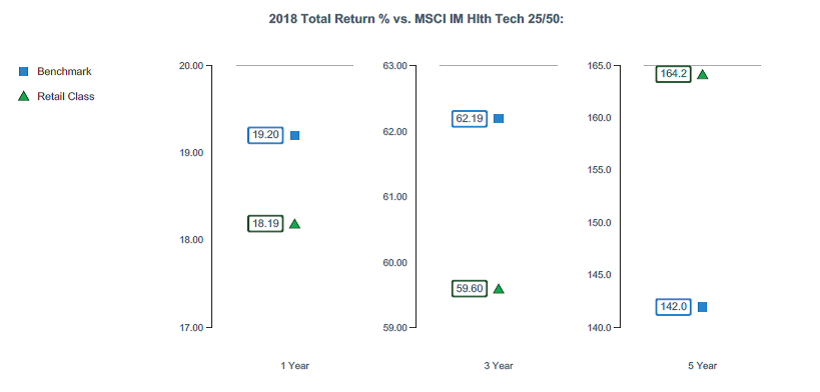
Pharmaceuticals Portfolio
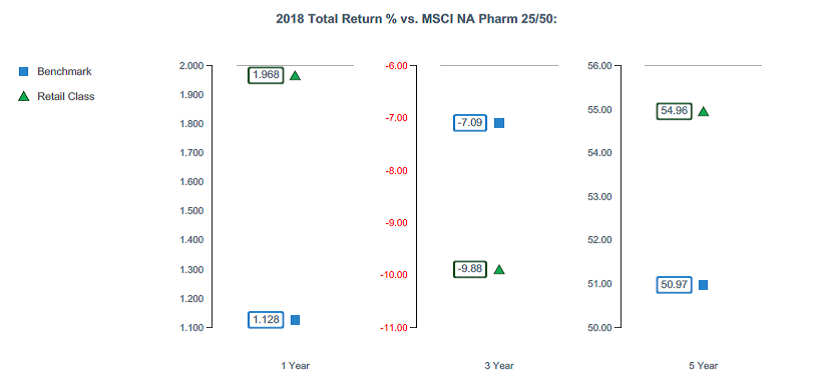
Based on its review, the Board concluded that the nature, extent, and quality of services provided to each fund under the Advisory Contracts should continue to benefit the shareholders of each fund.
Competitiveness of Management Fee and Total Expense Ratio. The Board considered each fund's management fee and total expense ratio compared to "mapped groups" of competitive funds and classes created for the purpose of facilitating the Trustees' competitive analysis of management fees and total expenses. Fidelity creates "mapped groups" by combining similar Lipper investment objective categories that have comparable investment mandates. For this purpose, all sector focused equity funds are grouped in the same mapped group. Combining Lipper investment objective categories aids the Board's management fee and total expense ratio comparisons by broadening the competitive group used for comparison.
Management Fee. The Board considered two proprietary management fee comparisons for the 12-month periods ended June 30 shown in basis points (BP) in the charts below. The group of Lipper funds used by the Board for management fee comparisons is referred to below as the "Total Mapped Group." The Total Mapped Group comparison focuses on a fund's standing in terms of gross management fees before expense reimbursements or caps relative to the total universe of funds with comparable investment mandates (i.e., sector equities), regardless of whether their management fee structures also are comparable. Funds with comparable management fee structures have similar management fee contractual arrangements (
e.g., flat rate charged for advisory services, all-inclusive fee rate,
etc.). "TMG %" represents the percentage of funds in the Total Mapped Group that had management fees that were lower than a fund's. For example, a hypothetical TMG % of 20% would mean that 80% of the funds in the Total Mapped Group had higher, and 20% had lower, management fees than a fund. The funds' actual TMG %s and the number of funds in the Total Mapped Group are in the charts below. The "Asset-Size Peer Group" (ASPG) comparison focuses on a fund's standing relative to a subset of non-Fidelity funds within the Total Mapped Group that are similar in size and management fee structure. For example, if a fund is in the first quartile of the ASPG, the fund's management fee ranks in the least expensive or lowest 25% of funds in the ASPG. The ASPG represents at least 15% of the funds in the Total Mapped Group with comparable asset size and management fee structures, subject to a minimum of 50 funds (or all funds in the Total Mapped Group if fewer than 50). Additional information, such as the ASPG quartile in which a fund's management fee rate ranked, is also included in the charts and was considered by the Board.
Biotechnology Portfolio
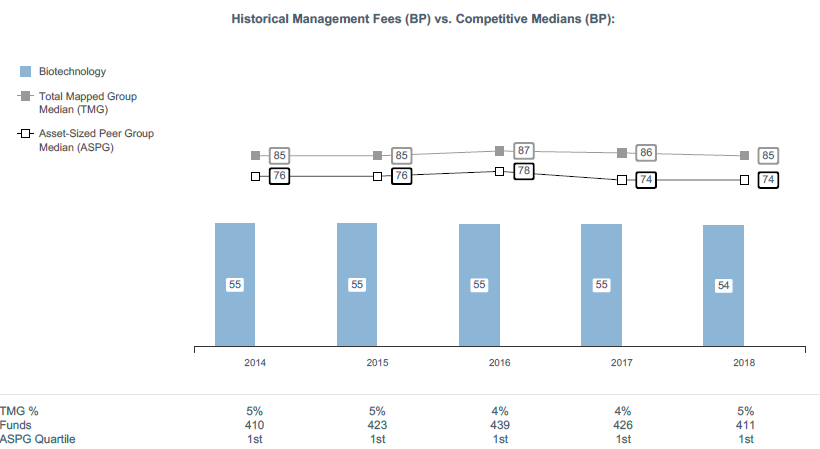
Health Care Portfolio

Health Care Services Portfolio
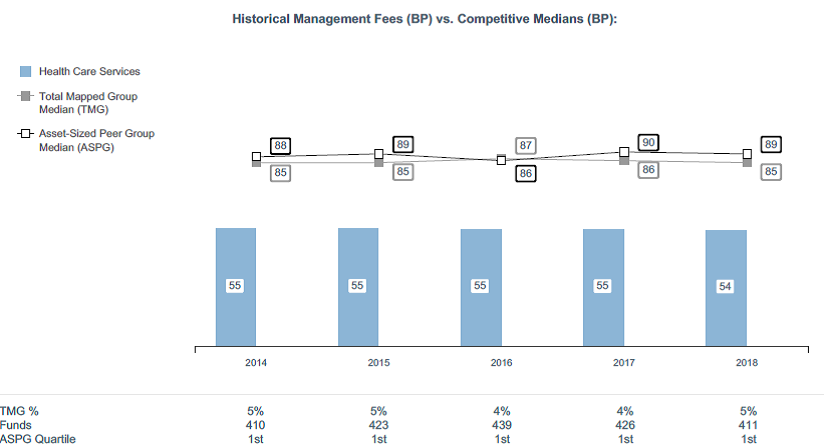
Medical Technology and Devices Portfolio
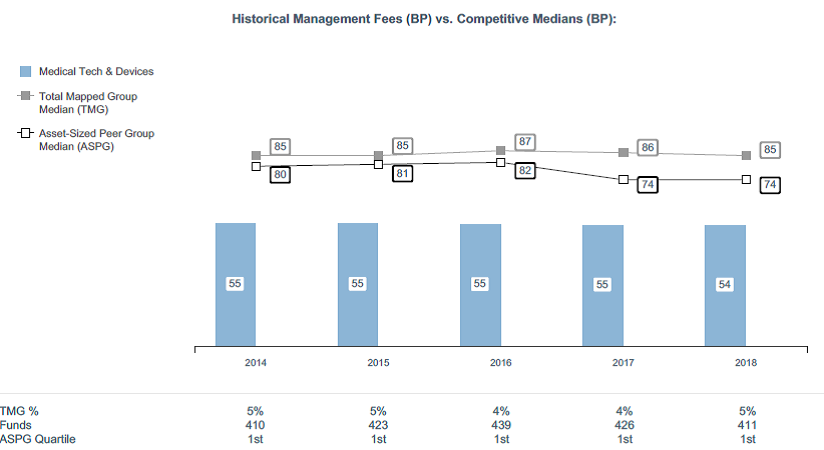
Pharmaceuticals Portfolio
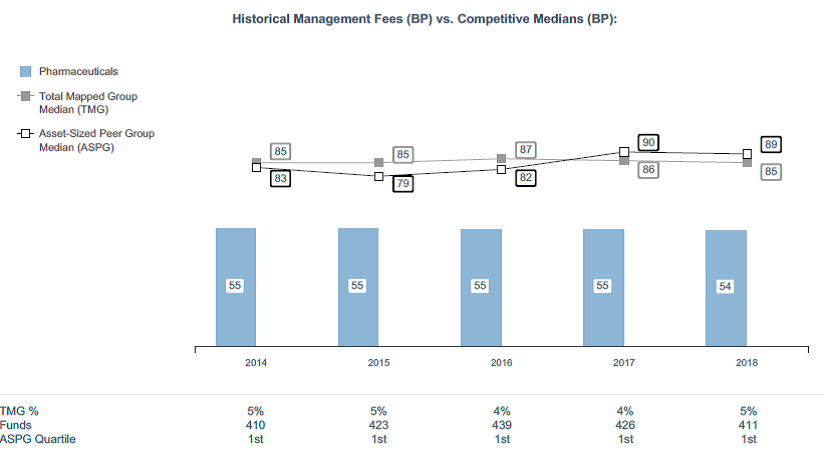
The Board noted that each fund's management fee rate ranked below the median of its Total Mapped Group and below the median of its ASPG for the 12-month period ended June 30, 2018.
The Board noted that it and the boards of other Fidelity funds formed an ad hoc Committee on Group Fee, which meets periodically, to conduct an in-depth review of the "group fee" component of the management fee of funds with such management fee structures. The Committee's focus included the mechanics of the group fee, the competitive landscape of group fee structures, Fidelity funds with no group fee component and investment products not included in group fee assets. The Board also considered that, for funds subject to the group fee, FMR agreed to voluntarily waive fees over a specified period of time in amounts designed to account for assets converted from certain funds to certain collective investment trusts.
Based on its review, the Board concluded that each fund's management fee is fair and reasonable in light of the services that the fund receives and the other factors considered.
Total Expense Ratio. In its review of each fund's total expense ratio, the Board considered the fund's management fee rate as well as other fund expenses, such as transfer agent fees, pricing and bookkeeping fees, and custodial, legal, and audit fees. The Board also noted that Fidelity may agree to waive fees and expenses from time to time, and the extent to which, if any, it has done so for each fund. As part of its review, the Board also considered the current and historical total expense ratios of each fund compared to competitive fund median expenses. Each fund is compared to those funds and classes in the Total Mapped Group (used by the Board for management fee comparisons) that have a similar sales load structure.
The Board noted that each fund's total expense ratio ranked below the competitive median for the 12-month period ended June 30, 2018.
Fees Charged to Other Fidelity Clients. The Board also considered Fidelity fee structures and other information with respect to clients of Fidelity, such as other funds advised or subadvised by Fidelity, pension plan clients, and other institutional clients with similar mandates. The Board noted that a joint ad hoc committee created by it and the boards of other Fidelity funds periodically reviews and compares Fidelity's institutional investment advisory business with its business of providing services to the Fidelity funds and also noted the most recent findings of the committee. The Board noted that the committee's review included a consideration of the differences in services provided, fees charged, and costs incurred, as well as competition in the markets serving the different categories of clients.
Based on its review of total expense ratios and fees charged to other Fidelity clients, the Board concluded that each fund's total expense ratio was reasonable in light of the services that the fund and its shareholders receive and the other factors considered.
Costs of the Services and Profitability. The Board considered the revenues earned and the expenses incurred by Fidelity in conducting the business of developing, marketing, distributing, managing, administering and servicing each fund and servicing each fund's shareholders. The Board also considered the level of Fidelity's profits in respect of all the Fidelity funds.
On an annual basis, Fidelity presents to the Board information about the profitability of its relationships with each fund. Fidelity calculates profitability information for each fund, as well as aggregate profitability information for groups of Fidelity funds and all Fidelity funds, using a series of detailed revenue and cost allocation methodologies which originate with the books and records of Fidelity on which Fidelity's audited financial statements are based. The Audit Committee of the Board reviews any significant changes from the prior year's methodologies.
PricewaterhouseCoopers LLP (PwC), auditor to Fidelity and certain Fidelity funds, has been engaged annually by the Board as part of the Board's assessment of Fidelity's profitability analysis. PwC's engagement includes the review and assessment of the methodologies used by Fidelity in determining the revenues and expenses attributable to Fidelity's mutual fund business, and completion of agreed-upon procedures in respect of the mathematical accuracy of the fund profitability information and its conformity to established allocation methodologies. After considering PwC's reports issued under the engagement and information provided by Fidelity, the Board concluded that while other allocation methods may also be reasonable, Fidelity's profitability methodologies are reasonable in all material respects.
The Board also reviewed Fidelity's non-fund businesses and potential indirect benefits such businesses may have received as a result of their association with Fidelity's mutual fund business (i.e., fall-out benefits) as well as cases where Fidelity's affiliates may benefit from the funds' business. The Board noted that changes to fall-out benefits year-over-year reflect business developments at Fidelity's various businesses.
The Board considered the costs of the services provided by and the profits realized by Fidelity in connection with the operation of each fund and was satisfied that the profitability was not excessive.
Economies of Scale. The Board considered whether there have been economies of scale in respect of the management of the Fidelity funds, whether the Fidelity funds (including each fund) have appropriately benefited from any such economies of scale, and whether there is potential for realization of any further economies of scale. The Board considered the extent to which each fund will benefit from economies of scale as assets grow through increased services to the fund, through waivers or reimbursements, or through fee or expense ratio reductions. The Board also noted that a committee (the Economies of Scale Committee) created by it and the boards of other Fidelity funds periodically analyzes whether Fidelity attains economies of scale in respect of the management and servicing of the Fidelity funds, whether the Fidelity funds have appropriately benefited from such economies of scale, and whether there is potential for realization of any further economies of scale.
The Board recognized that each fund's management contract incorporates a "group fee" structure, which provides for lower group fee rates as total group assets increase, and for higher group fee rates as total group assets decrease (with "group assets" defined to include fund assets under SelectCo's management plus assets under FMR's management). SelectCo calculates the group fee rates based on a tiered asset "breakpoint" schedule that varies based on asset class. The Board considered that the group fee is designed to deliver the benefits of economies of scale to fund shareholders when total group assets increase, even if assets of any particular fund are unchanged or have declined, because some portion of Fidelity's costs are attributable to services provided to all Fidelity funds, and all funds benefit if those costs can be allocated among more assets. The Board concluded that, given the group fee structure, fund shareholders will benefit from lower management fees as group assets increase at the fund complex level, regardless of whether Fidelity achieves any such economies of scale.
The Board concluded, taking into account the analysis of the Economies of Scale Committee, that economies of scale, if any, are being appropriately shared between fund shareholders and Fidelity.
Additional Information Requested by the Board. In order to develop fully the factual basis for consideration of the Fidelity funds' advisory contracts, the Board requested and received additional information on certain topics, including: (i) fund performance trends, in particular the underperformance of certain funds, and Fidelity's long-term strategies for certain funds; (ii) Fidelity's fund profitability methodology, profitability trends for certain funds, and the impact of certain factors on fund profitability results; (iii) metrics for evaluating index fund and ETF performance and information about ETF trading characteristics; (iv) the methodology with respect to the evaluation of competitive fund data and peer group classifications and fee comparisons; (v) the expense structures for different funds and classes; (vi) information regarding other accounts managed by Fidelity, including collective investment trusts; and (vii) Fidelity's philosophies and strategies for evaluating funds and classes with lower or declining asset levels.
Based on its evaluation of all of the conclusions noted above, and after considering all factors it believed relevant, the Board concluded that the advisory fee arrangements are fair and reasonable, and that each fund's Advisory Contracts should be renewed.
SELHC-ANN-0419
1.813640.114
Fidelity® Select Portfolios®
Industrials Sector Air Transportation Portfolio
Defense and Aerospace Portfolio
Environment and Alternative Energy Portfolio
Industrials Portfolio
Transportation Portfolio
Annual Report February 28, 2019 |
|
Beginning on January 1, 2021, as permitted by regulations adopted by the Securities and Exchange Commission, paper copies of a fund’s shareholder reports will no longer be sent by mail, unless you specifically request paper copies of the reports from the fund or from your financial intermediary, such as a financial advisor, broker-dealer or bank. Instead, the reports will be made available on a website, and you will be notified by mail each time a report is posted and provided with a website link to access the report.
If you already elected to receive shareholder reports electronically, you will not be affected by this change and you need not take any action. You may elect to receive shareholder reports and other communications from a fund electronically, by contacting your financial intermediary. For Fidelity customers, visit Fidelity's web site or call Fidelity using the contact information listed below.
You may elect to receive all future reports in paper free of charge. If you wish to continue receiving paper copies of your shareholder reports, you may contact your financial intermediary or, if you are a Fidelity customer, visit Fidelity’s website, or call Fidelity at the applicable toll-free number listed below. Your election to receive reports in paper will apply to all funds held with the fund complex/your financial intermediary.
| Account Type | Website | Phone Number |
| Brokerage, Mutual Fund, or Annuity Contracts: | fidelity.com/mailpreferences | 1-800-343-3548 |
| Employer Provided Retirement Accounts: | netbenefits.fidelity.com/preferences (choose 'no' under Required Disclosures to continue to print) | 1-800-343-0860 |
| Advisor Sold Accounts Serviced Through Your Financial Intermediary: | Contact Your Financial Intermediary | Your Financial Intermediary's phone number |
| Advisor Sold Accounts Serviced by Fidelity: | institutional.fidelity.com | 1-877-208-0098 |
Contents
To view a fund's proxy voting guidelines and proxy voting record for the 12-month period ended June 30, visit http://www.fidelity.com/proxyvotingresults or visit the Securities and Exchange Commission's (SEC) web site at http://www.sec.gov.
You may also call 1-800-544-8544 to request a free copy of the proxy voting guidelines.
Standard & Poor's, S&P and S&P 500 are registered service marks of The McGraw-Hill Companies, Inc. and have been licensed for use by Fidelity Distributors Corporation.
Other third-party marks appearing herein are the property of their respective owners.
All other marks appearing herein are registered or unregistered trademarks or service marks of FMR LLC or an affiliated company. © 2019 FMR LLC. All rights reserved.
This report and the financial statements contained herein are submitted for the general information of the shareholders of the Funds. This report is not authorized for distribution to prospective investors in the Funds unless preceded or accompanied by an effective prospectus.
A fund files its complete schedule of portfolio holdings with the SEC for the first and third quarters of each fiscal year on Form N-Q. Forms N-Q are available on the SEC’s web site at http://www.sec.gov. A fund's Forms N-Q may be reviewed and copied at the SEC’s Public Reference Room in Washington, DC. Information regarding the operation of the SEC's Public Reference Room may be obtained by calling 1-800-SEC-0330.
For a complete list of a fund's portfolio holdings, view the most recent holdings listing, semiannual report, or annual report on Fidelity's web site at http://www.fidelity.com, http://www.institutional.fidelity.com, or http://www.401k.com, as applicable.
NOT FDIC INSURED •MAY LOSE VALUE •NO BANK GUARANTEE
Neither the Funds nor Fidelity Distributors Corporation is a bank.
Air Transportation Portfolio
Performance: The Bottom Line
Average annual total return reflects the change in the value of an investment, assuming reinvestment of distributions from dividend income and capital gains (the profits earned upon the sale of securities that have grown in value, if any) and assuming a constant rate of performance each year. The hypothetical investment and the average annual total returns do not reflect the deduction of taxes that a shareholder would pay on fund distributions or the redemption of fund shares. During periods of reimbursement by Fidelity, a fund’s total return will be greater than it would be had the reimbursement not occurred. How a fund did yesterday is no guarantee of how it will do tomorrow.
Average Annual Total Returns
| For the periods ended February 28, 2019 | Past 1 year | Past 5 years | Past 10 years |
| Air Transportation Portfolio | 3.79% | 11.55% | 22.06% |
$10,000 Over 10 Years
Let's say hypothetically that $10,000 was invested in Air Transportation Portfolio on February 28, 2009.
The chart shows how the value of your investment would have changed, and also shows how the S&P 500® Index performed over the same period.
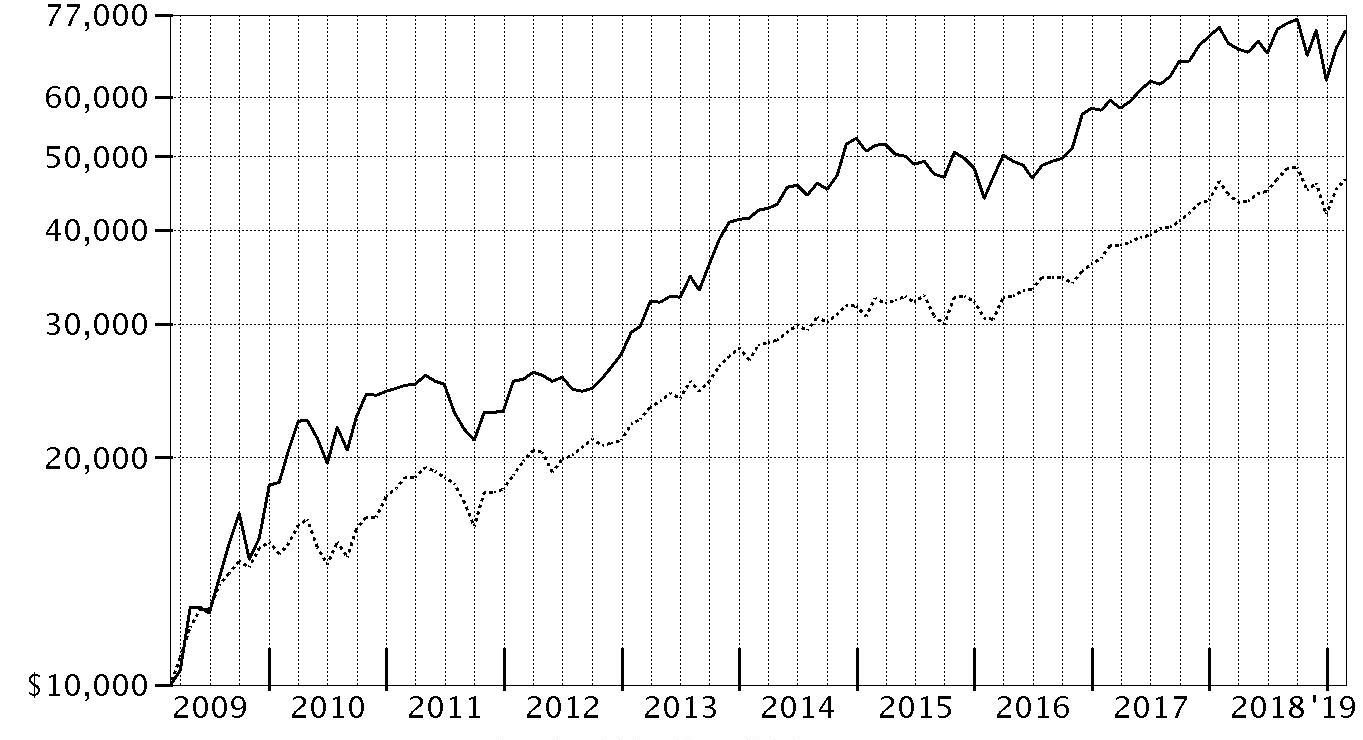
| Period Ending Values |
| $73,384 | Air Transportation Portfolio |
| $46,739 | S&P 500® Index |
Air Transportation Portfolio
Management's Discussion of Fund Performance
Market Recap: The S&P 500
® index gained 4.68% for the 12 months ending February 28, 2019, as the U.S. equity bellwether began the new year on a high note after enduring a final quarter of 2018 in which resurgent volatility upset the aging bull market. In October, rising U.S. Treasury yields and concern about peaking corporate earnings growth sent many investors fleeing from risk assets as they were still dealing with lingering uncertainty related to global trade and the U.S. Federal Reserve picking up the pace of interest rate hikes. The index returned -6.84% in October, at the time its largest monthly drop in seven years. But conditions worsened through Christmas, as jitters about the economy and another hike in rates led to a spike in market volatility and a -9.03% result for December. Sharply reversing course to begin 2019, the S&P 500
® gained 11.48% year-to-date, its strongest two-month opening since 1991, amid upbeat company earnings/outlooks and signs the Fed may pause on rates. For the full period, some economically sensitive sectors fared worst, with financials (-6%) and materials (-6%) both losing ground. Energy gained 1%, while communication services and industrials each rose roughly 2%. In contrast, the defensive utilities (+20%), real estate (+20%) and health care (+11%) sectors led the way, while consumer staples finished near the index. Information technology and consumer discretionary were rattled in the late-2018 downturn, but earlier strength contributed to advances of 9% and roughly 7%, respectively.
Comments from Portfolio Manager Matthew Moulis: For the fiscal year, the fund gained 3.79%, trailing the 4.88% return of the Nasdaq
® North America Air Transportation Total Return Linked Index, and also lagging the S&P 500
®. Versus the Nasdaq industry index, unfavorable positioning in aerospace & defense stocks was the main drag on fund performance. In fact, four of the five largest relative detractors this period were aerospace & defense stocks – all strong-performing stocks I either underweighted or chose not to purchase for the fund. At the individual stock level, a large underweighting in TransDigm Group – which I considered expensively valued – was the fund’s top relative detractor. In October, the maker of aerospace components announced plans to purchase Esterline Technologies, an index component that detracted from our relative result because we didn’t own it. Avoiding index component Heico until February also detracted, as I missed out on its earlier gain. Conversely, out-of-benchmark exposure to railroads and to internet & direct marketing retail stocks bolstered the fund’s relative result, as did positioning in air freight & logistics. Boeing was the fund’s top contributor this period. I increased the fund’s position in Boeing during the fourth quarter of 2018 – a timely decision, given the stock’s subsequent rally to a new all-time high in February. Overweighting Spirit Airlines, where I increased the fund’s weighting considerably this period, and a non-index position in railroad Norfolk Southern lifted our relative result as well.
The views expressed above reflect those of the portfolio manager(s) only through the end of the period as stated on the cover of this report and do not necessarily represent the views of Fidelity or any other person in the Fidelity organization. Any such views are subject to change at any time based upon market or other conditions and Fidelity disclaims any responsibility to update such views. These views may not be relied on as investment advice and, because investment decisions for a Fidelity fund are based on numerous factors, may not be relied on as an indication of trading intent on behalf of any Fidelity fund.
Air Transportation Portfolio
Investment Summary (Unaudited)
Top Ten Stocks as of February 28, 2019
| | % of fund's net assets |
| The Boeing Co. | 13.6 |
| United Parcel Service, Inc. Class B | 9.7 |
| Southwest Airlines Co. | 9.7 |
| Delta Air Lines, Inc. | 8.4 |
| United Technologies Corp. | 6.9 |
| Spirit AeroSystems Holdings, Inc. Class A | 4.8 |
| American Airlines Group, Inc. | 4.5 |
| Spirit Airlines, Inc. | 4.1 |
| HEICO Corp. Class A | 3.7 |
| FedEx Corp. | 2.7 |
| | 68.1 |
Top Industries (% of fund's net assets)
| As of February 28, 2019 |
| | Aerospace & Defense | 41.3% |
| | Airlines | 37.0% |
| | Air Freight & Logistics | 15.6% |
| | Road & Rail | 2.2% |
| | Trading Companies & Distributors | 0.4% |
| | All Others* | 3.5% |

* Includes short-term investments and net other assets (liabilities).
Air Transportation Portfolio
Schedule of Investments February 28, 2019
Showing Percentage of Net Assets
| Common Stocks - 96.7% | | | |
| | | Shares | Value |
| Aerospace & Defense - 41.3% | | | |
| Aerospace & Defense - 41.3% | | | |
| AAR Corp. | | 56,300 | $2,056,639 |
| Astronics Corp. (a) | | 10,120 | 364,016 |
| Bombardier, Inc. Class B (sub. vtg.) (a) | | 3,141,200 | 6,683,658 |
| CAE, Inc. | | 352,500 | 7,433,318 |
| HEICO Corp. Class A | | 144,000 | 11,518,560 |
| Heroux-Devtek, Inc. (a) | | 113,400 | 1,385,670 |
| Hexcel Corp. | | 10,400 | 750,256 |
| Moog, Inc. Class A | | 48,000 | 4,510,080 |
| Spirit AeroSystems Holdings, Inc. Class A | | 147,900 | 14,612,520 |
| Teledyne Technologies, Inc. (a) | | 3,300 | 778,932 |
| Textron, Inc. | | 106,200 | 5,766,660 |
| The Boeing Co. | | 95,210 | 41,888,592 |
| TransDigm Group, Inc. (a) | | 18,400 | 7,987,256 |
| United Technologies Corp. | | 167,400 | 21,037,158 |
| | | | 126,773,315 |
| Air Freight & Logistics - 15.6% | | | |
| Air Freight & Logistics - 15.6% | | | |
| C.H. Robinson Worldwide, Inc. | | 32,600 | 2,946,388 |
| Expeditors International of Washington, Inc. | | 74,976 | 5,619,451 |
| FedEx Corp. | | 46,100 | 8,344,100 |
| Forward Air Corp. | | 16,050 | 1,037,633 |
| United Parcel Service, Inc. Class B | | 270,500 | 29,809,100 |
| | | | 47,756,672 |
| Airlines - 37.0% | | | |
| Airlines - 37.0% | | | |
| Air Canada (a) | | 210,100 | 5,286,227 |
| Alaska Air Group, Inc. | | 110,000 | 6,787,000 |
| Allegiant Travel Co. | | 4,600 | 607,660 |
| American Airlines Group, Inc. | | 389,300 | 13,870,759 |
| Dart Group PLC | | 97,786 | 1,043,424 |
| Delta Air Lines, Inc. | | 517,502 | 25,657,749 |
| Hawaiian Holdings, Inc. | | 56,300 | 1,674,925 |
| JetBlue Airways Corp. (a) | | 214,200 | 3,577,140 |
| Mesa Air Group, Inc. | | 107,100 | 1,078,497 |
| SkyWest, Inc. | | 127,300 | 6,879,292 |
| Southwest Airlines Co. | | 530,800 | 29,746,032 |
| Spirit Airlines, Inc. (a) | | 221,600 | 12,465,000 |
| United Continental Holdings, Inc. (a) | | 54,600 | 4,794,426 |
| | | | 113,468,131 |
| Machinery - 0.2% | | | |
| Industrial Machinery - 0.2% | | | |
| Park-Ohio Holdings Corp. | | 16,990 | 540,112 |
| Road & Rail - 2.2% | | | |
| Railroads - 2.2% | | | |
| Genesee & Wyoming, Inc. Class A (a) | | 15,400 | 1,262,800 |
| Norfolk Southern Corp. | | 31,500 | 5,647,950 |
| | | | 6,910,750 |
| Trading Companies & Distributors - 0.4% | | | |
| Trading Companies & Distributors - 0.4% | | | |
| HD Supply Holdings, Inc. (a) | | 29,700 | 1,277,397 |
| TOTAL COMMON STOCKS | | | |
| (Cost $206,662,465) | | | 296,726,377 |
|
| Money Market Funds - 3.1% | | | |
| Fidelity Cash Central Fund, 2.44% (b) | | | |
| (Cost $9,419,316) | | 9,417,516 | 9,419,400 |
| TOTAL INVESTMENT IN SECURITIES - 99.8% | | | |
| (Cost $216,081,781) | | | 306,145,777 |
| NET OTHER ASSETS (LIABILITIES) - 0.2% | | | 717,376 |
| NET ASSETS - 100% | | | $306,863,153 |
Legend
(a) Non-income producing
(b) Affiliated fund that is generally available only to investment companies and other accounts managed by Fidelity Investments. The rate quoted is the annualized seven-day yield of the fund at period end. A complete unaudited listing of the fund's holdings as of its most recent quarter end is available upon request. In addition, each Fidelity Central Fund's financial statements, which are not covered by the Fund's Report of Independent Registered Public Accounting Firm, are available on the SEC's website or upon request.
Affiliated Central Funds
Information regarding fiscal year to date income earned by the Fund from investments in Fidelity Central Funds is as follows:
| Fund | Income earned |
| Fidelity Cash Central Fund | $184,258 |
| Fidelity Securities Lending Cash Central Fund | 796 |
| Total | $185,054 |
Amounts in the income column in the above table include any capital gain distributions from underlying funds, which are presented in the corresponding line-item in the Statement of Operations, if applicable.
Investment Valuation
All investments are categorized as Level 1 under the Fair Value Hierarchy. The inputs or methodology used for valuing securities may not be an indication of the risk associated with investing in those securities. For more information on valuation inputs please refer to the Investment Valuation section in the accompanying Notes to Financial Statements.
See accompanying notes which are an integral part of the financial statements.
Air Transportation Portfolio
Financial Statements
Statement of Assets and Liabilities
| | | February 28, 2019 |
| Assets | | |
Investment in securities, at value — See accompanying schedule:
Unaffiliated issuers (cost $206,662,465) | $296,726,377 | |
| Fidelity Central Funds (cost $9,419,316) | 9,419,400 | |
| Total Investment in Securities (cost $216,081,781) | | $306,145,777 |
| Receivable for fund shares sold | | 181,199 |
| Dividends receivable | | 862,395 |
| Distributions receivable from Fidelity Central Funds | | 18,716 |
| Prepaid expenses | | 3,163 |
| Other receivables | | 306 |
| Total assets | | 307,211,556 |
| Liabilities | | |
| Payable for fund shares redeemed | $117,795 | |
| Accrued management fee | 136,342 | |
| Transfer agent fee payable | 50,566 | |
| Other affiliated payables | 9,822 | |
| Other payables and accrued expenses | 33,878 | |
| Total liabilities | | 348,403 |
| Net Assets | | $306,863,153 |
| Net Assets consist of: | | |
| Paid in capital | | $214,216,280 |
| Total distributable earnings (loss) | | 92,646,873 |
| Net Assets, for 4,010,402 shares outstanding | | $306,863,153 |
| Net Asset Value, offering price and redemption price per share ($306,863,153 ÷ 4,010,402 shares) | | $76.52 |
See accompanying notes which are an integral part of the financial statements.
Statement of Operations
| | | Year ended February 28, 2019 |
| Investment Income | | |
| Dividends | | $4,659,881 |
| Income from Fidelity Central Funds | | 185,054 |
| Total income | | 4,844,935 |
| Expenses | | |
| Management fee | $1,732,220 | |
| Transfer agent fees | 663,187 | |
| Accounting and security lending fees | 124,866 | |
| Custodian fees and expenses | 7,165 | |
| Independent trustees' fees and expenses | 1,834 | |
| Registration fees | 31,519 | |
| Audit | 41,752 | |
| Legal | 2,126 | |
| Miscellaneous | 2,661 | |
| Total expenses before reductions | 2,607,330 | |
| Expense reductions | (13,492) | |
| Total expenses after reductions | | 2,593,838 |
| Net investment income (loss) | | 2,251,097 |
| Realized and Unrealized Gain (Loss) | | |
| Net realized gain (loss) on: | | |
| Investment securities: | | |
| Unaffiliated issuers | 18,552,503 | |
| Fidelity Central Funds | 581 | |
| Foreign currency transactions | (988) | |
| Total net realized gain (loss) | | 18,552,096 |
| Change in net unrealized appreciation (depreciation) on: | | |
| Investment securities: | | |
| Unaffiliated issuers | (12,855,937) | |
| Fidelity Central Funds | (618) | |
| Total change in net unrealized appreciation (depreciation) | | (12,856,555) |
| Net gain (loss) | | 5,695,541 |
| Net increase (decrease) in net assets resulting from operations | | $7,946,638 |
See accompanying notes which are an integral part of the financial statements.
Statement of Changes in Net Assets
| | Year ended February 28, 2019 | Year ended February 28, 2018 |
| Increase (Decrease) in Net Assets | | |
| Operations | | |
| Net investment income (loss) | $2,251,097 | $2,348,661 |
| Net realized gain (loss) | 18,552,096 | 58,361,433 |
| Change in net unrealized appreciation (depreciation) | (12,856,555) | 7,767,249 |
| Net increase (decrease) in net assets resulting from operations | 7,946,638 | 68,477,343 |
| Distributions to shareholders | (35,655,527) | – |
| Distributions to shareholders from net investment income | – | (1,727,901) |
| Distributions to shareholders from net realized gain | – | (33,467,895) |
| Total distributions | (35,655,527) | (35,195,796) |
| Share transactions | | |
| Proceeds from sales of shares | 52,101,305 | 112,568,755 |
| Reinvestment of distributions | 34,073,279 | 33,832,861 |
| Cost of shares redeemed | (134,132,078) | (191,306,787) |
| Net increase (decrease) in net assets resulting from share transactions | (47,957,494) | (44,905,171) |
| Redemption fees | – | 10,516 |
| Total increase (decrease) in net assets | (75,666,383) | (11,613,108) |
| Net Assets | | |
| Beginning of period | 382,529,536 | 394,142,644 |
| End of period | $306,863,153 | $382,529,536 |
| Other Information | | |
| Undistributed net investment income end of period | | $630,200 |
| Shares | | |
| Sold | 666,871 | 1,390,397 |
| Issued in reinvestment of distributions | 475,878 | 414,264 |
| Redeemed | (1,761,425) | (2,358,846) |
| Net increase (decrease) | (618,676) | (554,185) |
See accompanying notes which are an integral part of the financial statements.
Financial Highlights
Air Transportation Portfolio
| | | | | | |
| Years ended February 28, | 2019 | 2018 | 2017 | 2016 A | 2015 |
| Selected Per–Share Data | | | | | |
| Net asset value, beginning of period | $82.64 | $76.04 | $60.60 | $73.09 | $61.02 |
| Income from Investment Operations | | | | | |
| Net investment income (loss)B | .54 | .48C | .32 | .18 | .20D |
| Net realized and unrealized gain (loss) | 1.73 | 13.85 | 15.61 | (6.82) | 13.09 |
| Total from investment operations | 2.27 | 14.33 | 15.93 | (6.64) | 13.29 |
| Distributions from net investment income | (.48) | (.38) | (.25) | (.17) | (.08) |
| Distributions from net realized gain | (7.91) | (7.36) | (.24) | (5.68) | (1.14) |
| Total distributions | (8.39) | (7.73)E | (.49) | (5.85) | (1.23)F |
| Redemption fees added to paid in capitalB | – | –G | –G | –G | .01 |
| Net asset value, end of period | $76.52 | $82.64 | $76.04 | $60.60 | $73.09 |
| Total ReturnH | 3.79% | 19.07% | 26.30% | (9.24)% | 21.93% |
| Ratios to Average Net AssetsI,J | | | | | |
| Expenses before reductions | .81% | .82% | .85% | .83% | .83% |
| Expenses net of fee waivers, if any | .81% | .82% | .85% | .83% | .83% |
| Expenses net of all reductions | .81% | .82% | .84% | .82% | .83% |
| Net investment income (loss) | .70% | .59%C | .48% | .27% | .30%D |
| Supplemental Data | | | | | |
| Net assets, end of period (000 omitted) | $306,863 | $382,530 | $394,143 | $325,630 | $715,925 |
| Portfolio turnover rateK | 32% | 86% | 106% | 97% | 65%L |
A For the year ended February 29.
B Calculated based on average shares outstanding during the period.
C Net investment income per share reflects a large, non-recurring dividend which amounted to $.22 per share. Excluding this non-recurring dividend, the ratio of net investment income (loss) to average net assets would have been .31%.
D Net investment income per share reflects a large, non-recurring dividend which amounted to $.22 per share. Excluding this non-recurring dividend, the ratio of net investment income (loss) to average net assets would have been (.04) %.
E Total distributions of $7.73 per share is comprised of distributions from net investment income of $.377 and distributions from net realized gain of $7.357 per share.
F Total distributions of $1.23 per share is comprised of distributions from net investment income of $.084 and distributions from net realized gain of $1.144 per share.
G Amount represents less than $.005 per share.
H Total returns would have been lower if certain expenses had not been reduced during the applicable periods shown.
I Fees and expenses of any underlying Fidelity Central Funds are not included in the Fund's expense ratio. The Fund indirectly bears its proportionate share of the expenses of any underlying Fidelity Central Funds.
J Expense ratios reflect operating expenses of the Fund. Expenses before reductions do not reflect amounts reimbursed by the investment adviser or reductions from brokerage service arrangements or reductions from other expense offset arrangements and do not represent the amount paid by the Fund during periods when reimbursements or reductions occur. Expenses net of fee waivers reflect expenses after reimbursement by the investment adviser but prior to reductions from brokerage service arrangements or other expense offset arrangements. Expenses net of all reductions represent the net expenses paid by the Fund.
K Amount does not include the portfolio activity of any underlying Fidelity Central Funds.
L Portfolio turnover rate excludes securities received or delivered in-kind.
See accompanying notes which are an integral part of the financial statements.
Defense and Aerospace Portfolio
Performance: The Bottom Line
Average annual total return reflects the change in the value of an investment, assuming reinvestment of distributions from dividend income and capital gains (the profits earned upon the sale of securities that have grown in value, if any) and assuming a constant rate of performance each year. The hypothetical investment and the average annual total returns do not reflect the deduction of taxes that a shareholder would pay on fund distributions or the redemption of fund shares. During periods of reimbursement by Fidelity, a fund’s total return will be greater than it would be had the reimbursement not occurred. How a fund did yesterday is no guarantee of how it will do tomorrow.
Average Annual Total Returns
| For the periods ended February 28, 2019 | Past 1 year | Past 5 years | Past 10 years |
| Defense and Aerospace Portfolio | 3.57% | 14.03% | 20.96% |
$10,000 Over 10 Years
Let's say hypothetically that $10,000 was invested in Defense and Aerospace Portfolio on February 28, 2009.
The chart shows how the value of your investment would have changed, and also shows how the S&P 500® Index performed over the same period.
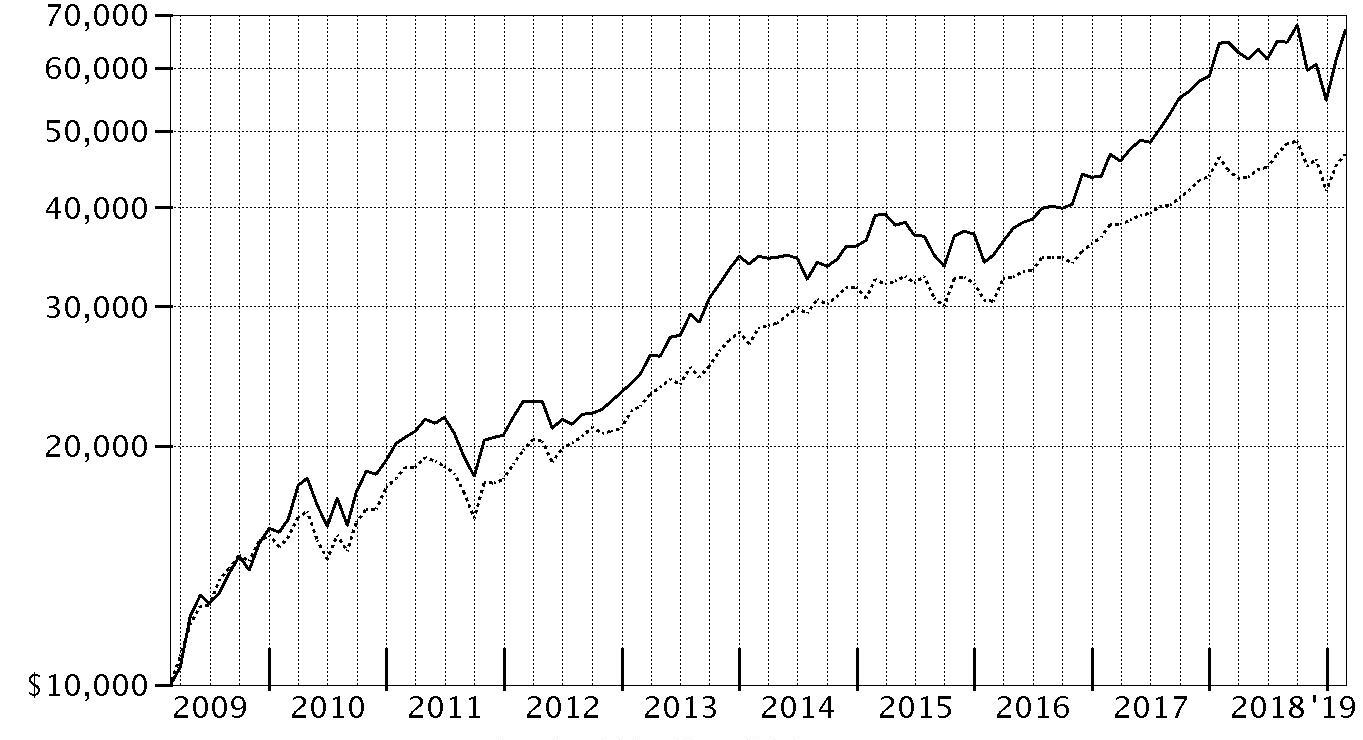
| Period Ending Values |
| $67,039 | Defense and Aerospace Portfolio |
| $46,739 | S&P 500® Index |
Defense and Aerospace Portfolio
Management's Discussion of Fund Performance
Market Recap: The S&P 500
® index gained 4.68% for the 12 months ending February 28, 2019, as the U.S. equity bellwether began the new year on a high note after enduring a final quarter of 2018 in which resurgent volatility upset the aging bull market. In October, rising U.S. Treasury yields and concern about peaking corporate earnings growth sent many investors fleeing from risk assets as they were still dealing with lingering uncertainty related to global trade and the U.S. Federal Reserve picking up the pace of interest rate hikes. The index returned -6.84% in October, at the time its largest monthly drop in seven years. But conditions worsened through Christmas, as jitters about the economy and another hike in rates led to a spike in market volatility and a -9.03% result for December. Sharply reversing course to begin 2019, the S&P 500
® gained 11.48% year-to-date, its strongest two-month opening since 1991, amid upbeat company earnings/outlooks and signs the Fed may pause on rates. For the full period, some economically sensitive sectors fared worst, with financials (-6%) and materials (-6%) both losing ground. Energy gained 1%, while communication services and industrials each rose roughly 2%. In contrast, the defensive utilities (+20%), real estate (+20%) and health care (+11%) sectors led the way, while consumer staples finished near the index. Information technology and consumer discretionary were rattled in the late-2018 downturn, but earlier strength contributed to advances of 9% and roughly 7%, respectively.
Comments from Portfolio Manager Jonathan Siegmann: For the fiscal year, the fund gained 3.57%, trailing the 6.62% return of the MSCI U.S. IMI Aerospace & Defense 25/50 Linked Index, and also falling short of the S&P 500
®. Versus the MSCI industry index, stock selection in the fund’s main category of aerospace & defense detracted most from performance. In particular, several overweighted positions on the defense side were disappointing. These included Northrop Grumman, the fund’s largest individual relative detractor and our second-largest holding, General Dynamics and Huntington Ingalls Industries, a shipbuilder. Defense stocks lagged their commercial aerospace counterparts, partly due to rich valuations to start the period, uncertainty created by the early departure of Defense Secretary James Mattis, and a tweet by President Trump that prompted questions about his commitment to defense spending. Out-of-benchmark exposure to Canada-based train/aircraft manufacturer Bombardier and an underweighting in index heavyweight Boeing also weighed on the fund’s relative result. Conversely, non-index exposure to industrial machinery modestly bolstered relative performance. Among individual holdings, the fund’s top relative contributor was major defense contractor Lockheed Martin, which I underweighted. Three aerospace components makers also were among the fund’s notable relative contributors: Heico, TransDigm Group and Teledyne Technologies, all large overweightings that performed well.
The views expressed above reflect those of the portfolio manager(s) only through the end of the period as stated on the cover of this report and do not necessarily represent the views of Fidelity or any other person in the Fidelity organization. Any such views are subject to change at any time based upon market or other conditions and Fidelity disclaims any responsibility to update such views. These views may not be relied on as investment advice and, because investment decisions for a Fidelity fund are based on numerous factors, may not be relied on as an indication of trading intent on behalf of any Fidelity fund.
Defense and Aerospace Portfolio
Investment Summary (Unaudited)
Top Ten Stocks as of February 28, 2019
| | % of fund's net assets |
| The Boeing Co. | 22.6 |
| Northrop Grumman Corp. | 11.3 |
| TransDigm Group, Inc. | 8.2 |
| General Dynamics Corp. | 6.7 |
| HEICO Corp. Class A | 4.9 |
| Spirit AeroSystems Holdings, Inc. Class A | 4.8 |
| United Technologies Corp. | 4.7 |
| Teledyne Technologies, Inc. | 4.6 |
| Huntington Ingalls Industries, Inc. | 4.6 |
| Moog, Inc. Class A | 4.6 |
| | 77.0 |
Top Industries (% of fund's net assets)
| As of February 28, 2019 |
| | Aerospace & Defense | 96.8% |
| | IT Services | 1.4% |
| | Machinery | 0.9% |
| | All Others* | 0.9% |

* Includes short-term investments and net other assets (liabilities).
Defense and Aerospace Portfolio
Schedule of Investments February 28, 2019
Showing Percentage of Net Assets
| Common Stocks - 99.1% | | | |
| | | Shares | Value |
| Aerospace & Defense - 96.8% | | | |
| Aerospace & Defense - 96.8% | | | |
| Airbus Group NV | | 239,200 | $30,816,757 |
| Arconic, Inc. | | 3,992,969 | 73,829,997 |
| Astronics Corp. (a) | | 1,379,945 | 49,636,622 |
| Astronics Corp. Class B | | 421,216 | 14,995,290 |
| Axon Enterprise, Inc. (a) | | 79,300 | 4,268,719 |
| BAE Systems PLC | | 3,597,086 | 22,178,482 |
| Bombardier, Inc. Class B (sub. vtg.) (a) | | 37,381,600 | 79,538,341 |
| BWX Technologies, Inc. | | 522,800 | 27,368,580 |
| CAE, Inc. | | 850,800 | 17,941,183 |
| Cubic Corp. | | 233,100 | 14,382,270 |
| Curtiss-Wright Corp. | | 144,800 | 17,852,392 |
| Elbit Systems Ltd. | | 570,885 | 74,940,074 |
| FACC AG | | 235,920 | 3,708,558 |
| General Dynamics Corp. | | 1,106,300 | 188,314,386 |
| Harris Corp. | | 96,400 | 15,899,252 |
| HEICO Corp. Class A | | 1,711,934 | 136,937,601 |
| Huntington Ingalls Industries, Inc. | | 611,075 | 127,965,216 |
| KEYW Holding Corp. (a) | | 247,382 | 1,830,627 |
| Kongsberg Gruppen ASA | | 331,500 | 5,082,924 |
| Lockheed Martin Corp. | | 292,715 | 90,568,948 |
| Moog, Inc. Class A | | 1,361,060 | 127,885,198 |
| Northrop Grumman Corp. | | 1,093,050 | 316,940,778 |
| Raytheon Co. | | 20,926 | 3,902,699 |
| Spirit AeroSystems Holdings, Inc. Class A | | 1,367,500 | 135,109,000 |
| Teledyne Technologies, Inc. (a) | | 546,600 | 129,019,464 |
| The Boeing Co. | | 1,438,419 | 632,846,821 |
| TransDigm Group, Inc. (a) | | 527,746 | 229,089,261 |
| United Technologies Corp. | | 1,050,656 | 132,035,940 |
| | | | 2,704,885,380 |
| IT Services - 1.4% | | | |
| IT Consulting & Other Services - 1.4% | | | |
| CACI International, Inc. Class A (a) | | 5,142 | 937,181 |
| Leidos Holdings, Inc. | | 592,830 | 38,290,890 |
| | | | 39,228,071 |
| Machinery - 0.9% | | | |
| Industrial Machinery - 0.9% | | | |
| Woodward, Inc. | | 266,051 | 25,631,353 |
| TOTAL COMMON STOCKS | | | |
| (Cost $1,896,997,230) | | | 2,769,744,804 |
|
| Money Market Funds - 0.9% | | | |
| Fidelity Cash Central Fund, 2.44% (b) | | | |
| (Cost $26,735,569) | | 26,730,223 | 26,735,569 |
| TOTAL INVESTMENT IN SECURITIES - 100.0% | | | |
| (Cost $1,923,732,799) | | | 2,796,480,373 |
| NET OTHER ASSETS (LIABILITIES) - 0.0% | | | (1,221,707) |
| NET ASSETS - 100% | | | $2,795,258,666 |
Legend
(a) Non-income producing
(b) Affiliated fund that is generally available only to investment companies and other accounts managed by Fidelity Investments. The rate quoted is the annualized seven-day yield of the fund at period end. A complete unaudited listing of the fund's holdings as of its most recent quarter end is available upon request. In addition, each Fidelity Central Fund's financial statements, which are not covered by the Fund's Report of Independent Registered Public Accounting Firm, are available on the SEC's website or upon request.
Affiliated Central Funds
Information regarding fiscal year to date income earned by the Fund from investments in Fidelity Central Funds is as follows:
| Fund | Income earned |
| Fidelity Cash Central Fund | $429,488 |
| Fidelity Securities Lending Cash Central Fund | 26,941 |
| Total | $456,429 |
Amounts in the income column in the above table include any capital gain distributions from underlying funds, which are presented in the corresponding line-item in the Statement of Operations, if applicable.
Investment Valuation
The following is a summary of the inputs used, as of February 28, 2019, involving the Fund's assets and liabilities carried at fair value. The inputs or methodology used for valuing securities may not be an indication of the risk associated with investing in those securities. For more information on valuation inputs, and their aggregation into the levels used below, please refer to the Investment Valuation section in the accompanying Notes to Financial Statements.
| | Valuation Inputs at Reporting Date: |
| Description | Total | Level 1 | Level 2 | Level 3 |
| Investments in Securities: | | | | |
| Common Stocks | $2,769,744,804 | $2,716,749,565 | $52,995,239 | $-- |
| Money Market Funds | 26,735,569 | 26,735,569 | -- | -- |
| Total Investments in Securities: | $2,796,480,373 | $2,743,485,134 | $52,995,239 | $-- |
See accompanying notes which are an integral part of the financial statements.
Defense and Aerospace Portfolio
Financial Statements
Statement of Assets and Liabilities
| | | February 28, 2019 |
| Assets | | |
Investment in securities, at value — See accompanying schedule:
Unaffiliated issuers (cost $1,896,997,230) | $2,769,744,804 | |
| Fidelity Central Funds (cost $26,735,569) | 26,735,569 | |
| Total Investment in Securities (cost $1,923,732,799) | | $2,796,480,373 |
| Receivable for investments sold | | 2,173,083 |
| Receivable for fund shares sold | | 8,309,187 |
| Dividends receivable | | 6,421,405 |
| Distributions receivable from Fidelity Central Funds | | 60,777 |
| Prepaid expenses | | 25,617 |
| Other receivables | | 82,901 |
| Total assets | | 2,813,553,343 |
| Liabilities | | |
| Payable for investments purchased | $14,761,155 | |
| Payable for fund shares redeemed | 1,782,120 | |
| Accrued management fee | 1,197,356 | |
| Other affiliated payables | 420,107 | |
| Other payables and accrued expenses | 133,939 | |
| Total liabilities | | 18,294,677 |
| Net Assets | | $2,795,258,666 |
| Net Assets consist of: | | |
| Paid in capital | | $1,935,767,265 |
| Total distributable earnings (loss) | | 859,491,401 |
| Net Assets, for 161,868,427 shares outstanding | | $2,795,258,666 |
| Net Asset Value, offering price and redemption price per share ($2,795,258,666 ÷ 161,868,427 shares) | | $17.27 |
See accompanying notes which are an integral part of the financial statements.
Statement of Operations
| | | Year ended February 28, 2019 |
| Investment Income | | |
| Dividends | | $38,844,667 |
| Income from Fidelity Central Funds | | 456,429 |
| Total income | | 39,301,096 |
| Expenses | | |
| Management fee | $15,065,290 | |
| Transfer agent fees | 4,785,611 | |
| Accounting and security lending fees | 826,368 | |
| Custodian fees and expenses | 37,072 | |
| Independent trustees' fees and expenses | 15,748 | |
| Registration fees | 137,615 | |
| Audit | 41,791 | |
| Legal | 13,856 | |
| Interest | 8,970 | |
| Miscellaneous | 22,177 | |
| Total expenses before reductions | 20,954,498 | |
| Expense reductions | (83,431) | |
| Total expenses after reductions | | 20,871,067 |
| Net investment income (loss) | | 18,430,029 |
| Realized and Unrealized Gain (Loss) | | |
| Net realized gain (loss) on: | | |
| Investment securities: | | |
| Unaffiliated issuers | 166,568,041 | |
| Fidelity Central Funds | 1,570 | |
| Foreign currency transactions | (26,840) | |
| Total net realized gain (loss) | | 166,542,771 |
| Change in net unrealized appreciation (depreciation) on: | | |
| Investment securities: | | |
| Unaffiliated issuers | (133,966,920) | |
| Fidelity Central Funds | (279) | |
| Assets and liabilities in foreign currencies | (1,010) | |
| Total change in net unrealized appreciation (depreciation) | | (133,968,209) |
| Net gain (loss) | | 32,574,562 |
| Net increase (decrease) in net assets resulting from operations | | $51,004,591 |
See accompanying notes which are an integral part of the financial statements.
Statement of Changes in Net Assets
| | Year ended February 28, 2019 | Year ended February 28, 2018 |
| Increase (Decrease) in Net Assets | | |
| Operations | | |
| Net investment income (loss) | $18,430,029 | $12,340,019 |
| Net realized gain (loss) | 166,542,771 | 165,203,147 |
| Change in net unrealized appreciation (depreciation) | (133,968,209) | 566,827,986 |
| Net increase (decrease) in net assets resulting from operations | 51,004,591 | 744,371,152 |
| Distributions to shareholders | (258,550,952) | – |
| Distributions to shareholders from net investment income | – | (9,697,066) |
| Distributions to shareholders from net realized gain | – | (75,569,005) |
| Total distributions | (258,550,952) | (85,266,071) |
| Share transactions | | |
| Proceeds from sales of shares | 996,158,246 | 1,383,656,760 |
| Reinvestment of distributions | 244,578,007 | 81,021,871 |
| Cost of shares redeemed | (1,311,720,576) | (651,462,161) |
| Net increase (decrease) in net assets resulting from share transactions | (70,984,323) | 813,216,470 |
| Total increase (decrease) in net assets | (278,530,684) | 1,472,321,551 |
| Net Assets | | |
| Beginning of period | 3,073,789,350 | 1,601,467,799 |
| End of period | $2,795,258,666 | $3,073,789,350 |
| Other Information | | |
| Undistributed net investment income end of period | | $3,275,263 |
| Shares(a) | | |
| Sold | 57,403,273 | 86,581,500 |
| Issued in reinvestment of distributions | 15,780,023 | 5,021,580 |
| Redeemed | (77,908,049) | (40,778,400) |
| Net increase (decrease) | (4,724,753) | 50,824,680 |
(a) Share activity prior to August 10, 2018 has been adjusted to reflect the impact of the 10 for 1 share split that occurred on that date.
See accompanying notes which are an integral part of the financial statements.
Financial Highlights
Defense and Aerospace Portfolio
| | | | | | |
| Years ended February 28, | 2019 | 2018 | 2017 | 2016 A | 2015 |
| Selected Per–Share DataB | | | | | |
| Net asset value, beginning of period | $18.45 | $13.83 | $10.81 | $12.90 | $12.26 |
| Income from Investment Operations | | | | | |
| Net investment income (loss)C | .11 | .09D | .13E | .11 | .11F |
| Net realized and unrealized gain (loss) | .33 | 5.14 | 3.52 | (1.47) | 1.31 |
| Total from investment operations | .44 | 5.23 | 3.65 | (1.36) | 1.42 |
| Distributions from net investment income | (.10) | (.07) | (.12) | (.10) | (.10) |
| Distributions from net realized gain | (1.52) | (.54) | (.51) | (.63) | (.68) |
| Total distributions | (1.62) | (.61) | (.63) | (.73) | (.78) |
| Redemption fees added to paid in capitalC | – | – | –G | –G | –G |
| Net asset value, end of period | $17.27 | $18.45 | $13.83 | $10.81 | $12.90 |
| Total ReturnH | 3.57% | 38.46% | 34.36% | (11.08)% | 12.53% |
| Ratios to Average Net AssetsI,J | | | | | |
| Expenses before reductions | .75% | .76% | .79% | .80% | .79% |
| Expenses net of fee waivers, if any | .75% | .76% | .79% | .79% | .79% |
| Expenses net of all reductions | .75% | .76% | .79% | .79% | .79% |
| Net investment income (loss) | .66% | .58%D | 1.03%E | .92% | .90%F |
| Supplemental Data | | | | | |
| Net assets, end of period (000 omitted) | $2,795,259 | $3,073,789 | $1,601,468 | $885,398 | $948,156 |
| Portfolio turnover rateK | 44% | 32% | 24% | 52% | 20% |
A For the year ended February 29.
B Per share amounts have been adjusted to reflect the impact of the 10 for 1 share split that occurred on August 10, 2018.
C Calculated based on average shares outstanding during the period.
D Net investment income per share reflects a large, non-recurring dividend which amounted to $.07 per share. Excluding this non-recurring dividend, the ratio of net investment income (loss) to average net assets would have been .14%.
E Net investment income per share reflects a large, non-recurring dividend which amounted to $.05 per share. Excluding this non-recurring dividend, the ratio of net investment income (loss) to average net assets would have been .64%.
F Net investment income per share reflects a large, non-recurring dividend which amounted to $.07 per share. Excluding this non-recurring dividend, the ratio of net investment income (loss) to average net assets would have been .34%.
G Amount represents less than $.005 per share.
H Total returns would have been lower if certain expenses had not been reduced during the applicable periods shown.
I Fees and expenses of any underlying Fidelity Central Funds are not included in the Fund's expense ratio. The Fund indirectly bears its proportionate share of the expenses of any underlying Fidelity Central Funds.
J Expense ratios reflect operating expenses of the Fund. Expenses before reductions do not reflect amounts reimbursed by the investment adviser or reductions from brokerage service arrangements or reductions from other expense offset arrangements and do not represent the amount paid by the Fund during periods when reimbursements or reductions occur. Expenses net of fee waivers reflect expenses after reimbursement by the investment adviser but prior to reductions from brokerage service arrangements or other expense offset arrangements. Expenses net of all reductions represent the net expenses paid by the Fund.
K Amount does not include the portfolio activity of any underlying Fidelity Central Funds.
See accompanying notes which are an integral part of the financial statements.
Environment and Alternative Energy Portfolio
Performance: The Bottom Line
Average annual total return reflects the change in the value of an investment, assuming reinvestment of distributions from dividend income and capital gains (the profits earned upon the sale of securities that have grown in value, if any) and assuming a constant rate of performance each year. The hypothetical investment and the average annual total returns do not reflect the deduction of taxes that a shareholder would pay on fund distributions or the redemption of fund shares. During periods of reimbursement by Fidelity, a fund’s total return will be greater than it would be had the reimbursement not occurred. How a fund did yesterday is no guarantee of how it will do tomorrow.
Average Annual Total Returns
| For the periods ended February 28, 2019 | Past 1 year | Past 5 years | Past 10 years |
| Environment and Alternative Energy Portfolio | 0.39% | 7.50% | 12.32% |
Prior to July 1, 2010, the fund was named Environmental Portfolio, and the fund operated under certain different investment policies and compared its performance to a different additional index. The fund's historical performance may not represent its current investment policies.
$10,000 Over 10 Years
Let's say hypothetically that $10,000 was invested in Environment and Alternative Energy Portfolio on February 28, 2009.
The chart shows how the value of your investment would have changed, and also shows how the S&P 500® Index performed over the same period.
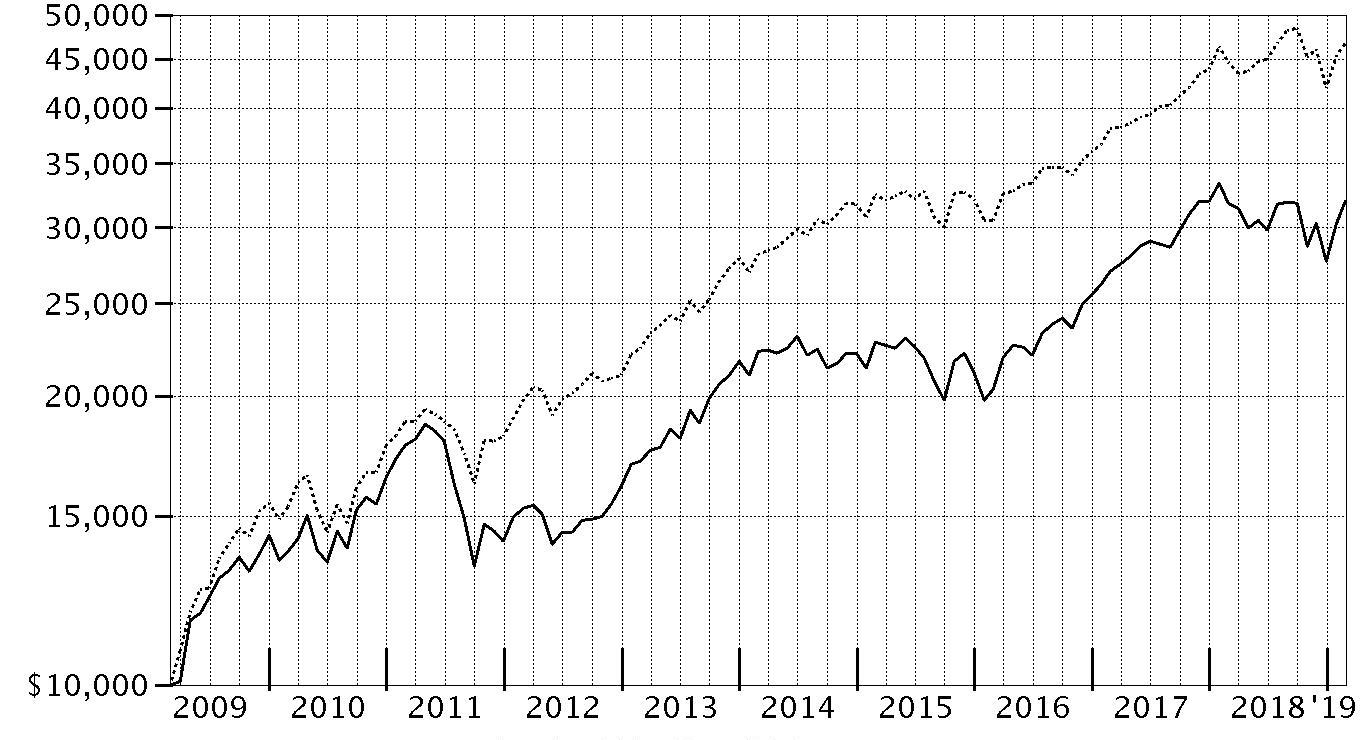
| Period Ending Values |
| $31,970 | Environment and Alternative Energy Portfolio |
| $46,739 | S&P 500® Index |
Environment and Alternative Energy Portfolio
Management's Discussion of Fund Performance
Market Recap: The S&P 500
® index gained 4.68% for the 12 months ending February 28, 2019, as the U.S. equity bellwether began the new year on a high note after enduring a final quarter of 2018 in which resurgent volatility upset the aging bull market. In October, rising U.S. Treasury yields and concern about peaking corporate earnings growth sent many investors fleeing from risk assets as they were still dealing with lingering uncertainty related to global trade and the U.S. Federal Reserve picking up the pace of interest rate hikes. The index returned -6.84% in October, at the time its largest monthly drop in seven years. But conditions worsened through Christmas, as jitters about the economy and another hike in rates led to a spike in market volatility and a -9.03% result for December. Sharply reversing course to begin 2019, the S&P 500
® gained 11.48% year-to-date, its strongest two-month opening since 1991, amid upbeat company earnings/outlooks and signs the Fed may pause on rates. For the full period, some economically sensitive sectors fared worst, with financials (-6%) and materials (-6%) both losing ground. Energy gained 1%, while communication services and industrials each rose roughly 2%. In contrast, the defensive utilities (+20%), real estate (+20%) and health care (+11%) sectors led the way, while consumer staples finished near the index. Information technology and consumer discretionary were rattled in the late-2018 downturn, but earlier strength contributed to advances of 9% and roughly 7%, respectively.
Comments from Portfolio Manager Kevin Walenta: For the fiscal year, the fund returned 0.39%, lagging both the 3.94% advance of the FTSE
® Environmental Opportunities & Alternative Energy Index and the broadly based S&P 500
®. The fund’s value bias hurt its result over the past 12 months, as investors favored stocks with strong earnings growth momentum – without much regard for price. Versus the FTSE industry index, security selection was the main impediment, particularly in the renewable & alternative energy group. Overweightings in shares of modular carpet and tile company Interface (-36%) and automotive parts supplier Tenneco (-27%) hurt notably versus the industry index as investors worried about the impact slowing economic growth would have on their respective businesses. Interface was not in the portfolio at period end. Not owning specialty chemicals provider Ecolab (+31%) also detracted. Conversely, owning firms focused on energy efficiency added value, led by overweightings in heating, ventilation and air conditioning company Comfort Systems USA (+32%) and specialty chemicals provider Innospec (+28%). Both of these positions remained top fund holdings at period end.
The views expressed above reflect those of the portfolio manager(s) only through the end of the period as stated on the cover of this report and do not necessarily represent the views of Fidelity or any other person in the Fidelity organization. Any such views are subject to change at any time based upon market or other conditions and Fidelity disclaims any responsibility to update such views. These views may not be relied on as investment advice and, because investment decisions for a Fidelity fund are based on numerous factors, may not be relied on as an indication of trading intent on behalf of any Fidelity fund.
Environment and Alternative Energy Portfolio
Investment Summary (Unaudited)
Top Ten Stocks as of February 28, 2019
| | % of fund's net assets |
| 3M Co. | 9.5 |
| Honeywell International, Inc. | 8.9 |
| Danaher Corp. | 6.9 |
| Eaton Corp. PLC | 4.3 |
| Ingersoll-Rand PLC | 4.2 |
| TE Connectivity Ltd. | 3.8 |
| Cummins, Inc. | 3.5 |
| Parker Hannifin Corp. | 3.2 |
| Innospec, Inc. | 3.0 |
| Comfort Systems U.S.A., Inc. | 2.7 |
| | 50.0 |
Top Industries (% of fund's net assets)
| As of February 28, 2019 |
| | Energy Efficiency | 29.7% |
| | Renewable & Alternative Energy | 23.2% |
| | Environmental Support Services | 20.2% |
| | Water Infrastructure & Technologies | 10.0% |
| | Other | 7.8% |
| | All Others* | 9.1% |

* Includes short-term investments and net other assets (liabilities).
Environment and Alternative Energy Portfolio
Schedule of Investments February 28, 2019
Showing Percentage of Net Assets
| Common Stocks - 96.0% | | | |
| | | Shares | Value |
| Energy Efficiency - 29.7% | | | |
| Buildings Energy Efficiency - 11.4% | | | |
| A.O. Smith Corp. | | 63,140 | $3,278,860 |
| Acuity Brands, Inc. | | 20,680 | 2,690,882 |
| Apogee Enterprises, Inc. | | 35,390 | 1,263,069 |
| Comfort Systems U.S.A., Inc. | | 80,770 | 4,330,887 |
| Ingersoll-Rand PLC | | 63,960 | 6,751,618 |
| | | | 18,315,316 |
| Industrial Energy Efficiency - 8.6% | | | |
| EMCOR Group, Inc. | | 52,928 | 3,817,697 |
| Minerals Technologies, Inc. | | 7,730 | 457,616 |
| ON Semiconductor Corp. (a) | | 157,440 | 3,381,811 |
| Regal Beloit Corp. | | 45,704 | 3,828,167 |
| Rockwell Automation, Inc. | | 13,630 | 2,433,773 |
| | | | 13,919,064 |
| Power Network Efficiency - 4.3% | | | |
| Eaton Corp. PLC | | 86,990 | 6,939,192 |
| Transport Energy Efficiency - 5.4% | | | |
| BorgWarner, Inc. | | 96,100 | 3,902,621 |
| Innospec, Inc. | | 58,607 | 4,797,569 |
| | | | 8,700,190 |
|
| TOTAL ENERGY EFFICIENCY | | | 47,873,762 |
|
| Environmental Support Services - 20.2% | | | |
| Diversified Environmental - 18.8% | | | |
| 3M Co. | | 73,872 | 15,320,314 |
| Dover Corp. | | 30,110 | 2,725,858 |
| Linde PLC | | 23,680 | 4,102,323 |
| MKS Instruments, Inc. | | 35,400 | 2,933,598 |
| Parker Hannifin Corp. | | 29,140 | 5,133,302 |
| | | | 30,215,395 |
| Environmental Consultancies - 1.4% | | | |
| AECOM (a) | | 37,430 | 1,158,833 |
| Tetra Tech, Inc. | | 19,040 | 1,142,781 |
| | | | 2,301,614 |
|
| TOTAL ENVIRONMENTAL SUPPORT SERVICES | | | 32,517,009 |
|
| Food Agriculture & Forestry - 0.7% | | | |
| Logistics, Food Safety and Packaging - 0.7% | | | |
| Bemis Co., Inc. | | 21,160 | 1,119,364 |
| Miscellaneous Environmental - 3.8% | | | |
| Other Environmental - 3.8% | | | |
| Accenture PLC Class A | | 4,970 | 802,059 |
| Boise Cascade Co. | | 2,710 | 75,582 |
| C.H. Robinson Worldwide, Inc. | | 8,840 | 798,959 |
| Henry Schein, Inc. (a) | | 6,620 | 392,566 |
| Oracle Corp. | | 15,230 | 793,940 |
| Philips Lighting NV (b) | | 91,160 | 2,421,160 |
| Quest Diagnostics, Inc. | | 9,240 | 799,722 |
| | | | 6,083,988 |
| Pollution Control - 4.7% | | | |
| Pollution Control Solutions - 4.7% | | | |
| Cummins, Inc. | | 36,422 | 5,612,266 |
| Tenneco, Inc. | | 55,880 | 1,933,448 |
| | | | 7,545,714 |
| Renewable & Alternative Energy - 23.2% | | | |
| Biofuels - 2.0% | | | |
| China Agri-Industries Holdings Ltd. | | 599,880 | 213,213 |
| Cosan SA Industria e Comercio | | 159,030 | 1,850,195 |
| Sao Martinho SA | | 245,960 | 1,229,751 |
| | | | 3,293,159 |
| Renewable Energy Developers and Independent Power Producers - 19.3% | | | |
| Colbun SA (a) | | 10,296,660 | 2,378,598 |
| Empresa Nacional de Electricidad SA sponsored ADR (c) | | 105,410 | 2,134,553 |
| Hollysys Automation Technologies Ltd. | | 75,161 | 1,663,313 |
| Honeywell International, Inc. | | 93,047 | 14,335,751 |
| Lennox International, Inc. | | 14,711 | 3,607,873 |
| Mercury Nz Ltd. | | 141,470 | 355,499 |
| SPX Flow, Inc. (a) | | 12,670 | 437,368 |
| TE Connectivity Ltd. | | 74,480 | 6,114,063 |
| | | | 31,027,018 |
| Solar Energy Generation Equipment - 1.9% | | | |
| Advanced Energy Industries, Inc. (a) | | 53,430 | 2,691,269 |
| Oci Co. Ltd. | | 3,820 | 366,557 |
| | | | 3,057,826 |
|
| TOTAL RENEWABLE & ALTERNATIVE ENERGY | | | 37,378,003 |
|
| Waste Management & Technologies - 3.7% | | | |
| Recycling and Value Added Waste Processing - 1.9% | | | |
| Steel Dynamics, Inc. | | 80,450 | 3,002,394 |
| Waste Technology Equipment - 1.8% | | | |
| Schnitzer Steel Industries, Inc. Class A | | 120,450 | 2,926,935 |
|
| TOTAL WASTE MANAGEMENT & TECHNOLOGIES | | | 5,929,329 |
|
| Water Infrastructure & Technologies - 10.0% | | | |
| Diversified Water Infrastructure and Technology - 6.9% | | | |
| Danaher Corp. | | 86,920 | 11,040,578 |
| Water Infrastructure - 3.1% | | | |
| Crane Co. | | 40,047 | 3,386,775 |
| HD Supply Holdings, Inc. (a) | | 38,910 | 1,673,519 |
| | | | 5,060,294 |
|
| TOTAL WATER INFRASTRUCTURE & TECHNOLOGIES | | | 16,100,872 |
|
| TOTAL COMMON STOCKS | | | |
| (Cost $130,646,740) | | | 154,548,041 |
|
| Money Market Funds - 4.6% | | | |
| Fidelity Cash Central Fund, 2.44% (d) | | 7,336,144 | 7,337,611 |
| Fidelity Securities Lending Cash Central Fund 2.45% (d)(e) | | 2,050 | 2,050 |
| TOTAL MONEY MARKET FUNDS | | | |
| (Cost $7,339,661) | | | 7,339,661 |
| TOTAL INVESTMENT IN SECURITIES - 100.6% | | | |
| (Cost $137,986,401) | | | 161,887,702 |
| NET OTHER ASSETS (LIABILITIES) - (0.6)% | | | (927,478) |
| NET ASSETS - 100% | | | $160,960,224 |
Legend
(a) Non-income producing
(b) Security exempt from registration under Rule 144A of the Securities Act of 1933. These securities may be resold in transactions exempt from registration, normally to qualified institutional buyers. At the end of the period, the value of these securities amounted to $2,421,160 or 1.5% of net assets.
(c) Security or a portion of the security is on loan at period end.
(d) Affiliated fund that is generally available only to investment companies and other accounts managed by Fidelity Investments. The rate quoted is the annualized seven-day yield of the fund at period end. A complete unaudited listing of the fund's holdings as of its most recent quarter end is available upon request. In addition, each Fidelity Central Fund's financial statements, which are not covered by the Fund's Report of Independent Registered Public Accounting Firm, are available on the SEC's website or upon request.
(e) Investment made with cash collateral received from securities on loan.
Affiliated Central Funds
Information regarding fiscal year to date income earned by the Fund from investments in Fidelity Central Funds is as follows:
| Fund | Income earned |
| Fidelity Cash Central Fund | $57,134 |
| Fidelity Securities Lending Cash Central Fund | 6,223 |
| Total | $63,357 |
Amounts in the income column in the above table include any capital gain distributions from underlying funds, which are presented in the corresponding line-item in the Statement of Operations, if applicable.
Investment Valuation
All investments are categorized as Level 1 under the Fair Value Hierarchy. The inputs or methodology used for valuing securities may not be an indication of the risk associated with investing in those securities. For more information on valuation inputs please refer to the Investment Valuation section in the accompanying Notes to Financial Statements.
Other Information
Distribution of investments by country or territory of incorporation, as a percentage of Total Net Assets, is as follows (Unaudited):
| United States of America | 78.2% |
| Ireland | 11.6% |
| Switzerland | 3.8% |
| Brazil | 1.9% |
| Netherlands | 1.5% |
| Chile | 1.5% |
| British Virgin Islands | 1.0% |
| Others (Individually Less Than 1%) | 0.5% |
| | 100.0% |
See accompanying notes which are an integral part of the financial statements.
Environment and Alternative Energy Portfolio
Financial Statements
Statement of Assets and Liabilities
| | | February 28, 2019 |
| Assets | | |
Investment in securities, at value (including securities loaned of $1,999) — See accompanying schedule:
Unaffiliated issuers (cost $130,646,740) | $154,548,041 | |
| Fidelity Central Funds (cost $7,339,661) | 7,339,661 | |
| Total Investment in Securities (cost $137,986,401) | | $161,887,702 |
| Receivable for fund shares sold | | 557,503 |
| Dividends receivable | | 457,604 |
| Distributions receivable from Fidelity Central Funds | | 8,618 |
| Prepaid expenses | | 1,554 |
| Total assets | | 162,912,981 |
| Liabilities | | |
| Payable for investments purchased | $1,688,998 | |
| Payable for fund shares redeemed | 125,095 | |
| Accrued management fee | 69,601 | |
| Other affiliated payables | 32,974 | |
| Other payables and accrued expenses | 34,039 | |
| Collateral on securities loaned | 2,050 | |
| Total liabilities | | 1,952,757 |
| Net Assets | | $160,960,224 |
| Net Assets consist of: | | |
| Paid in capital | | $134,283,189 |
| Total distributable earnings (loss) | | 26,677,035 |
| Net Assets, for 6,458,155 shares outstanding | | $160,960,224 |
| Net Asset Value, offering price and redemption price per share ($160,960,224 ÷ 6,458,155 shares) | | $24.92 |
See accompanying notes which are an integral part of the financial statements.
Statement of Operations
| | | Year ended February 28, 2019 |
| Investment Income | | |
| Dividends | | $2,728,657 |
| Income from Fidelity Central Funds | | 63,357 |
| Total income | | 2,792,014 |
| Expenses | | |
| Management fee | $825,056 | |
| Transfer agent fees | 350,784 | |
| Accounting and security lending fees | 59,514 | |
| Custodian fees and expenses | 9,060 | |
| Independent trustees' fees and expenses | 871 | |
| Registration fees | 27,132 | |
| Audit | 54,252 | |
| Legal | 1,305 | |
| Interest | 1,058 | |
| Miscellaneous | 7,406 | |
| Total expenses before reductions | 1,336,438 | |
| Expense reductions | (11,203) | |
| Total expenses after reductions | | 1,325,235 |
| Net investment income (loss) | | 1,466,779 |
| Realized and Unrealized Gain (Loss) | | |
| Net realized gain (loss) on: | | |
| Investment securities: | | |
| Unaffiliated issuers | 7,672,018 | |
| Fidelity Central Funds | 44 | |
| Foreign currency transactions | (25,223) | |
| Total net realized gain (loss) | | 7,646,839 |
| Change in net unrealized appreciation (depreciation) on: | | |
| Investment securities: | | |
| Unaffiliated issuers | (8,824,206) | |
| Assets and liabilities in foreign currencies | (3,957) | |
| Total change in net unrealized appreciation (depreciation) | | (8,828,163) |
| Net gain (loss) | | (1,181,324) |
| Net increase (decrease) in net assets resulting from operations | | $285,455 |
See accompanying notes which are an integral part of the financial statements.
Statement of Changes in Net Assets
| | Year ended February 28, 2019 | Year ended February 28, 2018 |
| Increase (Decrease) in Net Assets | | |
| Operations | | |
| Net investment income (loss) | $1,466,779 | $1,837,955 |
| Net realized gain (loss) | 7,646,839 | 10,608,491 |
| Change in net unrealized appreciation (depreciation) | (8,828,163) | 14,663,771 |
| Net increase (decrease) in net assets resulting from operations | 285,455 | 27,110,217 |
| Distributions to shareholders | (8,454,008) | – |
| Distributions to shareholders from net investment income | – | (1,447,374) |
| Distributions to shareholders from net realized gain | – | (9,452,414) |
| Total distributions | (8,454,008) | (10,899,788) |
| Share transactions | | |
| Proceeds from sales of shares | 40,206,295 | 111,369,434 |
| Reinvestment of distributions | 7,969,907 | 10,265,405 |
| Cost of shares redeemed | (67,430,135) | (87,147,383) |
| Net increase (decrease) in net assets resulting from share transactions | (19,253,933) | 34,487,456 |
| Redemption fees | – | 11,308 |
| Total increase (decrease) in net assets | (27,422,486) | 50,709,193 |
| Net Assets | | |
| Beginning of period | 188,382,710 | 137,673,517 |
| End of period | $160,960,224 | $188,382,710 |
| Other Information | | |
| Undistributed net investment income end of period | | $428,840 |
| Shares | | |
| Sold | 1,651,291 | 4,413,503 |
| Issued in reinvestment of distributions | 340,861 | 413,420 |
| Redeemed | (2,693,678) | (3,430,336) |
| Net increase (decrease) | (701,526) | 1,396,587 |
See accompanying notes which are an integral part of the financial statements.
Financial Highlights
Environment and Alternative Energy Portfolio
| | | | | | |
| Years ended February 28, | 2019 | 2018 | 2017 | 2016 A | 2015 |
| Selected Per–Share Data | | | | | |
| Net asset value, beginning of period | $26.31 | $23.89 | $18.20 | $20.94 | $23.36 |
| Income from Investment Operations | | | | | |
| Net investment income (loss)B | .24 | .27 | .20 | .17 | .16 |
| Net realized and unrealized gain (loss) | (.25) | 3.83 | 5.78 | (2.34) | .31 |
| Total from investment operations | (.01) | 4.10 | 5.98 | (2.17) | .47 |
| Distributions from net investment income | (.22) | (.22) | (.16) | (.13) | (.14) |
| Distributions from net realized gain | (1.16) | (1.46) | (.13) | (.44) | (2.75) |
| Total distributions | (1.38) | (1.68) | (.29) | (.57) | (2.89) |
| Redemption fees added to paid in capitalB | – | –C | –C | –C | –C |
| Net asset value, end of period | $24.92 | $26.31 | $23.89 | $18.20 | $20.94 |
| Total ReturnD | .39% | 17.73% | 33.02% | (10.63)% | 2.19% |
| Ratios to Average Net AssetsE,F | | | | | |
| Expenses before reductions | .87% | .87% | .94% | .95% | .92% |
| Expenses net of fee waivers, if any | .87% | .87% | .94% | .95% | .92% |
| Expenses net of all reductions | .87% | .86% | .94% | .95% | .92% |
| Net investment income (loss) | .96% | 1.07% | .94% | .86% | .71% |
| Supplemental Data | | | | | |
| Net assets, end of period (000 omitted) | $160,960 | $188,383 | $137,674 | $73,432 | $88,573 |
| Portfolio turnover rateG | 62% | 47% | 82% | 20% | 160% |
A For the year ended February 29.
B Calculated based on average shares outstanding during the period.
C Amount represents less than $.005 per share.
D Total returns would have been lower if certain expenses had not been reduced during the applicable periods shown.
E Fees and expenses of any underlying Fidelity Central Funds are not included in the Fund's expense ratio. The Fund indirectly bears its proportionate share of the expenses of any underlying Fidelity Central Funds.
F Expense ratios reflect operating expenses of the Fund. Expenses before reductions do not reflect amounts reimbursed by the investment adviser or reductions from brokerage service arrangements or reductions from other expense offset arrangements and do not represent the amount paid by the Fund during periods when reimbursements or reductions occur. Expenses net of fee waivers reflect expenses after reimbursement by the investment adviser but prior to reductions from brokerage service arrangements or other expense offset arrangements. Expenses net of all reductions represent the net expenses paid by the Fund.
G Amount does not include the portfolio activity of any underlying Fidelity Central Funds.
See accompanying notes which are an integral part of the financial statements.
Industrials Portfolio
Performance: The Bottom Line
Average annual total return reflects the change in the value of an investment, assuming reinvestment of distributions from dividend income and capital gains (the profits earned upon the sale of securities that have grown in value, if any) and assuming a constant rate of performance each year. The hypothetical investment and the average annual total returns do not reflect the deduction of taxes that a shareholder would pay on fund distributions or the redemption of fund shares. During periods of reimbursement by Fidelity, a fund’s total return will be greater than it would be had the reimbursement not occurred. How a fund did yesterday is no guarantee of how it will do tomorrow.
Average Annual Total Returns
| For the periods ended February 28, 2019 | Past 1 year | Past 5 years | Past 10 years |
| Industrials Portfolio | (0.45)% | 7.54% | 18.40% |
$10,000 Over 10 Years
Let's say hypothetically that $10,000 was invested in Industrials Portfolio on February 28, 2009.
The chart shows how the value of your investment would have changed, and also shows how the S&P 500® Index performed over the same period.
| Period Ending Values |
| $54,147 | Industrials Portfolio |
| $46,739 | S&P 500® Index |
Industrials Portfolio
Management's Discussion of Fund Performance
Market Recap: The S&P 500
® index gained 4.68% for the 12 months ending February 28, 2019, as the U.S. equity bellwether began the new year on a high note after enduring a final quarter of 2018 in which resurgent volatility upset the aging bull market. In October, rising U.S. Treasury yields and concern about peaking corporate earnings growth sent many investors fleeing from risk assets as they were still dealing with lingering uncertainty related to global trade and the U.S. Federal Reserve picking up the pace of interest rate hikes. The index returned -6.84% in October, at the time its largest monthly drop in seven years. But conditions worsened through Christmas, as jitters about the economy and another hike in rates led to a spike in market volatility and a -9.03% result for December. Sharply reversing course to begin 2019, the S&P 500
® gained 11.48% year-to-date, its strongest two-month opening since 1991, amid upbeat company earnings/outlooks and signs the Fed may pause on rates. For the full period, some economically sensitive sectors fared worst, with financials (-6%) and materials (-6%) both losing ground. Energy gained 1%, while communication services and industrials each rose roughly 2%. In contrast, the defensive utilities (+20%), real estate (+20%) and health care (+11%) sectors led the way, while consumer staples finished near the index. Information technology and consumer discretionary were rattled in the late-2018 downturn, but earlier strength contributed to advances of 9% and roughly 7%, respectively.
Comments from Portfolio Manager Janet Glazer: For the fiscal year, the fund returned -0.45%, trailing the 1.75% gain of the MSCI U.S. IMI Industrials 25/50 Linked Index, and also falling short of the broad-based S&P 500
®. Versus the MSCI industrials index, positioning in aerospace & defense detracted most the past 12 months, with railroads and industrial conglomerates also weighing on our relative result. Untimely positioning in General Electric was the fund’s biggest individual detractor. The stock of the industrial conglomerate – which has been attempting a turnaround – trended lower for the first 10 months of the period before trimming some of its loss in the new year. Untimely ownership of rail-freight hauler CSX also worked against the fund, as did an overweighting in major defense contractor Northrop Grumman, a position I considerably reduced during the period. Conversely, picks among construction machinery & heavy trucks, along with industrial machinery stocks, meaningfully contributed to relative performance. A sizable overweighting in Ingersoll Rand, a leader in creating comfortable, sustainable and efficient environments, made this stock the fund’s top relative contributor. The stock was aided partly by an optimistic October earnings call. Another overweighted position that contributed was Allison Transmission Holdings, a maker of transmissions for medium- and heavy-duty commercial and defense vehicles.
The views expressed above reflect those of the portfolio manager(s) only through the end of the period as stated on the cover of this report and do not necessarily represent the views of Fidelity or any other person in the Fidelity organization. Any such views are subject to change at any time based upon market or other conditions and Fidelity disclaims any responsibility to update such views. These views may not be relied on as investment advice and, because investment decisions for a Fidelity fund are based on numerous factors, may not be relied on as an indication of trading intent on behalf of any Fidelity fund.
Note to shareholders: On December 1, 2018, Janet Glazer assumed co-management responsibilities for the fund, joining Lead Manager Tobias Welo. On December 31, 2018, Tobias retired from Fidelity, leaving Janet sole Portfolio Manager.
Industrials Portfolio
Investment Summary (Unaudited)
Top Ten Stocks as of February 28, 2019
| | % of fund's net assets |
| The Boeing Co. | 10.5 |
| Union Pacific Corp. | 6.0 |
| AMETEK, Inc. | 5.1 |
| IDEX Corp. | 4.6 |
| Ingersoll-Rand PLC | 4.5 |
| Norfolk Southern Corp. | 3.8 |
| HD Supply Holdings, Inc. | 3.7 |
| General Electric Co. | 3.6 |
| CSX Corp. | 3.4 |
| Emerson Electric Co. | 3.2 |
| | 48.4 |
Top Industries (% of fund's net assets)
| As of February 28, 2019 |
| | Aerospace & Defense | 24.2% |
| | Machinery | 17.7% |
| | Road & Rail | 14.8% |
| | Industrial Conglomerates | 12.8% |
| | Electrical Equipment | 11.4% |
| | All Others* | 19.1% |

* Includes short-term investments and net other assets (liabilities).
Industrials Portfolio
Schedule of Investments February 28, 2019
Showing Percentage of Net Assets
| Common Stocks - 99.1% | | | |
| | | Shares | Value |
| Aerospace & Defense - 24.2% | | | |
| Aerospace & Defense - 24.2% | | | |
| General Dynamics Corp. | | 76,297 | $12,987,275 |
| HEICO Corp. Class A | | 147,600 | 11,806,524 |
| Huntington Ingalls Industries, Inc. | | 25,500 | 5,339,955 |
| Northrop Grumman Corp. | | 41,200 | 11,946,352 |
| Raytheon Co. | | 43,000 | 8,019,500 |
| Teledyne Technologies, Inc. (a) | | 31,040 | 7,326,682 |
| Textron, Inc. | | 18,100 | 982,830 |
| The Boeing Co. | | 151,100 | 66,477,957 |
| TransDigm Group, Inc. (a) | | 38,400 | 16,669,056 |
| United Technologies Corp. | | 94,617 | 11,890,518 |
| | | | 153,446,649 |
| Air Freight & Logistics - 1.9% | | | |
| Air Freight & Logistics - 1.9% | | | |
| United Parcel Service, Inc. Class B | | 111,700 | 12,309,340 |
| Airlines - 3.7% | | | |
| Airlines - 3.7% | | | |
| Delta Air Lines, Inc. | | 137,000 | 6,792,460 |
| Southwest Airlines Co. | | 177,800 | 9,963,912 |
| Spirit Airlines, Inc. (a) | | 114,700 | 6,451,875 |
| | | | 23,208,247 |
| Building Products - 2.6% | | | |
| Building Products - 2.6% | | | |
| Allegion PLC | | 87,400 | 7,862,504 |
| Jeld-Wen Holding, Inc. (a) | | 35,853 | 724,589 |
| Lennox International, Inc. | | 31,500 | 7,725,375 |
| | | | 16,312,468 |
| Commercial Services & Supplies - 3.2% | | | |
| Diversified Support Services - 1.1% | | | |
| Cintas Corp. | | 33,057 | 6,829,576 |
| Environmental & Facility Services - 2.1% | | | |
| Waste Connection, Inc. (United States) | | 161,400 | 13,460,760 |
|
| TOTAL COMMERCIAL SERVICES & SUPPLIES | | | 20,290,336 |
|
| Construction & Engineering - 1.9% | | | |
| Construction & Engineering - 1.9% | | | |
| Fluor Corp. | | 49,600 | 1,864,960 |
| Jacobs Engineering Group, Inc. | | 97,585 | 7,199,821 |
| KBR, Inc. | | 148,600 | 2,936,336 |
| | | | 12,001,117 |
| Electrical Equipment - 11.4% | | | |
| Electrical Components & Equipment - 11.4% | | | |
| AMETEK, Inc. | | 404,354 | 32,178,491 |
| Emerson Electric Co. | | 297,800 | 20,295,070 |
| Fortive Corp. | | 238,210 | 19,430,790 |
| | | | 71,904,351 |
| Industrial Conglomerates - 12.8% | | | |
| Industrial Conglomerates - 12.8% | | | |
| 3M Co. | | 25,200 | 5,226,228 |
| General Electric Co. | | 2,209,739 | 22,959,188 |
| Honeywell International, Inc. | | 129,859 | 20,007,376 |
| ITT, Inc. | | 256,771 | 14,831,093 |
| Roper Technologies, Inc. | | 54,700 | 17,703,655 |
| | | | 80,727,540 |
| Machinery - 17.7% | | | |
| Agricultural & Farm Machinery - 2.7% | | | |
| Deere & Co. | | 103,700 | 17,010,948 |
| Construction Machinery & Heavy Trucks - 3.1% | | | |
| Allison Transmission Holdings, Inc. | | 60,300 | 2,996,910 |
| Caterpillar, Inc. | | 99,200 | 13,624,128 |
| WABCO Holdings, Inc. (a) | | 13,700 | 1,884,161 |
| Wabtec Corp. | | 11,868 | 869,450 |
| | | | 19,374,649 |
| Industrial Machinery - 11.9% | | | |
| Flowserve Corp. | | 195,900 | 8,699,919 |
| Gardner Denver Holdings, Inc. (a) | | 303,400 | 8,146,290 |
| IDEX Corp. | | 200,763 | 28,929,948 |
| Ingersoll-Rand PLC | | 271,000 | 28,606,760 |
| Xylem, Inc. | | 12,500 | 944,375 |
| | | | 75,327,292 |
|
| TOTAL MACHINERY | | | 111,712,889 |
|
| Professional Services - 1.2% | | | |
| Research & Consulting Services - 1.2% | | | |
| IHS Markit Ltd. (a) | | 41,308 | 2,196,346 |
| Nielsen Holdings PLC | | 202,000 | 5,292,400 |
| | | | 7,488,746 |
| Road & Rail - 14.8% | | | |
| Railroads - 13.2% | | | |
| CSX Corp. | | 294,700 | 21,415,849 |
| Norfolk Southern Corp. | | 137,000 | 24,564,100 |
| Union Pacific Corp. | | 226,400 | 37,967,280 |
| | | | 83,947,229 |
| Trucking - 1.6% | | | |
| J.B. Hunt Transport Services, Inc. | | 52,700 | 5,674,209 |
| Knight-Swift Transportation Holdings, Inc. Class A | | 128,700 | 4,328,181 |
| | | | 10,002,390 |
|
| TOTAL ROAD & RAIL | | | 93,949,619 |
|
| Trading Companies & Distributors - 3.7% | | | |
| Trading Companies & Distributors - 3.7% | | | |
| HD Supply Holdings, Inc. (a) | | 542,500 | 23,332,925 |
| TOTAL COMMON STOCKS | | | |
| (Cost $505,111,651) | | | 626,684,227 |
|
| Money Market Funds - 0.9% | | | |
| Fidelity Cash Central Fund, 2.44% (b) | | | |
| (Cost $5,949,626) | | 5,948,436 | 5,949,626 |
| TOTAL INVESTMENT IN SECURITIES - 100.0% | | | |
| (Cost $511,061,277) | | | 632,633,853 |
| NET OTHER ASSETS (LIABILITIES) - 0.0% | | | (164,064) |
| NET ASSETS - 100% | | | $632,469,789 |
Legend
(a) Non-income producing
(b) Affiliated fund that is generally available only to investment companies and other accounts managed by Fidelity Investments. The rate quoted is the annualized seven-day yield of the fund at period end. A complete unaudited listing of the fund's holdings as of its most recent quarter end is available upon request. In addition, each Fidelity Central Fund's financial statements, which are not covered by the Fund's Report of Independent Registered Public Accounting Firm, are available on the SEC's website or upon request.
Affiliated Central Funds
Information regarding fiscal year to date income earned by the Fund from investments in Fidelity Central Funds is as follows:
| Fund | Income earned |
| Fidelity Cash Central Fund | $80,488 |
| Fidelity Securities Lending Cash Central Fund | 63,435 |
| Total | $143,923 |
Amounts in the income column in the above table include any capital gain distributions from underlying funds, which are presented in the corresponding line-item in the Statement of Operations, if applicable.
Investment Valuation
All investments are categorized as Level 1 under the Fair Value Hierarchy. The inputs or methodology used for valuing securities may not be an indication of the risk associated with investing in those securities. For more information on valuation inputs please refer to the Investment Valuation section in the accompanying Notes to Financial Statements.
See accompanying notes which are an integral part of the financial statements.
Industrials Portfolio
Financial Statements
Statement of Assets and Liabilities
| | | February 28, 2019 |
| Assets | | |
Investment in securities, at value — See accompanying schedule:
Unaffiliated issuers (cost $505,111,651) | $626,684,227 | |
| Fidelity Central Funds (cost $5,949,626) | 5,949,626 | |
| Total Investment in Securities (cost $511,061,277) | | $632,633,853 |
| Receivable for investments sold | | 1,003,822 |
| Receivable for fund shares sold | | 517,943 |
| Dividends receivable | | 1,348,991 |
| Distributions receivable from Fidelity Central Funds | | 9,339 |
| Prepaid expenses | | 8,725 |
| Other receivables | | 74,865 |
| Total assets | | 635,597,538 |
| Liabilities | | |
| Payable for investments purchased | $1,900,313 | |
| Payable for fund shares redeemed | 728,148 | |
| Accrued management fee | 278,412 | |
| Other affiliated payables | 104,723 | |
| Other payables and accrued expenses | 116,153 | |
| Total liabilities | | 3,127,749 |
| Net Assets | | $632,469,789 |
| Net Assets consist of: | | |
| Paid in capital | | $517,579,531 |
| Total distributable earnings (loss) | | 114,890,258 |
| Net Assets, for 18,688,115 shares outstanding | | $632,469,789 |
| Net Asset Value, offering price and redemption price per share ($632,469,789 ÷ 18,688,115 shares) | | $33.84 |
See accompanying notes which are an integral part of the financial statements.
Statement of Operations
| | | Year ended February 28, 2019 |
| Investment Income | | |
| Dividends | | $11,007,174 |
| Non-Cash dividends | | 910,038 |
| Income from Fidelity Central Funds | | 143,923 |
| Total income | | 12,061,135 |
| Expenses | | |
| Management fee | $3,883,593 | |
| Transfer agent fees | 1,251,899 | |
| Accounting and security lending fees | 255,623 | |
| Custodian fees and expenses | 19,567 | |
| Independent trustees' fees and expenses | 4,267 | |
| Registration fees | 29,317 | |
| Audit | 47,139 | |
| Legal | 13,219 | |
| Miscellaneous | 6,717 | |
| Total expenses before reductions | 5,511,341 | |
| Expense reductions | (67,690) | |
| Total expenses after reductions | | 5,443,651 |
| Net investment income (loss) | | 6,617,484 |
| Realized and Unrealized Gain (Loss) | | |
| Net realized gain (loss) on: | | |
| Investment securities: | | |
| Unaffiliated issuers | 16,555,569 | |
| Redemptions in-kind with affiliated entities | 79,998,333 | |
| Fidelity Central Funds | (764) | |
| Foreign currency transactions | (50,198) | |
| Total net realized gain (loss) | | 96,502,940 |
| Change in net unrealized appreciation (depreciation) on: | | |
| Investment securities: | | |
| Unaffiliated issuers | (119,039,629) | |
| Assets and liabilities in foreign currencies | (20) | |
| Total change in net unrealized appreciation (depreciation) | | (119,039,649) |
| Net gain (loss) | | (22,536,709) |
| Net increase (decrease) in net assets resulting from operations | | $(15,919,225) |
See accompanying notes which are an integral part of the financial statements.
Statement of Changes in Net Assets
| | Year ended February 28, 2019 | Year ended February 28, 2018 |
| Increase (Decrease) in Net Assets | | |
| Operations | | |
| Net investment income (loss) | $6,617,484 | $5,526,016 |
| Net realized gain (loss) | 96,502,940 | 75,756,347 |
| Change in net unrealized appreciation (depreciation) | (119,039,649) | 33,436,197 |
| Net increase (decrease) in net assets resulting from operations | (15,919,225) | 114,718,560 |
| Distributions to shareholders | (65,750,180) | – |
| Distributions to shareholders from net investment income | – | (5,401,531) |
| Distributions to shareholders from net realized gain | – | (43,099,432) |
| Total distributions | (65,750,180) | (48,500,963) |
| Share transactions | | |
| Proceeds from sales of shares | 81,696,031 | 196,779,599 |
| Net asset value of shares issued in exchange for the net assets of Industrial Equipment Portfolio (note 10) | – | 186,045,666 |
| Reinvestment of distributions | 62,911,721 | 46,751,393 |
| Cost of shares redeemed | (507,418,619) | (425,264,580) |
| Net increase (decrease) in net assets resulting from share transactions | (362,810,867) | 4,312,078 |
| Total increase (decrease) in net assets | (444,480,272) | 70,529,675 |
| Net Assets | | |
| Beginning of period | 1,076,950,061 | 1,006,420,386 |
| End of period | $632,469,789 | $1,076,950,061 |
| Other Information | | |
| Undistributed net investment income end of period | | $1,342,839 |
| Shares | | |
| Sold | 2,374,933 | 5,592,749 |
| Issued in exchange for the shares of Industrial Equipment Portfolio (note 10) | – | 4,761,855 |
| Issued in reinvestment of distributions | 1,933,852 | 1,349,204 |
| Redeemed | (14,757,500) | (12,414,624) |
| Net increase (decrease) | (10,448,715) | (710,816) |
See accompanying notes which are an integral part of the financial statements.
Financial Highlights
Industrials Portfolio
| | | | | | |
| Years ended February 28, | 2019 | 2018 | 2017 | 2016 A | 2015 |
| Selected Per–Share Data | | | | | |
| Net asset value, beginning of period | $36.96 | $33.72 | $28.10 | $32.69 | $33.69 |
| Income from Investment Operations | | | | | |
| Net investment income (loss)B | .32 | .21 | .26 | .24 | .22 |
| Net realized and unrealized gain (loss) | (.70) | 4.95 | 6.76 | (2.90) | 2.44 |
| Total from investment operations | (.38) | 5.16 | 7.02 | (2.66) | 2.66 |
| Distributions from net investment income | (.25) | (.22) | (.19) | (.20) | (.23) |
| Distributions from net realized gain | (2.49) | (1.71) | (1.21) | (1.73) | (3.43) |
| Total distributions | (2.74) | (1.92)C | (1.40) | (1.93) | (3.66) |
| Redemption fees added to paid in capitalB | – | – | –D | –D | –D |
| Net asset value, end of period | $33.84 | $36.96 | $33.72 | $28.10 | $32.69 |
| Total ReturnE | (.45)% | 15.73% | 25.18% | (8.29)% | 8.74% |
| Ratios to Average Net AssetsF,G | | | | | |
| Expenses before reductions | .76% | .77% | .77% | .77% | .78% |
| Expenses net of fee waivers, if any | .76% | .77% | .77% | .76% | .78% |
| Expenses net of all reductions | .75% | .77% | .77% | .76% | .78% |
| Net investment income (loss) | .92% | .60% | .83% | .79% | .68% |
| Supplemental Data | | | | | |
| Net assets, end of period (000 omitted) | $632,470 | $1,076,950 | $1,006,420 | $978,550 | $1,142,689 |
| Portfolio turnover rateH | 88%I | 64%J | 62%I | 75%I | 72%I |
A For the year ended February 29.
B Calculated based on average shares outstanding during the period.
C Total distributions of $1.92 per share is comprised of distributions from net investment income of $.216 and distributions from net realized gain of $1.705 per share.
D Amount represents less than $.005 per share.
E Total returns would have been lower if certain expenses had not been reduced during the applicable periods shown.
F Fees and expenses of any underlying Fidelity Central Funds are not included in the Fund's expense ratio. The Fund indirectly bears its proportionate share of the expenses of any underlying Fidelity Central Funds.
G Expense ratios reflect operating expenses of the Fund. Expenses before reductions do not reflect amounts reimbursed by the investment adviser or reductions from brokerage service arrangements or reductions from other expense offset arrangements and do not represent the amount paid by the Fund during periods when reimbursements or reductions occur. Expenses net of fee waivers reflect expenses after reimbursement by the investment adviser but prior to reductions from brokerage service arrangements or other expense offset arrangements. Expenses net of all reductions represent the net expenses paid by the Fund.
H Amount does not include the portfolio activity of any underlying Fidelity Central Funds.
I Portfolio turnover rate excludes securities received or delivered in-kind.
J The portfolio turnover rate does not include the assets acquired in the merger.
See accompanying notes which are an integral part of the financial statements.
Transportation Portfolio
Performance: The Bottom Line
Average annual total return reflects the change in the value of an investment, assuming reinvestment of distributions from dividend income and capital gains (the profits earned upon the sale of securities that have grown in value, if any) and assuming a constant rate of performance each year. The hypothetical investment and the average annual total returns do not reflect the deduction of taxes that a shareholder would pay on fund distributions or the redemption of fund shares. During periods of reimbursement by Fidelity, a fund’s total return will be greater than it would be had the reimbursement not occurred. How a fund did yesterday is no guarantee of how it will do tomorrow.
Average Annual Total Returns
| For the periods ended February 28, 2019 | Past 1 year | Past 5 years | Past 10 years |
| Transportation Portfolio | 6.85% | 10.55% | 20.13% |
$10,000 Over 10 Years
Let's say hypothetically that $10,000 was invested in Transportation Portfolio on February 28, 2009.
The chart shows how the value of your investment would have changed, and also shows how the S&P 500® Index performed over the same period.
| Period Ending Values |
| $62,570 | Transportation Portfolio |
| $46,739 | S&P 500® Index |
Transportation Portfolio
Management's Discussion of Fund Performance
Market Recap: The S&P 500
® index gained 4.68% for the 12 months ending February 28, 2019, as the U.S. equity bellwether began the new year on a high note after enduring a final quarter of 2018 in which resurgent volatility upset the aging bull market. In October, rising U.S. Treasury yields and concern about peaking corporate earnings growth sent many investors fleeing from risk assets as they were still dealing with lingering uncertainty related to global trade and the U.S. Federal Reserve picking up the pace of interest rate hikes. The index returned -6.84% in October, at the time its largest monthly drop in seven years. But conditions worsened through Christmas, as jitters about the economy and another hike in rates led to a spike in market volatility and a -9.03% result for December. Sharply reversing course to begin 2019, the S&P 500
® gained 11.48% year-to-date, its strongest two-month opening since 1991, amid upbeat company earnings/outlooks and signs the Fed may pause on rates. For the full period, some economically sensitive sectors fared worst, with financials (-6%) and materials (-6%) both losing ground. Energy gained 1%, while communication services and industrials each rose roughly 2%. In contrast, the defensive utilities (+20%), real estate (+20%) and health care (+11%) sectors led the way, while consumer staples finished near the index. Information technology and consumer discretionary were rattled in the late-2018 downturn, but earlier strength contributed to advances of 9% and roughly 7%, respectively.
Comments from Portfolio Manager Matthew Moulis: For the fiscal year, the fund gained 6.85%, topping the 4.73% return of the MSCI U.S. IMI Transportation 25/50 Linked Index, and also outpacing the S&P 500
®. Versus the MSCI industry index, stock selection and an underweighting in air freight & logistics gave the fund its biggest lift. Overweighting railroads – the top-performing industry in the MSCI index this period, with a return of roughly 31% – and underweighting trucking stocks also helped. At the individual stock level, a large underweighting in the weak-performing shares of XPO Logistics was the fund’s top relative contributor. The company lowered its financial estimates twice in recent months, as it lost a key customer in Europe and the general environment there deteriorated. Underweighting FedEx also worked to the fund’s benefit this period, as did overweighted exposure to Spirit Airlines – which I purchased for the fund beginning in April – and American Airlines Group. Conversely, positioning in airport services nicked us a bit. Among individual holdings, a large underweighting in the strong-performing shares of United Continental Holdings, parent company of United Airlines, worked against us. Underweighting rail carrier Union Pacific also detracted on a relative basis, given this stock’s strong advance.
The views expressed above reflect those of the portfolio manager(s) only through the end of the period as stated on the cover of this report and do not necessarily represent the views of Fidelity or any other person in the Fidelity organization. Any such views are subject to change at any time based upon market or other conditions and Fidelity disclaims any responsibility to update such views. These views may not be relied on as investment advice and, because investment decisions for a Fidelity fund are based on numerous factors, may not be relied on as an indication of trading intent on behalf of any Fidelity fund.
Transportation Portfolio
Investment Summary (Unaudited)
Top Ten Stocks as of February 28, 2019
| | % of fund's net assets |
| Union Pacific Corp. | 17.5 |
| United Parcel Service, Inc. Class B | 12.5 |
| Norfolk Southern Corp. | 6.0 |
| C.H. Robinson Worldwide, Inc. | 5.9 |
| Southwest Airlines Co. | 5.1 |
| CSX Corp. | 5.0 |
| FedEx Corp. | 4.9 |
| J.B. Hunt Transport Services, Inc. | 4.7 |
| American Airlines Group, Inc. | 4.6 |
| Genesee & Wyoming, Inc. Class A | 3.9 |
| | 70.1 |
Top Industries (% of fund's net assets)
| As of February 28, 2019 |
| | Road & Rail | 43.7% |
| | Air Freight & Logistics | 27.4% |
| | Airlines | 22.1% |
| | Transportation Infrastructure | 1.2% |
| | Marine | 1.1% |
| | All Others* | 4.5% |

* Includes short-term investments and net other assets (liabilities).
Transportation Portfolio
Schedule of Investments February 28, 2019
Showing Percentage of Net Assets
| Common Stocks - 96.5% | | | |
| | | Shares | Value |
| Air Freight & Logistics - 27.4% | | | |
| Air Freight & Logistics - 27.4% | | | |
| Air Transport Services Group, Inc. (a) | | 23,000 | $535,210 |
| Atlas Air Worldwide Holdings, Inc. (a) | | 64,600 | 3,471,604 |
| C.H. Robinson Worldwide, Inc. | | 293,196 | 26,499,054 |
| Echo Global Logistics, Inc. (a) | | 314,000 | 7,542,280 |
| FedEx Corp. | | 121,550 | 22,000,550 |
| Forward Air Corp. | | 20,744 | 1,341,100 |
| Hub Group, Inc. Class A (a) | | 76,200 | 3,275,076 |
| United Parcel Service, Inc. Class B | | 511,800 | 56,400,360 |
| XPO Logistics, Inc. (a) | | 52,300 | 2,633,305 |
| | | | 123,698,539 |
| Airlines - 22.1% | | | |
| Airlines - 22.1% | | | |
| Alaska Air Group, Inc. | | 80,300 | 4,954,510 |
| American Airlines Group, Inc. | | 581,000 | 20,701,030 |
| Delta Air Lines, Inc. | | 284,802 | 14,120,483 |
| Hawaiian Holdings, Inc. | | 33,700 | 1,002,575 |
| JetBlue Airways Corp. (a) | | 573,400 | 9,575,780 |
| Mesa Air Group, Inc. | | 215,200 | 2,167,064 |
| SkyWest, Inc. | | 151,700 | 8,197,868 |
| Southwest Airlines Co. | | 407,300 | 22,825,092 |
| Spirit Airlines, Inc. (a) | | 268,900 | 15,125,625 |
| United Continental Holdings, Inc. (a) | | 14,000 | 1,229,340 |
| | | | 99,899,367 |
| Auto Components - 0.4% | | | |
| Auto Parts & Equipment - 0.4% | | | |
| Hertz Global Holdings, Inc. (a) | | 84,400 | 1,612,040 |
| Commercial Services & Supplies - 0.3% | | | |
| Diversified Support Services - 0.3% | | | |
| Boyd Group Income Fund | | 13,400 | 1,240,871 |
| Machinery - 0.3% | | | |
| Construction Machinery & Heavy Trucks - 0.3% | | | |
| Allison Transmission Holdings, Inc. | | 24,800 | 1,232,560 |
| Marine - 1.1% | | | |
| Marine - 1.1% | | | |
| Kirby Corp. (a) | | 47,500 | 3,525,450 |
| Matson, Inc. | | 43,295 | 1,563,382 |
| | | | 5,088,832 |
| Road & Rail - 43.7% | | | |
| Railroads - 34.9% | | | |
| CSX Corp. | | 310,719 | 22,579,950 |
| Genesee & Wyoming, Inc. Class A (a) | | 212,000 | 17,384,000 |
| Kansas City Southern | | 105,100 | 11,418,064 |
| Norfolk Southern Corp. | | 150,150 | 26,921,895 |
| Union Pacific Corp. | | 471,595 | 79,086,482 |
| | | | 157,390,391 |
| Trucking - 8.8% | | | |
| AMERCO | | 6,800 | 2,615,212 |
| Avis Budget Group, Inc. (a) | | 62,100 | 2,224,422 |
| J.B. Hunt Transport Services, Inc. | | 199,000 | 21,426,330 |
| Knight-Swift Transportation Holdings, Inc. Class A | | 120,100 | 4,038,963 |
| Landstar System, Inc. | | 33,800 | 3,673,384 |
| Ryder System, Inc. | | 84,000 | 5,221,440 |
| YRC Worldwide, Inc. (a) | | 97,600 | 748,592 |
| | | | 39,948,343 |
|
| TOTAL ROAD & RAIL | | | 197,338,734 |
|
| Transportation Infrastructure - 1.2% | | | |
| Airport Services - 1.2% | | | |
| Macquarie Infrastructure Co. LLC | | 130,500 | 5,336,145 |
| TOTAL COMMON STOCKS | | | |
| (Cost $279,269,032) | | | 435,447,088 |
|
| Money Market Funds - 3.3% | | | |
| Fidelity Cash Central Fund, 2.44% (b) | | | |
| (Cost $14,697,735) | | 14,694,796 | 14,697,735 |
| TOTAL INVESTMENT IN SECURITIES - 99.8% | | | |
| (Cost $293,966,767) | | | 450,144,823 |
| NET OTHER ASSETS (LIABILITIES) - 0.2% | | | 1,046,841 |
| NET ASSETS - 100% | | | $451,191,664 |
Legend
(a) Non-income producing
(b) Affiliated fund that is generally available only to investment companies and other accounts managed by Fidelity Investments. The rate quoted is the annualized seven-day yield of the fund at period end. A complete unaudited listing of the fund's holdings as of its most recent quarter end is available upon request. In addition, each Fidelity Central Fund's financial statements, which are not covered by the Fund's Report of Independent Registered Public Accounting Firm, are available on the SEC's website or upon request.
Affiliated Central Funds
Information regarding fiscal year to date income earned by the Fund from investments in Fidelity Central Funds is as follows:
| Fund | Income earned |
| Fidelity Cash Central Fund | $287,311 |
| Fidelity Securities Lending Cash Central Fund | 4,487 |
| Total | $291,798 |
Amounts in the income column in the above table include any capital gain distributions from underlying funds, which are presented in the corresponding line-item in the Statement of Operations, if applicable.
Investment Valuation
All investments are categorized as Level 1 under the Fair Value Hierarchy. The inputs or methodology used for valuing securities may not be an indication of the risk associated with investing in those securities. For more information on valuation inputs please refer to the Investment Valuation section in the accompanying Notes to Financial Statements.
See accompanying notes which are an integral part of the financial statements.
Transportation Portfolio
Financial Statements
Statement of Assets and Liabilities
| | | February 28, 2019 |
| Assets | | |
Investment in securities, at value — See accompanying schedule:
Unaffiliated issuers (cost $279,269,032) | $435,447,088 | |
| Fidelity Central Funds (cost $14,697,735) | 14,697,735 | |
| Total Investment in Securities (cost $293,966,767) | | $450,144,823 |
| Cash | | 815 |
| Receivable for fund shares sold | | 445,599 |
| Dividends receivable | | 1,442,658 |
| Distributions receivable from Fidelity Central Funds | | 32,229 |
| Prepaid expenses | | 4,277 |
| Total assets | | 452,070,401 |
| Liabilities | | |
| Payable for fund shares redeemed | $557,350 | |
| Accrued management fee | 202,489 | |
| Transfer agent fee payable | 69,771 | |
| Other affiliated payables | 14,587 | |
| Other payables and accrued expenses | 34,540 | |
| Total liabilities | | 878,737 |
| Net Assets | | $451,191,664 |
| Net Assets consist of: | | |
| Paid in capital | | $284,337,481 |
| Total distributable earnings (loss) | | 166,854,183 |
| Net Assets, for 4,728,743 shares outstanding | | $451,191,664 |
| Net Asset Value, offering price and redemption price per share ($451,191,664 ÷ 4,728,743 shares) | | $95.41 |
See accompanying notes which are an integral part of the financial statements.
Statement of Operations
| | | Year ended February 28, 2019 |
| Investment Income | | |
| Dividends | | $7,551,254 |
| Income from Fidelity Central Funds | | 291,798 |
| Total income | | 7,843,052 |
| Expenses | | |
| Management fee | $2,556,671 | |
| Transfer agent fees | 906,514 | |
| Accounting and security lending fees | 184,232 | |
| Custodian fees and expenses | 7,953 | |
| Independent trustees' fees and expenses | 2,680 | |
| Registration fees | 29,807 | |
| Audit | 49,153 | |
| Legal | 3,139 | |
| Interest | 728 | |
| Miscellaneous | 4,134 | |
| Total expenses before reductions | 3,745,011 | |
| Expense reductions | (22,762) | |
| Total expenses after reductions | | 3,722,249 |
| Net investment income (loss) | | 4,120,803 |
| Realized and Unrealized Gain (Loss) | | |
| Net realized gain (loss) on: | | |
| Investment securities: | | |
| Unaffiliated issuers | 35,677,874 | |
| Fidelity Central Funds | 201 | |
| Foreign currency transactions | 120 | |
| Total net realized gain (loss) | | 35,678,195 |
| Change in net unrealized appreciation (depreciation) on investment securities | | (13,313,644) |
| Net gain (loss) | | 22,364,551 |
| Net increase (decrease) in net assets resulting from operations | | $26,485,354 |
See accompanying notes which are an integral part of the financial statements.
Statement of Changes in Net Assets
| | Year ended February 28, 2019 | Year ended February 28, 2018 |
| Increase (Decrease) in Net Assets | | |
| Operations | | |
| Net investment income (loss) | $4,120,803 | $4,414,310 |
| Net realized gain (loss) | 35,678,195 | 54,399,996 |
| Change in net unrealized appreciation (depreciation) | (13,313,644) | (491,145) |
| Net increase (decrease) in net assets resulting from operations | 26,485,354 | 58,323,161 |
| Distributions to shareholders | (46,373,355) | – |
| Distributions to shareholders from net investment income | – | (3,594,752) |
| Distributions to shareholders from net realized gain | – | (25,696,815) |
| Total distributions | (46,373,355) | (29,291,567) |
| Share transactions | | |
| Proceeds from sales of shares | 101,838,716 | 129,618,153 |
| Reinvestment of distributions | 43,939,054 | 27,926,461 |
| Cost of shares redeemed | (186,853,315) | (317,501,802) |
| Net increase (decrease) in net assets resulting from share transactions | (41,075,545) | (159,957,188) |
| Redemption fees | – | 13,501 |
| Total increase (decrease) in net assets | (60,963,546) | (130,912,093) |
| Net Assets | | |
| Beginning of period | 512,155,210 | 643,067,303 |
| End of period | $451,191,664 | $512,155,210 |
| Other Information | | |
| Undistributed net investment income end of period | | $1,226,779 |
| Shares | | |
| Sold | 1,020,111 | 1,302,357 |
| Issued in reinvestment of distributions | 490,031 | 280,882 |
| Redeemed | (1,950,861) | (3,330,145) |
| Net increase (decrease) | (440,719) | (1,746,906) |
See accompanying notes which are an integral part of the financial statements.
Financial Highlights
Transportation Portfolio
| | | | | | |
| Years ended February 28, | 2019 | 2018 | 2017 | 2016 A | 2015 |
| Selected Per–Share Data | | | | | |
| Net asset value, beginning of period | $99.07 | $92.98 | $73.25 | $94.04 | $76.28 |
| Income from Investment Operations | | | | | |
| Net investment income (loss)B | .85 | .78 | .63 | .50 | .46 |
| Net realized and unrealized gain (loss) | 5.05 | 10.83 | 20.86 | (15.81) | 19.67 |
| Total from investment operations | 5.90 | 11.61 | 21.49 | (15.31) | 20.13 |
| Distributions from net investment income | (.78) | (.67) | (.38) | (.52) | (.34) |
| Distributions from net realized gain | (8.78) | (4.85) | (1.39) | (4.95) | (2.04) |
| Total distributions | (9.56) | (5.52) | (1.77) | (5.48)C | (2.38) |
| Redemption fees added to paid in capitalB | – | –D | .01 | –D | .01 |
| Net asset value, end of period | $95.41 | $99.07 | $92.98 | $73.25 | $94.04 |
| Total ReturnE | 6.85% | 12.48% | 29.40% | (16.28)% | 26.80% |
| Ratios to Average Net AssetsF,G | | | | | |
| Expenses before reductions | .79% | .80% | .83% | .81% | .81% |
| Expenses net of fee waivers, if any | .79% | .80% | .83% | .81% | .81% |
| Expenses net of all reductions | .78% | .80% | .82% | .80% | .81% |
| Net investment income (loss) | .87% | .80% | .76% | .60% | .53% |
| Supplemental Data | | | | | |
| Net assets, end of period (000 omitted) | $451,192 | $512,155 | $643,067 | $408,171 | $1,146,633 |
| Portfolio turnover rateH | 58% | 47% | 104% | 80% | 72%I |
A For the year ended February 29.
B Calculated based on average shares outstanding during the period.
C Total distributions of $5.48 per share is comprised of distributions from net investment income of $.521 and distributions from net realized gain of $4.954 per share.
D Amount represents less than $.005 per share.
E Total returns would have been lower if certain expenses had not been reduced during the applicable periods shown.
F Fees and expenses of any underlying Fidelity Central Funds are not included in the Fund's expense ratio. The Fund indirectly bears its proportionate share of the expenses of any underlying Fidelity Central Funds.
G Expense ratios reflect operating expenses of the Fund. Expenses before reductions do not reflect amounts reimbursed by the investment adviser or reductions from brokerage service arrangements or reductions from other expense offset arrangements and do not represent the amount paid by the Fund during periods when reimbursements or reductions occur. Expenses net of fee waivers reflect expenses after reimbursement by the investment adviser but prior to reductions from brokerage service arrangements or other expense offset arrangements. Expenses net of all reductions represent the net expenses paid by the Fund.
H Amount does not include the portfolio activity of any underlying Fidelity Central Funds.
I Portfolio turnover rate excludes securities received or delivered in-kind.
See accompanying notes which are an integral part of the financial statements.
Notes to Financial Statements
For the period ended February 28, 2019
1. Organization.
Air Transportation Portfolio, Defense and Aerospace Portfolio, Environment and Alternative Energy Portfolio, Industrials Portfolio, and Transportation Portfolio (the Funds) are non-diversified funds of Fidelity Select Portfolios (the Trust). The Trust is registered under the Investment Company Act of 1940, as amended (the 1940 Act), as an open-end management investment company organized as a Massachusetts business trust. The Funds invest primarily in securities of companies whose principal business activities fall within specific industries. Each Fund is authorized to issue an unlimited number of shares. Share transactions on the Statement of Changes in Net Assets may contain exchanges between affiliated funds.
Effective August 10, 2018, Defense and Aerospace Portfolio underwent a 10 for 1 share split. The effect of the share split transaction was to multiply the number of outstanding shares of Defense and Aerospace Portfolio by a split factor of 10:1, with a corresponding decrease in net asset value (NAV) per share. This event does not impact the overall net assets of Defense and Aerospace Portfolio. The per share data presented in the Financial Highlights and Share activity presented in the Statements of Changes in Net Assets for Defense and Aerospace Portfolio have been retroactively adjusted to reflect this share split.
2. Investments in Fidelity Central Funds.
The Funds invests in Fidelity Central Funds, which are open-end investment companies generally available only to other investment companies and accounts managed by the investment adviser and its affiliates. The Funds' Schedules of Investments list each of the Fidelity Central Funds held as of period end, if any, as an investment of each Fund, but do not include the underlying holdings of each Fidelity Central Fund. As an Investing Fund, each Fund indirectly bears its proportionate share of the expenses of the underlying Fidelity Central Funds.
The Money Market Central Funds seek preservation of capital and current income and are managed by Fidelity Investments Money Management, Inc. (FIMM), an affiliate of the investment adviser. Annualized expenses of the Money Market Central Funds as of their most recent shareholder report date are less than .005%.
A complete unaudited list of holdings for each Fidelity Central Fund is available upon request or at the Securities and Exchange Commission (the SEC) website at www.sec.gov. In addition, the financial statements of the Fidelity Central Funds, which are not covered by the Funds' Report of Independent Registered Public Accounting Firm, are available on the SEC website or upon request.
3. Significant Accounting Policies.
Each Fund is an investment company and applies the accounting and reporting guidance of the Financial Accounting Standards Board (FASB) Accounting Standards Codification Topic 946 Financial Services – Investments Companies. The financial statements have been prepared in conformity with accounting principles generally accepted in the United States of America (GAAP), which require management to make certain estimates and assumptions at the date of the financial statements. Actual results could differ from those estimates. Subsequent events, if any, through the date that the financial statements were issued have been evaluated in the preparation of the financial statements. The following summarizes the significant accounting policies of the Funds:
Investment Valuation. Investments are valued as of 4:00 p.m. Eastern time on the last calendar day of the period. The Board of Trustees (the Board) has delegated the day to day responsibility for the valuation of each Fund's investments to the Fair Value Committee (the Committee) established by each Fund's investment adviser. In accordance with valuation policies and procedures approved by the Board, each Fund attempts to obtain prices from one or more third party pricing vendors or brokers to value its investments. When current market prices, quotations or currency exchange rates are not readily available or reliable, investments will be fair valued in good faith by the Committee, in accordance with procedures adopted by the Board. Factors used in determining fair value vary by investment type and may include market or investment specific events. The frequency with which these procedures are used cannot be predicted and they may be utilized to a significant extent. The Committee oversees each Fund's valuation policies and procedures and reports to the Board on the Committee's activities and fair value determinations. The Board monitors the appropriateness of the procedures used in valuing each Fund's investments and ratifies the fair value determinations of the Committee.
Each Fund categorizes the inputs to valuation techniques used to value its investments into a disclosure hierarchy consisting of three levels as shown below:
- Level 1 – quoted prices in active markets for identical investments
- Level 2 – other significant observable inputs (including quoted prices for similar investments, interest rates, prepayment speeds, etc.)
- Level 3 – unobservable inputs (including the Fund's own assumptions based on the best information available)
Valuation techniques used to value each Fund's investments by major category are as follows:
Equity securities, including restricted securities, for which market quotations are readily available, are valued at the last reported sale price or official closing price as reported by a third party pricing vendor on the primary market or exchange on which they are traded and are categorized as Level 1 in the hierarchy. In the event there were no sales during the day or closing prices are not available, securities are valued at the last quoted bid price or may be valued using the last available price and are generally categorized as Level 2 in the hierarchy. For foreign equity securities, when market or security specific events arise, comparisons to the valuation of American Depositary Receipts (ADRs), futures contracts, Exchange-Traded Funds (ETFs) and certain indexes as well as quoted prices for similar securities may be used and would be categorized as Level 2 in the hierarchy. For equity securities, including restricted securities, where observable inputs are limited, assumptions about market activity and risk are used and these securities may be categorized as Level 3 in the hierarchy.
Investments in open-end mutual funds, including the Fidelity Central Funds, are valued at their closing net asset value (NAV) each business day and are categorized as Level 1 in the hierarchy.
Changes in valuation techniques may result in transfers in or out of an assigned level within the disclosure hierarchy. The aggregate value of investments by input level as of February 28, 2019, is included at the end of each applicable Fund's Schedule of Investments.
Foreign Currency. The Funds may use foreign currency contracts to facilitate transactions in foreign-denominated securities. Gains and losses from these transactions may arise from changes in the value of the foreign currency or if the counterparties do not perform under the contracts' terms.
Foreign-denominated assets, including investment securities, and liabilities are translated into U.S. dollars at the exchange rates at period end. Purchases and sales of investment securities, income and dividends received and expenses denominated in foreign currencies are translated into U.S. dollars at the exchange rate in effect on the transaction date.
The effects of exchange rate fluctuations on investments are included with the net realized and unrealized gain (loss) on investment securities. Other foreign currency transactions resulting in realized and unrealized gain (loss) are disclosed separately.
Investment Transactions and Income. For financial reporting purposes, the Funds' investment holdings and NAV include trades executed through the end of the last business day of the period. The NAV per share for processing shareholder transactions is calculated as of the close of business of the New York Stock Exchange (NYSE), normally 4:00 p.m. Eastern time and includes trades executed through the end of the prior business day. Gains and losses on securities sold are determined on the basis of identified cost and for certain Funds include proceeds received from litigation. Dividend income is recorded on the ex-dividend date, except for certain dividends from foreign securities where the ex-dividend date may have passed, which are recorded as soon as the Funds are informed of the ex-dividend date. Non-cash dividends included in dividend income, if any, are recorded at the fair market value of the securities received. Income and capital gain distributions from Fidelity Central Funds, if any, are recorded on the ex-dividend date. Certain distributions received by the Funds represent a return of capital or capital gain. The Funds determine the components of these distributions subsequent to the ex-dividend date, based upon receipt of tax filings or other correspondence relating to the underlying investment. These distributions are recorded as a reduction of cost of investments and/or as a realized gain. Investment income is recorded net of foreign taxes withheld where recovery of such taxes is uncertain.
Expenses. Expenses directly attributable to a fund are charged to that fund. Expenses attributable to more than one fund are allocated among the respective funds on the basis of relative net assets or other appropriate methods. Expense estimates are accrued in the period to which they relate and adjustments are made when actual amounts are known.
Deferred Trustee Compensation. Under a Deferred Compensation Plan (the Plan) for certain Funds, certain independent Trustees have elected to defer receipt of a portion of their annual compensation. Deferred amounts are invested in a cross-section of Fidelity funds, are marked-to-market and remain in each Fund until distributed in accordance with the Plan. The investment of deferred amounts and the offsetting payable to the Trustees presented below are included in each accompanying Statement of Assets and Liabilities in other receivables and other payables and accrued expenses, respectively.
| Defense and Aerospace Portfolio | $82,900 |
| Industrials Portfolio | 74,635 |
Income Tax Information and Distributions to Shareholders. Each year, each Fund intends to qualify as a regulated investment company under Subchapter M of the Internal Revenue Code, including distributing substantially all of its taxable income and realized gains. As a result, no provision for U.S. Federal income taxes is required. As of February 28, 2019, each Fund did not have any unrecognized tax benefits in the financial statements; nor is each Fund aware of any tax positions for which it is reasonably possible that the total amounts of unrecognized tax benefits will significantly change in the next twelve months. Each Fund files a U.S. federal tax return, in addition to state and local tax returns as required. Each Fund's federal income tax returns are subject to examination by the Internal Revenue Service (IRS) for a period of three fiscal years after they are filed. State and local tax returns may be subject to examination for an additional fiscal year depending on the jurisdiction. Foreign taxes are provided for based on each Fund's understanding of the tax rules and rates that exist in the foreign markets in which it invests.
Distributions are declared and recorded on the ex-dividend date. Income and capital gain distributions are determined in accordance with income tax regulations, which may differ from GAAP. In addition, the Funds claimed a portion of the payment made to redeeming shareholders as a distribution for income tax purposes.
Capital accounts within the financial statements are adjusted for permanent book-tax differences. These adjustments have no impact on net assets or the results of operations. Capital accounts are not adjusted for temporary book-tax differences which will reverse in a subsequent period.
Book-tax differences are primarily due to foreign currency transactions, redemptions in kind, deferred trustees compensation and losses deferred due to wash sales and excise tax regulations.
As of period end, the cost and unrealized appreciation (depreciation) in securities, and derivatives if applicable, for federal income tax purposes were as follows for each Fund:
| | Tax cost | Gross unrealized appreciation | Gross unrealized depreciation | Net unrealized appreciation (depreciation) |
| Air Transportation Portfolio | $216,450,257 | $94,357,993 | $(4,662,473) | $89,695,520 |
| Defense and Aerospace Portfolio | 1,924,824,622 | 927,533,651 | (55,877,900) | 871,655,751 |
| Environment and Alternative Energy Portfolio | 138,201,190 | 26,725,304 | (3,038,792) | 23,686,512 |
| Industrials Portfolio | 513,183,562 | 129,687,936 | (10,237,645) | 119,450,291 |
| Transportation Portfolio | 296,325,458 | 165,040,910 | (11,221,545) | 153,819,365 |
The tax-based components of distributable earnings as of period end were as follows for each Fund:
| | Undistributed ordinary income | Undistributed long-term capital gain | Net unrealized appreciation (depreciation) on securities and other investments |
| Air Transportation Portfolio | $591,383 | $2,359,969 | $89,695,520 |
| Defense and Aerospace Portfolio | – | – | 871,655,156 |
| Environment and Alternative Energy Portfolio | 355,662 | 2,636,160 | 23,685,212 |
| Industrials Portfolio | – | – | 119,450,265 |
| Transportation Portfolio | 1,128,181 | 11,906,637 | 153,819,365 |
Certain of the Funds intend to elect to defer to the next fiscal year capital losses recognized during the period November 1, 2018 to February 28, 2019. Loss deferrals were as follows:
| | Capital losses |
| Defense and Aerospace Portfolio | $(12,080,856) |
| Industrials Portfolio | (4,485,372) |
The tax character of distributions paid was as follows:
| February 28, 2019 | | | |
| | Ordinary Income | Long-term Capital Gains | Total |
| Air Transportation Portfolio | $9,453,579 | $26,201,948 | $35,655,527 |
| Defense and Aerospace Portfolio | 46,737,621 | 211,813,331 | 258,550,952 |
| Environment and Alternative Energy Portfolio | 2,257,022 | 6,196,986 | 8,454,008 |
| Industrials Portfolio | 11,514,105 | 54,236,075 | 65,750,180 |
| Transportation Portfolio | 5,383,802 | 40,989,553 | 46,373,355 |
| February 28, 2018 | | | |
| | Ordinary Income | Long-term Capital Gains | Total |
| Air Transportation Portfolio | $5,548,777 | $29,647,019 | $35,195,796 |
| Defense and Aerospace Portfolio | 19,819,026 | 65,447,045 | 85,266,071 |
| Environment and Alternative Energy Portfolio | 4,709,514 | 6,190,274 | 10,899,788 |
| Industrials Portfolio | 6,232,259 | 42,268,704 | 48,500,963 |
| Transportation Portfolio | 3,759,198 | 25,532,369 | 29,291,567 |
Restricted Securities. The Funds may invest in securities that are subject to legal or contractual restrictions on resale. These securities generally may be resold in transactions exempt from registration or to the public if the securities are registered. Disposal of these securities may involve time-consuming negotiations and expense, and prompt sale at an acceptable price may be difficult. Information regarding restricted securities is included at the end of each applicable Fund's Schedule of Investments.
New Rule Issuance. During August 2018, the U.S. Securities and Exchange Commission issued Final Rule Release No. 33-10532, Disclosure Update and Simplification. This Final Rule includes amendments specific to registered investment companies that are intended to eliminate overlap in disclosure requirements between Regulation S-X and GAAP. In accordance with these amendments, certain line-items in the Funds' financial statements have been combined or removed for the current period as outlined in the table below.
| Financial Statement | Current Line-Item Presentation (As Applicable) | Prior Line-Item Presentation (As Applicable) |
| Statement of Assets and Liabilities | Total distributable earnings (loss) | Undistributed/Distributions in excess of/Accumulated net investment income (loss)
Accumulated/Undistributed net realized gain (loss)
Net unrealized appreciation (depreciation) |
| Statement of Changes in Net Assets | N/A - removed | Undistributed/Distributions in excess of/Accumulated net investment income (loss) end of period |
| Statement of Changes in Net Assets | Distributions to shareholders | Distributions to shareholders from net investment income
Distributions to shareholders from net realized gain |
4. Purchases and Sales of Investments.
Purchases and sales of securities, other than short-term securities and in-kind transactions, are noted in the table below.
| | Purchases ($) | Sales ($) |
| Air Transportation Portfolio | 101,590,648 | 181,892,566 |
| Defense and Aerospace Portfolio | 1,206,631,181 | 1,506,705,366 |
| Environment and Alternative Energy Portfolio | 93,648,882 | 123,060,579 |
| Industrials Portfolio | 637,013,575 | 784,349,609 |
| Transportation Portfolio | 266,741,581 | 346,086,903 |
5. Fees and Other Transactions with Affiliates.
Management Fee. Fidelity SelectCo, LLC (the investment adviser) and its affiliates provide the Funds with investment management related services for which the Funds pay a monthly management fee. The management fee is the sum of an individual fund fee rate and an annualized group fee rate. The individual fund fee rate is applied to each Fund's average net assets. The group fee rate is based upon the average net assets of all the mutual funds advised by Fidelity Management & Research Company (FMR) and the investment adviser. The group fee rate decreases as assets under management increase and increases as assets under management decrease. For the reporting period, each Fund's annual management fee rate expressed as a percentage of each Fund's average net assets was as follows:
| | Individual Rate | Group Rate | Total |
| Air Transportation Portfolio | .30% | .24% | .54% |
| Defense and Aerospace Portfolio | .30% | .24% | .54% |
| Environment and Alternative Energy Portfolio | .30% | .24% | .54% |
| Industrials Portfolio | .30% | .24% | .54% |
| Transportation Portfolio | .30% | .24% | .54% |
Transfer Agent Fees. Fidelity Investments Institutional Operations Company, Inc. (FIIOC), an affiliate of the investment adviser, is the Funds' transfer, dividend disbursing and shareholder servicing agent. FIIOC receives account fees and asset-based fees that vary according to account size and type of account. FIIOC pays for typesetting, printing and mailing of shareholder reports, except proxy statements. For the period, transfer agent fees were equivalent to the following annual rates expressed as a percentage of average net assets:
| Air Transportation Portfolio | .21% |
| Defense and Aerospace Portfolio | .17% |
| Environment and Alternative Energy Portfolio | .23% |
| Industrials Portfolio | .17% |
| Transportation Portfolio | .19% |
Accounting and Security Lending Fees. Fidelity Service Company, Inc. (FSC), an affiliate of the investment adviser, maintains each Fund's accounting records. The accounting fee is based on the level of average net assets for each month. Under a separate contract, FSC administers the security lending program. The security lending fee is based on the number and duration of lending transactions. For the period, the fees were equivalent to the following annual rates:
| | % of Average Net Assets |
| Air Transportation Portfolio | .04 |
| Defense and Aerospace Portfolio | .03 |
| Environment and Alternative Energy Portfolio | .04 |
| Industrials Portfolio | .04 |
| Transportation Portfolio | .04 |
Brokerage Commissions. Certain Funds placed a portion of their portfolio transactions with brokerage firms which are affiliates of the investment adviser. Brokerage commissions are included in net realized gain (loss) and change in net unrealized appreciation (depreciation) in the Statement of Operations. The commissions paid to these affiliated firms were as follows:
| | Amount |
| Air Transportation Portfolio | $2,932 |
| Defense and Aerospace Portfolio | 28,099 |
| Environmental and Alternative Energy Portfolio | 1,682 |
| Industrials Portfolio | 19,112 |
| Transportation Portfolio | 8,765 |
Interfund Lending Program. Pursuant to an Exemptive Order issued by the SEC, the Funds, along with other registered investment companies having management contracts with Fidelity Management & Research Company (FMR) or other affiliated entities of FMR, may participate in an interfund lending program. This program provides an alternative credit facility allowing the funds to borrow from, or lend money to, other participating affiliated funds. At period end, there were no interfund loans outstanding. Each applicable fund's activity in this program during the period for which loans were outstanding was as follows:
| | Borrower or Lender | Average Loan Balance | Weighted Average Interest Rate | Interest Expense |
| Defense and Aerospace Portfolio | Borrower | $10,724,750 | 2.51% | $8,970 |
| Environment and Alternative Energy Portfolio | Borrower | 7,051,333 | 1.80% | 1,058 |
| Transportation Portfolio | Borrower | 13,468,000 | 1.95% | 728 |
Interfund Trades. The Funds may purchase from or sell securities to other Fidelity Funds under procedures adopted by the Board. The procedures have been designed to ensure these interfund trades are executed in accordance with Rule 17a-7 of the 1940 Act. Interfund trades are included within the respective purchases and sales amounts shown in the Purchases and Sales of Investments note.
Affiliated Redemptions In-Kind. During the period, 8,024,186 shares of Industrials Portfolio were redeemed in-kind for investments and cash with a value of $278,038,031. The net realized gain of $79,998,333 on investments delivered through in-kind redemptions is included in the accompanying Statement of Operations. The amount of in-kind redemptions is included in share transactions in the accompanying Statement of Changes in Net Assets. Industrials Portfolio recognized no gain or loss for federal income tax purposes.
Other. During the period, the investment advisor reimbursed Defense and Aerospace Portfolio for certain losses in the amount of $1,420.
6. Committed Line of Credit.
Certain Funds participate with other funds managed by the investment adviser or an affiliate in a $4.25 billion credit facility (the "line of credit") to be utilized for temporary or emergency purposes to fund shareholder redemptions or for other short-term liquidity purposes. The participating funds have agreed to pay commitment fees on their pro-rata portion of the line of credit, which are reflected in Miscellaneous expenses on the Statement of Operations, and are as follows:
| Air Transportation Portfolio | $926 |
| Defense and Aerospace Portfolio | 7,682 |
| Environment and Alternative Energy Portfolio | 437 |
| Industrials Portfolio | 2,170 |
| Transportation Portfolio | 1,341 |
During the period, the Funds did not borrow on this line of credit.
7. Security Lending.
Certain Funds lend portfolio securities through a lending agent from time to time in order to earn additional income. On the settlement date of the loan, each applicable Fund receives collateral (in the form of U.S. Treasury obligations, letters of credit and/or cash) against the loaned securities and maintains collateral in an amount not less than 100% of the market value of the loaned securities during the period of the loan. The market value of the loaned securities is determined at the close of business of the Funds and any additional required collateral is delivered to the Funds on the next business day. The Funds or borrower may terminate the loan at any time, and if the borrower defaults on its obligation to return the securities loaned because of insolvency or other reasons, the Funds may apply collateral received from the borrower against the obligation. The Funds may experience delays and costs in recovering the securities loaned. Any cash collateral received is invested in the Fidelity Securities Lending Cash Central Fund. The value of loaned securities and cash collateral at period end are disclosed on each applicable Fund's Statement of Assets and Liabilities. Security lending income represents the income earned on investing cash collateral, less rebates paid to borrowers and any lending agent fees associated with the loan, plus any premium payments received for lending certain types of securities. Security lending income is presented on each applicable Fund's Statement of Operations as a component of income from Fidelity Central Funds. Security lending activity was as follows:
| | Total Security Lending Income |
| Air Transportation Portfolio | $796 |
| Defense and Aerospace Portfolio | 26,941 |
| Environment and Alternative Energy Portfolio | 6,223 |
| Industrials Portfolio | 63,435 |
| Transportation Portfolio | 4,487 |
8. Expense Reductions.
Commissions paid to certain brokers with whom the investment adviser, or its affiliates, places trades on behalf of certain Funds include an amount in addition to trade execution, which may be rebated back to the Funds to offset certain expenses. In addition, through arrangements with each applicable Fund's custodian, credits realized as a result of certain uninvested cash balances were used to reduce each applicable Fund's expenses. All of the applicable expense reductions are noted in the table below.
| | Brokerage Service reduction | Custody expense reduction |
| Air Transportation Portfolio | $10,534 | $26 |
| Defense and Aerospace Portfolio | 59,361 | 3,563 |
| Environment and Alternative Energy Portfolio | 9,851 | – |
| Industrials Portfolio | 60,662 | – |
| Transportation Portfolio | 18,095 | 485 |
In addition, during the period the investment adviser reimbursed and/or waived a portion of operating expenses as follows:
| | Amount |
| Air Transportation Portfolio | $2,932 |
| Defense and Aerospace Portfolio | 20,507 |
| Environment and Alternative Energy Portfolio | 1,352 |
| Industrials Portfolio | 7,028 |
| Transportation Portfolio | 4,182 |
9. Other.
The Funds' organizational documents provide former and current trustees and officers with a limited indemnification against liabilities arising in connection with the performance of their duties to the Funds. In the normal course of business, the Funds may also enter into contracts that provide general indemnifications. The Funds' maximum exposure under these arrangements is unknown as this would be dependent on future claims that may be made against the Funds. The risk of material loss from such claims is considered remote.
10. Prior Year Merger Information.
On January 26, 2018, Industrials Portfolio acquired all of the assets and assumed all of the liabilities of Industrial Equipment Portfolio ("Target Fund") pursuant to an Agreement and Plan of Reorganization approved by the Board of Trustees ("The Board"). The acquisition was accomplished by an exchange of shares then outstanding of the Target Fund at its respective net asset value on the acquisition date. The reorganization provides shareholders of the Target Fund access to a larger portfolio with a similar investment objective. The reorganization qualified as a tax-free reorganization for federal income tax purposes with no gain or loss recognized to the funds or their shareholders. The Target Fund's net assets of $186,045,666, including securities of $186,126,516 and unrealized appreciation of $32,401,431 was combined with the Fund's net assets of $965,428,804 for total net assets after the acquisition of $1,151,474,470.
Pro forma results of operations of the combined entity for the entire period ended February 28, 2018, as though the acquisition had occurred as of the beginning of the year (rather than on the actual acquisition date), are as follows:
| Net investment income (loss) | $6,705,094 |
| Total net realized gain (loss) | 101,913,604 |
| Total change in net unrealized appreciation (depreciation) | 40,445,283 |
| Net increase (decrease) in net assets resulting from operations | $149,063,981 |
Because the combined investment portfolios have been managed as a single portfolio since the acquisition was completed, it is not practicable to separate the amounts of revenue and earnings of the acquired fund that have been included in the Industrial Portfolio's accompanying Statement of Operations since January 26, 2018.
Report of Independent Registered Public Accounting Firm
To the Board of Trustees of Fidelity Select Portfolio and Shareholders of Air Transportation Portfolio, Defense and Aerospace Portfolio, Environment and Alternative Energy Portfolio, Industrials Portfolio, Transportation Portfolio:
Opinions on the Financial Statements
We have audited the accompanying statements of assets and liabilities, including the schedules of investments, of Air Transportation Portfolio, Defense and Aerospace Portfolio, Environment and Alternative Energy Portfolio, Industrials Portfolio and Transportation Portfolio (five of the funds constituting Fidelity Select Portfolio, hereafter collectively referred to as the "Funds") as of February 28, 2019, the related statements of operations for the year ended February 28, 2019, the statements of changes in net assets for each of the two years in the period ended February 28, 2019, including the related notes, and the financial highlights for each of the five years in the period ended February 28, 2019 (collectively referred to as the “financial statements”). In our opinion, the financial statements present fairly, in all material respects, the financial position of each of the Funds as of February 28, 2019, the results of each of their operations for the year then ended, the changes in each of their net assets for each of the two years in the period ended February 28, 2019 and each of the financial highlights for each of the five years in the period ended February 28, 2019 in conformity with accounting principles generally accepted in the United States of America.
Basis for Opinions
These financial statements are the responsibility of the Funds' management. Our responsibility is to express an opinion on the Funds' financial statements based on our audits. We are a public accounting firm registered with the Public Company Accounting Oversight Board (United States) (PCAOB) and are required to be independent with respect to the Funds in accordance with the U.S. federal securities laws and the applicable rules and regulations of the Securities and Exchange Commission and the PCAOB.
We conducted our audits of these financial statements in accordance with the standards of the PCAOB. Those standards require that we plan and perform the audit to obtain reasonable assurance about whether the financial statements are free of material misstatement, whether due to error or fraud.
Our audits included performing procedures to assess the risks of material misstatement of the financial statements, whether due to error or fraud, and performing procedures that respond to those risks. Such procedures included examining, on a test basis, evidence regarding the amounts and disclosures in the financial statements. Our audits also included evaluating the accounting principles used and significant estimates made by management, as well as evaluating the overall presentation of the financial statements. Our procedures included confirmation of securities owned as of February 28, 2019 by correspondence with the custodian, and brokers; when replies were not received from brokers, we performed other auditing procedures. We believe that our audits provide a reasonable basis for our opinions.
PricewaterhouseCoopers LLP
Boston, Massachusetts
April 15, 2019
We have served as the auditor of one or more investment companies in the Fidelity group of funds since 1932.
Trustees and Officers
The Trustees, Members of the Advisory Board (if any), and officers of the trust and funds, as applicable, are listed below. The Board of Trustees governs each fund and is responsible for protecting the interests of shareholders. The Trustees are experienced executives who meet periodically throughout the year to oversee each fund's activities, review contractual arrangements with companies that provide services to each fund, oversee management of the risks associated with such activities and contractual arrangements, and review each fund's performance. Except for Michael E. Wiley, each of the Trustees oversees 287 funds. Mr. Wiley oversees 195 funds.
The Trustees hold office without limit in time except that (a) any Trustee may resign; (b) any Trustee may be removed by written instrument, signed by at least two-thirds of the number of Trustees prior to such removal; (c) any Trustee who requests to be retired or who has become incapacitated by illness or injury may be retired by written instrument signed by a majority of the other Trustees; and (d) any Trustee may be removed at any special meeting of shareholders by a two-thirds vote of the outstanding voting securities of the trust. Each Trustee who is not an interested person (as defined in the 1940 Act) of the trust and the funds is referred to herein as an Independent Trustee. Each Independent Trustee shall retire not later than the last day of the calendar year in which his or her 75th birthday occurs. The Independent Trustees may waive this mandatory retirement age policy with respect to individual Trustees. Officers and Advisory Board Members hold office without limit in time, except that any officer or Advisory Board Member may resign or may be removed by a vote of a majority of the Trustees at any regular meeting or any special meeting of the Trustees. Except as indicated, each individual has held the office shown or other offices in the same company for the past five years.
Each fund’s Statement of Additional Information (SAI) includes more information about the Trustees. To request a free copy, call Fidelity at 1-800-544-8544.
Experience, Skills, Attributes, and Qualifications of the Trustees. The Governance and Nominating Committee has adopted a statement of policy that describes the experience, qualifications, attributes, and skills that are necessary and desirable for potential Independent Trustee candidates (Statement of Policy). The Board believes that each Trustee satisfied at the time he or she was initially elected or appointed a Trustee, and continues to satisfy, the standards contemplated by the Statement of Policy. The Governance and Nominating Committee also engages professional search firms to help identify potential Independent Trustee candidates who have the experience, qualifications, attributes, and skills consistent with the Statement of Policy. From time to time, additional criteria based on the composition and skills of the current Independent Trustees, as well as experience or skills that may be appropriate in light of future changes to board composition, business conditions, and regulatory or other developments, have also been considered by the professional search firms and the Governance and Nominating Committee. In addition, the Board takes into account the Trustees' commitment and participation in Board and committee meetings, as well as their leadership of standing and ad hoc committees throughout their tenure.
In determining that a particular Trustee was and continues to be qualified to serve as a Trustee, the Board has considered a variety of criteria, none of which, in isolation, was controlling. The Board believes that, collectively, the Trustees have balanced and diverse experience, qualifications, attributes, and skills, which allow the Board to operate effectively in governing each fund and protecting the interests of shareholders. Information about the specific experience, skills, attributes, and qualifications of each Trustee, which in each case led to the Board's conclusion that the Trustee should serve (or continue to serve) as a trustee of the funds, is provided below.
Board Structure and Oversight Function. James C. Curvey is an interested person and currently serves as Chairman. The Trustees have determined that an interested Chairman is appropriate and benefits shareholders because an interested Chairman has a personal and professional stake in the quality and continuity of services provided to the funds. Independent Trustees exercise their informed business judgment to appoint an individual of their choosing to serve as Chairman, regardless of whether the Trustee happens to be independent or a member of management. The Independent Trustees have determined that they can act independently and effectively without having an Independent Trustee serve as Chairman and that a key structural component for assuring that they are in a position to do so is for the Independent Trustees to constitute a substantial majority for the Board. The Independent Trustees also regularly meet in executive session. Ned C. Lautenbach serves as Chairman of the Independent Trustees and as such (i) acts as a liaison between the Independent Trustees and management with respect to matters important to the Independent Trustees and (ii) with management prepares agendas for Board meetings.
Fidelity® funds are overseen by different Boards of Trustees. The funds' Board oversees Fidelity's high income and certain equity funds, and other Boards oversee Fidelity's investment-grade bond, money market, asset allocation, and other equity funds. The asset allocation funds may invest in Fidelity® funds overseen by the funds' Board. The use of separate Boards, each with its own committee structure, allows the Trustees of each group of Fidelity® funds to focus on the unique issues of the funds they oversee, including common research, investment, and operational issues. On occasion, the separate Boards establish joint committees to address issues of overlapping consequences for the Fidelity® funds overseen by each Board.
The Trustees operate using a system of committees to facilitate the timely and efficient consideration of all matters of importance to the Trustees, each fund, and fund shareholders and to facilitate compliance with legal and regulatory requirements and oversight of the funds' activities and associated risks. The Board, acting through its committees, has charged SelectCo and its affiliates with (i) identifying events or circumstances the occurrence of which could have demonstrably adverse effects on the funds' business and/or reputation; (ii) implementing processes and controls to lessen the possibility that such events or circumstances occur or to mitigate the effects of such events or circumstances if they do occur; and (iii) creating and maintaining a system designed to evaluate continuously business and market conditions in order to facilitate the identification and implementation processes described in (i) and (ii) above. Because the day-to-day operations and activities of the funds are carried out by or through SelectCo, its affiliates, and other service providers, the funds' exposure to risks is mitigated but not eliminated by the processes overseen by the Trustees. While each of the Board's committees has responsibility for overseeing different aspects of the funds' activities, oversight is exercised primarily through the Operations, Audit, and Compliance Committees. In addition, the Independent Trustees have worked with Fidelity to enhance the Board's oversight of investment and financial risks, legal and regulatory risks, technology risks, and operational risks, including the development of additional risk reporting to the Board. Appropriate personnel, including but not limited to the funds' Chief Compliance Officer (CCO), SelectCo's internal auditor, the independent accountants, the funds' Treasurer and portfolio management personnel, make periodic reports to the Board's committees, as appropriate, including an annual review of Fidelity's risk management program for the Fidelity® funds. The responsibilities of each standing committee, including their oversight responsibilities, are described further under "Standing Committees of the Trustees."
Interested Trustees*:
Correspondence intended for a Trustee who is an interested person may be sent to Fidelity Investments, 245 Summer Street, Boston, Massachusetts 02210.
Name, Year of Birth; Principal Occupations and Other Relevant Experience+
James C. Curvey (1935)
Year of Election or Appointment: 2018
Trustee
Chairman of the Board of Trustees
Mr. Curvey also serves as Trustee of other Fidelity® funds. Mr. Curvey is Vice Chairman (2007-present) and Director of FMR LLC (diversified financial services company). In addition, Mr. Curvey is an Overseer Emeritus for the Boston Symphony Orchestra, a Director of Artis-Naples, and a Trustee of Brewster Academy in Wolfeboro, New Hampshire. Previously, Mr. Curvey served as a Director of Fidelity Research & Analysis Co. (investment adviser firm, 2009-2018), Director of Fidelity Investments Money Management, Inc. (investment adviser firm, 2009-2014) and a Director of FMR and FMR Co., Inc. (investment adviser firms, 2007-2014).
* Determined to be an "Interested Trustee" by virtue of, among other things, his or her affiliation with the trust or various entities under common control with SelectCo.
+ The information includes the Trustee's principal occupation during the last five years and other information relating to the experience, attributes, and skills relevant to the Trustee's qualifications to serve as a Trustee, which led to the conclusion that the Trustee should serve as a Trustee for each fund.
Independent Trustees:
Correspondence intended for an Independent Trustee may be sent to Fidelity Investments, P.O. Box 55235, Boston, Massachusetts 02205-5235.
Name, Year of Birth; Principal Occupations and Other Relevant Experience+
Dennis J. Dirks (1948)
Year of Election or Appointment: 2018
Trustee
Mr. Dirks also serves as Trustee of other Fidelity® funds. Prior to his retirement in May 2003, Mr. Dirks was Chief Operating Officer and a member of the Board of The Depository Trust & Clearing Corporation (DTCC). He also served as President, Chief Operating Officer, and Board member of The Depository Trust Company (DTC) and President and Board member of the National Securities Clearing Corporation (NSCC). In addition, Mr. Dirks served as Chief Executive Officer and Board member of the Government Securities Clearing Corporation, Chief Executive Officer and Board member of the Mortgage-Backed Securities Clearing Corporation, as a Trustee and a member of the Finance Committee of Manhattan College (2005-2008), as a Trustee and a member of the Finance Committee of AHRC of Nassau County (2006-2008), as a member of the Independent Directors Council (IDC) Governing Council (2010-2015), and as a member of the Board of Directors for The Brookville Center for Children’s Services, Inc. (2009-2017). Mr. Dirks is a member of the Finance Committee (2016-present) and Board of Directors (2017-present) and is Treasurer (2018-present) of the Asolo Repertory Theatre.
Donald F. Donahue (1950)
Year of Election or Appointment: 2018
Trustee
Mr. Donahue also serves as a Trustee of other Fidelity® funds. Mr. Donahue is President and Chief Executive Officer of Miranda Partners, LLC (risk consulting for the financial services industry, 2012-present). Previously, Mr. Donahue served as a Member of the Advisory Board of certain Fidelity® funds (2015-2018) and Chief Executive Officer (2006-2012), Chief Operating Officer (2003-2006), and Managing Director, Customer Marketing and Development (1999-2003) of The Depository Trust & Clearing Corporation (financial markets infrastructure). Mr. Donahue serves as a Member (2007-present) and Co-Chairman (2016-present) of the Board of Directors of United Way of New York, Member of the Board of Directors of NYC Leadership Academy (2012-present) and Member of the Board of Advisors of Ripple Labs, Inc. (financial services, 2015-present). He also served as Chairman (2010-2012) and Member of the Board of Directors (2012-2013) of Omgeo, LLC (financial services), Treasurer of United Way of New York (2012-2016), and Member of the Board of Directors of XBRL US (financial services non-profit, 2009-2012) and the International Securities Services Association (2009-2012).
Alan J. Lacy (1953)
Year of Election or Appointment: 2018
Trustee
Mr. Lacy also serves as Trustee of other Fidelity® funds. Mr. Lacy serves as a Director of Bristol-Myers Squibb Company (global pharmaceuticals, 2008-present). He is a Trustee of the California Chapter of The Nature Conservancy (2015-present) and a Director of the Center for Advanced Study in the Behavioral Sciences at Stanford University (2015-present). In addition, Mr. Lacy served as Senior Adviser (2007-2014) of Oak Hill Capital Partners, L.P. (private equity) and also served as Chief Executive Officer (2005) and Vice Chairman (2005-2006) of Sears Holdings Corporation (retail) and Chief Executive Officer and Chairman of the Board of Sears, Roebuck and Co. (retail, 2000-2005). Previously, Mr. Lacy served as Chairman (2014-2017) and a member (2010-2017) of the Board of Directors of Dave & Buster’s Entertainment, Inc. (restaurant and entertainment complexes), as Chairman (2008-2011) and a member (2006-2015) of the Board of Trustees of the National Parks Conservation Association, and as a member of the Board of Directors for The Hillman Companies, Inc. (hardware wholesalers, 2010-2014), Earth Fare, Inc. (retail grocery, 2010-2014), and The Western Union Company (global money transfer, 2006-2011).
Ned C. Lautenbach (1944)
Year of Election or Appointment: 2018
Trustee
Chairman of the Independent Trustees
Mr. Lautenbach also serves as Trustee of other Fidelity® funds. Mr. Lautenbach currently serves as Chair (2018-present) and Member (2013-present) of the Board of Governors, State University System of Florida and is a member of the Council on Foreign Relations (1994-present). He is also a member and has most recently served as Chairman of the Board of Directors of Artis-Naples (2012-present). Previously, Mr. Lautenbach served as a member and then Lead Director of the Board of Directors of Eaton Corporation (diversified industrial, 1997-2016). He was also a Partner and Advisory Partner at Clayton, Dubilier & Rice, LLC (private equity investment, 1998-2010), as well as a Director of Sony Corporation (2006-2007). In addition, Mr. Lautenbach also had a 30-year career with IBM (technology company) during which time he served as Senior Vice President and a member of the Corporate Executive Committee (1968-1998).
Joseph Mauriello (1944)
Year of Election or Appointment: 2018
Trustee
Mr. Mauriello also serves as Trustee of other Fidelity® funds. Prior to his retirement in January 2006, Mr. Mauriello served in numerous senior management positions including Deputy Chairman and Chief Operating Officer (2004-2005), and Vice Chairman of Financial Services (2002-2004) of KPMG LLP US (professional services, 1965-2005). Mr. Mauriello currently serves as a member of the Independent Directors Council (IDC) Governing Council (2015-present). Previously, Mr. Mauriello served as a member of the Board of Directors of XL Group plc. (global insurance and re-insurance, 2006-2018).
Cornelia M. Small (1944)
Year of Election or Appointment: 2018
Trustee
Ms. Small also serves as Trustee of other Fidelity® funds. Ms. Small is a member of the Board of Directors (2009-present) and Chair of the Investment Committee (2010-present) of the Teagle Foundation. Ms. Small also serves on the Investment Committee of the Berkshire Taconic Community Foundation (2008-present). Previously, Ms. Small served as Chairperson (2002-2008) and a member of the Investment Committee and Chairperson (2008-2012) and a member of the Board of Trustees of Smith College. In addition, Ms. Small served as Chief Investment Officer, Director of Global Equity Investments, and a member of the Board of Directors of Scudder, Stevens & Clark and Scudder Kemper Investments.
Garnett A. Smith (1947)
Year of Election or Appointment: 2013
Trustee
Mr. Smith also serves as Trustee of other Fidelity® funds. Prior to Mr. Smith's retirement, he served as Chairman and Chief Executive Officer of Inbrand Corp. (manufacturer of personal absorbent products, 1990-1997). He also served as President (1986-1990) of Inbrand Corp. Prior to his employment with Inbrand Corp., he was employed by a retail fabric chain and North Carolina National Bank. In addition, Mr. Smith served as a Member of the Advisory Board of certain Fidelity® funds (2012-2013) and as a board member of the Jackson Hole Land Trust (2009-2012).
David M. Thomas (1949)
Year of Election or Appointment: 2018
Trustee
Mr. Thomas also serves as Trustee of other Fidelity® funds. Mr. Thomas serves as Non-Executive Chairman of the Board of Directors of Fortune Brands Home and Security (home and security products, 2011-present) and as a member of the Board of Directors (2004-present) and Presiding Director (2013-present) of Interpublic Group of Companies, Inc. (marketing communication). Previously, Mr. Thomas served as Executive Chairman (2005-2006) and Chairman and Chief Executive Officer (2000-2005) of IMS Health, Inc. (pharmaceutical and healthcare information solutions), a Director of Fortune Brands, Inc. (consumer products, 2000-2011), and a member of the Board of Trustees of the University of Florida (2013-2018).
Michael E. Wiley (1950)
Year of Election or Appointment: 2008
Trustee
Mr. Wiley also serves as Trustee or Member of the Advisory Board of other Fidelity® funds. Mr. Wiley serves as a Director of High Point Resources (exploration and production, 2005-present). Previously, Mr. Wiley served as a Director of Andeavor Corporation (independent oil refiner and marketer, 2005-2018), a Director of Andeavor Logistics LP (natural resources logistics, 2015-2018), a Director of Post Oak Bank (privately-held bank, 2004-2018), a Director of Asia Pacific Exploration Consolidated (international oil and gas exploration and production, 2008-2013), a member of the Board of Trustees of the University of Tulsa (2000-2006; 2007-2010), a Senior Energy Advisor of Katzenbach Partners, LLC (consulting, 2006-2007), an Advisory Director of Riverstone Holdings (private investment), a Director of Spinnaker Exploration Company (exploration and production, 2001-2005) and Chairman, President, and CEO of Baker Hughes, Inc. (oilfield services, 2000-2004).
+ The information includes the Trustee's principal occupation during the last five years and other information relating to the experience, attributes, and skills relevant to the Trustee's qualifications to serve as a Trustee, which led to the conclusion that the Trustee should serve as a Trustee for each fund.
Advisory Board Members and Officers:
Correspondence intended for a Member of the Advisory Board (if any) may be sent to Fidelity Investments, P.O. Box 55235, Boston, Massachusetts 02205-5235. Correspondence intended for an officer or Peter S. Lynch may be sent to Fidelity Investments, 245 Summer Street, Boston, Massachusetts 02210. Officers appear below in alphabetical order.
Name, Year of Birth; Principal Occupation
Vicki L. Fuller (1957)
Year of Election or Appointment: 2018
Member of the Advisory Board
Ms. Fuller also serves as Member of the Advisory Board of other Fidelity® funds. Ms. Fuller serves as a member of the Board of Directors, Audit Committee, and Nominating and Governance Committee of The Williams Companies, Inc. (natural gas infrastructure, 2018-present). Previously, Ms. Fuller served as the Chief Investment Officer of the New York State Common Retirement Fund (2012-2018) and held a variety of positions at AllianceBernstein L.P. (global asset management, 1985-2012), including Managing Director (2006-2012) and Senior Vice President and Senior Portfolio Manager (2001-2006).
Peter S. Lynch (1944)
Year of Election or Appointment: 2018
Member of the Advisory Board
Mr. Lynch also serves as Member of the Advisory Board of other Fidelity® funds. Mr. Lynch is Vice Chairman and a Director of FMR (investment adviser firm) and FMR Co., Inc. (investment adviser firm). In addition, Mr. Lynch serves as a Trustee of Boston College and as the Chairman of the Inner-City Scholarship Fund. Previously, Mr. Lynch served on the Special Olympics International Board of Directors (1997-2006).
Carol B. Tomé (1957)
Year of Election or Appointment: 2017
Member of the Advisory Board
Ms. Tomé also serves as Member of the Advisory Board of other Fidelity® funds. Ms. Tomé is Chief Financial Officer (2001-present) and Executive Vice President of Corporate Services (2007-present) of The Home Depot, Inc. (home improvement retailer) and a Director (2003-present) and Chair of the Audit Committee (2004-present) of United Parcel Service, Inc. (package delivery and supply chain management). Previously, Ms. Tomé served as Trustee of certain Fidelity® funds (2017), Senior Vice President of Finance and Accounting/Treasurer (2000-2007) and Vice President and Treasurer (1995-2000) of The Home Depot, Inc. and Chair of the Board (2010-2012), Vice Chair of the Board (2009 and 2013), and a Director (2008-2013) of the Federal Reserve Bank of Atlanta. Ms. Tomé is also a director or trustee of many community and professional organizations.
Elizabeth Paige Baumann (1968)
Year of Election or Appointment: 2017
Anti-Money Laundering (AML) Officer
Ms. Baumann also serves as AML Officer of other funds. She is Chief AML Officer (2012-present) and Senior Vice President (2014-present) of FMR LLC (diversified financial services company) and is an employee of Fidelity Investments. Previously, Ms. Baumann served as AML Officer of the funds (2012-2016), and Vice President (2007-2014) and Deputy Anti-Money Laundering Officer (2007-2012) of FMR LLC.
Craig S. Brown (1977)
Year of Election or Appointment: 2019
Assistant Treasurer
Mr. Brown also serves as Assistant Treasurer of other funds. Mr. Brown is an employee of Fidelity Investments (2013-present).
John J. Burke III (1964)
Year of Election or Appointment: 2018
Chief Financial Officer
Mr. Burke also serves as Chief Financial Officer of other funds. Mr. Burke serves as Head of Investment Operations for Fidelity Fund and Investment Operations (2018-present) and is an employee of Fidelity Investments (1998-present). Previously Mr. Burke served as head of Asset Management Investment Operations (2012-2018).
William C. Coffey (1969)
Year of Election or Appointment: 2018
Secretary and Chief Legal Officer (CLO)
Mr. Coffey also serves as Secretary and CLO of other funds. Mr. Coffey serves as CLO, Secretary, and Senior Vice President of Fidelity Management & Research Company and FMR Co., Inc. (investment adviser firms, 2018-present); Secretary of Fidelity SelectCo, LLC and Fidelity Investments Money Management, Inc. (investment adviser firms, 2018-present); and CLO of Fidelity Management & Research (Hong Kong) Limited, FMR Investment Management (UK) Limited, and Fidelity Management & Research (Japan) Limited (investment adviser firms, 2018-present). He is Senior Vice President and Deputy General Counsel of FMR LLC (diversified financial services company, 2010-present), and is an employee of Fidelity Investments. Previously, Mr. Coffey served as Assistant Secretary of certain funds (2009-2018) and as Vice President and Associate General Counsel of FMR LLC (2005-2009).
Timothy M. Cohen (1969)
Year of Election or Appointment: 2018
Vice President
Mr. Cohen also serves as Vice President of other funds. Mr. Cohen serves as Co-Head of Global Equity Research (2016-present), a Director of Fidelity Management & Research (Japan) Limited (investment adviser firm, 2016-present), and is an employee of Fidelity Investments. Previously, Mr. Cohen served as Chief Investment Officer - Equity and a Director of Fidelity Management & Research (U.K.) Inc. (investment adviser firm, 2013-2015) and as a Director of Fidelity Management & Research (Hong Kong) Limited (investment adviser firm, 2017).
Jonathan Davis (1968)
Year of Election or Appointment: 2010
Assistant Treasurer
Mr. Davis also serves as Assistant Treasurer of other funds. Mr. Davis serves as Assistant Treasurer of FMR Capital, Inc. (2017-present) and is an employee of Fidelity Investments. Previously, Mr. Davis served as Vice President and Associate General Counsel of FMR LLC (diversified financial services company, 2003-2010).
Adrien E. Deberghes (1967)
Year of Election or Appointment: 2018
Assistant Treasurer
Mr. Deberghes also serves as an officer of other funds. He serves as Assistant Treasurer of FMR Capital, Inc. (2017-present), Executive Vice President of Fidelity Investments Money Management, Inc. (FIMM) (investment adviser firm, 2016-present), and is an employee of Fidelity Investments (2008-present). Previously, Mr. Deberghes served as President and Treasurer of certain Fidelity® funds (2013-2018). Prior to joining Fidelity Investments, Mr. Deberghes was Senior Vice President of Mutual Fund Administration at State Street Corporation (2007-2008), Senior Director of Mutual Fund Administration at Investors Bank & Trust (2005-2007), and Director of Finance for Dunkin' Brands (2000-2005). Previously, Mr. Deberghes served in other fund officer roles.
Laura M. Del Prato (1964)
Year of Election or Appointment: 2018
Assistant Treasurer
Ms. Del Prato also serves as an officer of other funds. Ms. Del Prato is an employee of Fidelity Investments (2017-present). Prior to joining Fidelity Investments, Ms. Del Prato served as a Managing Director and Treasurer of the JPMorgan Mutual Funds (2014-2017). Prior to JPMorgan, Ms. Del Prato served as a partner at Cohen Fund Audit Services (accounting firm, 2012-2013) and KPMG LLP (accounting firm, 2004-2012).
Colm A. Hogan (1973)
Year of Election or Appointment: 2018
Deputy Treasurer
Mr. Hogan also serves as an officer of other funds. Mr. Hogan serves as Assistant Treasurer of FMR Capital, Inc. (2017-present) and is an employee of Fidelity Investments (2005-present). Previously, Mr. Hogan served as Assistant Treasurer of certain Fidelity® funds (2016-2018).
Pamela R. Holding (1964)
Year of Election or Appointment: 2018
Vice President
Ms. Holding also serves as Vice President of other funds. Ms. Holding serves as Co-Head of Global Equity Research (2018-present) and is an employee of Fidelity Investments (2013-present).
Chris Maher (1972)
Year of Election or Appointment: 2013
Assistant Treasurer
Mr. Maher serves as Assistant Treasurer of other funds. Mr. Maher is Vice President of Valuation Oversight, serves as Assistant Treasurer of FMR Capital, Inc. (2017-present), and is an employee of Fidelity Investments. Previously, Mr. Maher served as Vice President of Asset Management Compliance (2013), Vice President of the Program Management Group of FMR (investment adviser firm, 2010-2013), and Vice President of Valuation Oversight (2008-2010).
Kenneth B. Robins (1969)
Year of Election or Appointment: 2018
Chief Compliance Officer
Mr. Robins also serves as an officer of other funds. Mr. Robins serves as Compliance Officer of Fidelity Management & Research Company and FMR Co., Inc. (investment adviser firms, 2016-present) and is an employee of Fidelity Investments (2004-present). Previously, Mr. Robins served as Executive Vice President of Fidelity Investments Money Management, Inc. (investment adviser firm, 2013-2016) and served in other fund officer roles.
Stacie M. Smith (1974)
Year of Election or Appointment: 2018
President and Treasurer
Ms. Smith also serves as an officer of other funds. Ms. Smith serves as Assistant Treasurer of FMR Capital, Inc. (2017-present), is an employee of Fidelity Investments (2009-present), and has served in other fund officer roles. Prior to joining Fidelity Investments, Ms. Smith served as Senior Audit Manager of Ernst & Young LLP (accounting firm, 1996-2009). Previously, Ms. Smith served as Assistant Treasurer (2013-2018) and Deputy Treasurer (2013-2016) of certain Fidelity® funds.
Marc L. Spector (1972)
Year of Election or Appointment: 2017
Assistant Treasurer
Mr. Spector also serves as an officer of other funds. Mr. Spector serves as Assistant Treasurer of FMR Capital, Inc. (2017-present) and is an employee of Fidelity Investments (2016-present). Prior to joining Fidelity Investments, Mr. Spector served as Director at the Siegfried Group (accounting firm, 2013-2016), and prior to Siegfried Group as audit senior manager at Deloitte & Touche (accounting firm, 2005-2013).
Jim Wegmann (1979)
Year of Election or Appointment: 2019
Assistant Treasurer
Mr. Wegmann also serves as Assistant Treasurer of other funds. Mr. Wegmann is an employee of Fidelity Investments (2011-present).
Shareholder Expense Example
As a shareholder of a Fund, you incur two types of costs: (1) transaction costs, and (2) ongoing costs, including management fees and other Fund expenses. This Example is intended to help you understand your ongoing costs (in dollars) of investing in the Funds and to compare these costs with the ongoing costs of investing in other mutual funds.
The Example is based on an investment of $1,000 invested at the beginning of the period and held for the entire period (September 1, 2018 to February 28, 2019).
Actual Expenses
The first line of the accompanying table for each fund provides information about actual account values and actual expenses. You may use the information in this line, together with the amount you invested, to estimate the expenses that you paid over the period. Simply divide your account value by $1,000.00 (for example, an $8,600 account value divided by $1,000.00 = 8.6), then multiply the result by the number in the first line under the heading entitled "Expenses Paid During Period" to estimate the expenses you paid on your account during this period. In addition, each Fund, as a shareholder in the underlying Fidelity Central Funds, will indirectly bear its pro-rata share of the fees and expenses incurred by the underlying Fidelity Central Funds. These fees and expenses are not included in the Fund's annualized expense ratio used to calculate the expense estimate in the table below.
Hypothetical Example for Comparison Purposes
The second line of the accompanying table for each fund provides information about hypothetical account values and hypothetical expenses based on a fund's actual expense ratio and an assumed rate of return of 5% per year before expenses, which is not the Fund's actual return. The hypothetical account values and expenses may not be used to estimate the actual ending account balance or expenses you paid for the period. You may use this information to compare the ongoing costs of investing in the Fund and other funds. To do so, compare this 5% hypothetical example with the 5% hypothetical examples that appear in the shareholder reports of the other funds. In addition, each Fund, as a shareholder in the underlying Fidelity Central Funds, will indirectly bear its pro-rata share of the fees and expenses incurred by the underlying Fidelity Central Funds. These fees and expenses are not included in the Fund's annualized expense ratio used to calculate the expense estimate in the table below.
Please note that the expenses shown in the table are meant to highlight your ongoing costs only and do not reflect any transaction costs. Therefore, the second line of the table is useful in comparing ongoing costs only, and will not help you determine the relative total costs of owning different funds. In addition, if these transactional costs were included, your costs would have been higher.
| | Annualized Expense RatioA | Beginning
Account Value
September 1, 2018 | Ending
Account Value
February 28, 2019 | Expenses Paid
During Period-B
September 1, 2018
to February 28, 2019 |
| Air Transportation Portfolio | .81% | | | |
| Actual | | $1,000.00 | $977.60 | $3.97 |
| Hypothetical-C | | $1,000.00 | $1,020.78 | $4.06 |
| Defense and Aerospace Portfolio | .75% | | | |
| Actual | | $1,000.00 | $1,038.00 | $3.79 |
| Hypothetical-C | | $1,000.00 | $1,021.08 | $3.76 |
| Environment and Alternative Energy Portfolio | .86% | | | |
| Actual | | $1,000.00 | $1,003.00 | $4.27 |
| Hypothetical-C | | $1,000.00 | $1,020.53 | $4.31 |
| Industrials Portfolio | .77% | | | |
| Actual | | $1,000.00 | $972.60 | $3.77 |
| Hypothetical-C | | $1,000.00 | $1,020.98 | $3.86 |
| Transportation Portfolio | .79% | | | |
| Actual | | $1,000.00 | $946.40 | $3.81 |
| Hypothetical-C | | $1,000.00 | $1,020.88 | $3.96 |
A Annualized expense ratio reflects expenses net of applicable fee waivers.
B Expenses are equal to each Fund's annualized expense ratio, multiplied by the average account value over the period, multiplied by 181/ 365 (to reflect the one-half year period).
C 5% return per year before expenses
Distributions (Unaudited)
The Board of Trustees of each fund voted to pay to shareholders of record at the opening of business on record date, the following distributions per share derived from capital gains realized from sales of portfolio securities, and dividends derived from net investment income:
| | Pay Date | Record Date | Dividends | Capital Gains |
| Air Transportation Portfolio | 04/15/19 | 04/12/19 | $0.150 | $0.598 |
| Defense and Aerospace Portfolio | 04/15/19 | 04/12/19 | $0.000 | $0.000 |
| Environment and Alternative Energy Portfolio | 04/15/19 | 04/12/19 | $0.048 | $0.351 |
| Industrials Portfolio | 04/15/19 | 04/12/19 | $0.000 | $0.000 |
| Transportation Portfolio | 04/15/19 | 04/12/19 | $0.245 | $2.581 |
|
The funds hereby designate as capital gain dividend the amounts noted below for the taxable year ended February 28, 2019, or, if subsequently determined to be different, the net capital gain of such year.
| Air Transportation Portfolio | $18,041,234 |
| Defense and Aerospace Portfolio | $164,074,768 |
| Environment and Alternative Energy Portfolio | $7,610,264 |
| Industrials Portfolio | $22,062,036 |
| Transportation Portfolio | $36,601,525 |
|
A percentage of the dividends distributed during the fiscal year for the following funds qualify for the dividends–received deduction for corporate shareholders:
| | April 2018 | December 2018 |
| Air Transportation Portfolio | 13% | 100% |
| Defense and Aerospace Portfolio | 28% | 100% |
| Environment and Alternative Energy Portfolio | 27% | 100% |
| Industrials Portfolio | 90% | 100% |
| Transportation Portfolio | 100% | 100% |
|
A percentage of the dividends distributed during the fiscal year for the following funds may be taken into account as a dividend for purposes of the maximum rate under section 1(h)(11) of the Internal Revenue Code.
| | April 2018 | December 2018 |
| Air Transportation Portfolio | 13% | 100% |
| Defense and Aerospace Portfolio | 34% | 100% |
| Environment and Alternative Energy Portfolio | 44% | 100% |
| Industrials Portfolio | 98% | 100% |
| Transportation Portfolio | 100% | 100% |
|
The funds will notify shareholders in January 2020 of amounts for use in preparing 2019 income tax returns.
Board Approval of Investment Advisory Contracts and Management Fees
Air Transportation Portfolio
Defense and Aerospace Portfolio
Environment and Alternative Energy Portfolio
Industrials Portfolio
Transportation Portfolio
Each year, the Board of Trustees, including the Independent Trustees (together, the Board), votes on the renewal of the management contract with Fidelity SelectCo, LLC (SelectCo), an affiliate of Fidelity Management & Research Company (FMR), and the sub-advisory agreements with affiliates of FMR (together, the Advisory Contracts) for each fund. SelectCo and the sub-advisers are referred to herein as the Investment Advisers. The Board, assisted by the advice of fund counsel and Independent Trustees' counsel, requests and considers a broad range of information relevant to the renewal of the Advisory Contracts throughout the year.
The Board meets regularly and, at each of its meetings, covers an extensive agenda of topics and materials and considers factors that are relevant to its annual consideration of the renewal of each fund's Advisory Contracts, including the services and support provided to each fund and its shareholders. The Board has established various standing committees (Committees), each composed of and chaired by Independent Trustees with varying backgrounds, to which the Board has assigned specific subject matter responsibilities in order to enhance effective decision-making by the Board. The Board, acting directly and through its Committees, requests and receives information concerning the annual consideration of the renewal of each fund's Advisory Contracts. The Board also meets as needed to review matters specifically related to the Board's annual consideration of the renewal of the Advisory Contracts. Members of the Board may also meet with trustees of other Fidelity funds through joint ad hoc committees to discuss certain matters relevant to all of the Fidelity funds.
At its January 2019 meeting, the Board unanimously determined to renew each fund's Advisory Contracts. In reaching its determination, the Board considered all factors it believed relevant, including (i) the nature, extent, and quality of the services to be provided to each fund and its shareholders (including the investment performance of each fund); (ii) the competitiveness of each fund's management fee and total expense ratio relative to peer funds; (iii) the total costs of the services to be provided by and the profits to be realized by Fidelity from its relationships with each fund; and (iv) the extent to which, if any, economies of scale exist and would be realized as each fund grows, and whether any economies of scale are appropriately shared with fund shareholders.
In considering whether to renew the Advisory Contracts for each fund, the Board reached a determination, with the assistance of fund counsel and Independent Trustees' counsel and through the exercise of its business judgment, that the renewal of the Advisory Contracts was in the best interests of each fund and its shareholders and that the compensation payable under the Advisory Contracts was fair and reasonable. The Board's decision to renew the Advisory Contracts was not based on any single factor, but rather was based on a comprehensive consideration of all the information provided to the Board at its meetings throughout the year. The Board, in reaching its determination to renew the Advisory Contracts, was aware that shareholders of each fund have a broad range of investment choices available to them, including a wide choice among funds offered by Fidelity's competitors, and that each fund's shareholders, who have the opportunity to review and weigh the disclosure provided by the fund in its prospectus and other public disclosures, have chosen to invest in that fund, which is part of the Fidelity family of funds.
Nature, Extent, and Quality of Services Provided. The Board considered Fidelity's staffing as it relates to the funds, including the backgrounds of investment personnel of Fidelity, and also considered the funds' investment objectives, strategies, and related investment philosophies. The Independent Trustees also had discussions with senior management of Fidelity's investment operations and investment groups. The Board considered the structure of the investment personnel compensation program and whether this structure provides appropriate incentives to act in the best interests of each fund. Additionally, the Board considered the portfolio managers' investments, if any, in the funds that they manage.
Resources Dedicated to Investment Management and Support Services. The Board and the Fund Oversight and Research Committees reviewed the general qualifications and capabilities of Fidelity's investment staff, including its size, education, experience, and resources, as well as Fidelity's approach to recruiting, training, managing, and compensating investment personnel. The Board noted that Fidelity has continued to increase the resources devoted to non-U.S. offices, including expansion of Fidelity's global investment organization. The Board also noted that Fidelity's analysts have extensive resources, tools and capabilities that allow them to conduct sophisticated quantitative and fundamental analysis, as well as credit analysis of issuers, counterparties and guarantors. Further, the Board considered that Fidelity's investment professionals have sufficient access to global information and data so as to provide competitive investment results over time, and that those professionals also have access to sophisticated tools that permit them to assess portfolio construction and risk and performance attribution characteristics continuously, as well as to transmit new information and research conclusions rapidly around the world. Additionally, in its deliberations, the Board considered Fidelity's trading, risk management, compliance, and technology and operations capabilities and resources, which are integral parts of the investment management process.
Shareholder and Administrative Services. The Board considered (i) the nature, extent, quality, and cost of advisory, administrative, and shareholder services performed by the Investment Advisers and their affiliates under the Advisory Contracts and under separate agreements covering transfer agency, pricing and bookkeeping, and securities lending services for each fund; (ii) the nature and extent of the supervision of third party service providers, principally custodians, subcustodians, and pricing vendors; and (iii) the resources devoted to, and the record of compliance with, each fund's compliance policies and procedures. The Board also reviewed the allocation of fund brokerage, including allocations to brokers affiliated with the Investment Advisers, the use of brokerage commissions to pay fund expenses, and the use of "soft" commission dollars to pay for research services.
The Board noted that the growth of fund assets over time across the complex allows Fidelity to reinvest in the development of services designed to enhance the value and convenience of the Fidelity funds as investment vehicles. These services include 24-hour access to account information and market information through telephone representatives and over the Internet, investor education materials and asset allocation tools, and the expanded availability of Fidelity Investor Centers.
The Board noted that it and the boards of certain other Fidelity funds had formed an ad hoc Committee on Transfer Agency Fees to review the variety of transfer agency fee structures throughout the industry and Fidelity's competitive positioning with respect to industry participants.
Investment in a Large Fund Family. The Board considered the benefits to shareholders of investing in a Fidelity fund, including the benefits of investing in a fund that is part of a large family of funds offering a variety of investment disciplines and providing a large variety of mutual fund investor services. The Board noted that Fidelity had taken, or had made recommendations that resulted in the Fidelity funds taking, a number of actions over the previous year that benefited particular funds, including: (i) continuing to dedicate additional resources to Fidelity's investment research process, which includes meetings with management of issuers of securities in which the funds invest, and to the support of the senior management team that oversees asset management; (ii) continuing efforts to enhance Fidelity's global research capabilities; (iii) launching new funds and making other enhancements to meet client needs; (iv) launching new share classes of existing funds; (v) eliminating purchase minimums and broadening eligibility requirements for certain funds and share classes; (vi) reducing management fees and total expenses for certain growth equity funds and index funds; (vii) lowering expense caps for certain existing funds and classes, and converting certain voluntary expense caps to contractual caps, to reduce expenses borne by shareholders; (viii) eliminating short-term redemption fees for funds that had such fees; (ix) rationalizing product lines and gaining increased efficiencies from fund mergers and share class consolidations; (x) continuing to develop, acquire and implement systems and technology to improve services to the funds and shareholders, strengthen information security, and increase efficiency; and (xi) continuing to implement enhancements to further strengthen Fidelity's product line to increase investors' probability of success in achieving their investment goals, including retirement income goals.
Investment Performance. The Board considered whether each fund has operated in accordance with its investment objective, as well as its record of compliance with its investment restrictions and its performance history. The Industrials Portfolio had a portfolio manager change in November 2018. The Board will continue to monitor closely each fund's performance, taking into account the portfolio manager change.
The Board took into account discussions that occur at Board meetings throughout the year with representatives of the Investment Advisers about fund investment performance. In this regard the Board noted that as part of regularly scheduled fund reviews and other reports to the Board on fund performance, the Board considers annualized return information for each fund for different time periods, measured against an appropriate securities market index ("benchmark index"). In its evaluation of fund investment performance, the Board gave particular attention to information indicating changes in performance of certain Fidelity funds for specific time periods and discussed with the Investment Advisers the reasons for any overperformance or underperformance.
In addition to reviewing absolute and relative fund performance, the Independent Trustees periodically consider the appropriateness of fund performance metrics in evaluating the results achieved. In general, the Independent Trustees believe that fund performance should be evaluated based on net performance (after fees and expenses) of both the highest performing and lowest performing fund share classes, where applicable, compared to appropriate benchmark indices, over appropriate time periods that may include full market cycles, taking into account relevant factors including the following: general market conditions; issuer-specific information; and fund cash flows and other factors.
The Independent Trustees recognize that shareholders evaluate performance on a net basis over their own holding periods, for which one-, three-, and five-year periods are often used as a proxy. For this reason, the performance information reviewed by the Board also included net cumulative total return information for each fund and an appropriate benchmark index for the most recent one-, three-, and five-year periods ended June 30, 2018, as shown below.
Air Transportation Portfolio
The Board considered the fund's underperformance for different time periods based on the June 30, 2018 data presented above and based on earlier periods ended prior to June 30, 2018. The Board noted that the fund's underperformance has continued since the Board approved the management contract in 2018. The Board's discussions with SelectCo regarding underperformance cover topics including, but not limited to: the longer-term track record of a fund's portfolio manager(s); broader trends in the market that may adversely impact a fund's performance; attribution reports on contributors to the fund's underperformance; and the applicable portfolio manager's explanation of his or her underperformance. The Board engages with SelectCo on steps that might be taken to address a fund's underperformance. For a fund with underperformance over longer periods of time, the Board typically monitors the effect of any remedial actions and other relevant factors.
Defense and Aerospace Portfolio
The Board considered the fund's underperformance for different time periods based on the June 30, 2018 data presented above and based on earlier periods ended prior to June 30, 2018. The Board noted that the fund's underperformance has continued since the Board approved the management contract in 2017 and 2018. The Board's discussions with SelectCo regarding underperformance cover topics including, but not limited to: the longer-term track record of a fund's portfolio manager(s); broader trends in the market that may adversely impact a fund's performance; attribution reports on contributors to the fund's underperformance; and the applicable portfolio manager's explanation of his or her underperformance. The Board engages with SelectCo on steps that might be taken to address a fund's underperformance. For a fund with underperformance over longer periods of time, the Board typically monitors the effect of any remedial actions and other relevant factors.
Environment and Alternative Energy Portfolio
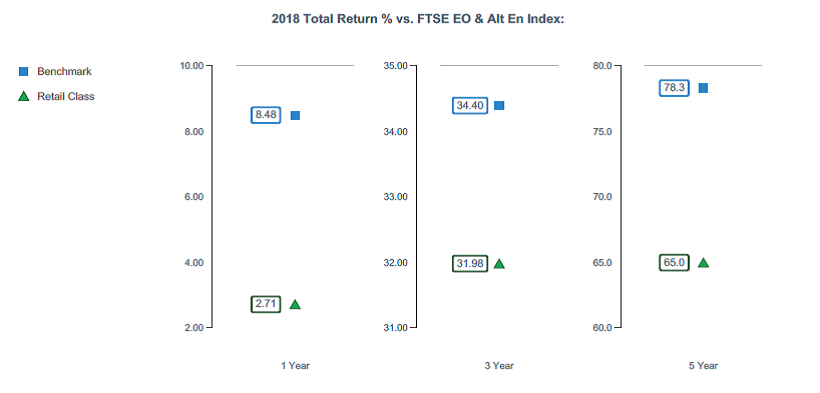
The Board considered the fund’s underperformance for different time periods based on the June 30, 2018 data presented above and based on earlier periods ended prior to June 30, 2018. The Board noted that the fund’s underperformance has continued since the Board approved the management contract in 2017 and 2018. The Board’s discussions with SelectCo regarding underperformance cover topics including, but not limited to: the longer-term track record of a fund’s portfolio manager(s); broader trends in the market that may adversely impact a fund’s performance; attribution reports on contributors to the fund’s underperformance; and the applicable portfolio manager’s explanation of his or her underperformance. The Board engages with SelectCo on steps that might be taken to address a fund’s underperformance. For a fund with underperformance over longer periods of time, the Board typically monitors the effect of any remedial actions and other relevant factors.
Industrials Portfolio
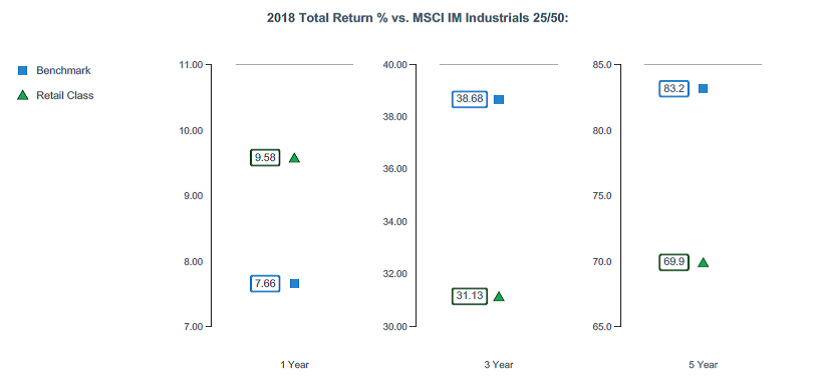
The Board considered the fund's underperformance for different time based on time periods ended prior to June 30, 2018 (which periods are not shown in the chart above). The Board noted that the fund's underperformance has continued since the Board approved the management contract in 2017 and 2018. The Board's discussions with SelectCo regarding underperformance cover topics including, but not limited to: the longer-term track record of a fund's portfolio manager(s); broader trends in the market that may adversely impact a fund's performance; attribution reports on contributors to the fund's underperformance; and the applicable portfolio manager's explanation of his or her underperformance. The Board engages with SelectCo on steps that might be taken to address a fund's underperformance. The Board noted that the fund's more recent performance had improved.
Transportation Portfolio
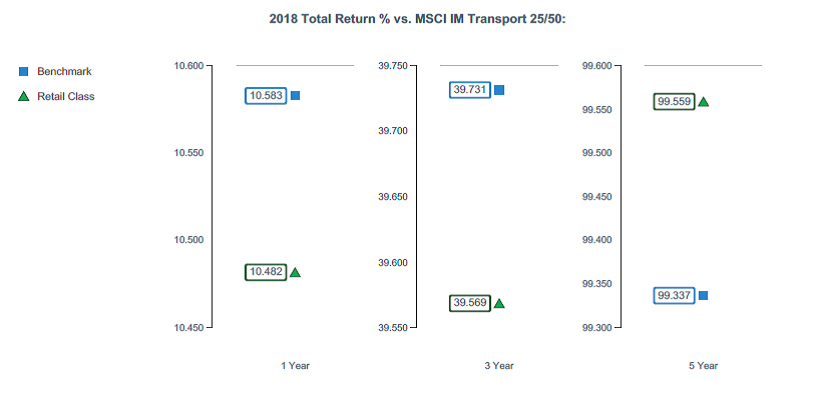
Based on its review, the Board concluded that the nature, extent, and quality of services provided to each fund under the Advisory Contracts should continue to benefit the shareholders of each fund.
Competitiveness of Management Fee and Total Expense Ratio. The Board considered each fund's management fee and total expense ratio compared to "mapped groups" of competitive funds and classes created for the purpose of facilitating the Trustees' competitive analysis of management fees and total expenses. Fidelity creates "mapped groups" by combining similar Lipper investment objective categories that have comparable investment mandates. For this purpose, all sector focused equity funds are grouped in the same mapped group. Combining Lipper investment objective categories aids the Board's management fee and total expense ratio comparisons by broadening the competitive group used for comparison.
Management Fee. The Board considered two proprietary management fee comparisons for the 12-month periods ended June 30 shown in basis points (BP) in the charts below. The group of Lipper funds used by the Board for management fee comparisons is referred to below as the "Total Mapped Group." The Total Mapped Group comparison focuses on a fund's standing in terms of gross management fees before expense reimbursements or caps relative to the total universe of funds with comparable investment mandates (i.e., sector equities), regardless of whether their management fee structures also are comparable. Funds with comparable management fee structures have similar management fee contractual arrangements (
e.g., flat rate charged for advisory services, all-inclusive fee rate,
etc.). "TMG %" represents the percentage of funds in the Total Mapped Group that had management fees that were lower than a fund's. For example, a hypothetical TMG % of 20% would mean that 80% of the funds in the Total Mapped Group had higher, and 20% had lower, management fees than a fund. The funds' actual TMG %s and the number of funds in the Total Mapped Group are in the charts below. The "Asset-Size Peer Group" (ASPG) comparison focuses on a fund's standing relative to a subset of non-Fidelity funds within the Total Mapped Group that are similar in size and management fee structure. For example, if a fund is in the first quartile of the ASPG, the fund's management fee ranks in the least expensive or lowest 25% of funds in the ASPG. The ASPG represents at least 15% of the funds in the Total Mapped Group with comparable asset size and management fee structures, subject to a minimum of 50 funds (or all funds in the Total Mapped Group if fewer than 50). Additional information, such as the ASPG quartile in which a fund's management fee rate ranked, is also included in the charts and was considered by the Board.
Air Transportation Portfolio
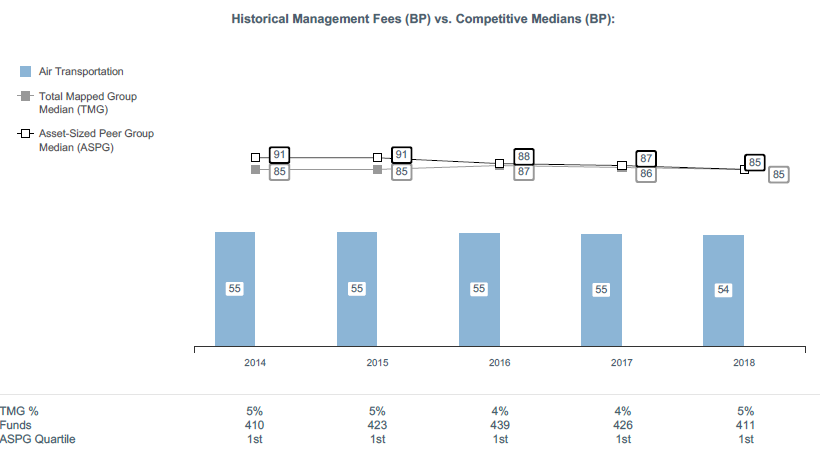
Defense and Aerospace Portfolio

Environment and Alternative Energy Portfolio
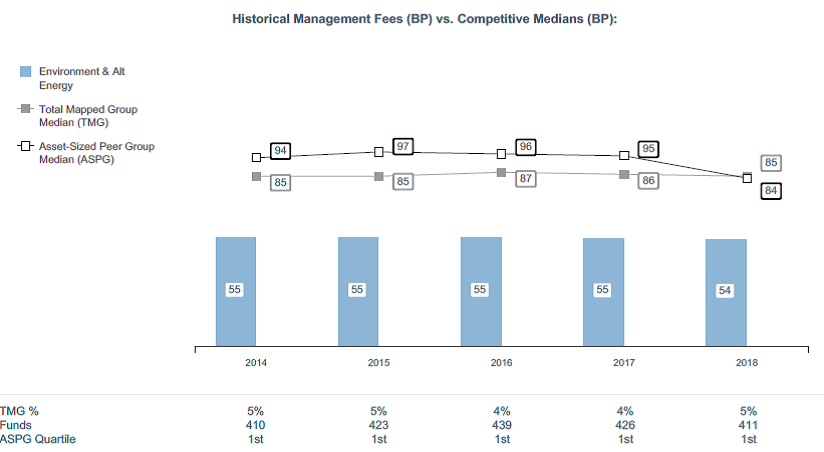
Industrials Portfolio
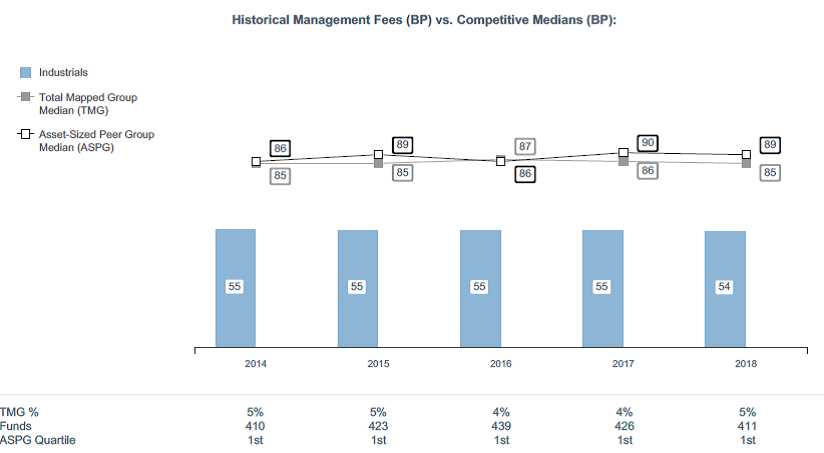
Transportation Portfolio
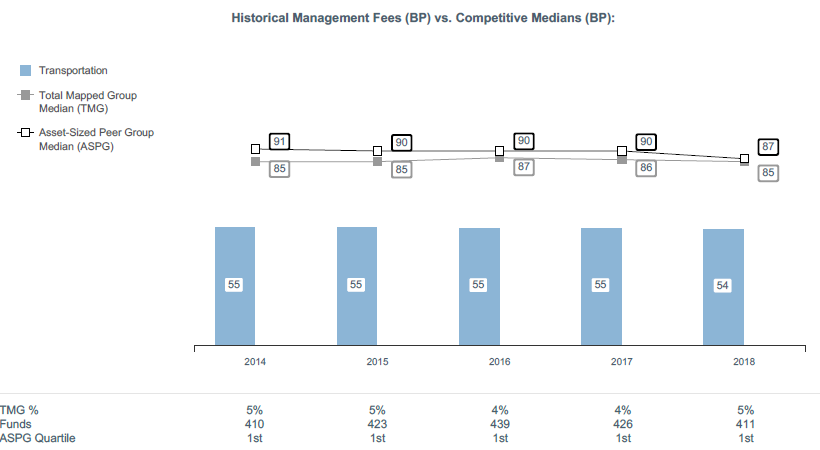
The Board noted that each fund's management fee rate ranked below the median of its Total Mapped Group and below the median of its ASPG for the 12-month period ended June 30, 2018.
The Board noted that it and the boards of other Fidelity funds formed an ad hoc Committee on Group Fee, which meets periodically, to conduct an in-depth review of the "group fee" component of the management fee of funds with such management fee structures. The Committee's focus included the mechanics of the group fee, the competitive landscape of group fee structures, Fidelity funds with no group fee component and investment products not included in group fee assets. The Board also considered that, for funds subject to the group fee, FMR agreed to voluntarily waive fees over a specified period of time in amounts designed to account for assets converted from certain funds to certain collective investment trusts.
Based on its review, the Board concluded that each fund's management fee is fair and reasonable in light of the services that the fund receives and the other factors considered.
Total Expense Ratio. In its review of each fund's total expense ratio, the Board considered the fund's management fee rate as well as other fund expenses, such as transfer agent fees, pricing and bookkeeping fees, and custodial, legal, and audit fees. The Board also noted that Fidelity may agree to waive fees and expenses from time to time, and the extent to which, if any, it has done so for each fund. As part of its review, the Board also considered the current and historical total expense ratios of each fund compared to competitive fund median expenses. Each fund is compared to those funds and classes in the Total Mapped Group (used by the Board for management fee comparisons) that have a similar sales load structure.
The Board noted that each fund's total expense ratio ranked below the competitive median for the 12-month period ended June 30, 2018.
Fees Charged to Other Fidelity Clients. The Board also considered Fidelity fee structures and other information with respect to clients of Fidelity, such as other funds advised or subadvised by Fidelity, pension plan clients, and other institutional clients with similar mandates. The Board noted that a joint ad hoc committee created by it and the boards of other Fidelity funds periodically reviews and compares Fidelity's institutional investment advisory business with its business of providing services to the Fidelity funds and also noted the most recent findings of the committee. The Board noted that the committee's review included a consideration of the differences in services provided, fees charged, and costs incurred, as well as competition in the markets serving the different categories of clients.
Based on its review of total expense ratios and fees charged to other Fidelity clients, the Board concluded that each fund's total expense ratio was reasonable in light of the services that the fund and its shareholders receive and the other factors considered.
Costs of the Services and Profitability. The Board considered the revenues earned and the expenses incurred by Fidelity in conducting the business of developing, marketing, distributing, managing, administering and servicing each fund and servicing each fund's shareholders. The Board also considered the level of Fidelity's profits in respect of all the Fidelity funds.
On an annual basis, Fidelity presents to the Board information about the profitability of its relationships with each fund. Fidelity calculates profitability information for each fund, as well as aggregate profitability information for groups of Fidelity funds and all Fidelity funds, using a series of detailed revenue and cost allocation methodologies which originate with the books and records of Fidelity on which Fidelity's audited financial statements are based. The Audit Committee of the Board reviews any significant changes from the prior year's methodologies.
PricewaterhouseCoopers LLP (PwC), auditor to Fidelity and certain Fidelity funds, has been engaged annually by the Board as part of the Board's assessment of Fidelity's profitability analysis. PwC's engagement includes the review and assessment of the methodologies used by Fidelity in determining the revenues and expenses attributable to Fidelity's mutual fund business, and completion of agreed-upon procedures in respect of the mathematical accuracy of the fund profitability information and its conformity to established allocation methodologies. After considering PwC's reports issued under the engagement and information provided by Fidelity, the Board concluded that while other allocation methods may also be reasonable, Fidelity's profitability methodologies are reasonable in all material respects.
The Board also reviewed Fidelity's non-fund businesses and potential indirect benefits such businesses may have received as a result of their association with Fidelity's mutual fund business (i.e., fall-out benefits) as well as cases where Fidelity's affiliates may benefit from the funds' business. The Board noted that changes to fall-out benefits year-over-year reflect business developments at Fidelity's various businesses.
The Board considered the costs of the services provided by and the profits realized by Fidelity in connection with the operation of each fund and was satisfied that the profitability was not excessive.
Economies of Scale. The Board considered whether there have been economies of scale in respect of the management of the Fidelity funds, whether the Fidelity funds (including each fund) have appropriately benefited from any such economies of scale, and whether there is potential for realization of any further economies of scale. The Board considered the extent to which each fund will benefit from economies of scale as assets grow through increased services to the fund, through waivers or reimbursements, or through fee or expense ratio reductions. The Board also noted that a committee (the Economies of Scale Committee) created by it and the boards of other Fidelity funds periodically analyzes whether Fidelity attains economies of scale in respect of the management and servicing of the Fidelity funds, whether the Fidelity funds have appropriately benefited from such economies of scale, and whether there is potential for realization of any further economies of scale.
The Board recognized that each fund's management contract incorporates a "group fee" structure, which provides for lower group fee rates as total group assets increase, and for higher group fee rates as total group assets decrease (with "group assets" defined to include fund assets under SelectCo's management plus assets under FMR's management). SelectCo calculates the group fee rates based on a tiered asset "breakpoint" schedule that varies based on asset class. The Board considered that the group fee is designed to deliver the benefits of economies of scale to fund shareholders when total group assets increase, even if assets of any particular fund are unchanged or have declined, because some portion of Fidelity's costs are attributable to services provided to all Fidelity funds, and all funds benefit if those costs can be allocated among more assets. The Board concluded that, given the group fee structure, fund shareholders will benefit from lower management fees as group assets increase at the fund complex level, regardless of whether Fidelity achieves any such economies of scale.
The Board concluded, taking into account the analysis of the Economies of Scale Committee, that economies of scale, if any, are being appropriately shared between fund shareholders and Fidelity.
Additional Information Requested by the Board. In order to develop fully the factual basis for consideration of the Fidelity funds' advisory contracts, the Board requested and received additional information on certain topics, including: (i) fund performance trends, in particular the underperformance of certain funds, and Fidelity's long-term strategies for certain funds; (ii) Fidelity's fund profitability methodology, profitability trends for certain funds, and the impact of certain factors on fund profitability results; (iii) metrics for evaluating index fund and ETF performance and information about ETF trading characteristics; (iv) the methodology with respect to the evaluation of competitive fund data and peer group classifications and fee comparisons; (v) the expense structures for different funds and classes; (vi) information regarding other accounts managed by Fidelity, including collective investment trusts; and (vii) Fidelity's philosophies and strategies for evaluating funds and classes with lower or declining asset levels.
Based on its evaluation of all of the conclusions noted above, and after considering all factors it believed relevant, the Board concluded that the advisory fee arrangements are fair and reasonable, and that each fund's Advisory Contracts should be renewed.
SELCI-ANN-0419
1.813657.114
Fidelity® Select Portfolios®
Information Technology Sector Communications Equipment Portfolio
Computers Portfolio
IT Services Portfolio
Semiconductors Portfolio
Software and IT Services Portfolio
Technology Portfolio
Annual Report February 28, 2019 |
|
Beginning on January 1, 2021, as permitted by regulations adopted by the Securities and Exchange Commission, paper copies of a fund’s shareholder reports will no longer be sent by mail, unless you specifically request paper copies of the reports from the fund or from your financial intermediary, such as a financial advisor, broker-dealer or bank. Instead, the reports will be made available on a website, and you will be notified by mail each time a report is posted and provided with a website link to access the report.
If you already elected to receive shareholder reports electronically, you will not be affected by this change and you need not take any action. You may elect to receive shareholder reports and other communications from a fund electronically, by contacting your financial intermediary. For Fidelity customers, visit Fidelity's web site or call Fidelity using the contact information listed below.
You may elect to receive all future reports in paper free of charge. If you wish to continue receiving paper copies of your shareholder reports, you may contact your financial intermediary or, if you are a Fidelity customer, visit Fidelity’s website, or call Fidelity at the applicable toll-free number listed below. Your election to receive reports in paper will apply to all funds held with the fund complex/your financial intermediary.
| Account Type | Website | Phone Number |
| Brokerage, Mutual Fund, or Annuity Contracts: | fidelity.com/mailpreferences | 1-800-343-3548 |
| Employer Provided Retirement Accounts: | netbenefits.fidelity.com/preferences (choose 'no' under Required Disclosures to continue to print) | 1-800-343-0860 |
| Advisor Sold Accounts Serviced Through Your Financial Intermediary: | Contact Your Financial Intermediary | Your Financial Intermediary's phone number |
| Advisor Sold Accounts Serviced by Fidelity: | institutional.fidelity.com | 1-877-208-0098 |
Contents
To view a fund's proxy voting guidelines and proxy voting record for the 12-month period ended June 30, visit http://www.fidelity.com/proxyvotingresults or visit the Securities and Exchange Commission's (SEC) web site at http://www.sec.gov.
You may also call 1-800-544-8544 to request a free copy of the proxy voting guidelines.
Standard & Poor's, S&P and S&P 500 are registered service marks of The McGraw-Hill Companies, Inc. and have been licensed for use by Fidelity Distributors Corporation.
Other third-party marks appearing herein are the property of their respective owners.
All other marks appearing herein are registered or unregistered trademarks or service marks of FMR LLC or an affiliated company. © 2019 FMR LLC. All rights reserved.
This report and the financial statements contained herein are submitted for the general information of the shareholders of the Funds. This report is not authorized for distribution to prospective investors in the Funds unless preceded or accompanied by an effective prospectus.
A fund files its complete schedule of portfolio holdings with the SEC for the first and third quarters of each fiscal year on Form N-Q. Forms N-Q are available on the SEC’s web site at http://www.sec.gov. A fund's Forms N-Q may be reviewed and copied at the SEC’s Public Reference Room in Washington, DC. Information regarding the operation of the SEC's Public Reference Room may be obtained by calling 1-800-SEC-0330.
For a complete list of a fund's portfolio holdings, view the most recent holdings listing, semiannual report, or annual report on Fidelity's web site at http://www.fidelity.com, http://www.institutional.fidelity.com, or http://www.401k.com, as applicable.
NOT FDIC INSURED •MAY LOSE VALUE •NO BANK GUARANTEE
Neither the Funds nor Fidelity Distributors Corporation is a bank.
Communications Equipment Portfolio
Performance: The Bottom Line
Average annual total return reflects the change in the value of an investment, assuming reinvestment of distributions from dividend income and capital gains (the profits earned upon the sale of securities that have grown in value, if any) and assuming a constant rate of performance each year. The hypothetical investment and the average annual total returns do not reflect the deduction of taxes that a shareholder would pay on fund distributions or the redemption of fund shares. During periods of reimbursement by Fidelity, a fund’s total return will be greater than it would be had the reimbursement not occurred. How a fund did yesterday is no guarantee of how it will do tomorrow.
Average Annual Total Returns
| For the periods ended February 28, 2019 | Past 1 year | Past 5 years | Past 10 years |
| Communications Equipment Portfolio | 11.11% | 9.53% | 16.70% |
$10,000 Over 10 Years
Let's say hypothetically that $10,000 was invested in Communications Equipment Portfolio on February 28, 2009.
The chart shows how the value of your investment would have changed, and also shows how the S&P 500® Index performed over the same period.
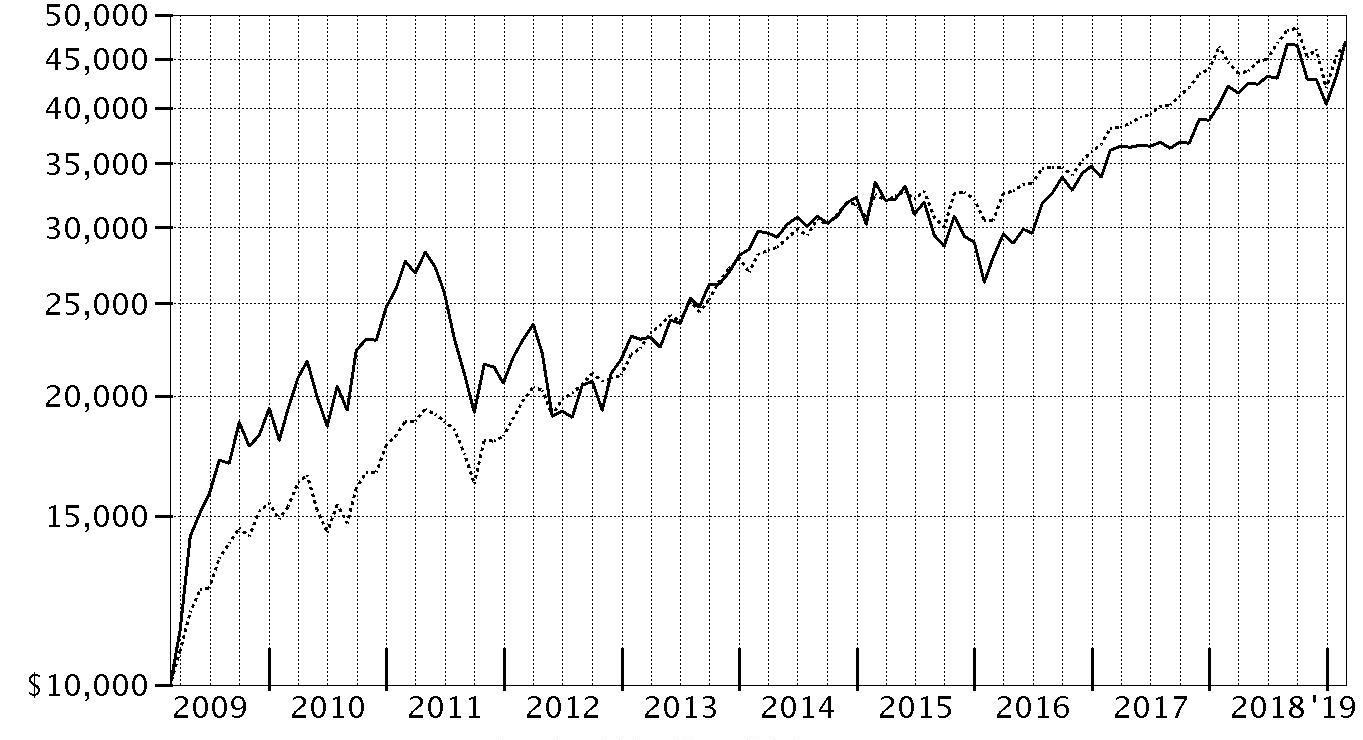
| Period Ending Values |
| $46,843 | Communications Equipment Portfolio |
| $46,739 | S&P 500® Index |
Communications Equipment Portfolio
Management's Discussion of Fund Performance
Market Recap: The S&P 500
® index gained 4.68% for the 12 months ending February 28, 2019, as the U.S. equity bellwether began the new year on a high note after enduring a final quarter of 2018 in which resurgent volatility upset the aging bull market. In October, rising U.S. Treasury yields and concern about peaking corporate earnings growth sent many investors fleeing from risk assets as they were still dealing with lingering uncertainty related to global trade and the U.S. Federal Reserve picking up the pace of interest rate hikes. The index returned -6.84% in October, at the time its largest monthly drop in seven years. But conditions worsened through Christmas, as jitters about the economy and another hike in rates led to a spike in market volatility and a -9.03% result for December. Sharply reversing course to begin 2019, the S&P 500
® gained 11.48% year-to-date, its strongest two-month opening since 1991, amid upbeat company earnings/outlooks and signs the Fed may pause on rates. For the full period, some economically sensitive sectors fared worst, with financials (-6%) and materials (-6%) both losing ground. Energy gained 1%, while communication services and industrials each rose roughly 2%. In contrast, the defensive utilities (+20%), real estate (+20%) and health care (+11%) sectors led the way, while consumer staples finished near the index. Information technology and consumer discretionary were rattled in the late-2018 downturn, but earlier strength contributed to advances of 9% and roughly 7%, respectively.
Comments from Portfolio Manager Caroline Tall: For the fiscal year, the fund gained 11.11%, trailing the 13.84% return of the MSCI North America IMI + ADR Custom Communications Equipment 25/50 Linked Index, but handily outpacing the broad-based S&P 500
®. Versus the MSCI industry index, stock selection in the fund’s core communications equipment category detracted most. Non-index exposure to semiconductors and to IT consulting & other services hurt to a much lesser extent. CommScope Holding was the fund’s largest detractor by a wide margin. Shares of the maker of cables, antennas and other network-infrastructure equipment fell sharply in November, after the company reported third-quarter financial results that were below expectations. Other notable detractors included untimely positioning in Ericsson, along with underweightings in Ciena and Nokia. Conversely, out-of-index exposure to several groups – notably, electronic manufacturing services – modestly lifted the fund’s relative result. A cash position of 1%, on average, also helped in a volatile market. The fund’s top contributor versus the index was an underweighted position in Arista Networks, which recorded a roughly 6% index return this period. I considerably increased this position by the end of February, moving from an underweighting to an overweighting. The company sells equipment and software for data-center management. I’ll also mention an out-of-index position in Fabrinet. Shares of this contract manufacturer specializing in optical components posted a 59% gain for the fund until I eliminated the position.
The views expressed above reflect those of the portfolio manager(s) only through the end of the period as stated on the cover of this report and do not necessarily represent the views of Fidelity or any other person in the Fidelity organization. Any such views are subject to change at any time based upon market or other conditions and Fidelity disclaims any responsibility to update such views. These views may not be relied on as investment advice and, because investment decisions for a Fidelity fund are based on numerous factors, may not be relied on as an indication of trading intent on behalf of any Fidelity fund.
Note to shareholders: On January 1, 2019, Caroline Tall became sole Portfolio Manager of the fund, after having served as Co-Manager alongside Colin Anderson since July 31, 2018.
Communications Equipment Portfolio
Investment Summary (Unaudited)
Top Ten Stocks as of February 28, 2019
| | % of fund's net assets |
| Cisco Systems, Inc. | 24.7 |
| Nokia Corp. sponsored ADR | 9.0 |
| Telefonaktiebolaget LM Ericsson (B Shares) sponsored ADR | 8.9 |
| Arista Networks, Inc. | 6.6 |
| F5 Networks, Inc. | 4.9 |
| Motorola Solutions, Inc. | 4.7 |
| Ubiquiti Networks, Inc. | 3.0 |
| Ciena Corp. | 2.8 |
| Lumentum Holdings, Inc. | 2.7 |
| Acacia Communications, Inc. | 2.7 |
| | 70.0 |
Top Industries (% of fund's net assets)
| As of February 28, 2019 |
| | Communications Equipment | 93.0% |
| | Semiconductors & Semiconductor Equipment | 3.5% |
| | Electronic Equipment & Components | 1.3% |
| | Media | 0.7% |
| | Software | 0.2% |
| | All Others* | 1.3% |

* Includes short-term investments and net other assets (liabilities).
Communications Equipment Portfolio
Schedule of Investments February 28, 2019
Showing Percentage of Net Assets
| Common Stocks - 98.7% | | | |
| | | Shares | Value |
| Communications Equipment - 93.0% | | | |
| Communications Equipment - 93.0% | | | |
| ADTRAN, Inc. | | 118,000 | $1,772,360 |
| Applied Optoelectronics, Inc. (a)(b) | | 41,900 | 565,650 |
| Arista Networks, Inc. (a) | | 50,345 | 14,360,911 |
| Arris International PLC (a) | | 178,753 | 5,662,895 |
| CalAmp Corp. (a) | | 75,100 | 1,043,890 |
| Ciena Corp. (a) | | 141,800 | 6,049,188 |
| Cisco Systems, Inc. | | 1,046,599 | 54,182,430 |
| CommScope Holding Co., Inc. (a) | | 162,271 | 3,782,537 |
| Comtech Telecommunications Corp. | | 70,500 | 1,868,250 |
| EchoStar Holding Corp. Class A (a) | | 69,500 | 2,679,920 |
| Extreme Networks, Inc. (a) | | 378,700 | 3,112,914 |
| F5 Networks, Inc. (a) | | 63,285 | 10,640,740 |
| Finisar Corp. (a) | | 158,200 | 3,874,318 |
| Harmonic, Inc. (a) | | 251,500 | 1,388,280 |
| Infinera Corp. (a) | | 246,014 | 1,257,132 |
| InterDigital, Inc. | | 31,900 | 2,224,387 |
| Juniper Networks, Inc. | | 143,912 | 3,897,137 |
| Lumentum Holdings, Inc. (a) | | 120,063 | 5,973,134 |
| Motorola Solutions, Inc. | | 71,959 | 10,298,772 |
| NETGEAR, Inc. (a) | | 13,250 | 475,013 |
| NetScout Systems, Inc. (a) | | 84,800 | 2,320,976 |
| Nokia Corp. sponsored ADR (b) | | 3,231,583 | 19,680,340 |
| Plantronics, Inc. | | 69,034 | 3,468,268 |
| Quantenna Communications, Inc. (a) | | 178,444 | 3,238,759 |
| Sierra Wireless, Inc.(a)(b) | | 298,400 | 3,764,155 |
| Sonus Networks, Inc. (a) | | 259,460 | 1,336,219 |
| Telefonaktiebolaget LM Ericsson (B Shares) sponsored ADR | | 2,154,680 | 19,542,948 |
| Ubiquiti Networks, Inc. (b) | | 45,600 | 6,584,184 |
| ViaSat, Inc. (a)(b) | | 53,800 | 4,064,590 |
| Viavi Solutions, Inc. (a) | | 336,600 | 4,419,558 |
| | | | 203,529,855 |
| Electronic Equipment & Components - 1.3% | | | |
| Electronic Components - 1.3% | | | |
| Casa Systems, Inc. (a) | | 137,400 | 1,400,106 |
| Corning, Inc. | | 44,200 | 1,538,602 |
| | | | 2,938,708 |
| Media - 0.7% | | | |
| Cable & Satellite - 0.7% | | | |
| Comcast Corp. Class A | | 41,500 | 1,604,805 |
| Semiconductors & Semiconductor Equipment - 3.5% | | | |
| Semiconductors - 3.5% | | | |
| Acacia Communications, Inc. (a) | | 111,900 | 5,969,865 |
| Inphi Corp. (a) | | 37,600 | 1,625,072 |
| | | | 7,594,937 |
| Software - 0.2% | | | |
| Systems Software - 0.2% | | | |
| Symantec Corp. | | 24,200 | 544,258 |
| TOTAL COMMON STOCKS | | | |
| (Cost $153,354,875) | | | 216,212,563 |
|
| Money Market Funds - 12.4% | | | |
| Fidelity Cash Central Fund, 2.44% (c) | | 3,113,964 | 3,114,587 |
| Fidelity Securities Lending Cash Central Fund 2.45% (c)(d) | | 23,987,045 | 23,989,444 |
| TOTAL MONEY MARKET FUNDS | | | |
| (Cost $27,104,031) | | | 27,104,031 |
| TOTAL INVESTMENT IN SECURITIES - 111.1% | | | |
| (Cost $180,458,906) | | | 243,316,594 |
| NET OTHER ASSETS (LIABILITIES) - (11.1)% | | | (24,371,784) |
| NET ASSETS - 100% | | | $218,944,810 |
Legend
(a) Non-income producing
(b) Security or a portion of the security is on loan at period end.
(c) Affiliated fund that is generally available only to investment companies and other accounts managed by Fidelity Investments. The rate quoted is the annualized seven-day yield of the fund at period end. A complete unaudited listing of the fund's holdings as of its most recent quarter end is available upon request. In addition, each Fidelity Central Fund's financial statements, which are not covered by the Fund's Report of Independent Registered Public Accounting Firm, are available on the SEC's website or upon request.
(d) Investment made with cash collateral received from securities on loan.
Affiliated Central Funds
Information regarding fiscal year to date income earned by the Fund from investments in Fidelity Central Funds is as follows:
| Fund | Income earned |
| Fidelity Cash Central Fund | $43,319 |
| Fidelity Securities Lending Cash Central Fund | 144,731 |
| Total | $188,050 |
Amounts in the income column in the above table include any capital gain distributions from underlying funds, which are presented in the corresponding line-item in the Statement of Operations, if applicable.
Investment Valuation
All investments are categorized as Level 1 under the Fair Value Hierarchy. The inputs or methodology used for valuing securities may not be an indication of the risk associated with investing in those securities. For more information on valuation inputs please refer to the Investment Valuation section in the accompanying Notes to Financial Statements.
Other Information
Distribution of investments by country or territory of incorporation, as a percentage of Total Net Assets, is as follows (Unaudited):
| United States of America | 77.8% |
| Finland | 9.0% |
| Sweden | 8.9% |
| United Kingdom | 2.6% |
| Canada | 1.7% |
| | 100.0% |
See accompanying notes which are an integral part of the financial statements.
Communications Equipment Portfolio
Financial Statements
Statement of Assets and Liabilities
| | | February 28, 2019 |
| Assets | | |
Investment in securities, at value (including securities loaned of $23,208,500) — See accompanying schedule:
Unaffiliated issuers (cost $153,354,875) | $216,212,563 | |
| Fidelity Central Funds (cost $27,104,031) | 27,104,031 | |
| Total Investment in Securities (cost $180,458,906) | | $243,316,594 |
| Receivable for investments sold | | 2,178,499 |
| Receivable for fund shares sold | | 3,122,030 |
| Dividends receivable | | 48,771 |
| Distributions receivable from Fidelity Central Funds | | 9,858 |
| Prepaid expenses | | 1,788 |
| Total assets | | 248,677,540 |
| Liabilities | | |
| Payable for investments purchased | $5,486,976 | |
| Payable for fund shares redeemed | 82,652 | |
| Accrued management fee | 92,561 | |
| Other affiliated payables | 40,840 | |
| Other payables and accrued expenses | 39,981 | |
| Collateral on securities loaned | 23,989,720 | |
| Total liabilities | | 29,732,730 |
| Net Assets | | $218,944,810 |
| Net Assets consist of: | | |
| Paid in capital | | $154,730,020 |
| Total distributable earnings (loss) | | 64,214,790 |
| Net Assets, for 5,424,507 shares outstanding | | $218,944,810 |
| Net Asset Value, offering price and redemption price per share ($218,944,810 ÷ 5,424,507 shares) | | $40.36 |
See accompanying notes which are an integral part of the financial statements.
Statement of Operations
| | | Year ended February 28, 2019 |
| Investment Income | | |
| Dividends | | $3,069,710 |
| Income from Fidelity Central Funds (including $144,731 from security lending) | | 188,050 |
| Total income | | 3,257,760 |
| Expenses | | |
| Management fee | $1,179,905 | |
| Transfer agent fees | 447,684 | |
| Accounting and security lending fees | 88,678 | |
| Custodian fees and expenses | 40,911 | |
| Independent trustees' fees and expenses | 1,219 | |
| Registration fees | 33,752 | |
| Audit | 41,769 | |
| Legal | 2,428 | |
| Interest | 4,354 | |
| Miscellaneous | 2,445 | |
| Total expenses before reductions | 1,843,145 | |
| Expense reductions | (24,763) | |
| Total expenses after reductions | | 1,818,382 |
| Net investment income (loss) | | 1,439,378 |
| Realized and Unrealized Gain (Loss) | | |
| Net realized gain (loss) on: | | |
| Investment securities: | | |
| Unaffiliated issuers | 5,601,287 | |
| Fidelity Central Funds | (275) | |
| Foreign currency transactions | (4,214) | |
| Total net realized gain (loss) | | 5,596,798 |
| Change in net unrealized appreciation (depreciation) on: | | |
| Investment securities: | | |
| Unaffiliated issuers | 13,337,759 | |
| Assets and liabilities in foreign currencies | 64 | |
| Total change in net unrealized appreciation (depreciation) | | 13,337,823 |
| Net gain (loss) | | 18,934,621 |
| Net increase (decrease) in net assets resulting from operations | | $20,373,999 |
See accompanying notes which are an integral part of the financial statements.
Statement of Changes in Net Assets
| | Year ended February 28, 2019 | Year ended February 28, 2018 |
| Increase (Decrease) in Net Assets | | |
| Operations | | |
| Net investment income (loss) | $1,439,378 | $921,400 |
| Net realized gain (loss) | 5,596,798 | 12,965,036 |
| Change in net unrealized appreciation (depreciation) | 13,337,823 | 15,653,779 |
| Net increase (decrease) in net assets resulting from operations | 20,373,999 | 29,540,215 |
| Distributions to shareholders | (15,319,912) | – |
| Distributions to shareholders from net investment income | – | (1,789,780) |
| Distributions to shareholders from net realized gain | – | (1,551,482) |
| Total distributions | (15,319,912) | (3,341,262) |
| Share transactions | | |
| Proceeds from sales of shares | 95,495,326 | 19,613,235 |
| Reinvestment of distributions | 14,435,389 | 3,127,012 |
| Cost of shares redeemed | (105,217,924) | (44,412,551) |
| Net increase (decrease) in net assets resulting from share transactions | 4,712,791 | (21,672,304) |
| Redemption fees | – | 509 |
| Total increase (decrease) in net assets | 9,766,878 | 4,527,158 |
| Net Assets | | |
| Beginning of period | 209,177,932 | 204,650,774 |
| End of period | $218,944,810 | $209,177,932 |
| Other Information | | |
| Distributions in excess of net investment income end of period | | $(422,185) |
| Shares | | |
| Sold | 2,510,396 | 523,886 |
| Issued in reinvestment of distributions | 396,991 | 89,704 |
| Redeemed | (2,828,010) | (1,266,244) |
| Net increase (decrease) | 79,377 | (652,654) |
See accompanying notes which are an integral part of the financial statements.
Financial Highlights
Communications Equipment Portfolio
| | | | | | |
| Years ended February 28, | 2019 | 2018 | 2017 | 2016 A | 2015 |
| Selected Per–Share Data | | | | | |
| Net asset value, beginning of period | $39.13 | $34.12 | $26.71 | $32.99 | $31.24 |
| Income from Investment Operations | | | | | |
| Net investment income (loss)B | .25 | .17 | .38 | .31 | .28 |
| Net realized and unrealized gain (loss) | 3.76 | 5.45C | 7.39 | (5.64) | 3.52 |
| Total from investment operations | 4.01 | 5.62 | 7.77 | (5.33) | 3.80 |
| Distributions from net investment income | (.17)D | (.33) | (.36) | (.30) | (.30) |
| Distributions from net realized gain | (2.61)D | (.28) | – | (.65) | (1.75) |
| Total distributions | (2.78) | (.61) | (.36) | (.95) | (2.05) |
| Redemption fees added to paid in capitalB | – | –E | –E | –E | –E |
| Net asset value, end of period | $40.36 | $39.13 | $34.12 | $26.71 | $32.99 |
| Total ReturnF | 11.11% | 16.71%C | 29.24% | (16.38)% | 12.49% |
| Ratios to Average Net AssetsG,H | | | | | |
| Expenses before reductions | .84% | .85% | .88% | .90% | .89% |
| Expenses net of fee waivers, if any | .84% | .85% | .88% | .89% | .89% |
| Expenses net of all reductions | .83% | .85% | .88% | .89% | .89% |
| Net investment income (loss) | .66% | .48% | 1.27% | 1.04% | .89% |
| Supplemental Data | | | | | |
| Net assets, end of period (000 omitted) | $218,945 | $209,178 | $204,651 | $169,455 | $263,631 |
| Portfolio turnover rateI | 71% | 56% | 38% | 30% | 42%J |
A For the year ended February 29.
B Calculated based on average shares outstanding during the period.
C Net realized and unrealized gain (loss) per share reflects proceeds received from litigation which amounted to $.01 per share. Excluding these litigation proceeds, the total return would have been 16.67%.
D The amounts shown reflect certain reclassifications related to book to tax differences that were made in the year shown.
E Amount represents less than $.005 per share.
F Total returns would have been lower if certain expenses had not been reduced during the applicable periods shown.
G Fees and expenses of any underlying Fidelity Central Funds are not included in the Fund's expense ratio. The Fund indirectly bears its proportionate share of the expenses of any underlying Fidelity Central Funds.
H Expense ratios reflect operating expenses of the Fund. Expenses before reductions do not reflect amounts reimbursed by the investment adviser or reductions from brokerage service arrangements or reductions from other expense offset arrangements and do not represent the amount paid by the Fund during periods when reimbursements or reductions occur. Expenses net of fee waivers reflect expenses after reimbursement by the investment adviser but prior to reductions from brokerage service arrangements or other expense offset arrangements. Expenses net of all reductions represent the net expenses paid by the Fund.
I Amount does not include the portfolio activity of any underlying Fidelity Central Funds.
J Portfolio turnover rate excludes securities received or delivered in-kind.
See accompanying notes which are an integral part of the financial statements.
Computers Portfolio
Performance: The Bottom Line
Average annual total return reflects the change in the value of an investment, assuming reinvestment of distributions from dividend income and capital gains (the profits earned upon the sale of securities that have grown in value, if any) and assuming a constant rate of performance each year. The hypothetical investment and the average annual total returns do not reflect the deduction of taxes that a shareholder would pay on fund distributions or the redemption of fund shares. During periods of reimbursement by Fidelity, a fund’s total return will be greater than it would be had the reimbursement not occurred. How a fund did yesterday is no guarantee of how it will do tomorrow.
Average Annual Total Returns
| For the periods ended February 28, 2019 | Past 1 year | Past 5 years | Past 10 years |
| Computers Portfolio | 0.54% | 9.58% | 18.67% |
$10,000 Over 10 Years
Let's say hypothetically that $10,000 was invested in Computers Portfolio on February 28, 2009.
The chart shows how the value of your investment would have changed, and also shows how the S&P 500® Index performed over the same period.
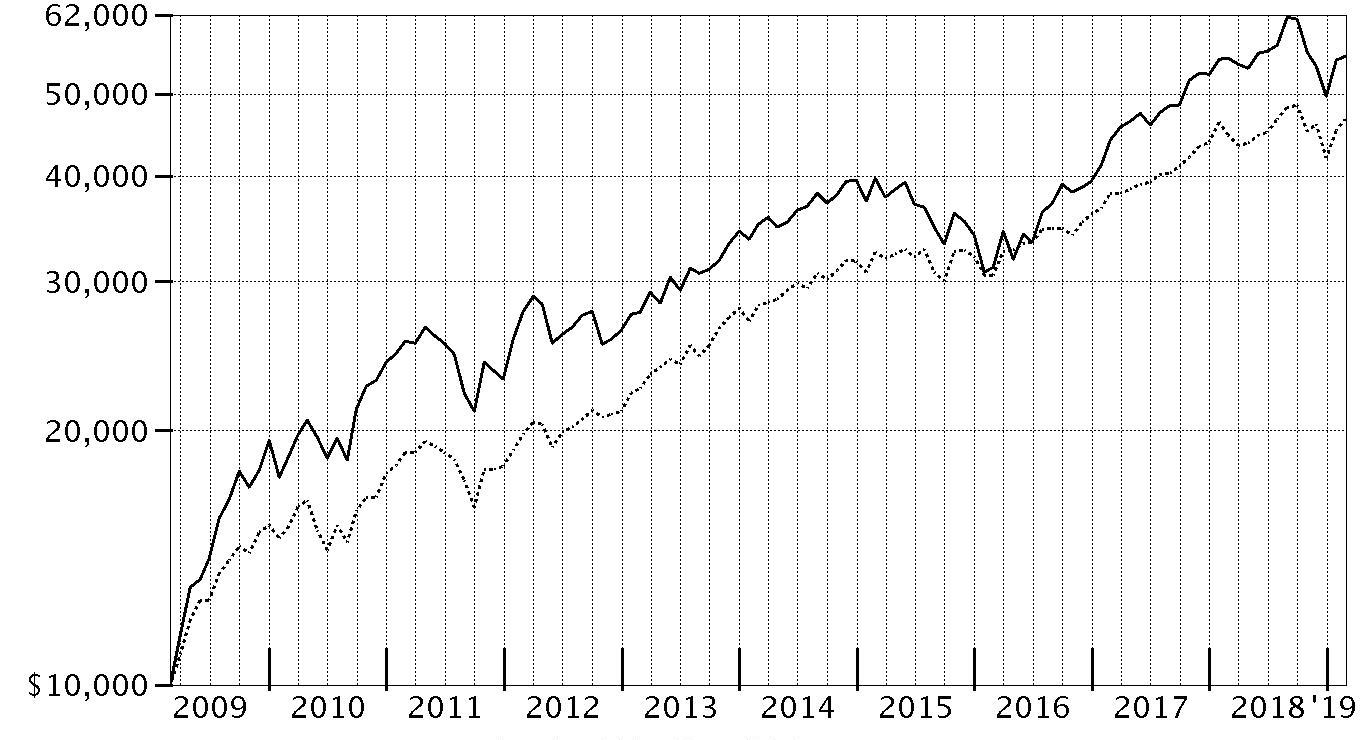
| Period Ending Values |
| $55,408 | Computers Portfolio |
| $46,739 | S&P 500® Index |
Computers Portfolio
Management's Discussion of Fund Performance
Market Recap: The S&P 500
® index gained 4.68% for the 12 months ending February 28, 2019, as the U.S. equity bellwether began the new year on a high note after enduring a final quarter of 2018 in which resurgent volatility upset the aging bull market. In October, rising U.S. Treasury yields and concern about peaking corporate earnings growth sent many investors fleeing from risk assets as they were still dealing with lingering uncertainty related to global trade and the U.S. Federal Reserve picking up the pace of interest rate hikes. The index returned -6.84% in October, at the time its largest monthly drop in seven years. But conditions worsened through Christmas, as jitters about the economy and another hike in rates led to a spike in market volatility and a -9.03% result for December. Sharply reversing course to begin 2019, the S&P 500
® gained 11.48% year-to-date, its strongest two-month opening since 1991, amid upbeat company earnings/outlooks and signs the Fed may pause on rates. For the full period, some economically sensitive sectors fared worst, with financials (-6%) and materials (-6%) both losing ground. Energy gained 1%, while communication services and industrials each rose roughly 2%. In contrast, the defensive utilities (+20%), real estate (+20%) and health care (+11%) sectors led the way, while consumer staples finished near the index. Information technology and consumer discretionary were rattled in the late-2018 downturn, but earlier strength contributed to advances of 9% and roughly 7%, respectively.
Comments from Portfolio Manager Caroline Tall: For the fiscal year, the fund gained 0.54%, handily topping the -6.20% return of the FactSet Computers & Peripherals Linked Index, but trailing the broad-based S&P 500
®. Versus the FactSet index, stock selection in the fund’s core technology hardware, storage & peripherals segment was the primary contributor the past 12 months. The fund's foreign holdings also helped overall, despite the drag of a broadly stronger U.S. dollar. Our top individual relative contributor was Dell Technologies, which returned about 42% for the fund after being publicly relisted in December. Subsequently, Dell was removed from the FactSet index, and I exited the position. A sizable stake in consumer electronics maker Apple also contributed to our relative result, as did Mellanox Technologies. The latter makes high-speed connectors that facilitate data transmission. Conversely, the fund’s largest relative detractor was Taiwan-based Quanta Computer. An overweighting in this leading manufacturer of relatively generic “white box” equipment for hyperscale data centers proved ill-timed. A small non-index stake in Qualcomm, a maker of wireless infrastructure and chips, also worked against us. I exited this position. Moving to an overweighting in Japan-based Sony detracted as well. The company makes video-game consoles and software, as well as image sensors.
The views expressed above reflect those of the portfolio manager(s) only through the end of the period as stated on the cover of this report and do not necessarily represent the views of Fidelity or any other person in the Fidelity organization. Any such views are subject to change at any time based upon market or other conditions and Fidelity disclaims any responsibility to update such views. These views may not be relied on as investment advice and, because investment decisions for a Fidelity fund are based on numerous factors, may not be relied on as an indication of trading intent on behalf of any Fidelity fund.
Note to shareholders: On June 1, 2018, Christopher Lin transitioned off of the fund, leaving Caroline Tall as sole Portfolio Manager.
Computers Portfolio
Investment Summary (Unaudited)
Top Ten Stocks as of February 28, 2019
| | % of fund's net assets |
| Sony Corp. | 16.1 |
| Samsung Electronics Co. Ltd. | 15.6 |
| Apple, Inc. | 14.4 |
| NetApp, Inc. | 4.8 |
| Xiaomi Corp. Class B | 4.7 |
| Western Digital Corp. | 4.6 |
| HP, Inc. | 3.9 |
| Kyocera Corp. | 3.6 |
| Seagate Technology LLC | 3.5 |
| Mellanox Technologies Ltd. | 3.0 |
| | 74.2 |
Top Industries (% of fund's net assets)
| As of February 28, 2019 |
| | Technology Hardware, Storage & Peripherals | 63.6% |
| | Household Durables | 16.1% |
| | Electronic Equipment & Components | 6.4% |
| | Semiconductors & Semiconductor Equipment | 5.3% |
| | Communications Equipment | 4.7% |
| | All Others* | 3.9% |

* Includes short-term investments and net other assets (liabilities).
Computers Portfolio
Schedule of Investments February 28, 2019
Showing Percentage of Net Assets
| Common Stocks - 99.0% | | | |
| | | Shares | Value |
| Communications Equipment - 4.7% | | | |
| Communications Equipment - 4.7% | | | |
| Xiaomi Corp. Class B (a) | | 15,141,400 | $23,069,670 |
| Electronic Equipment & Components - 6.4% | | | |
| Electronic Components - 3.6% | | | |
| Kyocera Corp. | | 320,300 | 17,697,796 |
| Technology Distributors - 2.8% | | | |
| Dell Technologies, Inc. (b) | | 246,831 | 13,778,106 |
|
| TOTAL ELECTRONIC EQUIPMENT & COMPONENTS | | | 31,475,902 |
|
| Household Durables - 16.1% | | | |
| Consumer Electronics - 16.1% | | | |
| Sony Corp. | | 1,649,168 | 79,185,653 |
| Interactive Media & Services - 1.1% | | | |
| Interactive Media & Services - 1.1% | | | |
| Alphabet, Inc. Class A (b) | | 4,512 | 5,082,994 |
| Semiconductors & Semiconductor Equipment - 5.3% | | | |
| Semiconductor Equipment - 2.3% | | | |
| Entegris, Inc. | | 110,335 | 3,898,136 |
| Lam Research Corp. | | 42,496 | 7,483,121 |
| | | | 11,381,257 |
| Semiconductors - 3.0% | | | |
| Mellanox Technologies Ltd. (b) | | 137,427 | 14,765,157 |
|
| TOTAL SEMICONDUCTORS & SEMICONDUCTOR EQUIPMENT | | | 26,146,414 |
|
| Software - 1.8% | | | |
| Application Software - 0.3% | | | |
| Pegasystems, Inc. | | 22,428 | 1,473,744 |
| Systems Software - 1.5% | | | |
| Microsoft Corp. | | 67,074 | 7,514,300 |
|
| TOTAL SOFTWARE | | | 8,988,044 |
|
| Technology Hardware, Storage & Peripherals - 63.6% | | | |
| Technology Hardware, Storage & Peripherals - 63.6% | | | |
| Apple, Inc. | | 408,382 | 70,711,343 |
| ASUSTeK Computer, Inc. | | 654,718 | 4,638,662 |
| Canon, Inc. | | 447,662 | 12,858,055 |
| Cray, Inc. (b) | | 53,589 | 1,314,538 |
| Diebold Nixdorf, Inc. (c) | | 102,247 | 939,650 |
| Electronics for Imaging, Inc. (b) | | 203,469 | 5,501,802 |
| Fujifilm Holdings Corp. | | 313,395 | 14,039,500 |
| Hewlett Packard Enterprise Co. | | 862,970 | 14,135,449 |
| HP, Inc. | | 982,177 | 19,378,352 |
| Lenovo Group Ltd. | | 1,152,000 | 1,037,567 |
| Logitech International SA (Reg.) | | 292,732 | 11,007,697 |
| NetApp, Inc. | | 360,380 | 23,496,776 |
| Pure Storage, Inc. Class A (b) | | 249,877 | 5,117,481 |
| Quanta Computer, Inc. | | 4,618,668 | 8,544,066 |
| Ricoh Co. Ltd. | | 121,884 | 1,240,349 |
| Samsung Electronics Co. Ltd. | | 1,919,403 | 76,912,550 |
| Seagate Technology LLC | | 366,243 | 17,052,274 |
| Western Digital Corp. | | 452,004 | 22,735,801 |
| Xerox Corp. | | 70,162 | 2,168,006 |
| | | | 312,829,918 |
| TOTAL COMMON STOCKS | | | |
| (Cost $375,364,657) | | | 486,778,595 |
|
| Money Market Funds - 0.3% | | | |
| Fidelity Cash Central Fund, 2.44% (d) | | 1,272,622 | 1,272,877 |
| Fidelity Securities Lending Cash Central Fund 2.45% (d)(e) | | 137,761 | 137,775 |
| TOTAL MONEY MARKET FUNDS | | | |
| (Cost $1,410,652) | | | 1,410,652 |
| TOTAL INVESTMENT IN SECURITIES - 99.3% | | | |
| (Cost $376,775,309) | | | 488,189,247 |
| NET OTHER ASSETS (LIABILITIES) - 0.7% | | | 3,591,067 |
| NET ASSETS - 100% | | | $491,780,314 |
Legend
(a) Security exempt from registration under Rule 144A of the Securities Act of 1933. These securities may be resold in transactions exempt from registration, normally to qualified institutional buyers. At the end of the period, the value of these securities amounted to $23,069,670 or 4.7% of net assets.
(b) Non-income producing
(c) Security or a portion of the security is on loan at period end.
(d) Affiliated fund that is generally available only to investment companies and other accounts managed by Fidelity Investments. The rate quoted is the annualized seven-day yield of the fund at period end. A complete unaudited listing of the fund's holdings as of its most recent quarter end is available upon request. In addition, each Fidelity Central Fund's financial statements, which are not covered by the Fund's Report of Independent Registered Public Accounting Firm, are available on the SEC's website or upon request.
(e) Investment made with cash collateral received from securities on loan.
Affiliated Central Funds
Information regarding fiscal year to date income earned by the Fund from investments in Fidelity Central Funds is as follows:
| Fund | Income earned |
| Fidelity Cash Central Fund | $77,810 |
| Fidelity Securities Lending Cash Central Fund | 2,583 |
| Total | $80,393 |
Amounts in the income column in the above table include any capital gain distributions from underlying funds, which are presented in the corresponding line-item in the Statement of Operations, if applicable.
Investment Valuation
The following is a summary of the inputs used, as of February 28, 2019, involving the Fund's assets and liabilities carried at fair value. The inputs or methodology used for valuing securities may not be an indication of the risk associated with investing in those securities. For more information on valuation inputs, and their aggregation into the levels used below, please refer to the Investment Valuation section in the accompanying Notes to Financial Statements.
| | Valuation Inputs at Reporting Date: |
| Description | Total | Level 1 | Level 2 | Level 3 |
| Investments in Securities: | | | | |
| Common Stocks | $486,778,595 | $348,574,514 | $138,204,081 | $-- |
| Money Market Funds | 1,410,652 | 1,410,652 | -- | -- |
| Total Investments in Securities: | $488,189,247 | $349,985,166 | $138,204,081 | $-- |
Other Information
Distribution of investments by country or territory of incorporation, as a percentage of Total Net Assets, is as follows (Unaudited):
| United States of America | 42.6% |
| Japan | 25.5% |
| Korea (South) | 15.6% |
| Cayman Islands | 4.7% |
| Ireland | 3.5% |
| Israel | 3.0% |
| Taiwan | 2.7% |
| Switzerland | 2.2% |
| Others (Individually Less Than 1%) | 0.2% |
| | 100.0% |
See accompanying notes which are an integral part of the financial statements.
Computers Portfolio
Financial Statements
Statement of Assets and Liabilities
| | | February 28, 2019 |
| Assets | | |
Investment in securities, at value (including securities loaned of $129,167) — See accompanying schedule:
Unaffiliated issuers (cost $375,364,657) | $486,778,595 | |
| Fidelity Central Funds (cost $1,410,652) | 1,410,652 | |
| Total Investment in Securities (cost $376,775,309) | | $488,189,247 |
| Receivable for investments sold | | 66,269,058 |
| Receivable for fund shares sold | | 217,858 |
| Dividends receivable | | 1,019,577 |
| Distributions receivable from Fidelity Central Funds | | 6,211 |
| Prepaid expenses | | 4,524 |
| Other receivables | | 188,243 |
| Total assets | | 555,894,718 |
| Liabilities | | |
| Payable for investments purchased | $63,453,969 | |
| Payable for fund shares redeemed | 130,635 | |
| Accrued management fee | 221,335 | |
| Other affiliated payables | 83,257 | |
| Other payables and accrued expenses | 87,433 | |
| Collateral on securities loaned | 137,775 | |
| Total liabilities | | 64,114,404 |
| Net Assets | | $491,780,314 |
| Net Assets consist of: | | |
| Paid in capital | | $343,833,785 |
| Total distributable earnings (loss) | | 147,946,529 |
| Net Assets, for 6,484,788 shares outstanding | | $491,780,314 |
| Net Asset Value, offering price and redemption price per share ($491,780,314 ÷ 6,484,788 shares) | | $75.84 |
See accompanying notes which are an integral part of the financial statements.
Statement of Operations
| | | Year ended February 28, 2019 |
| Investment Income | | |
| Dividends | | $8,614,043 |
| Income from Fidelity Central Funds (including $2,583 from security lending) | | 80,393 |
| Total income | | 8,694,436 |
| Expenses | | |
| Management fee | $2,805,366 | |
| Transfer agent fees | 871,858 | |
| Accounting and security lending fees | 199,074 | |
| Custodian fees and expenses | 44,710 | |
| Independent trustees' fees and expenses | 2,921 | |
| Registration fees | 28,473 | |
| Audit | 46,283 | |
| Legal | 6,224 | |
| Miscellaneous | 4,267 | |
| Total expenses before reductions | 4,009,176 | |
| Expense reductions | (14,783) | |
| Total expenses after reductions | | 3,994,393 |
| Net investment income (loss) | | 4,700,043 |
| Realized and Unrealized Gain (Loss) | | |
| Net realized gain (loss) on: | | |
| Investment securities: | | |
| Unaffiliated issuers | 119,224,361 | |
| Fidelity Central Funds | 70 | |
| Foreign currency transactions | (3,648) | |
| Total net realized gain (loss) | | 119,220,783 |
| Change in net unrealized appreciation (depreciation) on: | | |
| Investment securities: | | |
| Unaffiliated issuers | (121,864,350) | |
| Assets and liabilities in foreign currencies | (48,823) | |
| Total change in net unrealized appreciation (depreciation) | | (121,913,173) |
| Net gain (loss) | | (2,692,390) |
| Net increase (decrease) in net assets resulting from operations | | $2,007,653 |
See accompanying notes which are an integral part of the financial statements.
Statement of Changes in Net Assets
| | Year ended February 28, 2019 | Year ended February 28, 2018 |
| Increase (Decrease) in Net Assets | | |
| Operations | | |
| Net investment income (loss) | $4,700,043 | $3,955,582 |
| Net realized gain (loss) | 119,220,783 | 45,050,304 |
| Change in net unrealized appreciation (depreciation) | (121,913,173) | 66,098,365 |
| Net increase (decrease) in net assets resulting from operations | 2,007,653 | 115,104,251 |
| Distributions to shareholders | (87,948,443) | – |
| Distributions to shareholders from net investment income | – | (4,051,079) |
| Distributions to shareholders from net realized gain | – | (53,152,316) |
| Total distributions | (87,948,443) | (57,203,395) |
| Share transactions | | |
| Proceeds from sales of shares | 34,349,889 | 135,247,709 |
| Reinvestment of distributions | 83,463,307 | 54,503,094 |
| Cost of shares redeemed | (78,423,602) | (182,074,270) |
| Net increase (decrease) in net assets resulting from share transactions | 39,389,594 | 7,676,533 |
| Redemption fees | – | 8,857 |
| Total increase (decrease) in net assets | (46,551,196) | 65,586,246 |
| Net Assets | | |
| Beginning of period | 538,331,510 | 472,745,264 |
| End of period | $491,780,314 | $538,331,510 |
| Other Information | | |
| Distributions in excess of net investment income end of period | | $(40,577) |
| Shares | | |
| Sold | 391,378 | 1,547,276 |
| Issued in reinvestment of distributions | 1,189,565 | 617,683 |
| Redeemed | (896,723) | (2,059,450) |
| Net increase (decrease) | 684,220 | 105,509 |
See accompanying notes which are an integral part of the financial statements.
Financial Highlights
Computers Portfolio
| | | | | | |
| Years ended February 28, | 2019 | 2018 | 2017 | 2016 A | 2015 |
| Selected Per–Share Data | | | | | |
| Net asset value, beginning of period | $92.81 | $83.01 | $62.46 | $83.28 | $75.46 |
| Income from Investment Operations | | | | | |
| Net investment income (loss)B | .81 | .67 | .73 | .69 | .45 |
| Net realized and unrealized gain (loss) | (1.67) | 19.24 | 24.69 | (18.42) | 9.61 |
| Total from investment operations | (.86) | 19.91 | 25.42 | (17.73) | 10.06 |
| Distributions from net investment income | (.88)C | (.73)C | (.88) | (.80) | (.47) |
| Distributions from net realized gain | (15.23)C | (9.38)C | (4.00) | (2.29) | (1.77) |
| Total distributions | (16.11) | (10.11) | (4.87)D | (3.09) | (2.24) |
| Redemption fees added to paid in capitalB | – | –E | –E | –E | –E |
| Net asset value, end of period | $75.84 | $92.81 | $83.01 | $62.46 | $83.28 |
| Total ReturnF | .54% | 24.82% | 41.57% | (21.56)% | 13.36% |
| Ratios to Average Net AssetsG,H | | | | | |
| Expenses before reductions | .77% | .79% | .81% | .80% | .80% |
| Expenses net of fee waivers, if any | .77% | .79% | .81% | .80% | .80% |
| Expenses net of all reductions | .77% | .78% | .81% | .79% | .80% |
| Net investment income (loss) | .90% | .75% | 1.01% | .91% | .57% |
| Supplemental Data | | | | | |
| Net assets, end of period (000 omitted) | $491,780 | $538,332 | $472,745 | $388,554 | $808,852 |
| Portfolio turnover rateI | 81% | 57% | 49% | 31% | 46% |
A For the year ended February 29.
B Calculated based on average shares outstanding during the period.
C The amounts shown reflect certain reclassifications related to book to tax differences that were made in the year shown.
D Total distributions of $4.87 per share is comprised of distributions from net investment income of $.879 and distributions from net realized gain of $3.995 per share.
E Amount represents less than $.005 per share.
F Total returns would have been lower if certain expenses had not been reduced during the applicable periods shown.
G Fees and expenses of any underlying Fidelity Central Funds are not included in the Fund's expense ratio. The Fund indirectly bears its proportionate share of the expenses of any underlying Fidelity Central Funds.
H Expense ratios reflect operating expenses of the Fund. Expenses before reductions do not reflect amounts reimbursed by the investment adviser or reductions from brokerage service arrangements or reductions from other expense offset arrangements and do not represent the amount paid by the Fund during periods when reimbursements or reductions occur. Expenses net of fee waivers reflect expenses after reimbursement by the investment adviser but prior to reductions from brokerage service arrangements or other expense offset arrangements. Expenses net of all reductions represent the net expenses paid by the Fund.
I Amount does not include the portfolio activity of any underlying Fidelity Central Funds.
See accompanying notes which are an integral part of the financial statements.
IT Services Portfolio
Performance: The Bottom Line
Average annual total return reflects the change in the value of an investment, assuming reinvestment of distributions from dividend income and capital gains (the profits earned upon the sale of securities that have grown in value, if any) and assuming a constant rate of performance each year. The hypothetical investment and the average annual total returns do not reflect the deduction of taxes that a shareholder would pay on fund distributions or the redemption of fund shares. During periods of reimbursement by Fidelity, a fund’s total return will be greater than it would be had the reimbursement not occurred. How a fund did yesterday is no guarantee of how it will do tomorrow.
Average Annual Total Returns
| For the periods ended February 28, 2019 | Past 1 year | Past 5 years | Past 10 years |
| IT Services Portfolio | 16.04% | 15.98% | 22.99% |
$10,000 Over 10 Years
Let's say hypothetically that $10,000 was invested in IT Services Portfolio on February 28, 2009.
The chart shows how the value of your investment would have changed, and also shows how the S&P 500® Index performed over the same period.
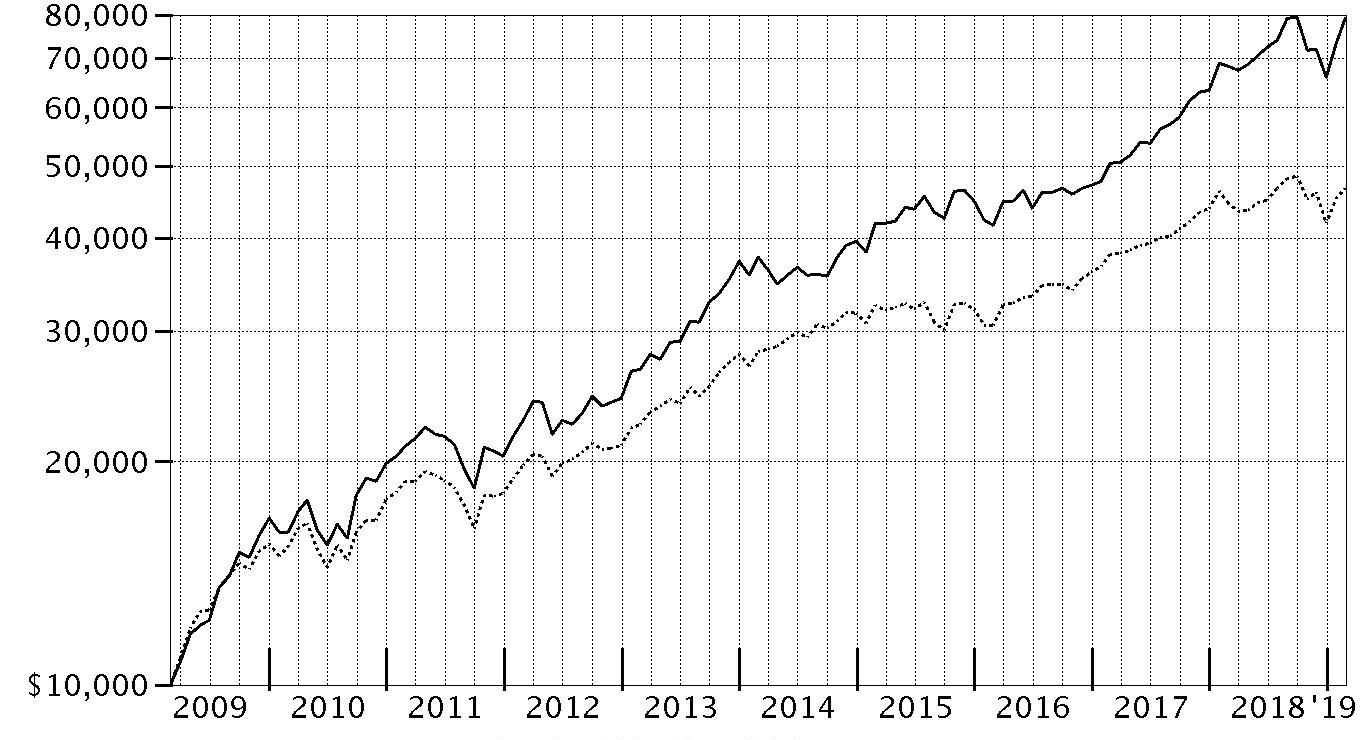
| Period Ending Values |
| $79,181 | IT Services Portfolio |
| $46,739 | S&P 500® Index |
IT Services Portfolio
Management's Discussion of Fund Performance
Market Recap: The S&P 500
® index gained 4.68% for the 12 months ending February 28, 2019, as the U.S. equity bellwether began the new year on a high note after enduring a final quarter of 2018 in which resurgent volatility upset the aging bull market. In October, rising U.S. Treasury yields and concern about peaking corporate earnings growth sent many investors fleeing from risk assets as they were still dealing with lingering uncertainty related to global trade and the U.S. Federal Reserve picking up the pace of interest rate hikes. The index returned -6.84% in October, at the time its largest monthly drop in seven years. But conditions worsened through Christmas, as jitters about the economy and another hike in rates led to a spike in market volatility and a -9.03% result for December. Sharply reversing course to begin 2019, the S&P 500
® gained 11.48% year-to-date, its strongest two-month opening since 1991, amid upbeat company earnings/outlooks and signs the Fed may pause on rates. For the full period, some economically sensitive sectors fared worst, with financials (-6%) and materials (-6%) both losing ground. Energy gained 1%, while communication services and industrials each rose roughly 2%. In contrast, the defensive utilities (+20%), real estate (+20%) and health care (+11%) sectors led the way, while consumer staples finished near the index. Information technology and consumer discretionary were rattled in the late-2018 downturn, but earlier strength contributed to advances of 9% and roughly 7%, respectively.
Comments from Portfolio Manager Daniel Sherwood: For the fiscal year, the fund gained 16.04%, topping the 14.33% advance of the MSCI U.S. IMI Information Technology Services 25/50 Index, and handily outpacing the S&P 500
®. Versus the MSCI industry index, stock selection in the IT consulting & other services category contributed most the past 12 months, followed by non-index exposure to application software and picks in internet services & infrastructure. Index heavyweight IBM provided by far the biggest boost to performance compared with the MSCI index. The stock returned -7% this period, rewarding our sizable underweighting. Other key relative contributors were out-of-index positions in Luxoft Holding, a provider of software development and IT solutions, and Intuit, maker of the popular TurboTax
® tax-preparation software and QuickBooks
® bookkeeping software for small businesses. Luxoft was not held at period end. Conversely, an underweighting in the data processing & outsourced services group was the main detractor from relative performance. A small non-index position in human resource & employment services also hurt, as did a small cash position. A sizable overweighting in Cognizant Technology Solutions proved to be our largest individual detractor versus the MSCI index. It also hurt not to own Square for much of the period, as shares of the provider of point-of-sale hardware and software mainly for small businesses gained roughly 76% the past 12 months.
The views expressed above reflect those of the portfolio manager(s) only through the end of the period as stated on the cover of this report and do not necessarily represent the views of Fidelity or any other person in the Fidelity organization. Any such views are subject to change at any time based upon market or other conditions and Fidelity disclaims any responsibility to update such views. These views may not be relied on as investment advice and, because investment decisions for a Fidelity fund are based on numerous factors, may not be relied on as an indication of trading intent on behalf of any Fidelity fund.
IT Services Portfolio
Investment Summary (Unaudited)
Top Ten Stocks as of February 28, 2019
| | % of fund's net assets |
| Visa, Inc. Class A | 18.7 |
| MasterCard, Inc. Class A | 13.6 |
| PayPal Holdings, Inc. | 6.5 |
| Cognizant Technology Solutions Corp. Class A | 5.1 |
| Accenture PLC Class A | 4.4 |
| IBM Corp. | 3.6 |
| Worldpay, Inc. | 3.2 |
| EPAM Systems, Inc. | 2.9 |
| First Data Corp. Class A | 2.8 |
| GoDaddy, Inc. | 2.6 |
| | 63.4 |
Top Industries (% of fund's net assets)
| As of February 28, 2019 |
| | IT Services | 89.4% |
| | Software | 7.5% |
| | Professional Services | 0.8% |
| | Electronic Equipment & Components | 0.3% |
| | All Others* | 2.0% |

* Includes short-term investments and net other assets (liabilities).
IT Services Portfolio
Schedule of Investments February 28, 2019
Showing Percentage of Net Assets
| Common Stocks - 98.0% | | | |
| | | Shares | Value |
| Electronic Equipment & Components - 0.3% | | | |
| Technology Distributors - 0.3% | | | |
| SYNNEX Corp. | | 97,935 | $9,609,382 |
| IT Services - 89.4% | | | |
| Data Processing & Outsourced Services - 59.9% | | | |
| Adyen BV (a) | | 2,500 | 1,876,793 |
| Alliance Data Systems Corp. | | 275,948 | 47,739,004 |
| Amadeus IT Holding SA Class A | | 800 | 60,239 |
| Automatic Data Processing, Inc. | | 445,500 | 68,174,865 |
| CoreLogic, Inc. (b) | | 2,700 | 99,009 |
| Fidelity National Information Services, Inc. | | 194,100 | 20,991,915 |
| First Data Corp. Class A (b) | | 3,234,530 | 81,316,084 |
| Fiserv, Inc. (b) | | 429,500 | 36,374,355 |
| FleetCor Technologies, Inc. (b) | | 307,400 | 71,710,272 |
| Genpact Ltd. | | 1,744,180 | 57,941,660 |
| Global Payments, Inc. | | 421,403 | 54,942,523 |
| Jack Henry & Associates, Inc. | | 1,600 | 212,208 |
| MasterCard, Inc. Class A | | 1,731,200 | 389,121,824 |
| Paychex, Inc. | | 3,700 | 284,974 |
| PayPal Holdings, Inc. (b) | | 1,907,300 | 187,048,911 |
| Square, Inc. (b) | | 302,600 | 24,583,224 |
| The Western Union Co. | | 4,900 | 87,563 |
| Ttec Holdings, Inc. | | 2,000 | 68,520 |
| Visa, Inc. Class A | | 3,625,648 | 537,030,981 |
| WEX, Inc. (b) | | 700 | 124,642 |
| WNS Holdings Ltd. sponsored ADR (b) | | 854,192 | 45,101,338 |
| Worldpay, Inc. (b) | | 970,400 | 92,964,320 |
| | | | 1,717,855,224 |
| Internet Services & Infrastructure - 4.7% | | | |
| Akamai Technologies, Inc. (b) | | 38,000 | 2,647,080 |
| GoDaddy, Inc. (b) | | 994,827 | 74,263,836 |
| VeriSign, Inc. (b) | | 89,100 | 15,863,364 |
| Wix.com Ltd. (b) | | 372,817 | 40,730,257 |
| | | | 133,504,537 |
| IT Consulting & Other Services - 24.8% | | | |
| Accenture PLC Class A | | 771,580 | 124,517,580 |
| Amdocs Ltd. | | 367,800 | 20,438,646 |
| Booz Allen Hamilton Holding Corp. Class A | | 833,100 | 44,037,666 |
| Capgemini SA | | 320,000 | 38,291,117 |
| Cognizant Technology Solutions Corp. Class A | | 2,050,232 | 145,525,467 |
| DXC Technology Co. | | 538,000 | 35,432,680 |
| Endava PLC ADR (b) | | 281,700 | 8,327,052 |
| EPAM Systems, Inc. (b) | | 513,000 | 82,993,140 |
| IBM Corp. | | 750,950 | 103,728,724 |
| Leidos Holdings, Inc. | | 676,425 | 43,690,291 |
| Liveramp Holdings, Inc. (b) | | 6,100 | 327,875 |
| Netcompany Group A/S (a) | | 47,700 | 1,740,204 |
| Perspecta, Inc. | | 14,868 | 313,715 |
| Science Applications International Corp. | | 800 | 59,760 |
| Virtusa Corp. (b) | | 1,209,170 | 61,026,810 |
| | | | 710,450,727 |
|
| TOTAL IT SERVICES | | | 2,561,810,488 |
|
| Professional Services - 0.8% | | | |
| Human Resource & Employment Services - 0.3% | | | |
| WageWorks, Inc. (b) | | 283,600 | 9,330,440 |
| Research & Consulting Services - 0.5% | | | |
| ICF International, Inc. | | 178,011 | 13,443,391 |
|
| TOTAL PROFESSIONAL SERVICES | | | 22,773,831 |
|
| Software - 7.5% | | | |
| Application Software - 7.1% | | | |
| Adobe, Inc. (b) | | 165,169 | 43,356,863 |
| Black Knight, Inc. (b) | | 846,300 | 44,219,175 |
| Ceridian HCM Holding, Inc. (c) | | 7,073 | 346,718 |
| DocuSign, Inc. | | 143,700 | 7,925,055 |
| Intuit, Inc. | | 231,800 | 57,284,734 |
| Pivotal Software, Inc. | | 474,600 | 10,640,532 |
| SS&C Technologies Holdings, Inc. | | 546,400 | 33,647,312 |
| Ultimate Software Group, Inc. (b) | | 21,400 | 7,094,100 |
| | | | 204,514,489 |
| Systems Software - 0.4% | | | |
| Zuora, Inc. | | 413,400 | 9,822,384 |
|
| TOTAL SOFTWARE | | | 214,336,873 |
|
| TOTAL COMMON STOCKS | | | |
| (Cost $1,542,650,531) | | | 2,808,530,574 |
|
| Money Market Funds - 1.7% | | | |
| Fidelity Cash Central Fund, 2.44% (d) | | 49,003,080 | 49,012,881 |
| Fidelity Securities Lending Cash Central Fund 2.45% (d)(e) | | 197,905 | 197,925 |
| TOTAL MONEY MARKET FUNDS | | | |
| (Cost $49,210,493) | | | 49,210,806 |
| TOTAL INVESTMENT IN SECURITIES - 99.7% | | | |
| (Cost $1,591,861,024) | | | 2,857,741,380 |
| NET OTHER ASSETS (LIABILITIES) - 0.3% | | | 9,579,919 |
| NET ASSETS - 100% | | | $2,867,321,299 |
Legend
(a) Security exempt from registration under Rule 144A of the Securities Act of 1933. These securities may be resold in transactions exempt from registration, normally to qualified institutional buyers. At the end of the period, the value of these securities amounted to $3,616,997 or 0.1% of net assets.
(b) Non-income producing
(c) Security or a portion of the security is on loan at period end.
(d) Affiliated fund that is generally available only to investment companies and other accounts managed by Fidelity Investments. The rate quoted is the annualized seven-day yield of the fund at period end. A complete unaudited listing of the fund's holdings as of its most recent quarter end is available upon request. In addition, each Fidelity Central Fund's financial statements, which are not covered by the Fund's Report of Independent Registered Public Accounting Firm, are available on the SEC's website or upon request.
(e) Investment made with cash collateral received from securities on loan.
Affiliated Central Funds
Information regarding fiscal year to date income earned by the Fund from investments in Fidelity Central Funds is as follows:
| Fund | Income earned |
| Fidelity Cash Central Fund | $516,267 |
| Fidelity Securities Lending Cash Central Fund | 4,845 |
| Total | $521,112 |
Amounts in the income column in the above table include any capital gain distributions from underlying funds, which are presented in the corresponding line-item in the Statement of Operations, if applicable.
Investment Valuation
All investments are categorized as Level 1 under the Fair Value Hierarchy. The inputs or methodology used for valuing securities may not be an indication of the risk associated with investing in those securities. For more information on valuation inputs please refer to the Investment Valuation section in the accompanying Notes to Financial Statements.
Other Information
Distribution of investments by country or territory of incorporation, as a percentage of Total Net Assets, is as follows (Unaudited):
| United States of America | 88.1% |
| Ireland | 4.4% |
| Bermuda | 2.0% |
| Bailiwick of Jersey | 1.6% |
| Israel | 1.4% |
| France | 1.3% |
| Others (Individually Less Than 1%) | 1.2% |
| | 100.0% |
See accompanying notes which are an integral part of the financial statements.
IT Services Portfolio
Financial Statements
Statement of Assets and Liabilities
| | | February 28, 2019 |
| Assets | | |
Investment in securities, at value (including securities loaned of $191,178) — See accompanying schedule:
Unaffiliated issuers (cost $1,542,650,531) | $2,808,530,574 | |
| Fidelity Central Funds (cost $49,210,493) | 49,210,806 | |
| Total Investment in Securities (cost $1,591,861,024) | | $2,857,741,380 |
| Receivable for fund shares sold | | 10,807,125 |
| Dividends receivable | | 2,308,076 |
| Distributions receivable from Fidelity Central Funds | | 85,941 |
| Prepaid expenses | | 19,453 |
| Other receivables | | 17,665 |
| Total assets | | 2,870,979,640 |
| Liabilities | | |
| Payable for fund shares redeemed | 1,759,825 | |
| Accrued management fee | 1,238,990 | |
| Transfer agent fee payable | 348,059 | |
| Other affiliated payables | 67,847 | |
| Other payables and accrued expenses | 45,695 | |
| Collateral on securities loaned | 197,925 | |
| Total liabilities | | 3,658,341 |
| Net Assets | | $2,867,321,299 |
| Net Assets consist of: | | |
| Paid in capital | | $1,593,143,544 |
| Total distributable earnings (loss) | | 1,274,177,755 |
| Net Assets, for 44,139,018 shares outstanding | | $2,867,321,299 |
| Net Asset Value, offering price and redemption price per share ($2,867,321,299 ÷ 44,139,018 shares) | | $64.96 |
See accompanying notes which are an integral part of the financial statements.
Statement of Operations
| | | Year ended February 28, 2019 |
| Investment Income | | |
| Dividends | | $20,163,114 |
| Income from Fidelity Central Funds (including $4,845 from security lending) | | 521,112 |
| Total income | | 20,684,226 |
| Expenses | | |
| Management fee | $13,933,901 | |
| Transfer agent fees | 4,241,409 | |
| Accounting and security lending fees | 767,268 | |
| Custodian fees and expenses | 36,389 | |
| Independent trustees' fees and expenses | 14,112 | |
| Registration fees | 92,583 | |
| Audit | 49,741 | |
| Legal | 12,287 | |
| Interest | 986 | |
| Miscellaneous | 18,822 | |
| Total expenses before reductions | 19,167,498 | |
| Expense reductions | (60,017) | |
| Total expenses after reductions | | 19,107,481 |
| Net investment income (loss) | | 1,576,745 |
| Realized and Unrealized Gain (Loss) | | |
| Net realized gain (loss) on: | | |
| Investment securities: | | |
| Unaffiliated issuers | 94,403,001 | |
| Fidelity Central Funds | (1,700) | |
| Foreign currency transactions | (257) | |
| Total net realized gain (loss) | | 94,401,044 |
| Change in net unrealized appreciation (depreciation) on: | | |
| Investment securities: | | |
| Unaffiliated issuers | 266,647,479 | |
| Fidelity Central Funds | 313 | |
| Assets and liabilities in foreign currencies | (1,525) | |
| Total change in net unrealized appreciation (depreciation) | | 266,646,267 |
| Net gain (loss) | | 361,047,311 |
| Net increase (decrease) in net assets resulting from operations | | $362,624,056 |
See accompanying notes which are an integral part of the financial statements.
Statement of Changes in Net Assets
| | Year ended February 28, 2019 | Year ended February 28, 2018 |
| Increase (Decrease) in Net Assets | | |
| Operations | | |
| Net investment income (loss) | $1,576,745 | $1,434,598 |
| Net realized gain (loss) | 94,401,044 | 90,645,455 |
| Change in net unrealized appreciation (depreciation) | 266,646,267 | 484,745,291 |
| Net increase (decrease) in net assets resulting from operations | 362,624,056 | 576,825,344 |
| Distributions to shareholders | (111,405,360) | – |
| Distributions to shareholders from net investment income | – | (863,213) |
| Distributions to shareholders from net realized gain | – | (62,255,457) |
| Total distributions | (111,405,360) | (63,118,670) |
| Share transactions | | |
| Proceeds from sales of shares | 866,407,438 | 451,323,420 |
| Reinvestment of distributions | 105,563,259 | 60,224,569 |
| Cost of shares redeemed | (640,019,796) | (404,904,553) |
| Net increase (decrease) in net assets resulting from share transactions | 331,950,901 | 106,643,436 |
| Total increase (decrease) in net assets | 583,169,597 | 620,350,110 |
| Net Assets | | |
| Beginning of period | 2,284,151,702 | 1,663,801,592 |
| End of period | $2,867,321,299 | $2,284,151,702 |
| Other Information | | |
| Undistributed net investment income end of period | | $388,251 |
| Shares | | |
| Sold | 14,047,200 | 8,580,519 |
| Issued in reinvestment of distributions | 1,880,626 | 1,157,339 |
| Redeemed | (10,707,678) | (7,927,102) |
| Net increase (decrease) | 5,220,148 | 1,810,756 |
See accompanying notes which are an integral part of the financial statements.
Financial Highlights
IT Services Portfolio
| | | | | | |
| Years ended February 28, | 2019 | 2018 | 2017 | 2016 A | 2015 |
| Selected Per–Share Data | | | | | |
| Net asset value, beginning of period | $58.69 | $44.84 | $37.16 | $38.88 | $37.86 |
| Income from Investment Operations | | | | | |
| Net investment income (loss)B | .04 | .04 | .13C | (.02) | (.03) |
| Net realized and unrealized gain (loss) | 8.92 | 15.50 | 7.68 | (.15) | 4.06 |
| Total from investment operations | 8.96 | 15.54 | 7.81 | (.17) | 4.03 |
| Distributions from net investment income | (.03) | (.02) | (.13) | – | (.01) |
| Distributions from net realized gain | (2.66) | (1.67) | – | (1.55) | (3.01) |
| Total distributions | (2.69) | (1.69) | (.13) | (1.55) | (3.01)D |
| Redemption fees added to paid in capitalB | – | – | –E | –E | –E |
| Net asset value, end of period | $64.96 | $58.69 | $44.84 | $37.16 | $38.88 |
| Total ReturnF | 16.04% | 35.17% | 21.05% | (.59)% | 11.16% |
| Ratios to Average Net AssetsG,H | | | | | |
| Expenses before reductions | .74% | .77% | .79% | .81% | .81% |
| Expenses net of fee waivers, if any | .74% | .77% | .79% | .81% | .81% |
| Expenses net of all reductions | .74% | .77% | .79% | .80% | .81% |
| Net investment income (loss) | .06% | .08% | .33%C | (.06)% | (.07)% |
| Supplemental Data | | | | | |
| Net assets, end of period (000 omitted) | $2,867,321 | $2,284,152 | $1,663,802 | $1,894,175 | $941,998 |
| Portfolio turnover rateI | 26% | 26% | 27% | 24% | 56% |
A For the year ended February 29.
B Calculated based on average shares outstanding during the period.
C Net investment income per share reflects a large, non-recurring dividends which amounted to $.13 per share. Excluding this non-recurring dividend, the ratio of net investment income (loss) to average net assets would have been .02%.
D Total distributions of $3.01 per share is comprised of distributions from net investment income of $.005 and distributions from net realized gain of $3.009 per share.
E Amount represents less than $.005 per share.
F Total returns would have been lower if certain expenses had not been reduced during the applicable periods shown.
G Fees and expenses of any underlying Fidelity Central Funds are not included in the Fund's expense ratio. The Fund indirectly bears its proportionate share of the expenses of any underlying Fidelity Central Funds.
H Expense ratios reflect operating expenses of the Fund. Expenses before reductions do not reflect amounts reimbursed by the investment adviser or reductions from brokerage service arrangements or reductions from other expense offset arrangements and do not represent the amount paid by the Fund during periods when reimbursements or reductions occur. Expenses net of fee waivers reflect expenses after reimbursement by the investment adviser but prior to reductions from brokerage service arrangements or other expense offset arrangements. Expenses net of all reductions represent the net expenses paid by the Fund.
I Amount does not include the portfolio activity of any underlying Fidelity Central Funds.
See accompanying notes which are an integral part of the financial statements.
Semiconductors Portfolio
Performance: The Bottom Line
Average annual total return reflects the change in the value of an investment, assuming reinvestment of distributions from dividend income and capital gains (the profits earned upon the sale of securities that have grown in value, if any) and assuming a constant rate of performance each year. The hypothetical investment and the average annual total returns do not reflect the deduction of taxes that a shareholder would pay on fund distributions or the redemption of fund shares. During periods of reimbursement by Fidelity, a fund’s total return will be greater than it would be had the reimbursement not occurred. How a fund did yesterday is no guarantee of how it will do tomorrow.
Average Annual Total Returns
| For the periods ended February 28, 2019 | Past 1 year | Past 5 years | Past 10 years |
| Semiconductors Portfolio | 0.19% | 19.78% | 23.36% |
$10,000 Over 10 Years
Let's say hypothetically that $10,000 was invested in Semiconductors Portfolio on February 28, 2009.
The chart shows how the value of your investment would have changed, and also shows how the S&P 500® Index performed over the same period.
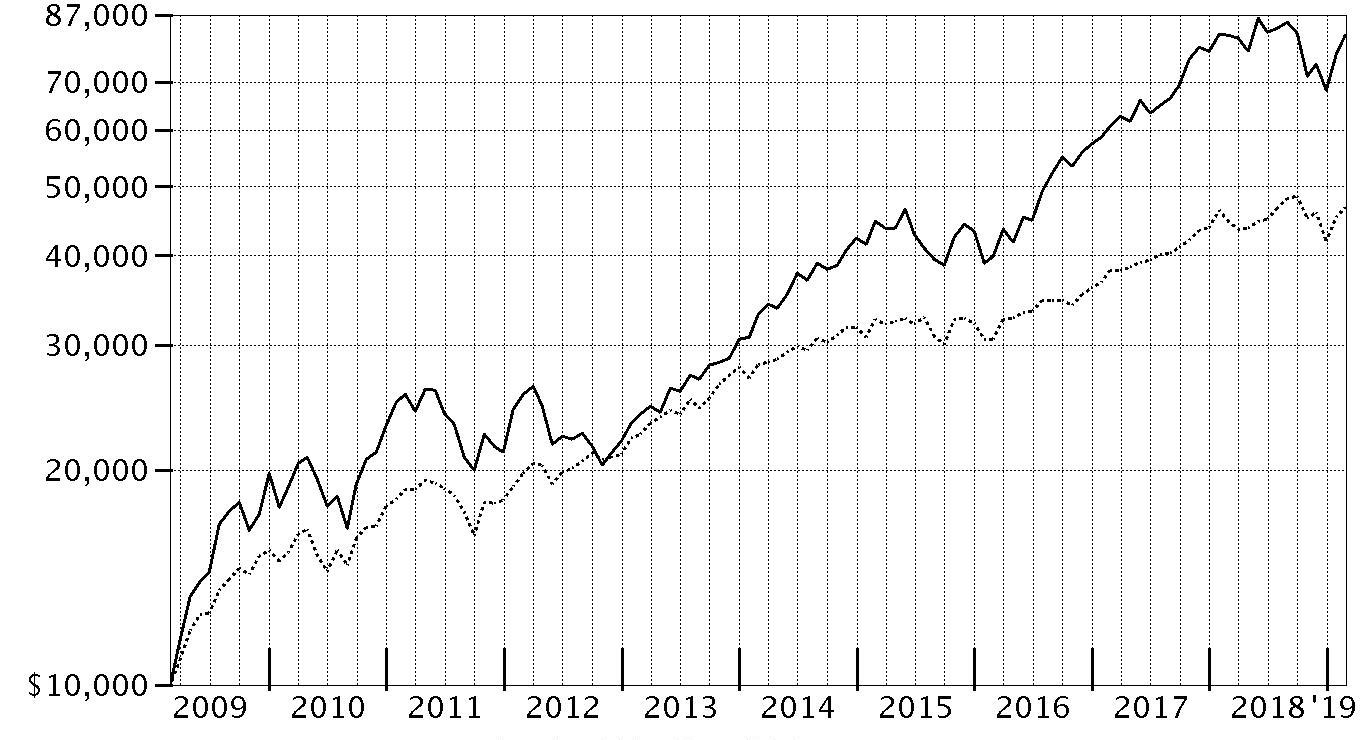
| Period Ending Values |
| $81,578 | Semiconductors Portfolio |
| $46,739 | S&P 500® Index |
Semiconductors Portfolio
Management's Discussion of Fund Performance
Market Recap: The S&P 500
® index gained 4.68% for the 12 months ending February 28, 2019, as the U.S. equity bellwether began the new year on a high note after enduring a final quarter of 2018 in which resurgent volatility upset the aging bull market. In October, rising U.S. Treasury yields and concern about peaking corporate earnings growth sent many investors fleeing from risk assets as they were still dealing with lingering uncertainty related to global trade and the U.S. Federal Reserve picking up the pace of interest rate hikes. The index returned -6.84% in October, at the time its largest monthly drop in seven years. But conditions worsened through Christmas, as jitters about the economy and another hike in rates led to a spike in market volatility and a -9.03% result for December. Sharply reversing course to begin 2019, the S&P 500
® gained 11.48% year-to-date, its strongest two-month opening since 1991, amid upbeat company earnings/outlooks and signs the Fed may pause on rates. For the full period, some economically sensitive sectors fared worst, with financials (-6%) and materials (-6%) both losing ground. Energy gained 1%, while communication services and industrials each rose roughly 2%. In contrast, the defensive utilities (+20%), real estate (+20%) and health care (+11%) sectors led the way, while consumer staples finished near the index. Information technology and consumer discretionary were rattled in the late-2018 downturn, but earlier strength contributed to advances of 9% and roughly 7%, respectively.
Comments from Portfolio Manager Stephen Barwikowski: For the fiscal year, the fund gained 0.19%, topping the -0.62% return of the MSCI U.S. IMI Semiconductors & Semiconductor Equipment 25/50 Index, but trailing the broad-based S&P 500
®. Versus the MSCI index, a sizable underweighting in semiconductor equipment contributed most the past 12 months. Non-index exposure to technology hardware, storage & peripherals and to communications equipment also helped our relative result. The top individual relative contributor by far was also the fund’s largest holding at period end: Broadcom. I bought a lot of additional shares in July, after the stock stumbled when the market was disappointed in the company’s plans to buy CA, a designer of mainframe software. Subsequently, easing concerns about the suitability of the CA deal, together with an aggressive stock-buyback campaign and a meaningful dividend boost, helped our holdings in Broadcom gain roughly 21%. Other notable contributors versus the MSCI index included Inphi, a provider of optical semiconductor components, as well as favorable positioning in two stocks in the semiconductor equipment group: Lam Research and Applied Materials. We increased exposure to both the past 12 months, moving from underweightings to overweightings as of February 28. Conversely, stock selection in semiconductors was the primary relative detractor. A modest out-of-index stake in electronic manufacturing services also worked against us. By far, the largest individual relative detractor this period was Xilinx, a strong-performing index name we avoided for most of the period. An underweighting, on average, in index heavyweight Intel also hurt.
The views expressed above reflect those of the portfolio manager(s) only through the end of the period as stated on the cover of this report and do not necessarily represent the views of Fidelity or any other person in the Fidelity organization. Any such views are subject to change at any time based upon market or other conditions and Fidelity disclaims any responsibility to update such views. These views may not be relied on as investment advice and, because investment decisions for a Fidelity fund are based on numerous factors, may not be relied on as an indication of trading intent on behalf of any Fidelity fund.
Semiconductors Portfolio
Investment Summary (Unaudited)
Top Ten Stocks as of February 28, 2019
| | % of fund's net assets |
| Broadcom, Inc. | 8.9 |
| Intel Corp. | 8.4 |
| Marvell Technology Group Ltd. | 8.1 |
| NVIDIA Corp. | 7.7 |
| Qualcomm, Inc. | 6.4 |
| Applied Materials, Inc. | 6.4 |
| NXP Semiconductors NV | 4.9 |
| Micron Technology, Inc. | 4.8 |
| Analog Devices, Inc. | 4.7 |
| Lam Research Corp. | 4.3 |
| | 64.6 |
Top Industries (% of fund's net assets)
| As of February 28, 2019 |
| | Semiconductors & Semiconductor Equipment | 88.8% |
| | Electronic Equipment & Components | 6.0% |
| | Technology Hardware, Storage & Peripherals | 0.7% |
| | Interactive Media & Services | 0.4% |
| | Electrical Equipment | 0.3% |
| | All Others* | 3.8% |

* Includes short-term investments and net other assets (liabilities).
Semiconductors Portfolio
Schedule of Investments February 28, 2019
Showing Percentage of Net Assets
| Common Stocks - 96.2% | | | |
| | | Shares | Value |
| Electrical Equipment - 0.3% | | | |
| Electrical Components & Equipment - 0.3% | | | |
| Sensata Technologies, Inc. PLC (a) | | 172,200 | $8,735,706 |
| Electronic Equipment & Components - 6.0% | | | |
| Electronic Manufacturing Services - 6.0% | | | |
| Flextronics International Ltd. (a) | | 6,690,900 | 70,522,086 |
| Jabil, Inc. | | 2,432,337 | 69,078,371 |
| TTM Technologies, Inc. (a) | | 3,550,594 | 43,033,199 |
| | | | 182,633,656 |
| Interactive Media & Services - 0.4% | | | |
| Interactive Media & Services - 0.4% | | | |
| Alphabet, Inc. Class A (a) | | 11,000 | 12,392,050 |
| Semiconductors & Semiconductor Equipment - 88.8% | | | |
| Semiconductor Equipment - 16.0% | | | |
| Advanced Energy Industries, Inc. (a) | | 895,800 | 45,121,446 |
| Applied Materials, Inc. | | 5,060,000 | 194,000,400 |
| KLA-Tencor Corp. | | 714,500 | 82,517,605 |
| Lam Research Corp. | | 754,473 | 132,855,151 |
| MKS Instruments, Inc. | | 404,200 | 33,496,054 |
| | | | 487,990,656 |
| Semiconductors - 72.8% | | | |
| Alpha & Omega Semiconductor Ltd. (a) | | 1,008,046 | 10,846,575 |
| Ambarella, Inc. (a)(b) | | 114,600 | 4,626,402 |
| Analog Devices, Inc. | | 1,349,896 | 144,384,876 |
| Aquantia Corp. (a) | | 459,500 | 3,607,075 |
| Broadcom, Inc. | | 984,000 | 270,954,242 |
| Cypress Semiconductor Corp. | | 1,443,600 | 22,274,748 |
| Dialog Semiconductor PLC (a) | | 201,100 | 6,132,551 |
| Inphi Corp. (a)(b) | | 1,242,395 | 53,696,312 |
| Intel Corp. | | 4,818,571 | 255,191,520 |
| MACOM Technology Solutions Holdings, Inc. (a)(b) | | 1,461,900 | 27,907,671 |
| Marvell Technology Group Ltd. | | 12,470,879 | 248,794,036 |
| Maxim Integrated Products, Inc. | | 495,600 | 26,975,508 |
| MaxLinear, Inc. Class A (a) | | 121,731 | 3,060,317 |
| MediaTek, Inc. | | 347,000 | 3,132,629 |
| Mellanox Technologies Ltd. (a) | | 339,100 | 36,432,904 |
| Microchip Technology, Inc. (b) | | 1,306,200 | 113,469,594 |
| Micron Technology, Inc. (a) | | 3,604,440 | 147,349,507 |
| Nordic VLSI ASA (a)(b) | | 760,100 | 3,233,466 |
| NVIDIA Corp. | | 1,515,492 | 233,779,796 |
| NXP Semiconductors NV | | 1,646,569 | 150,364,681 |
| O2Micro International Ltd. sponsored ADR (a) | | 357,607 | 632,964 |
| ON Semiconductor Corp. (a) | | 5,677,646 | 121,955,836 |
| Qorvo, Inc. (a) | | 630,124 | 44,196,897 |
| Qualcomm, Inc. | | 3,656,184 | 195,203,664 |
| Renesas Electronics Corp. (a) | | 3,617,925 | 21,162,581 |
| Sanken Electric Co. Ltd. | | 494,200 | 9,629,950 |
| Silicon Motion Technology Corp. sponsored ADR | | 45,594 | 1,873,002 |
| Skyworks Solutions, Inc. | | 343,500 | 28,050,210 |
| SMART Global Holdings, Inc. (a) | | 256,800 | 7,526,808 |
| Synaptics, Inc. (a) | | 460,200 | 19,268,574 |
| Tower Semiconductor Ltd. (a) | | 350,100 | 6,277,293 |
| United Microelectronics Corp. sponsored ADR (b) | | 1,344,832 | 2,487,939 |
| | | | 2,224,480,128 |
|
| TOTAL SEMICONDUCTORS & SEMICONDUCTOR EQUIPMENT | | | 2,712,470,784 |
|
| Technology Hardware, Storage & Peripherals - 0.7% | | | |
| Technology Hardware, Storage & Peripherals - 0.7% | | | |
| Western Digital Corp. | | 408,500 | 20,547,550 |
| TOTAL COMMON STOCKS | | | |
| (Cost $2,425,622,734) | | | 2,936,779,746 |
|
| Money Market Funds - 7.9% | | | |
| Fidelity Cash Central Fund, 2.44% (c) | | 113,779,852 | 113,802,608 |
| Fidelity Securities Lending Cash Central Fund 2.45% (c)(d) | | 125,554,174 | 125,566,729 |
| TOTAL MONEY MARKET FUNDS | | | |
| (Cost $239,369,056) | | | 239,369,337 |
| TOTAL INVESTMENT IN SECURITIES - 104.1% | | | |
| (Cost $2,664,991,790) | | | 3,176,149,083 |
| NET OTHER ASSETS (LIABILITIES) - (4.1)% | | | (123,643,385) |
| NET ASSETS - 100% | | | $3,052,505,698 |
Legend
(a) Non-income producing
(b) Security or a portion of the security is on loan at period end.
(c) Affiliated fund that is generally available only to investment companies and other accounts managed by Fidelity Investments. The rate quoted is the annualized seven-day yield of the fund at period end. A complete unaudited listing of the fund's holdings as of its most recent quarter end is available upon request. In addition, each Fidelity Central Fund's financial statements, which are not covered by the Fund's Report of Independent Registered Public Accounting Firm, are available on the SEC's website or upon request.
(d) Investment made with cash collateral received from securities on loan.
Affiliated Central Funds
Information regarding fiscal year to date income earned by the Fund from investments in Fidelity Central Funds is as follows:
| Fund | Income earned |
| Fidelity Cash Central Fund | $1,003,209 |
| Fidelity Securities Lending Cash Central Fund | 791,647 |
| Total | $1,794,856 |
Amounts in the income column in the above table include any capital gain distributions from underlying funds, which are presented in the corresponding line-item in the Statement of Operations, if applicable.
Other Affiliated Issuers
An affiliated company is a company in which the Fund has ownership of at least 5% of the voting securities. Fiscal year to date transactions with companies which are or were affiliates are as follows:
| Affiliate | Value, beginning of period | Purchases | Sales Proceeds | Dividend Income | Realized Gain (loss) | Change in Unrealized appreciation (depreciation) | Value, end of period |
| MACOM Technology Solutions Holdings, Inc. | $73,590,990 | $4,575,966 | $43,331,216 | $-- | $(28,610,364) | $21,682,295 | $-- |
| Quantenna Communications, Inc. | 48,428,806 | -- | 57,189,441 | -- | 9,361,173 | (600,538) | -- |
| Total | $122,019,796 | $4,575,966 | $100,520,657 | $-- | $(19,249,191) | $21,081,757 | $-- |
Investment Valuation
The following is a summary of the inputs used, as of February 28, 2019, involving the Fund's assets and liabilities carried at fair value. The inputs or methodology used for valuing securities may not be an indication of the risk associated with investing in those securities. For more information on valuation inputs, and their aggregation into the levels used below, please refer to the Investment Valuation section in the accompanying Notes to Financial Statements.
| | Valuation Inputs at Reporting Date: |
| Description | Total | Level 1 | Level 2 | Level 3 |
| Investments in Securities: | | | | |
| Common Stocks | $2,936,779,746 | $2,933,647,117 | $3,132,629 | $-- |
| Money Market Funds | 239,369,337 | 239,369,337 | -- | -- |
| Total Investments in Securities: | $3,176,149,083 | $3,173,016,454 | $3,132,629 | $-- |
Other Information
Distribution of investments by country or territory of incorporation, as a percentage of Total Net Assets, is as follows (Unaudited):
| United States of America | 80.8% |
| Bermuda | 8.5% |
| Netherlands | 4.9% |
| Singapore | 2.3% |
| Israel | 1.4% |
| Japan | 1.0% |
| Others (Individually Less Than 1%) | 1.1% |
| | 100.0% |
See accompanying notes which are an integral part of the financial statements.
Semiconductors Portfolio
Financial Statements
Statement of Assets and Liabilities
| | | February 28, 2019 |
| Assets | | |
Investment in securities, at value (including securities loaned of $122,425,874) — See accompanying schedule:
Unaffiliated issuers (cost $2,425,622,734) | $2,936,779,746 | |
| Fidelity Central Funds (cost $239,369,056) | 239,369,337 | |
| Total Investment in Securities (cost $2,664,991,790) | | $3,176,149,083 |
| Cash | | 371,387 |
| Receivable for investments sold | | 12,495,088 |
| Receivable for fund shares sold | | 4,933,144 |
| Dividends receivable | | 5,153,725 |
| Distributions receivable from Fidelity Central Funds | | 201,686 |
| Prepaid expenses | | 30,826 |
| Other receivables | | 190,573 |
| Total assets | | 3,199,525,512 |
| Liabilities | | |
| Payable for investments purchased | $17,750,063 | |
| Payable for fund shares redeemed | 1,713,867 | |
| Accrued management fee | 1,345,188 | |
| Other affiliated payables | 445,904 | |
| Other payables and accrued expenses | 203,292 | |
| Collateral on securities loaned | 125,561,500 | |
| Total liabilities | | 147,019,814 |
| Net Assets | | $3,052,505,698 |
| Net Assets consist of: | | |
| Paid in capital | | $2,644,198,496 |
| Total distributable earnings (loss) | | 408,307,202 |
| Net Assets, for 324,345,373 shares outstanding | | $3,052,505,698 |
| Net Asset Value, offering price and redemption price per share ($3,052,505,698 ÷ 324,345,373 shares) | | $9.41 |
See accompanying notes which are an integral part of the financial statements.
Statement of Operations
| | | Year ended February 28, 2019 |
| Investment Income | | |
| Dividends | | $52,012,790 |
| Income from Fidelity Central Funds (including $791,647 from security lending) | | 1,794,856 |
| Total income | | 53,807,646 |
| Expenses | | |
| Management fee | $17,704,630 | |
| Transfer agent fees | 5,136,087 | |
| Accounting and security lending fees | 973,495 | |
| Custodian fees and expenses | 78,367 | |
| Independent trustees' fees and expenses | 18,662 | |
| Registration fees | 72,305 | |
| Audit | 44,673 | |
| Legal | 23,351 | |
| Interest | 4,037 | |
| Miscellaneous | 28,183 | |
| Total expenses before reductions | 24,083,790 | |
| Expense reductions | (550,919) | |
| Total expenses after reductions | | 23,532,871 |
| Net investment income (loss) | | 30,274,775 |
| Realized and Unrealized Gain (Loss) | | |
| Net realized gain (loss) on: | | |
| Investment securities: | | |
| Unaffiliated issuers | 315,017,459 | |
| Fidelity Central Funds | 9,847 | |
| Other affiliated issuers | (19,249,191) | |
| Foreign currency transactions | (113,040) | |
| Total net realized gain (loss) | | 295,665,075 |
| Change in net unrealized appreciation (depreciation) on: | | |
| Investment securities: | | |
| Unaffiliated issuers | (383,910,989) | |
| Fidelity Central Funds | (10,446) | |
| Other affiliated issuers | 21,081,757 | |
| Assets and liabilities in foreign currencies | 2,695 | |
| Total change in net unrealized appreciation (depreciation) | | (362,836,983) |
| Net gain (loss) | | (67,171,908) |
| Net increase (decrease) in net assets resulting from operations | | $(36,897,133) |
See accompanying notes which are an integral part of the financial statements.
Statement of Changes in Net Assets
| | Year ended February 28, 2019 | Year ended February 28, 2018 |
| Increase (Decrease) in Net Assets | | |
| Operations | | |
| Net investment income (loss) | $30,274,775 | $15,302,171 |
| Net realized gain (loss) | 295,665,075 | 561,183,337 |
| Change in net unrealized appreciation (depreciation) | (362,836,983) | 363,549,432 |
| Net increase (decrease) in net assets resulting from operations | (36,897,133) | 940,034,940 |
| Distributions to shareholders | (611,562,086) | – |
| Distributions to shareholders from net investment income | – | (33,424,828) |
| Distributions to shareholders from net realized gain | – | (438,241,980) |
| Total distributions | (611,562,086) | (471,666,808) |
| Share transactions | | |
| Proceeds from sales of shares | 593,371,840 | 1,113,948,684 |
| Reinvestment of distributions | 585,226,471 | 451,720,104 |
| Cost of shares redeemed | (1,130,198,787) | (1,393,950,572) |
| Net increase (decrease) in net assets resulting from share transactions | 48,399,524 | 171,718,216 |
| Redemption fees | – | 107,527 |
| Total increase (decrease) in net assets | (600,059,695) | 640,193,875 |
| Net Assets | | |
| Beginning of period | 3,652,565,393 | 3,012,371,518 |
| End of period | $3,052,505,698 | $3,652,565,393 |
| Other Information | | |
| Distributions in excess of net investment income end of period | | $(11,289,025) |
| Shares(a) | | |
| Sold | 55,572,693 | 100,161,140 |
| Issued in reinvestment of distributions | 66,721,427 | 41,600,750 |
| Redeemed | (108,362,277) | (128,899,350) |
| Net increase (decrease) | 13,931,843 | 12,862,540 |
(a) Share activity prior to May 11, 2018 has been adjusted to reflect the impact of the 10 for 1 share split that occurred on that date.
See accompanying notes which are an integral part of the financial statements.
Financial Highlights
Semiconductors Portfolio
| | | | | | |
| Years ended February 28, | 2019 | 2018 | 2017 | 2016 A | 2015 |
| Selected Per–Share DataB | | | | | |
| Net asset value, beginning of period | $11.77 | $10.12 | $6.99 | $8.95 | $6.83 |
| Income from Investment Operations | | | | | |
| Net investment income (loss)C | .10 | .05 | .10 | .07 | .05 |
| Net realized and unrealized gain (loss) | (.35) | 3.24 | 3.40 | (.88) | 2.33 |
| Total from investment operations | (.25) | 3.29 | 3.50 | (.81) | 2.38 |
| Distributions from net investment income | (.06) | (.12) | (.07) | (.08) | (.05) |
| Distributions from net realized gain | (2.05) | (1.52) | (.30) | (1.07) | (.21) |
| Total distributions | (2.11) | (1.64) | (.37) | (1.15) | (.26) |
| Redemption fees added to paid in capitalC | – | –D | –D | –D | –D |
| Net asset value, end of period | $9.41 | $11.77 | $10.12 | $6.99 | $8.95 |
| Total ReturnE | .19% | 34.20% | 51.79% | (10.44)% | 34.91% |
| Ratios to Average Net AssetsF,G | | | | | |
| Expenses before reductions | .73% | .75% | .77% | .77% | .78% |
| Expenses net of fee waivers, if any | .73% | .75% | .77% | .77% | .78% |
| Expenses net of all reductions | .72% | .74% | .75% | .74% | .77% |
| Net investment income (loss) | .92% | .47% | 1.19% | .88% | .61% |
| Supplemental Data | | | | | |
| Net assets, end of period (000 omitted) | $3,052,506 | $3,652,565 | $3,012,372 | $1,338,175 | $2,395,039 |
| Portfolio turnover rateH | 130% | 110% | 110% | 179% | 132%I |
A For the year ended February 29.
B Per share amounts have been adjusted to reflect the impact of the 10 for 1 share split that occurred on May 11, 2018.
C Calculated based on average shares outstanding during the period.
D Amount represents less than $.005 per share.
E Total returns would have been lower if certain expenses had not been reduced during the applicable periods shown.
F Fees and expenses of any underlying Fidelity Central Funds are not included in the Fund's expense ratio. The Fund indirectly bears its proportionate share of the expenses of any underlying Fidelity Central Funds.
G Expense ratios reflect operating expenses of the Fund. Expenses before reductions do not reflect amounts reimbursed by the investment adviser or reductions from brokerage service arrangements or reductions from other expense offset arrangements and do not represent the amount paid by the Fund during periods when reimbursements or reductions occur. Expenses net of fee waivers reflect expenses after reimbursement by the investment adviser but prior to reductions from brokerage service arrangements or other expense offset arrangements. Expenses net of all reductions represent the net expenses paid by the Fund.
H Amount does not include the portfolio activity of any underlying Fidelity Central Funds.
I Portfolio turnover rate excludes securities received or delivered in-kind.
See accompanying notes which are an integral part of the financial statements.
Software and IT Services Portfolio
Performance: The Bottom Line
Average annual total return reflects the change in the value of an investment, assuming reinvestment of distributions from dividend income and capital gains (the profits earned upon the sale of securities that have grown in value, if any) and assuming a constant rate of performance each year. The hypothetical investment and the average annual total returns do not reflect the deduction of taxes that a shareholder would pay on fund distributions or the redemption of fund shares. During periods of reimbursement by Fidelity, a fund’s total return will be greater than it would be had the reimbursement not occurred. How a fund did yesterday is no guarantee of how it will do tomorrow.
Average Annual Total Returns
| For the periods ended February 28, 2019 | Past 1 year | Past 5 years | Past 10 years |
| Software and IT Services Portfolio | 10.90% | 15.85% | 23.29% |
$10,000 Over 10 Years
Let's say hypothetically that $10,000 was invested in Software and IT Services Portfolio on February 28, 2009.
The chart shows how the value of your investment would have changed, and also shows how the S&P 500® Index performed over the same period.
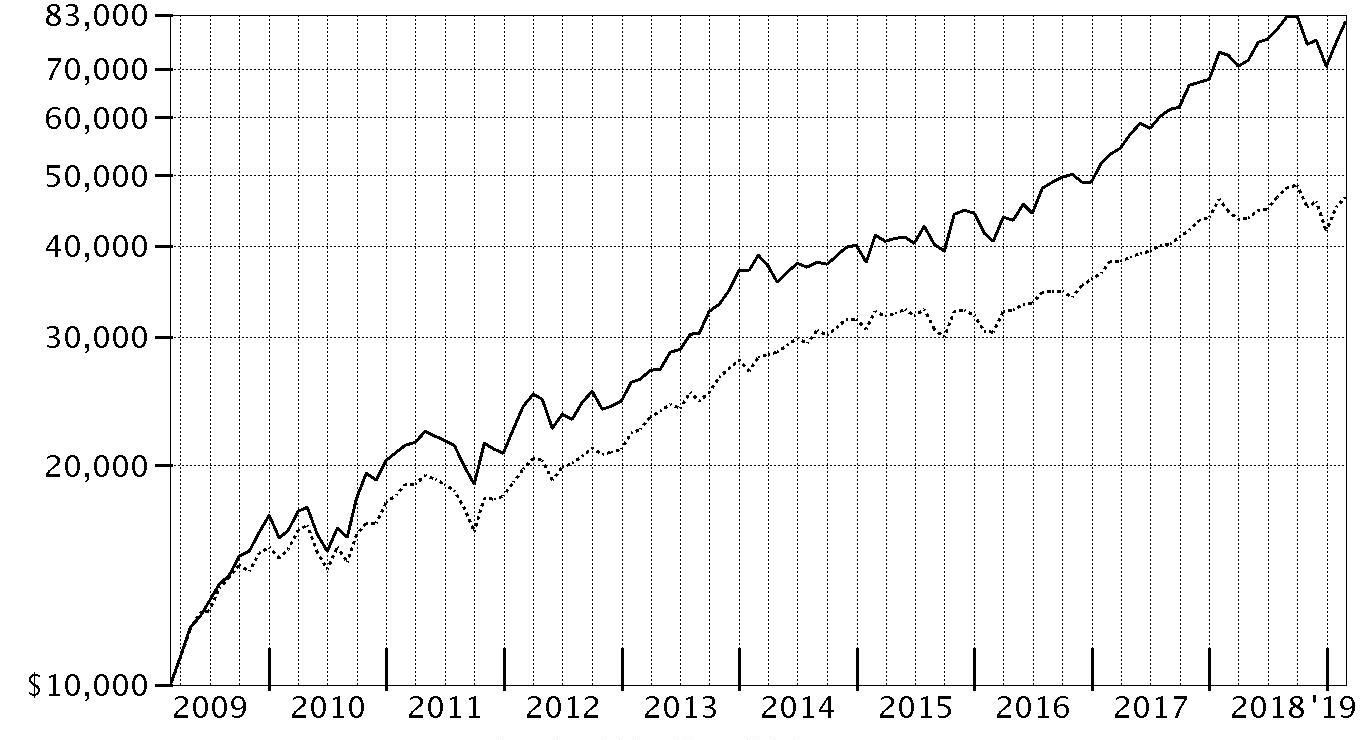
| Period Ending Values |
| $81,122 | Software and IT Services Portfolio |
| $46,739 | S&P 500® Index |
Software and IT Services Portfolio
Management's Discussion of Fund Performance
Market Recap: The S&P 500
® index gained 4.68% for the 12 months ending February 28, 2019, as the U.S. equity bellwether began the new year on a high note after enduring a final quarter of 2018 in which resurgent volatility upset the aging bull market. In October, rising U.S. Treasury yields and concern about peaking corporate earnings growth sent many investors fleeing from risk assets as they were still dealing with lingering uncertainty related to global trade and the U.S. Federal Reserve picking up the pace of interest rate hikes. The index returned -6.84% in October, at the time its largest monthly drop in seven years. But conditions worsened through Christmas, as jitters about the economy and another hike in rates led to a spike in market volatility and a -9.03% result for December. Sharply reversing course to begin 2019, the S&P 500
® gained 11.48% year-to-date, its strongest two-month opening since 1991, amid upbeat company earnings/outlooks and signs the Fed may pause on rates. For the full period, some economically sensitive sectors fared worst, with financials (-6%) and materials (-6%) both losing ground. Energy gained 1%, while communication services and industrials each rose roughly 2%. In contrast, the defensive utilities (+20%), real estate (+20%) and health care (+11%) sectors led the way, while consumer staples finished near the index. Information technology and consumer discretionary were rattled in the late-2018 downturn, but earlier strength contributed to advances of 9% and roughly 7%, respectively.
Comments from Portfolio Manager Ali Khan: For the fiscal year, the fund gained 10.90%, lagging the 12.84% result of the MSCI U.S. IMI Software & Services 25/50 Index, but well ahead of the S&P 500
®. Buoyed by strong enterprise spending on digital transformation, software and IT services companies topped the broader market the past 12 months. Versus the MSCI index, stock selection detracted, especially within the interactive home entertainment segment. My picks and an overweighting in data processing & outsourced services also hurt. Video-game developer Activision Blizzard was the largest individual relative detractor, as its shares were hampered by the popularity of a competitor's blockbuster title. Elsewhere, holding a lighter-than-index stake in Mastercard also hurt. The company continued to gain market share, especially in emerging markets as the global middle-class expands, and the stock gained 28% this period. I added to the fund's stake in Mastercard the past 12 months, but it remained an underweighting as of February 28. Conversely, choices in internet & direct marketing retail boosted the fund's relative result, partly reflecting my decision to largely avoid e-commerce platform eBay. Faced with continued competitive challenges from Amazon.com, eBay's lackluster growth sent its shares sharply lower this period.
The views expressed above reflect those of the portfolio manager(s) only through the end of the period as stated on the cover of this report and do not necessarily represent the views of Fidelity or any other person in the Fidelity organization. Any such views are subject to change at any time based upon market or other conditions and Fidelity disclaims any responsibility to update such views. These views may not be relied on as investment advice and, because investment decisions for a Fidelity fund are based on numerous factors, may not be relied on as an indication of trading intent on behalf of any Fidelity fund.
Software and IT Services Portfolio
Investment Summary (Unaudited)
Top Ten Stocks as of February 28, 2019
| | % of fund's net assets |
| Microsoft Corp. | 24.1 |
| Visa, Inc. Class A | 6.5 |
| Adobe, Inc. | 6.1 |
| Salesforce.com, Inc. | 4.9 |
| MasterCard, Inc. Class A | 4.4 |
| PayPal Holdings, Inc. | 4.2 |
| Oracle Corp. | 2.7 |
| Alphabet, Inc. Class A | 2.5 |
| Cognizant Technology Solutions Corp. Class A | 2.3 |
| IBM Corp. | 1.9 |
| | 59.6 |
Top Industries (% of fund's net assets)
| As of February 28, 2019 |
| | Software | 50.5% |
| | IT Services | 30.6% |
| | Interactive Media & Services | 4.6% |
| | Entertainment | 2.7% |
| | Internet & Direct Marketing Retail | 2.5% |
| | All Others* | 9.1% |

* Includes short-term investments and net other assets (liabilities).
Software and IT Services Portfolio
Schedule of Investments February 28, 2019
Showing Percentage of Net Assets
| Common Stocks - 93.7% | | | |
| | | Shares | Value |
| Electronic Equipment & Components - 0.5% | | | |
| Electronic Equipment & Instruments - 0.5% | | | |
| Trimble, Inc. (a) | | 821,800 | $32,880,218 |
| Entertainment - 2.7% | | | |
| Interactive Home Entertainment - 2.7% | | | |
| Activision Blizzard, Inc. | | 1,809,200 | 76,239,688 |
| Electronic Arts, Inc. (a) | | 1,083,700 | 103,796,786 |
| | | | 180,036,474 |
| Interactive Media & Services - 4.6% | | | |
| Interactive Media & Services - 4.6% | | | |
| Alphabet, Inc. Class A (a) | | 141,900 | 159,857,445 |
| Facebook, Inc. Class A (a) | | 386,300 | 62,368,135 |
| Match Group, Inc. (b) | | 163,800 | 9,071,244 |
| Tencent Holdings Ltd. | | 647,800 | 27,740,902 |
| Twitter, Inc. (a) | | 780,700 | 24,029,946 |
| Zillow Group, Inc.: | | | |
| Class A (a) | | 162,500 | 6,732,375 |
| Class C (a) | | 211,500 | 8,840,700 |
| | | | 298,640,747 |
| Internet & Direct Marketing Retail - 2.5% | | | |
| Internet & Direct Marketing Retail - 2.5% | | | |
| Alibaba Group Holding Ltd. sponsored ADR (a) | | 469,900 | 86,005,797 |
| MercadoLibre, Inc. (a) | | 77,600 | 35,602,104 |
| The Booking Holdings, Inc. (a) | | 25,000 | 42,426,000 |
| | | | 164,033,901 |
| IT Services - 30.6% | | | |
| Data Processing & Outsourced Services - 20.4% | | | |
| Alliance Data Systems Corp. | | 334,200 | 57,816,600 |
| Broadridge Financial Solutions, Inc. | | 80,500 | 8,150,625 |
| ExlService Holdings, Inc. (a) | | 582,100 | 35,740,940 |
| Fidelity National Information Services, Inc. | | 358,200 | 38,739,330 |
| FleetCor Technologies, Inc. (a) | | 331,600 | 77,355,648 |
| Global Payments, Inc. | | 161,000 | 20,991,180 |
| MasterCard, Inc. Class A | | 1,275,600 | 286,716,612 |
| NIC, Inc. | | 1,503,100 | 25,687,979 |
| PayPal Holdings, Inc. (a) | | 2,817,000 | 276,263,190 |
| The Western Union Co. | | 782,800 | 13,988,636 |
| Total System Services, Inc. | | 694,700 | 65,579,680 |
| Visa, Inc. Class A | | 2,884,520 | 427,255,102 |
| WEX, Inc. (a) | | 20,800 | 3,703,648 |
| | | | 1,337,989,170 |
| Internet Services & Infrastructure - 1.6% | | | |
| Akamai Technologies, Inc. (a) | | 1,478,500 | 102,992,310 |
| IT Consulting & Other Services - 8.6% | | | |
| Accenture PLC Class A | | 594,300 | 95,908,134 |
| Capgemini SA | | 571,900 | 68,433,406 |
| Cognizant Technology Solutions Corp. Class A | | 2,146,900 | 152,386,962 |
| DXC Technology Co. | | 160,800 | 10,590,288 |
| Gartner, Inc. (a) | | 488,300 | 69,485,090 |
| IBM Corp. | | 898,200 | 124,068,366 |
| Leidos Holdings, Inc. | | 669,300 | 43,230,087 |
| | | | 564,102,333 |
|
| TOTAL IT SERVICES | | | 2,005,083,813 |
|
| Semiconductors & Semiconductor Equipment - 0.8% | | | |
| Semiconductors - 0.8% | | | |
| NVIDIA Corp. | | 104,000 | 16,043,040 |
| Qualcomm, Inc. | | 662,600 | 35,376,214 |
| | | | 51,419,254 |
| Software - 50.5% | | | |
| Application Software - 21.3% | | | |
| Adobe, Inc. (a) | | 1,510,400 | 396,480,000 |
| Autodesk, Inc. (a) | | 574,200 | 93,600,342 |
| Blackbaud, Inc. | | 113,100 | 8,735,844 |
| Box, Inc. Class A (a) | | 662,100 | 13,400,904 |
| Citrix Systems, Inc. | | 1,060,950 | 111,930,225 |
| Constellation Software, Inc. | | 49,800 | 42,525,745 |
| Dropbox, Inc. Class A (a) | | 586,900 | 14,003,434 |
| HubSpot, Inc. (a) | | 70,900 | 11,938,142 |
| Instructure, Inc. (a) | | 583,781 | 27,280,086 |
| Intuit, Inc. | | 220,900 | 54,591,017 |
| Micro Focus International PLC | | 1,179,000 | 29,265,893 |
| Monotype Imaging Holdings, Inc. | | 1,115,100 | 21,855,960 |
| Nuance Communications, Inc. (a) | | 962,300 | 16,137,771 |
| Pivotal Software, Inc. (b) | | 2,325,800 | 52,144,436 |
| RealPage, Inc. (a) | | 73,600 | 4,505,056 |
| Salesforce.com, Inc. (a) | | 1,947,026 | 318,630,805 |
| SPS Commerce, Inc. (a) | | 239,800 | 25,605,844 |
| Talend SA ADR (a) | | 315,100 | 15,093,290 |
| Ultimate Software Group, Inc. (a) | | 113,600 | 37,658,400 |
| Workday, Inc. Class A (a) | | 378,900 | 74,995,677 |
| Zendesk, Inc. (a) | | 255,600 | 20,197,512 |
| | | | 1,390,576,383 |
| Systems Software - 29.2% | | | |
| Check Point Software Technologies Ltd. (a) | | 147,000 | 17,978,100 |
| Microsoft Corp. | | 14,068,500 | 1,576,094,056 |
| Oracle Corp. | | 3,376,900 | 176,037,797 |
| Red Hat, Inc. (a) | | 314,600 | 57,445,960 |
| Symantec Corp. | | 3,684,200 | 82,857,658 |
| | | | 1,910,413,571 |
|
| TOTAL SOFTWARE | | | 3,300,989,954 |
|
| Technology Hardware, Storage & Peripherals - 1.5% | | | |
| Technology Hardware, Storage & Peripherals - 1.5% | | | |
| Apple, Inc. | | 572,700 | 99,163,005 |
| TOTAL COMMON STOCKS | | | |
| (Cost $3,963,344,441) | | | 6,132,247,366 |
|
| Money Market Funds - 6.4% | | | |
| Fidelity Cash Central Fund, 2.44% (c) | | 403,853,501 | 403,934,271 |
| Fidelity Securities Lending Cash Central Fund 2.45% (c)(d) | | 13,099,581 | 13,100,891 |
| TOTAL MONEY MARKET FUNDS | | | |
| (Cost $417,031,317) | | | 417,035,162 |
| TOTAL INVESTMENT IN SECURITIES - 100.1% | | | |
| (Cost $4,380,375,758) | | | 6,549,282,528 |
| NET OTHER ASSETS (LIABILITIES) - (0.1)% | | | (8,386,879) |
| NET ASSETS - 100% | | | $6,540,895,649 |
Legend
(a) Non-income producing
(b) Security or a portion of the security is on loan at period end.
(c) Affiliated fund that is generally available only to investment companies and other accounts managed by Fidelity Investments. The rate quoted is the annualized seven-day yield of the fund at period end. A complete unaudited listing of the fund's holdings as of its most recent quarter end is available upon request. In addition, each Fidelity Central Fund's financial statements, which are not covered by the Fund's Report of Independent Registered Public Accounting Firm, are available on the SEC's website or upon request.
(d) Investment made with cash collateral received from securities on loan.
Affiliated Central Funds
Information regarding fiscal year to date income earned by the Fund from investments in Fidelity Central Funds is as follows:
| Fund | Income earned |
| Fidelity Cash Central Fund | $4,172,163 |
| Fidelity Securities Lending Cash Central Fund | 189,945 |
| Total | $4,362,108 |
Amounts in the income column in the above table include any capital gain distributions from underlying funds, which are presented in the corresponding line-item in the Statement of Operations, if applicable.
Investment Valuation
The following is a summary of the inputs used, as of February 28, 2019, involving the Fund's assets and liabilities carried at fair value. The inputs or methodology used for valuing securities may not be an indication of the risk associated with investing in those securities. For more information on valuation inputs, and their aggregation into the levels used below, please refer to the Investment Valuation section in the accompanying Notes to Financial Statements.
| | Valuation Inputs at Reporting Date: |
| Description | Total | Level 1 | Level 2 | Level 3 |
| Investments in Securities: | | | | |
| Common Stocks | $6,132,247,366 | $6,104,506,464 | $27,740,902 | $-- |
| Money Market Funds | 417,035,162 | 417,035,162 | -- | -- |
| Total Investments in Securities: | $6,549,282,528 | $6,521,541,626 | $27,740,902 | $-- |
See accompanying notes which are an integral part of the financial statements.
Software and IT Services Portfolio
Financial Statements
Statement of Assets and Liabilities
| | | February 28, 2019 |
| Assets | | |
Investment in securities, at value (including securities loaned of $12,536,108) — See accompanying schedule:
Unaffiliated issuers (cost $3,963,344,441) | $6,132,247,366 | |
| Fidelity Central Funds (cost $417,031,317) | 417,035,162 | |
| Total Investment in Securities (cost $4,380,375,758) | | $6,549,282,528 |
| Receivable for investments sold | | 16,312,817 |
| Receivable for fund shares sold | | 5,176,755 |
| Dividends receivable | | 9,783,442 |
| Distributions receivable from Fidelity Central Funds | | 605,352 |
| Prepaid expenses | | 47,050 |
| Other receivables | | 360,282 |
| Total assets | | 6,581,568,226 |
| Liabilities | | |
| Payable for investments purchased | $18,886,509 | |
| Payable for fund shares redeemed | 4,637,475 | |
| Accrued management fee | 2,867,704 | |
| Other affiliated payables | 874,639 | |
| Other payables and accrued expenses | 308,050 | |
| Collateral on securities loaned | 13,098,200 | |
| Total liabilities | | 40,672,577 |
| Net Assets | | $6,540,895,649 |
| Net Assets consist of: | | |
| Paid in capital | | $3,706,742,410 |
| Total distributable earnings (loss) | | 2,834,153,239 |
| Net Assets, for 349,595,509 shares outstanding | | $6,540,895,649 |
| Net Asset Value, offering price and redemption price per share ($6,540,895,649 ÷ 349,595,509 shares) | | $18.71 |
See accompanying notes which are an integral part of the financial statements.
Statement of Operations
| | | Year ended February 28, 2019 |
| Investment Income | | |
| Dividends | | $45,577,654 |
| Income from Fidelity Central Funds (including $189,945 from security lending) | | 4,362,108 |
| Total income | | 49,939,762 |
| Expenses | | |
| Management fee | $33,071,016 | |
| Transfer agent fees | 9,314,862 | |
| Accounting and security lending fees | 1,134,850 | |
| Custodian fees and expenses | 76,640 | |
| Independent trustees' fees and expenses | 33,597 | |
| Registration fees | 176,061 | |
| Audit | 48,694 | |
| Legal | 31,347 | |
| Miscellaneous | 44,992 | |
| Total expenses before reductions | 43,932,059 | |
| Expense reductions | (161,354) | |
| Total expenses after reductions | | 43,770,705 |
| Net investment income (loss) | | 6,169,057 |
| Realized and Unrealized Gain (Loss) | | |
| Net realized gain (loss) on: | | |
| Investment securities: | | |
| Unaffiliated issuers | 951,066,787 | |
| Fidelity Central Funds | 7,467 | |
| Foreign currency transactions | (32,893) | |
| Total net realized gain (loss) | | 951,041,361 |
| Change in net unrealized appreciation (depreciation) on: | | |
| Investment securities: | | |
| Unaffiliated issuers | (361,800,300) | |
| Fidelity Central Funds | (8,661) | |
| Assets and liabilities in foreign currencies | (11,291) | |
| Total change in net unrealized appreciation (depreciation) | | (361,820,252) |
| Net gain (loss) | | 589,221,109 |
| Net increase (decrease) in net assets resulting from operations | | $595,390,166 |
See accompanying notes which are an integral part of the financial statements.
Statement of Changes in Net Assets
| | Year ended February 28, 2019 | Year ended February 28, 2018 |
| Increase (Decrease) in Net Assets | | |
| Operations | | |
| Net investment income (loss) | $6,169,057 | $(4,237,571) |
| Net realized gain (loss) | 951,041,361 | 370,990,830 |
| Change in net unrealized appreciation (depreciation) | (361,820,252) | 1,088,676,746 |
| Net increase (decrease) in net assets resulting from operations | 595,390,166 | 1,455,430,005 |
| Distributions to shareholders | (333,011,171) | – |
| Distributions to shareholders from net realized gain | – | (340,316,912) |
| Total distributions | (333,011,171) | (340,316,912) |
| Share transactions | | |
| Proceeds from sales of shares | 1,674,148,271 | 1,063,695,918 |
| Reinvestment of distributions | 316,098,925 | 323,675,323 |
| Cost of shares redeemed | (1,251,087,217) | (1,118,562,434) |
| Net increase (decrease) in net assets resulting from share transactions | 739,159,979 | 268,808,807 |
| Total increase (decrease) in net assets | 1,001,538,974 | 1,383,921,900 |
| Net Assets | | |
| Beginning of period | 5,539,356,675 | 4,155,434,775 |
| End of period | $6,540,895,649 | $5,539,356,675 |
| Other Information | | |
| Accumulated net investment loss end of period | | $(255,934) |
| Shares(a) | | |
| Sold | 90,790,200 | 65,901,780 |
| Issued in reinvestment of distributions | 18,671,999 | 20,589,570 |
| Redeemed | (69,476,890) | (71,893,660) |
| Net increase (decrease) | 39,985,309 | 14,597,690 |
(a) Share activity prior to May 11, 2018 has been adjusted to reflect the impact of the 10 for 1 share split that occurred on that date.
See accompanying notes which are an integral part of the financial statements.
Financial Highlights
Software and IT Services Portfolio
| | | | | | |
| Years ended February 28, | 2019 | 2018 | 2017 | 2016 A | 2015 |
| Selected Per–Share DataB | | | | | |
| Net asset value, beginning of period | $17.89 | $14.09 | $11.11 | $11.94 | $12.44 |
| Income from Investment Operations | | | | | |
| Net investment income (loss)C | .02 | (.02) | (.01) | .01 | (.02) |
| Net realized and unrealized gain (loss) | 1.81 | 5.01 | 3.50 | (.20) | .73 |
| Total from investment operations | 1.83 | 4.99 | 3.49 | (.19) | .71 |
| Distributions from net investment income | (.01) | – | (.01) | (.01) | – |
| Distributions from net realized gain | (1.00) | (1.19) | (.50) | (.63) | (1.21) |
| Total distributions | (1.01) | (1.19) | (.51) | (.64) | (1.21) |
| Redemption fees added to paid in capitalC | – | – | –D | –D | –D |
| Net asset value, end of period | $18.71 | $17.89 | $14.09 | $11.11 | $11.94 |
| Total ReturnE | 10.90% | 36.76% | 31.83% | (1.84)% | 6.33% |
| Ratios to Average Net AssetsF,G | | | | | |
| Expenses before reductions | .72% | .73% | .76% | .77% | .77% |
| Expenses net of fee waivers, if any | .72% | .73% | .76% | .76% | .77% |
| Expenses net of all reductions | .71% | .73% | .75% | .76% | .77% |
| Net investment income (loss) | .10% | (.09)% | (.11)% | .10% | (.15)% |
| Supplemental Data | | | | | |
| Net assets, end of period (000 omitted) | $6,540,896 | $5,539,357 | $4,155,435 | $2,971,370 | $3,012,792 |
| Portfolio turnover rateH | 48% | 31% | 44% | 36% | 53% |
A For the year ended February 29.
B Per share amounts have been adjusted to reflect the impact of the 10 for 1 share split that occurred on May 11, 2018.
C Calculated based on average shares outstanding during the period.
D Amount represents less than $.005 per share.
E Total returns would have been lower if certain expenses had not been reduced during the applicable periods shown.
F Fees and expenses of any underlying Fidelity Central Funds are not included in the Fund's expense ratio. The Fund indirectly bears its proportionate share of the expenses of any underlying Fidelity Central Funds.
G Expense ratios reflect operating expenses of the Fund. Expenses before reductions do not reflect amounts reimbursed by the investment adviser or reductions from brokerage service arrangements or reductions from other expense offset arrangements and do not represent the amount paid by the Fund during periods when reimbursements or reductions occur. Expenses net of fee waivers reflect expenses after reimbursement by the investment adviser but prior to reductions from brokerage service arrangements or other expense offset arrangements. Expenses net of all reductions represent the net expenses paid by the Fund.
H Amount does not include the portfolio activity of any underlying Fidelity Central Funds.
See accompanying notes which are an integral part of the financial statements.
Technology Portfolio
Performance: The Bottom Line
Average annual total return reflects the change in the value of an investment, assuming reinvestment of distributions from dividend income and capital gains (the profits earned upon the sale of securities that have grown in value, if any) and assuming a constant rate of performance each year. The hypothetical investment and the average annual total returns do not reflect the deduction of taxes that a shareholder would pay on fund distributions or the redemption of fund shares. During periods of reimbursement by Fidelity, a fund’s total return will be greater than it would be had the reimbursement not occurred. How a fund did yesterday is no guarantee of how it will do tomorrow.
Average Annual Total Returns
| For the periods ended February 28, 2019 | Past 1 year | Past 5 years | Past 10 years |
| Technology Portfolio | (3.03)% | 14.53% | 22.37% |
$10,000 Over 10 Years
Let's say hypothetically that $10,000 was invested in Technology Portfolio on February 28, 2009.
The chart shows how the value of your investment would have changed, and also shows how the S&P 500® Index performed over the same period.
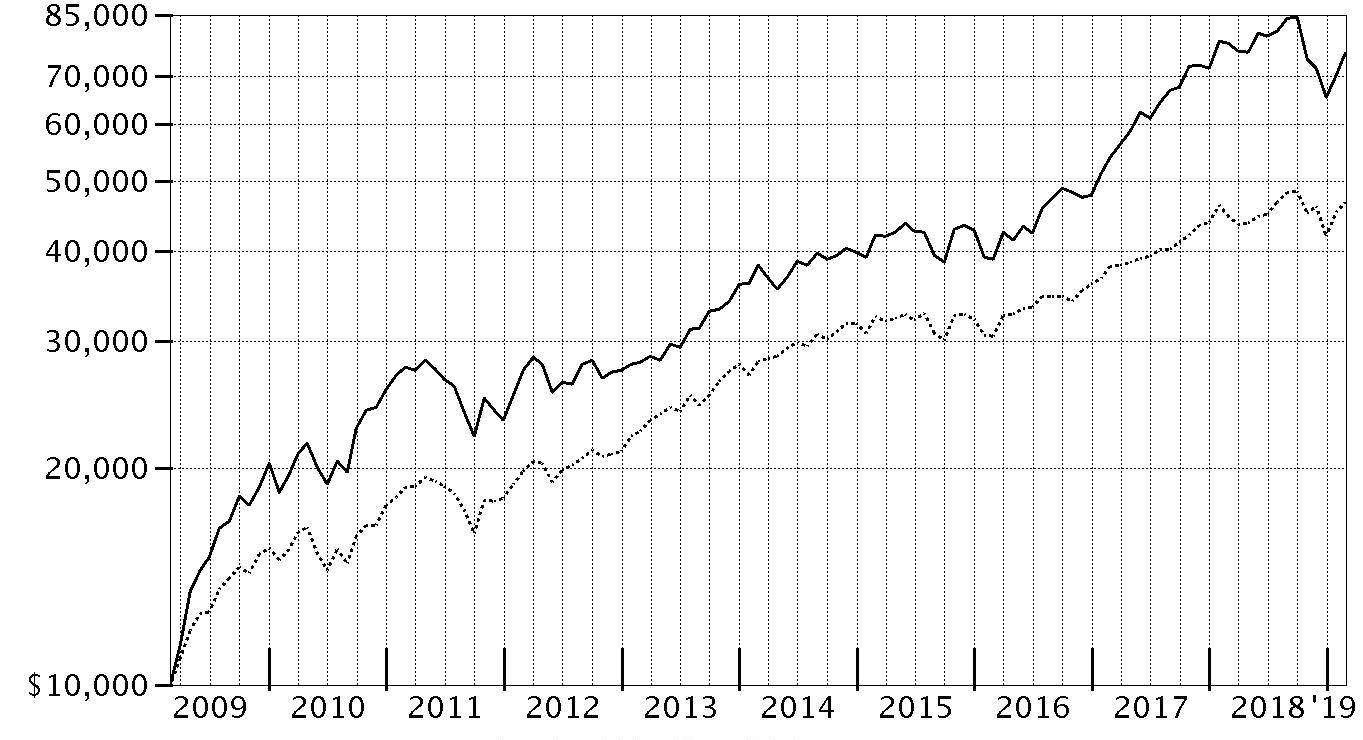
| Period Ending Values |
| $75,288 | Technology Portfolio |
| $46,739 | S&P 500® Index |
Technology Portfolio
Management's Discussion of Fund Performance
Market Recap: The S&P 500
® index gained 4.68% for the 12 months ending February 28, 2019, as the U.S. equity bellwether began the new year on a high note after enduring a final quarter of 2018 in which resurgent volatility upset the aging bull market. In October, rising U.S. Treasury yields and concern about peaking corporate earnings growth sent many investors fleeing from risk assets as they were still dealing with lingering uncertainty related to global trade and the U.S. Federal Reserve picking up the pace of interest rate hikes. The index returned -6.84% in October, at the time its largest monthly drop in seven years. But conditions worsened through Christmas, as jitters about the economy and another hike in rates led to a spike in market volatility and a -9.03% result for December. Sharply reversing course to begin 2019, the S&P 500
® gained 11.48% year-to-date, its strongest two-month opening since 1991, amid upbeat company earnings/outlooks and signs the Fed may pause on rates. For the full period, some economically sensitive sectors fared worst, with financials (-6%) and materials (-6%) both losing ground. Energy gained 1%, while communication services and industrials each rose roughly 2%. In contrast, the defensive utilities (+20%), real estate (+20%) and health care (+11%) sectors led the way, while consumer staples finished near the index. Information technology and consumer discretionary were rattled in the late-2018 downturn, but earlier strength contributed to advances of 9% and roughly 7%, respectively.
Comments from Portfolio Manager Nidhi Gupta: For the fiscal year, the fund returned -3.03%, well behind the 7.42% gain of the MSCI U.S. IMI Information Technology 25/50 Index, and also trailing the broad-based S&P 500
®. Versus the MSCI index, stock selection in the interactive home entertainment and semiconductors groups detracted most by a wide margin the past 12 months. Positioning in technology hardware, storage & peripherals and in data processing & outsourced services also weighed on our relative result. Our positioning in Apple made this stock by far the fund’s largest detractor. Our early-period underweighting of the stock and later overweighting both hurt relative performance. Non-index stakes in Austria-based AMS and Taiwan-based Himax Technologies – two suppliers of components for 3D sensors – further detracted, as did gaming-software maker Activision Blizzard. I exited all three stocks by period end. Conversely, a sizable overweighting in the strong application software segment aided relative performance, along with positioning in systems software. A modest cash position also helped amid volatile equity markets. The fund's foreign holdings contributed overall, despite the drag of a broadly stronger U.S. dollar. A timely underweighting in the shares of social-media platform operator Facebook – which I sold – was the fund’s top contributor versus the MSCI index. Microsoft, our second-best relative contributor, was the fund’s largest holding and a stock I added to considerably the past 12 months.
The views expressed above reflect those of the portfolio manager(s) only through the end of the period as stated on the cover of this report and do not necessarily represent the views of Fidelity or any other person in the Fidelity organization. Any such views are subject to change at any time based upon market or other conditions and Fidelity disclaims any responsibility to update such views. These views may not be relied on as investment advice and, because investment decisions for a Fidelity fund are based on numerous factors, may not be relied on as an indication of trading intent on behalf of any Fidelity fund.
Note to shareholders: On July 14, 2018, Nidhi Gupta became Co-Portfolio Manager of the fund, joining Charlie Chai. The two managed the fund together until January 1, 2019, at which point Charlie retired and Nidhi became sole Portfolio Manager.
Technology Portfolio
Investment Summary (Unaudited)
Top Ten Stocks as of February 28, 2019
| | % of fund's net assets |
| Microsoft Corp. | 15.8 |
| Apple, Inc. | 15.6 |
| Visa, Inc. Class A | 5.5 |
| MasterCard, Inc. Class A | 3.5 |
| Adobe, Inc. | 3.2 |
| Salesforce.com, Inc. | 2.9 |
| Netflix, Inc. | 2.2 |
| Broadcom, Inc. | 2.0 |
| Alphabet, Inc. Class C | 2.0 |
| PayPal Holdings, Inc. | 1.9 |
| | 54.6 |
Top Industries (% of fund's net assets)
| As of February 28, 2019 |
| | Software | 32.8% |
| | IT Services | 21.3% |
| | Technology Hardware, Storage & Peripherals | 17.4% |
| | Semiconductors & Semiconductor Equipment | 15.0% |
| | Internet & Direct Marketing Retail | 3.1% |
| | All Others* | 10.4% |

* Includes short-term investments and net other assets (liabilities).
Technology Portfolio
Schedule of Investments February 28, 2019
Showing Percentage of Net Assets
| Common Stocks - 98.4% | | | |
| | | Shares | Value |
| Communications Equipment - 2.5% | | | |
| Communications Equipment - 2.5% | | | |
| Arista Networks, Inc. (a) | | 48,700 | $13,891,675 |
| Cisco Systems, Inc. | | 1,565,404 | 81,040,965 |
| F5 Networks, Inc. (a) | | 53,624 | 9,016,339 |
| Motorola Solutions, Inc. | | 154,300 | 22,083,416 |
| | | | 126,032,395 |
| Electronic Equipment & Components - 2.4% | | | |
| Electronic Components - 1.0% | | | |
| Amphenol Corp. Class A | | 272,830 | 25,637,835 |
| Corning, Inc. | | 735,966 | 25,618,976 |
| | | | 51,256,811 |
| Electronic Equipment & Instruments - 0.6% | | | |
| Keysight Technologies, Inc. (a) | | 166,086 | 14,019,319 |
| Trimble, Inc. (a) | | 217,782 | 8,713,458 |
| Zebra Technologies Corp. Class A(a) | | 49,200 | 9,865,092 |
| | | | 32,597,869 |
| Electronic Manufacturing Services - 0.5% | | | |
| TE Connectivity Ltd. | | 316,300 | 25,965,067 |
| Technology Distributors - 0.3% | | | |
| CDW Corp. | | 137,400 | 12,900,486 |
|
| TOTAL ELECTRONIC EQUIPMENT & COMPONENTS | | | 122,720,233 |
|
| Entertainment - 2.2% | | | |
| Movies & Entertainment - 2.2% | | | |
| Netflix, Inc. (a) | | 319,486 | 114,407,937 |
| Equity Real Estate Investment Trusts (REITs) - 0.6% | | | |
| Diversified REITs - 0.6% | | | |
| Ant International Co. Ltd. Class C (b)(c) | | 4,366,389 | 27,639,242 |
| Interactive Media & Services - 2.0% | | | |
| Interactive Media & Services - 2.0% | | | |
| Alphabet, Inc. Class C (a) | | 89,968 | 100,756,963 |
| Internet & Direct Marketing Retail - 3.0% | | | |
| Internet & Direct Marketing Retail - 3.0% | | | |
| Amazon.com, Inc. (a) | | 29,600 | 48,538,968 |
| eBay, Inc. | | 1,394,900 | 51,820,535 |
| Meituan Dianping Class B | | 7,480,317 | 55,132,169 |
| | | | 155,491,672 |
| IT Services - 21.3% | | | |
| Data Processing & Outsourced Services - 16.6% | | | |
| Alliance Data Systems Corp. | | 43,000 | 7,439,000 |
| Automatic Data Processing, Inc. | | 391,914 | 59,974,599 |
| Broadridge Financial Solutions, Inc. | | 102,841 | 10,412,651 |
| Fidelity National Information Services, Inc. | | 295,405 | 31,948,051 |
| First Data Corp. Class A (a) | | 429,326 | 10,793,256 |
| Fiserv, Inc. (a) | | 368,900 | 31,242,141 |
| FleetCor Technologies, Inc. (a) | | 84,400 | 19,688,832 |
| Global Payments, Inc. | | 147,600 | 19,244,088 |
| Jack Henry & Associates, Inc. | | 68,093 | 9,031,175 |
| MasterCard, Inc. Class A | | 805,200 | 180,984,804 |
| Paychex, Inc. | | 292,147 | 22,501,162 |
| PayPal Holdings, Inc. (a) | | 984,300 | 96,530,301 |
| Square, Inc. (a) | | 281,200 | 22,844,688 |
| The Western Union Co. | | 356,150 | 6,364,401 |
| Total System Services, Inc. | | 154,300 | 14,565,920 |
| Visa, Inc. Class A | | 1,893,000 | 280,391,160 |
| Worldpay, Inc. (a) | | 285,800 | 27,379,640 |
| | | | 851,335,869 |
| Internet Services & Infrastructure - 2.2% | | | |
| Akamai Technologies, Inc. (a) | | 149,700 | 10,428,102 |
| GoDaddy, Inc. (a) | | 156,400 | 11,675,260 |
| MongoDB, Inc. Class A (a)(d) | | 533,100 | 54,141,636 |
| Okta, Inc. (a) | | 244,300 | 20,736,184 |
| VeriSign, Inc. (a) | | 98,473 | 17,532,133 |
| | | | 114,513,315 |
| IT Consulting & Other Services - 2.5% | | | |
| Accenture PLC Class A | | 560,708 | 90,487,057 |
| DXC Technology Co. | | 260,400 | 17,149,944 |
| Gartner, Inc. (a) | | 80,664 | 11,478,487 |
| Leidos Holdings, Inc. | | 111,167 | 7,180,277 |
| | | | 126,295,765 |
|
| TOTAL IT SERVICES | | | 1,092,144,949 |
|
| Life Sciences Tools & Services - 0.0% | | | |
| Life Sciences Tools & Services - 0.0% | | | |
| JHL Biotech, Inc. (a)(c) | | 1,015,442 | 1,620,807 |
| Semiconductors & Semiconductor Equipment - 15.0% | | | |
| Semiconductor Equipment - 2.4% | | | |
| Applied Materials, Inc. | | 1,606,400 | 61,589,376 |
| ASML Holding NV (Netherlands) | | 95,900 | 17,543,625 |
| KLA-Tencor Corp. | | 148,600 | 17,161,814 |
| Lam Research Corp. | | 144,500 | 25,445,005 |
| | | | 121,739,820 |
| Semiconductors - 12.6% | | | |
| Advanced Micro Devices, Inc. (a) | | 854,900 | 20,115,797 |
| Analog Devices, Inc. | | 333,300 | 35,649,768 |
| Broadcom, Inc. | | 374,864 | 103,222,551 |
| Intel Corp. | | 1,577,041 | 83,520,091 |
| Marvell Technology Group Ltd. | | 1,648,754 | 32,892,642 |
| Maxim Integrated Products, Inc. | | 259,900 | 14,146,357 |
| Microchip Technology, Inc. (d) | | 211,500 | 18,373,005 |
| Micron Technology, Inc. (a) | | 1,058,900 | 43,287,832 |
| NVIDIA Corp. | | 511,550 | 78,911,703 |
| ON Semiconductor Corp. (a) | | 409,000 | 8,785,320 |
| Qorvo, Inc. (a) | | 122,200 | 8,571,108 |
| Qualcomm, Inc. | | 1,251,500 | 66,817,585 |
| Skyworks Solutions, Inc. | | 170,900 | 13,955,694 |
| Texas Instruments, Inc. | | 850,283 | 89,942,936 |
| Xilinx, Inc. | | 228,852 | 28,675,156 |
| | | | 646,867,545 |
|
| TOTAL SEMICONDUCTORS & SEMICONDUCTOR EQUIPMENT | | | 768,607,365 |
|
| Software - 32.0% | | | |
| Application Software - 13.6% | | | |
| Adobe, Inc. (a) | | 626,939 | 164,571,488 |
| ANSYS, Inc. (a) | | 69,698 | 12,354,667 |
| Atlassian Corp. PLC (a) | | 189,925 | 20,413,139 |
| Autodesk, Inc. (a) | | 205,600 | 33,514,856 |
| Cadence Design Systems, Inc. (a) | | 251,142 | 14,377,880 |
| Citrix Systems, Inc. | | 121,248 | 12,791,664 |
| Intuit, Inc. | | 334,400 | 82,640,272 |
| Nutanix, Inc.: | | | |
| Class A (a) | | 103,000 | 5,159,270 |
| Class B (a)(e) | | 72,872 | 3,650,158 |
| Parametric Technology Corp. (a) | | 653,550 | 60,662,511 |
| Salesforce.com, Inc. (a) | | 898,192 | 146,989,121 |
| Splunk, Inc. (a) | | 121,700 | 16,536,596 |
| SS&C Technologies Holdings, Inc. | | 487,600 | 30,026,408 |
| Synopsys, Inc. (a) | | 132,301 | 13,452,366 |
| Ultimate Software Group, Inc. (a) | | 167,201 | 55,427,132 |
| Workday, Inc. Class A (a) | | 133,300 | 26,384,069 |
| | | | 698,951,597 |
| Systems Software - 18.4% | | | |
| Fortinet, Inc. (a) | | 126,529 | 10,981,452 |
| Microsoft Corp. | | 7,237,840 | 810,855,212 |
| Palo Alto Networks, Inc. (a) | | 85,000 | 20,932,950 |
| Red Hat, Inc. (a) | | 159,100 | 29,051,660 |
| ServiceNow, Inc. (a) | | 157,400 | 37,687,856 |
| Symantec Corp. | | 553,900 | 12,457,211 |
| Tableau Software, Inc. (a) | | 62,100 | 8,190,990 |
| VMware, Inc. Class A | | 67,156 | 11,538,072 |
| | | | 941,695,403 |
|
| TOTAL SOFTWARE | | | 1,640,647,000 |
|
| Technology Hardware, Storage & Peripherals - 17.4% | | | |
| Technology Hardware, Storage & Peripherals - 17.4% | | | |
| Apple, Inc. | | 4,632,197 | 802,064,911 |
| Hewlett Packard Enterprise Co. | | 1,340,008 | 21,949,331 |
| HP, Inc. | | 1,444,800 | 28,505,904 |
| NetApp, Inc. | | 244,600 | 15,947,920 |
| Seagate Technology LLC | | 240,500 | 11,197,680 |
| Western Digital Corp. | | 257,900 | 12,972,370 |
| | | | 892,638,116 |
| TOTAL COMMON STOCKS | | | |
| (Cost $4,274,253,093) | | | 5,042,706,679 |
|
| Convertible Preferred Stocks - 1.4% | | | |
| Food & Staples Retailing - 0.5% | | | |
| Food Retail - 0.5% | | | |
| Roofoods Ltd. Series F (a)(b)(c) | | 41,041 | 22,505,243 |
| Internet & Direct Marketing Retail - 0.1% | | | |
| Internet & Direct Marketing Retail - 0.1% | | | |
| Reddit, Inc. Series D (b)(c) | | 250,861 | 5,440,247 |
| Software - 0.8% | | | |
| Application Software - 0.8% | | | |
| Lyft, Inc. Series I (b)(c) | | 343,794 | 17,086,562 |
| Uber Technologies, Inc. Series D, 8.00% (a)(b)(c) | | 515,696 | 25,150,494 |
| | | | 42,237,056 |
| TOTAL CONVERTIBLE PREFERRED STOCKS | | | |
| (Cost $44,231,142) | | | 70,182,546 |
|
| Money Market Funds - 1.5% | | | |
| Fidelity Cash Central Fund, 2.44% (f) | | 8,706,473 | 8,708,214 |
| Fidelity Securities Lending Cash Central Fund 2.45% (f)(g) | | 68,964,449 | 68,971,346 |
| TOTAL MONEY MARKET FUNDS | | | |
| (Cost $77,679,560) | | | 77,679,560 |
| TOTAL INVESTMENT IN SECURITIES - 101.3% | | | |
| (Cost $4,396,163,795) | | | 5,190,568,785 |
| NET OTHER ASSETS (LIABILITIES) - (1.3)% | | | (66,447,287) |
| NET ASSETS - 100% | | | $5,124,121,498 |
Legend
(a) Non-income producing
(b) Restricted securities - Investment in securities not registered under the Securities Act of 1933 (excluding 144A issues). At the end of the period, the value of restricted securities (excluding 144A issues) amounted to $97,821,788 or 1.9% of net assets.
(c) Level 3 security
(d) Security or a portion of the security is on loan at period end.
(e) Security exempt from registration under Rule 144A of the Securities Act of 1933. These securities may be resold in transactions exempt from registration, normally to qualified institutional buyers. At the end of the period, the value of these securities amounted to $3,650,158 or 0.1% of net assets.
(f) Affiliated fund that is generally available only to investment companies and other accounts managed by Fidelity Investments. The rate quoted is the annualized seven-day yield of the fund at period end. A complete unaudited listing of the fund's holdings as of its most recent quarter end is available upon request. In addition, each Fidelity Central Fund's financial statements, which are not covered by the Fund's Report of Independent Registered Public Accounting Firm, are available on the SEC's website or upon request.
(g) Investment made with cash collateral received from securities on loan.
Additional information on each restricted holding is as follows:
| Security | Acquisition Date | Acquisition Cost |
| Ant International Co. Ltd. Class C | 5/16/18 | $24,495,442 |
| Lyft, Inc. Series I | 6/27/18 | $16,279,987 |
| Reddit, Inc. Series D | 2/4/19 | $5,440,247 |
| Roofoods Ltd. Series F | 9/12/17 | $14,510,890 |
| Uber Technologies, Inc. Series D, 8.00% | 6/6/14 | $8,000,018 |
Affiliated Central Funds
Information regarding fiscal year to date income earned by the Fund from investments in Fidelity Central Funds is as follows:
| Fund | Income earned |
| Fidelity Cash Central Fund | $1,146,612 |
| Fidelity Securities Lending Cash Central Fund | 9,359,874 |
| Total | $10,506,486 |
Amounts in the income column in the above table include any capital gain distributions from underlying funds, which are presented in the corresponding line-item in the Statement of Operations, if applicable.
Investment Valuation
The following is a summary of the inputs used, as of February 28, 2019, involving the Fund's assets and liabilities carried at fair value. The inputs or methodology used for valuing securities may not be an indication of the risk associated with investing in those securities. For more information on valuation inputs, and their aggregation into the levels used below, please refer to the Investment Valuation section in the accompanying Notes to Financial Statements.
| | Valuation Inputs at Reporting Date: |
| Description | Total | Level 1 | Level 2 | Level 3 |
| Investments in Securities: | | | | |
| Common Stocks | $5,042,706,679 | $4,940,770,836 | $72,675,794 | $29,260,049 |
| Convertible Preferred Stocks | 70,182,546 | -- | -- | 70,182,546 |
| Money Market Funds | 77,679,560 | 77,679,560 | -- | -- |
| Total Investments in Securities: | $5,190,568,785 | $5,018,450,396 | $72,675,794 | $99,442,595 |
The following is a reconciliation of Investments in Securities and Derivative Instruments for which Level 3 inputs were used in determining value:
| Investments in Securities: | |
| Convertible Preferred Stocks | |
| Beginning Balance | $70,174,412 |
| Total Realized Gain (Loss) | -- |
| Total Unrealized Gain (Loss) | 2,273,549 |
| Cost of Purchases | 21,720,234 |
| Proceeds of Sales | (23,985,649) |
| Amortization/Accretion | -- |
| Transfers in to Level 3 | -- |
| Transfers out of Level 3 | -- |
| Ending Balance | $70,182,546 |
| The change in unrealized gain (loss) for the period attributable to Level 3 securities held at February 28, 2019 | $15,850,493 |
| Other Investments in Securities | |
| Beginning Balance | $6,373,324 |
| Total Realized Gain (Loss) | -- |
| Total Unrealized Gain (Loss) | 532,013 |
| Cost of Purchases | 24,495,442 |
| Proceeds of Sales | (2,140,730) |
| Amortization/Accretion | -- |
| Transfers in to Level 3 | -- |
| Transfers out of Level 3 | -- |
| Ending Balance | $29,260,049 |
| The change in unrealized gain (loss) for the period attributable to Level 3 securities held at February 28, 2019 | $2,636,632 |
The information used in the above reconciliations represents fiscal year to date activity for any Investments in Securities identified as using Level 3 inputs at either the beginning or the end of the current fiscal period. Transfers in or out of Level 3 represent the beginning value of any Security or Instrument where a change in the pricing level occurred from the beginning to the end of the period. The cost of purchases and the proceeds of sales may include securities received or delivered through corporate actions or exchanges. Realized and unrealized gains (losses) disclosed in the reconciliations are included in Net Gain (Loss) on the Fund's Statement of Operations.
See accompanying notes which are an integral part of the financial statements.
Technology Portfolio
Financial Statements
Statement of Assets and Liabilities
| | | February 28, 2019 |
| Assets | | |
Investment in securities, at value (including securities loaned of $68,059,731) — See accompanying schedule:
Unaffiliated issuers (cost $4,318,484,235) | $5,112,889,225 | |
| Fidelity Central Funds (cost $77,679,560) | 77,679,560 | |
| Total Investment in Securities (cost $4,396,163,795) | | $5,190,568,785 |
| Receivable for investments sold | | 548,623 |
| Receivable for fund shares sold | | 3,985,684 |
| Dividends receivable | | 5,961,856 |
| Distributions receivable from Fidelity Central Funds | | 20,585 |
| Prepaid expenses | | 60,081 |
| Other receivables | | 283,124 |
| Total assets | | 5,201,428,738 |
| Liabilities | | |
| Payable for investments purchased | $40,024 | |
| Payable for fund shares redeemed | 4,976,853 | |
| Accrued management fee | 2,254,958 | |
| Other affiliated payables | 727,762 | |
| Other payables and accrued expenses | 347,218 | |
| Collateral on securities loaned | 68,960,425 | |
| Total liabilities | | 77,307,240 |
| Net Assets | | $5,124,121,498 |
| Net Assets consist of: | | |
| Paid in capital | | $4,373,551,167 |
| Total distributable earnings (loss) | | 750,570,331 |
| Net Assets, for 331,753,629 shares outstanding | | $5,124,121,498 |
| Net Asset Value, offering price and redemption price per share ($5,124,121,498 ÷ 331,753,629 shares) | | $15.45 |
See accompanying notes which are an integral part of the financial statements.
Statement of Operations
| | | Year ended February 28, 2019 |
| Investment Income | | |
| Dividends | | $51,583,261 |
| Income from Fidelity Central Funds (including $9,359,874 from security lending) | | 10,506,486 |
| Total income | | 62,089,747 |
| Expenses | | |
| Management fee | $32,020,508 | |
| Transfer agent fees | 9,063,620 | |
| Accounting and security lending fees | 1,172,307 | |
| Custodian fees and expenses | 274,863 | |
| Independent trustees' fees and expenses | 34,256 | |
| Registration fees | 163,478 | |
| Audit | 60,099 | |
| Legal | 38,761 | |
| Interest | 95,042 | |
| Miscellaneous | 51,124 | |
| Total expenses before reductions | 42,974,058 | |
| Expense reductions | (820,521) | |
| Total expenses after reductions | | 42,153,537 |
| Net investment income (loss) | | 19,936,210 |
| Realized and Unrealized Gain (Loss) | | |
| Net realized gain (loss) on: | | |
| Investment securities: | | |
| Unaffiliated issuers | 564,762,713 | |
| Redemptions in-kind with affiliated entities | 473,405,337 | |
| Fidelity Central Funds | (34,465) | |
| Foreign currency transactions | (666,863) | |
| Total net realized gain (loss) | | 1,037,466,722 |
| Change in net unrealized appreciation (depreciation) on: | | |
| Investment securities: | | |
| Unaffiliated issuers | (1,294,913,025) | |
| Assets and liabilities in foreign currencies | (4,802) | |
| Total change in net unrealized appreciation (depreciation) | | (1,294,917,827) |
| Net gain (loss) | | (257,451,105) |
| Net increase (decrease) in net assets resulting from operations | | $(237,514,895) |
See accompanying notes which are an integral part of the financial statements.
Statement of Changes in Net Assets
| | Year ended February 28, 2019 | Year ended February 28, 2018 |
| Increase (Decrease) in Net Assets | | |
| Operations | | |
| Net investment income (loss) | $19,936,210 | $574,919 |
| Net realized gain (loss) | 1,037,466,722 | 1,012,836,343 |
| Change in net unrealized appreciation (depreciation) | (1,294,917,827) | 1,037,513,581 |
| Net increase (decrease) in net assets resulting from operations | (237,514,895) | 2,050,924,843 |
| Distributions to shareholders | (1,122,751,603) | – |
| Distributions to shareholders from net investment income | – | (272,638) |
| Distributions to shareholders from net realized gain | – | (484,814,934) |
| Total distributions | (1,122,751,603) | (485,087,572) |
| Share transactions | | |
| Proceeds from sales of shares | 1,410,590,985 | 3,144,473,009 |
| Reinvestment of distributions | 1,076,404,658 | 464,201,228 |
| Cost of shares redeemed | (3,244,907,806) | (2,051,700,173) |
| Net increase (decrease) in net assets resulting from share transactions | (757,912,163) | 1,556,974,064 |
| Total increase (decrease) in net assets | (2,118,178,661) | 3,122,811,335 |
| Net Assets | | |
| Beginning of period | 7,242,300,159 | 4,119,488,824 |
| End of period | $5,124,121,498 | $7,242,300,159 |
| Other Information | | |
| Distributions in excess of net investment income end of period | | $(247,344) |
| Shares(a) | | |
| Sold | 80,059,360 | 181,368,690 |
| Issued in reinvestment of distributions | 68,331,578 | 27,683,120 |
| Redeemed | (190,798,339) | (115,214,270) |
| Net increase (decrease) | (42,407,401) | 93,837,540 |
(a) Share activity prior to August 10, 2018 has been adjusted to reflect the impact of the 10 for 1 share split that occurred on that date.
See accompanying notes which are an integral part of the financial statements.
Financial Highlights
Technology Portfolio
| | | | | | |
| Years ended February 28, | 2019 | 2018 | 2017 | 2016 A | 2015 |
| Selected Per–Share DataB | | | | | |
| Net asset value, beginning of period | $19.36 | $14.70 | $10.78 | $12.09 | $13.07 |
| Income from Investment Operations | | | | | |
| Net investment income (loss)C | .06 | – | .01 | .01 | .02 |
| Net realized and unrealized gain (loss) | (.78) | 6.15 | 4.11 | (.82) | 1.03 |
| Total from investment operations | (.72) | 6.15 | 4.12 | (.81) | 1.05 |
| Distributions from net investment income | (.02) | – | (.01) | (.01) | (.02) |
| Distributions from net realized gain | (3.17) | (1.49) | (.19) | (.49) | (2.01) |
| Total distributions | (3.19) | (1.49) | (.20) | (.50) | (2.03) |
| Redemption fees added to paid in capitalC | – | – | –D | –D | –D |
| Net asset value, end of period | $15.45 | $19.36 | $14.70 | $10.78 | $12.09 |
| Total ReturnE | (3.03)% | 43.71% | 38.52% | (7.16)% | 9.97% |
| Ratios to Average Net AssetsF,G | | | | | |
| Expenses before reductions | .72% | .75% | .77% | .78% | .78% |
| Expenses net of fee waivers, if any | .72% | .75% | .77% | .77% | .78% |
| Expenses net of all reductions | .71% | .74% | .76% | .76% | .78% |
| Net investment income (loss) | .34% | .01% | .11% | .11% | .13% |
| Supplemental Data | | | | | |
| Net assets, end of period (000 omitted) | $5,124,121 | $7,242,300 | $4,119,489 | $2,777,346 | $2,824,848 |
| Portfolio turnover rateH | 126%I | 71% | 82% | 130% | 144% |
A For the year ended February 29.
B Per share amounts have been adjusted to reflect the impact of the 10 to 1 share split that occurred on August 10, 2018.
C Calculated based on average shares outstanding during the period.
D Amount represents less than $.005 per share.
E Total returns would have been lower if certain expenses had not been reduced during the applicable periods shown.
F Fees and expenses of any underlying Fidelity Central Funds are not included in the Fund's expense ratio. The Fund indirectly bears its proportionate share of the expenses of any underlying Fidelity Central Funds.
G Expense ratios reflect operating expenses of the Fund. Expenses before reductions do not reflect amounts reimbursed by the investment adviser or reductions from brokerage service arrangements or reductions from other expense offset arrangements and do not represent the amount paid by the Fund during periods when reimbursements or reductions occur. Expenses net of fee waivers reflect expenses after reimbursement by the investment adviser but prior to reductions from brokerage service arrangements or other expense offset arrangements. Expenses net of all reductions represent the net expenses paid by the Fund.
H Amount does not include the portfolio activity of any underlying Fidelity Central Funds.
I Portfolio turnover rate excludes securities received or delivered in-kind.
See accompanying notes which are an integral part of the financial statements.
Notes to Financial Statements
For the period ended February 28, 2019
1. Organization.
Communications Equipment Portfolio, Computers Portfolio, IT Services Portfolio, Semiconductors Portfolio, Software and IT Services Portfolio, and Technology Portfolio (the Funds) are non-diversified funds of Fidelity Select Portfolios (the Trust). The Trust is registered under the Investment Company Act of 1940, as amended (the 1940 Act), as an open-end management investment company organized as a Massachusetts business trust. The Funds invest primarily in securities of companies whose principal business activities fall within specific industries. Each Fund is authorized to issue an unlimited number of shares. Share transactions on the Statement of Changes in Net Assets may contain exchanges between affiliated funds. Certain Funds' investments in emerging markets can be subject to social, economic, regulatory, and political uncertainties and can be extremely volatile.
Effective May 11, 2018, May 11, 2018 and August 10, 2018, Semiconductors Portfolio, Software and IT Services Portfolio and Technology Portfolio underwent a 10 for 1 share split, respectively. The effect of the share split transaction was to multiply the number of outstanding shares of Semiconductors Portfolio, Software and IT Services Portfolio and Technology Portfolio by a split factor of 10:1, with a corresponding decrease in net assets value (NAV) per share. This event does not impact the overall net assets of Semiconductors Portfolio, Software and IT Services Portfolio and Technology Portfolio. The per share data presented in the Financial Highlights and Shares activity presented in the Statement of Changes in Net Assets for Semiconductors Portfolio, Software and IT Services Portfolio and Technology Portfolio have been retroactively adjusted to reflect this share split.
2. Investments in Fidelity Central Funds.
The Funds invest in Fidelity Central Funds, which are open-end investment companies generally available only to other investment companies and accounts managed by the investment adviser and its affiliates. The Funds' Schedules of Investments list each of the Fidelity Central Funds held as of period end, if any, as an investment of each Fund, but do not include the underlying holdings of each Fidelity Central Fund. As an Investing Fund, each Fund indirectly bears its proportionate share of the expenses of the underlying Fidelity Central Funds.
The Money Market Central Funds seek preservation of capital and current income and are managed by Fidelity Investments Money Management, Inc. (FIMM), an affiliate of the investment adviser. Annualized expenses of the Money Market Central Funds as of their most recent shareholder report date are less than .005%.
A complete unaudited list of holdings for each Fidelity Central Fund is available upon request or at the Securities and Exchange Commission (the SEC) website at www.sec.gov. In addition, the financial statements of the Fidelity Central Funds, which are not covered by the Funds' Report of Independent Registered Public Accounting Firm, are available on the SEC website or upon request.
3. Significant Accounting Policies.
Each Fund is an investment company and applies the accounting and reporting guidance of the Financial Accounting Standards Board (FASB) Accounting Standards Codification Topic 946 Financial Services – Investments Companies. The financial statements have been prepared in conformity with accounting principles generally accepted in the United States of America (GAAP), which require management to make certain estimates and assumptions at the date of the financial statements. Actual results could differ from those estimates. Subsequent events, if any, through the date that the financial statements were issued have been evaluated in the preparation of the financial statements. The following summarizes the significant accounting policies of the Funds:
Investment Valuation. Investments are valued as of 4:00 p.m. Eastern time on the last calendar day of the period. The Board of Trustees (the Board) has delegated the day to day responsibility for the valuation of each Fund's investments to the Fair Value Committee (the Committee) established by each Fund's investment adviser. In accordance with valuation policies and procedures approved by the Board, each Fund attempts to obtain prices from one or more third party pricing vendors or brokers to value its investments. When current market prices, quotations or currency exchange rates are not readily available or reliable, investments will be fair valued in good faith by the Committee, in accordance with procedures adopted by the Board. Factors used in determining fair value vary by investment type and may include market or investment specific events. The frequency with which these procedures are used cannot be predicted and they may be utilized to a significant extent. The Committee oversees each Fund's valuation policies and procedures and reports to the Board on the Committee's activities and fair value determinations. The Board monitors the appropriateness of the procedures used in valuing each Fund's investments and ratifies the fair value determinations of the Committee.
Each Fund categorizes the inputs to valuation techniques used to value its investments into a disclosure hierarchy consisting of three levels as shown below:
- Level 1 – quoted prices in active markets for identical investments
- Level 2 – other significant observable inputs (including quoted prices for similar investments, interest rates, prepayment speeds, etc.)
- Level 3 – unobservable inputs (including the Fund's own assumptions based on the best information available)
Valuation techniques used to value each Fund's investments by major category are as follows:
Equity securities, including restricted securities, for which market quotations are readily available, are valued at the last reported sale price or official closing price as reported by a third party pricing vendor on the primary market or exchange on which they are traded and are categorized as Level 1 in the hierarchy. In the event there were no sales during the day or closing prices are not available, securities are valued at the last quoted bid price or may be valued using the last available price and are generally categorized as Level 2 in the hierarchy. For foreign equity securities, when market or security specific events arise, comparisons to the valuation of American Depositary Receipts (ADRs), futures contracts, Exchange-Traded Funds (ETFs) and certain indexes as well as quoted prices for similar securities may be used and would be categorized as Level 2 in the hierarchy. For equity securities, including restricted securities, where observable inputs are limited, assumptions about market activity and risk are used and these securities may be categorized as Level 3 in the hierarchy. Equity securities, including restricted securities, for which observable inputs are not available are valued using alternate valuation approaches, including the market approach and the income approach and are categorized as Level 3 in the hierarchy. The market approach generally consists of using comparable market transactions while the income approach generally consists of using the net present value of estimated future cash flows, adjusted as appropriate for liquidity, credit, market and/or other risk factors.
Investments in open-end mutual funds, including the Fidelity Central Funds, are valued at their closing net asset value (NAV) each business day and are categorized as Level 1 in the hierarchy.
The following provides information on Level 3 securities held by Technology Portfolio that were valued at period end based on unobservable inputs. These amounts exclude valuations provided by a broker.
| Asset Type | Fair Value | Valuation Technique (s) | Unobservable Input | Amount or Range / Weighted Average | Impact to Valuation from an Increase in Input(a) |
| Equities | $99,442,595 | Market comparable | Enterprise value/Sales multiple (EV/S) | 2.8 - 8.8 / 6.5 | Increase |
| | | | Discount rate | 6.0% - 30.0% / 15.2% | Decrease |
| | | Market approach | Transaction price | $21.69 - $548.36 / $257.75 | Increase |
| | | | Discount for lack of marketability | 20.0% | Decrease |
(a) Represents the directional change in the fair value of the Level 3 investments that could have resulted from an increase in the corresponding input as of period end. A decrease to the unobservable input would have had the opposite effect. Significant changes in these inputs may have resulted in a significantly higher or lower fair value measurement at period end.
Changes in valuation techniques may result in transfers in or out of an assigned level within the disclosure hierarchy. The aggregate value of investments by input level as of February 28, 2019, as well as a roll forward of Level 3 investments, is included at the end of each applicable Fund's Schedule of Investments.
Foreign Currency. The Funds may use foreign currency contracts to facilitate transactions in foreign-denominated securities. Gains and losses from these transactions may arise from changes in the value of the foreign currency or if the counterparties do not perform under the contracts' terms.
Foreign-denominated assets, including investment securities, and liabilities are translated into U.S. dollars at the exchange rates at period end. Purchases and sales of investment securities, income and dividends received and expenses denominated in foreign currencies are translated into U.S. dollars at the exchange rate in effect on the transaction date.
The effects of exchange rate fluctuations on investments are included with the net realized and unrealized gain (loss) on investment securities. Other foreign currency transactions resulting in realized and unrealized gain (loss) are disclosed separately.
Investment Transactions and Income. For financial reporting purposes, the Funds' investment holdings and NAV include trades executed through the end of the last business day of the period. The NAV per share for processing shareholder transactions is calculated as of the close of business of the New York Stock Exchange (NYSE), normally 4:00 p.m. Eastern time and includes trades executed through the end of the prior business day. Gains and losses on securities sold are determined on the basis of identified cost and for certain Funds include proceeds received from litigation. Dividend income is recorded on the ex-dividend date, except for certain dividends from foreign securities where the ex-dividend date may have passed, which are recorded as soon as the Funds are informed of the ex-dividend date. Non-cash dividends included in dividend income, if any, are recorded at the fair market value of the securities received. Income and capital gain distributions from Fidelity Central Funds, if any, are recorded on the ex-dividend date. Certain distributions received by the Funds represent a return of capital or capital gain. The Funds determine the components of these distributions subsequent to the ex-dividend date, based upon receipt of tax filings or other correspondence relating to the underlying investment. These distributions are recorded as a reduction of cost of investments and/or as a realized gain. Investment income is recorded net of foreign taxes withheld where recovery of such taxes is uncertain.
Expenses. Expenses directly attributable to a fund are charged to that fund. Expenses attributable to more than one fund are allocated among the respective funds on the basis of relative net assets or other appropriate methods. Expense estimates are accrued in the period to which they relate and adjustments are made when actual amounts are known.
Deferred Trustee Compensation. Under a Deferred Compensation Plan (the Plan) for Computers Portfolio, Semiconductors Portfolio, Software and IT Services Portfolio and Technology Portfolio, certain independent Trustees have elected to defer receipt of a portion of their annual compensation. Deferred amounts are invested in a cross-section of Fidelity funds, are marked-to-market and remain in each Fund until distributed in accordance with the Plan. The investment of deferred amounts and the offsetting payable to the Trustees presented below are included in each accompanying Statement of Assets and Liabilities in other receivables and other payables and accrued expenses, respectively.
| Computers Portfolio | $38,889 |
| Semiconductors Portfolio | 159,635 |
| Software and IT Services Portfolio | 245,252 |
| Technology Portfolio | 237,043 |
Income Tax Information and Distributions to Shareholders. Each year, each Fund intends to qualify as a regulated investment company under Subchapter M of the Internal Revenue Code, including distributing substantially all of its taxable income and realized gains. As a result, no provision for U.S. Federal income taxes is required. As of February 28, 2019, each Fund did not have any unrecognized tax benefits in the financial statements; nor is each Fund aware of any tax positions for which it is reasonably possible that the total amounts of unrecognized tax benefits will significantly change in the next twelve months. Each Fund files a U.S. federal tax return, in addition to state and local tax returns as required. Each Fund's federal income tax returns are subject to examination by the Internal Revenue Service (IRS) for a period of three fiscal years after they are filed. State and local tax returns may be subject to examination for an additional fiscal year depending on the jurisdiction. Foreign taxes are provided for based on each Fund's understanding of the tax rules and rates that exist in the foreign markets in which it invests.
Distributions are declared and recorded on the ex-dividend date. Income and capital gain distributions are determined in accordance with income tax regulations, which may differ from GAAP. These differences resulted in distribution reclassifications. In addition, certain Funds claimed a portion of the payment made to redeeming shareholders as a distribution for income tax purposes.
Capital accounts within the financial statements are adjusted for permanent book-tax differences. These adjustments have no impact on net assets or the results of operations. Capital accounts are not adjusted for temporary book-tax differences which will reverse in a subsequent period.
Book-tax differences are primarily due to foreign currency transactions, passive foreign investment companies (PFIC), redemptions in kind, deferred trustee's compensation, losses deferred due to wash sales and excise tax regulations.
As of period end, the cost and unrealized appreciation (depreciation) in securities, and derivatives if applicable, for federal income tax purposes were as follows for each Fund:
| | Tax cost | Gross unrealized appreciation | Gross unrealized depreciation | Net unrealized appreciation (depreciation) |
| Communications Equipment Portfolio | $182,856,036 | $64,307,487 | $(3,846,929) | $60,460,558 |
| Computers Portfolio | 381,940,582 | 113,533,214 | (7,284,549) | 106,248,665 |
| IT Services Portfolio | 1,600,304,686 | 1,285,820,724 | (28,384,030) | 1,257,436,694 |
| Semiconductors Portfolio | 2,692,965,977 | 619,360,941 | (136,177,835) | 483,183,106 |
| Software and IT Services Portfolio | 4,383,596,523 | 2,258,866,281 | (93,180,276) | 2,165,686,005 |
| Technology Portfolio | 4,421,346,220 | 915,263,274 | (146,040,709) | 769,222,565 |
The tax-based components of distributable earnings as of period end were as follows for each Fund:
| | Undistributed ordinary income | Undistributed long-term capital gain | Net unrealized appreciation (depreciation) on securities and other investments |
| Communications Equipment Portfolio | $26,526 | $3,727,716 | $60,460,547 |
| Computers Portfolio | – | 41,937,455 | 106,168,881 |
| IT Services Portfolio | 347,547 | 16,402,373 | 1,257,427,835 |
| Semiconductors Portfolio | 1,983,573 | – | 483,183,157 |
| Software and IT Services Portfolio | 3,752,042 | 665,045,288 | 2,165,601,161 |
| Technology Portfolio | – | – | 769,220,849 |
In addition, certain of the Funds intend to elect to defer to the next fiscal year capital losses recognized during the period November 1, 2018 to February 28, 2019, and ordinary losses recognized during the period January 1, 2019 to February 28, 2019. Loss deferrals were as follows:
| | Capital losses | Ordinary losses |
| Computers Portfolio | – | (120,917) |
| Semiconductors Portfolio | (76,699,891) | – |
| Technology Portfolio | (18,413,476) | – |
The tax character of distributions paid was as follows:
| February 28, 2019 | | | |
| | Ordinary Income | Long-term Capital Gains | Total |
| Communications Equipment Portfolio | $3,815,877 | $11,504,035 | $15,319,912 |
| Computers Portfolio | 6,584,043 | 81,364,400 | 87,948,443 |
| IT Services Portfolio | 5,754,493 | 105,650,867 | 111,405,360 |
| Semiconductors Portfolio | 238,841,513 | 372,720,573 | 611,562,086 |
| Software and IT Services Portfolio | 86,334,756 | 246,676,415 | 333,011,171 |
| Technology Portfolio | 232,174,304 | 890,577,299 | 1,122,751,603 |
| February 28, 2018 | | | |
| | Ordinary Income | Long-term Capital Gains | Total |
| Communications Equipment Portfolio | $2,537,101 | $804,161 | $3,341,262 |
| Computers Portfolio | 10,201,254 | 47,002,141 | 57,203,395 |
| IT Services Portfolio | 2,702,217 | 60,416,453 | 63,118,670 |
| Semiconductors Portfolio | 236,050,759 | 235,616,049 | 471,666,808 |
| Software and IT Services Portfolio | 77,868,471 | 262,448,441 | 340,316,912 |
| Technology Portfolio | 243,491,935 | 241,595,637 | 485,087,572 |
Restricted Securities. The Funds may invest in securities that are subject to legal or contractual restrictions on resale. These securities generally may be resold in transactions exempt from registration or to the public if the securities are registered. Disposal of these securities may involve time-consuming negotiations and expense, and prompt sale at an acceptable price may be difficult. Information regarding restricted securities is included at the end of each applicable Fund's Schedule of Investments.
New Rule Issuance. During August 2018, the U.S. Securities and Exchange Commission issued Final Rule Release No. 33-10532, Disclosure Update and Simplification. This Final Rule includes amendments specific to registered investment companies that are intended to eliminate overlap in disclosure requirements between Regulation S-X and GAAP. In accordance with these amendments, certain line-items in the Funds' financial statements have been combined or removed for the current period as outlined in the table below.
| Financial Statement | Current Line-Item Presentation (As Applicable) | Prior Line-Item Presentation (As Applicable) |
| Statement of Assets and Liabilities | Total distributable earnings (loss) | Undistributed/Distributions in excess of/Accumulated net investment income (loss)
Accumulated/Undistributed net realized gain (loss)
Net unrealized appreciation (depreciation) |
| Statement of Changes in Net Assets | N/A - removed | Undistributed/Distributions in excess of/Accumulated net investment income (loss) end of period |
| Statement of Changes in Net Assets | Distributions to shareholders | Distributions to shareholders from net investment income
Distributions to shareholders from net realized gain |
4. Purchases and Sales of Investments.
Purchases and sales of securities, other than short-term securities and in-kind transactions, are noted in the table below.
| | Purchases ($) | Sales ($) |
| Communications Equipment Portfolio | 153,788,489 | 163,153,123 |
| Computers Portfolio | 415,079,980 | 457,293,661 |
| IT Services Portfolio | 832,135,288 | 653,739,380 |
| Semiconductors Portfolio | 4,187,469,984 | 4,718,408,890 |
| Software and IT Services Portfolio | 2,993,357,977 | 2,816,590,657 |
| Technology Portfolio | 7,391,874,098 | 7,980,706,056 |
5. Fees and Other Transactions with Affiliates.
Management Fee. Fidelity SelectCo, LLC (the investment adviser) and its affiliates provide the Funds with investment management related services for which the Funds pay a monthly management fee. The management fee is the sum of an individual fund fee rate and an annualized group fee rate. The individual fund fee rate is applied to each Fund's average net assets. The group fee rate is based upon the average net assets of all the mutual funds advised by Fidelity Management & Research Company (FMR) and the investment adviser. The group fee rate decreases as assets under management increase and increases as assets under management decrease. For the reporting period, each Fund's annual management fee rate expressed as a percentage of each Fund's average net assets was as follows:
| | Individual Rate | Group Rate | Total |
| Communications Equipment Portfolio | .30% | .24% | .54% |
| Computers Portfolio | .30% | .24% | .54% |
| IT Services Portfolio | .30% | .24% | .54% |
| Semiconductors Portfolio | .30% | .24% | .54% |
| Software and IT Services Portfolio | .30% | .24% | .54% |
| Technology Portfolio | .30% | .24% | .54% |
Transfer Agent Fees. Fidelity Investments Institutional Operations Company, Inc. (FIIOC), an affiliate of the investment adviser, is the Funds' transfer, dividend disbursing and shareholder servicing agent. FIIOC receives account fees and asset-based fees that vary according to account size and type of account. FIIOC pays for typesetting, printing and mailing of shareholder reports, except proxy statements. For the period, transfer agent fees were equivalent to the following annual rates expressed as a percentage of average net assets:
| Communications Equipment Portfolio | .20% |
| Computers Portfolio | .17% |
| IT Services Portfolio | .16% |
| Semiconductors Portfolio | .16% |
| Software and IT Services Portfolio | .15% |
| Technology Portfolio | .15% |
Accounting and Security Lending Fees. Fidelity Service Company, Inc. (FSC), an affiliate of the investment adviser, maintains each Fund's accounting records. The accounting fee is based on the level of average net assets for each month. Under a separate contract, FSC administers the security lending program. The security lending fee is based on the number and duration of lending transactions. For the period, the fees were equivalent to the following annual rates:
| | % of Average Net Assets |
| Communications Equipment Portfolio | .04 |
| Computers Portfolio | .04 |
| IT Services Portfolio | .03 |
| Semiconductors Portfolio | .03 |
| Software and IT Services Portfolio | .02 |
| Technology Portfolio | .02 |
Brokerage Commissions. Certain Funds placed a portion of their portfolio transactions with brokerage firms which are affiliates of the investment adviser. Brokerage commissions are included in net realized gain (loss) and change in net unrealized appreciation (depreciation) in the Statement of Operations. The commissions paid to these affiliated firms were as follows:
| | Amount |
| Communications Equipment Portfolio | $6,994 |
| Computers Portfolio | 7,750 |
| IT Services Portfolio | 21,259 |
| Semiconductors Portfolio | 132,159 |
| Software and IT Services Portfolio | 54,952 |
| Technology Portfolio | 182,443 |
Interfund Lending Program. Pursuant to an Exemptive Order issued by the SEC, the Funds, along with other registered investment companies having management contracts with Fidelity Management & Research Company (FMR) or other affiliated entities of FMR, may participate in an interfund lending program. This program provides an alternative credit facility allowing the funds to borrow from, or lend money to, other participating affiliated funds. At period end, there were no interfund loans outstanding. Each applicable fund's activity in this program during the period for which loans were outstanding was as follows:
| | Borrower or Lender | Average Loan Balance | Weighted Average Interest Rate | Interest Expense |
| Communications Equipment Portfolio | Borrower | $7,760,375 | 2.52% | $4,354 |
| IT Services Portfolio | Borrower | $6,695,000 | 2.65% | $986 |
| Semiconductors Portfolio | Borrower | $12,143,000 | 1.99% | $4,037 |
| Technology Portfolio | Borrower | $36,908,600 | 2.32% | $95,042 |
Interfund Trades. The Funds may purchase from or sell securities to other Fidelity Funds under procedures adopted by the Board. The procedures have been designed to ensure these interfund trades are executed in accordance with Rule 17a-7 of the 1940 Act. Interfund trades are included within the respective purchases and sales amounts shown in the Purchases and Sales of Investments note.
Affiliated Redemptions In-Kind. During the period, 68,677,500* shares of Technology Portfolio were redeemed in-kind for investments and cash with a value of $1,186,541,219. The net realized gain of $473,405,337 on investments delivered through in-kind redemptions is included in the accompanying Statement of Operations. The amount of in-kind redemptions is included in share transactions in the accompanying Statement of Changes in Net Assets. Technology Portfolio recognized no gain or loss for federal income tax purposes.
* Share activity prior to August 10, 2018 has been adjusted to reflect the impact of the 10 to 1 share split that occurred on that date.
Other. During the period, the investment adviser reimbursed the Fund for certain losses as follow:
| | Amount |
| Semiconductors Portfolio | $17,270 |
| Technology Portfolio | 1,726 |
6. Committed Line of Credit.
Certain Funds participate with other funds managed by the investment adviser or an affiliate in a $4.25 billion credit facility (the "line of credit") to be utilized for temporary or emergency purposes to fund shareholder redemptions or for other short-term liquidity purposes. The participating funds have agreed to pay commitment fees on their pro-rata portion of the line of credit, which are reflected in Miscellaneous expenses on the Statement of Operations, and are as follows:
| Communications Equipment Portfolio | $586 |
| Computers Portfolio | 1,436 |
| IT Services Portfolio | 6,726 |
| Semiconductors Portfolio | 9,268 |
| Software and IT Services Portfolio | 16,074 |
| Technology Portfolio | 17,053 |
During the period, the Funds did not borrow on this line of credit.
7. Security Lending.
Certain Funds lend portfolio securities through a lending agent from time to time in order to earn additional income. On the settlement date of the loan, each applicable Fund receives collateral (in the form of U.S. Treasury obligations, letters of credit and/or cash) against the loaned securities and maintains collateral in an amount not less than 100% of the market value of the loaned securities during the period of the loan. The market value of the loaned securities is determined at the close of business of the Funds and any additional required collateral is delivered to the Funds on the next business day. The Funds or borrower may terminate the loan at any time, and if the borrower defaults on its obligation to return the securities loaned because of insolvency or other reasons, the Funds may apply collateral received from the borrower against the obligation. The Funds may experience delays and costs in recovering the securities loaned. Any cash collateral received is invested in the Fidelity Securities Lending Cash Central Fund. The value of loaned securities and cash collateral at period end are disclosed on each applicable Fund's Statement of Assets and Liabilities. Security lending income represents the income earned on investing cash collateral, less rebates paid to borrowers and any lending agent fees associated with the loan, plus any premium payments received for lending certain types of securities. Security lending income is presented on each applicable Fund's Statement of Operations as a component of income from Fidelity Central Funds.
8. Expense Reductions.
Commissions paid to certain brokers with whom the investment adviser, or its affiliates, places trades on behalf of certain Funds include an amount in addition to trade execution, which may be rebated back to the Funds to offset certain expenses. In addition, through arrangements with each applicable Fund's custodian and transfer agent, credits realized as a result of certain uninvested cash balances were used to reduce each applicable Fund's expenses. All of the applicable expense reductions are noted in the table below.
| | Brokerage Service reduction | Custody expense reduction | Transfer Agent expense reduction |
| Communications Equipment Portfolio | $23,103 | $– | $– |
| Computers Portfolio | 10,550 | – | – |
| IT Services Portfolio | 40,397 | 655 | – |
| Semiconductors Portfolio | 521,900 | 1,724 | 1,154 |
| Software and IT Services Portfolio | 113,805 | 1,880 | – |
| Technology Portfolio | 767,759 | 4,126 | 1,079 |
In addition, during the period the investment adviser reimbursed and/or waived a portion of operating expenses as follows:
| | Amount |
| Communications Equipment Portfolio | $1,660 |
| Computers Portfolio | 4,233 |
| IT Services Portfolio | 18,965 |
| Semiconductors Portfolio | 26,141 |
| Software and IT Services Portfolio | 45,669 |
| Technology Portfolio | 47,557 |
9. Other.
The Funds' organizational documents provide former and current trustees and officers with a limited indemnification against liabilities arising in connection with the performance of their duties to the Funds. In the normal course of business, the Funds may also enter into contracts that provide general indemnifications. The Funds' maximum exposure under these arrangements is unknown as this would be dependent on future claims that may be made against the Funds. The risk of material loss from such claims is considered remote.
Report of Independent Registered Public Accounting Firm
To the Board of Trustees of Fidelity Select Portfolios and Shareholders of Communications Equipment Portfolio, Computers Portfolio, IT Services Portfolio, Semiconductors Portfolio, Software and IT Services Portfolio and Technology Portfolio:
Opinions on the Financial Statements
We have audited the accompanying statements of assets and liabilities, including the schedules of investments, of Communications Equipment Portfolio, Computers Portfolio, IT Services Portfolio, Semiconductors Portfolio, Software and IT Services Portfolio and Technology Portfolio (six of the funds constituting Fidelity Select Portfolios, hereafter collectively referred to as the "Funds") as of February 28, 2019, the related statements of operations for the year ended February 28, 2019, the statements of changes in net assets for each of the two years in the period ended February 28, 2019, including the related notes, and the financial highlights for each of the five years in the period ended February 28, 2019 (collectively referred to as the “financial statements”). In our opinion, the financial statements present fairly, in all material respects, the financial position of each of the Funds as of February 28, 2019, the results of each of their operations for the year then ended, the changes in each of their net assets for each of the two years in the period ended February 28, 2019 and each of the financial highlights for each of the five years in the period ended February 28, 2019 in conformity with accounting principles generally accepted in the United States of America.
Basis for Opinions
These financial statements are the responsibility of the Funds' management. Our responsibility is to express an opinion on the Funds' financial statements based on our audits. We are a public accounting firm registered with the Public Company Accounting Oversight Board (United States) (PCAOB) and are required to be independent with respect to the Funds in accordance with the U.S. federal securities laws and the applicable rules and regulations of the Securities and Exchange Commission and the PCAOB.
We conducted our audits of these financial statements in accordance with the standards of the PCAOB. Those standards require that we plan and perform the audit to obtain reasonable assurance about whether the financial statements are free of material misstatement, whether due to error or fraud.
Our audits included performing procedures to assess the risks of material misstatement of the financial statements, whether due to error or fraud, and performing procedures that respond to those risks. Such procedures included examining, on a test basis, evidence regarding the amounts and disclosures in the financial statements. Our audits also included evaluating the accounting principles used and significant estimates made by management, as well as evaluating the overall presentation of the financial statements. Our procedures included confirmation of securities owned as of February 28, 2019 by correspondence with the custodian and brokers; when replies were not received from brokers, we performed other auditing procedures. We believe that our audits provide a reasonable basis for our opinions.
PricewaterhouseCoopers LLP
Boston, Massachusetts
April 12, 2019
We have served as the auditor of one or more investment companies in the Fidelity group of funds since 1932.
Trustees and Officers
The Trustees, Members of the Advisory Board (if any), and officers of the trust and funds, as applicable, are listed below. The Board of Trustees governs each fund and is responsible for protecting the interests of shareholders. The Trustees are experienced executives who meet periodically throughout the year to oversee each fund's activities, review contractual arrangements with companies that provide services to each fund, oversee management of the risks associated with such activities and contractual arrangements, and review each fund's performance. Except for Michael E. Wiley, each of the Trustees oversees 287 funds. Mr. Wiley oversees 195 funds.
The Trustees hold office without limit in time except that (a) any Trustee may resign; (b) any Trustee may be removed by written instrument, signed by at least two-thirds of the number of Trustees prior to such removal; (c) any Trustee who requests to be retired or who has become incapacitated by illness or injury may be retired by written instrument signed by a majority of the other Trustees; and (d) any Trustee may be removed at any special meeting of shareholders by a two-thirds vote of the outstanding voting securities of the trust. Each Trustee who is not an interested person (as defined in the 1940 Act) of the trust and the funds is referred to herein as an Independent Trustee. Each Independent Trustee shall retire not later than the last day of the calendar year in which his or her 75th birthday occurs. The Independent Trustees may waive this mandatory retirement age policy with respect to individual Trustees. Officers and Advisory Board Members hold office without limit in time, except that any officer or Advisory Board Member may resign or may be removed by a vote of a majority of the Trustees at any regular meeting or any special meeting of the Trustees. Except as indicated, each individual has held the office shown or other offices in the same company for the past five years.
Each fund’s Statement of Additional Information (SAI) includes more information about the Trustees. To request a free copy, call Fidelity at 1-800-544-8544.
Experience, Skills, Attributes, and Qualifications of the Trustees. The Governance and Nominating Committee has adopted a statement of policy that describes the experience, qualifications, attributes, and skills that are necessary and desirable for potential Independent Trustee candidates (Statement of Policy). The Board believes that each Trustee satisfied at the time he or she was initially elected or appointed a Trustee, and continues to satisfy, the standards contemplated by the Statement of Policy. The Governance and Nominating Committee also engages professional search firms to help identify potential Independent Trustee candidates who have the experience, qualifications, attributes, and skills consistent with the Statement of Policy. From time to time, additional criteria based on the composition and skills of the current Independent Trustees, as well as experience or skills that may be appropriate in light of future changes to board composition, business conditions, and regulatory or other developments, have also been considered by the professional search firms and the Governance and Nominating Committee. In addition, the Board takes into account the Trustees' commitment and participation in Board and committee meetings, as well as their leadership of standing and ad hoc committees throughout their tenure.
In determining that a particular Trustee was and continues to be qualified to serve as a Trustee, the Board has considered a variety of criteria, none of which, in isolation, was controlling. The Board believes that, collectively, the Trustees have balanced and diverse experience, qualifications, attributes, and skills, which allow the Board to operate effectively in governing each fund and protecting the interests of shareholders. Information about the specific experience, skills, attributes, and qualifications of each Trustee, which in each case led to the Board's conclusion that the Trustee should serve (or continue to serve) as a trustee of the funds, is provided below.
Board Structure and Oversight Function. James C. Curvey is an interested person and currently serves as Chairman. The Trustees have determined that an interested Chairman is appropriate and benefits shareholders because an interested Chairman has a personal and professional stake in the quality and continuity of services provided to the funds. Independent Trustees exercise their informed business judgment to appoint an individual of their choosing to serve as Chairman, regardless of whether the Trustee happens to be independent or a member of management. The Independent Trustees have determined that they can act independently and effectively without having an Independent Trustee serve as Chairman and that a key structural component for assuring that they are in a position to do so is for the Independent Trustees to constitute a substantial majority for the Board. The Independent Trustees also regularly meet in executive session. Ned C. Lautenbach serves as Chairman of the Independent Trustees and as such (i) acts as a liaison between the Independent Trustees and management with respect to matters important to the Independent Trustees and (ii) with management prepares agendas for Board meetings.
Fidelity® funds are overseen by different Boards of Trustees. The funds' Board oversees Fidelity's high income and certain equity funds, and other Boards oversee Fidelity's investment-grade bond, money market, asset allocation, and other equity funds. The asset allocation funds may invest in Fidelity® funds overseen by the funds' Board. The use of separate Boards, each with its own committee structure, allows the Trustees of each group of Fidelity® funds to focus on the unique issues of the funds they oversee, including common research, investment, and operational issues. On occasion, the separate Boards establish joint committees to address issues of overlapping consequences for the Fidelity® funds overseen by each Board.
The Trustees operate using a system of committees to facilitate the timely and efficient consideration of all matters of importance to the Trustees, each fund, and fund shareholders and to facilitate compliance with legal and regulatory requirements and oversight of the funds' activities and associated risks. The Board, acting through its committees, has charged SelectCo and its affiliates with (i) identifying events or circumstances the occurrence of which could have demonstrably adverse effects on the funds' business and/or reputation; (ii) implementing processes and controls to lessen the possibility that such events or circumstances occur or to mitigate the effects of such events or circumstances if they do occur; and (iii) creating and maintaining a system designed to evaluate continuously business and market conditions in order to facilitate the identification and implementation processes described in (i) and (ii) above. Because the day-to-day operations and activities of the funds are carried out by or through SelectCo, its affiliates, and other service providers, the funds' exposure to risks is mitigated but not eliminated by the processes overseen by the Trustees. While each of the Board's committees has responsibility for overseeing different aspects of the funds' activities, oversight is exercised primarily through the Operations, Audit, and Compliance Committees. In addition, the Independent Trustees have worked with Fidelity to enhance the Board's oversight of investment and financial risks, legal and regulatory risks, technology risks, and operational risks, including the development of additional risk reporting to the Board. Appropriate personnel, including but not limited to the funds' Chief Compliance Officer (CCO), SelectCo's internal auditor, the independent accountants, the funds' Treasurer and portfolio management personnel, make periodic reports to the Board's committees, as appropriate, including an annual review of Fidelity's risk management program for the Fidelity® funds. The responsibilities of each standing committee, including their oversight responsibilities, are described further under "Standing Committees of the Trustees."
Interested Trustees*:
Correspondence intended for a Trustee who is an interested person may be sent to Fidelity Investments, 245 Summer Street, Boston, Massachusetts 02210.
Name, Year of Birth; Principal Occupations and Other Relevant Experience+
James C. Curvey (1935)
Year of Election or Appointment: 2018
Trustee
Chairman of the Board of Trustees
Mr. Curvey also serves as Trustee of other Fidelity® funds. Mr. Curvey is Vice Chairman (2007-present) and Director of FMR LLC (diversified financial services company). In addition, Mr. Curvey is an Overseer Emeritus for the Boston Symphony Orchestra, a Director of Artis-Naples, and a Trustee of Brewster Academy in Wolfeboro, New Hampshire. Previously, Mr. Curvey served as a Director of Fidelity Research & Analysis Co. (investment adviser firm, 2009-2018), Director of Fidelity Investments Money Management, Inc. (investment adviser firm, 2009-2014) and a Director of FMR and FMR Co., Inc. (investment adviser firms, 2007-2014).
* Determined to be an "Interested Trustee" by virtue of, among other things, his or her affiliation with the trust or various entities under common control with SelectCo.
+ The information includes the Trustee's principal occupation during the last five years and other information relating to the experience, attributes, and skills relevant to the Trustee's qualifications to serve as a Trustee, which led to the conclusion that the Trustee should serve as a Trustee for each fund.
Independent Trustees:
Correspondence intended for an Independent Trustee may be sent to Fidelity Investments, P.O. Box 55235, Boston, Massachusetts 02205-5235.
Name, Year of Birth; Principal Occupations and Other Relevant Experience+
Dennis J. Dirks (1948)
Year of Election or Appointment: 2018
Trustee
Mr. Dirks also serves as Trustee of other Fidelity® funds. Prior to his retirement in May 2003, Mr. Dirks was Chief Operating Officer and a member of the Board of The Depository Trust & Clearing Corporation (DTCC). He also served as President, Chief Operating Officer, and Board member of The Depository Trust Company (DTC) and President and Board member of the National Securities Clearing Corporation (NSCC). In addition, Mr. Dirks served as Chief Executive Officer and Board member of the Government Securities Clearing Corporation, Chief Executive Officer and Board member of the Mortgage-Backed Securities Clearing Corporation, as a Trustee and a member of the Finance Committee of Manhattan College (2005-2008), as a Trustee and a member of the Finance Committee of AHRC of Nassau County (2006-2008), as a member of the Independent Directors Council (IDC) Governing Council (2010-2015), and as a member of the Board of Directors for The Brookville Center for Children’s Services, Inc. (2009-2017). Mr. Dirks is a member of the Finance Committee (2016-present) and Board of Directors (2017-present) and is Treasurer (2018-present) of the Asolo Repertory Theatre.
Donald F. Donahue (1950)
Year of Election or Appointment: 2018
Trustee
Mr. Donahue also serves as a Trustee of other Fidelity® funds. Mr. Donahue is President and Chief Executive Officer of Miranda Partners, LLC (risk consulting for the financial services industry, 2012-present). Previously, Mr. Donahue served as a Member of the Advisory Board of certain Fidelity® funds (2015-2018) and Chief Executive Officer (2006-2012), Chief Operating Officer (2003-2006), and Managing Director, Customer Marketing and Development (1999-2003) of The Depository Trust & Clearing Corporation (financial markets infrastructure). Mr. Donahue serves as a Member (2007-present) and Co-Chairman (2016-present) of the Board of Directors of United Way of New York, Member of the Board of Directors of NYC Leadership Academy (2012-present) and Member of the Board of Advisors of Ripple Labs, Inc. (financial services, 2015-present). He also served as Chairman (2010-2012) and Member of the Board of Directors (2012-2013) of Omgeo, LLC (financial services), Treasurer of United Way of New York (2012-2016), and Member of the Board of Directors of XBRL US (financial services non-profit, 2009-2012) and the International Securities Services Association (2009-2012).
Alan J. Lacy (1953)
Year of Election or Appointment: 2018
Trustee
Mr. Lacy also serves as Trustee of other Fidelity® funds. Mr. Lacy serves as a Director of Bristol-Myers Squibb Company (global pharmaceuticals, 2008-present). He is a Trustee of the California Chapter of The Nature Conservancy (2015-present) and a Director of the Center for Advanced Study in the Behavioral Sciences at Stanford University (2015-present). In addition, Mr. Lacy served as Senior Adviser (2007-2014) of Oak Hill Capital Partners, L.P. (private equity) and also served as Chief Executive Officer (2005) and Vice Chairman (2005-2006) of Sears Holdings Corporation (retail) and Chief Executive Officer and Chairman of the Board of Sears, Roebuck and Co. (retail, 2000-2005). Previously, Mr. Lacy served as Chairman (2014-2017) and a member (2010-2017) of the Board of Directors of Dave & Buster’s Entertainment, Inc. (restaurant and entertainment complexes), as Chairman (2008-2011) and a member (2006-2015) of the Board of Trustees of the National Parks Conservation Association, and as a member of the Board of Directors for The Hillman Companies, Inc. (hardware wholesalers, 2010-2014), Earth Fare, Inc. (retail grocery, 2010-2014), and The Western Union Company (global money transfer, 2006-2011).
Ned C. Lautenbach (1944)
Year of Election or Appointment: 2018
Trustee
Chairman of the Independent Trustees
Mr. Lautenbach also serves as Trustee of other Fidelity® funds. Mr. Lautenbach currently serves as Chair (2018-present) and Member (2013-present) of the Board of Governors, State University System of Florida and is a member of the Council on Foreign Relations (1994-present). He is also a member and has most recently served as Chairman of the Board of Directors of Artis-Naples (2012-present). Previously, Mr. Lautenbach served as a member and then Lead Director of the Board of Directors of Eaton Corporation (diversified industrial, 1997-2016). He was also a Partner and Advisory Partner at Clayton, Dubilier & Rice, LLC (private equity investment, 1998-2010), as well as a Director of Sony Corporation (2006-2007). In addition, Mr. Lautenbach also had a 30-year career with IBM (technology company) during which time he served as Senior Vice President and a member of the Corporate Executive Committee (1968-1998).
Joseph Mauriello (1944)
Year of Election or Appointment: 2018
Trustee
Mr. Mauriello also serves as Trustee of other Fidelity® funds. Prior to his retirement in January 2006, Mr. Mauriello served in numerous senior management positions including Deputy Chairman and Chief Operating Officer (2004-2005), and Vice Chairman of Financial Services (2002-2004) of KPMG LLP US (professional services, 1965-2005). Mr. Mauriello currently serves as a member of the Independent Directors Council (IDC) Governing Council (2015-present). Previously, Mr. Mauriello served as a member of the Board of Directors of XL Group plc. (global insurance and re-insurance, 2006-2018).
Cornelia M. Small (1944)
Year of Election or Appointment: 2018
Trustee
Ms. Small also serves as Trustee of other Fidelity® funds. Ms. Small is a member of the Board of Directors (2009-present) and Chair of the Investment Committee (2010-present) of the Teagle Foundation. Ms. Small also serves on the Investment Committee of the Berkshire Taconic Community Foundation (2008-present). Previously, Ms. Small served as Chairperson (2002-2008) and a member of the Investment Committee and Chairperson (2008-2012) and a member of the Board of Trustees of Smith College. In addition, Ms. Small served as Chief Investment Officer, Director of Global Equity Investments, and a member of the Board of Directors of Scudder, Stevens & Clark and Scudder Kemper Investments.
Garnett A. Smith (1947)
Year of Election or Appointment: 2013
Trustee
Mr. Smith also serves as Trustee of other Fidelity® funds. Prior to Mr. Smith's retirement, he served as Chairman and Chief Executive Officer of Inbrand Corp. (manufacturer of personal absorbent products, 1990-1997). He also served as President (1986-1990) of Inbrand Corp. Prior to his employment with Inbrand Corp., he was employed by a retail fabric chain and North Carolina National Bank. In addition, Mr. Smith served as a Member of the Advisory Board of certain Fidelity® funds (2012-2013) and as a board member of the Jackson Hole Land Trust (2009-2012).
David M. Thomas (1949)
Year of Election or Appointment: 2018
Trustee
Mr. Thomas also serves as Trustee of other Fidelity® funds. Mr. Thomas serves as Non-Executive Chairman of the Board of Directors of Fortune Brands Home and Security (home and security products, 2011-present) and as a member of the Board of Directors (2004-present) and Presiding Director (2013-present) of Interpublic Group of Companies, Inc. (marketing communication). Previously, Mr. Thomas served as Executive Chairman (2005-2006) and Chairman and Chief Executive Officer (2000-2005) of IMS Health, Inc. (pharmaceutical and healthcare information solutions), a Director of Fortune Brands, Inc. (consumer products, 2000-2011), and a member of the Board of Trustees of the University of Florida (2013-2018).
Michael E. Wiley (1950)
Year of Election or Appointment: 2008
Trustee
Mr. Wiley also serves as Trustee or Member of the Advisory Board of other Fidelity® funds. Mr. Wiley serves as a Director of High Point Resources (exploration and production, 2005-present). Previously, Mr. Wiley served as a Director of Andeavor Corporation (independent oil refiner and marketer, 2005-2018), a Director of Andeavor Logistics LP (natural resources logistics, 2015-2018), a Director of Post Oak Bank (privately-held bank, 2004-2018), a Director of Asia Pacific Exploration Consolidated (international oil and gas exploration and production, 2008-2013), a member of the Board of Trustees of the University of Tulsa (2000-2006; 2007-2010), a Senior Energy Advisor of Katzenbach Partners, LLC (consulting, 2006-2007), an Advisory Director of Riverstone Holdings (private investment), a Director of Spinnaker Exploration Company (exploration and production, 2001-2005) and Chairman, President, and CEO of Baker Hughes, Inc. (oilfield services, 2000-2004).
+ The information includes the Trustee's principal occupation during the last five years and other information relating to the experience, attributes, and skills relevant to the Trustee's qualifications to serve as a Trustee, which led to the conclusion that the Trustee should serve as a Trustee for each fund.
Advisory Board Members and Officers:
Correspondence intended for a Member of the Advisory Board (if any) may be sent to Fidelity Investments, P.O. Box 55235, Boston, Massachusetts 02205-5235. Correspondence intended for an officer or Peter S. Lynch may be sent to Fidelity Investments, 245 Summer Street, Boston, Massachusetts 02210. Officers appear below in alphabetical order.
Name, Year of Birth; Principal Occupation
Vicki L. Fuller (1957)
Year of Election or Appointment: 2018
Member of the Advisory Board
Ms. Fuller also serves as Member of the Advisory Board of other Fidelity® funds. Ms. Fuller serves as a member of the Board of Directors, Audit Committee, and Nominating and Governance Committee of The Williams Companies, Inc. (natural gas infrastructure, 2018-present). Previously, Ms. Fuller served as the Chief Investment Officer of the New York State Common Retirement Fund (2012-2018) and held a variety of positions at AllianceBernstein L.P. (global asset management, 1985-2012), including Managing Director (2006-2012) and Senior Vice President and Senior Portfolio Manager (2001-2006).
Peter S. Lynch (1944)
Year of Election or Appointment: 2018
Member of the Advisory Board
Mr. Lynch also serves as Member of the Advisory Board of other Fidelity® funds. Mr. Lynch is Vice Chairman and a Director of FMR (investment adviser firm) and FMR Co., Inc. (investment adviser firm). In addition, Mr. Lynch serves as a Trustee of Boston College and as the Chairman of the Inner-City Scholarship Fund. Previously, Mr. Lynch served on the Special Olympics International Board of Directors (1997-2006).
Carol B. Tomé (1957)
Year of Election or Appointment: 2017
Member of the Advisory Board
Ms. Tomé also serves as Member of the Advisory Board of other Fidelity® funds. Ms. Tomé is Chief Financial Officer (2001-present) and Executive Vice President of Corporate Services (2007-present) of The Home Depot, Inc. (home improvement retailer) and a Director (2003-present) and Chair of the Audit Committee (2004-present) of United Parcel Service, Inc. (package delivery and supply chain management). Previously, Ms. Tomé served as Trustee of certain Fidelity® funds (2017), Senior Vice President of Finance and Accounting/Treasurer (2000-2007) and Vice President and Treasurer (1995-2000) of The Home Depot, Inc. and Chair of the Board (2010-2012), Vice Chair of the Board (2009 and 2013), and a Director (2008-2013) of the Federal Reserve Bank of Atlanta. Ms. Tomé is also a director or trustee of many community and professional organizations.
Elizabeth Paige Baumann (1968)
Year of Election or Appointment: 2017
Anti-Money Laundering (AML) Officer
Ms. Baumann also serves as AML Officer of other funds. She is Chief AML Officer (2012-present) and Senior Vice President (2014-present) of FMR LLC (diversified financial services company) and is an employee of Fidelity Investments. Previously, Ms. Baumann served as AML Officer of the funds (2012-2016), and Vice President (2007-2014) and Deputy Anti-Money Laundering Officer (2007-2012) of FMR LLC.
Craig S. Brown (1977)
Year of Election or Appointment: 2019
Assistant Treasurer
Mr. Brown also serves as Assistant Treasurer of other funds. Mr. Brown is an employee of Fidelity Investments (2013-present).
John J. Burke III (1964)
Year of Election or Appointment: 2018
Chief Financial Officer
Mr. Burke also serves as Chief Financial Officer of other funds. Mr. Burke serves as Head of Investment Operations for Fidelity Fund and Investment Operations (2018-present) and is an employee of Fidelity Investments (1998-present). Previously Mr. Burke served as head of Asset Management Investment Operations (2012-2018).
William C. Coffey (1969)
Year of Election or Appointment: 2018
Secretary and Chief Legal Officer (CLO)
Mr. Coffey also serves as Secretary and CLO of other funds. Mr. Coffey serves as CLO, Secretary, and Senior Vice President of Fidelity Management & Research Company and FMR Co., Inc. (investment adviser firms, 2018-present); Secretary of Fidelity SelectCo, LLC and Fidelity Investments Money Management, Inc. (investment adviser firms, 2018-present); and CLO of Fidelity Management & Research (Hong Kong) Limited, FMR Investment Management (UK) Limited, and Fidelity Management & Research (Japan) Limited (investment adviser firms, 2018-present). He is Senior Vice President and Deputy General Counsel of FMR LLC (diversified financial services company, 2010-present), and is an employee of Fidelity Investments. Previously, Mr. Coffey served as Assistant Secretary of certain funds (2009-2018) and as Vice President and Associate General Counsel of FMR LLC (2005-2009).
Timothy M. Cohen (1969)
Year of Election or Appointment: 2018
Vice President
Mr. Cohen also serves as Vice President of other funds. Mr. Cohen serves as Co-Head of Global Equity Research (2016-present), a Director of Fidelity Management & Research (Japan) Limited (investment adviser firm, 2016-present), and is an employee of Fidelity Investments. Previously, Mr. Cohen served as Chief Investment Officer - Equity and a Director of Fidelity Management & Research (U.K.) Inc. (investment adviser firm, 2013-2015) and as a Director of Fidelity Management & Research (Hong Kong) Limited (investment adviser firm, 2017).
Jonathan Davis (1968)
Year of Election or Appointment: 2010
Assistant Treasurer
Mr. Davis also serves as Assistant Treasurer of other funds. Mr. Davis serves as Assistant Treasurer of FMR Capital, Inc. (2017-present) and is an employee of Fidelity Investments. Previously, Mr. Davis served as Vice President and Associate General Counsel of FMR LLC (diversified financial services company, 2003-2010).
Adrien E. Deberghes (1967)
Year of Election or Appointment: 2018
Assistant Treasurer
Mr. Deberghes also serves as an officer of other funds. He serves as Assistant Treasurer of FMR Capital, Inc. (2017-present), Executive Vice President of Fidelity Investments Money Management, Inc. (FIMM) (investment adviser firm, 2016-present), and is an employee of Fidelity Investments (2008-present). Previously, Mr. Deberghes served as President and Treasurer of certain Fidelity® funds (2013-2018). Prior to joining Fidelity Investments, Mr. Deberghes was Senior Vice President of Mutual Fund Administration at State Street Corporation (2007-2008), Senior Director of Mutual Fund Administration at Investors Bank & Trust (2005-2007), and Director of Finance for Dunkin' Brands (2000-2005). Previously, Mr. Deberghes served in other fund officer roles.
Laura M. Del Prato (1964)
Year of Election or Appointment: 2018
Assistant Treasurer
Ms. Del Prato also serves as an officer of other funds. Ms. Del Prato is an employee of Fidelity Investments (2017-present). Prior to joining Fidelity Investments, Ms. Del Prato served as a Managing Director and Treasurer of the JPMorgan Mutual Funds (2014-2017). Prior to JPMorgan, Ms. Del Prato served as a partner at Cohen Fund Audit Services (accounting firm, 2012-2013) and KPMG LLP (accounting firm, 2004-2012).
Colm A. Hogan (1973)
Year of Election or Appointment: 2018
Deputy Treasurer
Mr. Hogan also serves as an officer of other funds. Mr. Hogan serves as Assistant Treasurer of FMR Capital, Inc. (2017-present) and is an employee of Fidelity Investments (2005-present). Previously, Mr. Hogan served as Assistant Treasurer of certain Fidelity® funds (2016-2018).
Pamela R. Holding (1964)
Year of Election or Appointment: 2018
Vice President
Ms. Holding also serves as Vice President of other funds. Ms. Holding serves as Co-Head of Global Equity Research (2018-present) and is an employee of Fidelity Investments (2013-present).
Chris Maher (1972)
Year of Election or Appointment: 2013
Assistant Treasurer
Mr. Maher serves as Assistant Treasurer of other funds. Mr. Maher is Vice President of Valuation Oversight, serves as Assistant Treasurer of FMR Capital, Inc. (2017-present), and is an employee of Fidelity Investments. Previously, Mr. Maher served as Vice President of Asset Management Compliance (2013), Vice President of the Program Management Group of FMR (investment adviser firm, 2010-2013), and Vice President of Valuation Oversight (2008-2010).
Kenneth B. Robins (1969)
Year of Election or Appointment: 2018
Chief Compliance Officer
Mr. Robins also serves as an officer of other funds. Mr. Robins serves as Compliance Officer of Fidelity Management & Research Company and FMR Co., Inc. (investment adviser firms, 2016-present) and is an employee of Fidelity Investments (2004-present). Previously, Mr. Robins served as Executive Vice President of Fidelity Investments Money Management, Inc. (investment adviser firm, 2013-2016) and served in other fund officer roles.
Stacie M. Smith (1974)
Year of Election or Appointment: 2018
President and Treasurer
Ms. Smith also serves as an officer of other funds. Ms. Smith serves as Assistant Treasurer of FMR Capital, Inc. (2017-present), is an employee of Fidelity Investments (2009-present), and has served in other fund officer roles. Prior to joining Fidelity Investments, Ms. Smith served as Senior Audit Manager of Ernst & Young LLP (accounting firm, 1996-2009). Previously, Ms. Smith served as Assistant Treasurer (2013-2018) and Deputy Treasurer (2013-2016) of certain Fidelity® funds.
Marc L. Spector (1972)
Year of Election or Appointment: 2017
Assistant Treasurer
Mr. Spector also serves as an officer of other funds. Mr. Spector serves as Assistant Treasurer of FMR Capital, Inc. (2017-present) and is an employee of Fidelity Investments (2016-present). Prior to joining Fidelity Investments, Mr. Spector served as Director at the Siegfried Group (accounting firm, 2013-2016), and prior to Siegfried Group as audit senior manager at Deloitte & Touche (accounting firm, 2005-2013).
Jim Wegmann (1979)
Year of Election or Appointment: 2019
Assistant Treasurer
Mr. Wegmann also serves as Assistant Treasurer of other funds. Mr. Wegmann is an employee of Fidelity Investments (2011-present).
Shareholder Expense Example
As a shareholder of a Fund, you incur two types of costs: (1) transaction costs and (2) ongoing costs, including management fees and other Fund expenses. This Example is intended to help you understand your ongoing costs (in dollars) of investing in the Funds and to compare these costs with the ongoing costs of investing in other mutual funds.
The Example is based on an investment of $1,000 invested at the beginning of the period and held for the entire period (September 1, 2018 to February 28, 2019).
Actual Expenses
The first line of the accompanying table for each fund provides information about actual account values and actual expenses. You may use the information in this line, together with the amount you invested, to estimate the expenses that you paid over the period. Simply divide your account value by $1,000.00 (for example, an $8,600 account value divided by $1,000.00 = 8.6), then multiply the result by the number in the first line for a fund under the heading entitled "Expenses Paid During Period" to estimate the expenses you paid on your account during this period. In addition, each Fund, as a shareholder in the underlying Fidelity Central Funds, will indirectly bear its pro-rata share of the fees and expenses incurred by the underlying Fidelity Central Funds. These fees and expenses are not included in the Fund's annualized expense ratio used to calculate the expense estimate in the table below.
Hypothetical Example for Comparison Purposes
The second line of the accompanying table for each fund provides information about hypothetical account values and hypothetical expenses based on a fund's actual expense ratio and an assumed rate of return of 5% per year before expenses, which is not the Fund's actual return. The hypothetical account values and expenses may not be used to estimate the actual ending account balance or expenses you paid for the period. You may use this information to compare the ongoing costs of investing in the Fund and other funds. To do so, compare this 5% hypothetical example with the 5% hypothetical examples that appear in the shareholder reports of the other funds. In addition, each Fund, as a shareholder in the underlying Fidelity Central Funds, will indirectly bear its pro-rata share of the fees and expenses incurred by the underlying Fidelity Central Funds. These fees and expenses are not included in the Fund's annualized expense ratio used to calculate the expense estimate in the table below.
Please note that the expenses shown in the table are meant to highlight your ongoing costs only and do not reflect any transaction costs. Therefore, the second line of the table is useful in comparing ongoing costs only, and will not help you determine the relative total costs of owning different funds. In addition, if these transactional costs were included, your costs would have been higher.
| | Annualized Expense Ratio-A | Beginning
Account Value
September 1, 2018 | Ending
Account Value
February 28, 2019 | Expenses Paid
During Period-B
September 1, 2018
to February 28, 2019 |
| Communications Equipment Portfolio | .85% | | | |
| Actual | | $1,000.00 | $1,005.50 | $4.23 |
| Hypothetical-C | | $1,000.00 | $1,020.58 | $4.26 |
| Computers Portfolio | .77% | | | |
| Actual | | $1,000.00 | $900.00 | $3.63 |
| Hypothetical-C | | $1,000.00 | $1,020.98 | $3.86 |
| IT Services Portfolio | .74% | | | |
| Actual | | $1,000.00 | $1,001.20 | $3.67 |
| Hypothetical-C | | $1,000.00 | $1,021.12 | $3.71 |
| Semiconductors Portfolio | .74% | | | |
| Actual | | $1,000.00 | $959.40 | $3.60 |
| Hypothetical-C | | $1,000.00 | $1,021.12 | $3.71 |
| Software and IT Services Portfolio | .72% | | | |
| Actual | | $1,000.00 | $982.20 | $3.54 |
| Hypothetical-C | | $1,000.00 | $1,021.22 | $3.61 |
| Technology Portfolio | .73% | | | |
| Actual | | $1,000.00 | $893.80 | $3.43 |
| Hypothetical-C | | $1,000.00 | $1,021.17 | $3.66 |
A Annualized expense ratio reflects expenses net of applicable fee waivers.
B Expenses are equal to each Fund's annualized expense ratio, multiplied by the average account value over the period, multiplied by 181/ 365 (to reflect the one-half year period).
C 5% return per year before expenses
Distributions (Unaudited)
The Board of Trustees of each fund voted to pay to shareholders of record at the opening of business on record date, the following distributions per share derived from capital gains realized from sales of portfolio securities, and dividends derived from net investment income:
| | Pay Date | Record Date | Dividends | Capital Gains |
| Communications Equipment Portfolio | 04/15/19 | 04/12/19 | $0.005 | $0.640 |
| Computers Portfolio | 04/15/19 | 04/12/19 | $0.000 | $6.444 |
| IT Services Portfolio | 04/15/19 | 04/12/19 | $0.008 | $0.352 |
| Semiconductors Portfolio | 04/15/19 | 04/12/19 | $0.008 | $0.000 |
| Software and IT Services Portfolio | 04/15/19 | 04/12/19 | $0.011 | $1.893 |
| Technology Portfolio | 04/15/19 | 04/12/19 | $0.000 | $0.000 |
|
The funds hereby designate as capital gain dividend the amounts noted below for the taxable year ended February 28, 2019, or, if subsequently determined to be different, the net capital gain of such year.
| Communications Equipment Portfolio | $5,053,299 |
| Computers Portfolio | $123,309,444 |
| IT Services Portfolio | $95,038,124 |
| Semiconductors Portfolio | $269,223,541 |
| Software and IT Services Portfolio | $880,198,335 |
| Technology Portfolio | $590,779,401 |
|
A percentage of the dividends distributed during the fiscal year for the following funds qualify for the dividends–received deduction for corporate shareholders:
| | April 2018 | December 2018 |
| Communications Equipment Portfolio | 16% | 100% |
| Computers Portfolio | 19% | 72% |
| IT Services Portfolio | 100% | 100% |
| Semiconductors Portfolio | – | 27% |
| Software and IT Services Portfolio | 26% | 50% |
| Technology Portfolio | 3% | 100% |
|
A percentage of the dividends distributed during the fiscal year for the following funds may be taken into account as a dividend for purposes of the maximum rate under section 1(h)(11) of the Internal Revenue Code.
| | April 2018 | December 2018 |
| Communications Equipment Portfolio | 17% | 100% |
| Computers Portfolio | 40% | 100% |
| IT Services Portfolio | 100% | 100% |
| Semiconductors Portfolio | – | 32% |
| Software and IT Services Portfolio | 31% | 53% |
| Technology Portfolio | 3% | 100% |
|
The funds will notify shareholders in January 2020 of amounts for use in preparing 2019 income tax returns.
Board Approval of Investment Advisory Contracts and Management Fees
Communications Equipment Portfolio
Computers Portfolio
IT Services Portfolio
Semiconductors Portfolio
Software and IT Services Portfolio
Technology Portfolio
Each year, the Board of Trustees, including the Independent Trustees (together, the Board), votes on the renewal of the management contract with Fidelity SelectCo, LLC (SelectCo), an affiliate of Fidelity Management & Research Company (FMR), and the sub-advisory agreements with affiliates of FMR (together, the Advisory Contracts) for each fund. SelectCo and the sub-advisers are referred to herein as the Investment Advisers. The Board, assisted by the advice of fund counsel and Independent Trustees' counsel, requests and considers a broad range of information relevant to the renewal of the Advisory Contracts throughout the year.
The Board meets regularly and, at each of its meetings, covers an extensive agenda of topics and materials and considers factors that are relevant to its annual consideration of the renewal of each fund's Advisory Contracts, including the services and support provided to each fund and its shareholders. The Board has established various standing committees (Committees), each composed of and chaired by Independent Trustees with varying backgrounds, to which the Board has assigned specific subject matter responsibilities in order to enhance effective decision-making by the Board. The Board, acting directly and through its Committees, requests and receives information concerning the annual consideration of the renewal of each fund's Advisory Contracts. The Board also meets as needed to review matters specifically related to the Board's annual consideration of the renewal of the Advisory Contracts. Members of the Board may also meet with trustees of other Fidelity funds through joint ad hoc committees to discuss certain matters relevant to all of the Fidelity funds.
At its January 2019 meeting, the Board unanimously determined to renew each fund's Advisory Contracts. In reaching its determination, the Board considered all factors it believed relevant, including (i) the nature, extent, and quality of the services to be provided to each fund and its shareholders (including the investment performance of each fund); (ii) the competitiveness of each fund's management fee and total expense ratio relative to peer funds; (iii) the total costs of the services to be provided by and the profits to be realized by Fidelity from its relationships with each fund; and (iv) the extent to which, if any, economies of scale exist and would be realized as each fund grows, and whether any economies of scale are appropriately shared with fund shareholders.
In considering whether to renew the Advisory Contracts for each fund, the Board reached a determination, with the assistance of fund counsel and Independent Trustees' counsel and through the exercise of its business judgment, that the renewal of the Advisory Contracts was in the best interests of each fund and its shareholders and that the compensation payable under the Advisory Contracts was fair and reasonable. The Board's decision to renew the Advisory Contracts was not based on any single factor, but rather was based on a comprehensive consideration of all the information provided to the Board at its meetings throughout the year. The Board, in reaching its determination to renew the Advisory Contracts, was aware that shareholders of each fund have a broad range of investment choices available to them, including a wide choice among funds offered by Fidelity's competitors, and that each fund's shareholders, who have the opportunity to review and weigh the disclosure provided by the fund in its prospectus and other public disclosures, have chosen to invest in that fund, which is part of the Fidelity family of funds.
Nature, Extent, and Quality of Services Provided. The Board considered Fidelity's staffing as it relates to the funds, including the backgrounds of investment personnel of Fidelity, and also considered the funds' investment objectives, strategies, and related investment philosophies. The Independent Trustees also had discussions with senior management of Fidelity's investment operations and investment groups. The Board considered the structure of the investment personnel compensation program and whether this structure provides appropriate incentives to act in the best interests of each fund. Additionally, the Board considered the portfolio managers' investments, if any, in the funds that they manage.
Resources Dedicated to Investment Management and Support Services. The Board and the Fund Oversight and Research Committees reviewed the general qualifications and capabilities of Fidelity's investment staff, including its size, education, experience, and resources, as well as Fidelity's approach to recruiting, training, managing, and compensating investment personnel. The Board noted that Fidelity has continued to increase the resources devoted to non-U.S. offices, including expansion of Fidelity's global investment organization. The Board also noted that Fidelity's analysts have extensive resources, tools and capabilities that allow them to conduct sophisticated quantitative and fundamental analysis, as well as credit analysis of issuers, counterparties and guarantors. Further, the Board considered that Fidelity's investment professionals have sufficient access to global information and data so as to provide competitive investment results over time, and that those professionals also have access to sophisticated tools that permit them to assess portfolio construction and risk and performance attribution characteristics continuously, as well as to transmit new information and research conclusions rapidly around the world. Additionally, in its deliberations, the Board considered Fidelity's trading, risk management, compliance, and technology and operations capabilities and resources, which are integral parts of the investment management process.
Shareholder and Administrative Services. The Board considered (i) the nature, extent, quality, and cost of advisory, administrative, and shareholder services performed by the Investment Advisers and their affiliates under the Advisory Contracts and under separate agreements covering transfer agency, pricing and bookkeeping, and securities lending services for each fund; (ii) the nature and extent of the supervision of third party service providers, principally custodians, subcustodians, and pricing vendors; and (iii) the resources devoted to, and the record of compliance with, each fund's compliance policies and procedures. The Board also reviewed the allocation of fund brokerage, including allocations to brokers affiliated with the Investment Advisers, the use of brokerage commissions to pay fund expenses, and the use of "soft" commission dollars to pay for research services.
The Board noted that the growth of fund assets over time across the complex allows Fidelity to reinvest in the development of services designed to enhance the value and convenience of the Fidelity funds as investment vehicles. These services include 24-hour access to account information and market information through telephone representatives and over the Internet, investor education materials and asset allocation tools, and the expanded availability of Fidelity Investor Centers.
The Board noted that it and the boards of certain other Fidelity funds had formed an ad hoc Committee on Transfer Agency Fees to review the variety of transfer agency fee structures throughout the industry and Fidelity's competitive positioning with respect to industry participants.
Investment in a Large Fund Family. The Board considered the benefits to shareholders of investing in a Fidelity fund, including the benefits of investing in a fund that is part of a large family of funds offering a variety of investment disciplines and providing a large variety of mutual fund investor services. The Board noted that Fidelity had taken, or had made recommendations that resulted in the Fidelity funds taking, a number of actions over the previous year that benefited particular funds, including: (i) continuing to dedicate additional resources to Fidelity's investment research process, which includes meetings with management of issuers of securities in which the funds invest, and to the support of the senior management team that oversees asset management; (ii) continuing efforts to enhance Fidelity's global research capabilities; (iii) launching new funds and making other enhancements to meet client needs; (iv) launching new share classes of existing funds; (v) eliminating purchase minimums and broadening eligibility requirements for certain funds and share classes; (vi) reducing management fees and total expenses for certain growth equity funds and index funds; (vii) lowering expense caps for certain existing funds and classes, and converting certain voluntary expense caps to contractual caps, to reduce expenses borne by shareholders; (viii) eliminating short-term redemption fees for funds that had such fees; (ix) rationalizing product lines and gaining increased efficiencies from fund mergers and share class consolidations; (x) continuing to develop, acquire and implement systems and technology to improve services to the funds and shareholders, strengthen information security, and increase efficiency; and (xi) continuing to implement enhancements to further strengthen Fidelity's product line to increase investors' probability of success in achieving their investment goals, including retirement income goals.
Investment Performance. The Board considered whether each fund has operated in accordance with its investment objective, as well as its record of compliance with its investment restrictions and its performance history. Communications Equipment Portfolio had a portfolio manager change in July 2018. Computers Portfolio had a portfolio manager change in December 2017. Technology Portfolio had a portfolio manager change in July 2018. The Board will continue to monitor closely each fund's performance, taking into account the portfolio manager changes.
The Board took into account discussions that occur at Board meetings throughout the year with representatives of the Investment Advisers about fund investment performance. In this regard the Board noted that as part of regularly scheduled fund reviews and other reports to the Board on fund performance, the Board considers annualized return information for each fund for different time periods, measured against an appropriate securities market index ("benchmark index"). In its evaluation of fund investment performance, the Board gave particular attention to information indicating changes in performance of certain Fidelity funds for specific time periods and discussed with the Investment Advisers the reasons for any overperformance or underperformance.
In addition to reviewing absolute and relative fund performance, the Independent Trustees periodically consider the appropriateness of fund performance metrics in evaluating the results achieved. In general, the Independent Trustees believe that fund performance should be evaluated based on net performance (after fees and expenses) of both the highest performing and lowest performing fund share classes, where applicable, compared to appropriate benchmark indices, over appropriate time periods that may include full market cycles, taking into account relevant factors including the following: general market conditions; issuer-specific information; and fund cash flows and other factors.
The Independent Trustees recognize that shareholders evaluate performance on a net basis over their own holding periods, for which one-, three-, and five-year periods are often used as a proxy. For this reason, the performance information reviewed by the Board also included net cumulative total return information for each fund and an appropriate benchmark index for the most recent one-, three-, and five-year periods ended June 30, 2018, as shown below.
Communications Equipment Portfolio
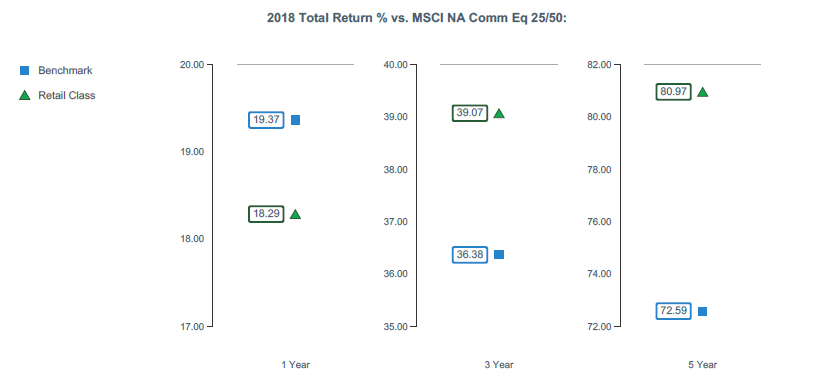
Computers Portfolio
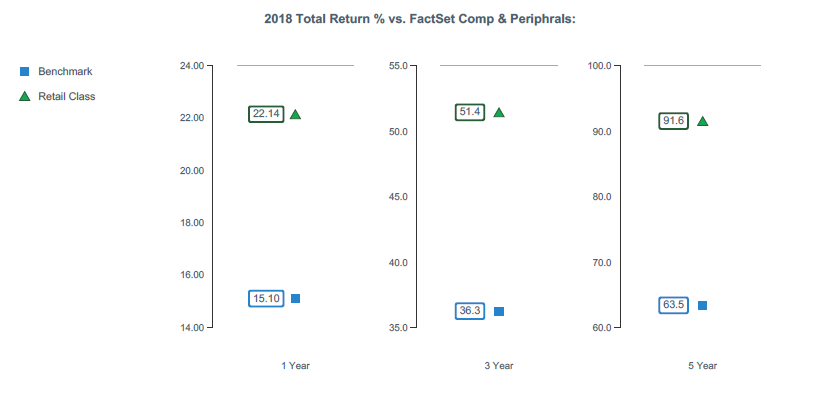
IT Services Portfolio
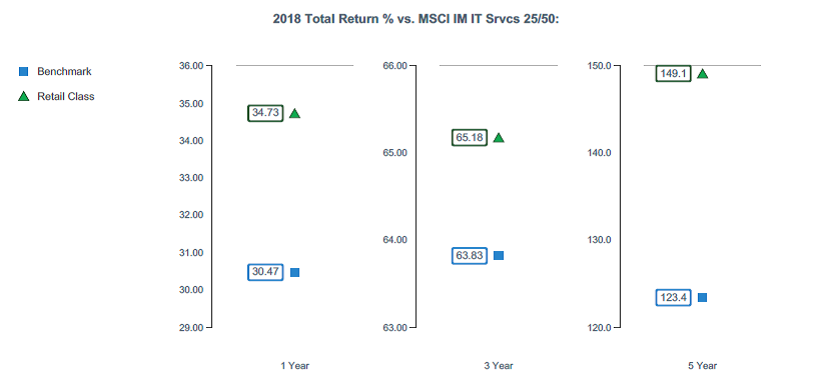
Semiconductors Portfolio
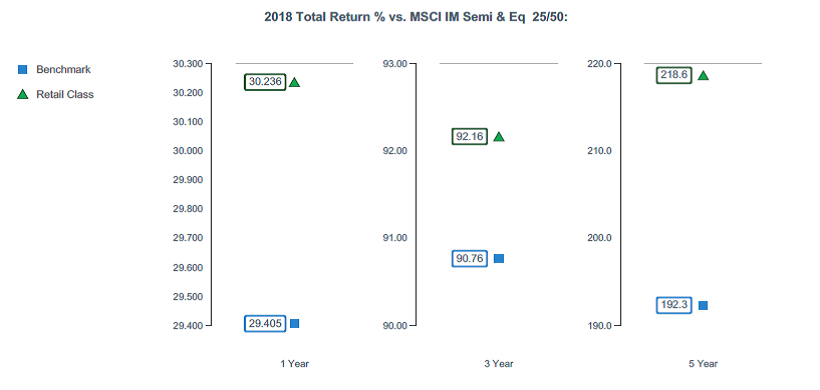
Software and IT Services Portfolio
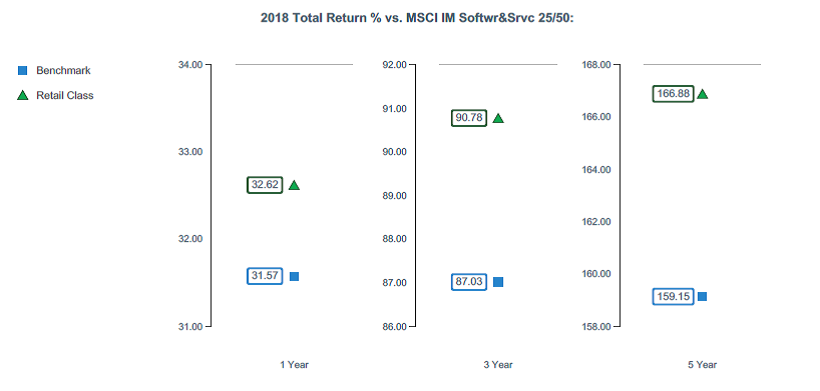
Technology Portfolio
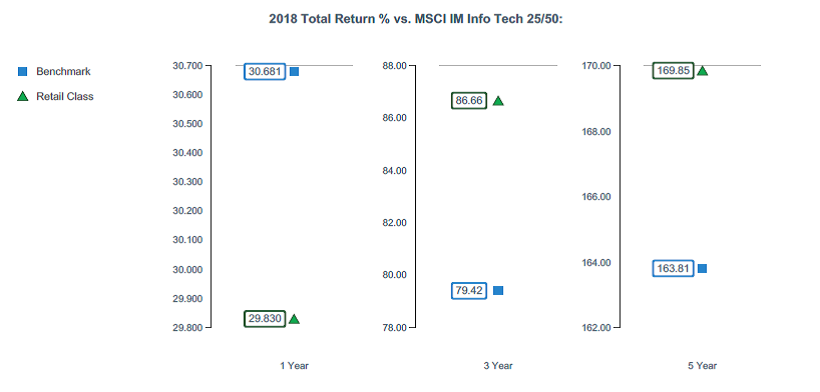
Based on its review, the Board concluded that the nature, extent, and quality of services provided to each fund under the Advisory Contracts should continue to benefit the shareholders of each fund.
Competitiveness of Management Fee and Total Expense Ratio. The Board considered each fund's management fee and total expense ratio compared to "mapped groups" of competitive funds and classes created for the purpose of facilitating the Trustees' competitive analysis of management fees and total expenses. Fidelity creates "mapped groups" by combining similar Lipper investment objective categories that have comparable investment mandates. For this purpose, all sector focused equity funds are grouped in the same mapped group. Combining Lipper investment objective categories aids the Board's management fee and total expense ratio comparisons by broadening the competitive group used for comparison.
Management Fee. The Board considered two proprietary management fee comparisons for the 12-month periods ended June 30 shown in basis points (BP) in the charts below. The group of Lipper funds used by the Board for management fee comparisons is referred to below as the "Total Mapped Group." The Total Mapped Group comparison focuses on a fund's standing in terms of gross management fees before expense reimbursements or caps relative to the total universe of funds with comparable investment mandates (i.e., sector equities), regardless of whether their management fee structures also are comparable. Funds with comparable management fee structures have similar management fee contractual arrangements (
e.g., flat rate charged for advisory services, all-inclusive fee rate,
etc.). "TMG %" represents the percentage of funds in the Total Mapped Group that had management fees that were lower than a fund's. For example, a hypothetical TMG % of 20% would mean that 80% of the funds in the Total Mapped Group had higher, and 20% had lower, management fees than a fund. The funds' actual TMG %s and the number of funds in the Total Mapped Group are in the charts below. The "Asset-Size Peer Group" (ASPG) comparison focuses on a fund's standing relative to a subset of non-Fidelity funds within the Total Mapped Group that are similar in size and management fee structure. For example, if a fund is in the first quartile of the ASPG, the fund's management fee ranks in the least expensive or lowest 25% of funds in the ASPG. The ASPG represents at least 15% of the funds in the Total Mapped Group with comparable asset size and management fee structures, subject to a minimum of 50 funds (or all funds in the Total Mapped Group if fewer than 50). Additional information, such as the ASPG quartile in which a fund's management fee rate ranked, is also included in the charts and was considered by the Board.
Communications Equipment Portfolio

Computers Portfolio

IT Services Portfolio
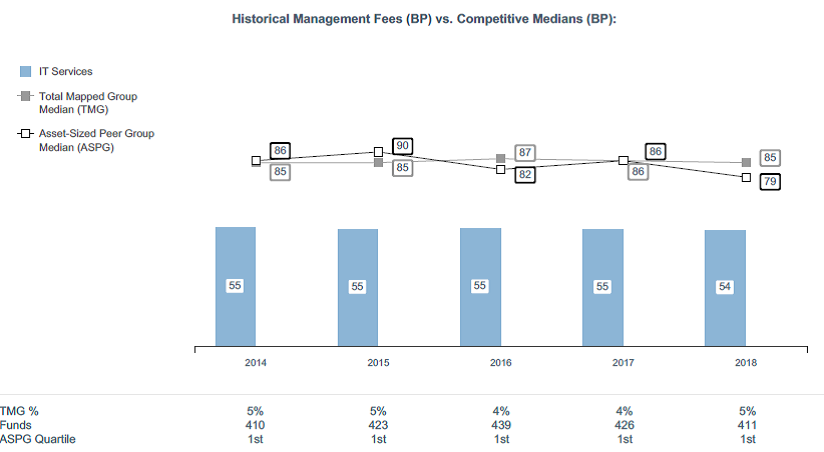
Semiconductors Portfolio
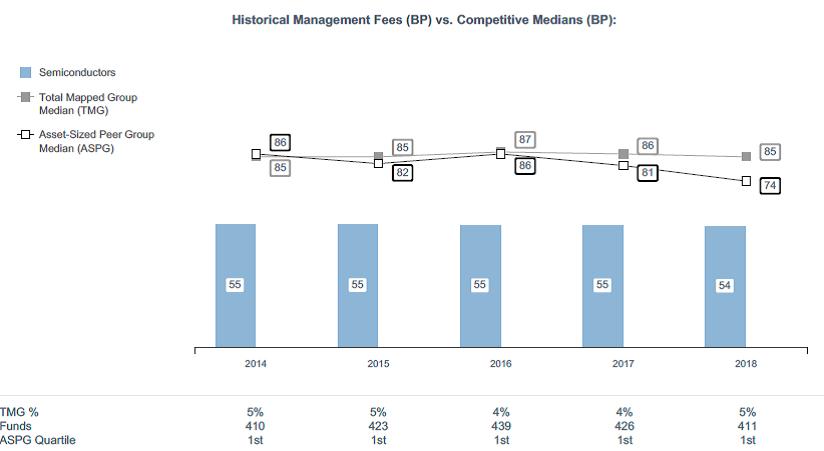
Software and IT Services Portfolio

Technology Portfolio
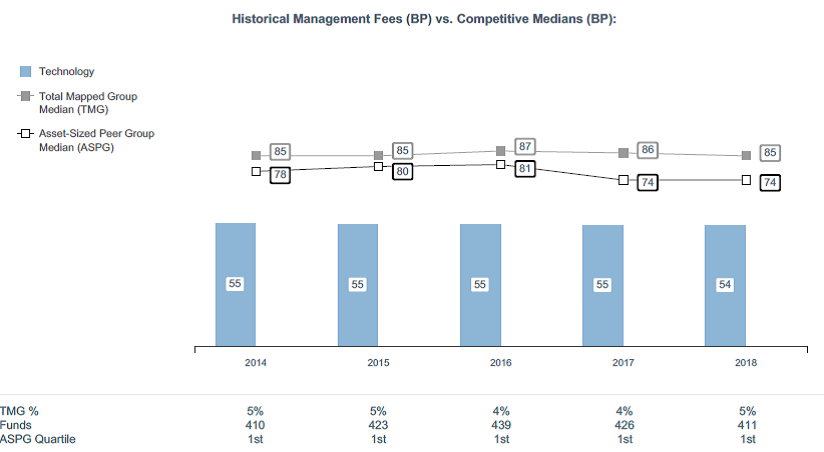
The Board noted that each fund's management fee rate ranked below the median of its Total Mapped Group and below the median of its ASPG for the 12-month period ended June 30, 2018.
The Board noted that it and the boards of other Fidelity funds formed an ad hoc Committee on Group Fee, which meets periodically, to conduct an in-depth review of the "group fee" component of the management fee of funds with such management fee structures. The Committee's focus included the mechanics of the group fee, the competitive landscape of group fee structures, Fidelity funds with no group fee component and investment products not included in group fee assets. The Board also considered that, for funds subject to the group fee, FMR agreed to voluntarily waive fees over a specified period of time in amounts designed to account for assets converted from certain funds to certain collective investment trusts.
Based on its review, the Board concluded that each fund's management fee is fair and reasonable in light of the services that the fund receives and the other factors considered.
Total Expense Ratio. In its review of each fund's total expense ratio, the Board considered the fund's management fee rate as well as other fund expenses, such as transfer agent fees, pricing and bookkeeping fees, and custodial, legal, and audit fees. The Board also noted that Fidelity may agree to waive fees and expenses from time to time, and the extent to which, if any, it has done so for each fund. As part of its review, the Board also considered the current and historical total expense ratios of each fund compared to competitive fund median expenses. Each fund is compared to those funds and classes in the Total Mapped Group (used by the Board for management fee comparisons) that have a similar sales load structure.
The Board noted that each fund's total expense ratio ranked below the competitive median for the 12-month period ended June 30, 2018.
Fees Charged to Other Fidelity Clients. The Board also considered Fidelity fee structures and other information with respect to clients of Fidelity, such as other funds advised or subadvised by Fidelity, pension plan clients, and other institutional clients with similar mandates. The Board noted that a joint ad hoc committee created by it and the boards of other Fidelity funds periodically reviews and compares Fidelity's institutional investment advisory business with its business of providing services to the Fidelity funds and also noted the most recent findings of the committee. The Board noted that the committee's review included a consideration of the differences in services provided, fees charged, and costs incurred, as well as competition in the markets serving the different categories of clients.
Based on its review of total expense ratios and fees charged to other Fidelity clients, the Board concluded that each fund's total expense ratio was reasonable in light of the services that the fund and its shareholders receive and the other factors considered.
Costs of the Services and Profitability. The Board considered the revenues earned and the expenses incurred by Fidelity in conducting the business of developing, marketing, distributing, managing, administering and servicing each fund and servicing each fund's shareholders. The Board also considered the level of Fidelity's profits in respect of all the Fidelity funds.
On an annual basis, Fidelity presents to the Board information about the profitability of its relationships with each fund. Fidelity calculates profitability information for each fund, as well as aggregate profitability information for groups of Fidelity funds and all Fidelity funds, using a series of detailed revenue and cost allocation methodologies which originate with the books and records of Fidelity on which Fidelity's audited financial statements are based. The Audit Committee of the Board reviews any significant changes from the prior year's methodologies.
PricewaterhouseCoopers LLP (PwC), auditor to Fidelity and certain Fidelity funds, has been engaged annually by the Board as part of the Board's assessment of Fidelity's profitability analysis. PwC's engagement includes the review and assessment of the methodologies used by Fidelity in determining the revenues and expenses attributable to Fidelity's mutual fund business, and completion of agreed-upon procedures in respect of the mathematical accuracy of the fund profitability information and its conformity to established allocation methodologies. After considering PwC's reports issued under the engagement and information provided by Fidelity, the Board concluded that while other allocation methods may also be reasonable, Fidelity's profitability methodologies are reasonable in all material respects.
The Board also reviewed Fidelity's non-fund businesses and potential indirect benefits such businesses may have received as a result of their association with Fidelity's mutual fund business (i.e., fall-out benefits) as well as cases where Fidelity's affiliates may benefit from the funds' business. The Board noted that changes to fall-out benefits year-over-year reflect business developments at Fidelity's various businesses.
The Board considered the costs of the services provided by and the profits realized by Fidelity in connection with the operation of each fund and was satisfied that the profitability was not excessive.
Economies of Scale. The Board considered whether there have been economies of scale in respect of the management of the Fidelity funds, whether the Fidelity funds (including each fund) have appropriately benefited from any such economies of scale, and whether there is potential for realization of any further economies of scale. The Board considered the extent to which each fund will benefit from economies of scale as assets grow through increased services to the fund, through waivers or reimbursements, or through fee or expense ratio reductions. The Board also noted that a committee (the Economies of Scale Committee) created by it and the boards of other Fidelity funds periodically analyzes whether Fidelity attains economies of scale in respect of the management and servicing of the Fidelity funds, whether the Fidelity funds have appropriately benefited from such economies of scale, and whether there is potential for realization of any further economies of scale.
The Board recognized that each fund's management contract incorporates a "group fee" structure, which provides for lower group fee rates as total group assets increase, and for higher group fee rates as total group assets decrease (with "group assets" defined to include fund assets under SelectCo's management plus assets under FMR's management). SelectCo calculates the group fee rates based on a tiered asset "breakpoint" schedule that varies based on asset class. The Board considered that the group fee is designed to deliver the benefits of economies of scale to fund shareholders when total group assets increase, even if assets of any particular fund are unchanged or have declined, because some portion of Fidelity's costs are attributable to services provided to all Fidelity funds, and all funds benefit if those costs can be allocated among more assets. The Board concluded that, given the group fee structure, fund shareholders will benefit from lower management fees as group assets increase at the fund complex level, regardless of whether Fidelity achieves any such economies of scale.
The Board concluded, taking into account the analysis of the Economies of Scale Committee, that economies of scale, if any, are being appropriately shared between fund shareholders and Fidelity.
Additional Information Requested by the Board. In order to develop fully the factual basis for consideration of the Fidelity funds' advisory contracts, the Board requested and received additional information on certain topics, including: (i) fund performance trends, in particular the underperformance of certain funds, and Fidelity's long-term strategies for certain funds; (ii) Fidelity's fund profitability methodology, profitability trends for certain funds, and the impact of certain factors on fund profitability results; (iii) metrics for evaluating index fund and ETF performance and information about ETF trading characteristics; (iv) the methodology with respect to the evaluation of competitive fund data and peer group classifications and fee comparisons; (v) the expense structures for different funds and classes; (vi) information regarding other accounts managed by Fidelity, including collective investment trusts; and (vii) Fidelity's philosophies and strategies for evaluating funds and classes with lower or declining asset levels.
Based on its evaluation of all of the conclusions noted above, and after considering all factors it believed relevant, the Board concluded that the advisory fee arrangements are fair and reasonable, and that each fund's Advisory Contracts should be renewed.
SELTEC-ANN-0419
1.813669.114
Fidelity® Select Portfolios®
Materials Sector Chemicals Portfolio
Gold Portfolio
Materials Portfolio
Annual Report February 28, 2019 Includes Fidelity and Fidelity Advisor share classes |
|
Beginning on January 1, 2021, as permitted by regulations adopted by the Securities and Exchange Commission, paper copies of a fund’s shareholder reports will no longer be sent by mail, unless you specifically request paper copies of the reports from the fund or from your financial intermediary, such as a financial advisor, broker-dealer or bank. Instead, the reports will be made available on a website, and you will be notified by mail each time a report is posted and provided with a website link to access the report.
If you already elected to receive shareholder reports electronically, you will not be affected by this change and you need not take any action. You may elect to receive shareholder reports and other communications from a fund electronically, by contacting your financial intermediary. For Fidelity customers, visit Fidelity's web site or call Fidelity using the contact information listed below.
You may elect to receive all future reports in paper free of charge. If you wish to continue receiving paper copies of your shareholder reports, you may contact your financial intermediary or, if you are a Fidelity customer, visit Fidelity’s website, or call Fidelity at the applicable toll-free number listed below. Your election to receive reports in paper will apply to all funds held with the fund complex/your financial intermediary.
| Account Type | Website | Phone Number |
| Brokerage, Mutual Fund, or Annuity Contracts: | fidelity.com/mailpreferences | 1-800-343-3548 |
| Employer Provided Retirement Accounts: | netbenefits.fidelity.com/preferences (choose 'no' under Required Disclosures to continue to print) | 1-800-343-0860 |
| Advisor Sold Accounts Serviced Through Your Financial Intermediary: | Contact Your Financial Intermediary | Your Financial Intermediary's phone number |
| Advisor Sold Accounts Serviced by Fidelity: | institutional.fidelity.com | 1-877-208-0098 |
Contents
To view a fund's proxy voting guidelines and proxy voting record for the 12-month period ended June 30, visit http://www.fidelity.com/proxyvotingresults or visit the Securities and Exchange Commission's (SEC) web site at http://www.sec.gov.
You may also call 1-800-544-8544 if you’re an individual investing directly with Fidelity, call 1-800-835-5092 if you’re a plan sponsor or participant with Fidelity as your recordkeeper or call 1-877-208-0098 on institutional accounts or if you’re an advisor or invest through one to request a free copy of the proxy voting guidelines.
Standard & Poor's, S&P and S&P 500 are registered service marks of The McGraw-Hill Companies, Inc. and have been licensed for use by Fidelity Distributors Corporation.
Other third-party marks appearing herein are the property of their respective owners.
All other marks appearing herein are registered or unregistered trademarks or service marks of FMR LLC or an affiliated company. © 2019 FMR LLC. All rights reserved.
This report and the financial statements contained herein are submitted for the general information of the shareholders of the Funds. This report is not authorized for distribution to prospective investors in the Funds unless preceded or accompanied by an effective prospectus.
A fund files its complete schedule of portfolio holdings with the SEC for the first and third quarters of each fiscal year on Form N-Q. Forms N-Q are available on the SEC’s web site at http://www.sec.gov. A fund's Forms N-Q may be reviewed and copied at the SEC’s Public Reference Room in Washington, DC. Information regarding the operation of the SEC's Public Reference Room may be obtained by calling 1-800-SEC-0330.
For a complete list of a fund's portfolio holdings, view the most recent holdings listing, semiannual report, or annual report on Fidelity's web site at http://www.fidelity.com, http://www.institutional.fidelity.com, or http://www.401k.com, as applicable.
NOT FDIC INSURED •MAY LOSE VALUE •NO BANK GUARANTEE
Neither the Funds nor Fidelity Distributors Corporation is a bank.
Chemicals Portfolio
Performance: The Bottom Line
Average annual total return reflects the change in the value of an investment, assuming reinvestment of distributions from dividend income and capital gains (the profits earned upon the sale of securities that have grown in value, if any) and assuming a constant rate of performance each year. The hypothetical investment and the average annual total returns do not reflect the deduction of taxes that a shareholder would pay on fund distributions or the redemption of fund shares. During periods of reimbursement by Fidelity, a fund’s total return will be greater than it would be had the reimbursement not occurred. How a fund did yesterday is no guarantee of how it will do tomorrow.
Average Annual Total Returns
| For the periods ended February 28, 2019 | Past 1 year | Past 5 years | Past 10 years |
| Chemicals Portfolio | (11.10)% | 5.59% | 18.10% |
$10,000 Over 10 Years
Let's say hypothetically that $10,000 was invested in Chemicals Portfolio on February 28, 2009.
The chart shows how the value of your investment would have changed, and also shows how the S&P 500® Index performed over the same period.
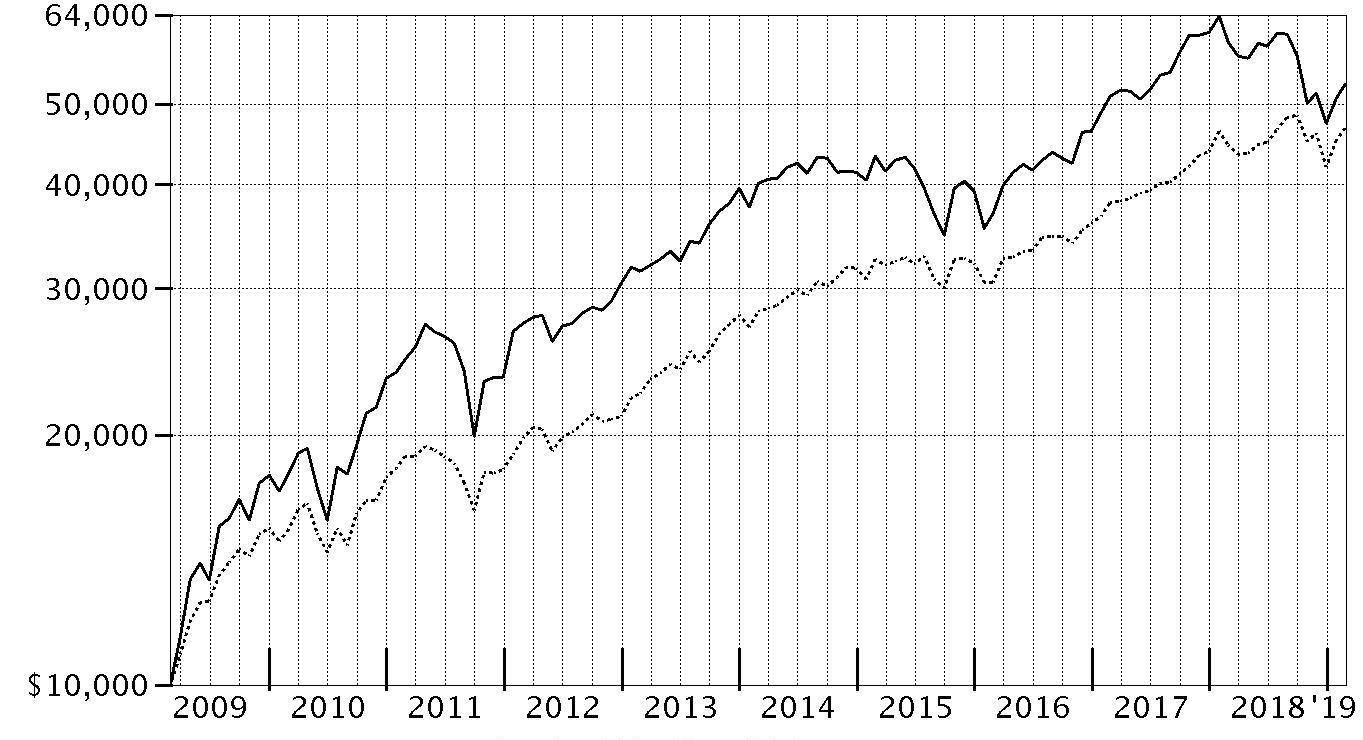
| Period Ending Values |
| $52,770 | Chemicals Portfolio |
| $46,739 | S&P 500® Index |
Chemicals Portfolio
Management's Discussion of Fund Performance
Market Recap: The S&P 500
® index gained 4.68% for the 12 months ending February 28, 2019, as the U.S. equity bellwether began the new year on a high note after enduring a final quarter of 2018 in which resurgent volatility upset the aging bull market. In October, rising U.S. Treasury yields and concern about peaking corporate earnings growth sent many investors fleeing from risk assets as they were still dealing with lingering uncertainty related to global trade and the U.S. Federal Reserve picking up the pace of interest rate hikes. The index returned -6.84% in October, at the time its largest monthly drop in seven years. But conditions worsened through Christmas, as jitters about the economy and another hike in rates led to a spike in market volatility and a -9.03% result for December. Sharply reversing course to begin 2019, the S&P 500
® gained 11.48% year-to-date, its strongest two-month opening since 1991, amid upbeat company earnings/outlooks and signs the Fed may pause on rates. For the full period, some economically sensitive sectors fared worst, with financials (-6%) and materials (-6%) both losing ground. Energy gained 1%, while communication services and industrials each rose roughly 2%. In contrast, the defensive utilities (+20%), real estate (+20%) and health care (+11%) sectors led the way, while consumer staples finished near the index. Information technology and consumer discretionary were rattled in the late-2018 downturn, but earlier strength contributed to advances of 9% and roughly 7%, respectively.
Comments from Portfolio Manager Richard Malnight: For the year, the fund returned -11.10%, notably trailing the -4.33% result of the MSCI U.S. IMI Chemicals 25/50 Index, and also underperforming the S&P 500
®. Versus the MSCI index, positioning in specialty chemicals, commodity chemicals and diversified chemicals detracted most from the fund’s performance. Holdings in fertilizers & agricultural chemicals weighed on our relative result to a lesser extent. At the individual stock level, not owning MSCI index component Ecolab detracted notably. Overweighting DowDuPont – by far, the fund’s largest holding – and Westlake Chemical also worked against us. During the period, I shifted capital from Westlake to Olin, which ended the period as the fund’s fourth-largest position. Elsewhere, relative performance benefited modestly from stock picking in industrial gases. The top individual relative contributor was a non-benchmark position in Germany-based industrial gases company Linde. Given the planned merger of Linde and Praxair – a deal that closed in December – we chose to play the Linde side of it and avoided Praxair. Although not owning Praxair detracted significantly this period, the combined impact of our positions in Linde and Praxair was positive.
The views expressed above reflect those of the portfolio manager(s) only through the end of the period as stated on the cover of this report and do not necessarily represent the views of Fidelity or any other person in the Fidelity organization. Any such views are subject to change at any time based upon market or other conditions and Fidelity disclaims any responsibility to update such views. These views may not be relied on as investment advice and, because investment decisions for a Fidelity fund are based on numerous factors, may not be relied on as an indication of trading intent on behalf of any Fidelity fund.
Chemicals Portfolio
Investment Summary (Unaudited)
Top Ten Stocks as of February 28, 2019
| | % of fund's net assets |
| DowDuPont, Inc. | 23.0 |
| Linde PLC | 12.1 |
| The Chemours Co. LLC | 7.8 |
| Olin Corp. | 6.6 |
| Sherwin-Williams Co. | 4.9 |
| Air Products & Chemicals, Inc. | 4.9 |
| International Flavors & Fragrances, Inc. | 4.3 |
| Tronox Ltd. Class A | 3.8 |
| The Mosaic Co. | 3.1 |
| Univar, Inc. | 3.0 |
| | 73.5 |
Top Industries (% of fund's net assets)
| As of February 28, 2019 |
| | Chemicals | 94.1% |
| | Trading Companies & Distributors | 3.0% |
| | Metals & Mining | 1.3% |
| | Oil, Gas & Consumable Fuels | 0.5% |
| | Biotechnology | 0.2% |
| | All Others* | 0.9% |

* Includes short-term investments and net other assets (liabilities).
Chemicals Portfolio
Schedule of Investments February 28, 2019
Showing Percentage of Net Assets
| Common Stocks - 99.1% | | | |
| | | Shares | Value |
| Biotechnology - 0.2% | | | |
| Biotechnology - 0.2% | | | |
| Calyxt, Inc. (a)(b) | | 187,310 | $3,002,579 |
| Chemicals - 94.1% | | | |
| Commodity Chemicals - 19.1% | | | |
| Cabot Corp. | | 350,000 | 16,408,000 |
| Ciner Resources LP | | 291,563 | 7,242,425 |
| LyondellBasell Industries NV Class A | | 392,898 | 33,600,637 |
| Olin Corp. | | 2,946,524 | 76,197,111 |
| Orion Engineered Carbons SA | | 572,500 | 15,955,575 |
| Trinseo SA | | 118,400 | 5,942,496 |
| Tronox Ltd. Class A | | 3,678,469 | 43,516,288 |
| Valvoline, Inc. | | 72,100 | 1,354,759 |
| Westlake Chemical Corp. | | 287,156 | 20,063,590 |
| | | | 220,280,881 |
| Diversified Chemicals - 34.7% | | | |
| DowDuPont, Inc. | | 4,979,480 | 265,057,720 |
| Eastman Chemical Co. | | 212,657 | 17,584,607 |
| Ingevity Corp. (a) | | 236,600 | 27,261,052 |
| The Chemours Co. LLC | | 2,377,400 | 90,412,522 |
| | | | 400,315,901 |
| Fertilizers & Agricultural Chemicals - 5.2% | | | |
| CF Industries Holdings, Inc. | | 380,200 | 16,044,440 |
| The Mosaic Co. | | 1,144,100 | 35,776,007 |
| The Scotts Miracle-Gro Co. Class A | | 105,100 | 8,607,690 |
| | | | 60,428,137 |
| Industrial Gases - 17.0% | | | |
| Air Products & Chemicals, Inc. | | 309,911 | 56,149,675 |
| Linde PLC | | 808,616 | 140,084,636 |
| | | | 196,234,311 |
| Specialty Chemicals - 18.1% | | | |
| Celanese Corp. Class A | | 232,200 | 23,751,738 |
| Ecolab, Inc. | | 73,700 | 12,448,667 |
| Element Solutions, Inc. (a) | | 2,931,943 | 33,013,678 |
| International Flavors & Fragrances, Inc. | | 390,400 | 49,776,000 |
| PPG Industries, Inc. | | 32,200 | 3,605,434 |
| RPM International, Inc. | | 297,000 | 17,187,390 |
| Sherwin-Williams Co. | | 131,333 | 56,893,456 |
| W.R. Grace & Co. | | 154,500 | 12,000,015 |
| | | | 208,676,378 |
|
| TOTAL CHEMICALS | | | 1,085,935,608 |
|
| Metals & Mining - 1.3% | | | |
| Diversified Metals & Mining - 1.3% | | | |
| Livent Corp. (b) | | 1,156,472 | 14,802,842 |
| Oil, Gas & Consumable Fuels - 0.5% | | | |
| Oil & Gas Refining & Marketing - 0.5% | | | |
| Valero Energy Corp. | | 68,600 | 5,595,016 |
| Trading Companies & Distributors - 3.0% | | | |
| Trading Companies & Distributors - 3.0% | | | |
| Univar, Inc. (a) | | 1,517,094 | 34,301,495 |
| TOTAL COMMON STOCKS | | | |
| (Cost $942,071,184) | | | 1,143,637,540 |
|
| Money Market Funds - 1.7% | | | |
| Fidelity Cash Central Fund, 2.44% (c) | | 4,469,089 | 4,469,983 |
| Fidelity Securities Lending Cash Central Fund 2.45% (c)(d) | | 15,033,712 | 15,035,216 |
| TOTAL MONEY MARKET FUNDS | | | |
| (Cost $19,505,199) | | | 19,505,199 |
| TOTAL INVESTMENT IN SECURITIES - 100.8% | | | |
| (Cost $961,576,383) | | | 1,163,142,739 |
| NET OTHER ASSETS (LIABILITIES) - (0.8)% | | | (9,763,697) |
| NET ASSETS - 100% | | | $1,153,379,042 |
Legend
(a) Non-income producing
(b) Security or a portion of the security is on loan at period end.
(c) Affiliated fund that is generally available only to investment companies and other accounts managed by Fidelity Investments. The rate quoted is the annualized seven-day yield of the fund at period end. A complete unaudited listing of the fund's holdings as of its most recent quarter end is available upon request. In addition, each Fidelity Central Fund's financial statements, which are not covered by the Fund's Report of Independent Registered Public Accounting Firm, are available on the SEC's website or upon request.
(d) Investment made with cash collateral received from securities on loan.
Affiliated Central Funds
Information regarding fiscal year to date income earned by the Fund from investments in Fidelity Central Funds is as follows:
| Fund | Income earned |
| Fidelity Cash Central Fund | $220,209 |
| Fidelity Securities Lending Cash Central Fund | 175,711 |
| Total | $395,920 |
Amounts in the income column in the above table include any capital gain distributions from underlying funds, which are presented in the corresponding line-item in the Statement of Operations, if applicable.
Investment Valuation
All investments are categorized as Level 1 under the Fair Value Hierarchy. The inputs or methodology used for valuing securities may not be an indication of the risk associated with investing in those securities. For more information on valuation inputs please refer to the Investment Valuation section in the accompanying Notes to Financial Statements.
Other Information
Distribution of investments by country or territory of incorporation, as a percentage of Total Net Assets, is as follows (Unaudited):
| United States of America | 79.3% |
| Ireland | 12.1% |
| Australia | 3.8% |
| Netherlands | 2.9% |
| Luxembourg | 1.9% |
| | 100.0% |
See accompanying notes which are an integral part of the financial statements.
Chemicals Portfolio
Financial Statements
Statement of Assets and Liabilities
| | | February 28, 2019 |
| Assets | | |
Investment in securities, at value (including securities loaned of $15,089,190) — See accompanying schedule:
Unaffiliated issuers (cost $942,071,184) | $1,143,637,540 | |
| Fidelity Central Funds (cost $19,505,199) | 19,505,199 | |
| Total Investment in Securities (cost $961,576,383) | | $1,163,142,739 |
| Receivable for investments sold | | 2,332,466 |
| Receivable for fund shares sold | | 508,676 |
| Dividends receivable | | 4,055,919 |
| Distributions receivable from Fidelity Central Funds | | 36,464 |
| Prepaid expenses | | 14,978 |
| Other receivables | | 101,653 |
| Total assets | | 1,170,192,895 |
| Liabilities | | |
| Payable for fund shares redeemed | $894,137 | |
| Accrued management fee | 518,139 | |
| Other affiliated payables | 220,335 | |
| Other payables and accrued expenses | 145,935 | |
| Collateral on securities loaned | 15,035,307 | |
| Total liabilities | | 16,813,853 |
| Net Assets | | $1,153,379,042 |
| Net Assets consist of: | | |
| Paid in capital | | $919,382,820 |
| Total distributable earnings (loss) | | 233,996,222 |
| Net Assets, for 85,004,878 shares outstanding | | $1,153,379,042 |
| Net Asset Value, offering price and redemption price per share ($1,153,379,042 ÷ 85,004,878 shares) | | $13.57 |
See accompanying notes which are an integral part of the financial statements.
Statement of Operations
| | | Year ended February 28, 2019 |
| Investment Income | | |
| Dividends | | $32,260,304 |
| Income from Fidelity Central Funds | | 395,920 |
| Total income | | 32,656,224 |
| Expenses | | |
| Management fee | $7,784,843 | |
| Transfer agent fees | 2,695,749 | |
| Accounting and security lending fees | 454,603 | |
| Custodian fees and expenses | 53,762 | |
| Independent trustees' fees and expenses | 8,423 | |
| Registration fees | 47,376 | |
| Audit | 52,943 | |
| Legal | 9,731 | |
| Interest | 11,739 | |
| Miscellaneous | (13,211) | |
| Total expenses before reductions | 11,105,958 | |
| Expense reductions | (109,555) | |
| Total expenses after reductions | | 10,996,403 |
| Net investment income (loss) | | 21,659,821 |
| Realized and Unrealized Gain (Loss) | | |
| Net realized gain (loss) on: | | |
| Investment securities: | | |
| Unaffiliated issuers | 93,647,178 | |
| Fidelity Central Funds | (489) | |
| Foreign currency transactions | 22,617 | |
| Total net realized gain (loss) | | 93,669,306 |
| Change in net unrealized appreciation (depreciation) on: | | |
| Investment securities: | | |
| Unaffiliated issuers | (285,152,364) | |
| Assets and liabilities in foreign currencies | (22,006) | |
| Total change in net unrealized appreciation (depreciation) | | (285,174,370) |
| Net gain (loss) | | (191,505,064) |
| Net increase (decrease) in net assets resulting from operations | | $(169,845,243) |
See accompanying notes which are an integral part of the financial statements.
Statement of Changes in Net Assets
| | Year ended February 28, 2019 | Year ended February 28, 2018 |
| Increase (Decrease) in Net Assets | | |
| Operations | | |
| Net investment income (loss) | $21,659,821 | $19,973,215 |
| Net realized gain (loss) | 93,669,306 | 192,613,270 |
| Change in net unrealized appreciation (depreciation) | (285,174,370) | 56,793,943 |
| Net increase (decrease) in net assets resulting from operations | (169,845,243) | 269,380,428 |
| Distributions to shareholders | (172,397,316) | – |
| Distributions to shareholders from net investment income | – | (15,828,578) |
| Distributions to shareholders from net realized gain | – | (130,959,179) |
| Total distributions | (172,397,316) | (146,787,757) |
| Share transactions | | |
| Proceeds from sales of shares | 142,345,479 | 708,415,147 |
| Reinvestment of distributions | 163,460,684 | 140,010,917 |
| Cost of shares redeemed | (600,405,301) | (807,440,266) |
| Net increase (decrease) in net assets resulting from share transactions | (294,599,138) | 40,985,798 |
| Total increase (decrease) in net assets | (636,841,697) | 163,578,469 |
| Net Assets | | |
| Beginning of period | 1,790,220,739 | 1,626,642,270 |
| End of period | $1,153,379,042 | $1,790,220,739 |
| Other Information | | |
| Undistributed net investment income end of period | | $1,118,316 |
| Shares(a) | | |
| Sold | 9,180,276 | 41,391,320 |
| Issued in reinvestment of distributions | 11,635,665 | 8,462,680 |
| Redeemed | (39,027,003) | (46,796,860) |
| Net increase (decrease) | (18,211,062) | 3,057,140 |
(a) Share activity prior to August 10, 2018 has been adjusted to reflect the impact of the 10 for 1 share split occurred on that date.
See accompanying notes which are an integral part of the financial statements.
Financial Highlights
Chemicals Portfolio
| | | | | | |
| Years ended February 28, | 2019 | 2018 | 2017 | 2016A | 2015 |
| Selected Per–Share DataB | | | | | |
| Net asset value, beginning of period | $17.34 | $16.24 | $12.32 | $15.33 | $14.82 |
| Income from Investment Operations | | | | | |
| Net investment income (loss)C | .23 | .19 | .18 | .19 | .16 |
| Net realized and unrealized gain (loss) | (2.17) | 2.36 | 4.44 | (2.34) | .91 |
| Total from investment operations | (1.94) | 2.55 | 4.62 | (2.15) | 1.07 |
| Distributions from net investment income | (.21) | (.16) | (.17) | (.18) | (.14) |
| Distributions from net realized gain | (1.62) | (1.29) | (.53) | (.68) | (.42) |
| Total distributions | (1.83) | (1.45) | (.70) | (.86) | (.56) |
| Redemption fees added to paid in capitalC | – | – | –D | –D | –D |
| Net asset value, end of period | $13.57 | $17.34 | $16.24 | $12.32 | $15.33 |
| Total ReturnE | (11.10)% | 16.31% | 38.02% | (14.46)% | 7.52% |
| Ratios to Average Net AssetsF,G | | | | | |
| Expenses before reductions | .77% | .77% | .80% | .80% | .79% |
| Expenses net of fee waivers, if any | .77% | .77% | .80% | .80% | .79% |
| Expenses net of all reductions | .76% | .77% | .79% | .79% | .79% |
| Net investment income (loss) | 1.50% | 1.12% | 1.26% | 1.36% | 1.10% |
| Supplemental Data | | | | | |
| Net assets, end of period (000 omitted) | $1,153,379 | $1,790,221 | $1,626,642 | $1,046,827 | $1,625,067 |
| Portfolio turnover rateH | 62% | 62% | 85% | 79% | 80%I |
A For the year ended February 29.
B Per Share amounts have been adjusted to reflect the impact of the 10 for 1 share split that occurred on August 10, 2018.
C Calculated based on average shares outstanding during the period.
D Amount represents less than $.005 per share.
E Total returns would have been lower if certain expenses had not been reduced during the applicable periods shown.
F Fees and expenses of any underlying Fidelity Central Funds are not included in the Fund's expense ratio. The Fund indirectly bears its proportionate share of the expenses of any underlying Fidelity Central Funds.
G Expense ratios reflect operating expenses of the Fund. Expenses before reductions do not reflect amounts reimbursed by the investment adviser or reductions from brokerage service arrangements or reductions from other expense offset arrangements and do not represent the amount paid by the Fund during periods when reimbursements or reductions occur. Expenses net of fee waivers reflect expenses after reimbursement by the investment adviser but prior to reductions from brokerage service arrangements or other expense offset arrangements. Expenses net of all reductions represent the net expenses paid by the Fund.
H Amount does not include the portfolio activity of any underlying Fidelity Central Funds.
I Portfolio turnover rate excludes securities received or delivered in-kind.
See accompanying notes which are an integral part of the financial statements.
Notes to Financial Statements
For the period ended February 28, 2019
1. Organization.
Chemicals Portfolio (the Fund) is a non-diversified fund of Fidelity Select Portfolios (the Trust) and is authorized to issue an unlimited number of shares. Share transactions on the Statement of Changes in Net Assets may contain exchanges between affiliated funds. The Trust is registered under the Investment Company Act of 1940, as amended (the 1940 Act), as an open-end management investment company organized as a Massachusetts business trust. The Fund invests primarily in securities of companies whose principal business activities fall within specific industries.
Effective August 10, 2018, Chemicals Portfolio underwent a 10 for 1 share split. The effect of the share split transaction was to multiply the number of outstanding shares of Chemicals Portfolio by a split factor of 10:1, with a corresponding decrease in net asset value (NAV) per share. This event does not impact the overall net assets of Chemicals Portfolio. The per share data presented in the Financial Highlights and Share activity presented in the Statements of Changes in Net Assets for Chemicals Portfolio have been retroactively adjusted to reflect this share split.
2. Investments in Fidelity Central Funds.
The Fund invests in Fidelity Central Funds, which are open-end investment companies generally available only to other investment companies and accounts managed by the investment adviser and its affiliates. The Fund's Schedule of Investments lists each of the Fidelity Central Funds held as of period end, if any, as an investment of the Fund, but does not include the underlying holdings of each Fidelity Central Fund. As an Investing Fund, the Fund indirectly bears its proportionate share of the expenses of the underlying Fidelity Central Funds.
The Money Market Central Funds seek preservation of capital and current income and are managed by Fidelity Investments Money Management, Inc. (FIMM), an affiliate of the investment adviser. Annualized expenses of the Money Market Central Funds as of their most recent shareholder report date are less than .005%.
A complete unaudited list of holdings for each Fidelity Central Fund is available upon request or at the Securities and Exchange Commission (the SEC) website at www.sec.gov. In addition, the financial statements of the Fidelity Central Funds, which are not covered by the Fund's Report of Independent Registered Public Accounting Firm, are available on the SEC website or upon request.
3. Significant Accounting Policies.
The Fund is an investment company and applies the accounting and reporting guidance of the Financial Accounting Standards Board (FASB) Accounting Standards Codification Topic 946 Financial Services – Investments Companies. The financial statements have been prepared in conformity with accounting principles generally accepted in the United States of America (GAAP), which require management to make certain estimates and assumptions at the date of the financial statements. Actual results could differ from those estimates. Subsequent events, if any, through the date that the financial statements were issued have been evaluated in the preparation of the financial statements. The following summarizes the significant accounting policies of the Fund:
Investment Valuation. Investments are valued as of 4:00 p.m. Eastern time on the last calendar day of the period. The Board of Trustees (the Board) has delegated the day to day responsibility for the valuation of the Fund's investments to the Fair Value Committee (the Committee) established by the Fund's investment adviser. In accordance with valuation policies and procedures approved by the Board, the Fund attempts to obtain prices from one or more third party pricing vendors or brokers to value its investments. When current market prices, quotations or currency exchange rates are not readily available or reliable, investments will be fair valued in good faith by the Committee, in accordance with procedures adopted by the Board. Factors used in determining fair value vary by investment type and may include market or investment specific events. The frequency with which these procedures are used cannot be predicted and they may be utilized to a significant extent. The Committee oversees the Fund's valuation policies and procedures and reports to the Board on the Committee's activities and fair value determinations. The Board monitors the appropriateness of the procedures used in valuing the Fund's investments and ratifies the fair value determinations of the Committee.
The Fund categorizes the inputs to valuation techniques used to value its investments into a disclosure hierarchy consisting of three levels as shown below:
- Level 1 – quoted prices in active markets for identical investments
- Level 2 – other significant observable inputs (including quoted prices for similar investments, interest rates, prepayment speeds, etc.)
- Level 3 – unobservable inputs (including the Fund's own assumptions based on the best information available)
Valuation techniques used to value the Fund's investments by major category are as follows:
Equity securities, including restricted securities, for which market quotations are readily available, are valued at the last reported sale price or official closing price as reported by a third party pricing vendor on the primary market or exchange on which they are traded and are categorized as Level 1 in the hierarchy. In the event there were no sales during the day or closing prices are not available, securities are valued at the last quoted bid price or may be valued using the last available price and are generally categorized as Level 2 in the hierarchy. For foreign equity securities, when market or security specific events arise, comparisons to the valuation of American Depositary Receipts (ADRs), futures contracts, Exchange-Traded Funds (ETFs) and certain indexes as well as quoted prices for similar securities may be used and would be categorized as Level 2 in the hierarchy. For equity securities, including restricted securities, where observable inputs are limited, assumptions about market activity and risk are used and these securities may be categorized as Level 3 in the hierarchy.
Investments in open-end mutual funds, including the Fidelity Central Funds, are valued at their closing net asset value (NAV) each business day and are categorized as Level 1 in the hierarchy.
Changes in valuation techniques may result in transfers in or out of an assigned level within the disclosure hierarchy.
Foreign Currency. The Fund may use foreign currency contracts to facilitate transactions in foreign-denominated securities. Gains and losses from these transactions may arise from changes in the value of the foreign currency or if the counterparties do not perform under the contracts' terms.
Foreign-denominated assets, including investment securities, and liabilities are translated into U.S. dollars at the exchange rates at period end. Purchases and sales of investment securities, income and dividends received and expenses denominated in foreign currencies are translated into U.S. dollars at the exchange rate in effect on the transaction date.
The effects of exchange rate fluctuations on investments are included with the net realized and unrealized gain (loss) on investment securities. Other foreign currency transactions resulting in realized and unrealized gain (loss) are disclosed separately.
Investment Transactions and Income. For financial reporting purposes, the Fund's investment holdings and NAV include trades executed through the end of the last business day of the period. The NAV per share for processing shareholder transactions is calculated as of the close of business of the New York Stock Exchange (NYSE), normally 4:00 p.m. Eastern time and includes trades executed through the end of the prior business day. Gains and losses on securities sold are determined on the basis of identified cost and include proceeds received from litigation. Dividend income is recorded on the ex-dividend date, except for certain dividends from foreign securities where the ex-dividend date may have passed, which are recorded as soon as the Fund is informed of the ex-dividend date. Non-cash dividends included in dividend income, if any, are recorded at the fair market value of the securities received. Income and capital gain distributions from Fidelity Central Funds, if any, are recorded on the ex-dividend date. Certain distributions received by the Fund represent a return of capital or capital gain. The Fund determines the components of these distributions subsequent to the ex-dividend date, based upon receipt of tax filings or other correspondence relating to the underlying investment. These distributions are recorded as a reduction of cost of investments and/or as a realized gain. Investment income is recorded net of foreign taxes withheld where recovery of such taxes is uncertain.
Expenses. Expenses directly attributable to a fund are charged to that fund. Expenses attributable to more than one fund are allocated among the respective funds on the basis of relative net assets or other appropriate methods. Expense estimates are accrued in the period to which they relate and adjustments are made when actual amounts are known.
Deferred Trustee Compensation. Under a Deferred Compensation Plan (the Plan) for the Fund, certain independent Trustees have elected to defer receipt of a portion of their annual compensation. Deferred amounts are invested in a cross-section of Fidelity funds, are marked-to-market and remain in the Fund until distributed in accordance with the Plan. The investment of deferred amounts and the offsetting payable to the Trustees of $101,653 are included in the accompanying Statement of Assets and Liabilities in other receivables and other payables and accrued expenses, respectively.
Income Tax Information and Distributions to Shareholders. Each year, the Fund intends to qualify as a regulated investment company under Subchapter M of the Internal Revenue Code, including distributing substantially all of its taxable income and realized gains. As a result, no provision for U.S. Federal income taxes is required. As of February 28, 2019, the Fund did not have any unrecognized tax benefits in the financial statements; nor is the Fund aware of any tax positions for which it is reasonably possible that the total amounts of unrecognized tax benefits will significantly change in the next twelve months. The Fund files a U.S. federal tax return, in addition to state and local tax returns as required. The Fund's federal income tax returns are subject to examination by the Internal Revenue Service (IRS) for a period of three fiscal years after they are filed. State and local tax returns may be subject to examination for an additional fiscal year depending on the jurisdiction. Foreign taxes are provided for based on the Fund's understanding of the tax rules and rates that exist in the foreign markets in which it invests.
Distributions are declared and recorded on the ex-dividend date. Income and capital gain distributions are determined in accordance with income tax regulations, which may differ from GAAP. In addition, the Fund claimed a portion of the payment made to redeeming shareholders as a distribution for income tax purposes.
Capital accounts within the financial statements are adjusted for permanent book-tax differences. These adjustments have no impact on net assets or the results of operations. Capital accounts are not adjusted for temporary book-tax differences which will reverse in a subsequent period.
Book-tax differences are primarily due to foreign currency transactions, partnerships, deferred trustees compensation and losses deferred due to wash sales.
As of period end, the cost and unrealized appreciation (depreciation) in securities, and derivatives if applicable, for federal income tax purposes were as follows:
| Gross unrealized appreciation | $243,985,071 |
| Gross unrealized depreciation | (45,987,058) |
| Net unrealized appreciation (depreciation) | $197,998,013 |
| Tax Cost | $965,144,726 |
The tax-based components of distributable earnings as of period end were as follows:
| Undistributed ordinary income | $2,827,781 |
| Undistributed long-term capital gain | $33,286,234 |
| Net unrealized appreciation (depreciation) on securities and other investments | $197,983,858 |
The tax character of distributions paid was as follows:
| | February 28, 2019 | February 28, 2018 |
| Ordinary Income | $18,521,629 | $ 82,124,537 |
| Long-term Capital Gains | 153,875,687 | 64,663,220 |
| Total | $172,397,316 | $ 146,787,757 |
New Rule Issuance. During August 2018, the U.S. Securities and Exchange Commission issued Final Rule Release No. 33-10532, Disclosure Update and Simplification. This Final Rule includes amendments specific to registered investment companies that are intended to eliminate overlap in disclosure requirements between Regulation S-X and GAAP. In accordance with these amendments, certain line-items in the Fund's financial statements have been combined or removed for the current period as outlined in the table below.
| Financial Statement | Current Line-Item Presentation (As Applicable) | Prior Line-Item Presentation (As Applicable) |
| Statement of Assets and Liabilities | Total distributable earnings (loss) | Undistributed/Distributions in excess of/Accumulated net investment income (loss)
Accumulated/Undistributed net realized gain (loss)
Net unrealized appreciation (depreciation) |
| Statement of Changes in Net Assets | N/A - removed | Undistributed/Distributions in excess of/Accumulated net investment income (loss) end of period |
| Statement of Changes in Net Assets | Distributions to shareholders | Distributions to shareholders from net investment income
Distributions to shareholders from net realized gain |
4. Purchases and Sales of Investments.
Purchases and sales of securities, other than short-term securities, aggregated $887,206,874 and $1,289,921,055, respectively.
5. Fees and Other Transactions with Affiliates.
Management Fee. Fidelity SelectCo, LLC (the investment adviser) and its affiliates provide the Fund with investment management related services for which the Fund pays a monthly management fee. The management fee is the sum of an individual fund fee rate that is based on an annual rate of .30% of the Fund's average net assets and an annualized group fee rate that averaged .24% during the period. The group fee rate is based upon the average net assets of all the mutual funds advised by Fidelity Management & Research Company (FMR) and the investment adviser. The group fee rate decreases as assets under management increase and increases as assets under management decrease. For the reporting period, the total annual management fee rate was .54% of the Fund's average net assets.
Transfer Agent Fees. Fidelity Investments Institutional Operations Company, Inc. (FIIOC), an affiliate of the investment adviser, is the Fund's transfer, dividend disbursing and shareholder servicing agent. FIIOC receives account fees and asset-based fees that vary according to account size and type of account. FIIOC pays for typesetting, printing and mailing of shareholder reports, except proxy statements. For the period, the transfer agent fees were equivalent to an annual rate of .19% of average net assets.
Accounting and Security Lending Fees. Fidelity Service Company, Inc. (FSC), an affiliate of the investment adviser, maintains the Fund's accounting records. The accounting fee is based on the level of average net assets for each month. Under a separate contract, FSC administers the security lending program. The security lending fee is based on the number and duration of lending transactions. For the period, the fees were equivalent to an annual rate of .03%.
Brokerage Commissions. The Fund placed a portion of its portfolio transactions with brokerage firms which are affiliates of the investment adviser. Brokerage commissions are included in net realized gain (loss) and change in net unrealized appreciation (depreciation) in the Statement of Operations. The commissions paid to these affiliated firms were $39,097 for the period.
Interfund Lending Program. Pursuant to an Exemptive Order issued by the SEC, the Fund, along with other registered investment companies having management contracts with Fidelity Management & Research Company (FMR) or other affiliated entities of FMR, may participate in an interfund lending program. This program provides an alternative credit facility allowing the funds to borrow from, or lend money to, other participating affiliated funds. At period end, there were no interfund loans outstanding. The Fund's activity in this program during the period for which loans were outstanding was as follows:
| Borrower or Lender | Average Loan Balance | Weighted Average Interest Rate | Interest Expense |
| Borrower | $6,516,821 | 2.32% | $11,739 |
Interfund Trades. The Fund may purchase from or sell securities to other Fidelity Funds under procedures adopted by the Board. The procedures have been designed to ensure these interfund trades are executed in accordance with Rule 17a-7 of the 1940 Act. Interfund trades are included within the respective purchases and sales amounts shown in the Purchases and Sales of Investments note.
6. Committed Line of Credit.
The Fund participates with other funds managed by the investment adviser or an affiliate in a $4.25 billion credit facility (the "line of credit") to be utilized for temporary or emergency purposes to fund shareholder redemptions or for other short-term liquidity purposes. The Fund has agreed to pay commitment fees on its pro-rata portion of the line of credit, which amounted to $4,306 and is reflected in Miscellaneous expenses on the Statement of Operations. During the period, the Fund did not borrow on this line of credit.
7. Security Lending.
The Fund lends portfolio securities through a lending agent from time to time in order to earn additional income. On the settlement date of the loan, the Fund receives collateral (in the form of U.S. Treasury obligations, letters of credit and/or cash) against the loaned securities and maintains collateral in an amount not less than 100% of the market value of the loaned securities during the period of the loan. The market value of the loaned securities is determined at the close of business of the Fund and any additional required collateral is delivered to the Fund on the next business day. The Fund or borrower may terminate the loan at any time, and if the borrower defaults on its obligation to return the securities loaned because of insolvency or other reasons, the Fund may apply collateral received from the borrower against the obligation. The Fund may experience delays and costs in recovering the securities loaned. Any cash collateral received is invested in the Fidelity Securities Lending Cash Central Fund. The value of loaned securities and cash collateral at period end are disclosed on the Fund's Statement of Assets and Liabilities. Security lending income represents the income earned on investing cash collateral, less rebates paid to borrowers and any lending agent fees associated with the loan, plus any premium payments received for lending certain types of securities. Security lending income is presented in the Statement of Operations as a component of income from Fidelity Central Funds. Total security lending income during the period amounted to $175,711.
8. Expense Reductions.
Commissions paid to certain brokers with whom the investment adviser, or its affiliates, places trades on behalf of the Fund include an amount in addition to trade execution, which may be rebated back to the Fund to offset certain expenses. This amount totaled $96,776 for the period. In addition, through arrangements with the Fund's transfer agent, credits realized as a result of certain uninvested cash balances were used to reduce the Fund's expenses. During the period, these credits reduced the Fund's transfer agent expenses by $8.
In addition, during the period the investment adviser reimbursed and/or waived a portion of operating expenses in the amount of $12,771.
9. Other.
The Fund's organizational documents provide former and current trustees and officers with a limited indemnification against liabilities arising in connection with the performance of their duties to the Fund. In the normal course of business, the Fund may also enter into contracts that provide general indemnifications. The Fund's maximum exposure under these arrangements is unknown as this would be dependent on future claims that may be made against the Fund. The risk of material loss from such claims is considered remote.
Gold Portfolio
Performance: The Bottom Line
Average annual total return reflects the change in the value of an investment, assuming reinvestment of distributions from dividend income and capital gains (the profits earned upon the sale of securities that have grown in value, if any) and assuming a constant rate of performance each year. The hypothetical investment and the average annual total returns do not reflect the deduction of taxes that a shareholder would pay on fund distributions or the redemption of fund shares. During periods of reimbursement by Fidelity, a fund’s total return will be greater than it would be had the reimbursement not occurred. How a fund did yesterday is no guarantee of how it will do tomorrow.
Average Annual Total Returns
| For the periods ended February 28, 2019 | Past 1 year | Past 5 years | Past 10 years |
| Class A (incl. 5.75% sales charge) | (4.62)% | (3.86)% | (3.62)% |
| Class M (incl. 3.50% sales charge) | (2.59)% | (3.69)% | (3.66)% |
| Class C (incl. contingent deferred sales charge) | (0.48)% | (3.40)% | (3.74)% |
| Gold Portfolio | 1.54% | (2.42)% | (2.77)% |
| Class I | 1.54% | (2.40)% | (2.73)% |
| Class Z | 1.60% | (2.39)% | (2.73)% |
Class C shares' contingent deferred sales charges included in the past one year, past five years and past ten years total return figures are 1%, 0% and 0%, respectively.
The initial offering of Class Z shares took place on October 2, 2018. Returns prior to October 2, 2018, are those of Class I.
$10,000 Over 10 Years
Let's say hypothetically that $10,000 was invested in Gold Portfolio, a class of the fund, on February 28, 2009.
The chart shows how the value of your investment would have changed, and also shows how the S&P 500® Index performed over the same period.
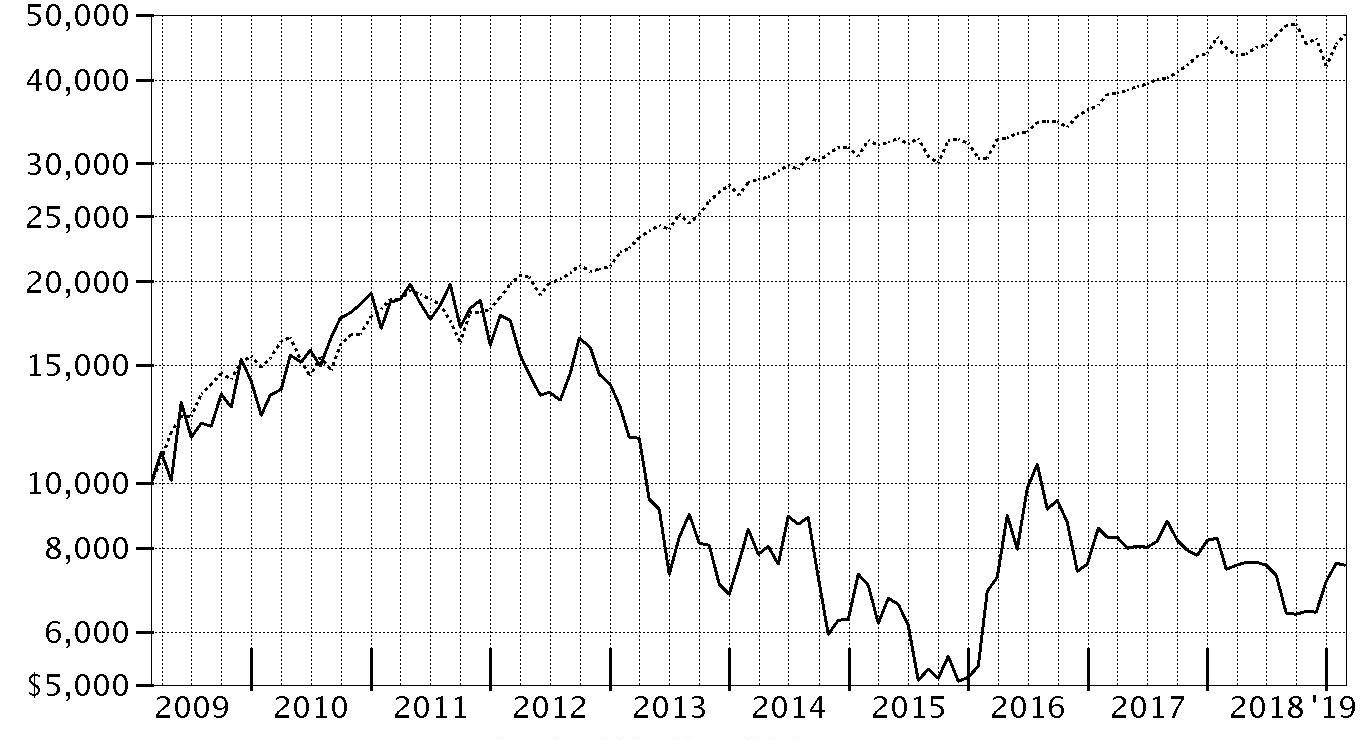
| Period Ending Values |
| $7,549 | Gold Portfolio |
| $46,739 | S&P 500® Index |
Gold Portfolio
Management's Discussion of Fund Performance
Market Recap: The S&P 500
® index gained 4.68% for the 12 months ending February 28, 2019, as the U.S. equity bellwether began the new year on a high note after enduring a final quarter of 2018 in which resurgent volatility upset the aging bull market. In October, rising U.S. Treasury yields and concern about peaking corporate earnings growth sent many investors fleeing from risk assets as they were still dealing with lingering uncertainty related to global trade and the U.S. Federal Reserve picking up the pace of interest rate hikes. The index returned -6.84% in October, at the time its largest monthly drop in seven years. But conditions worsened through Christmas, as jitters about the economy and another hike in rates led to a spike in market volatility and a -9.03% result for December. Sharply reversing course to begin 2019, the S&P 500
® gained 11.48% year-to-date, its strongest two-month opening since 1991, amid upbeat company earnings/outlooks and signs the Fed may pause on rates. For the full period, some economically sensitive sectors fared worst, with financials (-6%) and materials (-6%) both losing ground. Energy gained 1%, while communication services and industrials each rose roughly 2%. In contrast, the defensive utilities (+20%), real estate (+20%) and health care (+11%) sectors led the way, while consumer staples finished near the index. Information technology and consumer discretionary were rattled in the late-2018 downturn, but earlier strength contributed to advances of 9% and roughly 7%, respectively.
Comments from Portfolio Manager Steven Calhoun: For the fiscal year, the fund’s share classes (excluding sales charges, if applicable) gained roughly 1% to 2%, trailing the 6.51% advance of the S&P
® Global BMI Gold Capped 20/45 Linked Index, as well as the broad-based S&P 500
® index. The fund’s underperformance of the S&P gold index the past 12 months was due to weak security selection. Currency also proved to be a drag on fund performance. The biggest individual relative detractors were overweightings in Premier Gold Mines (-43%) and Continental Gold (-41%), followed by untimely ownership of Guyana Goldfields, which returned -71% for the fund until I eliminated the position. Positioning in Barrick Gold and Northern Star Resources also held back relative performance. Conversely, not owning index constituent Centamin (-37%), a precious metals exploration and development company, was the biggest individual contributor versus the index. An overweighting in Torex Gold Resources also added value, as our shares of the company gained about 55% this period. Lastly, the fund’s underweighted stake in Goldcorp contributed to our relative result.
The views expressed above reflect those of the portfolio manager(s) only through the end of the period as stated on the cover of this report and do not necessarily represent the views of Fidelity or any other person in the Fidelity organization. Any such views are subject to change at any time based upon market or other conditions and Fidelity disclaims any responsibility to update such views. These views may not be relied on as investment advice and, because investment decisions for a Fidelity fund are based on numerous factors, may not be relied on as an indication of trading intent on behalf of any Fidelity fund.
Note to shareholders: On September 24, 2018, Steven Calhoun became Co-Portfolio Manager of the fund, joining Joe Wickwire. The two managed the fund together until March 31, 2019, at which point Joe retired and Steven became sole Portfolio Manager.
Gold Portfolio
Consolidated Investment Summary (Unaudited)
The information in the following tables is based on the consolidated investments of the Fund.
Top Ten Holdings as of February 28, 2019
| (excluding repurchase agreements) | % of fund's net assets |
| Newmont Mining Corp. | 10.4 |
| Franco-Nevada Corp. | 8.4 |
| Newcrest Mining Ltd. | 7.1 |
| Barrick Gold Corp. | 6.2 |
| Agnico Eagle Mines Ltd. (Canada) | 6.1 |
| Barrick Gold Corp. (Canada) | 6.0 |
| Kirkland Lake Gold Ltd. | 5.1 |
| Royal Gold, Inc. | 4.7 |
| B2Gold Corp. | 4.2 |
| Goldcorp, Inc. | 4.1 |
| | 62.3 |
Top Industries (% of fund's net assets)
| As of February 28, 2019 |
| | Gold | 96.2% |
| | Silver | 1.7% |
| | Commodities & Related Investments* | 1.1% |
| | Precious Metals & Minerals | 0.5% |
| | All Others** | 0.5% |

* Includes gold bullion and/or silver bullion.
** Includes Short-Term investments and Net Other Assets (Liabilities).
Geographic Diversification (% of fund's net assets)
| As of February 28, 2019 |
| | Canada | 59.6% |
| | United States of America* | 16.7% |
| | Australia | 15.5% |
| | South Africa | 3.8% |
| | Peru | 2.8% |
| | Cayman Islands | 1.6% |

* Includes Short-Term investments and Net Other Assets (Liabilities).
Percentages are based on country or territory of incorporation and are adjusted for the effect of futures contracts, if applicable.
Gold Portfolio
Consolidated Schedule of Investments February 28, 2019
Showing Percentage of Net Assets
| Common Stocks - 98.4% | | | |
| | | Shares | Value |
| Australia - 15.5% | | | |
| Metals & Mining - 15.5% | | | |
| Gold - 15.5% | | | |
| Evolution Mining Ltd. | | 16,738,079 | $42,862,094 |
| Newcrest Mining Ltd. | | 5,191,370 | 89,558,359 |
| Northern Star Resources Ltd. | | 6,991,711 | 45,876,024 |
| Regis Resources Ltd. | | 4,470,527 | 16,934,039 |
| | | | 195,230,516 |
| Canada - 59.6% | | | |
| Metals & Mining - 59.6% | | | |
| Gold - 57.4% | | | |
| Agnico Eagle Mines Ltd. (Canada) | | 1,817,901 | 77,318,986 |
| Alamos Gold, Inc. | | 4,936,012 | 23,855,797 |
| Argonaut Gold, Inc. (a) | | 4,680,962 | 6,616,201 |
| B2Gold Corp. (a) | | 16,675,793 | 52,462,315 |
| Barrick Gold Corp. | | 6,193,426 | 78,284,905 |
| Barrick Gold Corp. (Canada) | | 5,997,469 | 75,654,839 |
| Continental Gold, Inc. (a) | | 5,560,257 | 9,718,144 |
| Detour Gold Corp. (a) | | 1,343,600 | 13,599,872 |
| Franco-Nevada Corp. | | 1,399,600 | 105,441,958 |
| Gold Standard Ventures Corp. (a) | | 3,200,700 | 3,745,642 |
| Goldcorp, Inc. | | 4,893,000 | 51,683,347 |
| Kirkland Lake Gold Ltd. | | 1,771,819 | 64,789,643 |
| Novagold Resources, Inc. (a) | | 1,827,300 | 7,248,380 |
| OceanaGold Corp. | | 8,905,732 | 28,694,330 |
| Osisko Gold Royalties Ltd. | | 1,315,293 | 14,742,636 |
| Premier Gold Mines Ltd. (a)(b) | | 14,800,022 | 20,806,293 |
| Pretium Resources, Inc. (a) | | 1,507,683 | 12,213,155 |
| Pretium Resources, Inc. (a)(c) | | 225,000 | 1,822,638 |
| Seabridge Gold, Inc. (a) | | 1,228,210 | 17,686,523 |
| SSR Mining, Inc. (a) | | 1,869,200 | 25,936,846 |
| Torex Gold Resources, Inc. (a) | | 2,505,000 | 30,304,799 |
| | | | 722,627,249 |
| Precious Metals & Minerals - 0.5% | | | |
| Osisko Mining, Inc. (a) | | 2,298,200 | 6,112,466 |
| Silver - 1.7% | | | |
| MAG Silver Corp. (a) | | 728,901 | 7,145,274 |
| Wheaton Precious Metals Corp. | | 647,400 | 14,080,009 |
| | | | 21,225,283 |
| TOTAL METALS & MINING | | | 749,964,998 |
| Cayman Islands - 1.6% | | | |
| Metals & Mining - 1.6% | | | |
| Gold - 1.6% | | | |
| Endeavour Mining Corp. (a) | | 1,355,640 | 20,613,516 |
| Peru - 2.8% | | | |
| Metals & Mining - 2.8% | | | |
| Gold - 2.8% | | | |
| Compania de Minas Buenaventura SA sponsored ADR | | 2,097,697 | 34,905,678 |
| South Africa - 3.8% | | | |
| Metals & Mining - 3.8% | | | |
| Gold - 3.8% | | | |
| AngloGold Ashanti Ltd. sponsored ADR | | 2,805,808 | 39,758,299 |
| Harmony Gold Mining Co. Ltd. (a) | | 4,056,200 | 8,547,816 |
| | | | 48,306,115 |
| United States of America - 15.1% | | | |
| Metals & Mining - 15.1% | | | |
| Gold - 15.1% | | | |
| Newmont Mining Corp. | | 3,838,178 | 130,958,631 |
| Royal Gold, Inc. | | 663,767 | 58,683,640 |
| | | | 189,642,271 |
| TOTAL COMMON STOCKS | | | |
| (Cost $1,051,701,337) | | | 1,238,663,094 |
| | | Troy Ounces | |
|
| Commodities - 1.1% | | | |
| Gold Bullion | | | |
| (Cost $10,517,140) | | 11,010 | 14,458,662 |
|
| Money Market Funds - 1.3% | | | |
| Fidelity Cash Central Fund, 2.44% (d) | | | |
| (Cost $15,827,399) | | 15,824,648 | 15,827,813 |
| TOTAL INVESTMENT IN SECURITIES - 100.8% | | | |
| (Cost $1,078,045,876) | | | 1,268,949,569 |
| NET OTHER ASSETS (LIABILITIES) - (0.8)% | | | (9,620,675) |
| NET ASSETS - 100% | | | $1,259,328,894 |
Legend
(a) Non-income producing
(b) Affiliated company
(c) Security exempt from registration under Rule 144A of the Securities Act of 1933. These securities may be resold in transactions exempt from registration, normally to qualified institutional buyers. At the end of the period, the value of these securities amounted to $1,822,638 or 0.1% of net assets.
(d) Affiliated fund that is generally available only to investment companies and other accounts managed by Fidelity Investments. The rate quoted is the annualized seven-day yield of the fund at period end. A complete unaudited listing of the fund's holdings as of its most recent quarter end is available upon request. In addition, each Fidelity Central Fund's financial statements, which are not covered by the Fund's Report of Independent Registered Public Accounting Firm, are available on the SEC's website or upon request.
Affiliated Central Funds
Information regarding fiscal year to date income earned by the Fund from investments in Fidelity Central Funds is as follows:
| Fund | Income earned |
| Fidelity Cash Central Fund | $247,653 |
| Fidelity Securities Lending Cash Central Fund | 807 |
| Total | $248,460 |
Amounts in the income column in the above table include any capital gain distributions from underlying funds, which are presented in the corresponding line-item in the Consolidated Statement of Operations, if applicable.
Consolidated Subsidiary
| Fund | Value, beginning of period | Purchases | Sales Proceeds | Dividend Income | Realized Gain/Loss | Change in unrealized appreciation (depreciation) | Value, end of period |
| Fidelity Select Gold Cayman Ltd. | $85,477,120 | $23,924,225 | $91,484,473 | $-- | $822,337 | $(4,309,971) | $14,429,238 |
Other Affiliated Issuers
An affiliated company is a company in which the Fund has ownership of at least 5% of the voting securities. Fiscal year to date transactions with companies which are or were affiliates are as follows:
| Affiliate | Value, beginning of period | Purchases | Sales Proceeds | Dividend Income | Realized Gain (loss) | Change in Unrealized appreciation (depreciation) | Value, end of period |
| Continental Gold, Inc. | $28,390,023 | $95,681 | $6,820,060 | $-- | $(14,118,785) | $2,171,285 | $-- |
| Premier Gold Mines Ltd. | 40,731,717 | 320,755 | 2,419,361 | -- | (7,274,690) | (10,552,128) | 20,806,293 |
| Total | $69,121,740 | $416,436 | $9,239,421 | $-- | $(21,393,475) | $(8,380,843) | $20,806,293 |
Investment Valuation
The following is a summary of the inputs used, as of February 28, 2019, involving the Fund's assets and liabilities carried at fair value. The inputs or methodology used for valuing securities may not be an indication of the risk associated with investing in those securities. For more information on valuation inputs, and their aggregation into the levels used below, please refer to the Investment Valuation section in the accompanying Notes to Consolidated Financial Statements.
| | Valuation Inputs at Reporting Date: |
| Description | Total | Level 1 | Level 2 | Level 3 |
| Investments in Securities: | | | | |
| Common Stocks | $1,238,663,094 | $1,230,115,278 | $8,547,816 | $-- |
| Commodities | 14,458,662 | 14,458,662 | -- | -- |
| Money Market Funds | 15,827,813 | 15,827,813 | -- | -- |
| Total Investments in Securities: | $1,268,949,569 | $1,260,401,753 | $8,547,816 | $-- |
See accompanying notes which are an integral part of the consolidated financial statements.
Gold Portfolio
Consolidated Financial Statements
Consolidated Statement of Assets and Liabilities
| | | February 28, 2019 |
| Assets | | |
Investment in securities, at value — See accompanying schedule:
Unaffiliated issuers (cost $1,015,971,402) | $1,217,856,801 | |
| Fidelity Central Funds (cost $15,827,399) | 15,827,813 | |
| Commodities (cost $10,517,140) | 14,458,662 | |
| Other affiliated issuers (cost $35,729,935) | 20,806,293 | |
| Total Investment in Securities (cost $1,078,045,876) | | $1,268,949,569 |
| Cash | | 8,664 |
| Foreign currency held at value (cost $630,961) | | 630,961 |
| Receivable for investments sold | | 4,069,906 |
| Receivable for fund shares sold | | 1,817,090 |
| Dividends receivable | | 1,056,962 |
| Distributions receivable from Fidelity Central Funds | | 24,202 |
| Prepaid expenses | | 10,478 |
| Other receivables | | 94,227 |
| Total assets | | 1,276,662,059 |
| Liabilities | | |
| Payable for investments purchased | $9,695,577 | |
| Payable for fund shares redeemed | 6,502,772 | |
| Accrued management fee | 571,275 | |
| Distribution and service plan fees payable | 77,439 | |
| Other affiliated payables | 266,902 | |
| Other payables and accrued expenses | 219,200 | |
| Total liabilities | | 17,333,165 |
| Net Assets | | $1,259,328,894 |
| Net Assets consist of: | | |
| Paid in capital | | $2,657,356,830 |
| Total distributable earnings (loss) | | (1,398,027,936) |
| Net Assets | | $1,259,328,894 |
| Net Asset Value and Maximum Offering Price | | |
| Class A: | | |
| Net Asset Value and redemption price per share ($50,478,694 ÷ 2,725,335 shares) | | $18.52 |
| Maximum offering price per share (100/94.25 of $18.52) | | $19.65 |
| Class M: | | |
| Net Asset Value and redemption price per share ($17,401,012 ÷ 960,840 shares) | | $18.11 |
| Maximum offering price per share (100/96.50 of $18.11) | | $18.77 |
| Class C: | | |
| Net Asset Value and offering price per share ($67,759,662 ÷ 3,930,189 shares)(a) | | $17.24 |
| Gold: | | |
| Net Asset Value, offering price and redemption price per share ($1,035,696,776 ÷ 54,313,462 shares) | | $19.07 |
| Class I: | | |
| Net Asset Value, offering price and redemption price per share ($84,956,170 ÷ 4,454,693 shares) | | $19.07 |
| Class Z: | | |
| Net Asset Value, offering price and redemption price per share ($3,036,580 ÷ 159,158 shares) | | $19.08 |
(a) Redemption price per share is equal to net asset value less any applicable contingent deferred sales charge.
See accompanying notes which are an integral part of the consolidated financial statements.
Consolidated Statement of Operations
| | | Year ended February 28, 2019 |
| Investment Income | | |
| Dividends | | $12,648,358 |
| Income from Fidelity Central Funds | | 248,460 |
| Income before foreign taxes withheld | | 12,896,818 |
| Less foreign taxes withheld | | (625,990) |
| Total income | | 12,270,828 |
| Expenses | | |
| Management fee | $6,592,158 | |
| Transfer agent fees | 2,661,262 | |
| Distribution and service plan fees | 1,062,748 | |
| Accounting and security lending fees | 546,595 | |
| Custodian fees and expenses | 260,812 | |
| Independent trustees' fees and expenses | 6,684 | |
| Registration fees | 129,596 | |
| Audit | 74,818 | |
| Legal | 7,473 | |
| Miscellaneous | 54,042 | |
| Total expenses before reductions | 11,396,188 | |
| Expense reductions | (197,765) | |
| Total expenses after reductions | | 11,198,423 |
| Net investment income (loss) | | 1,072,405 |
| Realized and Unrealized Gain (Loss) | | |
| Net realized gain (loss) on: | | |
| Investments: | | |
| Unaffiliated issuers | (194,751,098) | |
| Fidelity Central Funds | 172 | |
| Other affiliated issuers | (21,393,475) | |
| Commodities | (5,730,283) | |
| Foreign currency transactions | (119,489) | |
| Total net realized gain (loss) | | (221,994,173) |
| Change in net unrealized appreciation (depreciation) on: | | |
| Investments: | | |
| Investments | 245,479,824 | |
| Fidelity Central Funds | 410 | |
| Other affiliated issuers | (8,380,843) | |
| Assets and liabilities in foreign currencies | (32,065) | |
| Commodities | 2,574,543 | |
| Total change in net unrealized appreciation (depreciation) | | 239,641,869 |
| Net gain (loss) | | 17,647,696 |
| Net increase (decrease) in net assets resulting from operations | | $18,720,101 |
See accompanying notes which are an integral part of the consolidated financial statements.
Consolidated Statement of Changes in Net Assets
| | Year ended February 28, 2019 | Year ended February 28, 2018 |
| Increase (Decrease) in Net Assets�� | | |
| Operations | | |
| Net investment income (loss) | $1,072,405 | $(5,136,354) |
| Net realized gain (loss) | (221,994,173) | (19,797,959) |
| Change in net unrealized appreciation (depreciation) | 239,641,869 | (128,650,104) |
| Net increase (decrease) in net assets resulting from operations | 18,720,101 | (153,584,417) |
| Distributions to shareholders from net realized gain | – | (3,130,282) |
| Total distributions | – | (3,130,282) |
| Share transactions - net increase (decrease) | (6,262,689) | (136,518,156) |
| Total increase (decrease) in net assets | 12,457,412 | (293,232,855) |
| Net Assets | | |
| Beginning of period | 1,246,871,482 | 1,540,104,337 |
| End of period | $1,259,328,894 | $1,246,871,482 |
| Other Information | | |
| Accumulated net investment loss end of period | | $(6,965,927) |
See accompanying notes which are an integral part of the consolidated financial statements.
Consolidated Financial Highlights
Gold Portfolio Class A
| Years ended February 28, | 2019 | 2018 | 2017 | 2016A | 2015 |
| Selected Per–Share Data | | | | | |
| Net asset value, beginning of period | $18.30 | $20.54 | $17.70 | $18.11 | $22.01 |
| Income from Investment Operations | | | | | |
| Net investment income (loss)B | (.03) | (.12) | (.16) | (.06) | (.10) |
| Net realized and unrealized gain (loss) | .25 | (2.09) | 3.59 | (.35) | (3.80) |
| Total from investment operations | .22 | (2.21) | 3.43 | (.41) | (3.90) |
| Distributions from net realized gain | – | (.03) | (.60) | – | – |
| Total distributions | – | (.03) | (.60) | – | – |
| Redemption fees added to paid in capitalB | – | – | .01 | –C | –C |
| Net asset value, end of period | $18.52 | $18.30 | $20.54 | $17.70 | $18.11 |
| Total ReturnD,E | 1.20% | (10.77)% | 19.97% | (2.26)% | (17.72)% |
| Ratios to Average Net AssetsF,G | | | | | |
| Expenses before reductions | 1.19% | 1.18% | 1.19% | 1.23% | 1.23% |
| Expenses net of fee waivers, if any | 1.18% | 1.16% | 1.16% | 1.20% | 1.19% |
| Expenses net of all reductions | 1.18% | 1.16% | 1.16% | 1.20% | 1.19% |
| Net investment income (loss) | (.15)% | (.58)% | (.71)% | (.44)% | (.51)% |
| Supplemental Data | | | | | |
| Net assets, end of period (000 omitted) | $50,479 | $61,703 | $83,589 | $53,509 | $46,898 |
| Portfolio turnover rateH | 37% | 13% | 28% | 20% | 20% |
A For the year ended February 29.
B Calculated based on average shares outstanding during the period.
C Amount represents less than $.005 per share.
D Total returns would have been lower if certain expenses had not been reduced during the applicable periods shown.
E Total returns do not include the effect of the sales charges.
F Fees and expenses of any underlying Fidelity Central Funds are not included in the Fund's expense ratio. The Fund indirectly bears its proportionate share of the expenses of any underlying Fidelity Central Funds.
G Expense ratios reflect operating expenses of the class. Expenses before reductions do not reflect amounts reimbursed by the investment adviser or reductions from brokerage service arrangements or reductions from other expense offset arrangements and do not represent the amount paid by the class during periods when reimbursements or reductions occur. Expenses net of fee waivers reflect expenses after reimbursement by the investment adviser but prior to reductions from brokerage service arrangements or other expense offset arrangements. Expenses net of all reductions represent the net expenses paid by the class.
H Amount does not include the portfolio activity of any underlying Fidelity Central Funds.
See accompanying notes which are an integral part of the consolidated financial statements.
Gold Portfolio Class M
| Years ended February 28, | 2019 | 2018 | 2017 | 2016A | 2015 |
| Selected Per–Share Data | | | | | |
| Net asset value, beginning of period | $17.94 | $20.19 | $17.37 | $17.83 | $21.73 |
| Income from Investment Operations | | | | | |
| Net investment income (loss)B | (.07) | (.17) | (.22) | (.11) | (.15) |
| Net realized and unrealized gain (loss) | .24 | (2.05) | 3.54 | (.35) | (3.75) |
| Total from investment operations | .17 | (2.22) | 3.32 | (.46) | (3.90) |
| Distributions from net realized gain | – | (.03) | (.51) | – | – |
| Total distributions | – | (.03) | (.51) | – | – |
| Redemption fees added to paid in capitalB | – | – | .01 | –C | –C |
| Net asset value, end of period | $18.11 | $17.94 | $20.19 | $17.37 | $17.83 |
| Total ReturnD,E | .95% | (11.04)% | 19.62% | (2.58)% | (17.95)% |
| Ratios to Average Net AssetsF,G | | | | | |
| Expenses before reductions | 1.48% | 1.48% | 1.49% | 1.52% | 1.50% |
| Expenses net of fee waivers, if any | 1.46% | 1.47% | 1.46% | 1.48% | 1.46% |
| Expenses net of all reductions | 1.46% | 1.47% | 1.46% | 1.48% | 1.46% |
| Net investment income (loss) | (.43)% | (.88)% | (1.01)% | (.72)% | (.79)% |
| Supplemental Data | | | | | |
| Net assets, end of period (000 omitted) | $17,401 | $19,355 | $25,170 | $17,720 | $16,200 |
| Portfolio turnover rateH | 37% | 13% | 28% | 20% | 20% |
A For the year ended February 29.
B Calculated based on average shares outstanding during the period.
C Amount represents less than $.005 per share.
D Total returns would have been lower if certain expenses had not been reduced during the applicable periods shown.
E Total returns do not include the effect of the sales charges.
F Fees and expenses of any underlying Fidelity Central Funds are not included in the Fund's expense ratio. The Fund indirectly bears its proportionate share of the expenses of any underlying Fidelity Central Funds.
G Expense ratios reflect operating expenses of the class. Expenses before reductions do not reflect amounts reimbursed by the investment adviser or reductions from brokerage service arrangements or reductions from other expense offset arrangements and do not represent the amount paid by the class during periods when reimbursements or reductions occur. Expenses net of fee waivers reflect expenses after reimbursement by the investment adviser but prior to reductions from brokerage service arrangements or other expense offset arrangements. Expenses net of all reductions represent the net expenses paid by the class.
H Amount does not include the portfolio activity of any underlying Fidelity Central Funds.
See accompanying notes which are an integral part of the consolidated financial statements.
Gold Portfolio Class C
| Years ended February 28, | 2019 | 2018 | 2017 | 2016A | 2015 |
| Selected Per–Share Data | | | | | |
| Net asset value, beginning of period | $17.15 | $19.36 | $16.68 | $17.20 | $21.06 |
| Income from Investment Operations | | | | | |
| Net investment income (loss)B | (.13) | (.24) | (.29) | (.16) | (.23) |
| Net realized and unrealized gain (loss) | .22 | (1.95) | 3.42 | (.36) | (3.63) |
| Total from investment operations | .09 | (2.19) | 3.13 | (.52) | (3.86) |
| Distributions from net realized gain | – | (.02) | (.45) | – | – |
| Total distributions | – | (.02) | (.45) | – | – |
| Redemption fees added to paid in capitalB | – | – | –C | –C | –C |
| Net asset value, end of period | $17.24 | $17.15 | $19.36 | $16.68 | $17.20 |
| Total ReturnD,E | .52% | (11.35)% | 19.19% | (3.02)% | (18.33)% |
| Ratios to Average Net AssetsF,G | | | | | |
| Expenses before reductions | 1.84% | 1.85% | 1.88% | 1.97% | 1.96% |
| Expenses net of fee waivers, if any | 1.83% | 1.83% | 1.85% | 1.93% | 1.92% |
| Expenses net of all reductions | 1.83% | 1.83% | 1.84% | 1.93% | 1.92% |
| Net investment income (loss) | (.80)% | (1.25)% | (1.40)% | (1.17)% | (1.25)% |
| Supplemental Data | | | | | |
| Net assets, end of period (000 omitted) | $67,760 | $92,724 | $101,215 | $52,732 | $39,429 |
| Portfolio turnover rateH | 37% | 13% | 28% | 20% | 20% |
A For the year ended February 29.
B Calculated based on average shares outstanding during the period.
C Amount represents less than $.005 per share.
D Total returns would have been lower if certain expenses had not been reduced during the applicable periods shown.
E Total returns do not include the effect of the contingent deferred sales charge.
F Fees and expenses of any underlying Fidelity Central Funds are not included in the Fund's expense ratio. The Fund indirectly bears its proportionate share of the expenses of any underlying Fidelity Central Funds.
G Expense ratios reflect operating expenses of the class. Expenses before reductions do not reflect amounts reimbursed by the investment adviser or reductions from brokerage service arrangements or reductions from other expense offset arrangements and do not represent the amount paid by the class during periods when reimbursements or reductions occur. Expenses net of fee waivers reflect expenses after reimbursement by the investment adviser but prior to reductions from brokerage service arrangements or other expense offset arrangements. Expenses net of all reductions represent the net expenses paid by the class.
H Amount does not include the portfolio activity of any underlying Fidelity Central Funds.
See accompanying notes which are an integral part of the consolidated financial statements.
Gold Portfolio
| Years ended February 28, | 2019 | 2018 | 2017 | 2016 A | 2015 |
| Selected Per–Share Data | | | | | |
| Net asset value, beginning of period | $18.78 | $21.02 | $18.12 | $18.50 | $22.41 |
| Income from Investment Operations | | | | | |
| Net investment income (loss)B | .03 | (.05) | (.09) | (.03) | (.04) |
| Net realized and unrealized gain (loss) | .26 | (2.14) | 3.66 | (.35) | (3.87) |
| Total from investment operations | .29 | (2.19) | 3.57 | (.38) | (3.91) |
| Distributions from net realized gain | – | (.05) | (.68) | – | – |
| Total distributions | – | (.05) | (.68) | – | – |
| Redemption fees added to paid in capitalB | – | – | .01 | –C | –C |
| Net asset value, end of period | $19.07 | $18.78 | $21.02 | $18.12 | $18.50 |
| Total ReturnD | 1.54% | (10.47)% | 20.38% | (2.05)% | (17.45)% |
| Ratios to Average Net AssetsE,F | | | | | |
| Expenses before reductions | .86% | .86% | .87% | .97% | .94% |
| Expenses net of fee waivers, if any | .85% | .85% | .84% | .93% | .90% |
| Expenses net of all reductions | .85% | .84% | .84% | .93% | .90% |
| Net investment income (loss) | .18% | (.26)% | (.39)% | (.17)% | (.22)% |
| Supplemental Data | | | | | |
| Net assets, end of period (000 omitted) | $1,035,697 | $1,011,412 | $1,271,458 | $1,076,206 | $992,944 |
| Portfolio turnover rateG | 37% | 13% | 28% | 20% | 20% |
A For the year ended February 29.
B Calculated based on average shares outstanding during the period.
C Amount represents less than $.005 per share.
D Total returns would have been lower if certain expenses had not been reduced during the applicable periods shown.
E Fees and expenses of any underlying Fidelity Central Funds are not included in the Fund's expense ratio. The Fund indirectly bears its proportionate share of the expenses of any underlying Fidelity Central Funds.
F Expense ratios reflect operating expenses of the class. Expenses before reductions do not reflect amounts reimbursed by the investment adviser or reductions from brokerage service arrangements or reductions from other expense offset arrangements and do not represent the amount paid by the class during periods when reimbursements or reductions occur. Expenses net of fee waivers reflect expenses after reimbursement by the investment adviser but prior to reductions from brokerage service arrangements or other expense offset arrangements. Expenses net of all reductions represent the net expenses paid by the class.
G Amount does not include the portfolio activity of any underlying Fidelity Central Funds.
See accompanying notes which are an integral part of the consolidated financial statements.
Gold Portfolio Class I
| Years ended February 28, | 2019 | 2018 | 2017 | 2016A | 2015 |
| Selected Per–Share Data | | | | | |
| Net asset value, beginning of period | $18.78 | $21.02 | $18.13 | $18.50 | $22.41 |
| Income from Investment Operations | | | | | |
| Net investment income (loss)B | .04 | (.05) | (.09) | (.02) | (.04) |
| Net realized and unrealized gain (loss) | .25 | (2.14) | 3.67 | (.35) | (3.87) |
| Total from investment operations | .29 | (2.19) | 3.58 | (.37) | (3.91) |
| Distributions from net realized gain | – | (.05) | (.70) | – | – |
| Total distributions | – | (.05) | (.70) | – | – |
| Redemption fees added to paid in capitalB | – | – | .01 | –C | –C |
| Net asset value, end of period | $19.07 | $18.78 | $21.02 | $18.13 | $18.50 |
| Total ReturnD | 1.54% | (10.47)% | 20.41% | (2.00)% | (17.45)% |
| Ratios to Average Net AssetsE,F | | | | | |
| Expenses before reductions | .84% | .85% | .87% | .92% | .90% |
| Expenses net of fee waivers, if any | .82% | .83% | .84% | .88% | .86% |
| Expenses net of all reductions | .82% | .83% | .84% | .88% | .86% |
| Net investment income (loss) | .21% | (.24)% | (.39)% | (.12)% | (.18)% |
| Supplemental Data | | | | | |
| Net assets, end of period (000 omitted) | $84,956 | $61,677 | $58,673 | $52,607 | $23,667 |
| Portfolio turnover rateG | 37% | 13% | 28% | 20% | 20% |
A For the year ended February 29.
B Calculated based on average shares outstanding during the period.
C Amount represents less than $.005 per share.
D Total returns would have been lower if certain expenses had not been reduced during the applicable periods shown.
E Fees and expenses of any underlying Fidelity Central Funds are not included in the Fund's expense ratio. The Fund indirectly bears its proportionate share of the expenses of any underlying Fidelity Central Funds.
F Expense ratios reflect operating expenses of the class. Expenses before reductions do not reflect amounts reimbursed by the investment adviser or reductions from brokerage service arrangements or reductions from other expense offset arrangements and do not represent the amount paid by the class during periods when reimbursements or reductions occur. Expenses net of fee waivers reflect expenses after reimbursement by the investment adviser but prior to reductions from brokerage service arrangements or other expense offset arrangements. Expenses net of all reductions represent the net expenses paid by the class.
G Amount does not include the portfolio activity of any underlying Fidelity Central Funds.
See accompanying notes which are an integral part of the consolidated financial statements.
Gold Portfolio Class Z
| Years ended February 28, | 2019 A |
| Selected Per–Share Data | |
| Net asset value, beginning of period | $16.62 |
| Income from Investment Operations | |
| Net investment income (loss)B | .07 |
| Net realized and unrealized gain (loss) | 2.39 |
| Total from investment operations | 2.46 |
| Redemption fees added to paid in capitalB | – |
| Net asset value, end of period | $19.08 |
| Total ReturnC,D | 14.80% |
| Ratios to Average Net AssetsE,F | |
| Expenses before reductions | .68%G |
| Expenses net of fee waivers, if any | .68%G |
| Expenses net of all reductions | .67%G |
| Net investment income (loss) | .97%G |
| Supplemental Data | |
| Net assets, end of period (000 omitted) | $3,037 |
| Portfolio turnover rateH | 37% |
A For the period October 2, 2018 (commencement of sale of shares) to February 28, 2019.
B Calculated based on average shares outstanding during the period.
C Total returns for periods of less than one year are not annualized.
D Total returns would have been lower if certain expenses had not been reduced during the applicable periods shown.
E Fees and expenses of any underlying Fidelity Central Funds are not included in the Fund's expense ratio. The Fund indirectly bears its proportionate share of the expenses of any underlying Fidelity Central Funds.
F Expense ratios reflect operating expenses of the class. Expenses before reductions do not reflect amounts reimbursed by the investment adviser or reductions from brokerage service arrangements or reductions from other expense offset arrangements and do not represent the amount paid by the class during periods when reimbursements or reductions occur. Expense ratios before reductions for start-up periods may not be representative of longer-term operating periods. Expenses net of fee waivers reflect expenses after reimbursement by the investment adviser but prior to reductions from brokerage service arrangements or other expense offset arrangements. Expenses net of all reductions represent the net expenses paid by the class.
G Annualized
H Amount does not include the portfolio activity of any underlying Fidelity Central Funds.
See accompanying notes which are an integral part of the consolidated financial statements.
Notes to Consolidated Financial Statements
For the period ended February 28, 2019
1. Organization.
Gold Portfolio (the Fund) is a non-diversified fund of Fidelity Select Portfolios (the Trust) and is authorized to issue an unlimited number of shares. The Trust is registered under the Investment Company Act of 1940, as amended (the 1940 Act), as an open-end management investment company organized as a Massachusetts business trust. The Fund invests primarily in securities of companies whose principal business activities fall within specific industries. The Fund commenced sale of Class Z shares on October 2, 2018. The Fund offers Class A, Class M, Class C, Gold, Class I and Class Z shares, each of which has equal rights as to assets and voting privileges. Each class has exclusive voting rights with respect to matters that affect that class.
Effective March 1, 2019, Class C shares will automatically convert to Class A shares after a holding period of ten years from the initial date of purchase, with certain exceptions.
2. Consolidated Subsidiary.
The Fund invests in certain commodity-related investments through Fidelity Select Gold Cayman Ltd., a wholly owned subsidiary (the "Subsidiary"). As of period end, the Fund held an investment of $14,429,238 in the Subsidiary, representing 1.1% of the Fund's net assets.
The financial statements have been consolidated and include accounts of the Fund and the Subsidiary. Accordingly, all inter-company transactions and balances have been eliminated.
3. Investments in Fidelity Central Funds.
The Fund invests in Fidelity Central Funds, which are open-end investment companies generally available only to other investment companies and accounts managed by the investment adviser and its affiliates. The Fund's Consolidated Schedule of Investments lists each of the Fidelity Central Funds held as of period end, if any, as an investment of the Fund, but does not include the underlying holdings of each Fidelity Central Fund. As an Investing Fund, the Fund indirectly bears its proportionate share of the expenses of the underlying Fidelity Central Funds.
The Money Market Central Funds seek preservation of capital and current income and are managed by Fidelity Investments Money Management, Inc. (FIMM), an affiliate of the investment adviser. Annualized expenses of the Money Market Central Funds as of their most recent shareholder report date are less than .005%.
A complete unaudited list of holdings for each Fidelity Central Fund is available upon request or at the Securities and Exchange Commission (the SEC) website at www.sec.gov. In addition, the financial statements of the Fidelity Central Funds, which are not covered by the Fund's Report of Independent Registered Public Accounting Firm, are available on the SEC website or upon request.
4. Significant Accounting Policies.
The Fund is an investment company and applies the accounting and reporting guidance of the Financial Accounting Standards Board (FASB) Accounting Standards Codification Topic 946 Financial Services – Investments Companies. The consolidated financial statements have been prepared in conformity with accounting principles generally accepted in the United States of America (GAAP), which require management to make certain estimates and assumptions at the date of the consolidated financial statements. Actual results could differ from those estimates. Subsequent events, if any, through the date that the consolidated financial statements were issued have been evaluated in the preparation of the consolidated financial statements. The following summarizes the significant accounting policies of the Fund:
Investment Valuation. Investments are valued as of 4:00 p.m. Eastern time on the last calendar day of the period. The Board of Trustees (the Board) has delegated the day to day responsibility for the valuation of the Fund's investments to the Fair Value Committee (the Committee) established by the Fund's investment adviser. In accordance with valuation policies and procedures approved by the Board, the Fund attempts to obtain prices from one or more third party pricing vendors or brokers to value its investments. When current market prices, quotations or currency exchange rates are not readily available or reliable, investments will be fair valued in good faith by the Committee, in accordance with procedures adopted by the Board. Factors used in determining fair value vary by investment type and may include market or investment specific events. The frequency with which these procedures are used cannot be predicted and they may be utilized to a significant extent. The Committee oversees the Fund's valuation policies and procedures and reports to the Board on the Committee's activities and fair value determinations. The Board monitors the appropriateness of the procedures used in valuing the Fund's investments and ratifies the fair value determinations of the Committee.
The Fund categorizes the inputs to valuation techniques used to value its investments into a disclosure hierarchy consisting of three levels as shown below:
- Level 1 – quoted prices in active markets for identical investments
- Level 2 – other significant observable inputs (including quoted prices for similar investments, interest rates, prepayment speeds, etc.)
- Level 3 – unobservable inputs (including the Fund's own assumptions based on the best information available)
Valuation techniques used to value the Fund's investments by major category are as follows:
Equity securities, including restricted securities, for which market quotations are readily available, are valued at the last reported sale price or official closing price as reported by a third party pricing vendor on the primary market or exchange on which they are traded and are categorized as Level 1 in the hierarchy. In the event there were no sales during the day or closing prices are not available, securities are valued at the last quoted bid price or may be valued using the last available price and are generally categorized as Level 2 in the hierarchy. For foreign equity securities, when market or security specific events arise, comparisons to the valuation of American Depositary Receipts (ADRs), futures contracts, Exchange-Traded Funds (ETFs) and certain indexes as well as quoted prices for similar securities may be used and would be categorized as Level 2 in the hierarchy. For equity securities, including restricted securities, where observable inputs are limited, assumptions about market activity and risk are used and these securities may be categorized as Level 3 in the hierarchy.
Investments in commodities are valued at their last traded price at 4:00 p.m. Eastern time each business day and are categorized as Level 1 in the hierarchy. Investments in open-end mutual funds, including the Fidelity Central Funds, are valued at their closing net asset value (NAV) each business day and are categorized as Level 1 in the hierarchy.
Changes in valuation techniques may result in transfers in or out of an assigned level within the disclosure hierarchy. The aggregate value of investments by input level as of February 28, 2019 is included at the end of the Fund's Consolidated Schedule of Investments.
Foreign Currency. The Fund may use foreign currency contracts to facilitate transactions in foreign-denominated securities. Gains and losses from these transactions may arise from changes in the value of the foreign currency or if the counterparties do not perform under the contracts' terms.
Foreign-denominated assets, including investment securities, and liabilities are translated into U.S. dollars at the exchange rates at period end. Purchases and sales of investment securities, income and dividends received and expenses denominated in foreign currencies are translated into U.S. dollars at the exchange rate in effect on the transaction date.
The effects of exchange rate fluctuations on investments are included with the net realized and unrealized gain (loss) on investment securities. Other foreign currency transactions resulting in realized and unrealized gain (loss) are disclosed separately.
Investment Transactions and Income. For financial reporting purposes, the Fund's investment holdings and NAV include trades executed through the end of the last business day of the period. The NAV per share for processing shareholder transactions is calculated as of the close of business of the New York Stock Exchange (NYSE), normally 4:00 p.m. Eastern time and includes trades executed through the end of the prior business day. Gains and losses on securities sold are determined on the basis of identified cost and include proceeds received from litigation. Dividend income is recorded on the ex-dividend date, except for certain dividends from foreign securities where the ex-dividend date may have passed, which are recorded as soon as the Fund is informed of the ex-dividend date. Non-cash dividends included in dividend income, if any, are recorded at the fair market value of the securities received. Income and capital gain distributions from Fidelity Central Funds, if any, are recorded on the ex-dividend date. Certain distributions received by the Fund represent a return of capital or capital gain. The Fund determines the components of these distributions subsequent to the ex-dividend date, based upon receipt of tax filings or other correspondence relating to the underlying investment. These distributions are recorded as a reduction of cost of investments and/or as a realized gain. Investment income is recorded net of foreign taxes withheld where recovery of such taxes is uncertain.
Class Allocations and Expenses. Investment income, realized and unrealized capital gains and losses, common expenses of the Fund, and certain fund-level expense reductions, if any, are allocated daily on a pro-rata basis to each class based on the relative net assets of each class to the total net assets of the Fund. Each class differs with respect to transfer agent and distribution and service plan fees incurred. Certain expense reductions may also differ by class. For the reporting period, the allocated portion of income and expenses to each class as a percent of its average net assets may vary due to the timing of recording these transactions in relation to fluctuating net assets of the classes. Expenses directly attributable to a fund are charged to that fund. Expenses attributable to more than one fund are allocated among the respective funds on the basis of relative net assets or other appropriate methods. Expense estimates are accrued in the period to which they relate and adjustments are made when actual amounts are known.
Deferred Trustee Compensation. Under a Deferred Compensation Plan (the Plan) for the Fund, certain independent Trustees have elected to defer receipt of a portion of their annual compensation. Deferred amounts are invested in a cross-section of Fidelity funds, are marked-to-market and remain in the Fund until distributed in accordance with the Plan. The investment of deferred amounts and the offsetting payable to the Trustees of $94,227 are included in the accompanying Statement of Assets and Liabilities in other receivables and other payables and accrued expenses, respectively.
Income Tax Information and Distributions to Shareholders. Each year, the Fund intends to qualify as a regulated investment company under Subchapter M of the Internal Revenue Code, including distributing substantially all of its taxable income and realized gains. As a result, no provision for U.S. Federal income taxes is required. As of February 28, 2019, the Fund did not have any unrecognized tax benefits in the consolidated financial statements; nor is the Fund aware of any tax positions for which it is reasonably possible that the total amounts of unrecognized tax benefits will significantly change in the next twelve months. The Fund files a U.S. federal tax return, in addition to state and local tax returns as required. The Fund's federal income tax returns are subject to examination by the Internal Revenue Service (IRS) for a period of three fiscal years after they are filed. State and local tax returns may be subject to examination for an additional fiscal year depending on the jurisdiction. Foreign taxes are provided for based on the Fund's understanding of the tax rules and rates that exist in the foreign markets in which it invests.
The Subsidiary is classified as a controlled foreign corporation under Subchapter N of the Internal Revenue Code. Therefore, the Fund is required to increase its taxable income by its share of the Subsidiary's income. Net investment losses of the Subsidiary cannot be deducted by the Fund in the current period nor carried forward to offset taxable income in future periods.
Distributions are declared and recorded on the ex-dividend date. Income and capital gain distributions are declared separately for each class. Income and capital gain distributions are determined in accordance with income tax regulations, which may differ from GAAP.
Capital accounts within the consolidated financial statements are adjusted for permanent book-tax differences. These adjustments have no impact on net assets or the results of operations. Capital accounts are not adjusted for temporary book-tax differences which will reverse in a subsequent period.
Book-tax differences are primarily due to foreign currency transactions, passive foreign investment companies (PFIC), controlled foreign corporations, deferred trustees compensation, net operating losses, capital loss carryforwards and losses deferred due to wash sales and excise tax regulations.
As of period end, the cost and unrealized appreciation (depreciation) in securities, and derivatives if applicable, for federal income tax purposes on an unconsolidated basis were as follows:
| Gross unrealized appreciation | $247,846,536 |
| Gross unrealized depreciation | (182,161,467) |
| Net unrealized appreciation (depreciation) | $65,685,069 |
| Tax Cost | $1,203,235,076 |
The tax-based components of distributable earnings as of period end were as follows:
| Capital loss carryforward | $(1,511,346,534) |
| Net unrealized appreciation (depreciation) on securities and other investments | $65,651,980 |
Capital loss carryforwards are only available to offset future capital gains of the Fund to the extent provided by regulations and may be limited. Under the Regulated Investment Company Modernization Act of 2010 (the Act), the Fund is permitted to carry forward capital losses incurred in taxable years beginning after December 22, 2010 for an unlimited period and such capital losses are required to be used prior to any losses that expire. The capital loss carryforward information presented below, including any applicable limitation, is estimated as of fiscal period end and is subject to adjustment.
| No expiration | |
| Short-term | $(147,410,277) |
| Long-term | (1,363,936,257) |
| Total capital loss carryforward | $(1,511,346,534) |
The tax character of distributions paid was as follows:
| | February 28, 2019 | February 28, 2018 |
| Ordinary Income | $– | $ 3,130,282 |
| Total | $ - | $ 3,130,282 |
Restricted Securities. The Fund may invest in securities that are subject to legal or contractual restrictions on resale. These securities generally may be resold in transactions exempt from registration or to the public if the securities are registered. Disposal of these securities may involve time-consuming negotiations and expense, and prompt sale at an acceptable price may be difficult. Information regarding restricted securities is included at the end of the Fund's Consolidated Schedule of Investments.
New Rule Issuance. During August 2018, the U.S. Securities and Exchange Commission issued Final Rule Release No. 33-10532, Disclosure Update and Simplification. This Final Rule includes amendments specific to registered investment companies that are intended to eliminate overlap in disclosure requirements between Regulation S-X and GAAP. In accordance with these amendments, certain line-items in the Fund's consolidated financial statements have been combined or removed for the current period as outlined in the table below.
| Financial Statement | Current Line-Item Presentation (As Applicable) | Prior Line-Item Presentation (As Applicable) |
| Statement of Assets and Liabilities | Total distributable earnings (loss) | Undistributed/Distributions in excess of/Accumulated net investment income (loss)
Accumulated/Undistributed net realized gain (loss)
Net unrealized appreciation (depreciation) |
| Statement of Changes in Net Assets | N/A - removed | Undistributed/Distributions in excess of/Accumulated net investment income (loss) end of period |
| Statement of Changes in Net Assets | Distributions to shareholders | Distributions to shareholders from net investment income
Distributions to shareholders from net realized gain |
| Distributions to Shareholders Note to Financial Statements | Distributions to shareholders | Distributions to shareholders from net investment income
Distributions to shareholders from net realized gain |
5. Purchases and Sales of Investments.
Purchases and sales of securities, other than short-term securities, aggregated $437,274,815 and $439,818,154, respectively.
6. Fees and Other Transactions with Affiliates.
Management Fee. Fidelity SelectCo, LLC (the investment adviser) and its affiliates provide the Fund with investment management related services for which the Fund pays a monthly management fee. The management fee is the sum of an individual fund fee rate that is based on an annual rate of .30% of the Fund's average net assets and an annualized group fee rate that averaged .24% during the period. The group fee rate is based upon the average net assets of all the mutual funds advised by Fidelity Management & Research Company (FMR) and the investment adviser. The group fee rate decreases as assets under management increase and increases as assets under management decrease.
FMR, either through itself or through an affiliate provides investment management related services to the Subsidiary for which, during the period March 1, 2018 through September 30, 2018, the Subsidiary paid a monthly management fee at the annual rate of .30% of its net assets. Effective October 1, 2018, the Subsidiary no longer paid a monthly management fee. Under the management contract with the subsidiary, FMR pays all other expenses of the Subsidiary, except custodian fees.
For the reporting period, the total consolidated annual management fee rate which includes the management fee of the Fund and the Subsidiary was .55% of the Fund's average net assets.
During the period, the investment adviser waived a portion of the Fund's management fee representing the amount of the management fee paid by the Subsidiary to FMR as described in the Expense Reductions note.
Distribution and Service Plan Fees. In accordance with Rule 12b-1 of the 1940 Act, the Fund has adopted separate Distribution and Service Plans for each class of shares. Certain classes pay Fidelity Distributors Corporation (FDC), an affiliate of the investment adviser, separate Distribution and Service Fees, each of which is based on an annual percentage of each class' average net assets. In addition, FDC may pay financial intermediaries for selling shares of the Fund and providing shareholder support services. For the period, the Distribution and Service Fee rates, total fees and amounts retained by FDC were as follows:
| | Distribution Fee | Service Fee | Total Fees | Retained by FDC |
| Class A | -% | .25% | $124,913 | $– |
| Class M | .25% | .25% | 83,612 | – |
| Class C | .75% | .25% | 854,223 | 117,308 |
| | | | $1,062,748 | $117,308 |
Sales Load. FDC may receive a front-end sales charge of up to 5.75% for selling Class A shares and 3.50% for selling Class M shares, some of which is paid to financial intermediaries for selling shares of the Fund. Depending on the holding period, FDC may receive contingent deferred sales charges levied on Class A, Class M and Class C redemptions. The deferred sales charges are 1.00% for Class C shares, 1.00% for certain purchases of Class A shares and .25% for certain purchases of Class M shares.
For the period, sales charge amounts retained by FDC were as follows:
| | Retained by FDC |
| Class A | $14,500 |
| Class M | 4,575 |
| Class C(a) | 8,597 |
| | $27,672 |
(a) When Class C shares are initially sold, FDC pays commissions from its own resources to financial intermediaries through which the sales are made.
Transfer Agent Fees. Fidelity Investments Institutional Operations Company, Inc., (FIIOC), an affiliate of the investment adviser, is the transfer, dividend disbursing and shareholder servicing agent for each class of the Fund. FIIOC receives account fees and asset-based fees that vary according to the account size and type of account of the shareholders of the respective classes of the Fund, except for Class Z. FIIOC receives an asset-based fee of Class Z's average net assets. FIIOC pays for typesetting, printing and mailing of shareholder reports, except proxy statements.
For the period, transfer agent fees for each class were as follows:
| | Amount | % of Class-Level Average Net Assets |
| Class A | $150,583 | .30 |
| Class M | 56,184 | .34 |
| Class C | 174,224 | .20 |
| Gold | 2,160,628 | .22 |
| Class I | 119,146 | .20 |
| Class Z | 497 | .05(a) |
| | $2,661,262 | |
(a) Annualized
Accounting and Security Lending Fees. Fidelity Service Company, Inc. (FSC), an affiliate of the investment adviser, maintains the Fund's accounting records. The accounting fee is based on the level of average net assets for each month. Under a separate contract, FSC administers the security lending program. The security lending fee is based on the number and duration of lending transactions. For the period, the fees were equivalent to an annual rate of .05%.
Brokerage Commissions. The Fund placed a portion of its portfolio transactions with brokerage firms which are affiliates of the investment adviser. Brokerage commissions are included in net realized gain (loss) and change in net unrealized appreciation (depreciation) in the Consolidated Statement of Operations. The commissions paid to these affiliated firms were $6,844 for the period.
Interfund Trades. The Fund may purchase from or sell securities to other Fidelity Funds under procedures adopted by the Board. The procedures have been designed to ensure these interfund trades are executed in accordance with Rule 17a-7 of the 1940 Act. Interfund trades are included within the respective purchases and sales amounts shown in the Purchases and Sales of Investments note.
7. Committed Line of Credit.
The Fund participates with other funds managed by the investment adviser or an affiliate in a $4.25 billion credit facility (the "line of credit") to be utilized for temporary or emergency purposes to fund shareholder redemptions or for other short-term liquidity purposes. The Fund has agreed to pay commitment fees on its pro-rata portion of the line of credit, which amounted to $3,339 and is reflected in Miscellaneous expenses on the Consolidated Statement of Operations. During the period, the Fund did not borrow on this line of credit.
8. Security Lending.
The Fund lends portfolio securities through a lending agent from time to time in order to earn additional income. On the settlement date of the loan, the Fund receives collateral (in the form of U.S. Treasury obligations, letters of credit and/or cash) against the loaned securities and maintains collateral in an amount not less than 100% of the market value of the loaned securities during the period of the loan. The market value of the loaned securities is determined at the close of business of the Fund and any additional required collateral is delivered to the Fund on the next business day. The Fund or borrower may terminate the loan at any time, and if the borrower defaults on its obligation to return the securities loaned because of insolvency or other reasons, the Fund may apply collateral received from the borrower against the obligation. The Fund may experience delays and costs in recovering the securities loaned. Any cash collateral received is invested in the Fidelity Securities Lending Cash Central Fund. At period end, there were no security loans outstanding. Security lending income represents the income earned on investing cash collateral, less rebates paid to borrowers and any lending agent fees associated with the loan, plus any premium payments received for lending certain types of securities. Security lending income is presented in the Consolidated Statement of Operations as a component of income from Fidelity Central Funds. Total security lending income during the period amounted to $807.
9. Expense Reductions.
For the period March 1, 2018 through September 30, 2018, the investment adviser has contractually agreed to waive the Fund's management fee in an amount equal to the management fee paid by the Subsidiary to FMR. During the period, this waiver reduced the Fund's management fee by $152,805. Effective October 1, 2018, this waiver was discontinued.
Commissions paid to certain brokers with whom the investment adviser, or its affiliates, places trades on behalf of the Fund include an amount in addition to trade execution, which may be rebated back to the Fund to offset certain expenses. This amount totaled $17,287 for the period. In addition, through arrangements with the Fund's custodian, credits realized as a result of certain uninvested cash balances were used to reduce the Fund's expenses. During the period, these credits reduced the Fund's custody expenses by $1,047.
In addition, during the period the investment adviser reimbursed and/or waived a portion of fund-level operating expenses in the amount of $10,609 and a portion of class-level operating expenses as follows:
| | Amount |
| Class A | $644 |
| Class M | 222 |
| Class C | 868 |
| Gold | 13,158 |
| Class I | 1,086 |
| Class Z | 39 |
| | $16,017 |
10. Distributions to Shareholders.
Distributions to shareholders of each class were as follows:
| | Year ended
February 28, 2019(a) | Year ended
February 28, 2018 |
| From net realized gain | | |
| Class A | $– | $127,654 |
| Class M | – | 32,220 |
| Class C | – | 80,827 |
| Gold | – | 2,740,284 |
| Class I | – | 149,297 |
| Class Z | – | – |
| Total | $– | $3,130,282 |
(a) Distributions for Class Z are for the period October 2, 2018 (commencement of sale of shares) to February 28, 2019.
11. Share Transactions.
Share transactions for each class were as follows and may contain automatic conversions between classes or exchanges between affiliated funds:
| | Shares | Shares | Dollars | Dollars |
| | Year ended February 28, 2019 (a) | Year ended February 28, 2018 | Year ended February 28, 2019 (a) | Year ended February 28, 2018 |
| Class A | | | | |
| Shares sold | 562,437 | 960,171 | $9,909,468 | $19,302,127 |
| Reinvestment of distributions | – | 5,732 | – | 125,534 |
| Shares redeemed | (1,208,833) | (1,663,786) | (21,611,552) | (33,274,700) |
| Net increase (decrease) | (646,396) | (697,883) | $(11,702,084) | $(13,847,039) |
| Class M | | | | |
| Shares sold | 229,723 | 233,072 | $3,924,126 | $4,622,741 |
| Reinvestment of distributions | – | 1,488 | – | 32,029 |
| Shares redeemed | (347,502) | (402,307) | (6,015,227) | (7,900,562) |
| Net increase (decrease) | (117,779) | (167,747) | $(2,091,101) | $(3,245,792) |
| Class C | | | | |
| Shares sold | 752,482 | 1,214,001 | $12,855,428 | $22,977,515 |
| Reinvestment of distributions | – | 3,724 | – | 76,868 |
| Shares redeemed | (2,230,268) | (1,038,456) | (35,991,400) | (19,487,828) |
| Net increase (decrease) | (1,477,786) | 179,269 | $(23,135,972) | $3,566,555 |
| Gold | | | | |
| Shares sold | 18,855,174 | 17,998,314 | $336,678,749 | $372,447,330 |
| Reinvestment of distributions | – | 117,013 | – | 2,622,272 |
| Shares redeemed | (18,402,999) | (24,743,063) | (329,426,640) | (508,056,164) |
| Net increase (decrease) | 452,175 | (6,627,736) | $7,252,109 | $(132,986,562) |
| Class I | | | | |
| Shares sold | 2,830,267 | 1,883,552 | $50,462,127 | $38,579,606 |
| Reinvestment of distributions | – | 6,152 | – | 137,796 |
| Shares redeemed | (1,660,500) | (1,396,712) | (29,601,141) | (28,722,720) |
| Net increase (decrease) | 1,169,767 | 492,992 | $20,860,986 | $9,994,682 |
| Class Z | | | | |
| Shares sold | 368,708 | – | $6,495,798 | $– |
| Shares redeemed | (209,550) | – | (3,942,425) | – |
| Net increase (decrease) | 159,158 | – | $2,553,373 | $– |
(a) Share transactions for Class Z are for the period October 2, 2018 (commencement of sale of shares) to February 28, 2019.
12. Other.
The Fund's organizational documents provide former and current trustees and officers with a limited indemnification against liabilities arising in connection with the performance of their duties to the Fund. In the normal course of business, the Fund may also enter into contracts that provide general indemnifications. The Fund's maximum exposure under these arrangements is unknown as this would be dependent on future claims that may be made against the Fund. The risk of material loss from such claims is considered remote.
Materials Portfolio
Performance: The Bottom Line
Average annual total return reflects the change in the value of an investment, assuming reinvestment of distributions from dividend income and capital gains (the profits earned upon the sale of securities that have grown in value, if any) and assuming a constant rate of performance each year. The hypothetical investment and the average annual total returns do not reflect the deduction of taxes that a shareholder would pay on fund distributions or the redemption of fund shares. During periods of reimbursement by Fidelity, a fund’s total return will be greater than it would be had the reimbursement not occurred. How a fund did yesterday is no guarantee of how it will do tomorrow.
Average Annual Total Returns
| For the periods ended February 28, 2019 | Past 1 year | Past 5 years | Past 10 years |
| Class A (incl. 5.75% sales charge) | (17.62)% | 0.10% | 13.14% |
| Class M (incl. 3.50% sales charge) | (15.89)% | 0.27% | 13.07% |
| Class C (incl. contingent deferred sales charge) | (14.02)% | 0.54% | 12.95% |
| Materials Portfolio | (12.35)% | 1.56% | 14.12% |
| Class I | (12.34)% | 1.58% | 14.13% |
| Class Z | (12.28)% | 1.60% | 14.14% |
Class C shares' contingent deferred sales charges included in the past one year, past five years and past ten years total return figures are 1%, 0% and 0%, respectively.
The initial offering of Class Z shares took place on October 2, 2018. Returns prior to October 2, 2018 are those of Class I.
$10,000 Over 10 Years
Let's say hypothetically that $10,000 was invested in Materials Portfolio, a class of the fund, on February 28, 2009.
The chart shows how the value of your investment would have changed, and also shows how the S&P 500® Index performed over the same period.
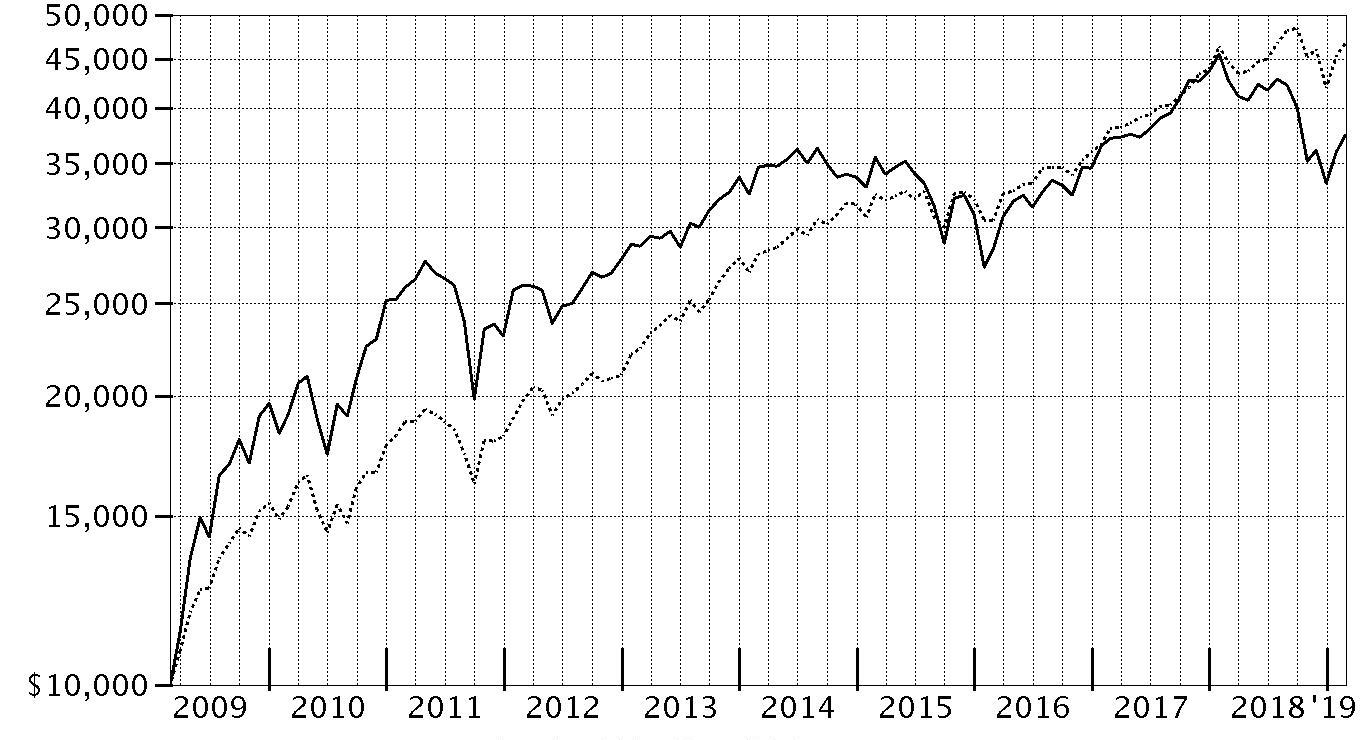
| Period Ending Values |
| $37,454 | Materials Portfolio |
| $46,739 | S&P 500® Index |
Materials Portfolio
Management's Discussion of Fund Performance
Market Recap: The S&P 500
® index gained 4.68% for the 12 months ending February 28, 2019, as the U.S. equity bellwether began the new year on a high note after enduring a final quarter of 2018 in which resurgent volatility upset the aging bull market. In October, rising U.S. Treasury yields and concern about peaking corporate earnings growth sent many investors fleeing from risk assets as they were still dealing with lingering uncertainty related to global trade and the U.S. Federal Reserve picking up the pace of interest rate hikes. The index returned -6.84% in October, at the time its largest monthly drop in seven years. But conditions worsened through Christmas, as jitters about the economy and another hike in rates led to a spike in market volatility and a -9.03% result for December. Sharply reversing course to begin 2019, the S&P 500
® gained 11.48% year-to-date, its strongest two-month opening since 1991, amid upbeat company earnings/outlooks and signs the Fed may pause on rates. For the full period, some economically sensitive sectors fared worst, with financials (-6%) and materials (-6%) both losing ground. Energy gained 1%, while communication services and industrials each rose roughly 2%. In contrast, the defensive utilities (+20%), real estate (+20%) and health care (+11%) sectors led the way, while consumer staples finished near the index. Information technology and consumer discretionary were rattled in the late-2018 downturn, but earlier strength contributed to advances of 9% and roughly 7%, respectively.
Comments from Portfolio Manager Richard Malnight: For the fiscal year, the fund’s share classes returned roughly -12% to -13%, notably trailing the -6.42% result of the MSCI U.S. IMI Materials 25/50 Index, and also underperforming the broader S&P 500
®. Versus the MSCI index, positioning in specialty chemicals and diversified chemicals detracted most from the fund’s performance, although fertilizers & agricultural chemicals also weighed on our relative result. Overweighting commodity chemicals hurt as well, but the negative impact here was largely offset by favorable stock selection in the group. At the individual stock level, not owning MSCI index component Ecolab made this stock the portfolio's largest relative detractor. Overweighting DowDuPont – by far, the fund’s largest holding – and Westlake Chemical also worked against us. During the period, I shifted capital from Westlake to Olin, which ended the period as the fund’s fourth-largest position and, due to our timely purchases, contributed to the fund’s relative result. Elsewhere, relative performance benefited modestly from stock picking among industrial gases and copper companies. The top individual relative contributor was a non-benchmark position in Germany-based industrial gases company Linde. Given the planned merger of Linde and competitor Praxair – a deal that closed in December – we chose to play the Linde side of it and avoided Praxair. Although not owning Praxair detracted this period, the combined impact of our positions in Linde and Praxair on relative performance was positive. A significant overweighting in Element Solutions – formerly known as Platform Specialty Products – also contributed.
The views expressed above reflect those of the portfolio manager(s) only through the end of the period as stated on the cover of this report and do not necessarily represent the views of Fidelity or any other person in the Fidelity organization. Any such views are subject to change at any time based upon market or other conditions and Fidelity disclaims any responsibility to update such views. These views may not be relied on as investment advice and, because investment decisions for a Fidelity fund are based on numerous factors, may not be relied on as an indication of trading intent on behalf of any Fidelity fund.
Materials Portfolio
Investment Summary (Unaudited)
Top Ten Stocks as of February 28, 2019
| | % of fund's net assets |
| DowDuPont, Inc. | 23.0 |
| Linde PLC | 9.3 |
| The Chemours Co. LLC | 8.5 |
| Olin Corp. | 7.2 |
| Air Products & Chemicals, Inc. | 4.9 |
| Sherwin-Williams Co. | 4.5 |
| Vulcan Materials Co. | 3.6 |
| Tronox Ltd. Class A | 2.9 |
| International Flavors & Fragrances, Inc. | 2.6 |
| Crown Holdings, Inc. | 2.4 |
| | 68.9 |
Top Industries (% of fund's net assets)
| As of February 28, 2019 |
| | Chemicals | 78.7% |
| | Metals & Mining | 8.5% |
| | Containers & Packaging | 6.2% |
| | Construction Materials | 3.8% |
| | Trading Companies & Distributors | 2.3% |
| | All Others* | 0.5% |

* Includes short-term investments and net other assets (liabilities).
Materials Portfolio
Schedule of Investments February 28, 2019
Showing Percentage of Net Assets
| Common Stocks - 99.8% | | | |
| | | Shares | Value |
| Building Products - 0.3% | | | |
| Building Products - 0.3% | | | |
| GCP Applied Technologies, Inc. (a) | | 87,900 | $2,634,363 |
| Chemicals - 78.7% | | | |
| Commodity Chemicals - 15.7% | | | |
| Cabot Corp. | | 197,956 | 9,280,177 |
| Ciner Resources LP | | 136,500 | 3,390,660 |
| LyondellBasell Industries NV Class A | | 178,615 | 15,275,155 |
| Olin Corp. | | 3,062,317 | 79,191,518 |
| Orion Engineered Carbons SA | | 556,121 | 15,499,092 |
| Trinseo SA | | 53,300 | 2,675,127 |
| Tronox Ltd. Class A | | 2,711,903 | 32,081,812 |
| Valvoline, Inc. | | 68,079 | 1,279,204 |
| Westlake Chemical Corp. | | 189,842 | 13,264,261 |
| | | | 171,937,006 |
| Diversified Chemicals - 33.7% | | | |
| DowDuPont, Inc. | | 4,728,333 | 251,689,166 |
| Eastman Chemical Co. | | 103,848 | 8,587,191 |
| Ingevity Corp. (a) | | 137,900 | 15,888,838 |
| The Chemours Co. LLC | | 2,448,531 | 93,117,634 |
| | | | 369,282,829 |
| Fertilizers & Agricultural Chemicals - 3.1% | | | |
| CF Industries Holdings, Inc. | | 243,100 | 10,258,820 |
| The Mosaic Co. | | 770,200 | 24,084,154 |
| | | | 34,342,974 |
| Industrial Gases - 14.2% | | | |
| Air Products & Chemicals, Inc. | | 297,800 | 53,955,404 |
| Linde PLC | | 590,186 | 102,243,823 |
| | | | 156,199,227 |
| Specialty Chemicals - 12.0% | | | |
| Celanese Corp. Class A | | 121,400 | 12,418,006 |
| Element Solutions, Inc. (a) | | 2,138,715 | 24,081,931 |
| International Flavors & Fragrances, Inc. | | 223,706 | 28,522,515 |
| RPM International, Inc. | | 175,000 | 10,127,250 |
| Sherwin-Williams Co. | | 114,300 | 49,514,760 |
| W.R. Grace & Co. | | 82,700 | 6,423,309 |
| | | | 131,087,771 |
|
| TOTAL CHEMICALS | | | 862,849,807 |
|
| Construction Materials - 3.8% | | | |
| Construction Materials - 3.8% | | | |
| Summit Materials, Inc. (a) | | 155,900 | 2,650,300 |
| Vulcan Materials Co. | | 353,500 | 39,401,110 |
| | | | 42,051,410 |
| Containers & Packaging - 6.2% | | | |
| Metal & Glass Containers - 6.2% | | | |
| Aptargroup, Inc. | | 187,800 | 19,104,894 |
| Ball Corp. | | 326,800 | 17,902,104 |
| Crown Holdings, Inc. (a) | | 491,600 | 26,688,964 |
| Owens-Illinois, Inc. | | 206,100 | 4,105,512 |
| | | | 67,801,474 |
| Metals & Mining - 8.5% | | | |
| Copper - 2.1% | | | |
| Antofagasta PLC | | 1,870,826 | 23,245,475 |
| Diversified Metals & Mining - 1.5% | | | |
| Alcoa Corp. (a) | | 257,000 | 7,581,500 |
| Livent Corp. (b) | | 675,700 | 8,648,960 |
| | | | 16,230,460 |
| Gold - 2.9% | | | |
| Newmont Mining Corp. | | 702,900 | 23,982,948 |
| Royal Gold, Inc. | | 90,000 | 7,956,900 |
| | | | 31,939,848 |
| Steel - 2.0% | | | |
| AK Steel Holding Corp. (a)(b) | | 424,600 | 1,282,292 |
| Allegheny Technologies, Inc. (a) | | 173,700 | 4,973,031 |
| Cleveland-Cliffs, Inc. | | 377,600 | 4,187,584 |
| Steel Dynamics, Inc. | | 315,279 | 11,766,212 |
| | | | 22,209,119 |
|
| TOTAL METALS & MINING | | | 93,624,902 |
|
| Trading Companies & Distributors - 2.3% | | | |
| Trading Companies & Distributors - 2.3% | | | |
| Univar, Inc. (a) | | 1,096,733 | 24,797,133 |
| TOTAL COMMON STOCKS | | | |
| (Cost $1,033,974,520) | | | 1,093,759,089 |
|
| Money Market Funds - 1.0% | | | |
| Fidelity Cash Central Fund, 2.44% (c) | | 1,459,132 | 1,459,424 |
| Fidelity Securities Lending Cash Central Fund 2.45% (c)(d) | | 9,592,626 | 9,593,585 |
| TOTAL MONEY MARKET FUNDS | | | |
| (Cost $11,053,009) | | | 11,053,009 |
| TOTAL INVESTMENT IN SECURITIES - 100.8% | | | |
| (Cost $1,045,027,529) | | | 1,104,812,098 |
| NET OTHER ASSETS (LIABILITIES) - (0.8)% | | | (8,497,071) |
| NET ASSETS - 100% | | | $1,096,315,027 |
Legend
(a) Non-income producing
(b) Security or a portion of the security is on loan at period end.
(c) Affiliated fund that is generally available only to investment companies and other accounts managed by Fidelity Investments. The rate quoted is the annualized seven-day yield of the fund at period end. A complete unaudited listing of the fund's holdings as of its most recent quarter end is available upon request. In addition, each Fidelity Central Fund's financial statements, which are not covered by the Fund's Report of Independent Registered Public Accounting Firm, are available on the SEC's website or upon request.
(d) Investment made with cash collateral received from securities on loan.
Affiliated Central Funds
Information regarding fiscal year to date income earned by the Fund from investments in Fidelity Central Funds is as follows:
| Fund | Income earned |
| Fidelity Cash Central Fund | $120,918 |
| Fidelity Securities Lending Cash Central Fund | 84,391 |
| Total | $205,309 |
Amounts in the income column in the above table include any capital gain distributions from underlying funds, which are presented in the corresponding line-item in the Statement of Operations, if applicable.
Investment Valuation
All investments are categorized as Level 1 under the Fair Value Hierarchy. The inputs or methodology used for valuing securities may not be an indication of the risk associated with investing in those securities. For more information on valuation inputs please refer to the Investment Valuation section in the accompanying Notes to Financial Statements.
Other Information
Distribution of investments by country or territory of incorporation, as a percentage of Total Net Assets, is as follows (Unaudited):
| United States of America | 82.6% |
| Ireland | 9.3% |
| Australia | 2.9% |
| United Kingdom | 2.1% |
| Luxembourg | 1.7% |
| Netherlands | 1.4% |
| | 100.0% |
See accompanying notes which are an integral part of the financial statements.
Materials Portfolio
Financial Statements
Statement of Assets and Liabilities
| | | February 28, 2019 |
| Assets | | |
Investment in securities, at value (including securities loaned of $9,557,980) — See accompanying schedule:
Unaffiliated issuers (cost $1,033,974,520) | $1,093,759,089 | |
| Fidelity Central Funds (cost $11,053,009) | 11,053,009 | |
| Total Investment in Securities (cost $1,045,027,529) | | $1,104,812,098 |
| Foreign currency held at value (cost $19,367) | | 19,569 |
| Receivable for investments sold | | 1,102,876 |
| Receivable for fund shares sold | | 561,709 |
| Dividends receivable | | 3,744,335 |
| Distributions receivable from Fidelity Central Funds | | 18,127 |
| Prepaid expenses | | 15,584 |
| Other receivables | | 120,873 |
| Total assets | | 1,110,395,171 |
| Liabilities | | |
| Payable for investments purchased | $1,859,091 | |
| Payable for fund shares redeemed | 1,670,697 | |
| Accrued management fee | 491,176 | |
| Distribution and service plan fees payable | 80,904 | |
| Other affiliated payables | 220,449 | |
| Other payables and accrued expenses | 164,402 | |
| Collateral on securities loaned | 9,593,425 | |
| Total liabilities | | 14,080,144 |
| Net Assets | | $1,096,315,027 |
| Net Assets consist of: | | |
| Paid in capital | | $1,049,970,682 |
| Total distributable earnings (loss) | | 46,344,345 |
| Net Assets | | $1,096,315,027 |
| Net Asset Value and Maximum Offering Price | | |
| Class A: | | |
| Net Asset Value and redemption price per share ($126,181,806 ÷ 1,813,619 shares) | | $69.57 |
| Maximum offering price per share (100/94.25 of $69.57) | | $73.81 |
| Class M: | | |
| Net Asset Value and redemption price per share ($27,435,946 ÷ 397,712 shares) | | $68.98 |
| Maximum offering price per share (100/96.50 of $68.98) | | $71.48 |
| Class C: | | |
| Net Asset Value and offering price per share ($51,659,091 ÷ 769,524 shares)(a) | | $67.13 |
| Materials: | | |
| Net Asset Value, offering price and redemption price per share ($626,759,051 ÷ 8,974,171 shares) | | $69.84 |
| Class I: | | |
| Net Asset Value, offering price and redemption price per share ($254,240,010 ÷ 3,647,522 shares) | | $69.70 |
| Class Z: | | |
| Net Asset Value, offering price and redemption price per share ($10,039,123 ÷ 144,281 shares) | | $69.58 |
(a) Redemption price per share is equal to net asset value less any applicable contingent deferred sales charge.
See accompanying notes which are an integral part of the financial statements.
Statement of Operations
| | | Year ended February 28, 2019 |
| Investment Income | | |
| Dividends | | $30,302,990 |
| Income from Fidelity Central Funds | | 205,309 |
| Total income | | 30,508,299 |
| Expenses | | |
| Management fee | $7,717,130 | |
| Transfer agent fees | 2,880,562 | |
| Distribution and service plan fees | 1,255,123 | |
| Accounting and security lending fees | 451,021 | |
| Custodian fees and expenses | 51,707 | |
| Independent trustees' fees and expenses | 8,426 | |
| Registration fees | 117,210 | |
| Audit | 56,946 | |
| Legal | 9,813 | |
| Interest | 22,531 | |
| Miscellaneous | 79,900 | |
| Total expenses before reductions | 12,650,369 | |
| Expense reductions | (223,695) | |
| Total expenses after reductions | | 12,426,674 |
| Net investment income (loss) | | 18,081,625 |
| Realized and Unrealized Gain (Loss) | | |
| Net realized gain (loss) on: | | |
| Investment securities: | | |
| Unaffiliated issuers | 48,584,983 | |
| Redemptions in-kind with affiliated entities | 42,386,899 | |
| Fidelity Central Funds | 145 | |
| Foreign currency transactions | 41,492 | |
| Total net realized gain (loss) | | 91,013,519 |
| Change in net unrealized appreciation (depreciation) on: | | |
| Investment securities: | | |
| Unaffiliated issuers | (319,868,319) | |
| Assets and liabilities in foreign currencies | (9,124) | |
| Total change in net unrealized appreciation (depreciation) | | (319,877,443) |
| Net gain (loss) | | (228,863,924) |
| Net increase (decrease) in net assets resulting from operations | | $(210,782,299) |
See accompanying notes which are an integral part of the financial statements.
Statement of Changes in Net Assets
| | Year ended February 28, 2019 | Year ended February 28, 2018 |
| Increase (Decrease) in Net Assets | | |
| Operations | | |
| Net investment income (loss) | $18,081,625 | $13,943,613 |
| Net realized gain (loss) | 91,013,519 | 168,615,627 |
| Change in net unrealized appreciation (depreciation) | (319,877,443) | 43,205,875 |
| Net increase (decrease) in net assets resulting from operations | (210,782,299) | 225,765,115 |
| Distributions to shareholders | (148,511,389) | – |
| Distributions to shareholders from net investment income | – | (13,925,069) |
| Distributions to shareholders from net realized gain | – | (80,094,510) |
| Total distributions | (148,511,389) | (94,019,579) |
| Share transactions - net increase (decrease) | (426,989,061) | 182,977,431 |
| Total increase (decrease) in net assets | (786,282,749) | 314,722,967 |
| Net Assets | | |
| Beginning of period | 1,882,597,776 | 1,567,874,809 |
| End of period | $1,096,315,027 | $1,882,597,776 |
| Other Information | | |
| Undistributed net investment income end of period | | $2,045,516 |
See accompanying notes which are an integral part of the financial statements.
Financial Highlights
Materials Portfolio Class A
| Years ended February 28, | 2019 | 2018 | 2017 | 2016A | 2015 |
| Selected Per–Share Data | | | | | |
| Net asset value, beginning of period | $88.50 | $81.27 | $62.94 | $80.43 | $86.46 |
| Income from Investment Operations | | | | | |
| Net investment income (loss)B | .84 | .55 | .70 | .79 | .51 |
| Net realized and unrealized gain (loss) | (12.01) | 11.18 | 18.26 | (16.80) | 1.05 |
| Total from investment operations | (11.17) | 11.73 | 18.96 | (16.01) | 1.56 |
| Distributions from net investment income | (.67) | (.50) | (.63) | (.58) | (.43) |
| Distributions from net realized gain | (7.09) | (4.00) | – | (.91) | (7.17) |
| Total distributions | (7.76) | (4.50) | (.63) | (1.48)C | (7.59)D |
| Redemption fees added to paid in capitalB | – | – | –E | –E | –E |
| Net asset value, end of period | $69.57 | $88.50 | $81.27 | $62.94 | $80.43 |
| Total ReturnF,G | (12.59)% | 14.65% | 30.18% | (20.01)% | 2.20% |
| Ratios to Average Net AssetsH,I | | | | | |
| Expenses before reductions | 1.06% | 1.07% | 1.08% | 1.06% | 1.06% |
| Expenses net of fee waivers, if any | 1.06% | 1.07% | 1.08% | 1.06% | 1.06% |
| Expenses net of all reductions | 1.05% | 1.06% | 1.07% | 1.06% | 1.06% |
| Net investment income (loss) | 1.08% | .64% | .96% | 1.09% | .61% |
| Supplemental Data | | | | | |
| Net assets, end of period (000 omitted) | $126,182 | $201,933 | $229,086 | $202,747 | $319,740 |
| Portfolio turnover rateJ | 77%K | 67% | 49%K | 64% | 76%K |
A For the year ended February 29.
B Calculated based on average shares outstanding during the period.
C Total distributions of $1.48 per share is comprised of distributions from net investment income of $.575 and distributions from net realized gain of $.906 per share.
D Total distributions of $7.59 per share is comprised of distributions from net investment income of $.425 and distributions from net realized gain of $7.167 per share.
E Amount represents less than $.005 per share.
F Total returns would have been lower if certain expenses had not been reduced during the applicable periods shown.
G Total returns do not include the effect of the sales charges.
H Fees and expenses of any underlying Fidelity Central Funds are not included in the Fund's expense ratio. The Fund indirectly bears its proportionate share of the expenses of any underlying Fidelity Central Funds.
I Expense ratios reflect operating expenses of the class. Expenses before reductions do not reflect amounts reimbursed by the investment adviser or reductions from brokerage service arrangements or reductions from other expense offset arrangements and do not represent the amount paid by the class during periods when reimbursements or reductions occur. Expenses net of fee waivers reflect expenses after reimbursement by the investment adviser but prior to reductions from brokerage service arrangements or other expense offset arrangements. Expenses net of all reductions represent the net expenses paid by the class.
J Amount does not include the portfolio activity of any underlying Fidelity Central Funds.
K Portfolio turnover rate excludes securities received or delivered in-kind.
See accompanying notes which are an integral part of the financial statements.
Materials Portfolio Class M
| Years ended February 28, | 2019 | 2018 | 2017 | 2016A | 2015 |
| Selected Per–Share Data | | | | | |
| Net asset value, beginning of period | $87.79 | $80.66 | $62.52 | $79.95 | $85.99 |
| Income from Investment Operations | | | | | |
| Net investment income (loss)B | .61 | .30 | .47 | .56 | .25 |
| Net realized and unrealized gain (loss) | (11.88) | 11.08 | 18.12 | (16.69) | 1.06 |
| Total from investment operations | (11.27) | 11.38 | 18.59 | (16.13) | 1.31 |
| Distributions from net investment income | (.45) | (.25) | (.45) | (.40) | (.18) |
| Distributions from net realized gain | (7.09) | (4.00) | – | (.91) | (7.17) |
| Total distributions | (7.54) | (4.25) | (.45) | (1.30)C | (7.35) |
| Redemption fees added to paid in capitalB | – | – | –D | –D | –D |
| Net asset value, end of period | $68.98 | $87.79 | $80.66 | $62.52 | $79.95 |
| Total ReturnE,F | (12.84)% | 14.30% | 29.78% | (20.27)% | 1.90% |
| Ratios to Average Net AssetsG,H | | | | | |
| Expenses before reductions | 1.35% | 1.36% | 1.39% | 1.38% | 1.37% |
| Expenses net of fee waivers, if any | 1.35% | 1.36% | 1.39% | 1.37% | 1.37% |
| Expenses net of all reductions | 1.34% | 1.35% | 1.38% | 1.37% | 1.37% |
| Net investment income (loss) | .79% | .35% | .65% | .77% | .31% |
| Supplemental Data | | | | | |
| Net assets, end of period (000 omitted) | $27,436 | $40,107 | $40,935 | $30,118 | $45,252 |
| Portfolio turnover rateI | 77%J | 67% | 49%J | 64% | 76%J |
A For the year ended February 29.
B Calculated based on average shares outstanding during the period.
C Total distributions of $1.30 per share is comprised of distributions from net investment income of $.395 and distributions from net realized gain of $.906 per share.
D Amount represents less than $.005 per share.
E Total returns would have been lower if certain expenses had not been reduced during the applicable periods shown.
F Total returns do not include the effect of the sales charges.
G Fees and expenses of any underlying Fidelity Central Funds are not included in the Fund's expense ratio. The Fund indirectly bears its proportionate share of the expenses of any underlying Fidelity Central Funds.
H Expense ratios reflect operating expenses of the class. Expenses before reductions do not reflect amounts reimbursed by the investment adviser or reductions from brokerage service arrangements or reductions from other expense offset arrangements and do not represent the amount paid by the class during periods when reimbursements or reductions occur. Expenses net of fee waivers reflect expenses after reimbursement by the investment adviser but prior to reductions from brokerage service arrangements or other expense offset arrangements. Expenses net of all reductions represent the net expenses paid by the class.
I Amount does not include the portfolio activity of any underlying Fidelity Central Funds.
J Portfolio turnover rate excludes securities received or delivered in-kind.
See accompanying notes which are an integral part of the financial statements.
See accompanying notes which are an integral part of the financial statements.
Materials Portfolio Class C
| Years ended February 28, | 2019 | 2018 | 2017 | 2016A | 2015 |
| Selected Per–Share Data | | | | | |
| Net asset value, beginning of period | $85.52 | $78.72 | $61.09 | $78.12 | $84.38 |
| Income from Investment Operations | | | | | |
| Net investment income (loss)B | .25 | (.09) | .15 | .24 | (.12) |
| Net realized and unrealized gain (loss) | (11.50) | 10.80 | 17.68 | (16.28) | 1.03 |
| Total from investment operations | (11.25) | 10.71 | 17.83 | (16.04) | .91 |
| Distributions from net investment income | (.04) | (.02) | (.20) | (.08) | – |
| Distributions from net realized gain | (7.09) | (3.89) | – | (.91) | (7.17) |
| Total distributions | (7.14)C | (3.91) | (.20) | (.99) | (7.17) |
| Redemption fees added to paid in capitalB | – | – | –D | –D | –D |
| Net asset value, end of period | $67.13 | $85.52 | $78.72 | $61.09 | $78.12 |
| Total ReturnE,F | (13.24)% | 13.78% | 29.21% | (20.61)% | 1.43% |
| Ratios to Average Net AssetsG,H | | | | | |
| Expenses before reductions | 1.81% | 1.82% | 1.83% | 1.81% | 1.82% |
| Expenses net of fee waivers, if any | 1.81% | 1.82% | 1.82% | 1.81% | 1.82% |
| Expenses net of all reductions | 1.79% | 1.82% | 1.82% | 1.81% | 1.82% |
| Net investment income (loss) | .33% | (.11)% | .21% | .34% | (.14)% |
| Supplemental Data | | | | | |
| Net assets, end of period (000 omitted) | $51,659 | $85,792 | $80,225 | $66,896 | $107,697 |
| Portfolio turnover rateI | 77%J | 67% | 49%J | 64% | 76%J |
A For the year ended February 29.
B Calculated based on average shares outstanding during the period.
C Total distributions of $7.14 per share is comprised of distributions from net investment income of $.042 and distributions from net realized gain of $7.094 per share.
D Amount represents less than $.005 per share.
E Total returns would have been lower if certain expenses had not been reduced during the applicable periods shown.
F Total returns do not include the effect of the contingent deferred sales charge.
G Fees and expenses of any underlying Fidelity Central Funds are not included in the Fund's expense ratio. The Fund indirectly bears its proportionate share of the expenses of any underlying Fidelity Central Funds.
H Expense ratios reflect operating expenses of the class. Expenses before reductions do not reflect amounts reimbursed by the investment adviser or reductions from brokerage service arrangements or reductions from other expense offset arrangements and do not represent the amount paid by the class during periods when reimbursements or reductions occur. Expenses net of fee waivers reflect expenses after reimbursement by the investment adviser but prior to reductions from brokerage service arrangements or other expense offset arrangements. Expenses net of all reductions represent the net expenses paid by the class.
I Amount does not include the portfolio activity of any underlying Fidelity Central Funds.
J Portfolio turnover rate excludes securities received or delivered in-kind.
See accompanying notes which are an integral part of the financial statements.
Materials Portfolio
| Years ended February 28, | 2019 | 2018 | 2017 | 2016A | 2015 |
| Selected Per–Share Data | | | | | |
| Net asset value, beginning of period | $88.90 | $81.64 | $63.20 | $80.77 | $86.81 |
| Income from Investment Operations | | | | | |
| Net investment income (loss)B | 1.06 | .79 | .90 | .98 | .73 |
| Net realized and unrealized gain (loss) | (12.09) | 11.24 | 18.34 | (16.89) | 1.05 |
| Total from investment operations | (11.03) | 12.03 | 19.24 | (15.91) | 1.78 |
| Distributions from net investment income | (.93) | (.77) | (.80) | (.76) | (.65) |
| Distributions from net realized gain | (7.09) | (4.00) | – | (.91) | (7.17) |
| Total distributions | (8.03)C | (4.77) | (.80) | (1.66)D | (7.82) |
| Redemption fees added to paid in capitalB | – | – | –E | –E | –E |
| Net asset value, end of period | $69.84 | $88.90 | $81.64 | $63.20 | $80.77 |
| Total ReturnF | (12.35)% | 14.96% | 30.52% | (19.81)% | 2.46% |
| Ratios to Average Net AssetsG,H | | | | | |
| Expenses before reductions | .79% | .79% | .81% | .81% | .80% |
| Expenses net of fee waivers, if any | .79% | .79% | .81% | .81% | .80% |
| Expenses net of all reductions | .78% | .79% | .81% | .80% | .80% |
| Net investment income (loss) | 1.35% | .91% | 1.22% | 1.34% | .87% |
| Supplemental Data | | | | | |
| Net assets, end of period (000 omitted) | $626,759 | $1,043,704 | $882,504 | $711,985 | $1,107,689 |
| Portfolio turnover rateI | 77%J | 67% | 49%J | 64% | 76%J |
A For the year ended February 29.
B Calculated based on average shares outstanding during the period.
C Total distributions of $8.03 per share is comprised of distributions from net investment income of $.932 and distributions from net realized gain of $7.094 per share.
D Total distributions of $1.66 per share is comprised of distributions from net investment income of $.756 and distributions from net realized gain of $.906 per share.
E Amount represents less than $.005 per share.
F Total returns would have been lower if certain expenses had not been reduced during the applicable periods shown.
G Fees and expenses of any underlying Fidelity Central Funds are not included in the Fund's expense ratio. The Fund indirectly bears its proportionate share of the expenses of any underlying Fidelity Central Funds.
H Expense ratios reflect operating expenses of the class. Expenses before reductions do not reflect amounts reimbursed by the investment adviser or reductions from brokerage service arrangements or reductions from other expense offset arrangements and do not represent the amount paid by the class during periods when reimbursements or reductions occur. Expenses net of fee waivers reflect expenses after reimbursement by the investment adviser but prior to reductions from brokerage service arrangements or other expense offset arrangements. Expenses net of all reductions represent the net expenses paid by the class.
I Amount does not include the portfolio activity of any underlying Fidelity Central Funds.
J Portfolio turnover rate excludes securities received or delivered in-kind.
See accompanying notes which are an integral part of the financial statements.
Materials Portfolio Class I
| Years ended February 28, | 2019 | 2018 | 2017 | 2016 A | 2015 |
| Selected Per–Share Data | | | | | |
| Net asset value, beginning of period | $88.73 | $81.49 | $63.07 | $80.60 | $86.66 |
| Income from Investment Operations | | | | | |
| Net investment income (loss)B | 1.07 | .80 | .91 | 1.00 | .74 |
| Net realized and unrealized gain (loss) | (12.08) | 11.22 | 18.31 | (16.86) | 1.05 |
| Total from investment operations | (11.01) | 12.02 | 19.22 | (15.86) | 1.79 |
| Distributions from net investment income | (.93) | (.78) | (.80) | (.77) | (.68) |
| Distributions from net realized gain | (7.09) | (4.00) | – | (.91) | (7.17) |
| Total distributions | (8.02) | (4.78) | (.80) | (1.67)C | (7.85) |
| Redemption fees added to paid in capitalB | – | – | –D | –D | –D |
| Net asset value, end of period | $69.70 | $88.73 | $81.49 | $63.07 | $80.60 |
| Total ReturnE | (12.34)% | 14.97% | 30.55% | (19.79)% | 2.49% |
| Ratios to Average Net AssetsF,G | | | | | |
| Expenses before reductions | .78% | .79% | .79% | .78% | .78% |
| Expenses net of fee waivers, if any | .78% | .79% | .79% | .78% | .78% |
| Expenses net of all reductions | .77% | .78% | .78% | .78% | .78% |
| Net investment income (loss) | 1.36% | .92% | 1.25% | 1.37% | .89% |
| Supplemental Data | | | | | |
| Net assets, end of period (000 omitted) | $254,240 | $511,062 | $335,124 | $306,145 | $468,371 |
| Portfolio turnover rateH | 77%I | 67% | 49%I | 64% | 76%I |
A For the year ended February 29.
B Calculated based on average shares outstanding during the period.
C Total distributions of $1.67 per share is comprised of distributions from net investment income of $.767 and distributions from net realized gain of $.906 per share.
D Amount represents less than $.005 per share.
E Total returns would have been lower if certain expenses had not been reduced during the applicable periods shown.
F Fees and expenses of any underlying Fidelity Central Funds are not included in the Fund's expense ratio. The Fund indirectly bears its proportionate share of the expenses of any underlying Fidelity Central Funds.
G Expense ratios reflect operating expenses of the class. Expenses before reductions do not reflect amounts reimbursed by the investment adviser or reductions from brokerage service arrangements or reductions from other expense offset arrangements and do not represent the amount paid by the class during periods when reimbursements or reductions occur. Expenses net of fee waivers reflect expenses after reimbursement by the investment adviser but prior to reductions from brokerage service arrangements or other expense offset arrangements. Expenses net of all reductions represent the net expenses paid by the class.
H Amount does not include the portfolio activity of any underlying Fidelity Central Funds.
I Portfolio turnover rate excludes securities received or delivered in-kind.
See accompanying notes which are an integral part of the financial statements.
Materials Portfolio Class Z
| Year ended February 28, | 2019 A |
| Selected Per–Share Data | |
| Net asset value, beginning of period | $79.81 |
| Income from Investment Operations | |
| Net investment income (loss)B | .62 |
| Net realized and unrealized gain (loss) | (6.96) |
| Total from investment operations | (6.34) |
| Distributions from net investment income | (.96) |
| Distributions from net realized gain | (2.93) |
| Total distributions | (3.89) |
| Net asset value, end of period | $69.58 |
| Total ReturnC,D | (7.35)% |
| Ratios to Average Net AssetsE,F | |
| Expenses before reductions | .63%G |
| Expenses net of fee waivers, if any | .62%G |
| Expenses net of all reductions | .61%G |
| Net investment income (loss) | 2.27%G |
| Supplemental Data | |
| Net assets, end of period (000 omitted) | $10,039 |
| Portfolio turnover rateH | 77%I |
A For the period October 2, 2018 (commencement of sale of shares) to February 28, 2019.
B Calculated based on average shares outstanding during the period.
C Total returns for periods of less than one year are not annualized.
D Total returns would have been lower if certain expenses had not been reduced during the applicable periods shown.
E Fees and expenses of any underlying Fidelity Central Funds are not included in the Fund's expense ratio. The Fund indirectly bears its proportionate share of the expenses of any underlying Fidelity Central Funds.
F Expense ratios reflect operating expenses of the class. Expenses before reductions do not reflect amounts reimbursed by the investment adviser or reductions from brokerage service arrangements or reductions from other expense offset arrangements and do not represent the amount paid by the class during periods when reimbursements or reductions occur. Expense ratios before reductions for start-up periods may not be representative of longer-term operating periods. Expenses net of fee waivers reflect expenses after reimbursement by the investment adviser but prior to reductions from brokerage service arrangements or other expense offset arrangements. Expenses net of all reductions represent the net expenses paid by the class.
G Annualized
H Amount does not include the portfolio activity of any underlying Fidelity Central Funds.
I Portfolio turnover rate excludes securities received or delivered in-kind.
See accompanying notes which are an integral part of the financial statements.
Notes to Financial Statements
For the period ended February 28, 2019
1. Organization.
Materials Portfolio (the Fund) is a non-diversified fund of Fidelity Select Portfolios (the Trust) and is authorized to issue an unlimited number of shares. The Trust is registered under the Investment Company Act of 1940, as amended (the 1940 Act), as an open-end management investment company organized as a Massachusetts business trust. The Fund invests primarily in securities of companies whose principal business activities fall within specific industries. The Fund commenced sale of Class Z shares on October 2, 2018. The Fund offers Class A, Class M, Class C, Materials, Class I and Class Z shares, each of which has equal rights as to assets and voting privileges. Each class has exclusive voting rights with respect to matters that affect that class.
Effective March 1, 2019, Class C shares will automatically convert to Class A shares after a holding period of ten years from the initial date of purchase, with certain exceptions.
2. Investments in Fidelity Central Funds.
The Fund invests in Fidelity Central Funds, which are open-end investment companies generally available only to other investment companies and accounts managed by the investment adviser and its affiliates. The Fund's Schedule of Investments lists each of the Fidelity Central Funds held as of period end, if any, as an investment of the Fund, but does not include the underlying holdings of each Fidelity Central Fund. As an Investing Fund, the Fund indirectly bears its proportionate share of the expenses of the underlying Fidelity Central Funds.
The Money Market Central Funds seek preservation of capital and current income and are managed by Fidelity Investments Money Management, Inc. (FIMM), an affiliate of the investment adviser. Annualized expenses of the Money Market Central Funds as of their most recent shareholder report date are less than .005%.
A complete unaudited list of holdings for each Fidelity Central Fund is available upon request or at the Securities and Exchange Commission (the SEC) website at www.sec.gov. In addition, the financial statements of the Fidelity Central Funds, which are not covered by the Fund's Report of Independent Registered Public Accounting Firm, are available on the SEC website or upon request.
3. Significant Accounting Policies.
The Fund is an investment company and applies the accounting and reporting guidance of the Financial Accounting Standards Board (FASB) Accounting Standards Codification Topic 946 Financial Services – Investments Companies. The financial statements have been prepared in conformity with accounting principles generally accepted in the United States of America (GAAP), which require management to make certain estimates and assumptions at the date of the financial statements. Actual results could differ from those estimates. Subsequent events, if any, through the date that the financial statements were issued have been evaluated in the preparation of the financial statements. The following summarizes the significant accounting policies of the Fund:
Investment Valuation. Investments are valued as of 4:00 p.m. Eastern time on the last calendar day of the period. The Board of Trustees (the Board) has delegated the day to day responsibility for the valuation of the Fund's investments to the Fair Value Committee (the Committee) established by the Fund's investment adviser. In accordance with valuation policies and procedures approved by the Board, the Fund attempts to obtain prices from one or more third party pricing vendors or brokers to value its investments. When current market prices, quotations or currency exchange rates are not readily available or reliable, investments will be fair valued in good faith by the Committee, in accordance with procedures adopted by the Board. Factors used in determining fair value vary by investment type and may include market or investment specific events. The frequency with which these procedures are used cannot be predicted and they may be utilized to a significant extent. The Committee oversees the Fund's valuation policies and procedures and reports to the Board on the Committee's activities and fair value determinations. The Board monitors the appropriateness of the procedures used in valuing the Fund's investments and ratifies the fair value determinations of the Committee.
The Fund categorizes the inputs to valuation techniques used to value its investments into a disclosure hierarchy consisting of three levels as shown below:
- Level 1 – quoted prices in active markets for identical investments
- Level 2 – other significant observable inputs (including quoted prices for similar investments, interest rates, prepayment speeds, etc.)
- Level 3 – unobservable inputs (including the Fund's own assumptions based on the best information available)
Valuation techniques used to value the Fund's investments by major category are as follows:
Equity securities, including restricted securities, for which market quotations are readily available, are valued at the last reported sale price or official closing price as reported by a third party pricing vendor on the primary market or exchange on which they are traded and are categorized as Level 1 in the hierarchy. In the event there were no sales during the day or closing prices are not available, securities are valued at the last quoted bid price or may be valued using the last available price and are generally categorized as Level 2 in the hierarchy. For foreign equity securities, when market or security specific events arise, comparisons to the valuation of American Depositary Receipts (ADRs), futures contracts, Exchange-Traded Funds (ETFs) and certain indexes as well as quoted prices for similar securities may be used and would be categorized as Level 2 in the hierarchy. For equity securities, including restricted securities, where observable inputs are limited, assumptions about market activity and risk are used and these securities may be categorized as Level 3 in the hierarchy.
Investments in open-end mutual funds, including the Fidelity Central Funds, are valued at their closing net asset value (NAV) each business day and are categorized as Level 1 in the hierarchy.
Changes in valuation techniques may result in transfers in or out of an assigned level within the disclosure hierarchy.
Foreign Currency. The Fund may use foreign currency contracts to facilitate transactions in foreign-denominated securities. Gains and losses from these transactions may arise from changes in the value of the foreign currency or if the counterparties do not perform under the contracts' terms.
Foreign-denominated assets, including investment securities, and liabilities are translated into U.S. dollars at the exchange rates at period end. Purchases and sales of investment securities, income and dividends received and expenses denominated in foreign currencies are translated into U.S. dollars at the exchange rate in effect on the transaction date.
The effects of exchange rate fluctuations on investments are included with the net realized and unrealized gain (loss) on investment securities. Other foreign currency transactions resulting in realized and unrealized gain (loss) are disclosed separately.
Investment Transactions and Income. For financial reporting purposes, the Fund's investment holdings and NAV include trades executed through the end of the last business day of the period. The NAV per share for processing shareholder transactions is calculated as of the close of business of the New York Stock Exchange (NYSE), normally 4:00 p.m. Eastern time and includes trades executed through the end of the prior business day. Gains and losses on securities sold are determined on the basis of identified cost. Dividend income is recorded on the ex-dividend date, except for certain dividends from foreign securities where the ex-dividend date may have passed, which are recorded as soon as the Fund is informed of the ex-dividend date. Non-cash dividends included in dividend income, if any, are recorded at the fair market value of the securities received. Income and capital gain distributions from Fidelity Central Funds, if any, are recorded on the ex-dividend date. Certain distributions received by the Fund represent a return of capital or capital gain. The Fund determines the components of these distributions subsequent to the ex-dividend date, based upon receipt of tax filings or other correspondence relating to the underlying investment. These distributions are recorded as a reduction of cost of investments and/or as a realized gain. Investment income is recorded net of foreign taxes withheld where recovery of such taxes is uncertain.
Class Allocations and Expenses. Investment income, realized and unrealized capital gains and losses, common expenses of the Fund, and certain fund-level expense reductions, if any, are allocated daily on a pro-rata basis to each class based on the relative net assets of each class to the total net assets of the Fund. Each class differs with respect to transfer agent and distribution and service plan fees incurred. Certain expense reductions may also differ by class. For the reporting period, the allocated portion of income and expenses to each class as a percent of its average net assets may vary due to the timing of recording these transactions in relation to fluctuating net assets of the classes. Expenses directly attributable to a fund are charged to that fund. Expenses attributable to more than one fund are allocated among the respective funds on the basis of relative net assets or other appropriate methods. Expense estimates are accrued in the period to which they relate and adjustments are made when actual amounts are known.
Deferred Trustee Compensation. Under a Deferred Compensation Plan (the Plan) for the Fund, certain independent Trustees have elected to defer receipt of a portion of their annual compensation. Deferred amounts are invested in a cross-section of Fidelity funds, are marked-to-market and remain in the Fund until distributed in accordance with the Plan. The investment of deferred amounts and the offsetting payable to the Trustees of $120,706 are included in the accompanying Statement of Assets and Liabilities in other receivables and other payables and accrued expenses, respectively.
Income Tax Information and Distributions to Shareholders. Each year, the Fund intends to qualify as a regulated investment company under Subchapter M of the Internal Revenue Code, including distributing substantially all of its taxable income and realized gains. As a result, no provision for U.S. Federal income taxes is required. As of February 28, 2019, the Fund did not have any unrecognized tax benefits in the financial statements; nor is the Fund aware of any tax positions for which it is reasonably possible that the total amounts of unrecognized tax benefits will significantly change in the next twelve months. The Fund files a U.S. federal tax return, in addition to state and local tax returns as required. The Fund's federal income tax returns are subject to examination by the Internal Revenue Service (IRS) for a period of three fiscal years after they are filed. State and local tax returns may be subject to examination for an additional fiscal year depending on the jurisdiction. Foreign taxes are provided for based on the Fund's understanding of the tax rules and rates that exist in the foreign markets in which it invests.
Distributions are declared and recorded on the ex-dividend date. Income and capital gain distributions are declared separately for each class. Income and capital gain distributions are determined in accordance with income tax regulations, which may differ from GAAP. In addition, the Fund claimed a portion of the payment made to redeeming shareholders as a distribution for income tax purposes.
Capital accounts within the financial statements are adjusted for permanent book-tax differences. These adjustments have no impact on net assets or the results of operations. Capital accounts are not adjusted for temporary book-tax differences which will reverse in a subsequent period.
Book-tax differences are primarily due to in-kind transactions, foreign currency transactions, deferred trustees compensation, partnerships, capital loss carryforwards and losses deferred due to wash sales and excise tax regulations.
As of period end, the cost and unrealized appreciation (depreciation) in securities, and derivatives if applicable, for federal income tax purposes were as follows:
| Gross unrealized appreciation | $112,893,272 |
| Gross unrealized depreciation | (61,305,726) |
| Net unrealized appreciation (depreciation) | $51,587,546 |
| Tax Cost | $1,053,224,552 |
The tax-based components of distributable earnings as of period end were as follows:
| Net unrealized appreciation (depreciation) on securities and other investments | $51,576,134 |
The Fund intends to elect to defer to its next fiscal year $5,111,087 of capital losses recognized during the period November 1, 2018 to February 28, 2019.
The tax character of distributions paid was as follows:
| | February 28, 2019 | February 28, 2018 |
| Ordinary Income | $14,413,957 | $ 18,045,341 |
| Long-term Capital Gains | 134,097,432 | 75,974,238 |
| Total | $148,511,389 | $ 94,019,579 |
New Rule Issuance. During August 2018, the U.S. Securities and Exchange Commission issued Final Rule Release No. 33-10532, Disclosure Update and Simplification. This Final Rule includes amendments specific to registered investment companies that are intended to eliminate overlap in disclosure requirements between Regulation S-X and GAAP. In accordance with these amendments, certain line-items in the Fund's financial statements have been combined or removed for the current period as outlined in the table below.
| Financial Statement | Current Line-Item Presentation (As Applicable) | Prior Line-Item Presentation (As Applicable) |
| Statement of Assets and Liabilities | Total distributable earnings (loss) | Undistributed/Distributions in excess of/Accumulated net investment income (loss)
Accumulated/Undistributed net realized gain (loss)
Net unrealized appreciation (depreciation) |
| Statement of Changes in Net Assets | N/A - removed | Undistributed/Distributions in excess of/Accumulated net investment income (loss) end of period |
| Statement of Changes in Net Assets | Distributions to shareholders | Distributions to shareholders from net investment income
Distributions to shareholders from net realized gain |
| Distributions to Shareholders Note to Financial Statements | Distributions to shareholders | Distributions to shareholders from net investment income
Distributions to shareholders from net realized gain |
4. Purchases and Sales of Investments.
Purchases and sales of securities, other than short-term securities and in-kind transactions, aggregated $1,099,197,290 and $1,529,055,992, respectively.
5. Fees and Other Transactions with Affiliates.
Management Fee. Fidelity SelectCo, LLC (the investment adviser) and its affiliates provide the Fund with investment management related services for which the Fund pays a monthly management fee. The management fee is the sum of an individual fund fee rate that is based on an annual rate of .30% of the Fund's average net assets and an annualized group fee rate that averaged .24% during the period. The group fee rate is based upon the average net assets of all the mutual funds advised by Fidelity Management & Research Company (FMR) and the investment adviser. The group fee rate decreases as assets under management increase and increases as assets under management decrease. For the reporting period, the total annual management fee rate was .54% of the Fund's average net assets.
Distribution and Service Plan Fees. In accordance with Rule 12b-1 of the 1940 Act, the Fund has adopted separate Distribution and Service Plans for each class of shares. Certain classes pay Fidelity Distributors Corporation (FDC), an affiliate of the investment adviser, separate Distribution and Service Fees, each of which is based on an annual percentage of each class' average net assets. In addition, FDC may pay financial intermediaries for selling shares of the Fund and providing shareholder support services. For the period, the Distribution and Service Fee rates, total fees and amounts retained by FDC were as follows:
| | Distribution Fee | Service Fee | Total Fees | Retained by FDC |
| Class A | -% | .25% | $401,420 | $6,298 |
| Class M | .25% | .25% | 162,240 | – |
| Class C | .75% | .25% | 691,463 | 54,790 |
| | | | $1,255,123 | $61,088 |
Sales Load. FDC may receive a front-end sales charge of up to 5.75% for selling Class A shares and 3.50% for selling Class M shares, some of which is paid to financial intermediaries for selling shares of the Fund. Depending on the holding period, FDC may receive contingent deferred sales charges levied on Class A, Class M and Class C redemptions. The deferred sales charges are 1.00% for Class C shares, 1.00% for certain purchases of Class A shares and .25% for certain purchases of Class M shares.
For the period, sales charge amounts retained by FDC were as follows:
| | Retained by FDC |
| Class A | $26,948 |
| Class M | 3,902 |
| Class C(a) | 6,470 |
| | $37,320 |
(a) When Class C shares are initially sold, FDC pays commissions from its own resources to financial intermediaries through which the sales are made.
Transfer Agent Fees. Fidelity Investments Institutional Operations Company, Inc., (FIIOC), an affiliate of the investment adviser, is the transfer, dividend disbursing and shareholder servicing agent for each class of the Fund. FIIOC receives account fees and asset-based fees that vary according to the account size and type of account of the shareholders of the respective classes of the Fund, except for Class Z. FIIOC receives an asset-based fee of Class Z's average net assets. FIIOC pays for typesetting, printing and mailing of shareholder reports, except proxy statements.
For the period, transfer agent fees for each class were as follows:
| | Amount | % of Class-Level Average Net Assets(a) |
| Class A | $356,510 | .22 |
| Class M | 85,120 | .26 |
| Class C | 153,813 | .22 |
| Materials | 1,539,209 | .20 |
| Class I | 744,718 | .19 |
| Class Z | 1,192 | .05(a) |
| | $2,880,562 | |
(a) Annualized
Accounting and Security Lending Fees. Fidelity Service Company, Inc. (FSC), an affiliate of the investment adviser, maintains the Fund's accounting records. The accounting fee is based on the level of average net assets for each month. Under a separate contract, FSC administers the security lending program. The security lending fee is based on the number and duration of lending transactions. For the period, the fees were equivalent to an annual rate of .03%.
Brokerage Commissions. The Fund placed a portion of its portfolio transactions with brokerage firms which are affiliates of the investment adviser. Brokerage commissions are included in net realized gain (loss) and change in net unrealized appreciation (depreciation) in the Statement of Operations. The commissions paid to these affiliated firms were $47,655 for the period.
Interfund Lending Program. Pursuant to an Exemptive Order issued by the SEC, the Fund, along with other registered investment companies having management contracts with Fidelity Management & Research Company (FMR) or other affiliated entities of FMR, may participate in an interfund lending program. This program provides an alternative credit facility allowing the funds to borrow from, or lend money to, other participating affiliated funds. At period end, there were no interfund loans outstanding. The Fund's activity in this program during the period for which loans were outstanding was as follows:
| Borrower or Lender | Average Loan Balance | Weighted Average Interest Rate | Interest Expense |
| Borrower | $5,504,389 | 2.24% | $12,356 |
Interfund Trades. The Fund may purchase from or sell securities to other Fidelity Funds under procedures adopted by the Board. The procedures have been designed to ensure these interfund trades are executed in accordance with Rule 17a-7 of the 1940 Act. Interfund trades are included within the respective purchases and sales amounts shown in the Purchases and Sales of Investments note.
Other. During the period, the investment adviser reimbursed the Fund for certain losses in the amount of $16,917.
Affiliated Redemptions In-Kind. During the period, 1,531,828 shares of the Fund were redeemed in-kind for investments and cash with a value of $126,544,324. The net realized gain of $42,386,899 on investments delivered through in-kind redemptions is included in the accompanying Statement of Operations. The amount of the in-kind redemptions is included in share transactions in the accompanying Statement of Changes in Net Assets as well as the Notes to Financial Statements. The Fund recognized no gain or loss for federal income tax purposes.
6. Committed Line of Credit.
The Fund participates with other funds managed by the investment adviser or an affiliate in a $4.25 billion credit facility (the "line of credit") to be utilized for temporary or emergency purposes to fund shareholder redemptions or for other short-term liquidity purposes. The Fund has agreed to pay commitment fees on its pro-rata portion of the line of credit, which amounted to $4,334 and is reflected in Miscellaneous expenses on the Statement of Operations. During the period, the Fund did not borrow on this line of credit.
7. Security Lending.
The Fund lends portfolio securities through a lending agent from time to time in order to earn additional income. On the settlement date of the loan, the Fund receives collateral (in the form of U.S. Treasury obligations, letters of credit and/or cash) against the loaned securities and maintains collateral in an amount not less than 100% of the market value of the loaned securities during the period of the loan. The market value of the loaned securities is determined at the close of business of the Fund and any additional required collateral is delivered to the Fund on the next business day. The Fund or borrower may terminate the loan at any time, and if the borrower defaults on its obligation to return the securities loaned because of insolvency or other reasons, the Fund may apply collateral received from the borrower against the obligation. The Fund may experience delays and costs in recovering the securities loaned. Any cash collateral received is invested in the Fidelity Securities Lending Cash Central Fund. The value of loaned securities and cash collateral at period end are disclosed on the Fund's Statement of Assets and Liabilities. Security lending income represents the income earned on investing cash collateral, less rebates paid to borrowers and any lending agent fees associated with the loan, plus any premium payments received for lending certain types of securities. Security lending income is presented in the Statement of Operations as a component of income from Fidelity Central Funds. Total security lending income during the period amounted to $84,391.
8. Bank Borrowings.
The Fund is permitted to have bank borrowings for temporary or emergency purposes to fund shareholder redemptions or for other short-term liquidity requirements. The Fund has established borrowing arrangements with certain banks. The interest rate on the borrowings is the bank's base rate, as revised from time to time. The average loan balance during the period for which loans were outstanding amounted to $7,672,647. The weighted average interest rate was 2.81%. The interest expense amounted to $10,175 under the bank borrowing program. At period end, there were no bank borrowings outstanding.
9. Expense Reductions.
Commissions paid to certain brokers with whom the investment adviser, or its affiliates, places trades on behalf of the Fund include an amount in addition to trade execution, which may be rebated back to the Fund to offset certain expenses. This amount totaled $194,959 for the period.
In addition, during the period the investment adviser reimbursed and/or waived a portion of fund-level operating expenses in the amount of $12,718 and a portion of class-level operating expenses as follows:
| | Amount |
| Class A | $1,844 |
| Class M | 401 |
| Class C | 753 |
| Materials | 9,164 |
| Class I | 3,710 |
| Class Z | 146 |
| | $16,018 |
10. Distributions to Shareholders.
Distributions to shareholders of each class were as follows:
| | Year ended
February 28, 2019(a) | Year ended
February 28, 2018 |
| Distributions to shareholders | | |
| Class A | $15,708,925 | $– |
| Class M | 3,202,320 | – |
| Class C | 6,520,876 | – |
| Materials | 82,797,754 | – |
| Class I | 39,718,583 | – |
| Class Z | 562,931 | – |
| Total | $148,511,389 | $– |
| From net investment income | | |
| Class A | $– | $1,122,417 |
| Class M | – | 111,276 |
| Class C | – | 21,712 |
| Materials | – | 8,651,332 |
| Class I | – | 4,018,332 |
| Total | $– | $13,925,069 |
| From net realized gain | | |
| Class A | $– | $8,907,618 |
| Class M | – | 1,755,252 |
| Class C | – | 3,835,607 |
| Materials | – | 44,912,504 |
| Class I | – | 20,683,529 |
| Total | $– | $80,094,510 |
(a) Distributions for Class Z are for the period October 2, 2018 (commencement of sale of shares) to February 28, 2019.
11. Share Transactions.
Share transactions for each class were as follows and may contain automatic conversions between classes or exchanges between affiliated funds:
| | Shares | Shares | Dollars | Dollars |
| | Year ended February 28, 2019 (a) | Year ended February 28, 2018 | Year ended February 28, 2019 (a) | Year ended February 28, 2018 |
| Class A | | | | |
| Shares sold | 308,373 | 680,092 | $22,956,940 | $58,507,834 |
| Reinvestment of distributions | 212,733 | 113,874 | 15,369,185 | 9,780,873 |
| Shares redeemed | (989,324) | (1,331,034) | (75,462,106) | (112,075,163) |
| Net increase (decrease) | (468,218) | (537,068) | $(37,135,981) | $(43,786,456) |
| Class M | | | | |
| Shares sold | 54,673 | 208,725 | $4,209,329 | $17,686,478 |
| Reinvestment of distributions | 44,672 | 21,925 | 3,195,601 | 1,863,640 |
| Shares redeemed | (158,456) | (281,358) | (12,302,958) | (23,392,261) |
| Net increase (decrease) | (59,111) | (50,708) | $(4,898,028) | $(3,842,143) |
| Class C | | | | |
| Shares sold | 52,426 | 181,208 | $3,945,243 | $15,047,250 |
| Reinvestment of distributions | 88,963 | 44,268 | 6,259,533 | 3,679,464 |
| Shares redeemed | (375,023) | (241,477) | (27,023,944) | (20,012,880) |
| Net increase (decrease) | (233,634) | (16,001) | $(16,819,168) | $(1,286,166) |
| Materials | | | | |
| Shares sold | 723,502 | 3,151,404 | $55,284,340 | $281,933,571 |
| Reinvestment of distributions | 1,071,623 | 582,560 | 77,748,766 | 50,400,849 |
| Shares redeemed | (4,560,838)(b) | (2,803,708) | (359,459,696)(b) | (242,311,502) |
| Net increase (decrease) | (2,765,713) | 930,256 | $(226,426,590) | $90,022,918 |
| Class I | | | | |
| Shares sold | 1,171,052 | 2,807,810 | $91,157,331 | $243,189,109 |
| Reinvestment of distributions | 515,251 | 269,534 | 37,224,159 | 23,282,439 |
| Shares redeemed | (3,798,586) | (1,429,768) | (280,329,178) | (124,602,270) |
| Net increase (decrease) | (2,112,283) | 1,647,576 | $(151,947,688) | $141,869,278 |
| Class Z | | | | |
| Shares sold | 190,704 | – | $13,136,478 | $– |
| Reinvestment of distributions | 6,745 | – | 418,264 | – |
| Shares redeemed | (53,168) | – | (3,316,348) | – |
| Net increase (decrease) | 144,281 | – | $10,238,394 | $– |
(a) Share transactions for Class Z are for the period October 2, 2018 (commencement of sale of shares) to February 28, 2019.
(b) Amount includes in-kind redemptions (See Affiliated Redemptions In-Kind note for additional details).
12. Other.
The Fund's organizational documents provide former and current trustees and officers with a limited indemnification against liabilities arising in connection with the performance of their duties to the Fund. In the normal course of business, the Fund may also enter into contracts that provide general indemnifications. The Fund's maximum exposure under these arrangements is unknown as this would be dependent on future claims that may be made against the Fund. The risk of material loss from such claims is considered remote.
Report of Independent Registered Public Accounting Firm
To the Board of Trustees of Fidelity Select Portfolios and Shareholders of Chemicals Portfolio and Materials Portfolio:
Opinions on the Financial Statements
We have audited the accompanying statements of assets and liabilities, including the schedules of investments, of Chemicals Portfolio and Materials Portfolio (two of the funds constituting Fidelity Select Portfolios, hereafter collectively referred to as the "Funds") as of February 28, 2019, the related statements of operations for the year ended February 28, 2019, the statements of changes in net assets for each of the two years in the period ended February 28, 2019, including the related notes, and the financial highlights for each of the periods indicated therein (collectively referred to as the “financial statements”). In our opinion, the financial statements present fairly, in all material respects, the financial position of each of the Funds as of February 28, 2019, the results of each of their operations for the year then ended, the changes in each of their net assets for each of the two years in the period ended February 28, 2019 and each of the financial highlights for each of the periods indicated therein in conformity with accounting principles generally accepted in the United States of America.
Basis for Opinions
These financial statements are the responsibility of the Funds' management. Our responsibility is to express an opinion on the Funds' financial statements based on our audits. We are a public accounting firm registered with the Public Company Accounting Oversight Board (United States) (PCAOB) and are required to be independent with respect to the Funds in accordance with the U.S. federal securities laws and the applicable rules and regulations of the Securities and Exchange Commission and the PCAOB.
We conducted our audits of these financial statements in accordance with the standards of the PCAOB. Those standards require that we plan and perform the audit to obtain reasonable assurance about whether the financial statements are free of material misstatement, whether due to error or fraud.
Our audits included performing procedures to assess the risks of material misstatement of the financial statements, whether due to error or fraud, and performing procedures that respond to those risks. Such procedures included examining, on a test basis, evidence regarding the amounts and disclosures in the financial statements. Our audits also included evaluating the accounting principles used and significant estimates made by management, as well as evaluating the overall presentation of the financial statements. Our procedures included confirmation of securities owned as of February 28, 2019 by correspondence with the custodian and brokers; when replies were not received from brokers, we performed other auditing procedures. We believe that our audits provide a reasonable basis for our opinions.
PricewaterhouseCoopers LLP
Boston, Massachusetts
April 16, 2019
We have served as the auditor of one or more investment companies in the Fidelity group of funds since 1932.
Report of Independent Registered Public Accounting Firm
To the Board of Trustees of Fidelity Select Portfolios and Shareholders of Gold Portfolio:
Opinion on the Consolidated Financial Statements
We have audited the accompanying consolidated statement of assets and liabilities, including the consolidated schedule of investments, of Gold Portfolio and its subsidiary (one of the funds constituting Fidelity Select Portfolios, referred to hereafter as the “Fund”) as of February 28, 2019, the related consolidated statement of operations for the year ended February 28, 2019, the consolidated statement of changes in net assets for each of the two years in the period ended February 28, 2019, including the related notes, and the consolidated financial highlights for each of the periods indicated therein (collectively referred to as the “consolidated financial statements”). In our opinion, the consolidated financial statements present fairly, in all material respects, the financial position of the Fund as of February 28, 2019, the results of its operations for the year then ended, the changes in its net assets for each of the two years in the period ended February 28, 2019 and the financial highlights for each of the periods indicated therein in conformity with accounting principles generally accepted in the United States of America.
Basis for Opinion
These consolidated financial statements are the responsibility of the Fund’s management. Our responsibility is to express an opinion on the Fund’s consolidated financial statements based on our audits. We are a public accounting firm registered with the Public Company Accounting Oversight Board (United States) (PCAOB) and are required to be independent with respect to the Fund in accordance with the U.S. federal securities laws and the applicable rules and regulations of the Securities and Exchange Commission and the PCAOB.
We conducted our audits of these consolidated financial statements in accordance with the standards of the PCAOB. Those standards require that we plan and perform the audit to obtain reasonable assurance about whether the consolidated financial statements are free of material misstatement, whether due to error or fraud.
Our audits included performing procedures to assess the risks of material misstatement of the consolidated financial statements, whether due to error or fraud, and performing procedures that respond to those risks. Such procedures included examining, on a test basis, evidence regarding the amounts and disclosures in the consolidated financial statements. Our audits also included evaluating the accounting principles used and significant estimates made by management, as well as evaluating the overall presentation of the consolidated financial statements. Our procedures included confirmation of securities owned as of February 28, 2019 by correspondence with the custodian and brokers; when replies were not received from brokers, we performed other auditing procedures. We believe that our audits provide a reasonable basis for our opinion.
PricewaterhouseCoopers LLP
Boston, Massachusetts
April 16, 2019
We have served as the auditor of one or more investment companies in the Fidelity group of funds since 1932.
Trustees and Officers
The Trustees, Members of the Advisory Board (if any), and officers of the trust and funds, as applicable, are listed below. The Board of Trustees governs each fund and is responsible for protecting the interests of shareholders. The Trustees are experienced executives who meet periodically throughout the year to oversee each fund's activities, review contractual arrangements with companies that provide services to each fund, oversee management of the risks associated with such activities and contractual arrangements, and review each fund's performance. Except for Michael E. Wiley, each of the Trustees oversees 287 funds. Mr. Wiley oversees 195 funds.
The Trustees hold office without limit in time except that (a) any Trustee may resign; (b) any Trustee may be removed by written instrument, signed by at least two-thirds of the number of Trustees prior to such removal; (c) any Trustee who requests to be retired or who has become incapacitated by illness or injury may be retired by written instrument signed by a majority of the other Trustees; and (d) any Trustee may be removed at any special meeting of shareholders by a two-thirds vote of the outstanding voting securities of the trust. Each Trustee who is not an interested person (as defined in the 1940 Act) of the trust and the funds is referred to herein as an Independent Trustee. Each Independent Trustee shall retire not later than the last day of the calendar year in which his or her 75th birthday occurs. The Independent Trustees may waive this mandatory retirement age policy with respect to individual Trustees. Officers and Advisory Board Members hold office without limit in time, except that any officer or Advisory Board Member may resign or may be removed by a vote of a majority of the Trustees at any regular meeting or any special meeting of the Trustees. Except as indicated, each individual has held the office shown or other offices in the same company for the past five years.
Each fund's Statement of Additional Information (SAI) includes more information about the Trustees. To request a free copy, call Fidelity at 1-800-544-8544 if you’re an individual investing directly with Fidelity, call 1-800-835-5092 if you’re a plan sponsor or participant with Fidelity as your recordkeeper or call 1-877-208-0098 on institutional accounts or if you’re an advisor or invest through one.
Experience, Skills, Attributes, and Qualifications of the Trustees. The Governance and Nominating Committee has adopted a statement of policy that describes the experience, qualifications, attributes, and skills that are necessary and desirable for potential Independent Trustee candidates (Statement of Policy). The Board believes that each Trustee satisfied at the time he or she was initially elected or appointed a Trustee, and continues to satisfy, the standards contemplated by the Statement of Policy. The Governance and Nominating Committee also engages professional search firms to help identify potential Independent Trustee candidates who have the experience, qualifications, attributes, and skills consistent with the Statement of Policy. From time to time, additional criteria based on the composition and skills of the current Independent Trustees, as well as experience or skills that may be appropriate in light of future changes to board composition, business conditions, and regulatory or other developments, have also been considered by the professional search firms and the Governance and Nominating Committee. In addition, the Board takes into account the Trustees' commitment and participation in Board and committee meetings, as well as their leadership of standing and ad hoc committees throughout their tenure.
In determining that a particular Trustee was and continues to be qualified to serve as a Trustee, the Board has considered a variety of criteria, none of which, in isolation, was controlling. The Board believes that, collectively, the Trustees have balanced and diverse experience, qualifications, attributes, and skills, which allow the Board to operate effectively in governing each fund and protecting the interests of shareholders. Information about the specific experience, skills, attributes, and qualifications of each Trustee, which in each case led to the Board's conclusion that the Trustee should serve (or continue to serve) as a trustee of the funds, is provided below.
Board Structure and Oversight Function. James C. Curvey is an interested person and currently serves as Chairman. The Trustees have determined that an interested Chairman is appropriate and benefits shareholders because an interested Chairman has a personal and professional stake in the quality and continuity of services provided to the funds. Independent Trustees exercise their informed business judgment to appoint an individual of their choosing to serve as Chairman, regardless of whether the Trustee happens to be independent or a member of management. The Independent Trustees have determined that they can act independently and effectively without having an Independent Trustee serve as Chairman and that a key structural component for assuring that they are in a position to do so is for the Independent Trustees to constitute a substantial majority for the Board. The Independent Trustees also regularly meet in executive session. Ned C. Lautenbach serves as Chairman of the Independent Trustees and as such (i) acts as a liaison between the Independent Trustees and management with respect to matters important to the Independent Trustees and (ii) with management prepares agendas for Board meetings.
Fidelity® funds are overseen by different Boards of Trustees. The funds' Board oversees Fidelity's high income and certain equity funds, and other Boards oversee Fidelity's investment-grade bond, money market, asset allocation, and other equity funds. The asset allocation funds may invest in Fidelity® funds overseen by the funds' Board. The use of separate Boards, each with its own committee structure, allows the Trustees of each group of Fidelity® funds to focus on the unique issues of the funds they oversee, including common research, investment, and operational issues. On occasion, the separate Boards establish joint committees to address issues of overlapping consequences for the Fidelity® funds overseen by each Board.
The Trustees operate using a system of committees to facilitate the timely and efficient consideration of all matters of importance to the Trustees, each fund, and fund shareholders and to facilitate compliance with legal and regulatory requirements and oversight of the funds' activities and associated risks. The Board, acting through its committees, has charged SelectCo and its affiliates with (i) identifying events or circumstances the occurrence of which could have demonstrably adverse effects on the funds' business and/or reputation; (ii) implementing processes and controls to lessen the possibility that such events or circumstances occur or to mitigate the effects of such events or circumstances if they do occur; and (iii) creating and maintaining a system designed to evaluate continuously business and market conditions in order to facilitate the identification and implementation processes described in (i) and (ii) above. Because the day-to-day operations and activities of the funds are carried out by or through SelectCo, its affiliates, and other service providers, the funds' exposure to risks is mitigated but not eliminated by the processes overseen by the Trustees. While each of the Board's committees has responsibility for overseeing different aspects of the funds' activities, oversight is exercised primarily through the Operations, Audit, and Compliance Committees. In addition, the Independent Trustees have worked with Fidelity to enhance the Board's oversight of investment and financial risks, legal and regulatory risks, technology risks, and operational risks, including the development of additional risk reporting to the Board. Appropriate personnel, including but not limited to the funds' Chief Compliance Officer (CCO), SelectCo's internal auditor, the independent accountants, the funds' Treasurer and portfolio management personnel, make periodic reports to the Board's committees, as appropriate, including an annual review of Fidelity's risk management program for the Fidelity® funds. The responsibilities of each standing committee, including their oversight responsibilities, are described further under "Standing Committees of the Trustees."
Interested Trustees*:
Correspondence intended for a Trustee who is an interested person may be sent to Fidelity Investments, 245 Summer Street, Boston, Massachusetts 02210.
Name, Year of Birth; Principal Occupations and Other Relevant Experience+
James C. Curvey (1935)
Year of Election or Appointment: 2018
Trustee
Chairman of the Board of Trustees
Mr. Curvey also serves as Trustee of other Fidelity® funds. Mr. Curvey is Vice Chairman (2007-present) and Director of FMR LLC (diversified financial services company). In addition, Mr. Curvey is an Overseer Emeritus for the Boston Symphony Orchestra, a Director of Artis-Naples, and a Trustee of Brewster Academy in Wolfeboro, New Hampshire. Previously, Mr. Curvey served as a Director of Fidelity Research & Analysis Co. (investment adviser firm, 2009-2018), Director of Fidelity Investments Money Management, Inc. (investment adviser firm, 2009-2014) and a Director of FMR and FMR Co., Inc. (investment adviser firms, 2007-2014).
* Determined to be an "Interested Trustee" by virtue of, among other things, his or her affiliation with the trust or various entities under common control with SelectCo.
+ The information includes the Trustee's principal occupation during the last five years and other information relating to the experience, attributes, and skills relevant to the Trustee's qualifications to serve as a Trustee, which led to the conclusion that the Trustee should serve as a Trustee for each fund.
Independent Trustees:
Correspondence intended for an Independent Trustee may be sent to Fidelity Investments, P.O. Box 55235, Boston, Massachusetts 02205-5235.
Name, Year of Birth; Principal Occupations and Other Relevant Experience+
Dennis J. Dirks (1948)
Year of Election or Appointment: 2018
Trustee
Mr. Dirks also serves as Trustee of other Fidelity® funds. Prior to his retirement in May 2003, Mr. Dirks was Chief Operating Officer and a member of the Board of The Depository Trust & Clearing Corporation (DTCC). He also served as President, Chief Operating Officer, and Board member of The Depository Trust Company (DTC) and President and Board member of the National Securities Clearing Corporation (NSCC). In addition, Mr. Dirks served as Chief Executive Officer and Board member of the Government Securities Clearing Corporation, Chief Executive Officer and Board member of the Mortgage-Backed Securities Clearing Corporation, as a Trustee and a member of the Finance Committee of Manhattan College (2005-2008), as a Trustee and a member of the Finance Committee of AHRC of Nassau County (2006-2008), as a member of the Independent Directors Council (IDC) Governing Council (2010-2015), and as a member of the Board of Directors for The Brookville Center for Children’s Services, Inc. (2009-2017). Mr. Dirks is a member of the Finance Committee (2016-present) and Board of Directors (2017-present) and is Treasurer (2018-present) of the Asolo Repertory Theatre.
Donald F. Donahue (1950)
Year of Election or Appointment: 2018
Trustee
Mr. Donahue also serves as a Trustee of other Fidelity® funds. Mr. Donahue is President and Chief Executive Officer of Miranda Partners, LLC (risk consulting for the financial services industry, 2012-present). Previously, Mr. Donahue served as a Member of the Advisory Board of certain Fidelity® funds (2015-2018) and Chief Executive Officer (2006-2012), Chief Operating Officer (2003-2006), and Managing Director, Customer Marketing and Development (1999-2003) of The Depository Trust & Clearing Corporation (financial markets infrastructure). Mr. Donahue serves as a Member (2007-present) and Co-Chairman (2016-present) of the Board of Directors of United Way of New York, Member of the Board of Directors of NYC Leadership Academy (2012-present) and Member of the Board of Advisors of Ripple Labs, Inc. (financial services, 2015-present). He also served as Chairman (2010-2012) and Member of the Board of Directors (2012-2013) of Omgeo, LLC (financial services), Treasurer of United Way of New York (2012-2016), and Member of the Board of Directors of XBRL US (financial services non-profit, 2009-2012) and the International Securities Services Association (2009-2012).
Alan J. Lacy (1953)
Year of Election or Appointment: 2018
Trustee
Mr. Lacy also serves as Trustee of other Fidelity® funds. Mr. Lacy serves as a Director of Bristol-Myers Squibb Company (global pharmaceuticals, 2008-present). He is a Trustee of the California Chapter of The Nature Conservancy (2015-present) and a Director of the Center for Advanced Study in the Behavioral Sciences at Stanford University (2015-present). In addition, Mr. Lacy served as Senior Adviser (2007-2014) of Oak Hill Capital Partners, L.P. (private equity) and also served as Chief Executive Officer (2005) and Vice Chairman (2005-2006) of Sears Holdings Corporation (retail) and Chief Executive Officer and Chairman of the Board of Sears, Roebuck and Co. (retail, 2000-2005). Previously, Mr. Lacy served as Chairman (2014-2017) and a member (2010-2017) of the Board of Directors of Dave & Buster’s Entertainment, Inc. (restaurant and entertainment complexes), as Chairman (2008-2011) and a member (2006-2015) of the Board of Trustees of the National Parks Conservation Association, and as a member of the Board of Directors for The Hillman Companies, Inc. (hardware wholesalers, 2010-2014), Earth Fare, Inc. (retail grocery, 2010-2014), and The Western Union Company (global money transfer, 2006-2011).
Ned C. Lautenbach (1944)
Year of Election or Appointment: 2018
Trustee
Chairman of the Independent Trustees
Mr. Lautenbach also serves as Trustee of other Fidelity® funds. Mr. Lautenbach currently serves as Chair (2018-present) and Member (2013-present) of the Board of Governors, State University System of Florida and is a member of the Council on Foreign Relations (1994-present). He is also a member and has most recently served as Chairman of the Board of Directors of Artis-Naples (2012-present). Previously, Mr. Lautenbach served as a member and then Lead Director of the Board of Directors of Eaton Corporation (diversified industrial, 1997-2016). He was also a Partner and Advisory Partner at Clayton, Dubilier & Rice, LLC (private equity investment, 1998-2010), as well as a Director of Sony Corporation (2006-2007). In addition, Mr. Lautenbach also had a 30-year career with IBM (technology company) during which time he served as Senior Vice President and a member of the Corporate Executive Committee (1968-1998).
Joseph Mauriello (1944)
Year of Election or Appointment: 2018
Trustee
Mr. Mauriello also serves as Trustee of other Fidelity® funds. Prior to his retirement in January 2006, Mr. Mauriello served in numerous senior management positions including Deputy Chairman and Chief Operating Officer (2004-2005), and Vice Chairman of Financial Services (2002-2004) of KPMG LLP US (professional services, 1965-2005). Mr. Mauriello currently serves as a member of the Independent Directors Council (IDC) Governing Council (2015-present). Previously, Mr. Mauriello served as a member of the Board of Directors of XL Group plc. (global insurance and re-insurance, 2006-2018).
Cornelia M. Small (1944)
Year of Election or Appointment: 2018
Trustee
Ms. Small also serves as Trustee of other Fidelity® funds. Ms. Small is a member of the Board of Directors (2009-present) and Chair of the Investment Committee (2010-present) of the Teagle Foundation. Ms. Small also serves on the Investment Committee of the Berkshire Taconic Community Foundation (2008-present). Previously, Ms. Small served as Chairperson (2002-2008) and a member of the Investment Committee and Chairperson (2008-2012) and a member of the Board of Trustees of Smith College. In addition, Ms. Small served as Chief Investment Officer, Director of Global Equity Investments, and a member of the Board of Directors of Scudder, Stevens & Clark and Scudder Kemper Investments.
Garnett A. Smith (1947)
Year of Election or Appointment: 2013
Trustee
Mr. Smith also serves as Trustee of other Fidelity® funds. Prior to Mr. Smith's retirement, he served as Chairman and Chief Executive Officer of Inbrand Corp. (manufacturer of personal absorbent products, 1990-1997). He also served as President (1986-1990) of Inbrand Corp. Prior to his employment with Inbrand Corp., he was employed by a retail fabric chain and North Carolina National Bank. In addition, Mr. Smith served as a Member of the Advisory Board of certain Fidelity® funds (2012-2013) and as a board member of the Jackson Hole Land Trust (2009-2012).
David M. Thomas (1949)
Year of Election or Appointment: 2018
Trustee
Mr. Thomas also serves as Trustee of other Fidelity® funds. Mr. Thomas serves as Non-Executive Chairman of the Board of Directors of Fortune Brands Home and Security (home and security products, 2011-present) and as a member of the Board of Directors (2004-present) and Presiding Director (2013-present) of Interpublic Group of Companies, Inc. (marketing communication). Previously, Mr. Thomas served as Executive Chairman (2005-2006) and Chairman and Chief Executive Officer (2000-2005) of IMS Health, Inc. (pharmaceutical and healthcare information solutions), a Director of Fortune Brands, Inc. (consumer products, 2000-2011), and a member of the Board of Trustees of the University of Florida (2013-2018).
Michael E. Wiley (1950)
Year of Election or Appointment: 2008
Trustee
Mr. Wiley also serves as Trustee or Member of the Advisory Board of other Fidelity® funds. Mr. Wiley serves as a Director of High Point Resources (exploration and production, 2005-present). Previously, Mr. Wiley served as a Director of Andeavor Corporation (independent oil refiner and marketer, 2005-2018), a Director of Andeavor Logistics LP (natural resources logistics, 2015-2018), a Director of Post Oak Bank (privately-held bank, 2004-2018), a Director of Asia Pacific Exploration Consolidated (international oil and gas exploration and production, 2008-2013), a member of the Board of Trustees of the University of Tulsa (2000-2006; 2007-2010), a Senior Energy Advisor of Katzenbach Partners, LLC (consulting, 2006-2007), an Advisory Director of Riverstone Holdings (private investment), a Director of Spinnaker Exploration Company (exploration and production, 2001-2005) and Chairman, President, and CEO of Baker Hughes, Inc. (oilfield services, 2000-2004).
+ The information includes the Trustee's principal occupation during the last five years and other information relating to the experience, attributes, and skills relevant to the Trustee's qualifications to serve as a Trustee, which led to the conclusion that the Trustee should serve as a Trustee for each fund.
Advisory Board Members and Officers:
Correspondence intended for a Member of the Advisory Board (if any) may be sent to Fidelity Investments, P.O. Box 55235, Boston, Massachusetts 02205-5235. Correspondence intended for an officer or Peter S. Lynch may be sent to Fidelity Investments, 245 Summer Street, Boston, Massachusetts 02210. Officers appear below in alphabetical order.
Name, Year of Birth; Principal Occupation
Vicki L. Fuller (1957)
Year of Election or Appointment: 2018
Member of the Advisory Board
Ms. Fuller also serves as Member of the Advisory Board of other Fidelity® funds. Ms. Fuller serves as a member of the Board of Directors, Audit Committee, and Nominating and Governance Committee of The Williams Companies, Inc. (natural gas infrastructure, 2018-present). Previously, Ms. Fuller served as the Chief Investment Officer of the New York State Common Retirement Fund (2012-2018) and held a variety of positions at AllianceBernstein L.P. (global asset management, 1985-2012), including Managing Director (2006-2012) and Senior Vice President and Senior Portfolio Manager (2001-2006).
Peter S. Lynch (1944)
Year of Election or Appointment: 2018
Member of the Advisory Board
Mr. Lynch also serves as Member of the Advisory Board of other Fidelity® funds. Mr. Lynch is Vice Chairman and a Director of FMR (investment adviser firm) and FMR Co., Inc. (investment adviser firm). In addition, Mr. Lynch serves as a Trustee of Boston College and as the Chairman of the Inner-City Scholarship Fund. Previously, Mr. Lynch served on the Special Olympics International Board of Directors (1997-2006).
Carol B. Tomé (1957)
Year of Election or Appointment: 2017
Member of the Advisory Board
Ms. Tomé also serves as Member of the Advisory Board of other Fidelity® funds. Ms. Tomé is Chief Financial Officer (2001-present) and Executive Vice President of Corporate Services (2007-present) of The Home Depot, Inc. (home improvement retailer) and a Director (2003-present) and Chair of the Audit Committee (2004-present) of United Parcel Service, Inc. (package delivery and supply chain management). Previously, Ms. Tomé served as Trustee of certain Fidelity® funds (2017), Senior Vice President of Finance and Accounting/Treasurer (2000-2007) and Vice President and Treasurer (1995-2000) of The Home Depot, Inc. and Chair of the Board (2010-2012), Vice Chair of the Board (2009 and 2013), and a Director (2008-2013) of the Federal Reserve Bank of Atlanta. Ms. Tomé is also a director or trustee of many community and professional organizations.
Elizabeth Paige Baumann (1968)
Year of Election or Appointment: 2017
Anti-Money Laundering (AML) Officer
Ms. Baumann also serves as AML Officer of other funds. She is Chief AML Officer (2012-present) and Senior Vice President (2014-present) of FMR LLC (diversified financial services company) and is an employee of Fidelity Investments. Previously, Ms. Baumann served as AML Officer of the funds (2012-2016), and Vice President (2007-2014) and Deputy Anti-Money Laundering Officer (2007-2012) of FMR LLC.
Craig S. Brown (1977)
Year of Election or Appointment: 2019
Assistant Treasurer
Mr. Brown also serves as Assistant Treasurer of other funds. Mr. Brown is an employee of Fidelity Investments (2013-present).
John J. Burke III (1964)
Year of Election or Appointment: 2018
Chief Financial Officer
Mr. Burke also serves as Chief Financial Officer of other funds. Mr. Burke serves as Head of Investment Operations for Fidelity Fund and Investment Operations (2018-present) and is an employee of Fidelity Investments (1998-present). Previously Mr. Burke served as head of Asset Management Investment Operations (2012-2018).
William C. Coffey (1969)
Year of Election or Appointment: 2018
Secretary and Chief Legal Officer (CLO)
Mr. Coffey also serves as Secretary and CLO of other funds. Mr. Coffey serves as CLO, Secretary, and Senior Vice President of Fidelity Management & Research Company and FMR Co., Inc. (investment adviser firms, 2018-present); Secretary of Fidelity SelectCo, LLC and Fidelity Investments Money Management, Inc. (investment adviser firms, 2018-present); and CLO of Fidelity Management & Research (Hong Kong) Limited, FMR Investment Management (UK) Limited, and Fidelity Management & Research (Japan) Limited (investment adviser firms, 2018-present). He is Senior Vice President and Deputy General Counsel of FMR LLC (diversified financial services company, 2010-present), and is an employee of Fidelity Investments. Previously, Mr. Coffey served as Assistant Secretary of certain funds (2009-2018) and as Vice President and Associate General Counsel of FMR LLC (2005-2009).
Timothy M. Cohen (1969)
Year of Election or Appointment: 2018
Vice President
Mr. Cohen also serves as Vice President of other funds. Mr. Cohen serves as Co-Head of Global Equity Research (2016-present), a Director of Fidelity Management & Research (Japan) Limited (investment adviser firm, 2016-present), and is an employee of Fidelity Investments. Previously, Mr. Cohen served as Chief Investment Officer - Equity and a Director of Fidelity Management & Research (U.K.) Inc. (investment adviser firm, 2013-2015) and as a Director of Fidelity Management & Research (Hong Kong) Limited (investment adviser firm, 2017).
Jonathan Davis (1968)
Year of Election or Appointment: 2010
Assistant Treasurer
Mr. Davis also serves as Assistant Treasurer of other funds. Mr. Davis serves as Assistant Treasurer of FMR Capital, Inc. (2017-present) and is an employee of Fidelity Investments. Previously, Mr. Davis served as Vice President and Associate General Counsel of FMR LLC (diversified financial services company, 2003-2010).
Adrien E. Deberghes (1967)
Year of Election or Appointment: 2018
Assistant Treasurer
Mr. Deberghes also serves as an officer of other funds. He serves as Assistant Treasurer of FMR Capital, Inc. (2017-present), Executive Vice President of Fidelity Investments Money Management, Inc. (FIMM) (investment adviser firm, 2016-present), and is an employee of Fidelity Investments (2008-present). Previously, Mr. Deberghes served as President and Treasurer of certain Fidelity® funds (2013-2018). Prior to joining Fidelity Investments, Mr. Deberghes was Senior Vice President of Mutual Fund Administration at State Street Corporation (2007-2008), Senior Director of Mutual Fund Administration at Investors Bank & Trust (2005-2007), and Director of Finance for Dunkin' Brands (2000-2005). Previously, Mr. Deberghes served in other fund officer roles.
Laura M. Del Prato (1964)
Year of Election or Appointment: 2018
Assistant Treasurer
Ms. Del Prato also serves as an officer of other funds. Ms. Del Prato is an employee of Fidelity Investments (2017-present). Prior to joining Fidelity Investments, Ms. Del Prato served as a Managing Director and Treasurer of the JPMorgan Mutual Funds (2014-2017). Prior to JPMorgan, Ms. Del Prato served as a partner at Cohen Fund Audit Services (accounting firm, 2012-2013) and KPMG LLP (accounting firm, 2004-2012).
Colm A. Hogan (1973)
Year of Election or Appointment: 2018
Deputy Treasurer
Mr. Hogan also serves as an officer of other funds. Mr. Hogan serves as Assistant Treasurer of FMR Capital, Inc. (2017-present) and is an employee of Fidelity Investments (2005-present). Previously, Mr. Hogan served as Assistant Treasurer of certain Fidelity® funds (2016-2018).
Pamela R. Holding (1964)
Year of Election or Appointment: 2018
Vice President
Ms. Holding also serves as Vice President of other funds. Ms. Holding serves as Co-Head of Global Equity Research (2018-present) and is an employee of Fidelity Investments (2013-present).
Chris Maher (1972)
Year of Election or Appointment: 2013
Assistant Treasurer
Mr. Maher serves as Assistant Treasurer of other funds. Mr. Maher is Vice President of Valuation Oversight, serves as Assistant Treasurer of FMR Capital, Inc. (2017-present), and is an employee of Fidelity Investments. Previously, Mr. Maher served as Vice President of Asset Management Compliance (2013), Vice President of the Program Management Group of FMR (investment adviser firm, 2010-2013), and Vice President of Valuation Oversight (2008-2010).
Kenneth B. Robins (1969)
Year of Election or Appointment: 2018
Chief Compliance Officer
Mr. Robins also serves as an officer of other funds. Mr. Robins serves as Compliance Officer of Fidelity Management & Research Company and FMR Co., Inc. (investment adviser firms, 2016-present) and is an employee of Fidelity Investments (2004-present). Previously, Mr. Robins served as Executive Vice President of Fidelity Investments Money Management, Inc. (investment adviser firm, 2013-2016) and served in other fund officer roles.
Stacie M. Smith (1974)
Year of Election or Appointment: 2018
President and Treasurer
Ms. Smith also serves as an officer of other funds. Ms. Smith serves as Assistant Treasurer of FMR Capital, Inc. (2017-present), is an employee of Fidelity Investments (2009-present), and has served in other fund officer roles. Prior to joining Fidelity Investments, Ms. Smith served as Senior Audit Manager of Ernst & Young LLP (accounting firm, 1996-2009). Previously, Ms. Smith served as Assistant Treasurer (2013-2018) and Deputy Treasurer (2013-2016) of certain Fidelity® funds.
Marc L. Spector (1972)
Year of Election or Appointment: 2017
Assistant Treasurer
Mr. Spector also serves as an officer of other funds. Mr. Spector serves as Assistant Treasurer of FMR Capital, Inc. (2017-present) and is an employee of Fidelity Investments (2016-present). Prior to joining Fidelity Investments, Mr. Spector served as Director at the Siegfried Group (accounting firm, 2013-2016), and prior to Siegfried Group as audit senior manager at Deloitte & Touche (accounting firm, 2005-2013).
Jim Wegmann (1979)
Year of Election or Appointment: 2019
Assistant Treasurer
Mr. Wegmann also serves as Assistant Treasurer of other funds. Mr. Wegmann is an employee of Fidelity Investments (2011-present).
Shareholder Expense Example
As a shareholder of a Fund, you incur two types of costs: (1) transaction costs, including sales charges (loads) on purchase payments or redemption proceeds, and (2) ongoing costs, including management fees, distribution and/or service (12b-1) fees and other Fund expenses. This Example is intended to help you understand your ongoing costs (in dollars) of investing in the Funds and to compare these costs with the ongoing costs of investing in other mutual funds.
The actual expense Example is based on an investment of $1,000 invested at the beginning of the period and held for the entire period (September 1, 2018 to February 28, 2019) for Class A, Class M, Class C, Chemicals, Gold, Materials and Class I and for the period (October 2, 2018 to February 28, 2019) for Class Z. The hypothetical expense Example is based on an investment of $1,000 invested for the one-half year period (September 1, 2018 to February 28, 2019).
Actual Expenses
The first line of the accompanying table for each class of the Fund provides information about actual account values and actual expenses. You may use the information in this line, together with the amount you invested, to estimate the expenses that you paid over the period. Simply divide your account value by $1,000.00 (for example, an $8,600 account value divided by $1,000.00 = 8.6), then multiply the result by the number in the first line for a class of the Fund under the heading entitled "Expenses Paid During Period" to estimate the expenses you paid on your account during this period. In addition, the Fund, as a shareholder in the underlying Fidelity Central Funds, will indirectly bear its pro-rata share of the fees and expenses incurred by the underlying Fidelity Central Funds. These fees and expenses are not included in the Fund's annualized expense ratio used to calculate the expense estimate in the table below.
Hypothetical Example for Comparison Purposes
The second line of the accompanying table for each class of the Fund provides information about hypothetical account values and hypothetical expenses based on a Class' actual expense ratio and an assumed rate of return of 5% per year before expenses, which is not the Class' actual return. The hypothetical account values and expenses may not be used to estimate the actual ending account balance or expenses you paid for the period. You may use this information to compare the ongoing costs of investing in the Fund and other funds. To do so, compare this 5% hypothetical example with the 5% hypothetical examples that appear in the shareholder reports of the other funds. In addition, the Fund, as a shareholder in the underlying Fidelity Central Funds, will indirectly bear its pro-rata share of the fees and expenses incurred by the underlying Fidelity Central Funds. These fees and expenses are not included in the Fund's annualized expense ratio used to calculate the expense estimate in the table below.
Please note that the expenses shown in the table are meant to highlight your ongoing costs only and do not reflect any transaction costs. Therefore, the second line of the table is useful in comparing ongoing costs only, and will not help you determine the relative total costs of owning different funds. In addition, if these transactional costs were included, your costs would have been higher.
| | Annualized Expense Ratio-A | Beginning
Account Value
| Ending
Account Value
February 28, 2019 | Expenses Paid
During Period
|
| Chemicals Portfolio | .78% | | | |
| Actual | | $1,000.00 | $869.70 | $3.62-B |
| Hypothetical-C | | $1,000.00 | $1,020.93 | $3.91-D |
| Gold Portfolio | | | | |
| Class A | 1.17% | | | |
| Actual | | $1,000.00 | $1,176.60 | $6.31-B |
| Hypothetical-C | | $1,000.00 | $1,018.99 | $5.86-D |
| Class M | 1.46% | | | |
| Actual | | $1,000.00 | $1,175.20 | $7.87-B |
| Hypothetical-C | | $1,000.00 | $1,017.55 | $7.30-D |
| Class C | 1.84% | | | |
| Actual | | $1,000.00 | $1,173.60 | $9.92-B |
| Hypothetical-C | | $1,000.00 | $1,015.67 | $9.20-D |
| Gold | .85% | | | |
| Actual | | $1,000.00 | $1,179.30 | $4.59-B |
| Hypothetical-C | | $1,000.00 | $1,020.58 | $4.26-D |
| Class I | .81% | | | |
| Actual | | $1,000.00 | $1,179.30 | $4.38-B |
| Hypothetical-C | | $1,000.00 | $1,020.78 | $4.06-D |
| Class Z | .68% | | | |
| Actual | | $1,000.00 | $1,148.00 | $3.00-B |
| Hypothetical-C | | $1,000.00 | $1,021.42 | $3.41-D |
| Materials Portfolio | | | | |
| Class A | 1.07% | | | |
| Actual | | $1,000.00 | $884.80 | $5.00-B |
| Hypothetical-C | | $1,000.00 | $1,019.49 | $5.36-D |
| Class M | 1.36% | | | |
| Actual | | $1,000.00 | $883.50 | $6.35-B |
| Hypothetical-C | | $1,000.00 | $1,018.05 | $6.81-D |
| Class C | 1.82% | | | |
| Actual | | $1,000.00 | $881.50 | $8.49-B |
| Hypothetical-C | | $1,000.00 | $1,015.77 | $9.10-D |
| Materials | .80% | | | |
| Actual | | $1,000.00 | $886.00 | $3.74-B |
| Hypothetical-C | | $1,000.00 | $1,020.83 | $4.01-D |
| Class I | .79% | | | |
| Actual | | $1,000.00 | $886.10 | $3.69-B |
| Hypothetical-C | | $1,000.00 | $1,020.88 | $3.96-D |
| Class Z | .62% | | | |
| Actual | | $1,000.00 | $926.50 | $2.45-B |
| Hypothetical-C | | $1,000.00 | $1,021.72 | $3.11-D |
A Annualized expense ratio reflects expenses net of applicable fee waivers.
B Actual expenses are equal to each Class' annualized expense ratio, multiplied by the average account value over the period, multiplied by 181/365 (to reflect the one-half year), for Class A, Class M, Class C, Chemicals, Gold, Materials and Class I and multiplied by 150/365 to reflect the period (October 2, 2018 to February 28, 2019) for Class Z.
C 5% return per year before expenses
D Hypothetical expenses are equal to each Class' annualized expense ratio, multiplied by the average account value over the period, multiplied by 181/365 (to reflect the one-half year period).
Distributions (Unaudited)
The Board of Trustees of each fund voted to pay to shareholders of record at the opening of business on record date, the following distributions per share derived from capital gains realized from sales of portfolio securities and dividends derived from net investment income:
| | Pay Date | Record Date | Dividends | Capital Gains |
| | | | | |
| Chemicals Portfolio | 04/15/19 | 04/12/19 | $0.0350 | $0.403 |
| Gold Portfolio | | | | |
| Class A | 04/15/19 | 04/12/19 | $0.000 | $0.000 |
| Class M | 04/15/19 | 04/12/19 | $0.000 | $0.000 |
| Class C | 04/15/19 | 04/12/19 | $0.000 | $0.000 |
| Gold | 04/15/19 | 04/12/19 | $0.000 | $0.000 |
| Class I | 04/15/19 | 04/12/19 | $0.000 | $0.000 |
| Class Z | 04/15/19 | 04/12/19 | $0.000 | $0.000 |
| Materials Portfolio | | | | |
| Class A | 04/15/19 | 04/12/19 | $0.000 | $0.000 |
| Class M | 04/15/19 | 04/12/19 | $0.000 | $0.000 |
| Class C | 04/15/19 | 04/12/19 | $0.000 | $0.000 |
| Materials | 04/15/19 | 04/12/19 | $0.000 | $0.000 |
| Class I | 04/15/19 | 04/12/19 | $0.000 | $0.000 |
| Class Z | 04/15/19 | 04/12/19 | $0.000 | $0.000 |
|
The funds hereby designate as capital gain dividend the amounts noted below for the taxable year ended February 28, 2019, or, if subsequently determined to be different, the net capital gain of such year.
| Chemicals Portfolio | $98,749,575 |
| Materials Portfolio | $60,673,051 |
|
A percentage of the dividends distributed during the fiscal year for the following funds qualify for the dividends–received deduction for corporate shareholders:
| | April 2018 | December 2018 |
| Chemicals Portfolio | 100% | 100% |
| Gold Portfolio | | |
| Class A | – | – |
| Class M | – | – |
| Class C | – | – |
| Gold | – | – |
| Class I | – | – |
| Class Z | – | – |
| Materials Portfolio | | |
| Class A | 100% | 100% |
| Class M | 100% | 100% |
| Class C | – | 100% |
| Materials | 100% | 100% |
| Class I | 100% | 100% |
| Class Z | – | 100% |
|
A percentage of the dividends distributed during the fiscal year for the following funds may be taken into account as a dividend for purposes of the maximum rate under section 1(h)(11) of the Internal Revenue Code.
| | April 2018 | December 2018 |
| Chemicals Portfolio | 100% | 100% |
| Gold Portfolio | | |
| Class A | – | – |
| Class M | – | – |
| Class C | – | – |
| Gold | – | – |
| Class I | – | – |
| Class Z | – | – |
| Materials Portfolio | | |
| Class A | 100% | 100% |
| Class M | 100% | 100% |
| Class C | – | 100% |
| Materials | 100% | 100% |
| Class I | 100% | 100% |
| Class Z | – | 100% |
|
The funds will notify shareholders in January 2020 of amounts for use in preparing 2019 income tax returns.
Board Approval of Investment Advisory Contracts and Management Fees
Chemicals Portfolio
Gold Portfolio
Materials Portfolio
Each year, the Board of Trustees, including the Independent Trustees (together, the Board), votes on the renewal of the management contract with Fidelity SelectCo, LLC (SelectCo), an affiliate of Fidelity Management & Research Company (FMR), and the sub-advisory agreements with affiliates of FMR (together, the Advisory Contracts) for each fund. SelectCo and the sub-advisers are referred to herein as the Investment Advisers. The Board, assisted by the advice of fund counsel and Independent Trustees' counsel, requests and considers a broad range of information relevant to the renewal of the Advisory Contracts throughout the year.
The Board meets regularly and, at each of its meetings, covers an extensive agenda of topics and materials and considers factors that are relevant to its annual consideration of the renewal of each fund's Advisory Contracts, including the services and support provided to each fund and its shareholders. The Board has established various standing committees (Committees), each composed of and chaired by Independent Trustees with varying backgrounds, to which the Board has assigned specific subject matter responsibilities in order to enhance effective decision-making by the Board. The Board, acting directly and through its Committees, requests and receives information concerning the annual consideration of the renewal of each fund's Advisory Contracts. The Board also meets as needed to review matters specifically related to the Board's annual consideration of the renewal of the Advisory Contracts. Members of the Board may also meet with trustees of other Fidelity funds through joint ad hoc committees to discuss certain matters relevant to all of the Fidelity funds.
At its January 2019 meeting, the Board unanimously determined to renew each fund's Advisory Contracts. In reaching its determination, the Board considered all factors it believed relevant, including (i) the nature, extent, and quality of the services to be provided to each fund and its shareholders (including the investment performance of each fund); (ii) the competitiveness of each fund's management fee and total expense ratio relative to peer funds; (iii) the total costs of the services to be provided by and the profits to be realized by Fidelity from its relationships with each fund; and (iv) the extent to which, if any, economies of scale exist and would be realized as each fund grows, and whether any economies of scale are appropriately shared with fund shareholders.
In considering whether to renew the Advisory Contracts for each fund, the Board reached a determination, with the assistance of fund counsel and Independent Trustees' counsel and through the exercise of its business judgment, that the renewal of the Advisory Contracts was in the best interests of each fund and its shareholders and that the compensation payable under the Advisory Contracts was fair and reasonable. The Board's decision to renew the Advisory Contracts was not based on any single factor, but rather was based on a comprehensive consideration of all the information provided to the Board at its meetings throughout the year. The Board, in reaching its determination to renew the Advisory Contracts, was aware that shareholders of each fund have a broad range of investment choices available to them, including a wide choice among funds offered by Fidelity's competitors, and that each fund's shareholders, who have the opportunity to review and weigh the disclosure provided by the fund in its prospectus and other public disclosures, have chosen to invest in that fund, which is part of the Fidelity family of funds.
Nature, Extent, and Quality of Services Provided. The Board considered Fidelity's staffing as it relates to the funds, including the backgrounds of investment personnel of Fidelity, and also considered the funds' investment objectives, strategies, and related investment philosophies. The Independent Trustees also had discussions with senior management of Fidelity's investment operations and investment groups. The Board considered the structure of the investment personnel compensation program and whether this structure provides appropriate incentives to act in the best interests of each fund. Additionally, the Board considered the portfolio managers' investments, if any, in the funds that they manage.
Resources Dedicated to Investment Management and Support Services. The Board and the Fund Oversight and Research Committees reviewed the general qualifications and capabilities of Fidelity's investment staff, including its size, education, experience, and resources, as well as Fidelity's approach to recruiting, training, managing, and compensating investment personnel. The Board noted that Fidelity has continued to increase the resources devoted to non-U.S. offices, including expansion of Fidelity's global investment organization. The Board also noted that Fidelity's analysts have extensive resources, tools and capabilities that allow them to conduct sophisticated quantitative and fundamental analysis, as well as credit analysis of issuers, counterparties and guarantors. Further, the Board considered that Fidelity's investment professionals have sufficient access to global information and data so as to provide competitive investment results over time, and that those professionals also have access to sophisticated tools that permit them to assess portfolio construction and risk and performance attribution characteristics continuously, as well as to transmit new information and research conclusions rapidly around the world. Additionally, in its deliberations, the Board considered Fidelity's trading, risk management, compliance, and technology and operations capabilities and resources, which are integral parts of the investment management process.
Shareholder and Administrative Services. The Board considered (i) the nature, extent, quality, and cost of advisory, administrative, and shareholder services performed by the Investment Advisers and their affiliates under the Advisory Contracts and under separate agreements covering transfer agency, pricing and bookkeeping, and securities lending services for each fund; (ii) the nature and extent of the supervision of third party service providers, principally custodians, subcustodians, and pricing vendors; and (iii) the resources devoted to, and the record of compliance with, each fund's compliance policies and procedures. The Board also reviewed the allocation of fund brokerage, including allocations to brokers affiliated with the Investment Advisers, the use of brokerage commissions to pay fund expenses, and the use of "soft" commission dollars to pay for research services.
The Board noted that the growth of fund assets over time across the complex allows Fidelity to reinvest in the development of services designed to enhance the value and convenience of the Fidelity funds as investment vehicles. These services include 24-hour access to account information and market information through telephone representatives and over the Internet, investor education materials and asset allocation tools, and the expanded availability of Fidelity Investor Centers.
The Board noted that it and the boards of certain other Fidelity funds had formed an ad hoc Committee on Transfer Agency Fees to review the variety of transfer agency fee structures throughout the industry and Fidelity's competitive positioning with respect to industry participants.
Investment in a Large Fund Family. The Board considered the benefits to shareholders of investing in a Fidelity fund, including the benefits of investing in a fund that is part of a large family of funds offering a variety of investment disciplines and providing a large variety of mutual fund investor services. The Board noted that Fidelity had taken, or had made recommendations that resulted in the Fidelity funds taking, a number of actions over the previous year that benefited particular funds, including: (i) continuing to dedicate additional resources to Fidelity's investment research process, which includes meetings with management of issuers of securities in which the funds invest, and to the support of the senior management team that oversees asset management; (ii) continuing efforts to enhance Fidelity's global research capabilities; (iii) launching new funds and making other enhancements to meet client needs; (iv) launching new share classes of existing funds; (v) eliminating purchase minimums and broadening eligibility requirements for certain funds and share classes; (vi) reducing management fees and total expenses for certain growth equity funds and index funds; (vii) lowering expense caps for certain existing funds and classes, and converting certain voluntary expense caps to contractual caps, to reduce expenses borne by shareholders; (viii) eliminating short-term redemption fees for funds that had such fees; (ix) rationalizing product lines and gaining increased efficiencies from fund mergers and share class consolidations; (x) continuing to develop, acquire and implement systems and technology to improve services to the funds and shareholders, strengthen information security, and increase efficiency; and (xi) continuing to implement enhancements to further strengthen Fidelity's product line to increase investors' probability of success in achieving their investment goals, including retirement income goals.
Investment Performance. The Board considered whether each fund has operated in accordance with its investment objective, as well as its record of compliance with its investment restrictions and its performance history. Gold Portfolio had a portfolio manager change in September 2018 and Materials Portfolio had a portfolio manager change in November 2017. The Board will continue to monitor closely each fund's performance, taking into account the portfolio manager changes.
The Board took into account discussions that occur at Board meetings throughout the year with representatives of the Investment Advisers about fund investment performance. In this regard the Board noted that as part of regularly scheduled fund reviews and other reports to the Board on fund performance, the Board considers annualized return information for each fund for different time periods, measured against an appropriate securities market index ("benchmark index"). In its evaluation of fund investment performance, the Board gave particular attention to information indicating changes in performance of certain Fidelity funds for specific time periods and discussed with the Investment Advisers the reasons for any overperformance or underperformance.
In addition to reviewing absolute and relative fund performance, the Independent Trustees periodically consider the appropriateness of fund performance metrics in evaluating the results achieved. In general, the Independent Trustees believe that fund performance should be evaluated based on net performance (after fees and expenses) of both the highest performing and lowest performing fund share classes, where applicable, compared to appropriate benchmark indices, over appropriate time periods that may include full market cycles, taking into account relevant factors including the following: general market conditions; issuer-specific information; and fund cash flows and other factors.
The Independent Trustees recognize that shareholders evaluate performance on a net basis over their own holding periods, for which one-, three-, and five-year periods are often used as a proxy. For this reason, the performance information reviewed by the Board also included net cumulative total return information for each fund and an appropriate benchmark index for the most recent one-, three-, and five-year periods ended June 30, 2018, as shown below.
Chemicals Portfolio
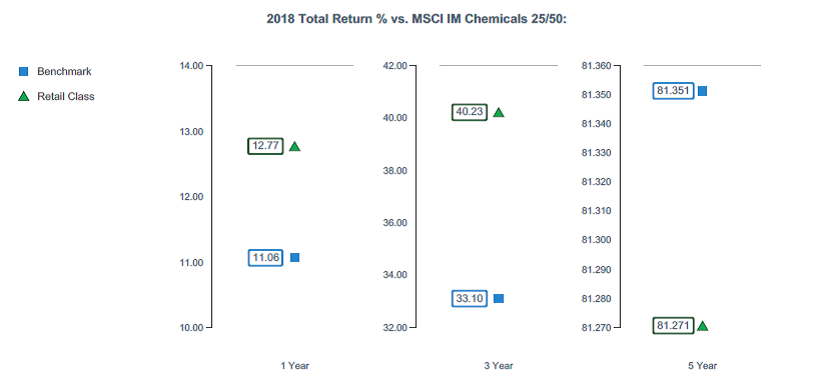
Gold Portfolio
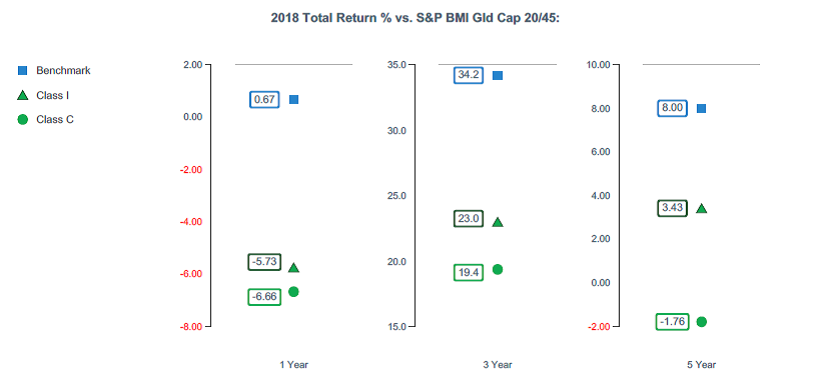
The Board considered the fund's underperformance for different time periods based on the June 30, 2018 data presented above and based on earlier periods ended prior to June 30, 2018. The Board's discussions with SelectCo regarding underperformance cover topics including, but not limited to: the longer-term track record of a fund's portfolio manager(s); broader trends in the market that may adversely impact a fund's performance; attribution reports on contributors to the fund's underperformance; and the applicable portfolio manager's explanation of his or her underperformance. The Board engages with SelectCo on steps that might be taken to address a fund's underperformance.
Materials Portfolio
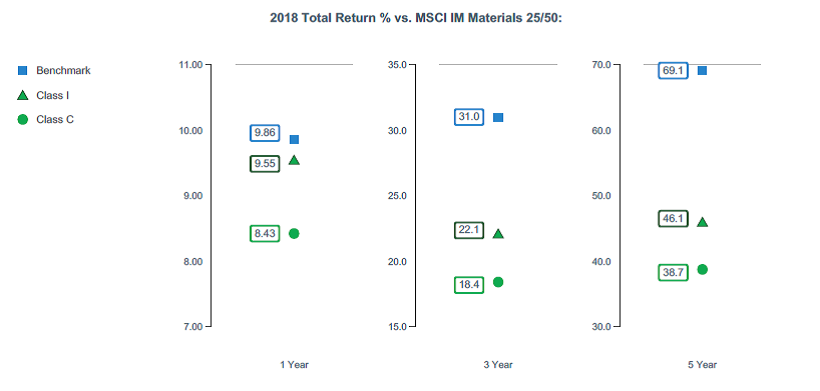
The Board considered the fund's underperformance for different time periods based on the June 30, 2018 data presented above and based on earlier periods ended prior to June 30, 2018. The Board noted that the fund's underperformance has continued since the Board approved the management contract in 2017 and 2018. The Board's discussions with SelectCo regarding underperformance cover topics including, but not limited to: the longer-term track record of a fund's portfolio manager(s); broader trends in the market that may adversely impact a fund's performance; attribution reports on contributors to the fund's underperformance; and the applicable portfolio manager's explanation of his or her underperformance. The Board engages with SelectCo on steps that might be taken to address a fund's underperformance. For a fund with underperformance over longer periods of time, the Board typically monitors the effect of any remedial actions and other relevant factors.
Based on its review, the Board concluded that the nature, extent, and quality of services provided to each fund under the Advisory Contracts should continue to benefit the shareholders of each fund.
Competitiveness of Management Fee and Total Expense Ratio. The Board considered each fund's management fee and total expense ratio compared to "mapped groups" of competitive funds and classes created for the purpose of facilitating the Trustees' competitive analysis of management fees and total expenses. Fidelity creates "mapped groups" by combining similar Lipper investment objective categories that have comparable investment mandates. For this purpose, all sector focused equity funds are grouped in the same mapped group. Combining Lipper investment objective categories aids the Board's management fee and total expense ratio comparisons by broadening the competitive group used for comparison.
Management Fee. The Board considered two proprietary management fee comparisons for the 12-month periods ended June 30 shown in basis points (BP) in the charts below. The group of Lipper funds used by the Board for management fee comparisons is referred to below as the "Total Mapped Group." The Total Mapped Group comparison focuses on a fund's standing in terms of gross management fees before expense reimbursements or caps relative to the total universe of funds with comparable investment mandates (i.e., sector equities), regardless of whether their management fee structures also are comparable. Funds with comparable management fee structures have similar management fee contractual arrangements (
e.g., flat rate charged for advisory services, all-inclusive fee rate,
etc.). "TMG %" represents the percentage of funds in the Total Mapped Group that had management fees that were lower than a fund's. For example, a hypothetical TMG % of 20% would mean that 80% of the funds in the Total Mapped Group had higher, and 20% had lower, management fees than a fund. The funds' actual TMG %s and the number of funds in the Total Mapped Group are in the charts below. The "Asset-Size Peer Group" (ASPG) comparison focuses on a fund's standing relative to a subset of non-Fidelity funds within the Total Mapped Group that are similar in size and management fee structure. For example, if a fund is in the first quartile of the ASPG, the fund's management fee ranks in the least expensive or lowest 25% of funds in the ASPG. The ASPG represents at least 15% of the funds in the Total Mapped Group with comparable asset size and management fee structures, subject to a minimum of 50 funds (or all funds in the Total Mapped Group if fewer than 50). Additional information, such as the ASPG quartile in which a fund's management fee rate ranked, is also included in the charts and was considered by the Board.
Chemicals Portfolio

Gold Portfolio
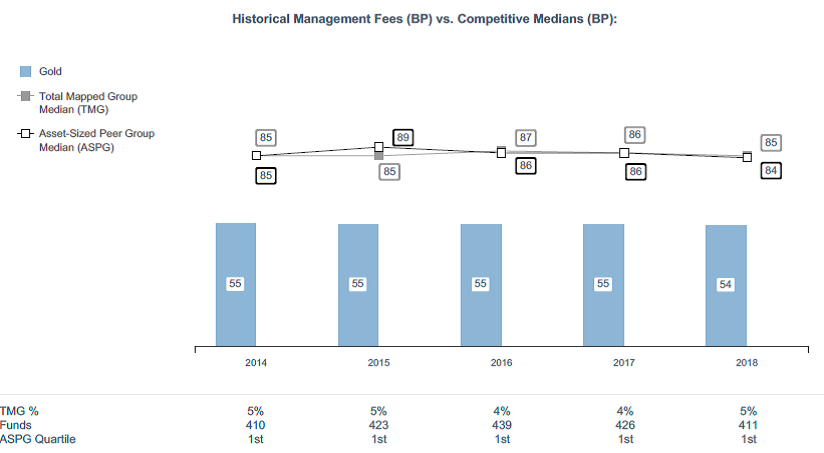
Materials Portfolio
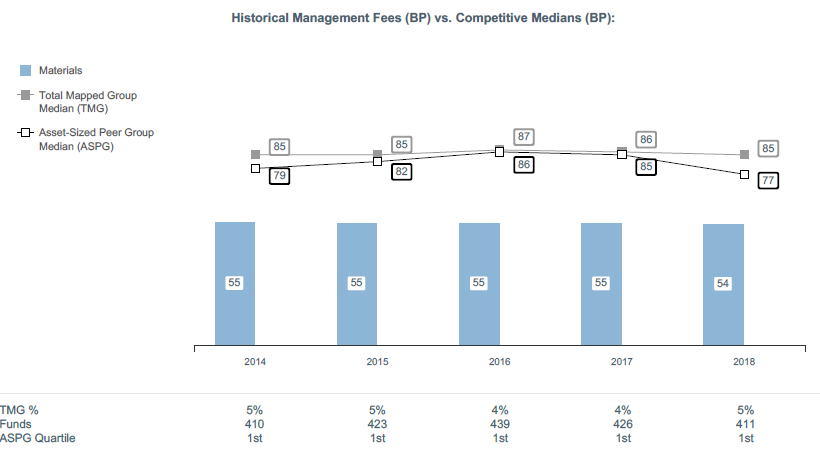
The Board noted that each fund's management fee rate ranked below the median of its Total Mapped Group and below the median of its ASPG for the 12-month period ended June 30, 2018.
The Board noted that it and the boards of other Fidelity funds formed an ad hoc Committee on Group Fee, which meets periodically, to conduct an in-depth review of the "group fee" component of the management fee of funds with such management fee structures. The Committee's focus included the mechanics of the group fee, the competitive landscape of group fee structures, Fidelity funds with no group fee component and investment products not included in group fee assets. The Board also considered that, for funds subject to the group fee, FMR agreed to voluntarily waive fees over a specified period of time in amounts designed to account for assets converted from certain funds to certain collective investment trusts.
Based on its review, the Board concluded that each fund's management fee is fair and reasonable in light of the services that the fund receives and the other factors considered.
Total Expense Ratio. In its review of Chemicals Portfolio's total expense ratio, the Board considered the fund's management fee rate as well as other fund expenses, such as transfer agent fees, pricing and bookkeeping fees, and custodial, legal, and audit fees. The Board also noted that Fidelity may agree to waive fees and expenses from time to time, and the extent to which, if any, it has done so for the fund. As part of its review, the Board also considered the current and historical total expense ratios of the fund compared to competitive fund median expenses. The fund is compared to those funds and classes in the Total Mapped Group (used by the Board for management fee comparisons) that have a similar sales load structure.
In its review of the total expense ratio of each class of Gold Portfolio and Materials Portfolio, the Board considered the fund's management fee rate as well as other fund or class expenses, as applicable, such as transfer agent fees, pricing and bookkeeping fees, fund-paid 12b-1 fees, and custodial, legal, and audit fees. The Board also noted that Fidelity may agree to waive fees and expenses from time to time, and the extent to which, if any, it has done so for each fund. As part of its review, the Board also considered the current and historical total expense ratios of each class of each fund compared to competitive fund median expenses. Each class of each fund is compared to those funds and classes in the Total Mapped Group (used by the Board for management fee comparisons) that have a similar sales load structure.
For Chemicals Portfolio, the Board noted that the total expense ratio ranked below the competitive median for the 12-month period ended June 30, 2018.
For Materials Portfolio, the Board noted that the total expense ratio of each class ranked below the competitive median for the 12-month period ended June 30, 2018.
For Gold Portfolio, the Board noted that the total expense ratio of each of Class A, Class C, Class I, and the retail class ranked below the competitive median for the 12-month period ended June 30, 2018, and the total expense ratio of Class M ranked above the competitive median for the 12-month period ended June 30, 2018. The Board considered that, in general, various factors can affect total expense ratios. The Board noted that the total expense ratio of Class M was above the competitive median primarily because of higher 12b-1 fees on Class M as compared to most competitor funds. Class M has a higher 12b-1 fee, but a lower front-end sales charge, than traditionally priced front-end sales charge classes. The Board considered that Class M is primarily sold load-waived to retirement plans and intermediary wrap programs where its 0.50% 12b-1 fee is comparable to competing no-load, higher 12b-1 fee classes designed specifically for retirement plans and wrap programs. The Board noted that, when compared with competitor funds that charge a 0.50% 12b-1 fee, the total expense ratio of Class M is below median. The Board noted that the fund offers multiple classes, each of which has a different sales load and 12b-1 fee structure, and that the multiple structures are intended to offer a range of pricing options for the intermediary market. The Board also noted that the total expense ratios of the classes of the fund vary primarily by the level of their 12b-1 fees, although differences in transfer agent fees may also cause expenses to vary from class to class.
Fees Charged to Other Fidelity Clients. The Board also considered Fidelity fee structures and other information with respect to clients of Fidelity, such as other funds advised or subadvised by Fidelity, pension plan clients, and other institutional clients with similar mandates. The Board noted that a joint ad hoc committee created by it and the boards of other Fidelity funds periodically reviews and compares Fidelity's institutional investment advisory business with its business of providing services to the Fidelity funds and also noted the most recent findings of the committee. The Board noted that the committee's review included a consideration of the differences in services provided, fees charged, and costs incurred, as well as competition in the markets serving the different categories of clients.
Based on its review of total expense ratios and fees charged to other Fidelity clients, the Board concluded that the total expense ratio of each class of each fund was reasonable in light of the services that the fund and its shareholders receive and the other factors considered.
Costs of the Services and Profitability. The Board considered the revenues earned and the expenses incurred by Fidelity in conducting the business of developing, marketing, distributing, managing, administering and servicing each fund and servicing each fund's shareholders. The Board also considered the level of Fidelity's profits in respect of all the Fidelity funds.
On an annual basis, Fidelity presents to the Board information about the profitability of its relationships with each fund. Fidelity calculates profitability information for each fund, as well as aggregate profitability information for groups of Fidelity funds and all Fidelity funds, using a series of detailed revenue and cost allocation methodologies which originate with the books and records of Fidelity on which Fidelity's audited financial statements are based. The Audit Committee of the Board reviews any significant changes from the prior year's methodologies.
PricewaterhouseCoopers LLP (PwC), auditor to Fidelity and certain Fidelity funds, has been engaged annually by the Board as part of the Board's assessment of Fidelity's profitability analysis. PwC's engagement includes the review and assessment of the methodologies used by Fidelity in determining the revenues and expenses attributable to Fidelity's mutual fund business, and completion of agreed-upon procedures in respect of the mathematical accuracy of the fund profitability information and its conformity to established allocation methodologies. After considering PwC's reports issued under the engagement and information provided by Fidelity, the Board concluded that while other allocation methods may also be reasonable, Fidelity's profitability methodologies are reasonable in all material respects.
The Board also reviewed Fidelity's non-fund businesses and potential indirect benefits such businesses may have received as a result of their association with Fidelity's mutual fund business (i.e., fall-out benefits) as well as cases where Fidelity's affiliates may benefit from the funds' business. The Board noted that changes to fall-out benefits year-over-year reflect business developments at Fidelity's various businesses.
The Board considered the costs of the services provided by and the profits realized by Fidelity in connection with the operation of each fund and was satisfied that the profitability was not excessive.
Economies of Scale. The Board considered whether there have been economies of scale in respect of the management of the Fidelity funds, whether the Fidelity funds (including each fund) have appropriately benefited from any such economies of scale, and whether there is potential for realization of any further economies of scale. The Board considered the extent to which each fund will benefit from economies of scale as assets grow through increased services to the fund, through waivers or reimbursements, or through fee or expense ratio reductions. The Board also noted that a committee (the Economies of Scale Committee) created by it and the boards of other Fidelity funds periodically analyzes whether Fidelity attains economies of scale in respect of the management and servicing of the Fidelity funds, whether the Fidelity funds have appropriately benefited from such economies of scale, and whether there is potential for realization of any further economies of scale.
The Board recognized that each fund's management contract incorporates a "group fee" structure, which provides for lower group fee rates as total group assets increase, and for higher group fee rates as total group assets decrease (with "group assets" defined to include fund assets under SelectCo's management plus assets under FMR's management). SelectCo calculates the group fee rates based on a tiered asset "breakpoint" schedule that varies based on asset class. The Board considered that the group fee is designed to deliver the benefits of economies of scale to fund shareholders when total group assets increase, even if assets of any particular fund are unchanged or have declined, because some portion of Fidelity's costs are attributable to services provided to all Fidelity funds, and all funds benefit if those costs can be allocated among more assets. The Board concluded that, given the group fee structure, fund shareholders will benefit from lower management fees as group assets increase at the fund complex level, regardless of whether Fidelity achieves any such economies of scale.
The Board concluded, taking into account the analysis of the Economies of Scale Committee, that economies of scale, if any, are being appropriately shared between fund shareholders and Fidelity.
Additional Information Requested by the Board. In order to develop fully the factual basis for consideration of the Fidelity funds' advisory contracts, the Board requested and received additional information on certain topics, including: (i) fund performance trends, in particular the underperformance of certain funds, and Fidelity's long-term strategies for certain funds; (ii) Fidelity's fund profitability methodology, profitability trends for certain funds, and the impact of certain factors on fund profitability results; (iii) metrics for evaluating index fund and ETF performance and information about ETF trading characteristics; (iv) the methodology with respect to the evaluation of competitive fund data and peer group classifications and fee comparisons; (v) the expense structures for different funds and classes; (vi) information regarding other accounts managed by Fidelity, including collective investment trusts; and (vii) Fidelity's philosophies and strategies for evaluating funds and classes with lower or declining asset levels.
Based on its evaluation of all of the conclusions noted above, and after considering all factors it believed relevant, the Board concluded that the advisory fee arrangements are fair and reasonable, and that each fund's Advisory Contracts should be renewed.
SELMT-ANN-0419
1.846032.112
Fidelity® Select Portfolios®
Telecommunications Services Sector Telecommunications Portfolio
Wireless Portfolio
Annual Report February 28, 2019 Includes Fidelity and Fidelity Advisor share classes |
|
Beginning on January 1, 2021, as permitted by regulations adopted by the Securities and Exchange Commission, paper copies of a fund’s shareholder reports will no longer be sent by mail, unless you specifically request paper copies of the reports from the fund or from your financial intermediary, such as a financial advisor, broker-dealer or bank. Instead, the reports will be made available on a website, and you will be notified by mail each time a report is posted and provided with a website link to access the report.
If you already elected to receive shareholder reports electronically, you will not be affected by this change and you need not take any action. You may elect to receive shareholder reports and other communications from a fund electronically, by contacting your financial intermediary. For Fidelity customers, visit Fidelity's web site or call Fidelity using the contact information listed below.
You may elect to receive all future reports in paper free of charge. If you wish to continue receiving paper copies of your shareholder reports, you may contact your financial intermediary or, if you are a Fidelity customer, visit Fidelity’s website, or call Fidelity at the applicable toll-free number listed below. Your election to receive reports in paper will apply to all funds held with the fund complex/your financial intermediary.
| Account Type | Website | Phone Number |
| Brokerage, Mutual Fund, or Annuity Contracts: | fidelity.com/mailpreferences | 1-800-343-3548 |
| Employer Provided Retirement Accounts: | netbenefits.fidelity.com/preferences (choose 'no' under Required Disclosures to continue to print) | 1-800-343-0860 |
| Advisor Sold Accounts Serviced Through Your Financial Intermediary: | Contact Your Financial Intermediary | Your Financial Intermediary's phone number |
| Advisor Sold Accounts Serviced by Fidelity: | institutional.fidelity.com | 1-877-208-0098 |
Contents
To view a fund's proxy voting guidelines and proxy voting record for the 12-month period ended June 30, visit http://www.fidelity.com/proxyvotingresults or visit the Securities and Exchange Commission's (SEC) web site at http://www.sec.gov.
You may also call 1-800-544-8544 if you’re an individual investing directly with Fidelity, call 1-800-835-5092 if you’re a plan sponsor or participant with Fidelity as your recordkeeper or call 1-877-208-0098 on institutional accounts or if you’re an advisor or invest through one to request a free copy of the proxy voting guidelines.
Standard & Poor's, S&P and S&P 500 are registered service marks of The McGraw-Hill Companies, Inc. and have been licensed for use by Fidelity Distributors Corporation.
Other third-party marks appearing herein are the property of their respective owners.
All other marks appearing herein are registered or unregistered trademarks or service marks of FMR LLC or an affiliated company. © 2019 FMR LLC. All rights reserved.
This report and the financial statements contained herein are submitted for the general information of the shareholders of the Funds. This report is not authorized for distribution to prospective investors in the Funds unless preceded or accompanied by an effective prospectus.
A fund files its complete schedule of portfolio holdings with the SEC for the first and third quarters of each fiscal year on Form N-Q. Forms N-Q are available on the SEC’s web site at http://www.sec.gov. A fund's Forms N-Q may be reviewed and copied at the SEC’s Public Reference Room in Washington, DC. Information regarding the operation of the SEC's Public Reference Room may be obtained by calling 1-800-SEC-0330.
For a complete list of a fund's portfolio holdings, view the most recent holdings listing, semiannual report, or annual report on Fidelity's web site at http://www.fidelity.com, http://www.institutional.fidelity.com, or http://www.401k.com, as applicable.
NOT FDIC INSURED •MAY LOSE VALUE •NO BANK GUARANTEE
Neither the Funds nor Fidelity Distributors Corporation is a bank.
Telecommunications Portfolio
Performance: The Bottom Line
Average annual total return reflects the change in the value of an investment, assuming reinvestment of distributions from dividend income and capital gains (the profits earned upon the sale of securities that have grown in value, if any) and assuming a constant rate of performance each year. The hypothetical investment and the average annual total returns do not reflect the deduction of taxes that a shareholder would pay on fund distributions or the redemption of fund shares. During periods of reimbursement by Fidelity, a fund’s total return will be greater than it would be had the reimbursement not occurred. How a fund did yesterday is no guarantee of how it will do tomorrow.
Average Annual Total Returns
| For the periods ended February 28, 2019 | Past 1 year | Past 5 years | Past 10 years |
| Class A (incl. 5.75% sales charge) | (2.90)% | 4.31% | 11.34% |
| Class M (incl. 3.50% sales charge) | (0.91)% | 4.46% | 11.25% |
| Class C (incl. contingent deferred sales charge) | 1.30% | 4.79% | 11.19% |
| Telecommunications Portfolio | 3.38% | 5.90% | 12.35% |
| Class I | 3.35% | 5.89% | 12.35% |
| Class Z | 3.46% | 5.91% | 12.36% |
Class C shares' contingent deferred sales charges included in the past one year, past five years and past ten years total return figures are 1%, 0% and 0%, respectively.
The initial offering of Class Z shares took place on October 2, 2018. Returns prior to October 2, 2018, are those of Class I.
$10,000 Over 10 Years
Let's say hypothetically that $10,000 was invested in Telecommunications Portfolio, a class of the fund, on February 28, 2009.
The chart shows how the value of your investment would have changed, and also shows how the S&P 500® Index performed over the same period.
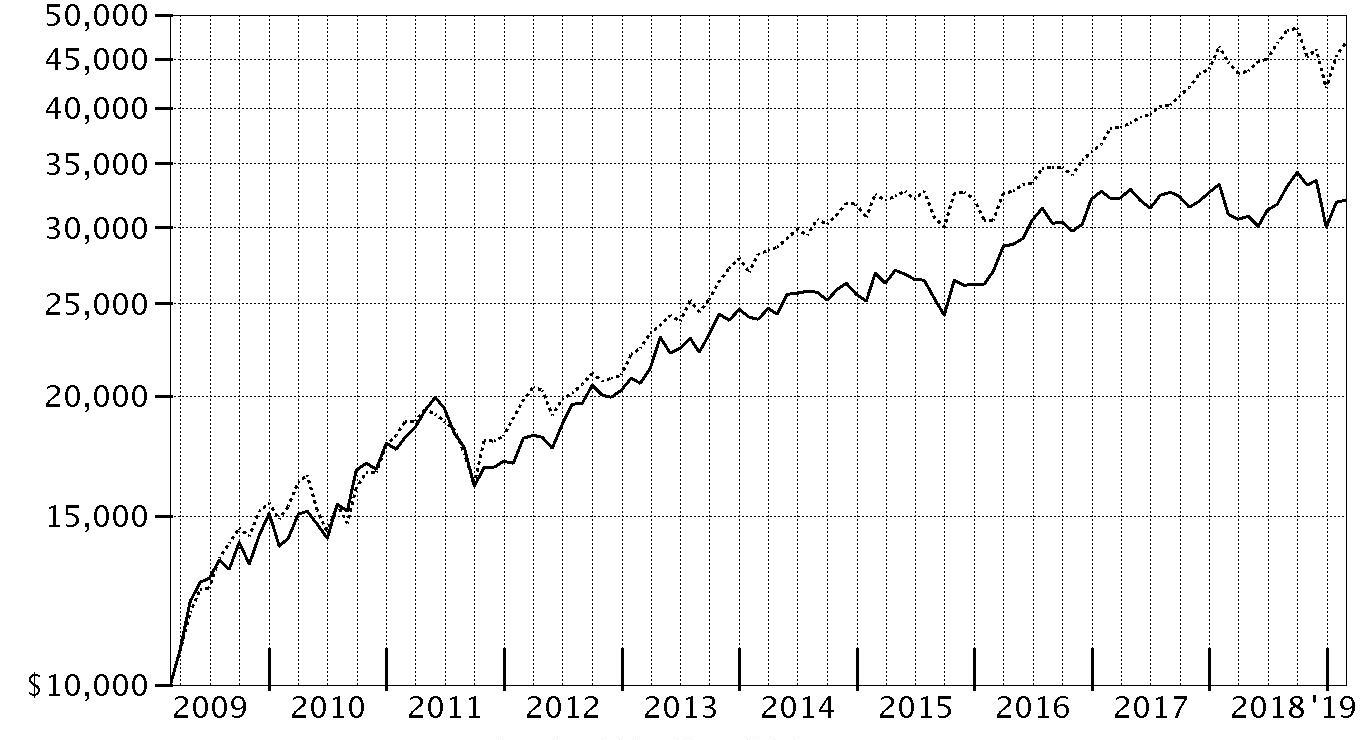
| Period Ending Values |
| $32,041 | Telecommunications Portfolio |
| $46,739 | S&P 500® Index |
Telecommunications Portfolio
Management's Discussion of Fund Performance
Market Recap: The S&P 500
® index gained 4.68% for the 12 months ending February 28, 2019, as the U.S. equity bellwether began the new year on a high note after enduring a final quarter of 2018 in which resurgent volatility upset the aging bull market. In October, rising U.S. Treasury yields and concern about peaking corporate earnings growth sent many investors fleeing from risk assets as they were still dealing with lingering uncertainty related to global trade and the U.S. Federal Reserve picking up the pace of interest rate hikes. The index returned -6.84% in October, at the time its largest monthly drop in seven years. But conditions worsened through Christmas, as jitters about the economy and another hike in rates led to a spike in market volatility and a -9.03% result for December. Sharply reversing course to begin 2019, the S&P 500
® gained 11.48% year-to-date, its strongest two-month opening since 1991, amid upbeat company earnings/outlooks and signs the Fed may pause on rates. For the full period, some economically sensitive sectors fared worst, with financials (-6%) and materials (-6%) both losing ground. Energy gained 1%, while communication services and industrials each rose roughly 2%. In contrast, the defensive utilities (+20%), real estate (+20%) and health care (+11%) sectors led the way, while consumer staples finished near the index. Information technology and consumer discretionary were rattled in the late-2018 downturn, but earlier strength contributed to advances of 9% and roughly 7%, respectively.
Comments from Portfolio Manager Matthew Drukker: For the year, the fund's share classes returned roughly 2% to 3%, strongly outpacing the -0.20% result of the industry benchmark, the MSCI U.S. IMI Telecommunication Services 25/50 Index, but trailing broader S&P 500
® index. Telecommunication stocks posted steady gains through mid-September, then pulled back sharply due to concerns about rising interest rates amid a slowing economy. Starting in late December, they rallied back strongly, once the U.S. Federal Reserve signaled a pause in the policy rate-hike cycle. Versus the MSCI index, stock selection delivered a significant boost to the fund’s result, led by choices in integrated telecommunication services. Underweighting weak-performing industry benchmark components Windstream Holdings and Frontier Communications, each with exposure to the challenged wireline and voice services segment, added significant relative value. The fund no longer held Windstream or Frontier at period end. Conversely, choices in the interactive home entertainment industry detracted, with shares of video-gamer developer Activision Blizzard weighing heavily on the fund’s relative return. A non-benchmark stake in French telecom provider Iliad Group, a company that struggled with its expansion into Italy, also hurt notably on a relative basis.
The views expressed above reflect those of the portfolio manager(s) only through the end of the period as stated on the cover of this report and do not necessarily represent the views of Fidelity or any other person in the Fidelity organization. Any such views are subject to change at any time based upon market or other conditions and Fidelity disclaims any responsibility to update such views. These views may not be relied on as investment advice and, because investment decisions for a Fidelity fund are based on numerous factors, may not be relied on as an indication of trading intent on behalf of any Fidelity fund.
Telecommunications Portfolio
Investment Summary (Unaudited)
Top Ten Stocks as of February 28, 2019
| | % of fund's net assets |
| AT&T, Inc. | 23.1 |
| Verizon Communications, Inc. | 18.4 |
| T-Mobile U.S., Inc. | 8.9 |
| Comcast Corp. Class A | 4.8 |
| Iridium Communications, Inc. | 3.5 |
| Liberty Broadband Corp. Class A | 3.3 |
| CenturyLink, Inc. | 2.9 |
| Vonage Holdings Corp. | 2.8 |
| Sprint Corp. | 2.7 |
| Zayo Group Holdings, Inc. | 2.6 |
| | 73.0 |
Top Industries (% of fund's net assets)
| As of February 28, 2019 |
| | Diversified Telecommunication Services | 63.7% |
| | Wireless Telecommunication Services | 18.6% |
| | Media | 14.5% |
| | Entertainment | 1.5% |
| | Communications Equipment | 0.8% |
| | All Others* | 0.9% |

* Includes short-term investments and net other assets (liabilities).
Telecommunications Portfolio
Schedule of Investments February 28, 2019
Showing Percentage of Net Assets
| Common Stocks - 99.8% | | | |
| | | Shares | Value |
| Communications Equipment - 0.8% | | | |
| Communications Equipment - 0.8% | | | |
| Quantenna Communications, Inc. (a) | | 123,800 | $2,246,970 |
| Diversified Telecommunication Services - 63.7% | | | |
| Alternative Carriers - 16.7% | | | |
| CenturyLink, Inc. | | 625,100 | 8,245,069 |
| Cogent Communications Group, Inc. | | 151,839 | 7,396,078 |
| Globalstar, Inc. (a)(b) | | 2,825,048 | 1,417,327 |
| Iliad SA | | 24,867 | 2,588,075 |
| Iridium Communications, Inc. (a) | | 477,411 | 10,164,080 |
| ORBCOMM, Inc. (a) | | 349,649 | 2,465,025 |
| Vonage Holdings Corp. (a) | | 782,771 | 8,046,886 |
| Zayo Group Holdings, Inc. (a) | | 306,800 | 7,608,640 |
| | | | 47,931,180 |
| Integrated Telecommunication Services - 47.0% | | | |
| AT&T, Inc. | | 2,127,520 | 66,208,423 |
| Atn International, Inc. | | 81,700 | 4,585,821 |
| Cincinnati Bell, Inc. (a) | | 350,702 | 3,401,809 |
| Consolidated Communications Holdings, Inc. (b) | | 407,500 | 4,046,475 |
| Masmovil Ibercom SA (a) | | 174,000 | 3,625,827 |
| Verizon Communications, Inc. | | 926,897 | 52,758,977 |
| | | | 134,627,332 |
|
| TOTAL DIVERSIFIED TELECOMMUNICATION SERVICES | | | 182,558,512 |
|
| Entertainment - 1.5% | | | |
| Interactive Home Entertainment - 1.5% | | | |
| Activision Blizzard, Inc. | | 104,700 | 4,412,058 |
| Equity Real Estate Investment Trusts (REITs) - 0.2% | | | |
| Specialized REITs - 0.2% | | | |
| American Tower Corp. | | 2,890 | 509,074 |
| Media - 14.5% | | | |
| Cable & Satellite - 14.5% | | | |
| Altice U.S.A., Inc. Class A | | 209,655 | 4,572,576 |
| Comcast Corp. Class A | | 358,300 | 13,855,461 |
| DISH Network Corp. Class A (a) | | 27,900 | 907,029 |
| GCI Liberty, Inc. (a) | | 63,200 | 3,383,728 |
| Liberty Broadband Corp. Class A (a) | | 107,200 | 9,575,104 |
| Liberty Global PLC Class C (a) | | 259,336 | 6,584,541 |
| Liberty Latin America Ltd. Class C (a) | | 76,434 | 1,482,055 |
| Megacable Holdings S.A.B. de CV unit | | 308,200 | 1,407,419 |
| | | | 41,767,913 |
| Semiconductors & Semiconductor Equipment - 0.5% | | | |
| Semiconductors - 0.5% | | | |
| Qorvo, Inc. (a) | | 20,600 | 1,444,884 |
| Wireless Telecommunication Services - 18.6% | | | |
| Wireless Telecommunication Services - 18.6% | | | |
| Boingo Wireless, Inc. (a) | | 160,500 | 3,590,385 |
| Shenandoah Telecommunications Co. | | 168,667 | 7,495,561 |
| Sprint Corp. (a) | | 1,238,585 | 7,865,015 |
| T-Mobile U.S., Inc. (a) | | 351,697 | 25,396,040 |
| Telephone & Data Systems, Inc. | | 176,464 | 5,655,671 |
| U.S. Cellular Corp. (a) | | 69,900 | 3,263,631 |
| | | | 53,266,303 |
| TOTAL COMMON STOCKS | | | |
| (Cost $247,082,466) | | | 286,205,714 |
|
| Money Market Funds - 2.1% | | | |
| Fidelity Cash Central Fund, 2.44% (c) | | 958,952 | 959,144 |
| Fidelity Securities Lending Cash Central Fund 2.45% (c)(d) | | 4,986,147 | 4,986,645 |
| TOTAL MONEY MARKET FUNDS | | | |
| (Cost $5,945,380) | | | 5,945,789 |
| TOTAL INVESTMENT IN SECURITIES - 101.9% | | | |
| (Cost $253,027,846) | | | 292,151,503 |
| NET OTHER ASSETS (LIABILITIES) - (1.9)% | | | (5,548,809) |
| NET ASSETS - 100% | | | $286,602,694 |
Legend
(a) Non-income producing
(b) Security or a portion of the security is on loan at period end.
(c) Affiliated fund that is generally available only to investment companies and other accounts managed by Fidelity Investments. The rate quoted is the annualized seven-day yield of the fund at period end. A complete unaudited listing of the fund's holdings as of its most recent quarter end is available upon request. In addition, each Fidelity Central Fund's financial statements, which are not covered by the Fund's Report of Independent Registered Public Accounting Firm, are available on the SEC's website or upon request.
(d) Investment made with cash collateral received from securities on loan.
Affiliated Central Funds
Information regarding fiscal year to date income earned by the Fund from investments in Fidelity Central Funds is as follows:
| Fund | Income earned |
| Fidelity Cash Central Fund | $30,653 |
| Fidelity Securities Lending Cash Central Fund | 261,492 |
| Total | $292,145 |
Amounts in the income column in the above table include any capital gain distributions from underlying funds, which are presented in the corresponding line-item in the Statement of Operations, if applicable.
Investment Valuation
All investments are categorized as Level 1 under the Fair Value Hierarchy. The inputs or methodology used for valuing securities may not be an indication of the risk associated with investing in those securities. For more information on valuation inputs please refer to the Investment Valuation section in the accompanying Notes to Financial Statements.
See accompanying notes which are an integral part of the financial statements.
Telecommunications Portfolio
Financial Statements
Statement of Assets and Liabilities
| | | February 28, 2019 |
| Assets | | |
Investment in securities, at value (including securities loaned of $3,909,984) — See accompanying schedule:
Unaffiliated issuers (cost $247,082,466) | $286,205,714 | |
| Fidelity Central Funds (cost $5,945,380) | 5,945,789 | |
| Total Investment in Securities (cost $253,027,846) | | $292,151,503 |
| Receivable for investments sold | | 107,344 |
| Receivable for fund shares sold | | 414,420 |
| Distributions receivable from Fidelity Central Funds | | 2,364 |
| Prepaid expenses | | 2,953 |
| Other receivables | | 8,333 |
| Total assets | | 292,686,917 |
| Liabilities | | |
| Payable to custodian bank | $95,612 | |
| Payable for fund shares redeemed | 764,837 | |
| Accrued management fee | 130,009 | |
| Distribution and service plan fees payable | 12,837 | |
| Other affiliated payables | 63,315 | |
| Other payables and accrued expenses | 39,090 | |
| Collateral on securities loaned | 4,978,523 | |
| Total liabilities | | 6,084,223 |
| Net Assets | | $286,602,694 |
| Net Assets consist of: | | |
| Paid in capital | | $256,241,029 |
| Total distributable earnings (loss) | | 30,361,665 |
| Net Assets | | $286,602,694 |
| Net Asset Value and Maximum Offering Price | | |
| Class A: | | |
| Net Asset Value and redemption price per share ($20,589,323 ÷ 369,805 shares) | | $55.68 |
| Maximum offering price per share (100/94.25 of $55.68) | | $59.08 |
| Class M: | | |
| Net Asset Value and redemption price per share ($6,017,622 ÷ 108,614 shares) | | $55.40 |
| Maximum offering price per share (100/96.50 of $55.40) | | $57.41 |
| Class C: | | |
| Net Asset Value and offering price per share ($6,993,698 ÷ 126,127 shares)(a) | | $55.45 |
| Telecommunications: | | |
| Net Asset Value, offering price and redemption price per share ($227,437,849 ÷ 4,058,448 shares) | | $56.04 |
| Class I: | | |
| Net Asset Value, offering price and redemption price per share ($25,181,438 ÷ 450,930 shares) | | $55.84 |
| Class Z: | | |
| Net Asset Value, offering price and redemption price per share ($382,764 ÷ 6,855 shares) | | $55.84 |
(a) Redemption price per share is equal to net asset value less any applicable contingent deferred sales charge.
See accompanying notes which are an integral part of the financial statements.
Statement of Operations
| | | Year ended February 28, 2019 |
| Investment Income | | |
| Dividends | | $7,789,693 |
| Non-Cash dividends | | 1,339,059 |
| Income from Fidelity Central Funds | | 292,145 |
| Total income | | 9,420,897 |
| Expenses | | |
| Management fee | $1,629,901 | |
| Transfer agent fees | 648,352 | |
| Distribution and service plan fees | 150,480 | |
| Accounting and security lending fees | 120,787 | |
| Custodian fees and expenses | 10,920 | |
| Independent trustees' fees and expenses | 1,726 | |
| Registration fees | 97,321 | |
| Audit | 62,629 | |
| Legal | 3,133 | |
| Miscellaneous | 4,132 | |
| Total expenses before reductions | 2,729,381 | |
| Expense reductions | (59,146) | |
| Total expenses after reductions | | 2,670,235 |
| Net investment income (loss) | | 6,750,662 |
| Realized and Unrealized Gain (Loss) | | |
| Net realized gain (loss) on: | | |
| Investment securities: | | |
| Unaffiliated issuers | (8,050,702) | |
| Redemptions in-kind with affiliated entities | 14,071,812 | |
| Fidelity Central Funds | 624 | |
| Foreign currency transactions | 3,920 | |
| Total net realized gain (loss) | | 6,025,654 |
| Change in net unrealized appreciation (depreciation) on: | | |
| Investment securities: | | |
| Unaffiliated issuers | (5,508,995) | |
| Fidelity Central Funds | (718) | |
| Assets and liabilities in foreign currencies | (464) | |
| Total change in net unrealized appreciation (depreciation) | | (5,510,177) |
| Net gain (loss) | | 515,477 |
| Net increase (decrease) in net assets resulting from operations | | $7,266,139 |
See accompanying notes which are an integral part of the financial statements.
Statement of Changes in Net Assets
| | Year ended February 28, 2019 | Year ended February 28, 2018 |
| Increase (Decrease) in Net Assets | | |
| Operations | | |
| Net investment income (loss) | $6,750,662 | $8,944,753 |
| Net realized gain (loss) | 6,025,654 | 61,414,644 |
| Change in net unrealized appreciation (depreciation) | (5,510,177) | (86,618,502) |
| Net increase (decrease) in net assets resulting from operations | 7,266,139 | (16,259,105) |
| Distributions to shareholders | (9,778,496) | – |
| Distributions to shareholders from net investment income | – | (9,787,526) |
| Distributions to shareholders from net realized gain | – | (66,377,876) |
| Total distributions | (9,778,496) | (76,165,402) |
| Share transactions - net increase (decrease) | (71,184,477) | (304,973,804) |
| Total increase (decrease) in net assets | (73,696,834) | (397,398,311) |
| Net Assets | | |
| Beginning of period | 360,299,528 | 757,697,839 |
| End of period | $286,602,694 | $360,299,528 |
| Other Information | | |
| Undistributed net investment income end of period | | $1,308,030 |
See accompanying notes which are an integral part of the financial statements.
Financial Highlights
Telecommunications Portfolio Class A
| Years ended February 28, | 2019 | 2018 | 2017 | 2016 A | 2015 |
| Selected Per–Share Data | | | | | |
| Net asset value, beginning of period | $55.58 | $69.61 | $62.32 | $63.26 | $58.71 |
| Income from Investment Operations | | | | | |
| Net investment income (loss)B | 1.10C | 1.05 | .88 | .81 | .76 |
| Net realized and unrealized gain (loss) | .56 | (3.38) | 10.68 | (.76) | 5.83 |
| Total from investment operations | 1.66 | (2.33) | 11.56 | .05 | 6.59 |
| Distributions from net investment income | (.94) | (1.31) | (1.11) | (.54) | (2.04) |
| Distributions from net realized gain | (.62) | (10.39) | (3.16) | (.45) | – |
| Total distributions | (1.56) | (11.70) | (4.27) | (.99) | (2.04) |
| Redemption fees added to paid in capitalB | – | – | –D | –D | –D |
| Net asset value, end of period | $55.68 | $55.58 | $69.61 | $62.32 | $63.26 |
| Total ReturnE,F | 3.03% | (4.06)% | 18.65% | .16% | 11.54% |
| Ratios to Average Net AssetsG,H | | | | | |
| Expenses before reductions | 1.18% | 1.14% | 1.14% | 1.15% | 1.15% |
| Expenses net of fee waivers, if any | 1.17% | 1.14% | 1.14% | 1.15% | 1.15% |
| Expenses net of all reductions | 1.16% | 1.12% | 1.12% | 1.15% | 1.15% |
| Net investment income (loss) | 1.96%C | 1.59% | 1.28% | 1.33% | 1.26% |
| Supplemental Data | | | | | |
| Net assets, end of period (000 omitted) | $20,589 | $17,816 | $31,966 | $13,032 | $11,052 |
| Portfolio turnover rateI | 64%J | 66% | 105%J | 51% | 94%J |
A For the year ended February 29.
B Calculated based on average shares outstanding during the period.
C Net investment income per share reflects a large, non-recurring dividend which amounted to $.25 per share. Excluding this non-recurring dividend, the ratio of net investment income (loss) to average net assets would have been 1.52%.
D Amount represents less than $.005 per share.
E Total returns would have been lower if certain expenses had not been reduced during the applicable periods shown.
F Total returns do not include the effect of the sales charges.
G Fees and expenses of any underlying Fidelity Central Funds are not included in the Fund's expense ratio. The Fund indirectly bears its proportionate share of the expenses of any underlying Fidelity Central Funds.
H Expense ratios reflect operating expenses of the class. Expenses before reductions do not reflect amounts reimbursed by the investment adviser or reductions from brokerage service arrangements or reductions from other expense offset arrangements and do not represent the amount paid by the class during periods when reimbursements or reductions occur. Expenses net of fee waivers reflect expenses after reimbursement by the investment adviser but prior to reductions from brokerage service arrangements or other expense offset arrangements. Expenses net of all reductions represent the net expenses paid by the class.
I Amount does not include the portfolio activity of any underlying Fidelity Central Funds.
J Portfolio turnover rate excludes securities received or delivered in-kind.
See accompanying notes which are an integral part of the financial statements.
Telecommunications Portfolio Class M
| Years ended February 28, | 2019 | 2018 | 2017 | 2016 A | 2015 |
| Selected Per–Share Data | | | | | |
| Net asset value, beginning of period | $55.31 | $69.33 | $61.95 | $63.04 | $58.50 |
| Income from Investment Operations | | | | | |
| Net investment income (loss)B | .92C | .81 | .65 | .61 | .57 |
| Net realized and unrealized gain (loss) | .55 | (3.36) | 10.62 | (.76) | 5.81 |
| Total from investment operations | 1.47 | (2.55) | 11.27 | (.15) | 6.38 |
| Distributions from net investment income | (.76) | (1.07) | (.73) | (.49) | (1.84) |
| Distributions from net realized gain | (.62) | (10.39) | (3.16) | (.45) | – |
| Total distributions | (1.38) | (11.47)D | (3.89) | (.94) | (1.84) |
| Redemption fees added to paid in capitalB | – | – | –E | –E | –E |
| Net asset value, end of period | $55.40 | $55.31 | $69.33 | $61.95 | $63.04 |
| Total ReturnF,G | 2.69% | (4.40)% | 18.26% | (.16)% | 11.19% |
| Ratios to Average Net AssetsH,I | | | | | |
| Expenses before reductions | 1.50% | 1.49% | 1.46% | 1.47% | 1.47% |
| Expenses net of fee waivers, if any | 1.49% | 1.49% | 1.46% | 1.47% | 1.47% |
| Expenses net of all reductions | 1.48% | 1.48% | 1.44% | 1.46% | 1.46% |
| Net investment income (loss) | 1.64%C | 1.24% | .96% | 1.01% | .94% |
| Supplemental Data | | | | | |
| Net assets, end of period (000 omitted) | $6,018 | $4,847 | $6,933 | $8,280 | $5,095 |
| Portfolio turnover rateJ | 64%K | 66% | 105%K | 51% | 94%K |
A For the year ended February 29.
B Calculated based on average shares outstanding during the period.
C Net investment income per share reflects a large, non-recurring dividend which amounted to $.25 per share. Excluding this non-recurring dividend, the ratio of net investment income (loss) to average net assets would have been 1.19%.
D Total distributions of $11.47 per share is comprised of distributions from net investment income of $1.073 and distributions from net realized gain of $10.393 per share.
E Amount represents less than $.005 per share.
F Total returns would have been lower if certain expenses had not been reduced during the applicable periods shown.
G Total returns do not include the effect of the sales charges.
H Fees and expenses of any underlying Fidelity Central Funds are not included in the Fund's expense ratio. The Fund indirectly bears its proportionate share of the expenses of any underlying Fidelity Central Funds.
I Expense ratios reflect operating expenses of the class. Expenses before reductions do not reflect amounts reimbursed by the investment adviser or reductions from brokerage service arrangements or reductions from other expense offset arrangements and do not represent the amount paid by the class during periods when reimbursements or reductions occur. Expenses net of fee waivers reflect expenses after reimbursement by the investment adviser but prior to reductions from brokerage service arrangements or other expense offset arrangements. Expenses net of all reductions represent the net expenses paid by the class.
J Amount does not include the portfolio activity of any underlying Fidelity Central Funds.
K Portfolio turnover rate excludes securities received or delivered in-kind.
See accompanying notes which are an integral part of the financial statements.
Telecommunications Portfolio Class C
| Years ended February 28, | 2019 | 2018 | 2017 | 2016 A | 2015 |
| Selected Per–Share Data | | | | | |
| Net asset value, beginning of period | $55.29 | $69.24 | $62.10 | $63.04 | $58.54 |
| Income from Investment Operations | | | | | |
| Net investment income (loss)B | .70C | .57 | .37 | .36 | .34 |
| Net realized and unrealized gain (loss) | .56 | (3.36) | 10.62 | (.75) | 5.80 |
| Total from investment operations | 1.26 | (2.79) | 10.99 | (.39) | 6.14 |
| Distributions from net investment income | (.48) | (.77) | (.69) | (.10) | (1.64) |
| Distributions from net realized gain | (.62) | (10.39) | (3.16) | (.45) | – |
| Total distributions | (1.10) | (11.16) | (3.85) | (.55) | (1.64) |
| Redemption fees added to paid in capitalB | – | – | –D | –D | –D |
| Net asset value, end of period | $55.45 | $55.29 | $69.24 | $62.10 | $63.04 |
| Total ReturnE,F | 2.30% | (4.75)% | 17.77% | (.57)% | 10.75% |
| Ratios to Average Net AssetsG,H | | | | | |
| Expenses before reductions | 1.88% | 1.86% | 1.88% | 1.89% | 1.85% |
| Expenses net of fee waivers, if any | 1.88% | 1.86% | 1.88% | 1.89% | 1.85% |
| Expenses net of all reductions | 1.86% | 1.85% | 1.86% | 1.88% | 1.85% |
| Net investment income (loss) | 1.26%C | .87% | .54% | .60% | .56% |
| Supplemental Data | | | | | |
| Net assets, end of period (000 omitted) | $6,994 | $8,396 | $13,528 | $7,735 | $7,074 |
| Portfolio turnover rateI | 64%J | 66% | 105%J | 51% | 94%J |
A For the year ended February 29.
B Calculated based on average shares outstanding during the period.
C Net investment income per share reflects a large, non-recurring dividend which amounted to $.25 per share. Excluding this non-recurring dividend, the ratio of net investment income (loss) to average net assets would have been .81%.
D Amount represents less than $.005 per share.
E Total returns would have been lower if certain expenses had not been reduced during the applicable periods shown.
F Total returns do not include the effect of the contingent deferred sales charge.
G Fees and expenses of any underlying Fidelity Central Funds are not included in the Fund's expense ratio. The Fund indirectly bears its proportionate share of the expenses of any underlying Fidelity Central Funds.
H Expense ratios reflect operating expenses of the class. Expenses before reductions do not reflect amounts reimbursed by the investment adviser or reductions from brokerage service arrangements or reductions from other expense offset arrangements and do not represent the amount paid by the class during periods when reimbursements or reductions occur. Expenses net of fee waivers reflect expenses after reimbursement by the investment adviser but prior to reductions from brokerage service arrangements or other expense offset arrangements. Expenses net of all reductions represent the net expenses paid by the class.
I Amount does not include the portfolio activity of any underlying Fidelity Central Funds.
J Portfolio turnover rate excludes securities received or delivered in-kind.
See accompanying notes which are an integral part of the financial statements.
Telecommunications Portfolio
| Years ended February 28, | 2019 | 2018 | 2017 | 2016 A | 2015 |
| Selected Per–Share Data | | | | | |
| Net asset value, beginning of period | $55.88 | $69.97 | $62.58 | $63.54 | $58.94 |
| Income from Investment Operations | | | | | |
| Net investment income (loss)B | 1.30C | 1.28 | 1.12 | 1.02 | .96 |
| Net realized and unrealized gain (loss) | .56 | (3.42) | 10.74 | (.77) | 5.85 |
| Total from investment operations | 1.86 | (2.14) | 11.86 | .25 | 6.81 |
| Distributions from net investment income | (1.08) | (1.56) | (1.31) | (.76) | (2.21) |
| Distributions from net realized gain | (.62) | (10.39) | (3.16) | (.45) | – |
| Total distributions | (1.70) | (11.95) | (4.47) | (1.21) | (2.21) |
| Redemption fees added to paid in capitalB | – | – | –D | –D | –D |
| Net asset value, end of period | $56.04 | $55.88 | $69.97 | $62.58 | $63.54 |
| Total ReturnE | 3.38% | (3.76)% | 19.06% | .49% | 11.90% |
| Ratios to Average Net AssetsF,G | | | | | |
| Expenses before reductions | .84% | .82% | .80% | .82% | .83% |
| Expenses net of fee waivers, if any | .83% | .82% | .80% | .81% | .83% |
| Expenses net of all reductions | .82% | .80% | .78% | .81% | .82% |
| Net investment income (loss) | 2.30%C | 1.92% | 1.62% | 1.67% | 1.58% |
| Supplemental Data | | | | | |
| Net assets, end of period (000 omitted) | $227,438 | $320,908 | $690,720 | $689,600 | $346,174 |
| Portfolio turnover rateH | 64%I | 66% | 105%I | 51% | 94%I |
A For the year ended February 29.
B Calculated based on average shares outstanding during the period.
C Net investment income per share reflects a large, non-recurring dividend which amounted to $.25 per share. Excluding this non-recurring dividend, the ratio of net investment income (loss) to average net assets would have been 1.85%.
D Amount represents less than $.005 per share.
E Total returns would have been lower if certain expenses had not been reduced during the applicable periods shown.
F Fees and expenses of any underlying Fidelity Central Funds are not included in the Fund's expense ratio. The Fund indirectly bears its proportionate share of the expenses of any underlying Fidelity Central Funds.
G Expense ratios reflect operating expenses of the class. Expenses before reductions do not reflect amounts reimbursed by the investment adviser or reductions from brokerage service arrangements or reductions from other expense offset arrangements and do not represent the amount paid by the class during periods when reimbursements or reductions occur. Expenses net of fee waivers reflect expenses after reimbursement by the investment adviser but prior to reductions from brokerage service arrangements or other expense offset arrangements. Expenses net of all reductions represent the net expenses paid by the class.
H Amount does not include the portfolio activity of any underlying Fidelity Central Funds.
I Portfolio turnover rate excludes securities received or delivered in-kind.
See accompanying notes which are an integral part of the financial statements.
Telecommunications Portfolio Class I
| Years ended February 28, | 2019 | 2018 | 2017 | 2016 A | 2015 |
| Selected Per–Share Data | | | | | |
| Net asset value, beginning of period | $55.74 | $69.82 | $62.46 | $63.38 | $58.80 |
| Income from Investment Operations | | | | | |
| Net investment income (loss)B | 1.27C | 1.26 | 1.12 | 1.02 | .94 |
| Net realized and unrealized gain (loss) | .57 | (3.39) | 10.70 | (.76) | 5.83 |
| Total from investment operations | 1.84 | (2.13) | 11.82 | .26 | 6.77 |
| Distributions from net investment income | (1.12) | (1.56) | (1.30) | (.73) | (2.19) |
| Distributions from net realized gain | (.62) | (10.39) | (3.16) | (.45) | – |
| Total distributions | (1.74) | (11.95) | (4.46) | (1.18) | (2.19) |
| Redemption fees added to paid in capitalB | – | – | –D | –D | –D |
| Net asset value, end of period | $55.84 | $55.74 | $69.82 | $62.46 | $63.38 |
| Total ReturnE | 3.35% | (3.75)% | 19.03% | .51% | 11.85% |
| Ratios to Average Net AssetsF,G | | | | | |
| Expenses before reductions | .91% | .82% | .80% | .82% | .86% |
| Expenses net of fee waivers, if any | .90% | .82% | .80% | .82% | .86% |
| Expenses net of all reductions | .88% | .80% | .78% | .81% | .85% |
| Net investment income (loss) | 2.23%C | 1.91% | 1.62% | 1.67% | 1.55% |
| Supplemental Data | | | | | |
| Net assets, end of period (000 omitted) | $25,181 | $8,332 | $14,550 | $6,197 | $2,505 |
| Portfolio turnover rateH | 64%I | 66% | 105%I | 51% | 94%I |
A For the year ended February 29.
B Calculated based on average shares outstanding during the period.
C Net investment income per share reflects a large, non-recurring dividend which amounted to $.25 per share. Excluding this non-recurring dividend, the ratio of net investment income (loss) to average net assets would have been 1.79%.
D Amount represents less than $.005 per share.
E Total returns would have been lower if certain expenses had not been reduced during the applicable periods shown.
F Fees and expenses of any underlying Fidelity Central Funds are not included in the Fund's expense ratio. The Fund indirectly bears its proportionate share of the expenses of any underlying Fidelity Central Funds.
G Expense ratios reflect operating expenses of the class. Expenses before reductions do not reflect amounts reimbursed by the investment adviser or reductions from brokerage service arrangements or reductions from other expense offset arrangements and do not represent the amount paid by the class during periods when reimbursements or reductions occur. Expenses net of fee waivers reflect expenses after reimbursement by the investment adviser but prior to reductions from brokerage service arrangements or other expense offset arrangements. Expenses net of all reductions represent the net expenses paid by the class.
H Amount does not include the portfolio activity of any underlying Fidelity Central Funds.
I Portfolio turnover rate excludes securities received or delivered in-kind.
See accompanying notes which are an integral part of the financial statements.
Telecommunications Portfolio Class Z
| Year ended February 28, | 2019 A |
| Selected Per–Share Data | |
| Net asset value, beginning of period | $60.97 |
| Income from Investment Operations | |
| Net investment income (loss)B | .39C |
| Net realized and unrealized gain (loss) | (4.55)D |
| Total from investment operations | (4.16) |
| Distributions from net investment income | (.97) |
| Distributions from net realized gain | – |
| Total distributions | (.97) |
| Net asset value, end of period | $55.84 |
| Total ReturnE,F | (6.80)% |
| Ratios to Average Net AssetsG,H | |
| Expenses before reductions | .68%I |
| Expenses net of fee waivers, if any | .66%I |
| Expenses net of all reductions | .64%I |
| Net investment income (loss) | 1.67%C,I |
| Supplemental Data | |
| Net assets, end of period (000 omitted) | $383 |
| Portfolio turnover rateJ | 64%K |
A For the period October 2, 2018 (commencement of sale of shares) to February 28, 2019.
B Calculated based on average shares outstanding during the period.
C Net investment income per share reflects a large, non-recurring dividend which amounted to $.10 per share. Excluding this non-recurring dividend, the ratio of net investment income (loss) to average net assets would have been 1.23%.
D The amount shown for a share outstanding does not correspond with the aggregate net gain (loss) on investments for the period due to the timing of sales and repurchases of shares in relation to fluctuating market values of the investments of the Fund.
E Total returns for periods of less than one year are not annualized.
F Total returns would have been lower if certain expenses had not been reduced during the applicable periods shown.
G Fees and expenses of any underlying Fidelity Central Funds are not included in the Fund's expense ratio. The Fund indirectly bears its proportionate share of the expenses of any underlying Fidelity Central Funds.
H Expense ratios reflect operating expenses of the class. Expenses before reductions do not reflect amounts reimbursed by the investment adviser or reductions from brokerage service arrangements or reductions from other expense offset arrangements and do not represent the amount paid by the class during periods when reimbursements or reductions occur. Expense ratios before reductions for start-up periods may not be representative of longer-term operating periods. Expenses net of fee waivers reflect expenses after reimbursement by the investment adviser but prior to reductions from brokerage service arrangements or other expense offset arrangements. Expenses net of all reductions represent the net expenses paid by the class.
I Annualized
J Amount does not include the portfolio activity of any underlying Fidelity Central Funds.
K Portfolio turnover rate excludes securities received or delivered in-kind.
See accompanying notes which are an integral part of the financial statements.
Notes to Financial Statements
For the period ended February 28, 2019
1. Organization.
Telecommunications Portfolio (the Fund) is a non-diversified fund of Fidelity Select Portfolios (the Trust) and is authorized to issue an unlimited number of shares. The Trust is registered under the Investment Company Act of 1940, as amended (the 1940 Act), as an open-end management investment company organized as a Massachusetts business trust. The Fund invests primarily in securities of companies whose principal business activities fall within specific industries. The Fund commenced sale of Class Z shares on October 2, 2018. The Fund offers Class A, Class M, Class C, Telecommunications, Class I and Class Z shares, each of which has equal rights as to assets and voting privileges. Each class has exclusive voting rights with respect to matters that affect that class.
Effective March 1, 2019, Class C shares will automatically convert to Class A shares after a holding period of ten years from the initial date of purchase, with certain exceptions.
2. Investments in Fidelity Central Funds.
The Fund invests in Fidelity Central Funds, which are open-end investment companies generally available only to other investment companies and accounts managed by the investment adviser and its affiliates. The Fund's Schedule of Investments lists each of the Fidelity Central Funds held as of period end, if any, as an investment of the Fund, but does not include the underlying holdings of each Fidelity Central Fund. As an Investing Fund, the Fund indirectly bears its proportionate share of the expenses of the underlying Fidelity Central Funds.
The Money Market Central Funds seek preservation of capital and current income and are managed by Fidelity Investments Money Management, Inc. (FIMM), an affiliate of the investment adviser. Annualized expenses of the Money Market Central Funds as of their most recent shareholder report date are less than .005%.
A complete unaudited list of holdings for each Fidelity Central Fund is available upon request or at the Securities and Exchange Commission (the SEC) website at www.sec.gov. In addition, the financial statements of the Fidelity Central Funds, which are not covered by the Fund's Report of Independent Registered Public Accounting Firm, are available on the SEC website or upon request.
3. Significant Accounting Policies.
The Fund is an investment company and applies the accounting and reporting guidance of the Financial Accounting Standards Board (FASB) Accounting Standards Codification Topic 946 Financial Services – Investments Companies. The financial statements have been prepared in conformity with accounting principles generally accepted in the United States of America (GAAP), which require management to make certain estimates and assumptions at the date of the financial statements. Actual results could differ from those estimates. Subsequent events, if any, through the date that the financial statements were issued have been evaluated in the preparation of the financial statements. The following summarizes the significant accounting policies of the Fund:
Investment Valuation. Investments are valued as of 4:00 p.m. Eastern time on the last calendar day of the period. The Board of Trustees (the Board) has delegated the day to day responsibility for the valuation of the Fund's investments to the Fair Value Committee (the Committee) established by the Fund's investment adviser. In accordance with valuation policies and procedures approved by the Board, the Fund attempts to obtain prices from one or more third party pricing vendors or brokers to value its investments. When current market prices, quotations or currency exchange rates are not readily available or reliable, investments will be fair valued in good faith by the Committee, in accordance with procedures adopted by the Board. Factors used in determining fair value vary by investment type and may include market or investment specific events. The frequency with which these procedures are used cannot be predicted and they may be utilized to a significant extent. The Committee oversees the Fund's valuation policies and procedures and reports to the Board on the Committee's activities and fair value determinations. The Board monitors the appropriateness of the procedures used in valuing the Fund's investments and ratifies the fair value determinations of the Committee.
The Fund categorizes the inputs to valuation techniques used to value its investments into a disclosure hierarchy consisting of three levels as shown below:
- Level 1 – quoted prices in active markets for identical investments
- Level 2 – other significant observable inputs (including quoted prices for similar investments, interest rates, prepayment speeds, etc.)
- Level 3 – unobservable inputs (including the Fund's own assumptions based on the best information available)
Valuation techniques used to value the Fund's investments by major category are as follows:
Equity securities, including restricted securities, for which market quotations are readily available, are valued at the last reported sale price or official closing price as reported by a third party pricing vendor on the primary market or exchange on which they are traded and are categorized as Level 1 in the hierarchy. In the event there were no sales during the day or closing prices are not available, securities are valued at the last quoted bid price or may be valued using the last available price and are generally categorized as Level 2 in the hierarchy. For foreign equity securities, when market or security specific events arise, comparisons to the valuation of American Depositary Receipts (ADRs), futures contracts, Exchange-Traded Funds (ETFs) and certain indexes as well as quoted prices for similar securities may be used and would be categorized as Level 2 in the hierarchy. For equity securities, including restricted securities, where observable inputs are limited, assumptions about market activity and risk are used and these securities may be categorized as Level 3 in the hierarchy.
Investments in open-end mutual funds, including the Fidelity Central Funds, are valued at their closing net asset value (NAV) each business day and are categorized as Level 1 in the hierarchy.
Changes in valuation techniques may result in transfers in or out of an assigned level within the disclosure hierarchy.
Foreign Currency. The Fund may use foreign currency contracts to facilitate transactions in foreign-denominated securities. Gains and losses from these transactions may arise from changes in the value of the foreign currency or if the counterparties do not perform under the contracts' terms.
Foreign-denominated assets, including investment securities, and liabilities are translated into U.S. dollars at the exchange rates at period end. Purchases and sales of investment securities, income and dividends received and expenses denominated in foreign currencies are translated into U.S. dollars at the exchange rate in effect on the transaction date.
The effects of exchange rate fluctuations on investments are included with the net realized and unrealized gain (loss) on investment securities. Other foreign currency transactions resulting in realized and unrealized gain (loss) are disclosed separately.
Investment Transactions and Income. For financial reporting purposes, the Fund's investment holdings and NAV include trades executed through the end of the last business day of the period. The NAV per share for processing shareholder transactions is calculated as of the close of business of the New York Stock Exchange (NYSE), normally 4:00 p.m. Eastern time and includes trades executed through the end of the prior business day. Gains and losses on securities sold are determined on the basis of identified cost and include proceeds received from litigation. Dividend income is recorded on the ex-dividend date, except for certain dividends from foreign securities where the ex-dividend date may have passed, which are recorded as soon as the Fund is informed of the ex-dividend date. Non-cash dividends included in dividend income, if any, are recorded at the fair market value of the securities received. Income and capital gain distributions from Fidelity Central Funds, if any, are recorded on the ex-dividend date. Certain distributions received by the Fund represent a return of capital or capital gain. The Fund determines the components of these distributions subsequent to the ex-dividend date, based upon receipt of tax filings or other correspondence relating to the underlying investment. These distributions are recorded as a reduction of cost of investments and/or as a realized gain. During the period, dividend income has been reduced $2,068,789 with a corresponding increase to net unrealized appreciation (depreciation) as a result of a change in the prior period estimate, which had no impact on the total net assets or total return of the Fund. Large, non-recurring dividends recognized by the Fund are presented separately on the Statement of Operations as "Non-cash dividends" and the impact of these dividends is presented in the Financial Highlights. Investment income is recorded net of foreign taxes withheld where recovery of such taxes is uncertain.
Class Allocations and Expenses. Investment income, realized and unrealized capital gains and losses, common expenses of the Fund, and certain fund-level expense reductions, if any, are allocated daily on a pro-rata basis to each class based on the relative net assets of each class to the total net assets of the Fund. Each class differs with respect to transfer agent and distribution and service plan fees incurred. Certain expense reductions may also differ by class. For the reporting period, the allocated portion of income and expenses to each class as a percent of its average net assets may vary due to the timing of recording these transactions in relation to fluctuating net assets of the classes. Expenses directly attributable to a fund are charged to that fund. Expenses attributable to more than one fund are allocated among the respective funds on the basis of relative net assets or other appropriate methods. Expense estimates are accrued in the period to which they relate and adjustments are made when actual amounts are known.
Income Tax Information and Distributions to Shareholders. Each year, the Fund intends to qualify as a regulated investment company under Subchapter M of the Internal Revenue Code, including distributing substantially all of its taxable income and realized gains. As a result, no provision for U.S. Federal income taxes is required. As of February 28, 2019, the Fund did not have any unrecognized tax benefits in the financial statements; nor is the Fund aware of any tax positions for which it is reasonably possible that the total amounts of unrecognized tax benefits will significantly change in the next twelve months. The Fund files a U.S. federal tax return, in addition to state and local tax returns as required. The Fund's federal income tax returns are subject to examination by the Internal Revenue Service (IRS) for a period of three fiscal years after they are filed. State and local tax returns may be subject to examination for an additional fiscal year depending on the jurisdiction. Foreign taxes are provided for based on the Fund's understanding of the tax rules and rates that exist in the foreign markets in which it invests.
Distributions are declared and recorded on the ex-dividend date. Income and capital gain distributions are declared separately for each class. Income and capital gain distributions are determined in accordance with income tax regulations, which may differ from GAAP.
Capital accounts within the financial statements are adjusted for permanent book-tax differences. These adjustments have no impact on net assets or the results of operations. Capital accounts are not adjusted for temporary book-tax differences which will reverse in a subsequent period.
Book-tax differences are primarily due to foreign currency transactions, redemptions in kind, capital loss carryforwards and losses deferred due to wash sales.
As of period end, the cost and unrealized appreciation (depreciation) in securities, and derivatives if applicable, for federal income tax purposes were as follows:
| Gross unrealized appreciation | $62,166,339 |
| Gross unrealized depreciation | (25,682,849) |
| Net unrealized appreciation (depreciation) | $36,483,490 |
| Tax Cost | $255,668,013 |
The tax-based components of distributable earnings as of period end were as follows:
| Undistributed ordinary income | $1,270,539 |
| Capital loss carryforward | $(7,388,604) |
| Net unrealized appreciation (depreciation) on securities and other investments | $36,479,729 |
Capital loss carryforwards are only available to offset future capital gains of the Fund to the extent provided by regulations and may be limited. Under the Regulated Investment Company Modernization Act of 2010 (the Act), the Fund is permitted to carry forward capital losses incurred in taxable years beginning after December 22, 2010 for an unlimited period and such capital losses are required to be used prior to any losses that expire. The capital loss carryforward information presented below, including any applicable limitation, is estimated as of fiscal period end and is subject to adjustment.
| No expiration | |
| Short-term | $(5,201,193) |
| Long-term | (2,187,411) |
| Total capital loss carryforward | $(7,388,604) |
The tax character of distributions paid was as follows:
| | February 28, 2019 | February 28, 2018 |
| Ordinary Income | $5,875,297 | $ 16,292,007 |
| Long-term Capital Gains | 3,903,199 | 59,873,395 |
| Total | $9,778,496 | $ 76,165,402 |
New Rule Issuance. During August 2018, the U.S. Securities and Exchange Commission issued Final Rule Release No. 33-10532, Disclosure Update and Simplification. This Final Rule includes amendments specific to registered investment companies that are intended to eliminate overlap in disclosure requirements between Regulation S-X and GAAP. In accordance with these amendments, certain line-items in the Fund's financial statements have been combined or removed for the current period as outlined in the table below.
| Financial Statement | Current Line-Item Presentation (As Applicable) | Prior Line-Item Presentation (As Applicable) |
| Statement of Assets and Liabilities | Total distributable earnings (loss) | Undistributed/Distributions in excess of/Accumulated net investment income (loss)
Accumulated/Undistributed net realized gain (loss)
Net unrealized appreciation (depreciation) |
| Statement of Changes in Net Assets | N/A - removed | Undistributed/Distributions in excess of/Accumulated net investment income (loss) end of period |
| Statement of Changes in Net Assets | Distributions to shareholders | Distributions to shareholders from net investment income
Distributions to shareholders from net realized gain |
| Distributions to Shareholders Note to Financial Statements | Distributions to shareholders | Distributions to shareholders from net investment income
Distributions to shareholders from net realized gain |
4. Purchases and Sales of Investments.
Purchases and sales of securities, other than short-term securities and in-kind transactions, aggregated $193,985,668 and $198,422,065, respectively.
5. Fees and Other Transactions with Affiliates.
Management Fee. Fidelity SelectCo, LLC (the investment adviser) and its affiliates provide the Fund with investment management related services for which the Fund pays a monthly management fee. The management fee is the sum of an individual fund fee rate that is based on an annual rate of .30% of the Fund's average net assets and an annualized group fee rate that averaged .24% during the period. The group fee rate is based upon the average net assets of all the mutual funds advised by Fidelity Management & Research Company (FMR) and the investment adviser. The group fee rate decreases as assets under management increase and increases as assets under management decrease. For the reporting period, the total annual management fee rate was .54% of the Fund's average net assets.
Distribution and Service Plan Fees. In accordance with Rule 12b-1 of the 1940 Act, the Fund has adopted separate Distribution and Service Plans for each class of shares. Certain classes pay Fidelity Distributors Corporation (FDC), an affiliate of the investment adviser, separate Distribution and Service Fees, each of which is based on an annual percentage of each class' average net assets. In addition, FDC may pay financial intermediaries for selling shares of the Fund and providing shareholder support services. For the period, the Distribution and Service Fee rates, total fees and amounts retained by FDC were as follows:
| | Distribution Fee | Service Fee | Total Fees | Retained by FDC |
| Class A | -% | .25% | $46,083 | $– |
| Class M | .25% | .25% | 26,564 | – |
| Class C | .75% | .25% | 77,833 | 2,950 |
| | | | $150,480 | $2,950 |
Sales Load. FDC may receive a front-end sales charge of up to 5.75% for selling Class A shares and 3.50% for selling Class M shares, some of which is paid to financial intermediaries for selling shares of the Fund. Depending on the holding period, FDC may receive contingent deferred sales charges levied on Class A, Class M and Class C redemptions. The deferred sales charges are 1.00% for Class C shares, 1.00% for certain purchases of Class A shares and .25% for certain purchases of Class M shares.
For the period, sales charge amounts retained by FDC were as follows:
| | Retained by FDC |
| Class A | $11,200 |
| Class M | 1,942 |
| Class C(a) | 889 |
| | $14,031 |
(a) When Class C shares are initially sold, FDC pays commissions from its own resources to financial intermediaries through which the sales are made.
Transfer Agent Fees. Fidelity Investments Institutional Operations Company, Inc., (FIIOC), an affiliate of the investment adviser, is the transfer, dividend disbursing and shareholder servicing agent for each class of the Fund. FIIOC receives account fees and asset-based fees that vary according to the account size and type of account of the shareholders of the respective classes of the Fund, except for Class Z. FIIOC receives an asset-based fee of Class Z's average net assets. FIIOC pays for typesetting, printing and mailing of shareholder reports, except proxy statements.
For the period, transfer agent fees for each class were as follows:
| | Amount | % of Class-Level Average Net Assets |
| Class A | $53,431 | .29 |
| Class M | 19,161 | .36 |
| Class C | 19,060 | .24 |
| Telecommunications | 512,586 | .20 |
| Class I | 44,061 | .27 |
| Class Z | 53 | .05(a) |
| | $648,352 | |
(a) Annualized
Accounting and Security Lending Fees. Fidelity Service Company, Inc. (FSC), an affiliate of the investment adviser, maintains the Fund's accounting records. The accounting fee is based on the level of average net assets for each month. Under a separate contract, FSC administers the security lending program. The security lending fee is based on the number and duration of lending transactions. For the period, the fees were equivalent to an annual rate of .04%.
Brokerage Commissions. The Fund placed a portion of its portfolio transactions with brokerage firms which are affiliates of the investment adviser. Brokerage commissions are included in net realized gain (loss) and change in net unrealized appreciation (depreciation) in the Statement of Operations. The commissions paid to these affiliated firms were $10,160 for the period.
Interfund Trades. The Fund may purchase from or sell securities to other Fidelity Funds under procedures adopted by the Board. The procedures have been designed to ensure these interfund trades are executed in accordance with Rule 17a-7 of the 1940 Act. Interfund trades are included within the respective purchases and sales amounts shown in the Purchases and Sales of Investments note.
Affiliated Redemptions In-Kind. During the period, 1,218,775 shares of the Fund were redeemed in-kind for investments and cash with a value of $67,398,250. The net realized gain of $14,071,812 on investments delivered through in-kind redemptions is included in the accompanying Statement of Operations. The amount of the in-kind redemptions is included in share transactions in the accompanying Statement of Changes in Net Assets as well as the Notes to Financial Statements. The Fund recognized no gain or loss for federal income tax purposes.
6. Committed Line of Credit.
The Fund participates with other funds managed by the investment adviser or an affiliate in a $4.25 billion credit facility (the "line of credit") to be utilized for temporary or emergency purposes to fund shareholder redemptions or for other short-term liquidity purposes. The Fund has agreed to pay commitment fees on its pro-rata portion of the line of credit, which amounted to $870 and is reflected in Miscellaneous expenses on the Statement of Operations. During the period, the Fund did not borrow on this line of credit.
7. Security Lending.
The Fund lends portfolio securities through a lending agent from time to time in order to earn additional income. On the settlement date of the loan, the Fund receives collateral (in the form of U.S. Treasury obligations, letters of credit and/or cash) against the loaned securities and maintains collateral in an amount not less than 100% of the market value of the loaned securities during the period of the loan. The market value of the loaned securities is determined at the close of business of the Fund and any additional required collateral is delivered to the Fund on the next business day. The Fund or borrower may terminate the loan at any time, and if the borrower defaults on its obligation to return the securities loaned because of insolvency or other reasons, the Fund may apply collateral received from the borrower against the obligation. The Fund may experience delays and costs in recovering the securities loaned. Any cash collateral received is invested in the Fidelity Securities Lending Cash Central Fund. The value of loaned securities and cash collateral at period end are disclosed on the Fund's Statement of Assets and Liabilities. Security lending income represents the income earned on investing cash collateral, less rebates paid to borrowers and any lending agent fees associated with the loan, plus any premium payments received for lending certain types of securities. Security lending income is presented in the Statement of Operations as a component of income from Fidelity Central Funds. Total security lending income during the period amounted to $261,492.
8. Expense Reductions.
Commissions paid to certain brokers with whom the investment adviser, or its affiliates, places trades on behalf of the Fund include an amount in addition to trade execution, which may be rebated back to the Fund to offset certain expenses. This amount totaled $40,173 for the period.
In addition, during the period the investment adviser reimbursed and/or waived a portion of fund-level operating expenses in the amount of $2,956 and a portion of class-level operating expenses as follows:
| | Amount |
| Class A | $1,153 |
| Class M | 336 |
| Class C | 392 |
| Telecommunications | 12,706 |
| Class I | 1,409 |
| Class Z | 21 |
| | $16,017 |
9. Distributions to Shareholders.
Distributions to shareholders of each class were as follows:
| | Year ended
February 28, 2019(a) | Year ended
February 28, 2018 |
| Distributions to shareholders | | |
| Class A | $535,063 | $– |
| Class M | 130,556 | – |
| Class C | 159,015 | – |
| Telecommunications | 8,378,886 | – |
| Class I | 568,868 | – |
| Class Z | 6,108 | – |
| Total | $9,778,496 | $– |
| From net investment income | | |
| Class A | $– | $396,755 |
| Class M | – | 86,824 |
| Class C | – | 113,266 |
| Telecommunications | – | 8,955,299 |
| Class I | – | 235,382 |
| Total | $– | $9,787,526 |
| From net realized gain | | |
| Class A | $– | $3,147,334 |
| Class M | – | 841,588 |
| Class C | – | 1,545,756 |
| Telecommunications | – | 59,280,788 |
| Class I | – | 1,562,410 |
| Total | $– | $66,377,876 |
(a) Distributions for Class Z are for the period October 2, 2018 (commencement of sale of shares) to February 28, 2019.
10. Share Transactions.
Share transactions for each class were as follows and may contain automatic conversions between classes or exchanges between affiliated funds:
| | Shares | Shares | Dollars | Dollars |
| | Year ended February 28, 2019(a) | Year ended February 28, 2018 | Year ended February 28, 2019(a) | Year ended February 28, 2018 |
| Class A | | | | |
| Shares sold | 178,681 | 76,520 | $10,119,847 | $4,987,299 |
| Reinvestment of distributions | 9,360 | 57,962 | 516,144 | 3,454,010 |
| Shares redeemed | (138,810) | (273,126) | (7,791,536) | (18,205,397) |
| Net increase (decrease) | 49,231 | (138,644) | $2,844,455 | $(9,764,088) |
| Class M | | | | |
| Shares sold | 44,519 | 21,912 | $2,532,619 | $1,457,815 |
| Reinvestment of distributions | 2,373 | 15,649 | 130,297 | 926,496 |
| Shares redeemed | (25,923) | (49,923) | (1,462,119) | (3,308,018) |
| Net increase (decrease) | 20,969 | (12,362) | $1,200,797 | $(923,707) |
| Class C | | | | |
| Shares sold | 31,491 | 31,294 | $1,771,517 | $2,045,854 |
| Reinvestment of distributions | 2,644 | 25,537 | 145,392 | 1,513,170 |
| Shares redeemed | (59,867) | (100,350) | (3,334,750) | (6,561,447) |
| Net increase (decrease) | (25,732) | (43,519) | $(1,417,841) | $(3,002,423) |
| Telecommunications | | | | |
| Shares sold | 715,808 | 1,189,602 | $41,325,429 | $77,745,057 |
| Reinvestment of distributions | 143,615 | 1,082,670 | 7,967,864 | 65,288,273 |
| Shares redeemed | (2,543,354)(b) | (6,401,925) | (142,062,236)(b) | (430,649,733) |
| Net increase (decrease) | (1,683,931) | (4,129,653) | $(92,768,943) | $(287,616,403) |
| Class I | | | | |
| Shares sold | 628,872 | 250,120 | $37,138,940 | $16,564,921 |
| Reinvestment of distributions | 8,061 | 25,845 | 444,865 | 1,544,599 |
| Shares redeemed | (335,488) | (334,874) | (19,029,976) | (21,776,703) |
| Net increase (decrease) | 301,445 | (58,909) | $18,553,829 | $(3,667,183) |
| Class Z | | | | |
| Shares sold | 6,750 | – | $397,427 | $– |
| Reinvestment of distributions | 110 | – | 6,066 | – |
| Shares redeemed | (5) | – | (267) | – |
| Net increase (decrease) | 6,855 | – | $403,226 | $– |
(a) Share transactions for Class Z are for the period October 2, 2018 (commencement of sale of shares) to February 28, 2019.
(b) Amount includes in-kind redemptions (see the Affiliated Redemptions In-Kind note for additional details)
11. Other.
The Fund's organizational documents provide former and current trustees and officers with a limited indemnification against liabilities arising in connection with the performance of their duties to the Fund. In the normal course of business, the Fund may also enter into contracts that provide general indemnifications. The Fund's maximum exposure under these arrangements is unknown as this would be dependent on future claims that may be made against the Fund. The risk of material loss from such claims is considered remote.
Wireless Portfolio
Performance: The Bottom Line
Average annual total return reflects the change in the value of an investment, assuming reinvestment of distributions from dividend income and capital gains (the profits earned upon the sale of securities that have grown in value, if any) and assuming a constant rate of performance each year. The hypothetical investment and the average annual total returns do not reflect the deduction of taxes that a shareholder would pay on fund distributions or the redemption of fund shares. During periods of reimbursement by Fidelity, a fund’s total return will be greater than it would be had the reimbursement not occurred. How a fund did yesterday is no guarantee of how it will do tomorrow.
Average Annual Total Returns
| For the periods ended February 28, 2019 | Past 1 year | Past 5 years | Past 10 years |
| Wireless Portfolio | 0.21% | 6.87% | 13.85% |
$10,000 Over 10 Years
Let's say hypothetically that $10,000 was invested in Wireless Portfolio on February 28, 2009.
The chart shows how the value of your investment would have changed, and also shows how the S&P 500® Index performed over the same period.
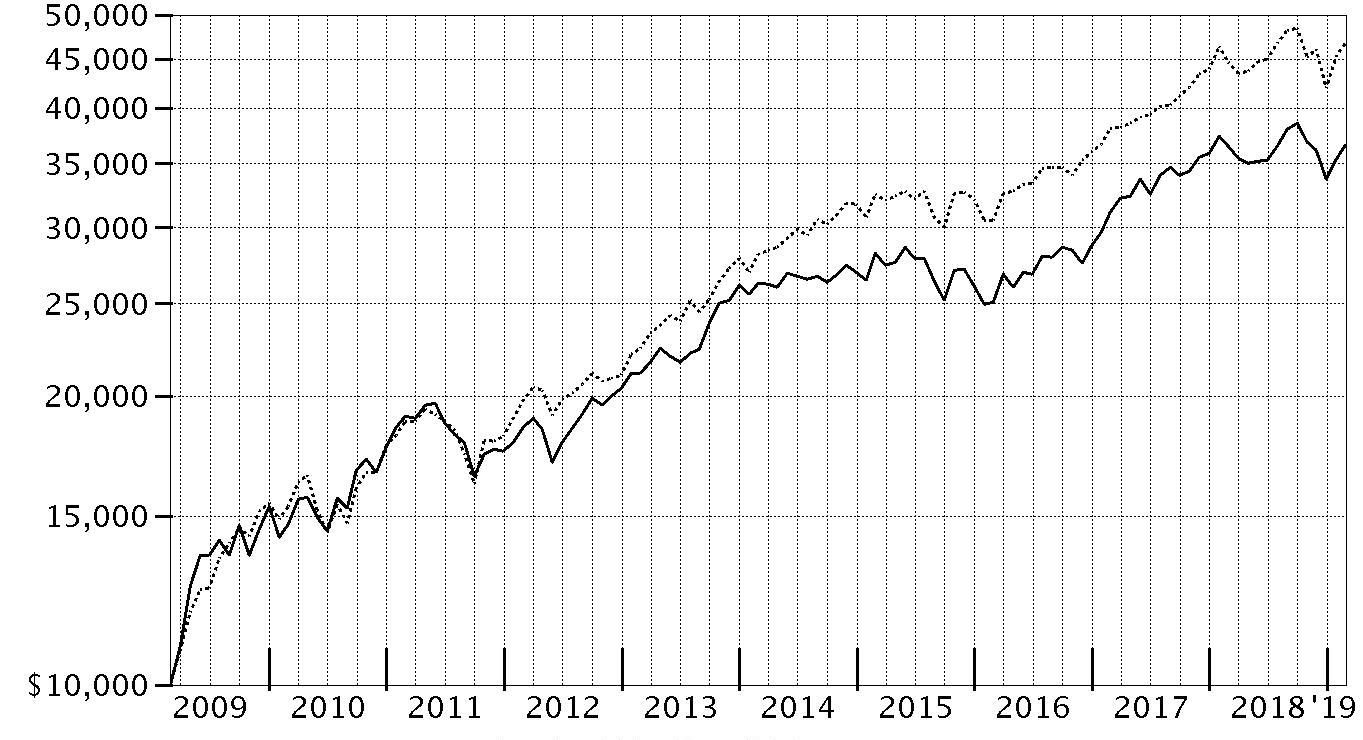
| Period Ending Values |
| $36,579 | Wireless Portfolio |
| $46,739 | S&P 500® Index |
Wireless Portfolio
Management's Discussion of Fund Performance
Market Recap: The S&P 500
® index gained 4.68% for the 12 months ending February 28, 2019, as the U.S. equity bellwether began the new year on a high note after enduring a final quarter of 2018 in which resurgent volatility upset the aging bull market. In October, rising U.S. Treasury yields and concern about peaking corporate earnings growth sent many investors fleeing from risk assets as they were still dealing with lingering uncertainty related to global trade and the U.S. Federal Reserve picking up the pace of interest rate hikes. The index returned -6.84% in October, at the time its largest monthly drop in seven years. But conditions worsened through Christmas, as jitters about the economy and another hike in rates led to a spike in market volatility and a -9.03% result for December. Sharply reversing course to begin 2019, the S&P 500
® gained 11.48% year-to-date, its strongest two-month opening since 1991, amid upbeat company earnings/outlooks and signs the Fed may pause on rates. For the full period, some economically sensitive sectors fared worst, with financials (-6%) and materials (-6%) both losing ground. Energy gained 1%, while communication services and industrials each rose roughly 2%. In contrast, the defensive utilities (+20%), real estate (+20%) and health care (+11%) sectors led the way, while consumer staples finished near the index. Information technology and consumer discretionary were rattled in the late-2018 downturn, but earlier strength contributed to advances of 9% and roughly 7%, respectively.
Comments from Portfolio Manager Matthew Drukker: For the year, the fund returned 0.21%, underperforming the 2.31% result of the industry benchmark, the Fidelity Wireless Index, and the S&P 500
®. Versus the industry benchmark, stock selection detracted meaningfully from the fund's result, mainly due to choices in the alternative carriers and interactive home entertainment segments. Among individual holdings, the fund's non-benchmark stake in French telecom provider Iliad Group, a company that struggled with its expansion into Italy, notably hurt the return versus the industry benchmark. Shares of video-gamer developer Activision Blizzard also weighing heavily on the fund’s relative return, due partly to a decline among monthly active users and reduced revenue guidance from management. Elsewhere, the fund’s underweighted position in Verizon Communications detracted on a relative basis. Conversely, a lighter-than-index stake in AT&T added value, due partly to investor concerns about its leveraged balance sheet, as did the fund's underweighting in U.K. telecom provider Vodafone.
The views expressed above reflect those of the portfolio manager(s) only through the end of the period as stated on the cover of this report and do not necessarily represent the views of Fidelity or any other person in the Fidelity organization. Any such views are subject to change at any time based upon market or other conditions and Fidelity disclaims any responsibility to update such views. These views may not be relied on as investment advice and, because investment decisions for a Fidelity fund are based on numerous factors, may not be relied on as an indication of trading intent on behalf of any Fidelity fund.
Wireless Portfolio
Investment Summary (Unaudited)
Top Ten Stocks as of February 28, 2019
| | % of fund's net assets |
| Apple, Inc. | 15.5 |
| AT&T, Inc. | 12.9 |
| American Tower Corp. | 7.5 |
| Qualcomm, Inc. | 5.2 |
| T-Mobile U.S., Inc. | 5.1 |
| Verizon Communications, Inc. | 4.0 |
| Alphabet, Inc. Class A | 4.0 |
| Marvell Technology Group Ltd. | 3.4 |
| China Mobile Ltd. sponsored ADR | 3.1 |
| Vodafone Group PLC sponsored ADR | 2.4 |
| | 63.1 |
Top Industries (% of fund's net assets)
| As of February 28, 2019 |
| | Diversified Telecommunication Services | 29.9% |
| | Technology Hardware, Storage & Peripherals | 15.5% |
| | Wireless Telecommunication Services | 13.6% |
| | Semiconductors & Semiconductor Equipment | 12.3% |
| | Equity Real Estate Investment Trusts (Reits) | 7.5% |
| | All Others* | 21.2% |

* Includes short-term investments and net other assets (liabilities).
Wireless Portfolio
Schedule of Investments February 28, 2019
Showing Percentage of Net Assets
| Common Stocks - 98.6% | | | |
| | | Shares | Value |
| Communications Equipment - 5.2% | | | |
| Communications Equipment - 5.2% | | | |
| CommScope Holding Co., Inc. (a) | | 65,300 | $1,522,143 |
| Motorola Solutions, Inc. | | 11,468 | 1,641,300 |
| Nokia Corp. sponsored ADR (b) | | 391,700 | 2,385,453 |
| Quantenna Communications, Inc. (a) | | 74,700 | 1,355,805 |
| Telefonaktiebolaget LM Ericsson (B Shares) sponsored ADR | | 592,000 | 5,369,440 |
| ViaSat, Inc. (a) | | 1 | 76 |
| | | | 12,274,217 |
| Diversified Telecommunication Services - 29.0% | | | |
| Alternative Carriers - 1.0% | | | |
| Iliad SA | | 21,995 | 2,289,166 |
| Integrated Telecommunication Services - 28.0% | | | |
| AT&T, Inc. | | 985,300 | 30,662,536 |
| BCE, Inc. | | 97,300 | 4,326,909 |
| BT Group PLC sponsored ADR (b) | | 384,700 | 5,558,915 |
| Masmovil Ibercom SA (a) | | 229,350 | 4,779,215 |
| Orange SA ADR | | 359,400 | 5,477,256 |
| Telecom Italia SpA (a) | | 2,505,500 | 1,525,096 |
| Telecom Italia SpA sponsored ADR (a) | | 25,400 | 153,162 |
| Telefonica SA sponsored ADR (b) | | 527,597 | 4,563,714 |
| Verizon Communications, Inc. | | 167,801 | 9,551,233 |
| | | | 66,598,036 |
|
| TOTAL DIVERSIFIED TELECOMMUNICATION SERVICES | | | 68,887,202 |
|
| Entertainment - 2.6% | | | |
| Interactive Home Entertainment - 2.1% | | | |
| Activision Blizzard, Inc. | | 118,400 | 4,989,376 |
| Movies & Entertainment - 0.5% | | | |
| Spotify Technology SA (a) | | 8,000 | 1,121,120 |
|
| TOTAL ENTERTAINMENT | | | 6,110,496 |
|
| Equity Real Estate Investment Trusts (REITs) - 7.5% | | | |
| Specialized REITs - 7.5% | | | |
| American Tower Corp. | | 101,592 | 17,895,431 |
| Crown Castle International Corp. | | 1 | 119 |
| | | | 17,895,550 |
| Hotels, Restaurants & Leisure - 0.8% | | | |
| Casinos & Gaming - 0.8% | | | |
| Sea Ltd. ADR (a)(b) | | 90,000 | 1,935,000 |
| Interactive Media & Services - 4.0% | | | |
| Interactive Media & Services - 4.0% | | | |
| Alphabet, Inc. Class A (a) | | 8,400 | 9,463,020 |
| Media - 5.0% | | | |
| Cable & Satellite - 5.0% | | | |
| Altice Europe NV Class A (b) | | 134,099 | 302,316 |
| Altice U.S.A., Inc. Class A | | 55,825 | 1,217,543 |
| DISH Network Corp. Class A (a) | | 87,200 | 2,834,872 |
| Liberty Global PLC Class A (a) | | 216,100 | 5,694,235 |
| Telenet Group Holding NV | | 40,479 | 1,826,980 |
| | | | 11,875,946 |
| Semiconductors & Semiconductor Equipment - 12.3% | | | |
| Semiconductors - 12.3% | | | |
| Marvell Technology Group Ltd. | | 410,100 | 8,181,495 |
| Qorvo, Inc. (a) | | 73,025 | 5,121,974 |
| Qualcomm, Inc. | | 230,150 | 12,287,709 |
| Sequans Communications SA ADR (a)(b) | | 393,300 | 432,630 |
| Skyworks Solutions, Inc. | | 32,200 | 2,629,452 |
| STMicroelectronics NV (NY Shares) unit (b) | | 33,500 | 548,060 |
| | | | 29,201,320 |
| Software - 2.0% | | | |
| Application Software - 1.7% | | | |
| RingCentral, Inc. (a) | | 40,000 | 4,211,600 |
| Systems Software - 0.3% | | | |
| BlackBerry Ltd. (a) | | 77,101 | 670,265 |
|
| TOTAL SOFTWARE | | | 4,881,865 |
|
| Technology Hardware, Storage & Peripherals - 15.5% | | | |
| Technology Hardware, Storage & Peripherals - 15.5% | | | |
| Apple, Inc. | | 213,105 | 36,899,130 |
| Textiles, Apparel & Luxury Goods - 1.1% | | | |
| Textiles - 1.1% | | | |
| China Tower Corp. Ltd. (H Shares) (c) | | 11,480,000 | 2,720,189 |
| Wireless Telecommunication Services - 13.6% | | | |
| Wireless Telecommunication Services - 13.6% | | | |
| China Mobile Ltd. sponsored ADR | | 139,400 | 7,344,986 |
| Millicom International Cellular SA | | 24,400 | 1,476,200 |
| Rogers Communications, Inc. Class B (non-vtg.) | | 6,900 | 381,245 |
| Shenandoah Telecommunications Co. | | 300 | 13,332 |
| SoftBank Corp. | | 56,400 | 5,233,597 |
| Spok Holdings, Inc. | | 1 | 14 |
| Sprint Corp. (a) | | 32 | 203 |
| T-Mobile U.S., Inc. (a) | | 169,675 | 12,252,232 |
| Vodafone Group PLC sponsored ADR | | 320,081 | 5,713,446 |
| | | | 32,415,255 |
| TOTAL COMMON STOCKS | | | |
| (Cost $202,831,328) | | | 234,559,190 |
|
| Nonconvertible Preferred Stocks - 0.9% | | | |
| Diversified Telecommunication Services - 0.9% | | | |
| Integrated Telecommunication Services - 0.9% | | | |
| Telefonica Brasil SA | | | |
| (Cost $2,278,272) | | 174,300 | 2,171,238 |
|
| Money Market Funds - 5.7% | | | |
| Fidelity Cash Central Fund, 2.44% (d) | | 246,764 | 246,813 |
| Fidelity Securities Lending Cash Central Fund 2.45% (d)(e) | | 13,323,614 | 13,324,946 |
| TOTAL MONEY MARKET FUNDS | | | |
| (Cost $13,571,759) | | | 13,571,759 |
| TOTAL INVESTMENT IN SECURITIES - 105.2% | | | |
| (Cost $218,681,359) | | | 250,302,187 |
| NET OTHER ASSETS (LIABILITIES) - (5.2)% | | | (12,395,561) |
| NET ASSETS - 100% | | | $237,906,626 |
Legend
(a) Non-income producing
(b) Security or a portion of the security is on loan at period end.
(c) Security exempt from registration under Rule 144A of the Securities Act of 1933. These securities may be resold in transactions exempt from registration, normally to qualified institutional buyers. At the end of the period, the value of these securities amounted to $2,720,189 or 1.1% of net assets.
(d) Affiliated fund that is generally available only to investment companies and other accounts managed by Fidelity Investments. The rate quoted is the annualized seven-day yield of the fund at period end. A complete unaudited listing of the fund's holdings as of its most recent quarter end is available upon request. In addition, each Fidelity Central Fund's financial statements, which are not covered by the Fund's Report of Independent Registered Public Accounting Firm, are available on the SEC's website or upon request.
(e) Investment made with cash collateral received from securities on loan.
Affiliated Central Funds
Information regarding fiscal year to date income earned by the Fund from investments in Fidelity Central Funds is as follows:
| Fund | Income earned |
| Fidelity Cash Central Fund | $30,992 |
| Fidelity Securities Lending Cash Central Fund | 217,308 |
| Total | $248,300 |
Amounts in the income column in the above table include any capital gain distributions from underlying funds, which are presented in the corresponding line-item in the Statement of Operations, if applicable.
Investment Valuation
The following is a summary of the inputs used, as of February 28, 2019, involving the Fund's assets and liabilities carried at fair value. The inputs or methodology used for valuing securities may not be an indication of the risk associated with investing in those securities. For more information on valuation inputs, and their aggregation into the levels used below, please refer to the Investment Valuation section in the accompanying Notes to Financial Statements.
| | Valuation Inputs at Reporting Date: |
| Description | Total | Level 1 | Level 2 | Level 3 |
| Investments in Securities: | | | | |
| Common Stocks | $234,559,190 | $227,800,497 | $6,758,693 | $-- |
| Nonconvertible Preferred Stocks | 2,171,238 | 2,171,238 | -- | -- |
| Money Market Funds | 13,571,759 | 13,571,759 | -- | -- |
| Total Investments in Securities: | $250,302,187 | $243,543,494 | $6,758,693 | $-- |
Other Information
Distribution of investments by country or territory of incorporation, as a percentage of Total Net Assets, is as follows (Unaudited):
| United States of America | 66.0% |
| United Kingdom | 7.1% |
| Spain | 3.9% |
| France | 3.5% |
| Bermuda | 3.4% |
| Hong Kong | 3.1% |
| Canada | 2.3% |
| Sweden | 2.3% |
| Japan | 2.2% |
| China | 1.1% |
| Finland | 1.0% |
| Others (Individually Less Than 1%) | 4.1% |
| | 100.0% |
See accompanying notes which are an integral part of the financial statements.
Wireless Portfolio
Financial Statements
Statement of Assets and Liabilities
| | | February 28, 2019 |
| Assets | | |
Investment in securities, at value (including securities loaned of $12,808,090) — See accompanying schedule:
Unaffiliated issuers (cost $205,109,600) | $236,730,428 | |
| Fidelity Central Funds (cost $13,571,759) | 13,571,759 | |
| Total Investment in Securities (cost $218,681,359) | | $250,302,187 |
| Receivable for fund shares sold | | 991,893 |
| Dividends receivable | | 307,870 |
| Distributions receivable from Fidelity Central Funds | | 14,617 |
| Prepaid expenses | | 2,289 |
| Other receivables | | 35,709 |
| Total assets | | 251,654,565 |
| Liabilities | | |
| Payable for fund shares redeemed | $231,564 | |
| Accrued management fee | 105,089 | |
| Other affiliated payables | 47,120 | |
| Other payables and accrued expenses | 41,571 | |
| Collateral on securities loaned | 13,322,595 | |
| Total liabilities | | 13,747,939 |
| Net Assets | | $237,906,626 |
| Net Assets consist of: | | |
| Paid in capital | | $210,071,931 |
| Total distributable earnings (loss) | | 27,834,695 |
| Net Assets, for 26,633,362 shares outstanding | | $237,906,626 |
| Net Asset Value, offering price and redemption price per share ($237,906,626 ÷ 26,633,362 shares) | | $8.93 |
See accompanying notes which are an integral part of the financial statements.
Statement of Operations
| | | Year ended February 28, 2019 |
| Investment Income | | |
| Dividends | | $6,056,708 |
| Non-Cash dividends | | 803,919 |
| Income from Fidelity Central Funds | | 248,300 |
| Total income | | 7,108,927 |
| Expenses | | |
| Management fee | $1,328,731 | |
| Transfer agent fees | 498,286 | |
| Accounting and security lending fees | 98,236 | |
| Custodian fees and expenses | 29,005 | |
| Independent trustees' fees and expenses | 1,394 | |
| Registration fees | 29,818 | |
| Audit | 48,344 | |
| Legal | 4,519 | |
| Interest | 707 | |
| Miscellaneous | 1,939 | |
| Total expenses before reductions | 2,040,979 | |
| Expense reductions | (21,502) | |
| Total expenses after reductions | | 2,019,477 |
| Net investment income (loss) | | 5,089,450 |
| Realized and Unrealized Gain (Loss) | | |
| Net realized gain (loss) on: | | |
| Investment securities: | | |
| Unaffiliated issuers | 25,051,205 | |
| Fidelity Central Funds | 507 | |
| Foreign currency transactions | (3,252) | |
| Total net realized gain (loss) | | 25,048,460 |
| Change in net unrealized appreciation (depreciation) on: | | |
| Investment securities: | | |
| Unaffiliated issuers | (30,799,787) | |
| Fidelity Central Funds | 19 | |
| Assets and liabilities in foreign currencies | (2,927) | |
| Total change in net unrealized appreciation (depreciation) | | (30,802,695) |
| Net gain (loss) | | (5,754,235) |
| Net increase (decrease) in net assets resulting from operations | | $(664,785) |
See accompanying notes which are an integral part of the financial statements.
Statement of Changes in Net Assets
| | Year ended February 28, 2019 | Year ended February 28, 2018 |
| Increase (Decrease) in Net Assets | | |
| Operations | | |
| Net investment income (loss) | $5,089,450 | $4,522,126 |
| Net realized gain (loss) | 25,048,460 | 11,020,350 |
| Change in net unrealized appreciation (depreciation) | (30,802,695) | 25,972,235 |
| Net increase (decrease) in net assets resulting from operations | (664,785) | 41,514,711 |
| Distributions to shareholders | (31,692,225) | – |
| Distributions to shareholders from net investment income | – | (3,603,116) |
| Distributions to shareholders from net realized gain | – | (6,240,342) |
| Total distributions | (31,692,225) | (9,843,458) |
| Share transactions | | |
| Proceeds from sales of shares | 36,649,769 | 174,215,147 |
| Reinvestment of distributions | 30,046,831 | 9,361,647 |
| Cost of shares redeemed | (72,175,357) | (178,872,137) |
| Net increase (decrease) in net assets resulting from share transactions | (5,478,757) | 4,704,657 |
| Redemption fees | – | 7,555 |
| Total increase (decrease) in net assets | (37,835,767) | 36,383,465 |
| Net Assets | | |
| Beginning of period | 275,742,393 | 239,358,928 |
| End of period | $237,906,626 | $275,742,393 |
| Other Information | | |
| Undistributed net investment income end of period | | $469,557 |
| Shares | | |
| Sold | 3,719,654 | 17,791,191 |
| Issued in reinvestment of distributions | 3,493,506 | 947,168 |
| Redeemed | (7,373,198) | (18,220,551) |
| Net increase (decrease) | (160,038) | 517,808 |
See accompanying notes which are an integral part of the financial statements.
Financial Highlights
Wireless Portfolio
| | | | | | |
| Years ended February 28, | 2019 | 2018 | 2017 | 2016 A | 2015 |
| Selected Per–Share Data | | | | | |
| Net asset value, beginning of period | $10.29 | $9.11 | $7.85 | $9.54 | $10.57 |
| Income from Investment Operations | | | | | |
| Net investment income (loss)B | .20C | .16 | .10 | .11 | .17 |
| Net realized and unrealized gain (loss) | (.24)D | 1.39 | 1.71 | (1.11) | .48 |
| Total from investment operations | (.04) | 1.55 | 1.81 | (1.00) | .65 |
| Distributions from net investment income | (.19) | (.14) | (.09) | (.12) | (.62) |
| Distributions from net realized gain | (1.13) | (.24) | (.46) | (.57) | (1.06) |
| Total distributions | (1.32) | (.37)E | (.55) | (.69) | (1.68) |
| Redemption fees added to paid in capitalB | – | –F | –F | –F | –F |
| Net asset value, end of period | $8.93 | $10.29 | $9.11 | $7.85 | $9.54 |
| Total ReturnG | .21%D | 17.21% | 24.09% | (11.07)% | 7.55% |
| Ratios to Average Net AssetsH,I | | | | | |
| Expenses before reductions | .83% | .83% | .87% | .86% | .86% |
| Expenses net of fee waivers, if any | .83% | .83% | .87% | .86% | .86% |
| Expenses net of all reductions | .82% | .82% | .86% | .85% | .85% |
| Net investment income (loss) | 2.07%C | 1.61% | 1.23% | 1.23% | 1.76% |
| Supplemental Data | | | | | |
| Net assets, end of period (000 omitted) | $237,907 | $275,742 | $239,359 | $207,492 | $270,449 |
| Portfolio turnover rateJ | 54% | 85% | 98% | 78% | 48% |
A For the year ended February 29.
B Calculated based on average shares outstanding during the period.
C Net investment income per share reflects a large, non-recurring dividend which amounted to $.03 per share. Excluding this non-recurring dividend, the ratio of net investment income (loss) to average net assets would have been 1.74%.
D Net realized and unrealized gain (loss) per share reflects proceeds received from litigation which amounted to $.01 per share. Excluding these litigation proceeds, the total return would have been .12%.
E Total distributions of $.37 per share is comprised of distributions from net investment income of $.136 and distributions from net realized gain of $.235 per share.
F Amount represents less than $.005 per share.
G Total returns would have been lower if certain expenses had not been reduced during the applicable periods shown.
H Fees and expenses of any underlying Fidelity Central Funds are not included in the Fund's expense ratio. The Fund indirectly bears its proportionate share of the expenses of any underlying Fidelity Central Funds.
I Expense ratios reflect operating expenses of the Fund. Expenses before reductions do not reflect amounts reimbursed by the investment adviser or reductions from brokerage service arrangements or reductions from other expense offset arrangements and do not represent the amount paid by the Fund during periods when reimbursements or reductions occur. Expenses net of fee waivers reflect expenses after reimbursement by the investment adviser but prior to reductions from brokerage service arrangements or other expense offset arrangements. Expenses net of all reductions represent the net expenses paid by the Fund.
J Amount does not include the portfolio activity of any underlying Fidelity Central Funds.
See accompanying notes which are an integral part of the financial statements.
Notes to Financial Statements
For the period ended February 28, 2019
1. Organization.
Wireless Portfolio (the Fund) is a non-diversified fund of Fidelity Select Portfolios (the Trust) and is authorized to issue an unlimited number of shares. Share transactions on the Statement of Changes in Net Assets may contain exchanges between affiliated funds. The Trust is registered under the Investment Company Act of 1940, as amended (the 1940 Act), as an open-end management investment company organized as a Massachusetts business trust. The Fund invests primarily in securities of companies whose principal business activities fall within specific industries.
2. Investments in Fidelity Central Funds.
The Fund invests in Fidelity Central Funds, which are open-end investment companies generally available only to other investment companies and accounts managed by the investment adviser and its affiliates. The Fund's Schedule of Investments lists each of the Fidelity Central Funds held as of period end, if any, as an investment of the Fund, but does not include the underlying holdings of each Fidelity Central Fund. As an Investing Fund, the Fund indirectly bears its proportionate share of the expenses of the underlying Fidelity Central Funds.
The Money Market Central Funds seek preservation of capital and current income and are managed by Fidelity Investments Money Management, Inc. (FIMM), an affiliate of the investment adviser. Annualized expenses of the Money Market Central Funds as of their most recent shareholder report date are less than .005%.
A complete unaudited list of holdings for each Fidelity Central Fund is available upon request or at the Securities and Exchange Commission (the SEC) website at www.sec.gov. In addition, the financial statements of the Fidelity Central Funds, which are not covered by the Fund's Report of Independent Registered Public Accounting Firm, are available on the SEC website or upon request.
3. Significant Accounting Policies.
The Fund is an investment company and applies the accounting and reporting guidance of the Financial Accounting Standards Board (FASB) Accounting Standards Codification Topic 946 Financial Services – Investments Companies. The financial statements have been prepared in conformity with accounting principles generally accepted in the United States of America (GAAP), which require management to make certain estimates and assumptions at the date of the financial statements. Actual results could differ from those estimates. Subsequent events, if any, through the date that the financial statements were issued have been evaluated in the preparation of the financial statements. The following summarizes the significant accounting policies of the Fund:
Investment Valuation. Investments are valued as of 4:00 p.m. Eastern time on the last calendar day of the period. The Board of Trustees (the Board) has delegated the day to day responsibility for the valuation of the Fund's investments to the Fair Value Committee (the Committee) established by the Fund's investment adviser. In accordance with valuation policies and procedures approved by the Board, the Fund attempts to obtain prices from one or more third party pricing vendors or brokers to value its investments. When current market prices, quotations or currency exchange rates are not readily available or reliable, investments will be fair valued in good faith by the Committee, in accordance with procedures adopted by the Board. Factors used in determining fair value vary by investment type and may include market or investment specific events. The frequency with which these procedures are used cannot be predicted and they may be utilized to a significant extent. The Committee oversees the Fund's valuation policies and procedures and reports to the Board on the Committee's activities and fair value determinations. The Board monitors the appropriateness of the procedures used in valuing the Fund's investments and ratifies the fair value determinations of the Committee.
The Fund categorizes the inputs to valuation techniques used to value its investments into a disclosure hierarchy consisting of three levels as shown below:
- Level 1 – quoted prices in active markets for identical investments
- Level 2 – other significant observable inputs (including quoted prices for similar investments, interest rates, prepayment speeds, etc.)
- Level 3 – unobservable inputs (including the Fund's own assumptions based on the best information available)
Valuation techniques used to value the Fund's investments by major category are as follows:
Equity securities, including restricted securities, for which market quotations are readily available, are valued at the last reported sale price or official closing price as reported by a third party pricing vendor on the primary market or exchange on which they are traded and are categorized as Level 1 in the hierarchy. In the event there were no sales during the day or closing prices are not available, securities are valued at the last quoted bid price or may be valued using the last available price and are generally categorized as Level 2 in the hierarchy. For foreign equity securities, when market or security specific events arise, comparisons to the valuation of American Depositary Receipts (ADRs), futures contracts, Exchange-Traded Funds (ETFs) and certain indexes as well as quoted prices for similar securities may be used and would be categorized as Level 2 in the hierarchy. For equity securities, including restricted securities, where observable inputs are limited, assumptions about market activity and risk are used and these securities may be categorized as Level 3 in the hierarchy.
Investments in open-end mutual funds, including the Fidelity Central Funds, are valued at their closing net asset value (NAV) each business day and are categorized as Level 1 in the hierarchy.
Changes in valuation techniques may result in transfers in or out of an assigned level within the disclosure hierarchy. The aggregate value of investments by input level as of February 28, 2019 is included at the end of the Fund's Schedule of Investments.
Foreign Currency. The Fund may use foreign currency contracts to facilitate transactions in foreign-denominated securities. Gains and losses from these transactions may arise from changes in the value of the foreign currency or if the counterparties do not perform under the contracts' terms.
Foreign-denominated assets, including investment securities, and liabilities are translated into U.S. dollars at the exchange rates at period end. Purchases and sales of investment securities, income and dividends received and expenses denominated in foreign currencies are translated into U.S. dollars at the exchange rate in effect on the transaction date.
The effects of exchange rate fluctuations on investments are included with the net realized and unrealized gain (loss) on investment securities. Other foreign currency transactions resulting in realized and unrealized gain (loss) are disclosed separately.
Investment Transactions and Income. For financial reporting purposes, the Fund's investment holdings and NAV include trades executed through the end of the last business day of the period. The NAV per share for processing shareholder transactions is calculated as of the close of business of the New York Stock Exchange (NYSE), normally 4:00 p.m. Eastern time and includes trades executed through the end of the prior business day. Gains and losses on securities sold are determined on the basis of identified cost and include proceeds received from litigation. Dividend income is recorded on the ex-dividend date, except for certain dividends from foreign securities where the ex-dividend date may have passed, which are recorded as soon as the Fund is informed of the ex-dividend date. Non-cash dividends included in dividend income, if any, are recorded at the fair market value of the securities received. Income and capital gain distributions from Fidelity Central Funds, if any, are recorded on the ex-dividend date. Certain distributions received by the Fund represent a return of capital or capital gain. The Fund determines the components of these distributions subsequent to the ex-dividend date, based upon receipt of tax filings or other correspondence relating to the underlying investment. These distributions are recorded as a reduction of cost of investments and/or as a realized gain. Large, non-recurring dividends recognized by the Fund are presented separately on the Statement of Operations as "Non-cash dividends" and the impact of these dividends is presented in the Financial Highlights. Investment income is recorded net of foreign taxes withheld where recovery of such taxes is uncertain.
Expenses. Expenses directly attributable to a fund are charged to that fund. Expenses attributable to more than one fund are allocated among the respective funds on the basis of relative net assets or other appropriate methods. Expense estimates are accrued in the period to which they relate and adjustments are made when actual amounts are known.
Income Tax Information and Distributions to Shareholders. Each year, the Fund intends to qualify as a regulated investment company under Subchapter M of the Internal Revenue Code, including distributing substantially all of its taxable income and realized gains. As a result, no provision for U.S. Federal income taxes is required. As of February 28, 2019, the Fund did not have any unrecognized tax benefits in the financial statements; nor is the Fund aware of any tax positions for which it is reasonably possible that the total amounts of unrecognized tax benefits will significantly change in the next twelve months. The Fund files a U.S. federal tax return, in addition to state and local tax returns as required. The Fund's federal income tax returns are subject to examination by the Internal Revenue Service (IRS) for a period of three fiscal years after they are filed. State and local tax returns may be subject to examination for an additional fiscal year depending on the jurisdiction. Foreign taxes are provided for based on the Fund's understanding of the tax rules and rates that exist in the foreign markets in which it invests.
Distributions are declared and recorded on the ex-dividend date. Income and capital gain distributions are determined in accordance with income tax regulations, which may differ from GAAP. In addition, the Fund claimed a portion of the payment made to redeeming shareholders as a distribution for income tax purposes.
Capital accounts within the financial statements are adjusted for permanent book-tax differences. These adjustments have no impact on net assets or the results of operations. Capital accounts are not adjusted for temporary book-tax differences which will reverse in a subsequent period.
Book-tax differences are primarily due to foreign currency transactions and losses deferred due to wash sales and excise tax regulations.
As of period end, the cost and unrealized appreciation (depreciation) in securities, and derivatives if applicable, for federal income tax purposes were as follows:
| Gross unrealized appreciation | $50,394,873 |
| Gross unrealized depreciation | (20,666,397) |
| Net unrealized appreciation (depreciation) | $29,728,476 |
| Tax Cost | $220,573,711 |
The tax-based components of distributable earnings as of period end were as follows:
| Net unrealized appreciation (depreciation) on securities and other investments | $29,725,738 |
The Fund intends to elect to defer to its next fiscal year $1,891,040 of capital losses recognized during the period November 1, 2018 to February 28, 2019.
The tax character of distributions paid was as follows:
| | February 28, 2019 | February 28, 2018 |
| Ordinary Income | $4,622,795 | $ 3,684,850 |
| Long-term Capital Gains | 27,069,430 | 6,158,608 |
| Total | $31,692,225 | $ 9,843,458 |
Restricted Securities. The Fund may invest in securities that are subject to legal or contractual restrictions on resale. These securities generally may be resold in transactions exempt from registration or to the public if the securities are registered. Disposal of these securities may involve time-consuming negotiations and expense, and prompt sale at an acceptable price may be difficult. Information regarding restricted securities is included at the end of the Fund's Schedule of Investments.
New Rule Issuance. During August 2018, the U.S. Securities and Exchange Commission issued Final Rule Release No. 33-10532, Disclosure Update and Simplification. This Final Rule includes amendments specific to registered investment companies that are intended to eliminate overlap in disclosure requirements between Regulation S-X and GAAP. In accordance with these amendments, certain line-items in the Fund's financial statements have been combined or removed for the current period as outlined in the table below.
| Financial Statement | Current Line-Item Presentation (As Applicable) | Prior Line-Item Presentation (As Applicable) |
| Statement of Assets and Liabilities | Total distributable earnings (loss) | Undistributed/Distributions in excess of/Accumulated net investment income (loss)
Accumulated/Undistributed net realized gain (loss)
Net unrealized appreciation (depreciation) |
| Statement of Changes in Net Assets | N/A - removed | Undistributed/Distributions in excess of/Accumulated net investment income (loss) end of period |
| Statement of Changes in Net Assets | Distributions to shareholders | Distributions to shareholders from net investment income
Distributions to shareholders from net realized gain |
4. Purchases and Sales of Investments.
Purchases and sales of securities, other than short-term securities, aggregated $131,825,584 and $161,770,992, respectively.
5. Fees and Other Transactions with Affiliates.
Management Fee. Fidelity SelectCo, LLC (the investment adviser) and its affiliates provide the Fund with investment management related services for which the Fund pays a monthly management fee. The management fee is the sum of an individual fund fee rate that is based on an annual rate of .30% of the Fund's average net assets and an annualized group fee rate that averaged .24% during the period. The group fee rate is based upon the average net assets of all the mutual funds advised by Fidelity Management & Research Company (FMR) and the investment adviser. The group fee rate decreases as assets under management increase and increases as assets under management decrease. For the reporting period, the total annual management fee rate was .54% of the Fund's average net assets.
Transfer Agent Fees. Fidelity Investments Institutional Operations Company, Inc. (FIIOC), an affiliate of the investment adviser, is the Fund's transfer, dividend disbursing and shareholder servicing agent. FIIOC receives account fees and asset-based fees that vary according to account size and type of account. FIIOC pays for typesetting, printing and mailing of shareholder reports, except proxy statements. For the period, the transfer agent fees were equivalent to an annual rate of .20% of average net assets.
Accounting and Security Lending Fees. Fidelity Service Company, Inc. (FSC), an affiliate of the investment adviser, maintains the Fund's accounting records. The accounting fee is based on the level of average net assets for each month. Under a separate contract, FSC administers the security lending program. The security lending fee is based on the number and duration of lending transactions. For the period, the fees were equivalent to an annual rate of .04%.
Brokerage Commissions. The Fund placed a portion of its portfolio transactions with brokerage firms which are affiliates of the investment adviser. Brokerage commissions are included in net realized gain (loss) and change in net unrealized appreciation (depreciation) in the Statement of Operations. The commissions paid to these affiliated firms were $2,755 for the period.
Interfund Lending Program. Pursuant to an Exemptive Order issued by the SEC, the Fund, along with other registered investment companies having management contracts with Fidelity Management & Research Company (FMR) or other affiliated entities of FMR, may participate in an interfund lending program. This program provides an alternative credit facility allowing the funds to borrow from, or lend money to, other participating affiliated funds. At period end, there were no interfund loans outstanding. The Fund's activity in this program during the period for which loans were outstanding was as follows:
| Borrower or Lender | Average Loan Balance | Weighted Average Interest Rate | Interest Expense |
| Borrower | $6,554,000 | 1.94% | $707 |
Interfund Trades. The Fund may purchase from or sell securities to other Fidelity Funds under procedures adopted by the Board. The procedures have been designed to ensure these interfund trades are executed in accordance with Rule 17a-7 of the 1940 Act. Interfund trades are included within the respective purchases and sales amounts shown in the Purchases and Sales of Investments note.
6. Committed Line of Credit.
The Fund participates with other funds managed by the investment adviser or an affiliate in a $4.25 billion credit facility (the "line of credit") to be utilized for temporary or emergency purposes to fund shareholder redemptions or for other short-term liquidity purposes. The Fund has agreed to pay commitment fees on its pro-rata portion of the line of credit, which amounted to $691 and is reflected in Miscellaneous expenses on the Statement of Operations. During the period, the Fund did not borrow on this line of credit.
7. Security Lending.
The Fund lends portfolio securities through a lending agent from time to time in order to earn additional income. On the settlement date of the loan, the Fund receives collateral (in the form of U.S. Treasury obligations, letters of credit and/or cash) against the loaned securities and maintains collateral in an amount not less than 100% of the market value of the loaned securities during the period of the loan. The market value of the loaned securities is determined at the close of business of the Fund and any additional required collateral is delivered to the Fund on the next business day. The Fund or borrower may terminate the loan at any time, and if the borrower defaults on its obligation to return the securities loaned because of insolvency or other reasons, the Fund may apply collateral received from the borrower against the obligation. The Fund may experience delays and costs in recovering the securities loaned. Any cash collateral received is invested in the Fidelity Securities Lending Cash Central Fund. The value of loaned securities and cash collateral at period end are disclosed on the Fund's Statement of Assets and Liabilities. Security lending income represents the income earned on investing cash collateral, less rebates paid to borrowers and any lending agent fees associated with the loan, plus any premium payments received for lending certain types of securities. Security lending income is presented in the Statement of Operations as a component of income from Fidelity Central Funds. Total security lending income during the period amounted to $217,308.
8. Expense Reductions.
Commissions paid to certain brokers with whom the investment adviser, or its affiliates, places trades on behalf of the Fund include an amount in addition to trade execution, which may be rebated back to the Fund to offset certain expenses. This amount totaled $19,364 for the period.
In addition, during the period the investment adviser reimbursed and/or waived a portion of operating expenses in the amount of $2,138.
9. Other.
The Fund's organizational documents provide former and current trustees and officers with a limited indemnification against liabilities arising in connection with the performance of their duties to the Fund. In the normal course of business, the Fund may also enter into contracts that provide general indemnifications. The Fund's maximum exposure under these arrangements is unknown as this would be dependent on future claims that may be made against the Fund. The risk of material loss from such claims is considered remote.
Report of Independent Registered Public Accounting Firm
To the Board of Trustees of Fidelity Select Portfolios and Shareholders of Telecommunications Portfolio and Wireless Portfolio:
Opinions on the Financial Statements
We have audited the accompanying statements of assets and liabilities, including the schedules of investments, of Telecommunications Portfolio and Wireless Portfolio (two of the funds constituting Fidelity Select Portfolios, hereafter collectively referred to as the "Funds") as of February 28, 2019, the related statements of operations for the year ended February 28, 2019, the statements of changes in net assets for each of the two years in the period ended February 28, 2019, including the related notes, and the financial highlights for each of the periods indicated therein (collectively referred to as the “financial statements”). In our opinion, the financial statements present fairly, in all material respects, the financial position of each of the Funds as of February 28, 2019, the results of each of their operations for the year then ended, the changes in each of their net assets for each of the two years in the period ended February 28, 2019 and each of the financial highlights for the periods indicated therein in conformity with accounting principles generally accepted in the United States of America.
Basis for Opinions
These financial statements are the responsibility of the Funds' management. Our responsibility is to express an opinion on the Funds' financial statements based on our audits. We are a public accounting firm registered with the Public Company Accounting Oversight Board (United States) (PCAOB) and are required to be independent with respect to the Funds in accordance with the U.S. federal securities laws and the applicable rules and regulations of the Securities and Exchange Commission and the PCAOB.
We conducted our audits of these financial statements in accordance with the standards of the PCAOB. Those standards require that we plan and perform the audit to obtain reasonable assurance about whether the financial statements are free of material misstatement, whether due to error or fraud.
Our audits included performing procedures to assess the risks of material misstatement of the financial statements, whether due to error or fraud, and performing procedures that respond to those risks. Such procedures included examining, on a test basis, evidence regarding the amounts and disclosures in the financial statements. Our audits also included evaluating the accounting principles used and significant estimates made by management, as well as evaluating the overall presentation of the financial statements. Our procedures included confirmation of securities owned as of February 28, 2019 by correspondence with the custodian. We believe that our audits provide a reasonable basis for our opinions.
PricewaterhouseCoopers LLP
Boston, Massachusetts
April 16, 2019
We have served as the auditor of one or more investment companies in the Fidelity group of funds since 1932.
Trustees and Officers
The Trustees, Members of the Advisory Board (if any), and officers of the trust and funds, as applicable, are listed below. The Board of Trustees governs each fund and is responsible for protecting the interests of shareholders. The Trustees are experienced executives who meet periodically throughout the year to oversee each fund's activities, review contractual arrangements with companies that provide services to each fund, oversee management of the risks associated with such activities and contractual arrangements, and review each fund's performance. Except for Michael E. Wiley, each of the Trustees oversees 287 funds. Mr. Wiley oversees 195 funds.
The Trustees hold office without limit in time except that (a) any Trustee may resign; (b) any Trustee may be removed by written instrument, signed by at least two-thirds of the number of Trustees prior to such removal; (c) any Trustee who requests to be retired or who has become incapacitated by illness or injury may be retired by written instrument signed by a majority of the other Trustees; and (d) any Trustee may be removed at any special meeting of shareholders by a two-thirds vote of the outstanding voting securities of the trust. Each Trustee who is not an interested person (as defined in the 1940 Act) of the trust and the funds is referred to herein as an Independent Trustee. Each Independent Trustee shall retire not later than the last day of the calendar year in which his or her 75th birthday occurs. The Independent Trustees may waive this mandatory retirement age policy with respect to individual Trustees. Officers and Advisory Board Members hold office without limit in time, except that any officer or Advisory Board Member may resign or may be removed by a vote of a majority of the Trustees at any regular meeting or any special meeting of the Trustees. Except as indicated, each individual has held the office shown or other offices in the same company for the past five years.
Each fund's Statement of Additional Information (SAI) includes more information about the Trustees. To request a free copy, call Fidelity at 1-800-544-8544 if you’re an individual investing directly with Fidelity, call 1-800-835-5092 if you’re a plan sponsor or participant with Fidelity as your recordkeeper or call 1-877-208-0098 on institutional accounts or if you’re an advisor or invest through one.
Experience, Skills, Attributes, and Qualifications of the Trustees. The Governance and Nominating Committee has adopted a statement of policy that describes the experience, qualifications, attributes, and skills that are necessary and desirable for potential Independent Trustee candidates (Statement of Policy). The Board believes that each Trustee satisfied at the time he or she was initially elected or appointed a Trustee, and continues to satisfy, the standards contemplated by the Statement of Policy. The Governance and Nominating Committee also engages professional search firms to help identify potential Independent Trustee candidates who have the experience, qualifications, attributes, and skills consistent with the Statement of Policy. From time to time, additional criteria based on the composition and skills of the current Independent Trustees, as well as experience or skills that may be appropriate in light of future changes to board composition, business conditions, and regulatory or other developments, have also been considered by the professional search firms and the Governance and Nominating Committee. In addition, the Board takes into account the Trustees' commitment and participation in Board and committee meetings, as well as their leadership of standing and ad hoc committees throughout their tenure.
In determining that a particular Trustee was and continues to be qualified to serve as a Trustee, the Board has considered a variety of criteria, none of which, in isolation, was controlling. The Board believes that, collectively, the Trustees have balanced and diverse experience, qualifications, attributes, and skills, which allow the Board to operate effectively in governing each fund and protecting the interests of shareholders. Information about the specific experience, skills, attributes, and qualifications of each Trustee, which in each case led to the Board's conclusion that the Trustee should serve (or continue to serve) as a trustee of the funds, is provided below.
Board Structure and Oversight Function. James C. Curvey is an interested person and currently serves as Chairman. The Trustees have determined that an interested Chairman is appropriate and benefits shareholders because an interested Chairman has a personal and professional stake in the quality and continuity of services provided to the funds. Independent Trustees exercise their informed business judgment to appoint an individual of their choosing to serve as Chairman, regardless of whether the Trustee happens to be independent or a member of management. The Independent Trustees have determined that they can act independently and effectively without having an Independent Trustee serve as Chairman and that a key structural component for assuring that they are in a position to do so is for the Independent Trustees to constitute a substantial majority for the Board. The Independent Trustees also regularly meet in executive session. Ned C. Lautenbach serves as Chairman of the Independent Trustees and as such (i) acts as a liaison between the Independent Trustees and management with respect to matters important to the Independent Trustees and (ii) with management prepares agendas for Board meetings.
Fidelity® funds are overseen by different Boards of Trustees. The funds' Board oversees Fidelity's high income and certain equity funds, and other Boards oversee Fidelity's investment-grade bond, money market, asset allocation, and other equity funds. The asset allocation funds may invest in Fidelity® funds overseen by the funds' Board. The use of separate Boards, each with its own committee structure, allows the Trustees of each group of Fidelity® funds to focus on the unique issues of the funds they oversee, including common research, investment, and operational issues. On occasion, the separate Boards establish joint committees to address issues of overlapping consequences for the Fidelity® funds overseen by each Board.
The Trustees operate using a system of committees to facilitate the timely and efficient consideration of all matters of importance to the Trustees, each fund, and fund shareholders and to facilitate compliance with legal and regulatory requirements and oversight of the funds' activities and associated risks. The Board, acting through its committees, has charged SelectCo and its affiliates with (i) identifying events or circumstances the occurrence of which could have demonstrably adverse effects on the funds' business and/or reputation; (ii) implementing processes and controls to lessen the possibility that such events or circumstances occur or to mitigate the effects of such events or circumstances if they do occur; and (iii) creating and maintaining a system designed to evaluate continuously business and market conditions in order to facilitate the identification and implementation processes described in (i) and (ii) above. Because the day-to-day operations and activities of the funds are carried out by or through SelectCo, its affiliates, and other service providers, the funds' exposure to risks is mitigated but not eliminated by the processes overseen by the Trustees. While each of the Board's committees has responsibility for overseeing different aspects of the funds' activities, oversight is exercised primarily through the Operations, Audit, and Compliance Committees. In addition, the Independent Trustees have worked with Fidelity to enhance the Board's oversight of investment and financial risks, legal and regulatory risks, technology risks, and operational risks, including the development of additional risk reporting to the Board. Appropriate personnel, including but not limited to the funds' Chief Compliance Officer (CCO), SelectCo's internal auditor, the independent accountants, the funds' Treasurer and portfolio management personnel, make periodic reports to the Board's committees, as appropriate, including an annual review of Fidelity's risk management program for the Fidelity® funds. The responsibilities of each standing committee, including their oversight responsibilities, are described further under "Standing Committees of the Trustees."
Interested Trustees*:
Correspondence intended for a Trustee who is an interested person may be sent to Fidelity Investments, 245 Summer Street, Boston, Massachusetts 02210.
Name, Year of Birth; Principal Occupations and Other Relevant Experience+
James C. Curvey (1935)
Year of Election or Appointment: 2018
Trustee
Chairman of the Board of Trustees
Mr. Curvey also serves as Trustee of other Fidelity® funds. Mr. Curvey is Vice Chairman (2007-present) and Director of FMR LLC (diversified financial services company). In addition, Mr. Curvey is an Overseer Emeritus for the Boston Symphony Orchestra, a Director of Artis-Naples, and a Trustee of Brewster Academy in Wolfeboro, New Hampshire. Previously, Mr. Curvey served as a Director of Fidelity Research & Analysis Co. (investment adviser firm, 2009-2018), Director of Fidelity Investments Money Management, Inc. (investment adviser firm, 2009-2014) and a Director of FMR and FMR Co., Inc. (investment adviser firms, 2007-2014).
* Determined to be an "Interested Trustee" by virtue of, among other things, his or her affiliation with the trust or various entities under common control with SelectCo.
+ The information includes the Trustee's principal occupation during the last five years and other information relating to the experience, attributes, and skills relevant to the Trustee's qualifications to serve as a Trustee, which led to the conclusion that the Trustee should serve as a Trustee for each fund.
Independent Trustees:
Correspondence intended for an Independent Trustee may be sent to Fidelity Investments, P.O. Box 55235, Boston, Massachusetts 02205-5235.
Name, Year of Birth; Principal Occupations and Other Relevant Experience+
Dennis J. Dirks (1948)
Year of Election or Appointment: 2018
Trustee
Mr. Dirks also serves as Trustee of other Fidelity® funds. Prior to his retirement in May 2003, Mr. Dirks was Chief Operating Officer and a member of the Board of The Depository Trust & Clearing Corporation (DTCC). He also served as President, Chief Operating Officer, and Board member of The Depository Trust Company (DTC) and President and Board member of the National Securities Clearing Corporation (NSCC). In addition, Mr. Dirks served as Chief Executive Officer and Board member of the Government Securities Clearing Corporation, Chief Executive Officer and Board member of the Mortgage-Backed Securities Clearing Corporation, as a Trustee and a member of the Finance Committee of Manhattan College (2005-2008), as a Trustee and a member of the Finance Committee of AHRC of Nassau County (2006-2008), as a member of the Independent Directors Council (IDC) Governing Council (2010-2015), and as a member of the Board of Directors for The Brookville Center for Children’s Services, Inc. (2009-2017). Mr. Dirks is a member of the Finance Committee (2016-present) and Board of Directors (2017-present) and is Treasurer (2018-present) of the Asolo Repertory Theatre.
Donald F. Donahue (1950)
Year of Election or Appointment: 2018
Trustee
Mr. Donahue also serves as a Trustee of other Fidelity® funds. Mr. Donahue is President and Chief Executive Officer of Miranda Partners, LLC (risk consulting for the financial services industry, 2012-present). Previously, Mr. Donahue served as a Member of the Advisory Board of certain Fidelity® funds (2015-2018) and Chief Executive Officer (2006-2012), Chief Operating Officer (2003-2006), and Managing Director, Customer Marketing and Development (1999-2003) of The Depository Trust & Clearing Corporation (financial markets infrastructure). Mr. Donahue serves as a Member (2007-present) and Co-Chairman (2016-present) of the Board of Directors of United Way of New York, Member of the Board of Directors of NYC Leadership Academy (2012-present) and Member of the Board of Advisors of Ripple Labs, Inc. (financial services, 2015-present). He also served as Chairman (2010-2012) and Member of the Board of Directors (2012-2013) of Omgeo, LLC (financial services), Treasurer of United Way of New York (2012-2016), and Member of the Board of Directors of XBRL US (financial services non-profit, 2009-2012) and the International Securities Services Association (2009-2012).
Alan J. Lacy (1953)
Year of Election or Appointment: 2018
Trustee
Mr. Lacy also serves as Trustee of other Fidelity® funds. Mr. Lacy serves as a Director of Bristol-Myers Squibb Company (global pharmaceuticals, 2008-present). He is a Trustee of the California Chapter of The Nature Conservancy (2015-present) and a Director of the Center for Advanced Study in the Behavioral Sciences at Stanford University (2015-present). In addition, Mr. Lacy served as Senior Adviser (2007-2014) of Oak Hill Capital Partners, L.P. (private equity) and also served as Chief Executive Officer (2005) and Vice Chairman (2005-2006) of Sears Holdings Corporation (retail) and Chief Executive Officer and Chairman of the Board of Sears, Roebuck and Co. (retail, 2000-2005). Previously, Mr. Lacy served as Chairman (2014-2017) and a member (2010-2017) of the Board of Directors of Dave & Buster’s Entertainment, Inc. (restaurant and entertainment complexes), as Chairman (2008-2011) and a member (2006-2015) of the Board of Trustees of the National Parks Conservation Association, and as a member of the Board of Directors for The Hillman Companies, Inc. (hardware wholesalers, 2010-2014), Earth Fare, Inc. (retail grocery, 2010-2014), and The Western Union Company (global money transfer, 2006-2011).
Ned C. Lautenbach (1944)
Year of Election or Appointment: 2018
Trustee
Chairman of the Independent Trustees
Mr. Lautenbach also serves as Trustee of other Fidelity® funds. Mr. Lautenbach currently serves as Chair (2018-present) and Member (2013-present) of the Board of Governors, State University System of Florida and is a member of the Council on Foreign Relations (1994-present). He is also a member and has most recently served as Chairman of the Board of Directors of Artis-Naples (2012-present). Previously, Mr. Lautenbach served as a member and then Lead Director of the Board of Directors of Eaton Corporation (diversified industrial, 1997-2016). He was also a Partner and Advisory Partner at Clayton, Dubilier & Rice, LLC (private equity investment, 1998-2010), as well as a Director of Sony Corporation (2006-2007). In addition, Mr. Lautenbach also had a 30-year career with IBM (technology company) during which time he served as Senior Vice President and a member of the Corporate Executive Committee (1968-1998).
Joseph Mauriello (1944)
Year of Election or Appointment: 2018
Trustee
Mr. Mauriello also serves as Trustee of other Fidelity® funds. Prior to his retirement in January 2006, Mr. Mauriello served in numerous senior management positions including Deputy Chairman and Chief Operating Officer (2004-2005), and Vice Chairman of Financial Services (2002-2004) of KPMG LLP US (professional services, 1965-2005). Mr. Mauriello currently serves as a member of the Independent Directors Council (IDC) Governing Council (2015-present). Previously, Mr. Mauriello served as a member of the Board of Directors of XL Group plc. (global insurance and re-insurance, 2006-2018).
Cornelia M. Small (1944)
Year of Election or Appointment: 2018
Trustee
Ms. Small also serves as Trustee of other Fidelity® funds. Ms. Small is a member of the Board of Directors (2009-present) and Chair of the Investment Committee (2010-present) of the Teagle Foundation. Ms. Small also serves on the Investment Committee of the Berkshire Taconic Community Foundation (2008-present). Previously, Ms. Small served as Chairperson (2002-2008) and a member of the Investment Committee and Chairperson (2008-2012) and a member of the Board of Trustees of Smith College. In addition, Ms. Small served as Chief Investment Officer, Director of Global Equity Investments, and a member of the Board of Directors of Scudder, Stevens & Clark and Scudder Kemper Investments.
Garnett A. Smith (1947)
Year of Election or Appointment: 2013
Trustee
Mr. Smith also serves as Trustee of other Fidelity® funds. Prior to Mr. Smith's retirement, he served as Chairman and Chief Executive Officer of Inbrand Corp. (manufacturer of personal absorbent products, 1990-1997). He also served as President (1986-1990) of Inbrand Corp. Prior to his employment with Inbrand Corp., he was employed by a retail fabric chain and North Carolina National Bank. In addition, Mr. Smith served as a Member of the Advisory Board of certain Fidelity® funds (2012-2013) and as a board member of the Jackson Hole Land Trust (2009-2012).
David M. Thomas (1949)
Year of Election or Appointment: 2018
Trustee
Mr. Thomas also serves as Trustee of other Fidelity® funds. Mr. Thomas serves as Non-Executive Chairman of the Board of Directors of Fortune Brands Home and Security (home and security products, 2011-present) and as a member of the Board of Directors (2004-present) and Presiding Director (2013-present) of Interpublic Group of Companies, Inc. (marketing communication). Previously, Mr. Thomas served as Executive Chairman (2005-2006) and Chairman and Chief Executive Officer (2000-2005) of IMS Health, Inc. (pharmaceutical and healthcare information solutions), a Director of Fortune Brands, Inc. (consumer products, 2000-2011), and a member of the Board of Trustees of the University of Florida (2013-2018).
Michael E. Wiley (1950)
Year of Election or Appointment: 2008
Trustee
Mr. Wiley also serves as Trustee or Member of the Advisory Board of other Fidelity® funds. Mr. Wiley serves as a Director of High Point Resources (exploration and production, 2005-present). Previously, Mr. Wiley served as a Director of Andeavor Corporation (independent oil refiner and marketer, 2005-2018), a Director of Andeavor Logistics LP (natural resources logistics, 2015-2018), a Director of Post Oak Bank (privately-held bank, 2004-2018), a Director of Asia Pacific Exploration Consolidated (international oil and gas exploration and production, 2008-2013), a member of the Board of Trustees of the University of Tulsa (2000-2006; 2007-2010), a Senior Energy Advisor of Katzenbach Partners, LLC (consulting, 2006-2007), an Advisory Director of Riverstone Holdings (private investment), a Director of Spinnaker Exploration Company (exploration and production, 2001-2005) and Chairman, President, and CEO of Baker Hughes, Inc. (oilfield services, 2000-2004).
+ The information includes the Trustee's principal occupation during the last five years and other information relating to the experience, attributes, and skills relevant to the Trustee's qualifications to serve as a Trustee, which led to the conclusion that the Trustee should serve as a Trustee for each fund.
Advisory Board Members and Officers:
Correspondence intended for a Member of the Advisory Board (if any) may be sent to Fidelity Investments, P.O. Box 55235, Boston, Massachusetts 02205-5235. Correspondence intended for an officer or Peter S. Lynch may be sent to Fidelity Investments, 245 Summer Street, Boston, Massachusetts 02210. Officers appear below in alphabetical order.
Name, Year of Birth; Principal Occupation
Vicki L. Fuller (1957)
Year of Election or Appointment: 2018
Member of the Advisory Board
Ms. Fuller also serves as Member of the Advisory Board of other Fidelity® funds. Ms. Fuller serves as a member of the Board of Directors, Audit Committee, and Nominating and Governance Committee of The Williams Companies, Inc. (natural gas infrastructure, 2018-present). Previously, Ms. Fuller served as the Chief Investment Officer of the New York State Common Retirement Fund (2012-2018) and held a variety of positions at AllianceBernstein L.P. (global asset management, 1985-2012), including Managing Director (2006-2012) and Senior Vice President and Senior Portfolio Manager (2001-2006).
Peter S. Lynch (1944)
Year of Election or Appointment: 2018
Member of the Advisory Board
Mr. Lynch also serves as Member of the Advisory Board of other Fidelity® funds. Mr. Lynch is Vice Chairman and a Director of FMR (investment adviser firm) and FMR Co., Inc. (investment adviser firm). In addition, Mr. Lynch serves as a Trustee of Boston College and as the Chairman of the Inner-City Scholarship Fund. Previously, Mr. Lynch served on the Special Olympics International Board of Directors (1997-2006).
Carol B. Tomé (1957)
Year of Election or Appointment: 2017
Member of the Advisory Board
Ms. Tomé also serves as Member of the Advisory Board of other Fidelity® funds. Ms. Tomé is Chief Financial Officer (2001-present) and Executive Vice President of Corporate Services (2007-present) of The Home Depot, Inc. (home improvement retailer) and a Director (2003-present) and Chair of the Audit Committee (2004-present) of United Parcel Service, Inc. (package delivery and supply chain management). Previously, Ms. Tomé served as Trustee of certain Fidelity® funds (2017), Senior Vice President of Finance and Accounting/Treasurer (2000-2007) and Vice President and Treasurer (1995-2000) of The Home Depot, Inc. and Chair of the Board (2010-2012), Vice Chair of the Board (2009 and 2013), and a Director (2008-2013) of the Federal Reserve Bank of Atlanta. Ms. Tomé is also a director or trustee of many community and professional organizations.
Elizabeth Paige Baumann (1968)
Year of Election or Appointment: 2017
Anti-Money Laundering (AML) Officer
Ms. Baumann also serves as AML Officer of other funds. She is Chief AML Officer (2012-present) and Senior Vice President (2014-present) of FMR LLC (diversified financial services company) and is an employee of Fidelity Investments. Previously, Ms. Baumann served as AML Officer of the funds (2012-2016), and Vice President (2007-2014) and Deputy Anti-Money Laundering Officer (2007-2012) of FMR LLC.
Craig S. Brown (1977)
Year of Election or Appointment: 2019
Assistant Treasurer
Mr. Brown also serves as Assistant Treasurer of other funds. Mr. Brown is an employee of Fidelity Investments (2013-present).
John J. Burke III (1964)
Year of Election or Appointment: 2018
Chief Financial Officer
Mr. Burke also serves as Chief Financial Officer of other funds. Mr. Burke serves as Head of Investment Operations for Fidelity Fund and Investment Operations (2018-present) and is an employee of Fidelity Investments (1998-present). Previously Mr. Burke served as head of Asset Management Investment Operations (2012-2018).
William C. Coffey (1969)
Year of Election or Appointment: 2018
Secretary and Chief Legal Officer (CLO)
Mr. Coffey also serves as Secretary and CLO of other funds. Mr. Coffey serves as CLO, Secretary, and Senior Vice President of Fidelity Management & Research Company and FMR Co., Inc. (investment adviser firms, 2018-present); Secretary of Fidelity SelectCo, LLC and Fidelity Investments Money Management, Inc. (investment adviser firms, 2018-present); and CLO of Fidelity Management & Research (Hong Kong) Limited, FMR Investment Management (UK) Limited, and Fidelity Management & Research (Japan) Limited (investment adviser firms, 2018-present). He is Senior Vice President and Deputy General Counsel of FMR LLC (diversified financial services company, 2010-present), and is an employee of Fidelity Investments. Previously, Mr. Coffey served as Assistant Secretary of certain funds (2009-2018) and as Vice President and Associate General Counsel of FMR LLC (2005-2009).
Timothy M. Cohen (1969)
Year of Election or Appointment: 2018
Vice President
Mr. Cohen also serves as Vice President of other funds. Mr. Cohen serves as Co-Head of Global Equity Research (2016-present), a Director of Fidelity Management & Research (Japan) Limited (investment adviser firm, 2016-present), and is an employee of Fidelity Investments. Previously, Mr. Cohen served as Chief Investment Officer - Equity and a Director of Fidelity Management & Research (U.K.) Inc. (investment adviser firm, 2013-2015) and as a Director of Fidelity Management & Research (Hong Kong) Limited (investment adviser firm, 2017).
Jonathan Davis (1968)
Year of Election or Appointment: 2010
Assistant Treasurer
Mr. Davis also serves as Assistant Treasurer of other funds. Mr. Davis serves as Assistant Treasurer of FMR Capital, Inc. (2017-present) and is an employee of Fidelity Investments. Previously, Mr. Davis served as Vice President and Associate General Counsel of FMR LLC (diversified financial services company, 2003-2010).
Adrien E. Deberghes (1967)
Year of Election or Appointment: 2018
Assistant Treasurer
Mr. Deberghes also serves as an officer of other funds. He serves as Assistant Treasurer of FMR Capital, Inc. (2017-present), Executive Vice President of Fidelity Investments Money Management, Inc. (FIMM) (investment adviser firm, 2016-present), and is an employee of Fidelity Investments (2008-present). Previously, Mr. Deberghes served as President and Treasurer of certain Fidelity® funds (2013-2018). Prior to joining Fidelity Investments, Mr. Deberghes was Senior Vice President of Mutual Fund Administration at State Street Corporation (2007-2008), Senior Director of Mutual Fund Administration at Investors Bank & Trust (2005-2007), and Director of Finance for Dunkin' Brands (2000-2005). Previously, Mr. Deberghes served in other fund officer roles.
Laura M. Del Prato (1964)
Year of Election or Appointment: 2018
Assistant Treasurer
Ms. Del Prato also serves as an officer of other funds. Ms. Del Prato is an employee of Fidelity Investments (2017-present). Prior to joining Fidelity Investments, Ms. Del Prato served as a Managing Director and Treasurer of the JPMorgan Mutual Funds (2014-2017). Prior to JPMorgan, Ms. Del Prato served as a partner at Cohen Fund Audit Services (accounting firm, 2012-2013) and KPMG LLP (accounting firm, 2004-2012).
Colm A. Hogan (1973)
Year of Election or Appointment: 2018
Deputy Treasurer
Mr. Hogan also serves as an officer of other funds. Mr. Hogan serves as Assistant Treasurer of FMR Capital, Inc. (2017-present) and is an employee of Fidelity Investments (2005-present). Previously, Mr. Hogan served as Assistant Treasurer of certain Fidelity® funds (2016-2018).
Pamela R. Holding (1964)
Year of Election or Appointment: 2018
Vice President
Ms. Holding also serves as Vice President of other funds. Ms. Holding serves as Co-Head of Global Equity Research (2018-present) and is an employee of Fidelity Investments (2013-present).
Chris Maher (1972)
Year of Election or Appointment: 2013
Assistant Treasurer
Mr. Maher serves as Assistant Treasurer of other funds. Mr. Maher is Vice President of Valuation Oversight, serves as Assistant Treasurer of FMR Capital, Inc. (2017-present), and is an employee of Fidelity Investments. Previously, Mr. Maher served as Vice President of Asset Management Compliance (2013), Vice President of the Program Management Group of FMR (investment adviser firm, 2010-2013), and Vice President of Valuation Oversight (2008-2010).
Kenneth B. Robins (1969)
Year of Election or Appointment: 2018
Chief Compliance Officer
Mr. Robins also serves as an officer of other funds. Mr. Robins serves as Compliance Officer of Fidelity Management & Research Company and FMR Co., Inc. (investment adviser firms, 2016-present) and is an employee of Fidelity Investments (2004-present). Previously, Mr. Robins served as Executive Vice President of Fidelity Investments Money Management, Inc. (investment adviser firm, 2013-2016) and served in other fund officer roles.
Stacie M. Smith (1974)
Year of Election or Appointment: 2018
President and Treasurer
Ms. Smith also serves as an officer of other funds. Ms. Smith serves as Assistant Treasurer of FMR Capital, Inc. (2017-present), is an employee of Fidelity Investments (2009-present), and has served in other fund officer roles. Prior to joining Fidelity Investments, Ms. Smith served as Senior Audit Manager of Ernst & Young LLP (accounting firm, 1996-2009). Previously, Ms. Smith served as Assistant Treasurer (2013-2018) and Deputy Treasurer (2013-2016) of certain Fidelity® funds.
Marc L. Spector (1972)
Year of Election or Appointment: 2017
Assistant Treasurer
Mr. Spector also serves as an officer of other funds. Mr. Spector serves as Assistant Treasurer of FMR Capital, Inc. (2017-present) and is an employee of Fidelity Investments (2016-present). Prior to joining Fidelity Investments, Mr. Spector served as Director at the Siegfried Group (accounting firm, 2013-2016), and prior to Siegfried Group as audit senior manager at Deloitte & Touche (accounting firm, 2005-2013).
Jim Wegmann (1979)
Year of Election or Appointment: 2019
Assistant Treasurer
Mr. Wegmann also serves as Assistant Treasurer of other funds. Mr. Wegmann is an employee of Fidelity Investments (2011-present).
Shareholder Expense Example
As a shareholder of a Fund, you incur two types of costs: (1) transaction costs, including sales charges (loads) on purchase payments or redemption proceeds, and (2) ongoing costs, including management fees, distribution and/or service (12b-1) fees and other Fund expenses. This Example is intended to help you understand your ongoing costs (in dollars) of investing in the Funds and to compare these costs with the ongoing costs of investing in other mutual funds.
The actual expense Example is based on an investment of $1,000 invested at the beginning of the period and held for the entire period (September 1, 2018 to February 28, 2019) for Class A, Class M, Class C, Telecommunications, Wireless Portfolio and Class I and for the period (October 2, 2018 to February 28, 2019) for Class Z. The hypothetical expense Example is based on an investment of $1,000 invested for the one-half year period (September 1, 2018 to February 28, 2019).
Actual Expenses
The first line of the accompanying table for each Class of each fund provides information about actual account values and actual expenses. You may use the information in this line, together with the amount you invested, to estimate the expenses that you paid over the period. Simply divide your account value by $1,000.00 (for example, an $8,600 account value divided by $1,000.00 = 8.6), then multiply the result by the number in the first line for a Class of the fund under the heading entitled "Expenses Paid During Period" to estimate the expenses you paid on your account during this period. In addition, each Fund, as a shareholder in the underlying Fidelity Central Funds, will indirectly bear its pro-rata share of the fees and expenses incurred by the underlying Fidelity Central Funds. These fees and expenses are not included in the Fund's annualized expense ratio used to calculate the expense estimate in the table below.
Hypothetical Example for Comparison Purposes
The second line of the accompanying table for each Class of each fund provides information about hypothetical account values and hypothetical expenses based on a Class' actual expense ratio and an assumed rate of return of 5% per year before expenses, which is not the Class' actual return. The hypothetical account values and expenses may not be used to estimate the actual ending account balance or expenses you paid for the period. You may use this information to compare the ongoing costs of investing in the Fund and other funds. To do so, compare this 5% hypothetical example with the 5% hypothetical examples that appear in the shareholder reports of the other funds. In addition, each Fund, as a shareholder in the underlying Fidelity Central Funds, will indirectly bear its pro-rata share of the fees and expenses incurred by the underlying Fidelity Central Funds. These fees and expenses are not included in the Fund's annualized expense ratio used to calculate the expense estimate in the table below.
Please note that the expenses shown in the table are meant to highlight your ongoing costs only and do not reflect any transaction costs. Therefore, the second line of the table is useful in comparing ongoing costs only, and will not help you determine the relative total costs of owning different funds. In addition, if these transactional costs were included, your costs would have been higher.
| | Annualized Expense Ratio-A | Beginning
Account Value
| Ending
Account Value
February 28, 2019 | Expenses Paid
During Period
|
| Telecommunications Portfolio | | | | |
| Class A | 1.18% | | | |
| Actual | | $1,000.00 | $964.30 | $5.75-B |
| Hypothetical-C | | $1,000.00 | $1,018.94 | $5.91-D |
| Class M | 1.48% | | | |
| Actual | | $1,000.00 | $962.60 | $7.20-B |
| Hypothetical-C | | $1,000.00 | $1,017.46 | $7.40-D |
| Class C | 1.88% | | | |
| Actual | | $1,000.00 | $960.90 | $9.14-B |
| Hypothetical-C | | $1,000.00 | $1,015.47 | $9.39-D |
| Telecommunications | .84% | | | |
| Actual | | $1,000.00 | $965.90 | $4.09-B |
| Hypothetical-C | | $1,000.00 | $1,020.63 | $4.21-D |
| Class I | .92% | | | |
| Actual | | $1,000.00 | $965.30 | $4.48-B |
| Hypothetical-C | | $1,000.00 | $1,020.23 | $4.61-D |
| Class Z | .66% | | | |
| Actual | | $1,000.00 | $932.00 | $2.62-B |
| Hypothetical-C | | $1,000.00 | $1,021.52 | $3.31-D |
| Wireless Portfolio | .82% | | | |
| Actual | | $1,000.00 | $963.60 | $3.99-B |
| Hypothetical-C | | $1,000.00 | $1,020.73 | $4.11-D |
A Annualized expense ratio reflects expenses net of applicable fee waivers.
B Actual expenses are equal to each Class' annualized expense ratio, multiplied by the average account value over the period, multiplied by 181/365 (to reflect the one-half year period) for Class A, Class M, Class C, Telecommunications, Wireless Portfolio and Class I and multiplied by 150/365 (to reflect the period October 2, 2018 to February 28, 2019) for Class Z.
C 5% return per year before expenses
D Hypothetical expenses are equal to each Class' annualized expense ratio, multiplied by the average account value over the period, multiplied by 181/365 (to reflect the one-half year period)
Distributions (Unaudited)
The funds hereby designate as capital gain dividend the amounts noted below for the taxable year ended February 28, 2019, or, if subsequently determined to be different, the net capital gain of such year.
| Telecommunications Portfolio | $0 |
| Wireless Portfolio | $25,664,578 |
|
A percentage of the dividends distributed during the fiscal year for the following funds qualify for the dividends–received deduction for corporate shareholders:
| | April 2018 | December 2018 |
| Telecommunications Portfolio | | |
| Class A | 100% | 100% |
| Class M | 100% | 100% |
| Class C | 100% | 100% |
| Telecommunications | 98% | 100% |
| Class I | 99% | 100% |
| Class Z | – | 100% |
| Wireless Portfolio | | |
| Wireless | 72% | 60% |
|
A percentage of the dividends distributed during the fiscal year for the following funds may be taken into account as a dividend for purposes of the maximum rate under section 1(h)(11) of the Internal Revenue Code.
| | April 2018 | December 2018 |
| Telecommunications Portfolio | | |
| Class A | 100% | 100% |
| Class M | 100% | 100% |
| Class C | 100% | 100% |
| Telecommunications | 100% | 100% |
| Class I | 100% | 100% |
| Class Z | – | 100% |
| Wireless Portfolio | | |
| Wireless | 100% | 100% |
|
The funds will notify shareholders in January 2020 of amounts for use in preparing 2019 income tax returns.
Board Approval of Investment Advisory Contracts and Management Fees
Telecommunications Portfolio
Wireless Portfolio
Each year, the Board of Trustees, including the Independent Trustees (together, the Board), votes on the renewal of the management contract with Fidelity SelectCo, LLC (SelectCo), an affiliate of Fidelity Management & Research Company (FMR), and the sub-advisory agreements with affiliates of FMR (together, the Advisory Contracts) for each fund. SelectCo and the sub-advisers are referred to herein as the Investment Advisers. The Board, assisted by the advice of fund counsel and Independent Trustees' counsel, requests and considers a broad range of information relevant to the renewal of the Advisory Contracts throughout the year.
The Board meets regularly and, at each of its meetings, covers an extensive agenda of topics and materials and considers factors that are relevant to its annual consideration of the renewal of each fund's Advisory Contracts, including the services and support provided to each fund and its shareholders. The Board has established various standing committees (Committees), each composed of and chaired by Independent Trustees with varying backgrounds, to which the Board has assigned specific subject matter responsibilities in order to enhance effective decision-making by the Board. The Board, acting directly and through its Committees, requests and receives information concerning the annual consideration of the renewal of each fund's Advisory Contracts. The Board also meets as needed to review matters specifically related to the Board's annual consideration of the renewal of the Advisory Contracts. Members of the Board may also meet with trustees of other Fidelity funds through joint ad hoc committees to discuss certain matters relevant to all of the Fidelity funds.
At its January 2019 meeting, the Board unanimously determined to renew each fund's Advisory Contracts. In reaching its determination, the Board considered all factors it believed relevant, including (i) the nature, extent, and quality of the services to be provided to each fund and its shareholders (including the investment performance of each fund); (ii) the competitiveness of each fund's management fee and total expense ratio relative to peer funds; (iii) the total costs of the services to be provided by and the profits to be realized by Fidelity from its relationships with each fund; and (iv) the extent to which, if any, economies of scale exist and would be realized as each fund grows, and whether any economies of scale are appropriately shared with fund shareholders.
In considering whether to renew the Advisory Contracts for each fund, the Board reached a determination, with the assistance of fund counsel and Independent Trustees' counsel and through the exercise of its business judgment, that the renewal of the Advisory Contracts was in the best interests of each fund and its shareholders and that the compensation payable under the Advisory Contracts was fair and reasonable. The Board's decision to renew the Advisory Contracts was not based on any single factor, but rather was based on a comprehensive consideration of all the information provided to the Board at its meetings throughout the year. The Board, in reaching its determination to renew the Advisory Contracts, was aware that shareholders of each fund have a broad range of investment choices available to them, including a wide choice among funds offered by Fidelity's competitors, and that each fund's shareholders, who have the opportunity to review and weigh the disclosure provided by the fund in its prospectus and other public disclosures, have chosen to invest in that fund, which is part of the Fidelity family of funds.
Nature, Extent, and Quality of Services Provided. The Board considered Fidelity's staffing as it relates to the funds, including the backgrounds of investment personnel of Fidelity, and also considered the funds' investment objectives, strategies, and related investment philosophies. The Independent Trustees also had discussions with senior management of Fidelity's investment operations and investment groups. The Board considered the structure of the investment personnel compensation program and whether this structure provides appropriate incentives to act in the best interests of each fund. Additionally, the Board considered the portfolio managers' investments, if any, in the funds that they manage.
Resources Dedicated to Investment Management and Support Services. The Board and the Fund Oversight and Research Committees reviewed the general qualifications and capabilities of Fidelity's investment staff, including its size, education, experience, and resources, as well as Fidelity's approach to recruiting, training, managing, and compensating investment personnel. The Board noted that Fidelity has continued to increase the resources devoted to non-U.S. offices, including expansion of Fidelity's global investment organization. The Board also noted that Fidelity's analysts have extensive resources, tools and capabilities that allow them to conduct sophisticated quantitative and fundamental analysis, as well as credit analysis of issuers, counterparties and guarantors. Further, the Board considered that Fidelity's investment professionals have sufficient access to global information and data so as to provide competitive investment results over time, and that those professionals also have access to sophisticated tools that permit them to assess portfolio construction and risk and performance attribution characteristics continuously, as well as to transmit new information and research conclusions rapidly around the world. Additionally, in its deliberations, the Board considered Fidelity's trading, risk management, compliance, and technology and operations capabilities and resources, which are integral parts of the investment management process.
Shareholder and Administrative Services. The Board considered (i) the nature, extent, quality, and cost of advisory, administrative, and shareholder services performed by the Investment Advisers and their affiliates under the Advisory Contracts and under separate agreements covering transfer agency, pricing and bookkeeping, and securities lending services for each fund; (ii) the nature and extent of the supervision of third party service providers, principally custodians, subcustodians, and pricing vendors; and (iii) the resources devoted to, and the record of compliance with, each fund's compliance policies and procedures. The Board also reviewed the allocation of fund brokerage, including allocations to brokers affiliated with the Investment Advisers, the use of brokerage commissions to pay fund expenses, and the use of "soft" commission dollars to pay for research services.
The Board noted that the growth of fund assets over time across the complex allows Fidelity to reinvest in the development of services designed to enhance the value and convenience of the Fidelity funds as investment vehicles. These services include 24-hour access to account information and market information through telephone representatives and over the Internet, investor education materials and asset allocation tools, and the expanded availability of Fidelity Investor Centers.
The Board noted that it and the boards of certain other Fidelity funds had formed an ad hoc Committee on Transfer Agency Fees to review the variety of transfer agency fee structures throughout the industry and Fidelity's competitive positioning with respect to industry participants.
Investment in a Large Fund Family. The Board considered the benefits to shareholders of investing in a Fidelity fund, including the benefits of investing in a fund that is part of a large family of funds offering a variety of investment disciplines and providing a large variety of mutual fund investor services. The Board noted that Fidelity had taken, or had made recommendations that resulted in the Fidelity funds taking, a number of actions over the previous year that benefited particular funds, including: (i) continuing to dedicate additional resources to Fidelity's investment research process, which includes meetings with management of issuers of securities in which the funds invest, and to the support of the senior management team that oversees asset management; (ii) continuing efforts to enhance Fidelity's global research capabilities; (iii) launching new funds and making other enhancements to meet client needs; (iv) launching new share classes of existing funds; (v) eliminating purchase minimums and broadening eligibility requirements for certain funds and share classes; (vi) reducing management fees and total expenses for certain growth equity funds and index funds; (vii) lowering expense caps for certain existing funds and classes, and converting certain voluntary expense caps to contractual caps, to reduce expenses borne by shareholders; (viii) eliminating short-term redemption fees for funds that had such fees; (ix) rationalizing product lines and gaining increased efficiencies from fund mergers and share class consolidations; (x) continuing to develop, acquire and implement systems and technology to improve services to the funds and shareholders, strengthen information security, and increase efficiency; and (xi) continuing to implement enhancements to further strengthen Fidelity's product line to increase investors' probability of success in achieving their investment goals, including retirement income goals.
Investment Performance. The Board considered whether each fund has operated in accordance with its investment objective, as well as its record of compliance with its investment restrictions and its performance history.
The Board took into account discussions that occur at Board meetings throughout the year with representatives of the Investment Advisers about fund investment performance. In this regard the Board noted that as part of regularly scheduled fund reviews and other reports to the Board on fund performance, the Board considers annualized return information for each fund for different time periods, measured against an appropriate securities market index ("benchmark index"). In its evaluation of fund investment performance, the Board gave particular attention to information indicating changes in performance of certain Fidelity funds for specific time periods and discussed with the Investment Advisers the reasons for any overperformance or underperformance.
In addition to reviewing absolute and relative fund performance, the Independent Trustees periodically consider the appropriateness of fund performance metrics in evaluating the results achieved. In general, the Independent Trustees believe that fund performance should be evaluated based on net performance (after fees and expenses) of both the highest performing and lowest performing fund share classes, where applicable, compared to appropriate benchmark indices, over appropriate time periods that may include full market cycles, taking into account relevant factors including the following: general market conditions; issuer-specific information; and fund cash flows and other factors.
The Independent Trustees recognize that shareholders evaluate performance on a net basis over their own holding periods, for which one-, three-, and five-year periods are often used as a proxy. For this reason, the performance information reviewed by the Board also included net cumulative total return information for each fund and an appropriate benchmark index for the most recent one-, three-, and five-year periods ended June 30, 2018, as shown below.
Telecommunications Portfolio
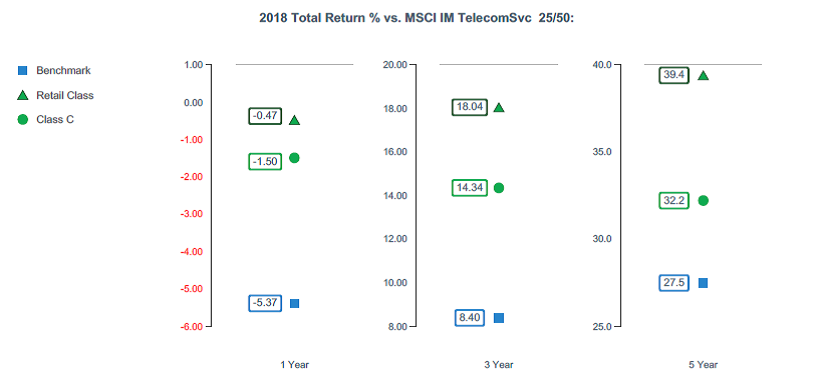
Wireless Portfolio
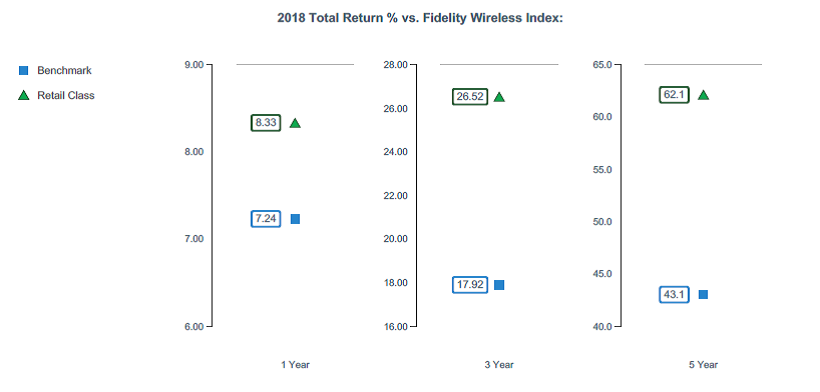
Based on its review, the Board concluded that the nature, extent, and quality of services provided to each fund under the Advisory Contracts should continue to benefit the shareholders of each fund.
Competitiveness of Management Fee and Total Expense Ratio. The Board considered each fund's management fee and total expense ratio compared to "mapped groups" of competitive funds and classes created for the purpose of facilitating the Trustees' competitive analysis of management fees and total expenses. Fidelity creates "mapped groups" by combining similar Lipper investment objective categories that have comparable investment mandates. For this purpose, all sector focused equity funds are grouped in the same mapped group. Combining Lipper investment objective categories aids the Board's management fee and total expense ratio comparisons by broadening the competitive group used for comparison.
Management Fee. The Board considered two proprietary management fee comparisons for the 12-month periods ended June 30 shown in basis points (BP) in the charts below. The group of Lipper funds used by the Board for management fee comparisons is referred to below as the "Total Mapped Group." The Total Mapped Group comparison focuses on a fund's standing in terms of gross management fees before expense reimbursements or caps relative to the total universe of funds with comparable investment mandates (i.e., sector equities), regardless of whether their management fee structures also are comparable. Funds with comparable management fee structures have similar management fee contractual arrangements (
e.g., flat rate charged for advisory services, all-inclusive fee rate,
etc.). "TMG %" represents the percentage of funds in the Total Mapped Group that had management fees that were lower than a fund's. For example, a hypothetical TMG % of 20% would mean that 80% of the funds in the Total Mapped Group had higher, and 20% had lower, management fees than a fund. The funds' actual TMG %s and the number of funds in the Total Mapped Group are in the charts below. The "Asset-Size Peer Group" (ASPG) comparison focuses on a fund's standing relative to a subset of non-Fidelity funds within the Total Mapped Group that are similar in size and management fee structure. For example, if a fund is in the first quartile of the ASPG, the fund's management fee ranks in the least expensive or lowest 25% of funds in the ASPG. The ASPG represents at least 15% of the funds in the Total Mapped Group with comparable asset size and management fee structures, subject to a minimum of 50 funds (or all funds in the Total Mapped Group if fewer than 50). Additional information, such as the ASPG quartile in which a fund's management fee rate ranked, is also included in the charts and was considered by the Board.
Telecommunications Portfolio
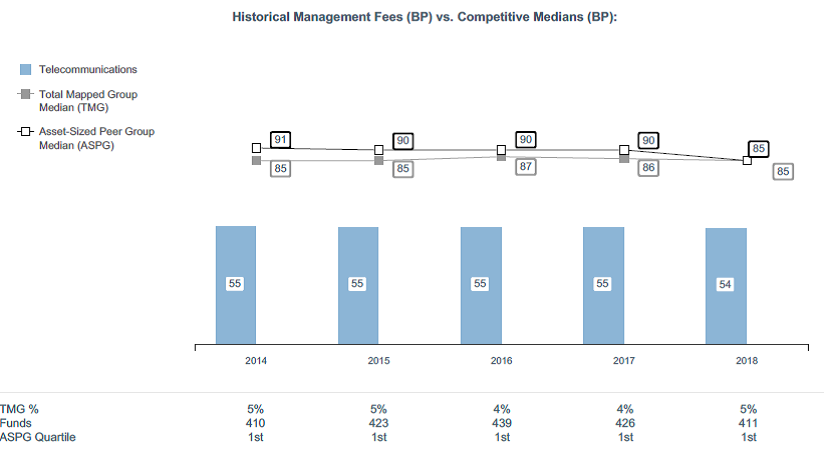
Wireless Portfolio
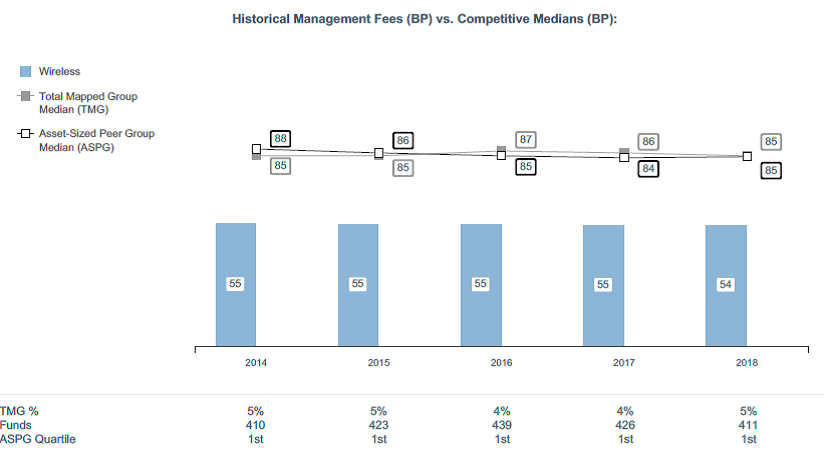
The Board noted that each fund's management fee rate ranked below the median of its Total Mapped Group and below the median of its ASPG for the 12-month period ended June 30, 2018.
The Board noted that it and the boards of other Fidelity funds formed an ad hoc Committee on Group Fee, which meets periodically, to conduct an in-depth review of the "group fee" component of the management fee of funds with such management fee structures. The Committee's focus included the mechanics of the group fee, the competitive landscape of group fee structures, Fidelity funds with no group fee component and investment products not included in group fee assets. The Board also considered that, for funds subject to the group fee, FMR agreed to voluntarily waive fees over a specified period of time in amounts designed to account for assets converted from certain funds to certain collective investment trusts.
Based on its review, the Board concluded that each fund's management fee is fair and reasonable in light of the services that the fund receives and the other factors considered.
Total Expense Ratio. In its review of the total expense ratio of each class of Telecommunications Portfolio, the Board considered the fund's management fee rate as well as other fund or class expenses, as applicable, such as transfer agent fees, pricing and bookkeeping fees, fund-paid 12b-1 fees, and custodial, legal, and audit fees. The Board also noted that Fidelity may agree to waive fees and expenses from time to time, and the extent to which, if any, it has done so for the fund. As part of its review, the Board also considered the current and historical total expense ratios of each class of the fund compared to competitive fund median expenses. Each class of the fund is compared to those funds and classes in the Total Mapped Group (used by the Board for management fee comparisons) that have a similar sales load structure.
For Telecommunications Portfolio, the Board noted that the total expense ratio of each of Class A, Class C, Class I, and the retail class ranked below the competitive median for the 12-month period ended June 30, 2018, and the total expense ratio of Class M ranked above the competitive median for the 12-month period ended June 30, 2018. The Board considered that, in general, various factors can affect total expense ratios. The Board noted that the total expense ratio of Class M was above the competitive median primarily because of higher 12b-1 fees on Class M as compared to most competitor funds. Class M has a higher 12b-1 fee, but a lower front-end sales charge, than traditionally priced front-end sales charge classes. The Board considered that Class M is primarily sold load-waived to retirement plans and intermediary wrap programs where its 0.50% 12b-1 fee is comparable to competing no-load, higher 12b-1 fee classes designed specifically for retirement plans and wrap programs. The Board noted that, when compared with competitor funds that charge a 0.50% 12b-1 fee, the total expense ratio of Class M is below median. The Board noted that the fund offers multiple classes, each of which has a different sales load and 12b-1 fee structure, and that the multiple structures are intended to offer a range of pricing options for the intermediary market. The Board also noted that the total expense ratios of the classes of the fund vary primarily by the level of their 12b-1 fees, although differences in transfer agent fees may also cause expenses to vary from class to class.
In its review of Wireless Portfolio's total expense ratio, the Board considered the fund's management fee rate as well as other fund expenses, such as transfer agent fees, pricing and bookkeeping fees, and custodial, legal, and audit fees. The Board also noted that Fidelity may agree to waive fees and expenses from time to time, and the extent to which, if any, it has done so for the fund. As part of its review, the Board also considered the current and historical total expense ratios of the fund compared to competitive fund median expenses. The fund is compared to those funds and classes in the Total Mapped Group (used by the Board for management fee comparisons) that have a similar sales load structure.
For Wireless Portfolio, the Board noted that the total expense ratio ranked below the competitive median for the 12-month period ended June 30, 2018.
Fees Charged to Other Fidelity Clients. The Board also considered Fidelity fee structures and other information with respect to clients of Fidelity, such as other funds advised or subadvised by Fidelity, pension plan clients, and other institutional clients with similar mandates. The Board noted that a joint ad hoc committee created by it and the boards of other Fidelity funds periodically reviews and compares Fidelity's institutional investment advisory business with its business of providing services to the Fidelity funds and also noted the most recent findings of the committee. The Board noted that the committee's review included a consideration of the differences in services provided, fees charged, and costs incurred, as well as competition in the markets serving the different categories of clients.
Based on its review of total expense ratios and fees charged to other Fidelity clients, the Board concluded that the total expense ratio of each class of each fund was reasonable in light of the services that the fund and its shareholders receive and the other factors considered.
Costs of the Services and Profitability. The Board considered the revenues earned and the expenses incurred by Fidelity in conducting the business of developing, marketing, distributing, managing, administering and servicing each fund and servicing each fund's shareholders. The Board also considered the level of Fidelity's profits in respect of all the Fidelity funds.
On an annual basis, Fidelity presents to the Board information about the profitability of its relationships with each fund. Fidelity calculates profitability information for each fund, as well as aggregate profitability information for groups of Fidelity funds and all Fidelity funds, using a series of detailed revenue and cost allocation methodologies which originate with the books and records of Fidelity on which Fidelity's audited financial statements are based. The Audit Committee of the Board reviews any significant changes from the prior year's methodologies.
PricewaterhouseCoopers LLP (PwC), auditor to Fidelity and certain Fidelity funds, has been engaged annually by the Board as part of the Board's assessment of Fidelity's profitability analysis. PwC's engagement includes the review and assessment of the methodologies used by Fidelity in determining the revenues and expenses attributable to Fidelity's mutual fund business, and completion of agreed-upon procedures in respect of the mathematical accuracy of the fund profitability information and its conformity to established allocation methodologies. After considering PwC's reports issued under the engagement and information provided by Fidelity, the Board concluded that while other allocation methods may also be reasonable, Fidelity's profitability methodologies are reasonable in all material respects.
The Board also reviewed Fidelity's non-fund businesses and potential indirect benefits such businesses may have received as a result of their association with Fidelity's mutual fund business (i.e., fall-out benefits) as well as cases where Fidelity's affiliates may benefit from the funds' business. The Board noted that changes to fall-out benefits year-over-year reflect business developments at Fidelity's various businesses.
The Board considered the costs of the services provided by and the profits realized by Fidelity in connection with the operation of each fund and was satisfied that the profitability was not excessive.
Economies of Scale. The Board considered whether there have been economies of scale in respect of the management of the Fidelity funds, whether the Fidelity funds (including each fund) have appropriately benefited from any such economies of scale, and whether there is potential for realization of any further economies of scale. The Board considered the extent to which each fund will benefit from economies of scale as assets grow through increased services to the fund, through waivers or reimbursements, or through fee or expense ratio reductions. The Board also noted that a committee (the Economies of Scale Committee) created by it and the boards of other Fidelity funds periodically analyzes whether Fidelity attains economies of scale in respect of the management and servicing of the Fidelity funds, whether the Fidelity funds have appropriately benefited from such economies of scale, and whether there is potential for realization of any further economies of scale.
The Board recognized that each fund's management contract incorporates a "group fee" structure, which provides for lower group fee rates as total group assets increase, and for higher group fee rates as total group assets decrease (with "group assets" defined to include fund assets under SelectCo's management plus assets under FMR's management). SelectCo calculates the group fee rates based on a tiered asset "breakpoint" schedule that varies based on asset class. The Board considered that the group fee is designed to deliver the benefits of economies of scale to fund shareholders when total group assets increase, even if assets of any particular fund are unchanged or have declined, because some portion of Fidelity's costs are attributable to services provided to all Fidelity funds, and all funds benefit if those costs can be allocated among more assets. The Board concluded that, given the group fee structure, fund shareholders will benefit from lower management fees as group assets increase at the fund complex level, regardless of whether Fidelity achieves any such economies of scale.
The Board concluded, taking into account the analysis of the Economies of Scale Committee, that economies of scale, if any, are being appropriately shared between fund shareholders and Fidelity.
Additional Information Requested by the Board. In order to develop fully the factual basis for consideration of the Fidelity funds' advisory contracts, the Board requested and received additional information on certain topics, including: (i) fund performance trends, in particular the underperformance of certain funds, and Fidelity's long-term strategies for certain funds; (ii) Fidelity's fund profitability methodology, profitability trends for certain funds, and the impact of certain factors on fund profitability results; (iii) metrics for evaluating index fund and ETF performance and information about ETF trading characteristics; (iv) the methodology with respect to the evaluation of competitive fund data and peer group classifications and fee comparisons; (v) the expense structures for different funds and classes; (vi) information regarding other accounts managed by Fidelity, including collective investment trusts; and (vii) Fidelity's philosophies and strategies for evaluating funds and classes with lower or declining asset levels.
Based on its evaluation of all of the conclusions noted above, and after considering all factors it believed relevant, the Board concluded that the advisory fee arrangements are fair and reasonable, and that each fund's Advisory Contracts should be renewed.
SELTS-ANN-0419
1.846050.112
Fidelity® Select Portfolios®
Consumer Staples Sector Consumer Staples Portfolio
Annual Report February 28, 2019 Includes Fidelity and Fidelity Advisor share classes |
|
Beginning on January 1, 2021, as permitted by regulations adopted by the Securities and Exchange Commission, paper copies of a fund’s shareholder reports will no longer be sent by mail, unless you specifically request paper copies of the reports from the fund or from your financial intermediary, such as a financial advisor, broker-dealer or bank. Instead, the reports will be made available on a website, and you will be notified by mail each time a report is posted and provided with a website link to access the report.
If you already elected to receive shareholder reports electronically, you will not be affected by this change and you need not take any action. You may elect to receive shareholder reports and other communications from a fund electronically, by contacting your financial intermediary. For Fidelity customers, visit Fidelity's web site or call Fidelity using the contact information listed below.
You may elect to receive all future reports in paper free of charge. If you wish to continue receiving paper copies of your shareholder reports, you may contact your financial intermediary or, if you are a Fidelity customer, visit Fidelity’s website, or call Fidelity at the applicable toll-free number listed below. Your election to receive reports in paper will apply to all funds held with the fund complex/your financial intermediary.
| Account Type | Website | Phone Number |
| Brokerage, Mutual Fund, or Annuity Contracts: | fidelity.com/mailpreferences | 1-800-343-3548 |
| Employer Provided Retirement Accounts: | netbenefits.fidelity.com/preferences (choose 'no' under Required Disclosures to continue to print) | 1-800-343-0860 |
| Advisor Sold Accounts Serviced Through Your Financial Intermediary: | Contact Your Financial Intermediary | Your Financial Intermediary's phone number |
| Advisor Sold Accounts Serviced by Fidelity: | institutional.fidelity.com | 1-877-208-0098 |
Contents
To view a fund's proxy voting guidelines and proxy voting record for the 12-month period ended June 30, visit http://www.fidelity.com/proxyvotingresults or visit the Securities and Exchange Commission's (SEC) web site at http://www.sec.gov.
You may also call 1-800-544-8544 if you’re an individual investing directly with Fidelity, call 1-800-835-5092 if you’re a plan sponsor or participant with Fidelity as your recordkeeper or call 1-877-208-0098 on institutional accounts or if you’re an advisor or invest through one to request a free copy of the proxy voting guidelines.
Standard & Poor's, S&P and S&P 500 are registered service marks of The McGraw-Hill Companies, Inc. and have been licensed for use by Fidelity Distributors Corporation.
Other third-party marks appearing herein are the property of their respective owners.
All other marks appearing herein are registered or unregistered trademarks or service marks of FMR LLC or an affiliated company. © 2019 FMR LLC. All rights reserved.
This report and the financial statements contained herein are submitted for the general information of the shareholders of the Fund. This report is not authorized for distribution to prospective investors in the Fund unless preceded or accompanied by an effective prospectus.
A fund files its complete schedule of portfolio holdings with the SEC for the first and third quarters of each fiscal year on Form N-Q. Forms N-Q are available on the SEC’s web site at http://www.sec.gov. A fund's Forms N-Q may be reviewed and copied at the SEC’s Public Reference Room in Washington, DC. Information regarding the operation of the SEC's Public Reference Room may be obtained by calling 1-800-SEC-0330.
For a complete list of a fund's portfolio holdings, view the most recent holdings listing, semiannual report, or annual report on Fidelity's web site at http://www.fidelity.com, http://www.institutional.fidelity.com, or http://www.401k.com, as applicable.
NOT FDIC INSURED •MAY LOSE VALUE •NO BANK GUARANTEE
Neither the Fund nor Fidelity Distributors Corporation is a bank.
Performance: The Bottom Line
Average annual total return reflects the change in the value of an investment, assuming reinvestment of distributions from dividend income and capital gains (the profits earned upon the sale of securities that have grown in value, if any) and assuming a constant rate of performance each year. The hypothetical investment and the average annual total returns do not reflect the deduction of taxes that a shareholder would pay on fund distributions or the redemption of fund shares. During periods of reimbursement by Fidelity, a fund’s total return will be greater than it would be had the reimbursement not occurred. How a fund did yesterday is no guarantee of how it will do tomorrow.
Average Annual Total Returns
| For the periods ended February 28, 2019 | Past 1 year | Past 5 years | Past 10 years |
| Class A (incl. 5.75% sales charge) | (6.05)% | 3.99% | 11.22% |
| Class M (incl. 3.50% sales charge) | (4.07)% | 4.20% | 11.17% |
| Class C (incl. contingent deferred sales charge) | (1.93)% | 4.45% | 11.05% |
| Consumer Staples Portfolio | (0.03)%�� | 5.53% | 12.18% |
| Class I | (0.04)% | 5.52% | 12.17% |
| Class Z | 0.01% | 5.53% | 12.18% |
Class C shares' contingent deferred sales charges included in the past one year, past five years and past ten years total return figures are 1%, 0% and 0%, respectively.
The initial offering of Class Z shares took place on October 2, 2018. Returns prior to October 2, 2018, are those of Class I.
$10,000 Over 10 Years
Let's say hypothetically that $10,000 was invested in Consumer Staples Portfolio, a class of the fund, on February 28, 2009.
The chart shows how the value of your investment would have changed, and also shows how the S&P 500® Index performed over the same period.
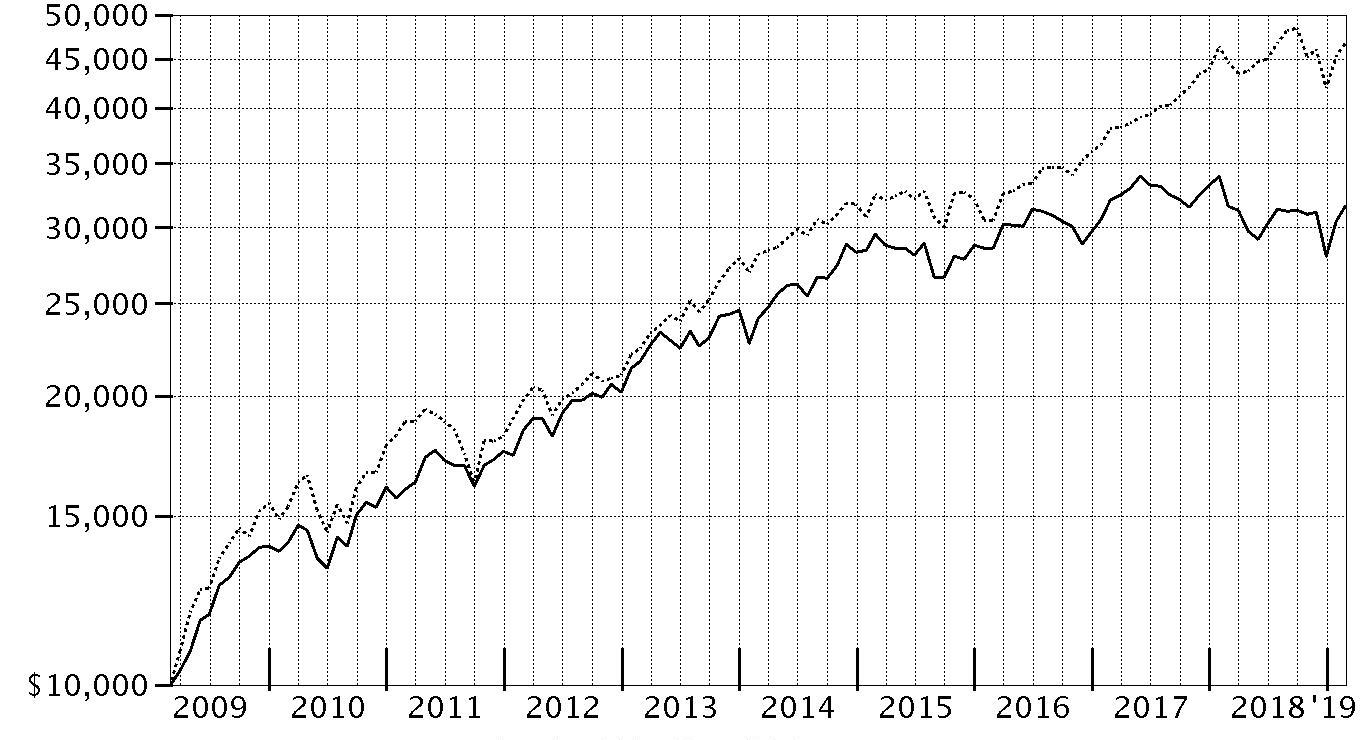
| Period Ending Values |
| $31,571 | Consumer Staples Portfolio |
| $46,739 | S&P 500® Index |
Management's Discussion of Fund Performance
Market Recap: The S&P 500
® index gained 4.68% for the 12 months ending February 28, 2019, as the U.S. equity bellwether began the new year on a high note after enduring a final quarter of 2018 in which resurgent volatility upset the aging bull market. In October, rising U.S. Treasury yields and concern about peaking corporate earnings growth sent many investors fleeing from risk assets as they were still dealing with lingering uncertainty related to global trade and the U.S. Federal Reserve picking up the pace of interest rate hikes. The index returned -6.84% in October, at the time its largest monthly drop in seven years. But conditions worsened through Christmas, as jitters about the economy and another hike in rates led to a spike in market volatility and a -9.03% result for December. Sharply reversing course to begin 2019, the S&P 500
® gained 11.48% year-to-date, its strongest two-month opening since 1991, amid upbeat company earnings/outlooks and signs the Fed may pause on rates. For the full period, some economically sensitive sectors fared worst, with financials (-6%) and materials (-6%) both losing ground. Energy gained 1%, while communication services and industrials each rose roughly 2%. In contrast, the defensive utilities (+20%), real estate (+20%) and health care (+11%) sectors led the way, while consumer staples finished near the index. Information technology and consumer discretionary were rattled in the late-2018 downturn, but earlier strength contributed to advances of 9% and roughly 7%, respectively.
Comments from Portfolio Manager James McElligott: For the fiscal year, the fund’s share classes (excluding sales charges, if applicable) were roughly flat, notably behind the 5.45% gain of the MSCI U.S. IMI Consumer Staples 25/50 Index and also lagging the broad-based S&P 500
®. Consumer staples stocks benefited in late 2018 as increased market volatility pushed investors toward more-defensive sectors, lower commodity prices reduced input costs, and product price hikes began to take effect. Security selection was the primary detractor from the fund’s performance versus the MSCI sector index the past 12 months, with notably disappointing results in the household products and personal products categories. Two individual holdings in particular hurt relative performance this period: beauty products company Coty and household products firm Spectrum Brands Holdings. Both stocks declined due to what I consider missteps by management. Our non-benchmark stake in British American Tobacco returned -35% this period, also detracting. Earnings somewhat lagged expectations, but the real pressure came from weak investor sentiment related to a shifting regulatory environment in the United States. Conversely, security selection in packaged foods & meats contributed most to relative performance, followed by an overweighting and stock picks in the soft drinks category. The top two individual contributors were private-label food manufacturer TreeHouse Foods and Simply Good Foods, a maker of healthy snacks. Both benefited from better-than expected financial results.
The views expressed above reflect those of the portfolio manager(s) only through the end of the period as stated on the cover of this report and do not necessarily represent the views of Fidelity or any other person in the Fidelity organization. Any such views are subject to change at any time based upon market or other conditions and Fidelity disclaims any responsibility to update such views. These views may not be relied on as investment advice and, because investment decisions for a Fidelity fund are based on numerous factors, may not be relied on as an indication of trading intent on behalf of any Fidelity fund.
Investment Summary (Unaudited)
Top Ten Stocks as of February 28, 2019
| | % of fund's net assets |
| Procter & Gamble Co. | 10.1 |
| The Coca-Cola Co. | 9.7 |
| Philip Morris International, Inc. | 7.6 |
| Altria Group, Inc. | 6.0 |
| Coty, Inc. Class A | 5.1 |
| PepsiCo, Inc. | 5.1 |
| Spectrum Brands Holdings, Inc. | 4.2 |
| Monster Beverage Corp. | 4.1 |
| Mondelez International, Inc. | 3.5 |
| Costco Wholesale Corp. | 3.1 |
| | 58.5 |
Top Industries (% of fund's net assets)
| As of February 28, 2019 |
| | Beverages | 24.8% |
| | Food Products | 18.9% |
| | Household Products | 18.9% |
| | Tobacco | 14.3% |
| | Food & Staples Retailing | 10.4% |
| | All Others* | 12.7% |

* Includes short-term investments and net other assets (liabilities).
Schedule of Investments February 28, 2019
Showing Percentage of Net Assets
| Common Stocks - 99.7% | | | |
| | | Shares | Value |
| Beverages - 24.8% | | | |
| Brewers - 1.0% | | | |
| Anheuser-Busch InBev SA NV | | 45,500 | $3,554,372 |
| Beijing Yanjing Brewery Co. Ltd. (A Shares) | | 10,571,440 | 10,106,917 |
| China Resources Beer Holdings Co. Ltd. | | 140,000 | 521,673 |
| | | | 14,182,962 |
| Distillers & Vintners - 2.4% | | | |
| Constellation Brands, Inc. Class A (sub. vtg.) | | 179,400 | 30,347,304 |
| Kweichow Moutai Co. Ltd. (A Shares) | | 13,453 | 1,517,317 |
| Pernod Ricard SA | | 12,800 | 2,204,287 |
| | | | 34,068,908 |
| Soft Drinks - 21.4% | | | |
| Coca-Cola Bottling Co. Consolidated | | 32,644 | 8,091,142 |
| Coca-Cola European Partners PLC | | 120,853 | 5,697,010 |
| Coca-Cola FEMSA S.A.B. de CV sponsored ADR | | 71,000 | 4,286,980 |
| Coca-Cola West Co. Ltd. | | 44,000 | 1,132,122 |
| Fever-Tree Drinks PLC | | 2,176 | 77,291 |
| Keurig Dr. Pepper, Inc. | | 678,100 | 17,054,215 |
| Monster Beverage Corp. (a) | | 922,302 | 58,870,537 |
| PepsiCo, Inc. | | 626,000 | 72,390,640 |
| The Coca-Cola Co. | | 3,038,418 | 137,761,872 |
| | | | 305,361,809 |
|
| TOTAL BEVERAGES | | | 353,613,679 |
|
| Food & Staples Retailing - 10.4% | | | |
| Drug Retail - 1.9% | | | |
| Walgreens Boots Alliance, Inc. | | 380,224 | 27,068,147 |
| Food Distributors - 1.6% | | | |
| Sysco Corp. | | 324,800 | 21,940,240 |
| Food Retail - 2.1% | | | |
| Kroger Co. | | 860,870 | 25,249,317 |
| Sprouts Farmers Market LLC (a) | | 188,500 | 4,395,820 |
| | | | 29,645,137 |
| Hypermarkets & Super Centers - 4.8% | | | |
| BJ's Wholesale Club Holdings, Inc. | | 21,600 | 546,912 |
| Costco Wholesale Corp. | | 203,200 | 44,447,968 |
| Walmart, Inc. | | 239,600 | 23,718,004 |
| | | | 68,712,884 |
|
| TOTAL FOOD & STAPLES RETAILING | | | 147,366,408 |
|
| Food Products - 18.9% | | | |
| Agricultural Products - 1.3% | | | |
| Bunge Ltd. | | 91,935 | 4,879,910 |
| Darling International, Inc. (a) | | 392,500 | 8,627,150 |
| Ingredion, Inc. | | 44,300 | 4,095,535 |
| | | | 17,602,595 |
| Packaged Foods & Meats - 17.6% | | | |
| Conagra Brands, Inc. | | 515,300 | 12,042,561 |
| Danone SA | | 305,991 | 23,111,301 |
| Freshpet, Inc. (a) | | 412,900 | 17,019,738 |
| General Mills, Inc. | | 454,300 | 21,411,159 |
| JBS SA | | 4,408,400 | 15,762,100 |
| Kellogg Co. | | 146,200 | 8,225,212 |
| Mondelez International, Inc. | | 1,047,858 | 49,416,983 |
| Nomad Foods Ltd. (a) | | 176,300 | 3,543,630 |
| Post Holdings, Inc. (a) | | 72,900 | 7,427,052 |
| SunOpta, Inc. (a) | | 307,800 | 800,280 |
| The Hain Celestial Group, Inc. (a) | | 131,299 | 2,582,651 |
| The Hershey Co. | | 5,300 | 586,604 |
| The J.M. Smucker Co. | | 193,300 | 20,472,403 |
| The Kraft Heinz Co. | | 459,300 | 15,244,167 |
| The Simply Good Foods Co. (a) | | 433,099 | 8,861,206 |
| TreeHouse Foods, Inc. (a) | | 402,259 | 24,368,850 |
| Tyson Foods, Inc. Class A | | 325,700 | 20,082,662 |
| | | | 250,958,559 |
|
| TOTAL FOOD PRODUCTS | | | 268,561,154 |
|
| Hotels, Restaurants & Leisure - 1.0% | | | |
| Restaurants - 1.0% | | | |
| ARAMARK Holdings Corp. | | 104,301 | 3,160,320 |
| U.S. Foods Holding Corp. (a) | | 325,616 | 11,474,708 |
| | | | 14,635,028 |
| Household Products - 18.9% | | | |
| Household Products - 18.9% | | | |
| Colgate-Palmolive Co. | | 638,180 | 42,036,917 |
| Energizer Holdings, Inc. | | 123,800 | 5,679,944 |
| Essity AB Class B | | 520,000 | 14,508,878 |
| Procter & Gamble Co. | | 1,454,550 | 143,345,901 |
| Reckitt Benckiser Group PLC | | 35,115 | 2,681,888 |
| Spectrum Brands Holdings, Inc. (b) | | 1,117,299 | 60,524,087 |
| | | | 268,777,615 |
| Internet & Direct Marketing Retail - 0.2% | | | |
| Internet & Direct Marketing Retail - 0.2% | | | |
| Ocado Group PLC (a) | | 52,100 | 714,869 |
| The Honest Co., Inc. (a)(c)(d) | | 212,235 | 2,205,122 |
| | | | 2,919,991 |
| Multiline Retail - 1.2% | | | |
| General Merchandise Stores - 1.2% | | | |
| Dollar General Corp. | | 34,100 | 4,039,486 |
| Dollar Tree, Inc. (a) | | 139,700 | 13,457,301 |
| | | | 17,496,787 |
| Personal Products - 10.0% | | | |
| Personal Products - 10.0% | | | |
| Avon Products, Inc. (a) | | 4,595,707 | 14,200,735 |
| Coty, Inc. Class A (b) | | 6,603,997 | 72,643,967 |
| Estee Lauder Companies, Inc. Class A | | 60,039 | 9,422,521 |
| Ontex Group NV | | 636,000 | 13,376,003 |
| Unilever NV (Certificaten Van Aandelen) (Bearer) | | 605,030 | 32,766,982 |
| | | | 142,410,208 |
| Tobacco - 14.3% | | | |
| Tobacco - 14.3% | | | |
| Altria Group, Inc. | | 1,625,245 | 85,179,090 |
| British American Tobacco PLC sponsored ADR | | 298,426 | 10,964,171 |
| Philip Morris International, Inc. | | 1,243,891 | 108,143,884 |
| | | | 204,287,145 |
| TOTAL COMMON STOCKS | | | |
| (Cost $1,295,978,265) | | | 1,420,068,015 |
|
| Money Market Funds - 1.6% | | | |
| Fidelity Cash Central Fund, 2.44% (e) | | 3,334,189 | 3,334,856 |
| Fidelity Securities Lending Cash Central Fund 2.45% (e)(f) | | 19,547,720 | 19,549,675 |
| TOTAL MONEY MARKET FUNDS | | | |
| (Cost $22,884,531) | | | 22,884,531 |
| TOTAL INVESTMENT IN SECURITIES - 101.3% | | | |
| (Cost $1,318,862,796) | | | 1,442,952,546 |
| NET OTHER ASSETS (LIABILITIES) - (1.3)% | | | (18,025,978) |
| NET ASSETS - 100% | | | $1,424,926,568 |
Legend
(a) Non-income producing
(b) Security or a portion of the security is on loan at period end.
(c) Restricted securities - Investment in securities not registered under the Securities Act of 1933 (excluding 144A issues). At the end of the period, the value of restricted securities (excluding 144A issues) amounted to $2,205,122 or 0.2% of net assets.
(d) Level 3 security
(e) Affiliated fund that is generally available only to investment companies and other accounts managed by Fidelity Investments. The rate quoted is the annualized seven-day yield of the fund at period end. A complete unaudited listing of the fund's holdings as of its most recent quarter end is available upon request. In addition, each Fidelity Central Fund's financial statements, which are not covered by the Fund's Report of Independent Registered Public Accounting Firm, are available on the SEC's website or upon request.
(f) Investment made with cash collateral received from securities on loan.
Additional information on each restricted holding is as follows:
| Security | Acquisition Date | Acquisition Cost |
| The Honest Co., Inc. | 8/28/18 | $2,381,277 |
Affiliated Central Funds
Information regarding fiscal year to date income earned by the Fund from investments in Fidelity Central Funds is as follows:
| Fund | Income earned |
| Fidelity Cash Central Fund | $56,521 |
| Fidelity Securities Lending Cash Central Fund | 162,259 |
| Total | $218,780 |
Amounts in the income column in the above table include any capital gain distributions from underlying funds, which are presented in the corresponding line-item in the Statement of Operations, if applicable.
Investment Valuation
The following is a summary of the inputs used, as of February 28, 2019, involving the Fund's assets and liabilities carried at fair value. The inputs or methodology used for valuing securities may not be an indication of the risk associated with investing in those securities. For more information on valuation inputs, and their aggregation into the levels used below, please refer to the Investment Valuation section in the accompanying Notes to Financial Statements.
| | Valuation Inputs at Reporting Date: |
| Description | Total | Level 1 | Level 2 | Level 3 |
| Investments in Securities: | | | | |
| Common Stocks | $1,420,068,015 | $1,355,748,350 | $62,114,543 | $2,205,122 |
| Money Market Funds | 22,884,531 | 22,884,531 | -- | -- |
| Total Investments in Securities: | $1,442,952,546 | $1,378,632,881 | $62,114,543 | $2,205,122 |
Other Information
Distribution of investments by country or territory of incorporation, as a percentage of Total Net Assets, is as follows (Unaudited):
| United States of America | 89.3% |
| Netherlands | 2.3% |
| France | 1.8% |
| United Kingdom | 1.3% |
| Belgium | 1.2% |
| Brazil | 1.1% |
| Sweden | 1.0% |
| Others (Individually Less Than 1%) | 2.0% |
| | 100.0% |
See accompanying notes which are an integral part of the financial statements.
Financial Statements
Statement of Assets and Liabilities
| | | February 28, 2019 |
| Assets | | |
Investment in securities, at value (including securities loaned of $18,794,489) — See accompanying schedule:
Unaffiliated issuers (cost $1,295,978,265) | $1,420,068,015 | |
| Fidelity Central Funds (cost $22,884,531) | 22,884,531 | |
| Total Investment in Securities (cost $1,318,862,796) | | $1,442,952,546 |
| Receivable for investments sold | | 7,728,767 |
| Receivable for fund shares sold | | 1,068,415 |
| Dividends receivable | | 3,891,312 |
| Distributions receivable from Fidelity Central Funds | | 3,547 |
| Prepaid expenses | | 17,895 |
| Other receivables | | 218,268 |
| Total assets | | 1,455,880,750 |
| Liabilities | | |
| Payable for investments purchased | $8,422,970 | |
| Payable for fund shares redeemed | 1,645,965 | |
| Accrued management fee | 638,639 | |
| Distribution and service plan fees payable | 199,073 | |
| Other affiliated payables | 258,145 | |
| Other payables and accrued expenses | 239,715 | |
| Collateral on securities loaned | 19,549,675 | |
| Total liabilities | | 30,954,182 |
| Net Assets | | $1,424,926,568 |
| Net Assets consist of: | | |
| Paid in capital | | $1,327,307,874 |
| Total distributable earnings (loss) | | 97,618,694 |
| Net Assets | | $1,424,926,568 |
| Net Asset Value and Maximum Offering Price | | |
| Class A: | | |
| Net Asset Value and redemption price per share ($232,020,463 ÷ 3,018,009 shares) | | $76.88 |
| Maximum offering price per share (100/94.25 of $76.88) | | $81.57 |
| Class M: | | |
| Net Asset Value and redemption price per share ($60,068,510 ÷ 789,073 shares) | | $76.13 |
| Maximum offering price per share (100/96.50 of $76.13) | | $78.89 |
| Class C: | | |
| Net Asset Value and offering price per share ($150,822,402 ÷ 2,016,548 shares)(a) | | $74.79 |
| Consumer Staples: | | |
| Net Asset Value, offering price and redemption price per share ($814,350,022 ÷ 10,490,753 shares) | | $77.63 |
| Class I: | | |
| Net Asset Value, offering price and redemption price per share ($159,613,505 ÷ 2,060,868 shares) | | $77.45 |
| Class Z: | | |
| Net Asset Value, offering price and redemption price per share ($8,051,666 ÷ 104,084 shares) | | $77.36 |
(a) Redemption price per share is equal to net asset value less any applicable contingent deferred sales charge.
See accompanying notes which are an integral part of the financial statements.
Statement of Operations
| | | Year ended February 28, 2019 |
| Investment Income | | |
| Dividends | | $45,240,893 |
| Special dividends | | 14,074,448 |
| Income from Fidelity Central Funds | | 218,780 |
| Total income | | 59,534,121 |
| Expenses | | |
| Management fee | $8,714,870 | |
| Transfer agent fees | 3,054,600 | |
| Distribution and service plan fees | 2,734,578 | |
| Accounting and security lending fees | 505,151 | |
| Custodian fees and expenses | 51,732 | |
| Independent trustees' fees and expenses | 9,455 | |
| Registration fees | 127,034 | |
| Audit | 61,959 | |
| Legal | 13,626 | |
| Interest | 15,815 | |
| Miscellaneous | 41,687 | |
| Total expenses before reductions | 15,330,507 | |
| Expense reductions | (292,596) | |
| Total expenses after reductions | | 15,037,911 |
| Net investment income (loss) | | 44,496,210 |
| Realized and Unrealized Gain (Loss) | | |
| Net realized gain (loss) on: | | |
| Investment securities: | | |
| Unaffiliated issuers (net of foreign taxes of $427) | 27,104,386 | |
| Redemptions in-kind with affiliated entities | 70,956,466 | |
| Fidelity Central Funds | (630) | |
| Foreign currency transactions | (35,674) | |
| Total net realized gain (loss) | | 98,024,548 |
| Change in net unrealized appreciation (depreciation) on: | | |
| Investment securities: | | |
| Unaffiliated issuers | (167,454,528) | |
| Assets and liabilities in foreign currencies | (53,300) | |
| Total change in net unrealized appreciation (depreciation) | | (167,507,828) |
| Net gain (loss) | | (69,483,280) |
| Net increase (decrease) in net assets resulting from operations | | $(24,987,070) |
See accompanying notes which are an integral part of the financial statements.
Statement of Changes in Net Assets
| | Year ended February 28, 2019 | Year ended February 28, 2018 |
| Increase (Decrease) in Net Assets | | |
| Operations | | |
| Net investment income (loss) | $44,496,210 | $45,723,582 |
| Net realized gain (loss) | 98,024,548 | 299,980,969 |
| Change in net unrealized appreciation (depreciation) | (167,507,828) | (369,315,122) |
| Net increase (decrease) in net assets resulting from operations | (24,987,070) | (23,610,571) |
| Distributions to shareholders | (212,172,340) | – |
| Distributions to shareholders from net investment income | – | (43,177,465) |
| Distributions to shareholders from net realized gain | – | (165,062,987) |
| Total distributions | (212,172,340) | (208,240,452) |
| Share transactions - net increase (decrease) | (530,026,269) | (437,546,127) |
| Total increase (decrease) in net assets | (767,185,679) | (669,397,150) |
| Net Assets | | |
| Beginning of period | 2,192,112,247 | 2,861,509,397 |
| End of period | $1,424,926,568 | $2,192,112,247 |
| Other Information | | |
| Undistributed net investment income end of period | | $5,261,183 |
See accompanying notes which are an integral part of the financial statements.
Financial Highlights
Consumer Staples Portfolio Class A
| Years ended February 28, | 2019 | 2018 | 2017 | 2016A | 2015 |
| Selected Per–Share Data | | | | | |
| Net asset value, beginning of period | $87.07 | $96.18 | $89.78 | $101.33 | $87.93 |
| Income from Investment Operations | | | | | |
| Net investment income (loss)B | 2.08C | 1.54 | 1.28 | 1.34 | 1.37 |
| Net realized and unrealized gain (loss) | (2.64) | (2.80) | 9.12 | (4.86) | 17.28 |
| Total from investment operations | (.56) | (1.26) | 10.40 | (3.52) | 18.65 |
| Distributions from net investment income | (2.11) | (1.55) | (1.37) | (1.31) | (1.28) |
| Distributions from net realized gain | (7.53) | (6.30) | (2.64) | (6.72) | (3.98) |
| Total distributions | (9.63)D | (7.85) | (4.00)E | (8.03) | (5.25)F |
| Redemption fees added to paid in capitalB | – | – | –G | –G | –G |
| Net asset value, end of period | $76.88 | $87.07 | $96.18 | $89.78 | $101.33 |
| Total ReturnH,I | (.32)% | (1.68)% | 11.91% | (3.51)% | 21.95% |
| Ratios to Average Net AssetsJ,K | | | | | |
| Expenses before reductions | 1.05% | 1.05% | 1.04% | 1.04% | 1.05% |
| Expenses net of fee waivers, if any | 1.05% | 1.05% | 1.04% | 1.04% | 1.05% |
| Expenses net of all reductions | 1.04% | 1.04% | 1.03% | 1.04% | 1.05% |
| Net investment income (loss) | 2.65%C | 1.60% | 1.37% | 1.45% | 1.45% |
| Supplemental Data | | | | | |
| Net assets, end of period (000 omitted) | $232,020 | $317,366 | $522,014 | $470,249 | $414,151 |
| Portfolio turnover rateL | 41%M | 76% | 56%M | 63% | 42%M |
A For the year ended February 29.
B Calculated based on average shares outstanding during the period.
C Net investment income per share reflects a large, non-recurring dividend which amounted to $.69 per share. Excluding this non-recurring dividend, the ratio of net investment income (loss) to average net assets would have been 1.78%.
D Total distributions of $9.63 per share is comprised of distributions from net investment income of $2.105 and distributions from net realized gain of $7.525 per share.
E Total distributions of $4.00 per share is comprised of distributions from net investment income of $1.365 and distributions from net realized gain of $2.636 per share.
F Total distributions of $5.25 per share is comprised of distributions from net investment income of $1.275 and distributions from net realized gain of $3.976 per share.
G Amount represents less than $.005 per share.
H Total returns would have been lower if certain expenses had not been reduced during the applicable periods shown.
I Total returns do not include the effect of the sales charges.
J Fees and expenses of any underlying Fidelity Central Funds are not included in the Fund's expense ratio. The Fund indirectly bears its proportionate share of the expenses of any underlying Fidelity Central Funds.
K Expense ratios reflect operating expenses of the class. Expenses before reductions do not reflect amounts reimbursed by the investment adviser or reductions from brokerage service arrangements or reductions from other expense offset arrangements and do not represent the amount paid by the class during periods when reimbursements or reductions occur. Expenses net of fee waivers reflect expenses after reimbursement by the investment adviser but prior to reductions from brokerage service arrangements or other expense offset arrangements. Expenses net of all reductions represent the net expenses paid by the class.
L Amount does not include the portfolio activity of any underlying Fidelity Central Funds.
M Portfolio turnover rate excludes securities received or delivered in-kind.
See accompanying notes which are an integral part of the financial statements.
Consumer Staples Portfolio Class M
| Years ended February 28, | 2019 | 2018 | 2017 | 2016A | 2015 |
| Selected Per–Share Data | | | | | |
| Net asset value, beginning of period | $86.30 | $95.42 | $89.10 | $100.61 | $87.37 |
| Income from Investment Operations | | | | | |
| Net investment income (loss)B | 1.85C | 1.27 | 1.01 | 1.08 | 1.10 |
| Net realized and unrealized gain (loss) | (2.61) | (2.78) | 9.07 | (4.83) | 17.15 |
| Total from investment operations | (.76) | (1.51) | 10.08 | (3.75) | 18.25 |
| Distributions from net investment income | (1.88) | (1.31) | (1.12) | (1.04) | (1.04) |
| Distributions from net realized gain | (7.53) | (6.30) | (2.64) | (6.72) | (3.98) |
| Total distributions | (9.41) | (7.61) | (3.76) | (7.76) | (5.01)D |
| Redemption fees added to paid in capitalB | – | – | –E | –E | –E |
| Net asset value, end of period | $76.13 | $86.30 | $95.42 | $89.10 | $100.61 |
| Total ReturnF,G | (.59)% | (1.94)% | 11.61% | (3.78)% | 21.60% |
| Ratios to Average Net AssetsH,I | | | | | |
| Expenses before reductions | 1.33% | 1.32% | 1.32% | 1.32% | 1.32% |
| Expenses net of fee waivers, if any | 1.32% | 1.32% | 1.32% | 1.32% | 1.32% |
| Expenses net of all reductions | 1.31% | 1.31% | 1.31% | 1.31% | 1.32% |
| Net investment income (loss) | 2.37%C | 1.33% | 1.09% | 1.17% | 1.18% |
| Supplemental Data | | | | | |
| Net assets, end of period (000 omitted) | $60,069 | $76,572 | $89,925 | $76,586 | $81,489 |
| Portfolio turnover rateJ | 41%K | 76% | 56%K | 63% | 42%K |
A For the year ended February 29.
B Calculated based on average shares outstanding during the period.
C Net investment income per share reflects a large, non-recurring dividend which amounted to $.68 per share. Excluding this non-recurring dividend, the ratio of net investment income (loss) to average net assets would have been 1.50%.
D Total distributions of $5.01 per share is comprised of distributions from net investment income of $1.036 and distributions from net realized gain of $3.976 per share.
E Amount represents less than $.005 per share.
F Total returns would have been lower if certain expenses had not been reduced during the applicable periods shown.
G Total returns do not include the effect of the sales charges.
H Fees and expenses of any underlying Fidelity Central Funds are not included in the Fund's expense ratio. The Fund indirectly bears its proportionate share of the expenses of any underlying Fidelity Central Funds.
I Expense ratios reflect operating expenses of the class. Expenses before reductions do not reflect amounts reimbursed by the investment adviser or reductions from brokerage service arrangements or reductions from other expense offset arrangements and do not represent the amount paid by the class during periods when reimbursements or reductions occur. Expenses net of fee waivers reflect expenses after reimbursement by the investment adviser but prior to reductions from brokerage service arrangements or other expense offset arrangements. Expenses net of all reductions represent the net expenses paid by the class.
J Amount does not include the portfolio activity of any underlying Fidelity Central Funds.
K Portfolio turnover rate excludes securities received or delivered in-kind.
See accompanying notes which are an integral part of the financial statements.
Consumer Staples Portfolio Class C
| Years ended February 28, | 2019 | 2018 | 2017 | 2016A | 2015 |
| Selected Per–Share Data | | | | | |
| Net asset value, beginning of period | $84.85 | $93.89 | $87.77 | $99.27 | $86.32 |
| Income from Investment Operations | | | | | |
| Net investment income (loss)B | 1.46C | .81 | .56 | .63 | .65 |
| Net realized and unrealized gain (loss) | (2.57) | (2.73) | 8.92 | (4.75) | 16.93 |
| Total from investment operations | (1.11) | (1.92) | 9.48 | (4.12) | 17.58 |
| Distributions from net investment income | (1.43) | (.82) | (.73) | (.65) | (.65) |
| Distributions from net realized gain | (7.53) | (6.30) | (2.64) | (6.72) | (3.98) |
| Total distributions | (8.95)D | (7.12) | (3.36)E | (7.38)F | (4.63) |
| Redemption fees added to paid in capitalB | – | – | –G | –G | –G |
| Net asset value, end of period | $74.79 | $84.85 | $93.89 | $87.77 | $99.27 |
| Total ReturnH,I | (1.05)% | (2.41)% | 11.07% | (4.23)% | 21.03% |
| Ratios to Average Net AssetsJ,K | | | | | |
| Expenses before reductions | 1.79% | 1.79% | 1.80% | 1.80% | 1.80% |
| Expenses net of fee waivers, if any | 1.79% | 1.79% | 1.79% | 1.80% | 1.80% |
| Expenses net of all reductions | 1.78% | 1.78% | 1.79% | 1.79% | 1.80% |
| Net investment income (loss) | 1.91%C | .86% | .61% | .69% | .70% |
| Supplemental Data | | | | | |
| Net assets, end of period (000 omitted) | $150,822 | $228,874 | $308,350 | $250,576 | $228,151 |
| Portfolio turnover rateL | 41%M | 76% | 56%M | 63% | 42%M |
A For the year ended February 29.
B Calculated based on average shares outstanding during the period.
C Net investment income per share reflects a large, non-recurring dividend which amounted to $.67 per share. Excluding this non-recurring dividend, the ratio of net investment income (loss) to average net assets would have been 1.04%.
D Total distributions of $8.95 per share is comprised of distributions from net investment income of $1.427 and distributions from net realized gain of $7.525 per share.
E Total distributions of $3.36 per share is comprised of distributions from net investment income of $.726 and distributions from net realized gain of $2.636 per share.
F Total distributions of $7.38 per share is comprised of distributions from net investment income of $.651 and distributions from net realized gain of $6.724 per share.
G Amount represents less than $.005 per share.
H Total returns would have been lower if certain expenses had not been reduced during the applicable periods shown.
I Total returns do not include the effect of the contingent deferred sales charge.
J Fees and expenses of any underlying Fidelity Central Funds are not included in the Fund's expense ratio. The Fund indirectly bears its proportionate share of the expenses of any underlying Fidelity Central Funds.
K Expense ratios reflect operating expenses of the class. Expenses before reductions do not reflect amounts reimbursed by the investment adviser or reductions from brokerage service arrangements or reductions from other expense offset arrangements and do not represent the amount paid by the class during periods when reimbursements or reductions occur. Expenses net of fee waivers reflect expenses after reimbursement by the investment adviser but prior to reductions from brokerage service arrangements or other expense offset arrangements. Expenses net of all reductions represent the net expenses paid by the class.
L Amount does not include the portfolio activity of any underlying Fidelity Central Funds.
M Portfolio turnover rate excludes securities received or delivered in-kind.
See accompanying notes which are an integral part of the financial statements.
Consumer Staples Portfolio
| Years ended February 28, | 2019 | 2018 | 2017 | 2016A | 2015 |
| Selected Per–Share Data | | | | | |
| Net asset value, beginning of period | $87.85 | $97.01 | $90.48 | $102.03 | $88.51 |
| Income from Investment Operations | | | | | |
| Net investment income (loss)B | 2.34C | 1.82 | 1.56 | 1.61 | 1.64 |
| Net realized and unrealized gain (loss) | (2.67) | (2.82) | 9.20 | (4.89) | 17.40 |
| Total from investment operations | (.33) | (1.00) | 10.76 | (3.28) | 19.04 |
| Distributions from net investment income | (2.36) | (1.86) | (1.60) | (1.55) | (1.54) |
| Distributions from net realized gain | (7.53) | (6.30) | (2.64) | (6.72) | (3.98) |
| Total distributions | (9.89) | (8.16) | (4.23)D | (8.27) | (5.52) |
| Redemption fees added to paid in capitalB | – | – | –E | –E | –E |
| Net asset value, end of period | $77.63 | $87.85 | $97.01 | $90.48 | $102.03 |
| Total ReturnF | (.03)% | (1.40)% | 12.24% | (3.25)% | 22.27% |
| Ratios to Average Net AssetsG,H | | | | | |
| Expenses before reductions | .77% | .76% | .76% | .77% | .77% |
| Expenses net of fee waivers, if any | .76% | .76% | .76% | .77% | .77% |
| Expenses net of all reductions | .75% | .76% | .76% | .76% | .77% |
| Net investment income (loss) | 2.94%C | 1.89% | 1.64% | 1.72% | 1.73% |
| Supplemental Data | | | | | |
| Net assets, end of period (000 omitted) | $814,350 | $1,328,696 | $1,665,604 | $2,039,983 | $2,173,970 |
| Portfolio turnover rateI | 41%J | 76% | 56%J | 63% | 42%J |
A For the year ended February 29.
B Calculated based on average shares outstanding during the period.
C Net investment income per share reflects a large, non-recurring dividend which amounted to $.69 per share. Excluding this non-recurring dividend, the ratio of net investment income (loss) to average net assets would have been 2.07%.
D Total distributions of $4.23 per share is comprised of distributions from net investment income of $1.596 and distributions from net realized gain of $2.636 per share.
E Amount represents less than $.005 per share.
F Total returns would have been lower if certain expenses had not been reduced during the applicable periods shown.
G Fees and expenses of any underlying Fidelity Central Funds are not included in the Fund's expense ratio. The Fund indirectly bears its proportionate share of the expenses of any underlying Fidelity Central Funds.
H Expense ratios reflect operating expenses of the class. Expenses before reductions do not reflect amounts reimbursed by the investment adviser or reductions from brokerage service arrangements or reductions from other expense offset arrangements and do not represent the amount paid by the class during periods when reimbursements or reductions occur. Expenses net of fee waivers reflect expenses after reimbursement by the investment adviser but prior to reductions from brokerage service arrangements or other expense offset arrangements. Expenses net of all reductions represent the net expenses paid by the class.
I Amount does not include the portfolio activity of any underlying Fidelity Central Funds.
J Portfolio turnover rate excludes securities received or delivered in-kind.
See accompanying notes which are an integral part of the financial statements.
Consumer Staples Portfolio Class I
| Years ended February 28, | 2019 | 2018 | 2017 | 2016A | 2015 |
| Selected Per–Share Data | | | | | |
| Net asset value, beginning of period | $87.68 | $96.82 | $90.34 | $101.91 | $88.33 |
| Income from Investment Operations | | | | | |
| Net investment income (loss)B | 2.33C | 1.81 | 1.54 | 1.60 | 1.59 |
| Net realized and unrealized gain (loss) | (2.68) | (2.82) | 9.19 | (4.89) | 17.40 |
| Total from investment operations | (.35) | (1.01) | 10.73 | (3.29) | 18.99 |
| Distributions from net investment income | (2.36) | (1.83) | (1.61) | (1.55) | (1.44) |
| Distributions from net realized gain | (7.53) | (6.30) | (2.64) | (6.72) | (3.98) |
| Total distributions | (9.88)D | (8.13) | (4.25) | (8.28)E | (5.41)F |
| Redemption fees added to paid in capitalB | – | – | –G | –G | –G |
| Net asset value, end of period | $77.45 | $87.68 | $96.82 | $90.34 | $101.91 |
| Total ReturnH | (.04)% | (1.41)% | 12.22% | (3.26)% | 22.26% |
| Ratios to Average Net AssetsI,J | | | | | |
| Expenses before reductions | .77% | .78% | .78% | .78% | .80% |
| Expenses net of fee waivers, if any | .77% | .78% | .78% | .77% | .80% |
| Expenses net of all reductions | .76% | .77% | .77% | .77% | .80% |
| Net investment income (loss) | 2.93%C | 1.88% | 1.63% | 1.71% | 1.70% |
| Supplemental Data | | | | | |
| Net assets, end of period (000 omitted) | $159,614 | $240,605 | $275,616 | $216,836 | $198,538 |
| Portfolio turnover rateK | 41%L | 76% | 56%L | 63% | 42%L |
A For the year ended February 29.
B Calculated based on average shares outstanding during the period.
C Net investment income per share reflects a large, non-recurring dividend which amounted to $.69 per share. Excluding this non-recurring dividend, the ratio of net investment income (loss) to average net assets would have been 2.06%.
D Total distributions of $9.88 per share is comprised of distributions from net investment income of $2.357 and distributions from net realized gain of $7.525 per share.
E Total distributions of $8.28 per share is comprised of distributions from net investment income of $1.553 and distributions from net realized gain of $6.724 per share.
F Total distributions of $5.41 per share is comprised of distributions from net investment income of $1.436 and distributions from net realized gain of $3.976 per share.
G Amount represents less than $.005 per share.
H Total returns would have been lower if certain expenses had not been reduced during the applicable periods shown.
I Fees and expenses of any underlying Fidelity Central Funds are not included in the Fund's expense ratio. The Fund indirectly bears its proportionate share of the expenses of any underlying Fidelity Central Funds.
J Expense ratios reflect operating expenses of the class. Expenses before reductions do not reflect amounts reimbursed by the investment adviser or reductions from brokerage service arrangements or reductions from other expense offset arrangements and do not represent the amount paid by the class during periods when reimbursements or reductions occur. Expenses net of fee waivers reflect expenses after reimbursement by the investment adviser but prior to reductions from brokerage service arrangements or other expense offset arrangements. Expenses net of all reductions represent the net expenses paid by the class.
K Amount does not include the portfolio activity of any underlying Fidelity Central Funds.
L Portfolio turnover rate excludes securities received or delivered in-kind.
See accompanying notes which are an integral part of the financial statements.
Consumer Staples Portfolio Class Z
| Year ended February 28, | 2019 A |
| Selected Per–Share Data | |
| Net asset value, beginning of period | $81.61 |
| Income from Investment Operations | |
| Net investment income (loss)B | .05C |
| Net realized and unrealized gain (loss) | .33D |
| Total from investment operations | .38 |
| Distributions from net investment income | (2.23) |
| Distributions from net realized gain | (2.40) |
| Total distributions | (4.63) |
| Net asset value, end of period | $77.36 |
| Total ReturnE,F | .79% |
| Ratios to Average Net AssetsG,H | |
| Expenses before reductions | .63%I |
| Expenses net of fee waivers, if any | .62%I |
| Expenses net of all reductions | .61%I |
| Net investment income (loss) | .16%C,I |
| Supplemental Data | |
| Net assets, end of period (000 omitted) | $8,052 |
| Portfolio turnover rateJ | 41%K |
A For the period October 2, 2018 (commencement of sale of shares) to February 28, 2019.
B Calculated based on average shares outstanding during the period.
C Net investment income per share reflects a large, non-recurring dividend which amounted to $.26 per share. Excluding this non-recurring dividend, the ratio of net investment income (loss) to average net assets would have been (.69)%.
D The amount shown for a share outstanding does not correspond with the aggregate net gain (loss) on investments for the period due to the timing of sales and repurchases of shares in relation to fluctuating market values of the investments of the Fund.
E Total returns for periods of less than one year are not annualized.
F Total returns would have been lower if certain expenses had not been reduced during the applicable periods shown.
G Fees and expenses of any underlying Fidelity Central Funds are not included in the Fund's expense ratio. The Fund indirectly bears its proportionate share of the expenses of any underlying Fidelity Central Funds.
H Expense ratios reflect operating expenses of the class. Expenses before reductions do not reflect amounts reimbursed by the investment adviser or reductions from brokerage service arrangements or reductions from other expense offset arrangements and do not represent the amount paid by the class during periods when reimbursements or reductions occur. Expense ratios before reductions for start-up periods may not be representative of longer-term operating periods. Expenses net of fee waivers reflect expenses after reimbursement by the investment adviser but prior to reductions from brokerage service arrangements or other expense offset arrangements. Expenses net of all reductions represent the net expenses paid by the class.
I Annualized
J Amount does not include the portfolio activity of any underlying Fidelity Central Funds.
K Portfolio turnover rate excludes securities received or delivered in-kind.
See accompanying notes which are an integral part of the financial statements.
Notes to Financial Statements
For the period ended February 28, 2019
1. Organization.
Consumer Staples Portfolio (the Fund) is a non-diversified fund of Fidelity Select Portfolios (the Trust) and is authorized to issue an unlimited number of shares. The Trust is registered under the Investment Company Act of 1940, as amended (the 1940 Act), as an open-end management investment company organized as a Massachusetts business trust. The Fund invests primarily in securities of companies whose principal business activities fall within specific industries. The Fund commenced sale of Class Z shares on October 2, 2018. The Fund offers Class A, Class M, Class C, Consumer Staples, Class I and Class Z shares, each of which has equal rights as to assets and voting privileges. Each class has exclusive voting rights with respect to matters that affect that class.
Effective March 1, 2019, Class C shares will automatically convert to Class A shares after a holding period of ten years from the initial date of purchase, with certain exceptions.
2. Investments in Fidelity Central Funds.
The Fund invests in Fidelity Central Funds, which are open-end investment companies generally available only to other investment companies and accounts managed by the investment adviser and its affiliates. The Fund's Schedule of Investments lists each of the Fidelity Central Funds held as of period end, if any, as an investment of the Fund, but does not include the underlying holdings of each Fidelity Central Fund. As an Investing Fund, the Fund indirectly bears its proportionate share of the expenses of the underlying Fidelity Central Funds.
The Money Market Central Funds seek preservation of capital and current income and are managed by Fidelity Investments Money Management, Inc. (FIMM), an affiliate of the investment adviser. Annualized expenses of the Money Market Central Funds as of their most recent shareholder report date are less than .005%.
A complete unaudited list of holdings for each Fidelity Central Fund is available upon request or at the Securities and Exchange Commission (the SEC) website at www.sec.gov. In addition, the financial statements of the Fidelity Central Funds, which are not covered by the Fund's Report of Independent Registered Public Accounting Firm, are available on the SEC website or upon request.
3. Significant Accounting Policies.
The Fund is an investment company and applies the accounting and reporting guidance of the Financial Accounting Standards Board (FASB) Accounting Standards Codification Topic 946 Financial Services – Investments Companies. The financial statements have been prepared in conformity with accounting principles generally accepted in the United States of America (GAAP), which require management to make certain estimates and assumptions at the date of the financial statements. Actual results could differ from those estimates. Subsequent events, if any, through the date that the financial statements were issued have been evaluated in the preparation of the financial statements. The following summarizes the significant accounting policies of the Fund:
Investment Valuation. Investments are valued as of 4:00 p.m. Eastern time on the last calendar day of the period. The Board of Trustees (the Board) has delegated the day to day responsibility for the valuation of the Fund's investments to the Fair Value Committee (the Committee) established by the Fund's investment adviser. In accordance with valuation policies and procedures approved by the Board, the Fund attempts to obtain prices from one or more third party pricing vendors or brokers to value its investments. When current market prices, quotations or currency exchange rates are not readily available or reliable, investments will be fair valued in good faith by the Committee, in accordance with procedures adopted by the Board. Factors used in determining fair value vary by investment type and may include market or investment specific events. The frequency with which these procedures are used cannot be predicted and they may be utilized to a significant extent. The Committee oversees the Fund's valuation policies and procedures and reports to the Board on the Committee's activities and fair value determinations. The Board monitors the appropriateness of the procedures used in valuing the Fund's investments and ratifies the fair value determinations of the Committee.
The Fund categorizes the inputs to valuation techniques used to value its investments into a disclosure hierarchy consisting of three levels as shown below:
- Level 1 – quoted prices in active markets for identical investments
- Level 2 – other significant observable inputs (including quoted prices for similar investments, interest rates, prepayment speeds, etc.)
- Level 3 – unobservable inputs (including the Fund's own assumptions based on the best information available)
Valuation techniques used to value the Fund's investments by major category are as follows:
Equity securities, including restricted securities, for which market quotations are readily available, are valued at the last reported sale price or official closing price as reported by a third party pricing vendor on the primary market or exchange on which they are traded and are categorized as Level 1 in the hierarchy. In the event there were no sales during the day or closing prices are not available, securities are valued at the last quoted bid price or may be valued using the last available price and are generally categorized as Level 2 in the hierarchy. For foreign equity securities, when market or security specific events arise, comparisons to the valuation of American Depositary Receipts (ADRs), futures contracts, Exchange-Traded Funds (ETFs) and certain indexes as well as quoted prices for similar securities may be used and would be categorized as Level 2 in the hierarchy. For equity securities, including restricted securities, where observable inputs are limited, assumptions about market activity and risk are used and these securities may be categorized as Level 3 in the hierarchy.
Investments in open-end mutual funds, including the Fidelity Central Funds, are valued at their closing net asset value (NAV) each business day and are categorized as Level 1 in the hierarchy.
Changes in valuation techniques may result in transfers in or out of an assigned level within the disclosure hierarchy. The aggregate value of investments by input level as of February 28, 2019 is included at the end of the Fund's Schedule of Investments.
Foreign Currency. The Fund may use foreign currency contracts to facilitate transactions in foreign-denominated securities. Gains and losses from these transactions may arise from changes in the value of the foreign currency or if the counterparties do not perform under the contracts' terms.
Foreign-denominated assets, including investment securities, and liabilities are translated into U.S. dollars at the exchange rates at period end. Purchases and sales of investment securities, income and dividends received and expenses denominated in foreign currencies are translated into U.S. dollars at the exchange rate in effect on the transaction date.
The effects of exchange rate fluctuations on investments are included with the net realized and unrealized gain (loss) on investment securities. Other foreign currency transactions resulting in realized and unrealized gain (loss) are disclosed separately.
Investment Transactions and Income. For financial reporting purposes, the Fund's investment holdings and NAV include trades executed through the end of the last business day of the period. The NAV per share for processing shareholder transactions is calculated as of the close of business of the New York Stock Exchange (NYSE), normally 4:00 p.m. Eastern time and includes trades executed through the end of the prior business day. Gains and losses on securities sold are determined on the basis of identified cost and include proceeds received from litigation. Dividend income is recorded on the ex-dividend date, except for certain dividends from foreign securities where the ex-dividend date may have passed, which are recorded as soon as the Fund is informed of the ex-dividend date. Non-cash dividends included in dividend income, if any, are recorded at the fair market value of the securities received. Income and capital gain distributions from Fidelity Central Funds, if any, are recorded on the ex-dividend date. Certain distributions received by the Fund represent a return of capital or capital gain. The Fund determines the components of these distributions subsequent to the ex-dividend date, based upon receipt of tax filings or other correspondence relating to the underlying investment. These distributions are recorded as a reduction of cost of investments and/or as a realized gain. Large, non-recurring dividends recognized by the Fund are presented separately on the Statement of Operations as "Special Dividends" and the impact of these dividends is presented in the Financial Highlights. Investment income is recorded net of foreign taxes withheld where recovery of such taxes is uncertain.
Class Allocations and Expenses. Investment income, realized and unrealized capital gains and losses, common expenses of the Fund, and certain fund-level expense reductions, if any, are allocated daily on a pro-rata basis to each class based on the relative net assets of each class to the total net assets of the Fund. Each class differs with respect to transfer agent and distribution and service plan fees incurred. Certain expense reductions may also differ by class. For the reporting period, the allocated portion of income and expenses to each class as a percent of its average net assets may vary due to the timing of recording these transactions in relation to fluctuating net assets of the classes. Expenses directly attributable to a fund are charged to that fund. Expenses attributable to more than one fund are allocated among the respective funds on the basis of relative net assets or other appropriate methods. Expense estimates are accrued in the period to which they relate and adjustments are made when actual amounts are known.
Deferred Trustee Compensation. Under a Deferred Compensation Plan (the Plan) for the Fund, certain independent Trustees have elected to defer receipt of a portion of their annual compensation. Deferred amounts are invested in a cross-section of Fidelity funds, are marked-to-market and remain in the Fund until distributed in accordance with the Plan. The investment of deferred amounts and the offsetting payable to the Trustees of $192,659 are included in the accompanying Statement of Assets and Liabilities in other receivables and other payables and accrued expenses, respectively.
Income Tax Information and Distributions to Shareholders. Each year, the Fund intends to qualify as a regulated investment company under Subchapter M of the Internal Revenue Code, including distributing substantially all of its taxable income and realized gains. As a result, no provision for U.S. Federal income taxes is required. As of February 28, 2019, the Fund did not have any unrecognized tax benefits in the financial statements; nor is the Fund aware of any tax positions for which it is reasonably possible that the total amounts of unrecognized tax benefits will significantly change in the next twelve months. The Fund files a U.S. federal tax return, in addition to state and local tax returns as required. The Fund's federal income tax returns are subject to examination by the Internal Revenue Service (IRS) for a period of three fiscal years after they are filed. State and local tax returns may be subject to examination for an additional fiscal year depending on the jurisdiction. Foreign taxes are provided for based on the Fund's understanding of the tax rules and rates that exist in the foreign markets in which it invests. The Fund is subject to a tax imposed on capital gains by certain countries in which it invests.
Distributions are declared and recorded on the ex-dividend date. Income and capital gain distributions are declared separately for each class. Income and capital gain distributions are determined in accordance with income tax regulations, which may differ from GAAP. In addition, the Fund claimed a portion of the payment made to redeeming shareholders as a distribution for income tax purposes.
Capital accounts within the financial statements are adjusted for permanent book-tax differences. These adjustments have no impact on net assets or the results of operations. Capital accounts are not adjusted for temporary book-tax differences which will reverse in a subsequent period.
Book-tax differences are primarily due to foreign currency transactions, certain foreign taxes, redemptions in-kind, deferred trustees compensation and losses deferred due to wash sales and excise tax regulations.
As of period end, the cost and unrealized appreciation (depreciation) in securities, and derivatives if applicable, for federal income tax purposes were as follows:
| Gross unrealized appreciation | $239,129,292 |
| Gross unrealized depreciation | (128,324,306) |
| Net unrealized appreciation (depreciation) | $110,804,986 |
| Tax Cost | $1,332,147,560 |
The tax-based components of distributable earnings as of period end were as follows:
| Net unrealized appreciation (depreciation) on securities and other investments | $110,805,693 |
The Fund intends to elect to defer to its next fiscal year $12,994,342 of capital losses recognized during the period November 1, 2018 to February 28, 2019.
The tax character of distributions paid was as follows:
| | February 28, 2019 | February 28, 2018 |
| Ordinary Income | $42,628,113 | $ 43,177,465 |
| Long-term Capital Gains | 169,544,227 | 165,062,987 |
| Total | $212,172,340 | $ 208,240,452 |
Restricted Securities. The Fund may invest in securities that are subject to legal or contractual restrictions on resale. These securities generally may be resold in transactions exempt from registration or to the public if the securities are registered. Disposal of these securities may involve time-consuming negotiations and expense, and prompt sale at an acceptable price may be difficult. Information regarding restricted securities is included at the end of the Fund's Schedule of Investments.
New Rule Issuance. During August 2018, the U.S. Securities and Exchange Commission issued Final Rule Release No. 33-10532, Disclosure Update and Simplification. This Final Rule includes amendments specific to registered investment companies that are intended to eliminate overlap in disclosure requirements between Regulation S-X and GAAP. In accordance with these amendments, certain line-items in the Fund's financial statements have been combined or removed for the current period as outlined in the table below.
| Financial Statement | Current Line-Item Presentation (As Applicable) | Prior Line-Item Presentation (As Applicable) |
| Statement of Assets and Liabilities | Total distributable earnings (loss) | Undistributed/Distributions in excess of/Accumulated net investment income (loss)
Accumulated/Undistributed net realized gain (loss)
Net unrealized appreciation (depreciation) |
| Statement of Changes in Net Assets | N/A - removed | Undistributed/Distributions in excess of/Accumulated net investment income (loss) end of period |
| Statement of Changes in Net Assets | Distributions to shareholders | Distributions to shareholders from net investment income
Distributions to shareholders from net realized gain |
| Distributions to Shareholders Note to Financial Statements | Distributions to shareholders | Distributions to shareholders from net investment income
Distributions to shareholders from net realized gain |
4. Purchases and Sales of Investments.
Purchases and sales of securities, other than short-term securities and in-kind transactions, aggregated $670,662,184 and $1,053,856,444, respectively.
5. Fees and Other Transactions with Affiliates.
Management Fee. Fidelity SelectCo, LLC (the investment adviser) and its affiliates provide the Fund with investment management related services for which the Fund pays a monthly management fee. The management fee is the sum of an individual fund fee rate that is based on an annual rate of .30% of the Fund's average net assets and an annualized group fee rate that averaged .24% during the period. The group fee rate is based upon the average net assets of all the mutual funds advised by Fidelity Management & Research Company (FMR) and the investment adviser. The group fee rate decreases as assets under management increase and increases as assets under management decrease. For the reporting period, the total annual management fee rate was .54% of the Fund's average net assets.
Distribution and Service Plan Fees. In accordance with Rule 12b-1 of the 1940 Act, the Fund has adopted separate Distribution and Service Plans for each class of shares. Certain classes pay Fidelity Distributors Corporation (FDC), an affiliate of the investment adviser, separate Distribution and Service Fees, each of which is based on an annual percentage of each class' average net assets. In addition, FDC may pay financial intermediaries for selling shares of the Fund and providing shareholder support services. For the period, the Distribution and Service Fee rates, total fees and amounts retained by FDC were as follows:
| | Distribution Fee | Service Fee | Total Fees | Retained by FDC |
| Class A | -% | .25% | $637,771 | $– |
| Class M | .25% | .25% | 326,316 | – |
| Class C | .75% | .25% | 1,770,491 | – |
| | | | $2,734,578 | $ - |
Sales Load. FDC may receive a front-end sales charge of up to 5.75% for selling Class A shares and 3.50% for selling Class M shares, some of which is paid to financial intermediaries for selling shares of the Fund. Depending on the holding period, FDC may receive contingent deferred sales charges levied on Class A, Class M and Class C redemptions. The deferred sales charges are 1.00% for Class C shares, 1.00% for certain purchases of Class A shares and .25% for certain purchases of Class M shares.
For the period, sales charge amounts retained by FDC were as follows:
| | Retained by FDC |
| Class A | $98,513 |
| Class M | 11,157 |
| Class C(a) | 12,886 |
| | $122,556 |
(a) When Class C shares are initially sold, FDC pays commissions from its own resources to financial intermediaries through which the sales are made.
Transfer Agent Fees. Fidelity Investments Institutional Operations Company, Inc., (FIIOC), an affiliate of the investment adviser, is the transfer, dividend disbursing and shareholder servicing agent for each class of the Fund. FIIOC receives account fees and asset-based fees that vary according to the account size and type of account of the shareholders of the respective classes of the Fund, except for Class Z. FIIOC receives an asset-based fee of Class Z's average net assets. FIIOC pays for typesetting, printing and mailing of shareholder reports, except proxy statements.
For the period, transfer agent fees for each class were as follows:
| | Amount | % of Class-Level Average Net Assets |
| Class A | $549,689 | .22 |
| Class M | 155,410 | .24 |
| Class C | 368,347 | .21 |
| Consumer Staples | 1,619,894 | .18 |
| Class I | 360,468 | .18 |
| Class Z | 792 | .05(a) |
| | $3,054,600 | |
(a) Annualized
Accounting and Security Lending Fees. Fidelity Service Company, Inc. (FSC), an affiliate of the investment adviser, maintains the Fund's accounting records. The accounting fee is based on the level of average net assets for each month. Under a separate contract, FSC administers the security lending program. The security lending fee is based on the number and duration of lending transactions. For the period, the fees were equivalent to an annual rate of .03%.
Brokerage Commissions. The Fund placed a portion of its portfolio transactions with brokerage firms which are affiliates of the investment adviser. Brokerage commissions are included in net realized gain (loss) and change in net unrealized appreciation (depreciation) in the Statement of Operations. The commissions paid to these affiliated firms were $28,524 for the period.
Interfund Lending Program. Pursuant to an Exemptive Order issued by the SEC, the Fund, along with other registered investment companies having management contracts with Fidelity Management & Research Company (FMR) or other affiliated entities of FMR, may participate in an interfund lending program. This program provides an alternative credit facility allowing the funds to borrow from, or lend money to, other participating affiliated funds. At period end, there were no interfund loans outstanding. The Fund's activity in this program during the period for which loans were outstanding was as follows:
| Borrower or Lender | Average Loan Balance | Weighted Average Interest Rate | Interest Expense |
| Borrower | $5,611,556 | 2.20% | $15,443 |
Interfund Trades. The Fund may purchase from or sell securities to other Fidelity Funds under procedures adopted by the Board. The procedures have been designed to ensure these interfund trades are executed in accordance with Rule 17a-7 of the 1940 Act. Interfund trades are included within the respective purchases and sales amounts shown in the Purchases and Sales of Investments note.
Other. During the period, the investment adviser reimbursed the Fund for certain losses in the amount of $7,910.
Affiliated Redemptions In-Kind. During the period, 3,404,232 shares of the Fund were redeemed in-kind for investments and cash with a value of $278,330,010. The net realized gain of $70,956,466 on investments delivered through in-kind redemptions is included in the accompanying Statement of Operations. The amount of the in-kind redemptions is included in share transactions in the accompanying Statement of Changes in Net Assets as well as the Notes to Financial Statements. The Fund recognized no gain or loss for federal income tax purposes.
6. Committed Line of Credit.
The Fund participates with other funds managed by the investment adviser or an affiliate in a $4.25 billion credit facility (the "line of credit") to be utilized for temporary or emergency purposes to fund shareholder redemptions or for other short-term liquidity purposes. The Fund has agreed to pay commitment fees on its pro-rata portion of the line of credit, which amounted to $4,913 and is reflected in Miscellaneous expenses on the Statement of Operations. During the period, the Fund did not borrow on this line of credit.
7. Security Lending.
The Fund lends portfolio securities through a lending agent from time to time in order to earn additional income. On the settlement date of the loan, the Fund receives collateral (in the form of U.S. Treasury obligations, letters of credit and/or cash) against the loaned securities and maintains collateral in an amount not less than 100% of the market value of the loaned securities during the period of the loan. The market value of the loaned securities is determined at the close of business of the Fund and any additional required collateral is delivered to the Fund on the next business day. The Fund or borrower may terminate the loan at any time, and if the borrower defaults on its obligation to return the securities loaned because of insolvency or other reasons, the Fund may apply collateral received from the borrower against the obligation. The Fund may experience delays and costs in recovering the securities loaned. Any cash collateral received is invested in the Fidelity Securities Lending Cash Central Fund. The value of loaned securities and cash collateral at period end are disclosed on the Fund's Statement of Assets and Liabilities. Security lending income represents the income earned on investing cash collateral, less rebates paid to borrowers and any lending agent fees associated with the loan, plus any premium payments received for lending certain types of securities. Security lending income is presented in the Statement of Operations as a component of income from Fidelity Central Funds. Total security lending income during the period amounted to $162,259.
8. Bank Borrowings.
The Fund is permitted to have bank borrowings for temporary or emergency purposes to fund shareholder redemptions or for other short-term liquidity requirements. The Fund has established borrowing arrangements with certain banks. The interest rate on the borrowings is the bank's base rate, as revised from time to time. The average loan balance during the period for which loans were outstanding amounted to $1,854,000. The weighted average interest rate was 2.41%. The interest expense amounted to $372 under the bank borrowing program. At period end, there were no bank borrowings outstanding.
9. Expense Reductions.
Commissions paid to certain brokers with whom the investment adviser, or its affiliates, places trades on behalf of the Fund include an amount in addition to trade execution, which may be rebated back to the Fund to offset certain expenses. This amount totaled $259,881 for the period.
In addition, during the period the investment adviser reimbursed and/or waived a portion of fund-level operating expenses in the amount of $16,696 and a portion of class-level operating expenses as follows:
| | Amount |
| Class A | $2,607 |
| Class M | 675 |
| Class C | 1,696 |
| Consumer Staples | 9,161 |
| Class I | 1,789 |
| Class Z | 91 |
| | $16,019 |
10. Distributions to Shareholders.
Distributions to shareholders of each class were as follows:
| | Year ended
February 28, 2019(a) | Year ended
February 28, 2018 |
| Distributions to shareholders | | |
| Class A | $31,532,315 | $– |
| Class M | 7,789,847 | – |
| Class C | 21,174,166 | – |
| Consumer Staples | 126,567,988 | – |
| Class I | 24,805,720 | – |
| Class Z | 302,304 | – |
| Total | $212,172,340 | $– |
| From net investment income | | |
| Class A | $– | $5,661,958 |
| Class M | – | 1,157,943 |
| Class C | – | 2,342,161 |
| Consumer Staples | – | 28,193,421 |
| Class I | – | 5,821,982 |
| Total | $– | $43,177,465 |
| From net realized gain | | |
| Class A | $– | $23,291,142 |
| Class M | – | 5,598,245 |
| Class C | – | 18,434,923 |
| Consumer Staples | – | 96,942,698 |
| Class I | – | 20,795,979 |
| Total | $– | $165,062,987 |
(a) Distributions for Class Z are for the period October 2, 2018 (commencement of sale of shares) to February 28, 2019.
11. Share Transactions.
Share transactions for each class were as follows and may contain automatic conversions between classes or exchanges between affiliated funds:
| | Shares | Shares | Dollars | Dollars |
| | Year ended February 28, 2019(a) | Year ended February 28, 2018 | Year ended February 28, 2019 (a) | Year ended February 28, 2018 |
| Class A | | | | |
| Shares sold | 449,932 | 878,413 | $35,089,323 | $84,134,789 |
| Reinvestment of distributions | 398,204 | 304,910 | 30,796,418 | 28,169,668 |
| Shares redeemed | (1,475,083) | (2,965,599) | (115,548,253) | (284,396,390) |
| Net increase (decrease) | (626,947) | (1,782,276) | $(49,662,512) | $(172,091,933) |
| Class M | | | | |
| Shares sold | 79,651 | 105,204 | $6,204,264 | $10,021,877 |
| Reinvestment of distributions | 101,114 | 73,231 | 7,739,839 | 6,708,282 |
| Shares redeemed | (278,973) | (233,572) | (21,711,204) | (22,022,226) |
| Net increase (decrease) | (98,208) | (55,137) | $(7,767,101) | $(5,292,067) |
| Class C | | | | |
| Shares sold | 207,723 | 324,616 | $15,770,092 | $30,510,004 |
| Reinvestment of distributions | 267,367 | 218,231 | 20,225,054 | 19,684,994 |
| Shares redeemed | (1,155,923) | (1,129,562) | (88,087,579) | (104,331,925) |
| Net increase (decrease) | (680,833) | (586,715) | $(52,092,433) | $(54,136,927) |
| Consumer Staples | | | | |
| Shares sold | 1,329,875 | 1,946,234 | $104,789,246 | $188,435,249 |
| Reinvestment of distributions | 1,509,435 | 1,262,390 | 118,306,244 | 117,653,205 |
| Shares redeemed | (7,473,301)(b) | (5,253,889) | (599,358,298)(b) | (504,239,846) |
| Net increase (decrease) | (4,633,991) | (2,045,265) | $(376,262,808) | $(198,151,392) |
| Class I | | | | |
| Shares sold | 973,629 | 2,545,385 | $76,737,622 | $246,802,163 |
| Reinvestment of distributions | 293,006 | 261,308 | 22,761,304 | 24,362,082 |
| Shares redeemed | (1,949,992) | (2,909,251) | (151,953,970) | (279,038,053) |
| Net increase (decrease) | (683,357) | (102,558) | $(52,455,044) | $(7,873,808) |
| Class Z | | | | |
| Shares sold | 110,114 | – | $8,671,440 | $– |
| Reinvestment of distributions | 3,266 | – | 238,969 | – |
| Shares redeemed | (9,296) | – | (696,780) | – |
| Net increase (decrease) | 104,084 | – | $8,213,629 | $– |
(a) Share transactions for Class Z are for the period October 2, 2018 (commencement of sale of shares) to February 28, 2019.
(b) Amount includes in-kind redemptions (see the Affiliated Redemptions In-Kind note for additional details).
12. Other.
The Fund's organizational documents provide former and current trustees and officers with a limited indemnification against liabilities arising in connection with the performance of their duties to the Fund. In the normal course of business, the Fund may also enter into contracts that provide general indemnifications. The Fund's maximum exposure under these arrangements is unknown as this would be dependent on future claims that may be made against the Fund. The risk of material loss from such claims is considered remote.
Report of Independent Registered Public Accounting Firm
To the Board of Trustees of Fidelity Select Portfolios and Shareholders of Consumer Staples Portfolio:
Opinion on the Financial Statements
We have audited the accompanying statement of assets and liabilities, including the schedule of investments, of Consumer Staples Portfolio (one of the funds constituting Fidelity Select Portfolios, referred to hereafter as the "Fund") as of February 28, 2019, the related statement of operations for the year ended February 28, 2019, the statement of changes in net assets for each of the two years in the period ended February 28,2019, including the related notes, and the financial highlights for ieach of the periods indicated therein (collectively referred to as the “financial statements”). In our opinion, the financial statements present fairly, in all material respects, the financial position of the Fund as of February 28, 2019, the results of its operations for the year then ended, the changes in its net assets for each of the two years in the period ended February 28, 2019 and the financial highlights for each of the periods indicated therein in conformity with accounting principles generally accepted in the United States of America.
Basis for Opinion
These financial statements are the responsibility of the Fund’s management. Our responsibility is to express an opinion on the Fund’s financial statements based on our audits. We are a public accounting firm registered with the Public Company Accounting Oversight Board (United States) (PCAOB) and are required to be independent with respect to the Fund in accordance with the U.S. federal securities laws and the applicable rules and regulations of the Securities and Exchange Commission and the PCAOB.
We conducted our audits of these financial statements in accordance with the standards of the PCAOB. Those standards require that we plan and perform the audit to obtain reasonable assurance about whether the financial statements are free of material misstatement, whether due to error or fraud.
Our audits included performing procedures to assess the risks of material misstatement of the financial statements, whether due to error or fraud, and performing procedures that respond to those risks. Such procedures included examining, on a test basis, evidence regarding the amounts and disclosures in the financial statements. Our audits also included evaluating the accounting principles used and significant estimates made by management, as well as evaluating the overall presentation of the financial statements. Our procedures included confirmation of securities owned as of February 28, 2019 by correspondence with the custodian and brokers; when replies were not received from brokers, we performed other auditing procedures. We believe that our audits provide a reasonable basis for our opinion.
PricewaterhouseCoopers LLP
Boston, Massachusetts
April 16, 2019
We have served as the auditor of one or more investment companies in the Fidelity group of funds since 1932.
Trustees and Officers
The Trustees, Members of the Advisory Board (if any), and officers of the trust and fund, as applicable, are listed below. The Board of Trustees governs the fund and is responsible for protecting the interests of shareholders. The Trustees are experienced executives who meet periodically throughout the year to oversee the fund's activities, review contractual arrangements with companies that provide services to the fund, oversee management of the risks associated with such activities and contractual arrangements, and review the fund's performance. Except for Michael E. Wiley, each of the Trustees oversees 287 funds. Mr. Wiley oversees 195 funds.
The Trustees hold office without limit in time except that (a) any Trustee may resign; (b) any Trustee may be removed by written instrument, signed by at least two-thirds of the number of Trustees prior to such removal; (c) any Trustee who requests to be retired or who has become incapacitated by illness or injury may be retired by written instrument signed by a majority of the other Trustees; and (d) any Trustee may be removed at any special meeting of shareholders by a two-thirds vote of the outstanding voting securities of the trust. Each Trustee who is not an interested person (as defined in the 1940 Act) of the trust and the fund is referred to herein as an Independent Trustee. Each Independent Trustee shall retire not later than the last day of the calendar year in which his or her 75th birthday occurs. The Independent Trustees may waive this mandatory retirement age policy with respect to individual Trustees. Officers and Advisory Board Members hold office without limit in time, except that any officer or Advisory Board Member may resign or may be removed by a vote of a majority of the Trustees at any regular meeting or any special meeting of the Trustees. Except as indicated, each individual has held the office shown or other offices in the same company for the past five years.
The fund's Statement of Additional Information (SAI) includes more information about the Trustees. To request a free copy, call Fidelity at 1-800-544-8544 if you’re an individual investing directly with Fidelity, call 1-800-835-5092 if you’re a plan sponsor or participant with Fidelity as your recordkeeper or call 1-877-208-0098 on institutional accounts or if you’re an advisor or invest through one.
Experience, Skills, Attributes, and Qualifications of the Trustees. The Governance and Nominating Committee has adopted a statement of policy that describes the experience, qualifications, attributes, and skills that are necessary and desirable for potential Independent Trustee candidates (Statement of Policy). The Board believes that each Trustee satisfied at the time he or she was initially elected or appointed a Trustee, and continues to satisfy, the standards contemplated by the Statement of Policy. The Governance and Nominating Committee also engages professional search firms to help identify potential Independent Trustee candidates who have the experience, qualifications, attributes, and skills consistent with the Statement of Policy. From time to time, additional criteria based on the composition and skills of the current Independent Trustees, as well as experience or skills that may be appropriate in light of future changes to board composition, business conditions, and regulatory or other developments, have also been considered by the professional search firms and the Governance and Nominating Committee. In addition, the Board takes into account the Trustees' commitment and participation in Board and committee meetings, as well as their leadership of standing and ad hoc committees throughout their tenure.
In determining that a particular Trustee was and continues to be qualified to serve as a Trustee, the Board has considered a variety of criteria, none of which, in isolation, was controlling. The Board believes that, collectively, the Trustees have balanced and diverse experience, qualifications, attributes, and skills, which allow the Board to operate effectively in governing the fund and protecting the interests of shareholders. Information about the specific experience, skills, attributes, and qualifications of each Trustee, which in each case led to the Board's conclusion that the Trustee should serve (or continue to serve) as a trustee of the fund, is provided below.
Board Structure and Oversight Function. James C. Curvey is an interested person and currently serves as Chairman. The Trustees have determined that an interested Chairman is appropriate and benefits shareholders because an interested Chairman has a personal and professional stake in the quality and continuity of services provided to the fund. Independent Trustees exercise their informed business judgment to appoint an individual of their choosing to serve as Chairman, regardless of whether the Trustee happens to be independent or a member of management. The Independent Trustees have determined that they can act independently and effectively without having an Independent Trustee serve as Chairman and that a key structural component for assuring that they are in a position to do so is for the Independent Trustees to constitute a substantial majority for the Board. The Independent Trustees also regularly meet in executive session. Ned C. Lautenbach serves as Chairman of the Independent Trustees and as such (i) acts as a liaison between the Independent Trustees and management with respect to matters important to the Independent Trustees and (ii) with management prepares agendas for Board meetings.
Fidelity® funds are overseen by different Boards of Trustees. The fund's Board oversees Fidelity's high income and certain equity funds, and other Boards oversee Fidelity's investment-grade bond, money market, asset allocation, and other equity funds. The asset allocation funds may invest in Fidelity® funds overseen by the fund's Board. The use of separate Boards, each with its own committee structure, allows the Trustees of each group of Fidelity® funds to focus on the unique issues of the funds they oversee, including common research, investment, and operational issues. On occasion, the separate Boards establish joint committees to address issues of overlapping consequences for the Fidelity® funds overseen by each Board.
The Trustees operate using a system of committees to facilitate the timely and efficient consideration of all matters of importance to the Trustees, the fund, and fund shareholders and to facilitate compliance with legal and regulatory requirements and oversight of the fund's activities and associated risks. The Board, acting through its committees, has charged SelectCo and its affiliates with (i) identifying events or circumstances the occurrence of which could have demonstrably adverse effects on the fund's business and/or reputation; (ii) implementing processes and controls to lessen the possibility that such events or circumstances occur or to mitigate the effects of such events or circumstances if they do occur; and (iii) creating and maintaining a system designed to evaluate continuously business and market conditions in order to facilitate the identification and implementation processes described in (i) and (ii) above. Because the day-to-day operations and activities of the fund are carried out by or through SelectCo, its affiliates, and other service providers, the fund's exposure to risks is mitigated but not eliminated by the processes overseen by the Trustees. While each of the Board's committees has responsibility for overseeing different aspects of the fund's activities, oversight is exercised primarily through the Operations, Audit, and Compliance Committees. In addition, the Independent Trustees have worked with Fidelity to enhance the Board's oversight of investment and financial risks, legal and regulatory risks, technology risks, and operational risks, including the development of additional risk reporting to the Board. Appropriate personnel, including but not limited to the fund's Chief Compliance Officer (CCO), SelectCo's internal auditor, the independent accountants, the fund's Treasurer and portfolio management personnel, make periodic reports to the Board's committees, as appropriate, including an annual review of Fidelity's risk management program for the Fidelity® funds. The responsibilities of each standing committee, including their oversight responsibilities, are described further under "Standing Committees of the Trustees."
Interested Trustees*:
Correspondence intended for a Trustee who is an interested person may be sent to Fidelity Investments, 245 Summer Street, Boston, Massachusetts 02210.
Name, Year of Birth; Principal Occupations and Other Relevant Experience+
James C. Curvey (1935)
Year of Election or Appointment: 2018
Trustee
Chairman of the Board of Trustees
Mr. Curvey also serves as Trustee of other Fidelity® funds. Mr. Curvey is Vice Chairman (2007-present) and Director of FMR LLC (diversified financial services company). In addition, Mr. Curvey is an Overseer Emeritus for the Boston Symphony Orchestra, a Director of Artis-Naples, and a Trustee of Brewster Academy in Wolfeboro, New Hampshire. Previously, Mr. Curvey served as a Director of Fidelity Research & Analysis Co. (investment adviser firm, 2009-2018), Director of Fidelity Investments Money Management, Inc. (investment adviser firm, 2009-2014) and a Director of FMR and FMR Co., Inc. (investment adviser firms, 2007-2014).
* Determined to be an "Interested Trustee" by virtue of, among other things, his or her affiliation with the trust or various entities under common control with SelectCo.
+ The information includes the Trustee's principal occupation during the last five years and other information relating to the experience, attributes, and skills relevant to the Trustee's qualifications to serve as a Trustee, which led to the conclusion that the Trustee should serve as a Trustee for the fund.
Independent Trustees:
Correspondence intended for an Independent Trustee may be sent to Fidelity Investments, P.O. Box 55235, Boston, Massachusetts 02205-5235.
Name, Year of Birth; Principal Occupations and Other Relevant Experience+
Dennis J. Dirks (1948)
Year of Election or Appointment: 2018
Trustee
Mr. Dirks also serves as Trustee of other Fidelity® funds. Prior to his retirement in May 2003, Mr. Dirks was Chief Operating Officer and a member of the Board of The Depository Trust & Clearing Corporation (DTCC). He also served as President, Chief Operating Officer, and Board member of The Depository Trust Company (DTC) and President and Board member of the National Securities Clearing Corporation (NSCC). In addition, Mr. Dirks served as Chief Executive Officer and Board member of the Government Securities Clearing Corporation, Chief Executive Officer and Board member of the Mortgage-Backed Securities Clearing Corporation, as a Trustee and a member of the Finance Committee of Manhattan College (2005-2008), as a Trustee and a member of the Finance Committee of AHRC of Nassau County (2006-2008), as a member of the Independent Directors Council (IDC) Governing Council (2010-2015), and as a member of the Board of Directors for The Brookville Center for Children’s Services, Inc. (2009-2017). Mr. Dirks is a member of the Finance Committee (2016-present) and Board of Directors (2017-present) and is Treasurer (2018-present) of the Asolo Repertory Theatre.
Donald F. Donahue (1950)
Year of Election or Appointment: 2018
Trustee
Mr. Donahue also serves as a Trustee of other Fidelity® funds. Mr. Donahue is President and Chief Executive Officer of Miranda Partners, LLC (risk consulting for the financial services industry, 2012-present). Previously, Mr. Donahue served as a Member of the Advisory Board of certain Fidelity® funds (2015-2018) and Chief Executive Officer (2006-2012), Chief Operating Officer (2003-2006), and Managing Director, Customer Marketing and Development (1999-2003) of The Depository Trust & Clearing Corporation (financial markets infrastructure). Mr. Donahue serves as a Member (2007-present) and Co-Chairman (2016-present) of the Board of Directors of United Way of New York, Member of the Board of Directors of NYC Leadership Academy (2012-present) and Member of the Board of Advisors of Ripple Labs, Inc. (financial services, 2015-present). He also served as Chairman (2010-2012) and Member of the Board of Directors (2012-2013) of Omgeo, LLC (financial services), Treasurer of United Way of New York (2012-2016), and Member of the Board of Directors of XBRL US (financial services non-profit, 2009-2012) and the International Securities Services Association (2009-2012).
Alan J. Lacy (1953)
Year of Election or Appointment: 2018
Trustee
Mr. Lacy also serves as Trustee of other Fidelity® funds. Mr. Lacy serves as a Director of Bristol-Myers Squibb Company (global pharmaceuticals, 2008-present). He is a Trustee of the California Chapter of The Nature Conservancy (2015-present) and a Director of the Center for Advanced Study in the Behavioral Sciences at Stanford University (2015-present). In addition, Mr. Lacy served as Senior Adviser (2007-2014) of Oak Hill Capital Partners, L.P. (private equity) and also served as Chief Executive Officer (2005) and Vice Chairman (2005-2006) of Sears Holdings Corporation (retail) and Chief Executive Officer and Chairman of the Board of Sears, Roebuck and Co. (retail, 2000-2005). Previously, Mr. Lacy served as Chairman (2014-2017) and a member (2010-2017) of the Board of Directors of Dave & Buster’s Entertainment, Inc. (restaurant and entertainment complexes), as Chairman (2008-2011) and a member (2006-2015) of the Board of Trustees of the National Parks Conservation Association, and as a member of the Board of Directors for The Hillman Companies, Inc. (hardware wholesalers, 2010-2014), Earth Fare, Inc. (retail grocery, 2010-2014), and The Western Union Company (global money transfer, 2006-2011).
Ned C. Lautenbach (1944)
Year of Election or Appointment: 2018
Trustee
Chairman of the Independent Trustees
Mr. Lautenbach also serves as Trustee of other Fidelity® funds. Mr. Lautenbach currently serves as Chair (2018-present) and Member (2013-present) of the Board of Governors, State University System of Florida and is a member of the Council on Foreign Relations (1994-present). He is also a member and has most recently served as Chairman of the Board of Directors of Artis-Naples (2012-present). Previously, Mr. Lautenbach served as a member and then Lead Director of the Board of Directors of Eaton Corporation (diversified industrial, 1997-2016). He was also a Partner and Advisory Partner at Clayton, Dubilier & Rice, LLC (private equity investment, 1998-2010), as well as a Director of Sony Corporation (2006-2007). In addition, Mr. Lautenbach also had a 30-year career with IBM (technology company) during which time he served as Senior Vice President and a member of the Corporate Executive Committee (1968-1998).
Joseph Mauriello (1944)
Year of Election or Appointment: 2018
Trustee
Mr. Mauriello also serves as Trustee of other Fidelity® funds. Prior to his retirement in January 2006, Mr. Mauriello served in numerous senior management positions including Deputy Chairman and Chief Operating Officer (2004-2005), and Vice Chairman of Financial Services (2002-2004) of KPMG LLP US (professional services, 1965-2005). Mr. Mauriello currently serves as a member of the Independent Directors Council (IDC) Governing Council (2015-present). Previously, Mr. Mauriello served as a member of the Board of Directors of XL Group plc. (global insurance and re-insurance, 2006-2018).
Cornelia M. Small (1944)
Year of Election or Appointment: 2018
Trustee
Ms. Small also serves as Trustee of other Fidelity® funds. Ms. Small is a member of the Board of Directors (2009-present) and Chair of the Investment Committee (2010-present) of the Teagle Foundation. Ms. Small also serves on the Investment Committee of the Berkshire Taconic Community Foundation (2008-present). Previously, Ms. Small served as Chairperson (2002-2008) and a member of the Investment Committee and Chairperson (2008-2012) and a member of the Board of Trustees of Smith College. In addition, Ms. Small served as Chief Investment Officer, Director of Global Equity Investments, and a member of the Board of Directors of Scudder, Stevens & Clark and Scudder Kemper Investments.
Garnett A. Smith (1947)
Year of Election or Appointment: 2013
Trustee
Mr. Smith also serves as Trustee of other Fidelity® funds. Prior to Mr. Smith's retirement, he served as Chairman and Chief Executive Officer of Inbrand Corp. (manufacturer of personal absorbent products, 1990-1997). He also served as President (1986-1990) of Inbrand Corp. Prior to his employment with Inbrand Corp., he was employed by a retail fabric chain and North Carolina National Bank. In addition, Mr. Smith served as a Member of the Advisory Board of certain Fidelity® funds (2012-2013) and as a board member of the Jackson Hole Land Trust (2009-2012).
David M. Thomas (1949)
Year of Election or Appointment: 2018
Trustee
Mr. Thomas also serves as Trustee of other Fidelity® funds. Mr. Thomas serves as Non-Executive Chairman of the Board of Directors of Fortune Brands Home and Security (home and security products, 2011-present) and as a member of the Board of Directors (2004-present) and Presiding Director (2013-present) of Interpublic Group of Companies, Inc. (marketing communication). Previously, Mr. Thomas served as Executive Chairman (2005-2006) and Chairman and Chief Executive Officer (2000-2005) of IMS Health, Inc. (pharmaceutical and healthcare information solutions), a Director of Fortune Brands, Inc. (consumer products, 2000-2011), and a member of the Board of Trustees of the University of Florida (2013-2018).
Michael E. Wiley (1950)
Year of Election or Appointment: 2008
Trustee
Mr. Wiley also serves as Trustee or Member of the Advisory Board of other Fidelity® funds. Mr. Wiley serves as a Director of High Point Resources (exploration and production, 2005-present). Previously, Mr. Wiley served as a Director of Andeavor Corporation (independent oil refiner and marketer, 2005-2018), a Director of Andeavor Logistics LP (natural resources logistics, 2015-2018), a Director of Post Oak Bank (privately-held bank, 2004-2018), a Director of Asia Pacific Exploration Consolidated (international oil and gas exploration and production, 2008-2013), a member of the Board of Trustees of the University of Tulsa (2000-2006; 2007-2010), a Senior Energy Advisor of Katzenbach Partners, LLC (consulting, 2006-2007), an Advisory Director of Riverstone Holdings (private investment), a Director of Spinnaker Exploration Company (exploration and production, 2001-2005) and Chairman, President, and CEO of Baker Hughes, Inc. (oilfield services, 2000-2004).
+ The information includes the Trustee's principal occupation during the last five years and other information relating to the experience, attributes, and skills relevant to the Trustee's qualifications to serve as a Trustee, which led to the conclusion that the Trustee should serve as a Trustee for the fund.
Advisory Board Members and Officers:
Correspondence intended for a Member of the Advisory Board (if any) may be sent to Fidelity Investments, P.O. Box 55235, Boston, Massachusetts 02205-5235. Correspondence intended for an officer or Peter S. Lynch may be sent to Fidelity Investments, 245 Summer Street, Boston, Massachusetts 02210. Officers appear below in alphabetical order.
Name, Year of Birth; Principal Occupation
Vicki L. Fuller (1957)
Year of Election or Appointment: 2018
Member of the Advisory Board
Ms. Fuller also serves as Member of the Advisory Board of other Fidelity® funds. Ms. Fuller serves as a member of the Board of Directors, Audit Committee, and Nominating and Governance Committee of The Williams Companies, Inc. (natural gas infrastructure, 2018-present). Previously, Ms. Fuller served as the Chief Investment Officer of the New York State Common Retirement Fund (2012-2018) and held a variety of positions at AllianceBernstein L.P. (global asset management, 1985-2012), including Managing Director (2006-2012) and Senior Vice President and Senior Portfolio Manager (2001-2006).
Peter S. Lynch (1944)
Year of Election or Appointment: 2018
Member of the Advisory Board
Mr. Lynch also serves as Member of the Advisory Board of other Fidelity® funds. Mr. Lynch is Vice Chairman and a Director of FMR (investment adviser firm) and FMR Co., Inc. (investment adviser firm). In addition, Mr. Lynch serves as a Trustee of Boston College and as the Chairman of the Inner-City Scholarship Fund. Previously, Mr. Lynch served on the Special Olympics International Board of Directors (1997-2006).
Carol B. Tomé (1957)
Year of Election or Appointment: 2017
Member of the Advisory Board
Ms. Tomé also serves as Member of the Advisory Board of other Fidelity® funds. Ms. Tomé is Chief Financial Officer (2001-present) and Executive Vice President of Corporate Services (2007-present) of The Home Depot, Inc. (home improvement retailer) and a Director (2003-present) and Chair of the Audit Committee (2004-present) of United Parcel Service, Inc. (package delivery and supply chain management). Previously, Ms. Tomé served as Trustee of certain Fidelity® funds (2017), Senior Vice President of Finance and Accounting/Treasurer (2000-2007) and Vice President and Treasurer (1995-2000) of The Home Depot, Inc. and Chair of the Board (2010-2012), Vice Chair of the Board (2009 and 2013), and a Director (2008-2013) of the Federal Reserve Bank of Atlanta. Ms. Tomé is also a director or trustee of many community and professional organizations.
Elizabeth Paige Baumann (1968)
Year of Election or Appointment: 2017
Anti-Money Laundering (AML) Officer
Ms. Baumann also serves as AML Officer of other funds. She is Chief AML Officer (2012-present) and Senior Vice President (2014-present) of FMR LLC (diversified financial services company) and is an employee of Fidelity Investments. Previously, Ms. Baumann served as AML Officer of the funds (2012-2016), and Vice President (2007-2014) and Deputy Anti-Money Laundering Officer (2007-2012) of FMR LLC.
Craig S. Brown (1977)
Year of Election or Appointment: 2019
Assistant Treasurer
Mr. Brown also serves as Assistant Treasurer of other funds. Mr. Brown is an employee of Fidelity Investments (2013-present).
John J. Burke III (1964)
Year of Election or Appointment: 2018
Chief Financial Officer
Mr. Burke also serves as Chief Financial Officer of other funds. Mr. Burke serves as Head of Investment Operations for Fidelity Fund and Investment Operations (2018-present) and is an employee of Fidelity Investments (1998-present). Previously Mr. Burke served as head of Asset Management Investment Operations (2012-2018).
William C. Coffey (1969)
Year of Election or Appointment: 2018
Secretary and Chief Legal Officer (CLO)
Mr. Coffey also serves as Secretary and CLO of other funds. Mr. Coffey serves as CLO, Secretary, and Senior Vice President of Fidelity Management & Research Company and FMR Co., Inc. (investment adviser firms, 2018-present); Secretary of Fidelity SelectCo, LLC and Fidelity Investments Money Management, Inc. (investment adviser firms, 2018-present); and CLO of Fidelity Management & Research (Hong Kong) Limited, FMR Investment Management (UK) Limited, and Fidelity Management & Research (Japan) Limited (investment adviser firms, 2018-present). He is Senior Vice President and Deputy General Counsel of FMR LLC (diversified financial services company, 2010-present), and is an employee of Fidelity Investments. Previously, Mr. Coffey served as Assistant Secretary of certain funds (2009-2018) and as Vice President and Associate General Counsel of FMR LLC (2005-2009).
Timothy M. Cohen (1969)
Year of Election or Appointment: 2018
Vice President
Mr. Cohen also serves as Vice President of other funds. Mr. Cohen serves as Co-Head of Global Equity Research (2016-present), a Director of Fidelity Management & Research (Japan) Limited (investment adviser firm, 2016-present), and is an employee of Fidelity Investments. Previously, Mr. Cohen served as Chief Investment Officer - Equity and a Director of Fidelity Management & Research (U.K.) Inc. (investment adviser firm, 2013-2015) and as a Director of Fidelity Management & Research (Hong Kong) Limited (investment adviser firm, 2017).
Jonathan Davis (1968)
Year of Election or Appointment: 2010
Assistant Treasurer
Mr. Davis also serves as Assistant Treasurer of other funds. Mr. Davis serves as Assistant Treasurer of FMR Capital, Inc. (2017-present) and is an employee of Fidelity Investments. Previously, Mr. Davis served as Vice President and Associate General Counsel of FMR LLC (diversified financial services company, 2003-2010).
Adrien E. Deberghes (1967)
Year of Election or Appointment: 2018
Assistant Treasurer
Mr. Deberghes also serves as an officer of other funds. He serves as Assistant Treasurer of FMR Capital, Inc. (2017-present), Executive Vice President of Fidelity Investments Money Management, Inc. (FIMM) (investment adviser firm, 2016-present), and is an employee of Fidelity Investments (2008-present). Previously, Mr. Deberghes served as President and Treasurer of certain Fidelity® funds (2013-2018). Prior to joining Fidelity Investments, Mr. Deberghes was Senior Vice President of Mutual Fund Administration at State Street Corporation (2007-2008), Senior Director of Mutual Fund Administration at Investors Bank & Trust (2005-2007), and Director of Finance for Dunkin' Brands (2000-2005). Previously, Mr. Deberghes served in other fund officer roles.
Laura M. Del Prato (1964)
Year of Election or Appointment: 2018
Assistant Treasurer
Ms. Del Prato also serves as an officer of other funds. Ms. Del Prato is an employee of Fidelity Investments (2017-present). Prior to joining Fidelity Investments, Ms. Del Prato served as a Managing Director and Treasurer of the JPMorgan Mutual Funds (2014-2017). Prior to JPMorgan, Ms. Del Prato served as a partner at Cohen Fund Audit Services (accounting firm, 2012-2013) and KPMG LLP (accounting firm, 2004-2012).
Colm A. Hogan (1973)
Year of Election or Appointment: 2018
Deputy Treasurer
Mr. Hogan also serves as an officer of other funds. Mr. Hogan serves as Assistant Treasurer of FMR Capital, Inc. (2017-present) and is an employee of Fidelity Investments (2005-present). Previously, Mr. Hogan served as Assistant Treasurer of certain Fidelity® funds (2016-2018).
Pamela R. Holding (1964)
Year of Election or Appointment: 2018
Vice President
Ms. Holding also serves as Vice President of other funds. Ms. Holding serves as Co-Head of Global Equity Research (2018-present) and is an employee of Fidelity Investments (2013-present).
Chris Maher (1972)
Year of Election or Appointment: 2013
Assistant Treasurer
Mr. Maher serves as Assistant Treasurer of other funds. Mr. Maher is Vice President of Valuation Oversight, serves as Assistant Treasurer of FMR Capital, Inc. (2017-present), and is an employee of Fidelity Investments. Previously, Mr. Maher served as Vice President of Asset Management Compliance (2013), Vice President of the Program Management Group of FMR (investment adviser firm, 2010-2013), and Vice President of Valuation Oversight (2008-2010).
Kenneth B. Robins (1969)
Year of Election or Appointment: 2018
Chief Compliance Officer
Mr. Robins also serves as an officer of other funds. Mr. Robins serves as Compliance Officer of Fidelity Management & Research Company and FMR Co., Inc. (investment adviser firms, 2016-present) and is an employee of Fidelity Investments (2004-present). Previously, Mr. Robins served as Executive Vice President of Fidelity Investments Money Management, Inc. (investment adviser firm, 2013-2016) and served in other fund officer roles.
Stacie M. Smith (1974)
Year of Election or Appointment: 2018
President and Treasurer
Ms. Smith also serves as an officer of other funds. Ms. Smith serves as Assistant Treasurer of FMR Capital, Inc. (2017-present), is an employee of Fidelity Investments (2009-present), and has served in other fund officer roles. Prior to joining Fidelity Investments, Ms. Smith served as Senior Audit Manager of Ernst & Young LLP (accounting firm, 1996-2009). Previously, Ms. Smith served as Assistant Treasurer (2013-2018) and Deputy Treasurer (2013-2016) of certain Fidelity® funds.
Marc L. Spector (1972)
Year of Election or Appointment: 2017
Assistant Treasurer
Mr. Spector also serves as an officer of other funds. Mr. Spector serves as Assistant Treasurer of FMR Capital, Inc. (2017-present) and is an employee of Fidelity Investments (2016-present). Prior to joining Fidelity Investments, Mr. Spector served as Director at the Siegfried Group (accounting firm, 2013-2016), and prior to Siegfried Group as audit senior manager at Deloitte & Touche (accounting firm, 2005-2013).
Jim Wegmann (1979)
Year of Election or Appointment: 2019
Assistant Treasurer
Mr. Wegmann also serves as Assistant Treasurer of other funds. Mr. Wegmann is an employee of Fidelity Investments (2011-present).
Shareholder Expense Example
As a shareholder of the Fund, you incur two types of costs: (1) transaction costs, including sales charges (loads) on purchase payments or redemption proceeds, and (2) ongoing costs, including management fees, distribution and/or service (12b-1) fees and other Fund expenses. This Example is intended to help you understand your ongoing costs (in dollars) of investing in the Fund and to compare these costs with the ongoing costs of investing in other mutual funds.
The actual expense Example is based on an investment of $1,000 invested at the beginning of the period and held for the entire period (September 1, 2018 to February 28, 2019) for Class A, Class M, Class C, Consumer Staples and Class I, and for the period (October 2, 2018 to February 28,2019) for Class Z. The hypothetical expense Example is based on an investment of $1,000 invested for the one-half year period (September 1, 2018 to February 28, 2019).
Actual Expenses
The first line of the accompanying table for each class of the Fund provides information about actual account values and actual expenses. You may use the information in this line, together with the amount you invested, to estimate the expenses that you paid over the period. Simply divide your account value by $1,000.00 (for example, an $8,600 account value divided by $1,000.00 = 8.6), then multiply the result by the number in the first line for a class of the Fund under the heading entitled "Expenses Paid During Period" to estimate the expenses you paid on your account during this period. In addition, the Fund, as a shareholder in the underlying Fidelity Central Funds, will indirectly bear its pro-rata share of the fees and expenses incurred by the underlying Fidelity Central Funds. These fees and expenses are not included in the Fund's annualized expense ratio used to calculate the expense estimate in the table below.
Hypothetical Example for Comparison Purposes
The second line of the accompanying table for each class of the Fund provides information about hypothetical account values and hypothetical expenses based on a Class' actual expense ratio and an assumed rate of return of 5% per year before expenses, which is not the Class' actual return. The hypothetical account values and expenses may not be used to estimate the actual ending account balance or expenses you paid for the period. You may use this information to compare the ongoing costs of investing in the Fund and other funds. To do so, compare this 5% hypothetical example with the 5% hypothetical examples that appear in the shareholder reports of the other funds. In addition, the Fund, as a shareholder in the underlying Fidelity Central Funds, will indirectly bear its pro-rata share of the fees and expenses incurred by the underlying Fidelity Central Funds. These fees and expenses are not included in the Fund's annualized expense ratio used to calculate the expense estimate in the table below.
Please note that the expenses shown in the table are meant to highlight your ongoing costs only and do not reflect any transaction costs. Therefore, the second line of the table is useful in comparing ongoing costs only, and will not help you determine the relative total costs of owning different funds. In addition, if these transactional costs were included, your costs would have been higher.
| | Annualized Expense Ratio-A | Beginning
Account Value
| Ending
Account Value
February 28, 2019 | Expenses Paid
During Period
|
| Class A | 1.05% | | | |
| Actual | | $1,000.00 | $1,010.40 | $5.23-B |
| Hypothetical-C | | $1,000.00 | $1,019.59 | $5.26-D |
| Class M | 1.32% | | | |
| Actual | | $1,000.00 | $1,009.00 | $6.58-B |
| Hypothetical-C | | $1,000.00 | $1,018.25 | $6.61-D |
| Class C | 1.80% | | | |
| Actual | | $1,000.00 | $1,006.80 | $8.96-B |
| Hypothetical-C | | $1,000.00 | $1,015.87 | $9.00-D |
| Consumer Staples | .77% | | | |
| Actual | | $1,000.00 | $1,011.90 | $3.84-B |
| Hypothetical-C | | $1,000.00 | $1,020.98 | $3.86-D |
| Class I | .77% | | | |
| Actual | | $1,000.00 | $1,011.80 | $3.84-B |
| Hypothetical-C | | $1,000.00 | $1,020.98 | $3.86-D |
| Class Z | .62% | | | |
| Actual | | $1,000.00 | $1,007.90 | $2.56-B |
| Hypothetical-C | | $1,000.00 | $1,021.72 | $3.11-D |
A Annualized expense ratio reflects expenses net of applicable fee waivers.
B Actual expenses are equal to each Class' annualized expense ratio, multiplied by the average account value over the period, multiplied by 181/365 (to reflect the one-half year period) for Class A, Class M, Class C, Consumer Staples and Class I and multiplied by 150/365 (to reflect the period October 2, 2018 to February 28, 2019) for Class Z.
C 5% return per year before expenses
D Hypothetical expenses are equal to each Class' annualized expense ratio, multiplied by the average account value over the period, multiplied by 181/365 (to reflect the one-half year period).
Distributions (Unaudited)
The fund hereby designates as a capital gain dividend with respect to the taxable year ended February 28, 2019, $50,171,843, or, if subsequently determined to be different, the net capital gain of such year.
Class A, Class M, Class C, Consumer Staples, Class I, and Class Z designate 100% of the dividends distributed during the fiscal year as qualifying for the dividends–received deduction for corporate shareholders.
Class A, Class M, Class C, Consumer Staples, Class I, and Class Z designate 100% of each dividends distributed during the fiscal year as amounts which may be taken into account as a dividend for purposes of the maximum rate under section 1(h)(11) of the Internal Revenue Code.
The fund will notify shareholders in January 2020 of amounts for use in preparing 2019 income tax returns.
Board Approval of Investment Advisory Contracts and Management Fees
Consumer Staples Portfolio
Each year, the Board of Trustees, including the Independent Trustees (together, the Board), votes on the renewal of the management contract with Fidelity SelectCo, LLC (SelectCo), an affiliate of Fidelity Management & Research Company (FMR), and the sub-advisory agreements with affiliates of FMR (together, the Advisory Contracts) for the fund. SelectCo and the sub-advisers are referred to herein as the Investment Advisers. The Board, assisted by the advice of fund counsel and Independent Trustees' counsel, requests and considers a broad range of information relevant to the renewal of the Advisory Contracts throughout the year.
The Board meets regularly and, at each of its meetings, covers an extensive agenda of topics and materials and considers factors that are relevant to its annual consideration of the renewal of the fund's Advisory Contracts, including the services and support provided to the fund and its shareholders. The Board has established various standing committees (Committees), each composed of and chaired by Independent Trustees with varying backgrounds, to which the Board has assigned specific subject matter responsibilities in order to enhance effective decision-making by the Board. The Board, acting directly and through its Committees, requests and receives information concerning the annual consideration of the renewal of the fund's Advisory Contracts. The Board also meets as needed to review matters specifically related to the Board's annual consideration of the renewal of the Advisory Contracts. Members of the Board may also meet with trustees of other Fidelity funds through joint ad hoc committees to discuss certain matters relevant to all of the Fidelity funds.
At its January 2019 meeting, the Board unanimously determined to renew the fund's Advisory Contracts. In reaching its determination, the Board considered all factors it believed relevant, including (i) the nature, extent, and quality of the services to be provided to the fund and its shareholders (including the investment performance of the fund); (ii) the competitiveness of the fund's management fee and total expense ratio relative to peer funds; (iii) the total costs of the services to be provided by and the profits to be realized by Fidelity from its relationships with the fund; and (iv) the extent to which, if any, economies of scale exist and would be realized as the fund grows, and whether any economies of scale are appropriately shared with fund shareholders.
In considering whether to renew the Advisory Contracts for the fund, the Board reached a determination, with the assistance of fund counsel and Independent Trustees' counsel and through the exercise of its business judgment, that the renewal of the Advisory Contracts was in the best interests of the fund and its shareholders and that the compensation payable under the Advisory Contracts was fair and reasonable. The Board's decision to renew the Advisory Contracts was not based on any single factor, but rather was based on a comprehensive consideration of all the information provided to the Board at its meetings throughout the year. The Board, in reaching its determination to renew the Advisory Contracts, was aware that shareholders of the fund have a broad range of investment choices available to them, including a wide choice among funds offered by Fidelity's competitors, and that the fund's shareholders, who have the opportunity to review and weigh the disclosure provided by the fund in its prospectus and other public disclosures, have chosen to invest in this fund, which is part of the Fidelity family of funds.
Nature, Extent, and Quality of Services Provided. The Board considered Fidelity's staffing as it relates to the fund, including the backgrounds of investment personnel of Fidelity, and also considered the fund's investment objective, strategies, and related investment philosophy. The Independent Trustees also had discussions with senior management of Fidelity's investment operations and investment groups. The Board considered the structure of the investment personnel compensation program and whether this structure provides appropriate incentives to act in the best interests of the fund. Additionally, the Board considered the portfolio managers' investments, if any, in the funds that they manage.
Resources Dedicated to Investment Management and Support Services. The Board and the Fund Oversight and Research Committees reviewed the general qualifications and capabilities of Fidelity's investment staff, including its size, education, experience, and resources, as well as Fidelity's approach to recruiting, training, managing, and compensating investment personnel. The Board noted that Fidelity has continued to increase the resources devoted to non-U.S. offices, including expansion of Fidelity's global investment organization. The Board also noted that Fidelity's analysts have extensive resources, tools and capabilities that allow them to conduct sophisticated quantitative and fundamental analysis, as well as credit analysis of issuers, counterparties and guarantors. Further, the Board considered that Fidelity's investment professionals have sufficient access to global information and data so as to provide competitive investment results over time, and that those professionals also have access to sophisticated tools that permit them to assess portfolio construction and risk and performance attribution characteristics continuously, as well as to transmit new information and research conclusions rapidly around the world. Additionally, in its deliberations, the Board considered Fidelity's trading, risk management, compliance, and technology and operations capabilities and resources, which are integral parts of the investment management process.
Shareholder and Administrative Services. The Board considered (i) the nature, extent, quality, and cost of advisory, administrative, and shareholder services performed by the Investment Advisers and their affiliates under the Advisory Contracts and under separate agreements covering transfer agency, pricing and bookkeeping, and securities lending services for the fund; (ii) the nature and extent of the supervision of third party service providers, principally custodians, subcustodians, and pricing vendors; and (iii) the resources devoted to, and the record of compliance with, the fund's compliance policies and procedures. The Board also reviewed the allocation of fund brokerage, including allocations to brokers affiliated with the Investment Advisers, the use of brokerage commissions to pay fund expenses, and the use of "soft" commission dollars to pay for research services.
The Board noted that the growth of fund assets over time across the complex allows Fidelity to reinvest in the development of services designed to enhance the value and convenience of the Fidelity funds as investment vehicles. These services include 24-hour access to account information and market information through telephone representatives and over the Internet, investor education materials and asset allocation tools, and the expanded availability of Fidelity Investor Centers.
The Board noted that it and the boards of certain other Fidelity funds had formed an ad hoc Committee on Transfer Agency Fees to review the variety of transfer agency fee structures throughout the industry and Fidelity's competitive positioning with respect to industry participants.
Investment in a Large Fund Family. The Board considered the benefits to shareholders of investing in a Fidelity fund, including the benefits of investing in a fund that is part of a large family of funds offering a variety of investment disciplines and providing a large variety of mutual fund investor services. The Board noted that Fidelity had taken, or had made recommendations that resulted in the Fidelity funds taking, a number of actions over the previous year that benefited particular funds, including: (i) continuing to dedicate additional resources to Fidelity's investment research process, which includes meetings with management of issuers of securities in which the funds invest, and to the support of the senior management team that oversees asset management; (ii) continuing efforts to enhance Fidelity's global research capabilities; (iii) launching new funds and making other enhancements to meet client needs; (iv) launching new share classes of existing funds; (v) eliminating purchase minimums and broadening eligibility requirements for certain funds and share classes; (vi) reducing management fees and total expenses for certain growth equity funds and index funds; (vii) lowering expense caps for certain existing funds and classes, and converting certain voluntary expense caps to contractual caps, to reduce expenses borne by shareholders; (viii) eliminating short-term redemption fees for funds that had such fees; (ix) rationalizing product lines and gaining increased efficiencies from fund mergers and share class consolidations; (x) continuing to develop, acquire and implement systems and technology to improve services to the funds and shareholders, strengthen information security, and increase efficiency; and (xi) continuing to implement enhancements to further strengthen Fidelity's product line to increase investors' probability of success in achieving their investment goals, including retirement income goals.
Investment Performance. The Board considered whether the fund has operated in accordance with its investment objective, as well as its record of compliance with its investment restrictions and its performance history. The fund had a portfolio manager change in November 2017. The Board will continue to monitor closely the fund's performance, taking into account the portfolio manager change.
The Board took into account discussions that occur at Board meetings throughout the year with representatives of the Investment Advisers about fund investment performance. In this regard the Board noted that as part of regularly scheduled fund reviews and other reports to the Board on fund performance, the Board considers annualized return information for the fund for different time periods, measured against an appropriate securities market index ("benchmark index"). In its evaluation of fund investment performance, the Board gave particular attention to information indicating changes in performance of certain Fidelity funds for specific time periods and discussed with the Investment Advisers the reasons for any overperformance or underperformance.
In addition to reviewing absolute and relative fund performance, the Independent Trustees periodically consider the appropriateness of fund performance metrics in evaluating the results achieved. In general, the Independent Trustees believe that fund performance should be evaluated based on net performance (after fees and expenses) of both the highest performing and lowest performing fund share classes, where applicable, compared to appropriate benchmark indices, over appropriate time periods that may include full market cycles, taking into account relevant factors including the following: general market conditions; issuer-specific information; and fund cash flows and other factors.
The Independent Trustees recognize that shareholders evaluate performance on a net basis over their own holding periods, for which one-, three-, and five-year periods are often used as a proxy. For this reason, the performance information reviewed by the Board also included net cumulative total return information for the fund and an appropriate benchmark index for the most recent one-, three-, and five-year periods ended June 30, 2018, as shown below.
Consumer Staples Portfolio
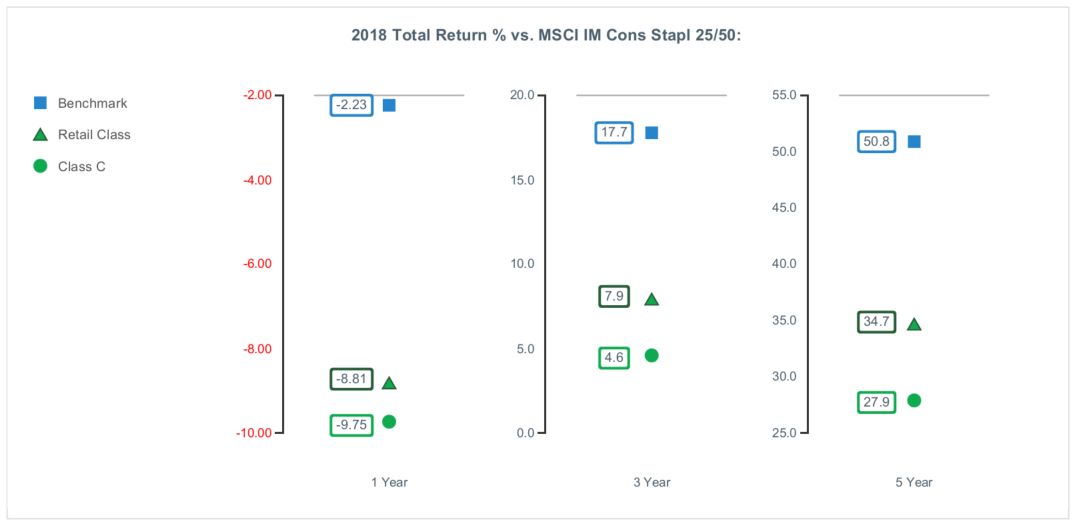
The Board considered the fund's underperformance for different time periods based on the June 30, 2018 data presented above and based on earlier periods ended prior to June 30, 2018. The Board's discussions with SelectCo regarding underperformance cover topics including, but not limited to: the longer-term track record of a fund's portfolio manager(s); broader trends in the market that may adversely impact a fund's performance; attribution reports on contributors to the fund's underperformance; and the applicable portfolio manager's explanation of his or her underperformance. The Board engages with SelectCo on steps that might be taken to address a fund's underperformance.
Based on its review, the Board concluded that the nature, extent, and quality of services provided to the fund under the Advisory Contracts should continue to benefit the shareholders of the fund.
Competitiveness of Management Fee and Total Expense Ratio. The Board considered the fund's management fee and total expense ratio compared to "mapped groups" of competitive funds and classes created for the purpose of facilitating the Trustees' competitive analysis of management fees and total expenses. Fidelity creates "mapped groups" by combining similar Lipper investment objective categories that have comparable investment mandates. For this purpose, all sector focused equity funds are grouped in the same mapped group. Combining Lipper investment objective categories aids the Board's management fee and total expense ratio comparisons by broadening the competitive group used for comparison.
Management Fee. The Board considered two proprietary management fee comparisons for the 12-month periods ended June 30 shown in basis points (BP) in the chart below. The group of Lipper funds used by the Board for management fee comparisons is referred to below as the "Total Mapped Group." The Total Mapped Group comparison focuses on a fund's standing in terms of gross management fees before expense reimbursements or caps relative to the total universe of funds with comparable investment mandates (i.e., sector equities), regardless of whether their management fee structures also are comparable. Funds with comparable management fee structures have similar management fee contractual arrangements (
e.g., flat rate charged for advisory services, all-inclusive fee rate,
etc.). "TMG %" represents the percentage of funds in the Total Mapped Group that had management fees that were lower than the fund's. For example, a hypothetical TMG % of 20% would mean that 80% of the funds in the Total Mapped Group had higher, and 20% had lower, management fees than the fund. The fund's actual TMG %s and the number of funds in the Total Mapped Group are in the chart below. The "Asset-Size Peer Group" (ASPG) comparison focuses on a fund's standing relative to a subset of non-Fidelity funds within the Total Mapped Group that are similar in size and management fee structure. For example, if a fund is in the first quartile of the ASPG, the fund's management fee ranks in the least expensive or lowest 25% of funds in the ASPG. The ASPG represents at least 15% of the funds in the Total Mapped Group with comparable asset size and management fee structures, subject to a minimum of 50 funds (or all funds in the Total Mapped Group if fewer than 50). Additional information, such as the ASPG quartile in which the fund's management fee rate ranked, is also included in the chart and was considered by the Board.
Consumer Staples Portfolio
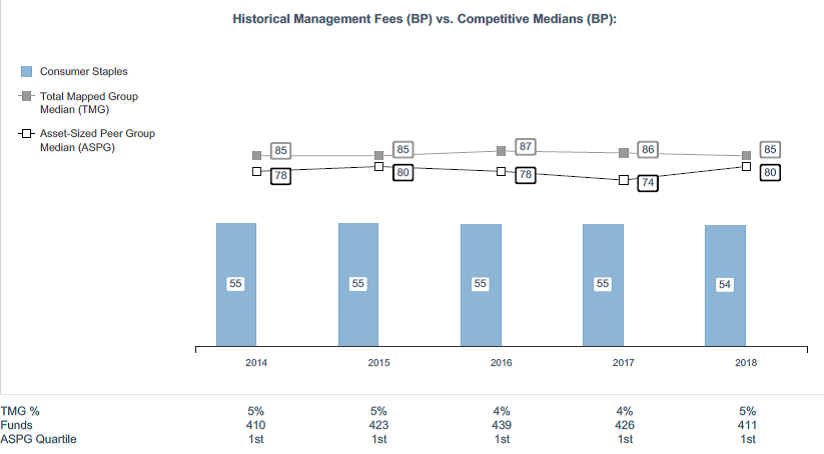
The Board noted that the fund's management fee rate ranked below the median of its Total Mapped Group and below the median of its ASPG for the 12-month period ended June 30, 2018.
The Board noted that it and the boards of other Fidelity funds formed an ad hoc Committee on Group Fee, which meets periodically, to conduct an in-depth review of the "group fee" component of the management fee of funds with such management fee structures. The Committee's focus included the mechanics of the group fee, the competitive landscape of group fee structures, Fidelity funds with no group fee component and investment products not included in group fee assets. The Board also considered that, for funds subject to the group fee, FMR agreed to voluntarily waive fees over a specified period of time in amounts designed to account for assets converted from certain funds to certain collective investment trusts.
Based on its review, the Board concluded that the fund's management fee is fair and reasonable in light of the services that the fund receives and the other factors considered.
Total Expense Ratio. In its review of each class's total expense ratio, the Board considered the fund's management fee rate as well as other fund or class expenses, as applicable, such as transfer agent fees, pricing and bookkeeping fees, fund-paid 12b-1 fees, and custodial, legal, and audit fees. The Board also noted that Fidelity may agree to waive fees and expenses from time to time, and the extent to which, if any, it has done so for the fund. As part of its review, the Board also considered the current and historical total expense ratios of each class of the fund compared to competitive fund median expenses. Each class of the fund is compared to those funds and classes in the Total Mapped Group (used by the Board for management fee comparisons) that have a similar sales load structure.
The Board noted that the total expense ratio of each class ranked below the competitive median for the 12-month period ended June 30, 2018.
Fees Charged to Other Fidelity Clients. The Board also considered Fidelity fee structures and other information with respect to clients of Fidelity, such as other funds advised or subadvised by Fidelity, pension plan clients, and other institutional clients with similar mandates. The Board noted that a joint ad hoc committee created by it and the boards of other Fidelity funds periodically reviews and compares Fidelity's institutional investment advisory business with its business of providing services to the Fidelity funds and also noted the most recent findings of the committee. The Board noted that the committee's review included a consideration of the differences in services provided, fees charged, and costs incurred, as well as competition in the markets serving the different categories of clients.
Based on its review of total expense ratios and fees charged to other Fidelity clients, the Board concluded that the total expense ratio of each class of the fund was reasonable in light of the services that the fund and its shareholders receive and the other factors considered.
Costs of the Services and Profitability. The Board considered the revenues earned and the expenses incurred by Fidelity in conducting the business of developing, marketing, distributing, managing, administering and servicing the fund and servicing the fund's shareholders. The Board also considered the level of Fidelity's profits in respect of all the Fidelity funds.
On an annual basis, Fidelity presents to the Board information about the profitability of its relationships with the fund. Fidelity calculates profitability information for each fund, as well as aggregate profitability information for groups of Fidelity funds and all Fidelity funds, using a series of detailed revenue and cost allocation methodologies which originate with the books and records of Fidelity on which Fidelity's audited financial statements are based. The Audit Committee of the Board reviews any significant changes from the prior year's methodologies.
PricewaterhouseCoopers LLP (PwC), auditor to Fidelity and certain Fidelity funds, has been engaged annually by the Board as part of the Board's assessment of Fidelity's profitability analysis. PwC's engagement includes the review and assessment of the methodologies used by Fidelity in determining the revenues and expenses attributable to Fidelity's mutual fund business, and completion of agreed-upon procedures in respect of the mathematical accuracy of the fund profitability information and its conformity to established allocation methodologies. After considering PwC's reports issued under the engagement and information provided by Fidelity, the Board concluded that while other allocation methods may also be reasonable, Fidelity's profitability methodologies are reasonable in all material respects.
The Board also reviewed Fidelity's non-fund businesses and potential indirect benefits such businesses may have received as a result of their association with Fidelity's mutual fund business (i.e., fall-out benefits) as well as cases where Fidelity's affiliates may benefit from the fund's business. The Board noted that changes to fall-out benefits year-over-year reflect business developments at Fidelity's various businesses.
The Board considered the costs of the services provided by and the profits realized by Fidelity in connection with the operation of the fund and was satisfied that the profitability was not excessive.
Economies of Scale. The Board considered whether there have been economies of scale in respect of the management of the Fidelity funds, whether the Fidelity funds (including the fund) have appropriately benefited from any such economies of scale, and whether there is potential for realization of any further economies of scale. The Board considered the extent to which the fund will benefit from economies of scale as assets grow through increased services to the fund, through waivers or reimbursements, or through fee or expense ratio reductions. The Board also noted that a committee (the Economies of Scale Committee) created by it and the boards of other Fidelity funds periodically analyzes whether Fidelity attains economies of scale in respect of the management and servicing of the Fidelity funds, whether the Fidelity funds have appropriately benefited from such economies of scale, and whether there is potential for realization of any further economies of scale.
The Board recognized that the fund's management contract incorporates a "group fee" structure, which provides for lower group fee rates as total group assets increase, and for higher group fee rates as total group assets decrease (with "group assets" defined to include fund assets under SelectCo's management plus assets under FMR's management). SelectCo calculates the group fee rates based on a tiered asset "breakpoint" schedule that varies based on asset class. The Board considered that the group fee is designed to deliver the benefits of economies of scale to fund shareholders when total group assets increase, even if assets of any particular fund are unchanged or have declined, because some portion of Fidelity's costs are attributable to services provided to all Fidelity funds, and all funds benefit if those costs can be allocated among more assets. The Board concluded that, given the group fee structure, fund shareholders will benefit from lower management fees as group assets increase at the fund complex level, regardless of whether Fidelity achieves any such economies of scale.
The Board concluded, taking into account the analysis of the Economies of Scale Committee, that economies of scale, if any, are being appropriately shared between fund shareholders and Fidelity.
Additional Information Requested by the Board. In order to develop fully the factual basis for consideration of the Fidelity funds' advisory contracts, the Board requested and received additional information on certain topics, including: (i) fund performance trends, in particular the underperformance of certain funds, and Fidelity's long-term strategies for certain funds; (ii) Fidelity's fund profitability methodology, profitability trends for certain funds, and the impact of certain factors on fund profitability results; (iii) metrics for evaluating index fund and ETF performance and information about ETF trading characteristics; (iv) the methodology with respect to the evaluation of competitive fund data and peer group classifications and fee comparisons; (v) the expense structures for different funds and classes; (vi) information regarding other accounts managed by Fidelity, including collective investment trusts; and (vii) Fidelity's philosophies and strategies for evaluating funds and classes with lower or declining asset levels.
Based on its evaluation of all of the conclusions noted above, and after considering all factors it believed relevant, the Board concluded that the advisory fee arrangements are fair and reasonable, and that the fund's Advisory Contracts should be renewed.
SELCS-ANN-0419
1.846042.112
Fidelity® Select Portfolios®
Utilities Sector Utilities Portfolio
Annual Report February 28, 2019 |
|
Beginning on January 1, 2021, as permitted by regulations adopted by the Securities and Exchange Commission, paper copies of a fund’s shareholder reports will no longer be sent by mail, unless you specifically request paper copies of the reports from the fund or from your financial intermediary, such as a financial advisor, broker-dealer or bank. Instead, the reports will be made available on a website, and you will be notified by mail each time a report is posted and provided with a website link to access the report.
If you already elected to receive shareholder reports electronically, you will not be affected by this change and you need not take any action. You may elect to receive shareholder reports and other communications from a fund electronically, by contacting your financial intermediary. For Fidelity customers, visit Fidelity's web site or call Fidelity using the contact information listed below.
You may elect to receive all future reports in paper free of charge. If you wish to continue receiving paper copies of your shareholder reports, you may contact your financial intermediary or, if you are a Fidelity customer, visit Fidelity’s website, or call Fidelity at the applicable toll-free number listed below. Your election to receive reports in paper will apply to all funds held with the fund complex/your financial intermediary.
| Account Type | Website | Phone Number |
| Brokerage, Mutual Fund, or Annuity Contracts: | fidelity.com/mailpreferences | 1-800-343-3548 |
| Employer Provided Retirement Accounts: | netbenefits.fidelity.com/preferences (choose 'no' under Required Disclosures to continue to print) | 1-800-343-0860 |
| Advisor Sold Accounts Serviced Through Your Financial Intermediary: | Contact Your Financial Intermediary | Your Financial Intermediary's phone number |
| Advisor Sold Accounts Serviced by Fidelity: | institutional.fidelity.com | 1-877-208-0098 |
Contents
To view a fund's proxy voting guidelines and proxy voting record for the 12-month period ended June 30, visit http://www.fidelity.com/proxyvotingresults or visit the Securities and Exchange Commission's (SEC) web site at http://www.sec.gov.
You may also call 1-800-544-8544 to request a free copy of the proxy voting guidelines.
Standard & Poor's, S&P and S&P 500 are registered service marks of The McGraw-Hill Companies, Inc. and have been licensed for use by Fidelity Distributors Corporation.
Other third-party marks appearing herein are the property of their respective owners.
All other marks appearing herein are registered or unregistered trademarks or service marks of FMR LLC or an affiliated company. © 2019 FMR LLC. All rights reserved.
This report and the financial statements contained herein are submitted for the general information of the shareholders of the Fund. This report is not authorized for distribution to prospective investors in the Fund unless preceded or accompanied by an effective prospectus.
A fund files its complete schedule of portfolio holdings with the SEC for the first and third quarters of each fiscal year on Form N-Q. Forms N-Q are available on the SEC’s web site at http://www.sec.gov. A fund's Forms N-Q may be reviewed and copied at the SEC’s Public Reference Room in Washington, DC. Information regarding the operation of the SEC's Public Reference Room may be obtained by calling 1-800-SEC-0330.
For a complete list of a fund's portfolio holdings, view the most recent holdings listing, semiannual report, or annual report on Fidelity's web site at http://www.fidelity.com, http://www.institutional.fidelity.com, or http://www.401k.com, as applicable.
NOT FDIC INSURED •MAY LOSE VALUE •NO BANK GUARANTEE
Neither the Fund nor Fidelity Distributors Corporation is a bank.
Performance: The Bottom Line
Average annual total return reflects the change in the value of an investment, assuming reinvestment of distributions from dividend income and capital gains (the profits earned upon the sale of securities that have grown in value, if any) and assuming a constant rate of performance each year. The hypothetical investment and the average annual total returns do not reflect the deduction of taxes that a shareholder would pay on fund distributions or the redemption of fund shares. During periods of reimbursement by Fidelity, a fund’s total return will be greater than it would be had the reimbursement not occurred. How a fund did yesterday is no guarantee of how it will do tomorrow.
Average Annual Total Returns
| For the periods ended February 28, 2019 | Past 1 year | Past 5 years | Past 10 years |
| Utilities Portfolio | 20.17% | 9.71% | 13.66% |
$10,000 Over 10 Years
Let's say hypothetically that $10,000 was invested in Utilities Portfolio on February 28, 2009.
The chart shows how the value of your investment would have changed, and also shows how the S&P 500® Index performed over the same period.
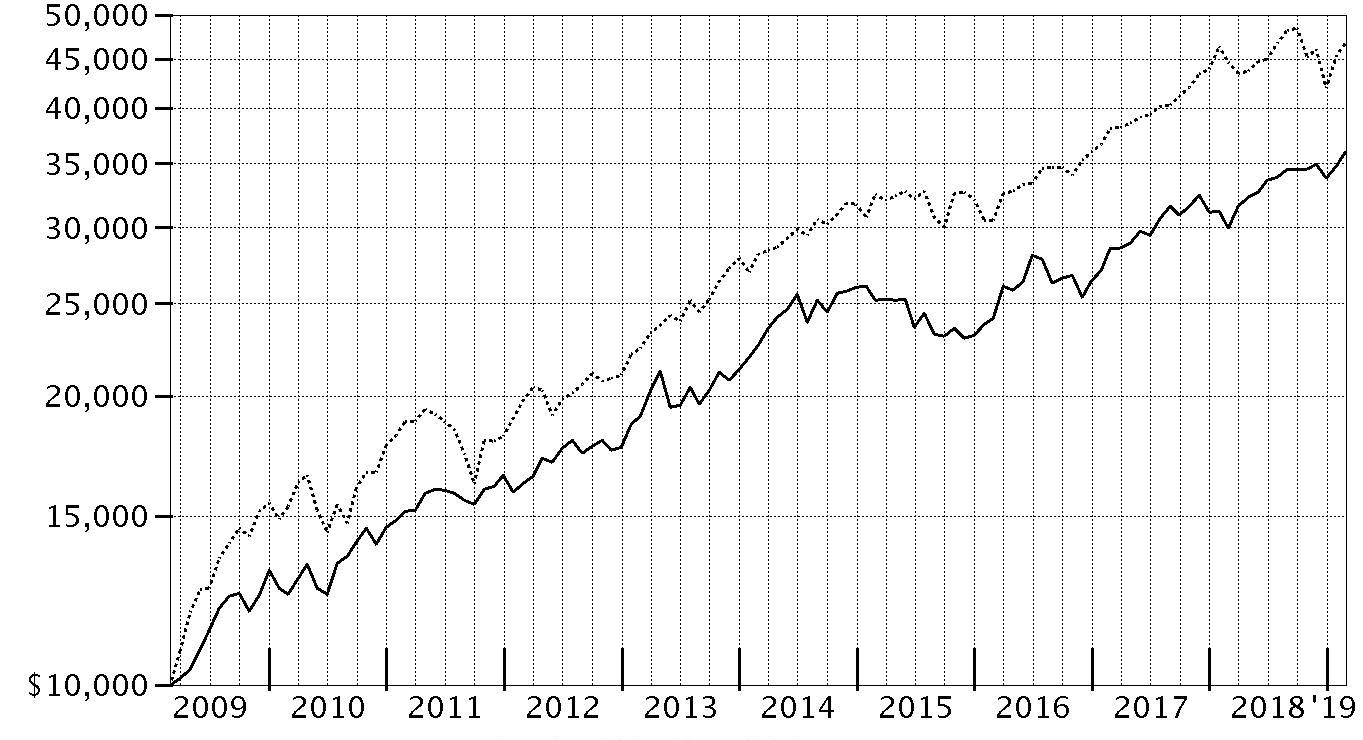
| Period Ending Values |
| $35,984 | Utilities Portfolio |
| $46,739 | S&P 500® Index |
Management's Discussion of Fund Performance
Market Recap: The S&P 500
® index gained 4.68% for the 12 months ending February 28, 2019, as the U.S. equity bellwether began the new year on a high note after enduring a final quarter of 2018 in which resurgent volatility upset the aging bull market. In October, rising U.S. Treasury yields and concern about peaking corporate earnings growth sent many investors fleeing from risk assets as they were still dealing with lingering uncertainty related to global trade and the U.S. Federal Reserve picking up the pace of interest rate hikes. The index returned -6.84% in October, at the time its largest monthly drop in seven years. But conditions worsened through Christmas, as jitters about the economy and another hike in rates led to a spike in market volatility and a -9.03% result for December. Sharply reversing course to begin 2019, the S&P 500
® gained 11.48% year-to-date, its strongest two-month opening since 1991, amid upbeat company earnings/outlooks and signs the Fed may pause on rates. For the full period, some economically sensitive sectors fared worst, with financials (-6%) and materials (-6%) both losing ground. Energy gained 1%, while communication services and industrials each rose roughly 2%. In contrast, the defensive utilities (+20%), real estate (+20%) and health care (+11%) sectors led the way, while consumer staples finished near the index. Information technology and consumer discretionary were rattled in the late-2018 downturn, but earlier strength contributed to advances of 9% and roughly 7%, respectively.
Comments from Portfolio Manager Douglas Simmons: For the year ending February 28, 2019, the fund gained 20.17%, trailing the 21.18% result of the sector benchmark, the MSCI U.S. IMI Utilities 25/50 Index, but easily topping the S&P 500
®. Utilities – often viewed by investors as a defensive sector – pulled ahead of the broader U.S. equity market the past 12 months, amid heightened market volatility attributed to rising policy interest rates, concern about the slowing global economy and trade conflict between the U.S. and China. Versus the MSCI index, stock picking in electric utilities detracted notably from fund performance. The fund's stake in California-based PG&E, which filed for bankruptcy in mid-January after being found liable for the state's 2017 "Camp Fire" wildfire, hurt more than any other individual fund position versus the benchmark. The fund's non-benchmark position in cable giant Comcast detracted on a relative basis as well, partly due to uncertainty surrounding the company's acquisitions of British cable provider Sky and television assets from Twenty-First Century Fox. I sold the fund's Comcast stake by period end. Conversely, a large overweighting in independent power producers (IPPs) & energy traders added value. On an individual basis, positions in NRG Energy, Vistra Energy and AES – all IPPs – contributed to the fund's relative result.
The views expressed above reflect those of the portfolio manager(s) only through the end of the period as stated on the cover of this report and do not necessarily represent the views of Fidelity or any other person in the Fidelity organization. Any such views are subject to change at any time based upon market or other conditions and Fidelity disclaims any responsibility to update such views. These views may not be relied on as investment advice and, because investment decisions for a Fidelity fund are based on numerous factors, may not be relied on as an indication of trading intent on behalf of any Fidelity fund.
Investment Summary (Unaudited)
Top Ten Stocks as of February 28, 2019
| | % of fund's net assets |
| Dominion Resources, Inc. | 11.7 |
| Sempra Energy | 8.4 |
| Southern Co. | 7.6 |
| Exelon Corp. | 7.3 |
| NextEra Energy, Inc. | 6.3 |
| FirstEnergy Corp. | 5.9 |
| Entergy Corp. | 4.9 |
| Public Service Enterprise Group, Inc. | 4.7 |
| Edison International | 4.2 |
| PPL Corp. | 4.1 |
| | 65.1 |
Top Industries (% of fund's net assets)
| As of February 28, 2019 |
| | Electric Utilities | 53.1% |
| | Multi-Utilities | 29.9% |
| | Independent Power and Renewable Electricity Producers | 4.6% |
| | Gas Utilities | 4.4% |
| | Oil, Gas & Consumable Fuels | 2.2% |
| | All Others* | 5.8% |

* Includes short-term investments and net other assets (liabilities).
Schedule of Investments February 28, 2019
Showing Percentage of Net Assets
| Common Stocks - 98.3% | | | |
| | | Shares | Value |
| Diversified Telecommunication Services - 2.2% | | | |
| Integrated Telecommunication Services - 2.2% | | | |
| AT&T, Inc. | | 724,800 | $22,555,776 |
| Electric Utilities - 53.1% | | | |
| Electric Utilities - 53.1% | | | |
| American Electric Power Co., Inc. | | 342,400 | 27,785,760 |
| Edison International | | 725,200 | 43,432,228 |
| Entergy Corp. | | 548,086 | 51,152,866 |
| Evergy, Inc. | | 581,266 | 32,498,582 |
| Eversource Energy | | 314,906 | 21,983,588 |
| Exelon Corp. | | 1,564,192 | 76,004,089 |
| FirstEnergy Corp. | | 1,501,495 | 61,185,921 |
| NextEra Energy, Inc. | | 347,870 | 65,302,156 |
| PG&E Corp. (a) | | 688,460 | 11,724,474 |
| PPL Corp. | | 1,328,468 | 42,736,816 |
| Southern Co. | | 1,584,100 | 78,713,929 |
| Vistra Energy Corp. | | 1,521,207 | 39,612,230 |
| | | | 552,132,639 |
| Gas Utilities - 4.4% | | | |
| Gas Utilities - 4.4% | | | |
| Atmos Energy Corp. | | 310,048 | 30,648,245 |
| Chesapeake Utilities Corp. | | 21,823 | 1,964,288 |
| South Jersey Industries, Inc. | | 449,586 | 13,015,515 |
| | | | 45,628,048 |
| Independent Power and Renewable Electricity Producers - 4.6% | | | |
| Independent Power Producers & Energy Traders - 2.6% | | | |
| NRG Energy, Inc. | | 483,102 | 20,135,691 |
| The AES Corp. | | 395,126 | 6,808,021 |
| | | | 26,943,712 |
| Renewable Electricity - 2.0% | | | |
| Atlantica Yield PLC | | 211,217 | 4,215,891 |
| NextEra Energy Partners LP | | 388,801 | 16,792,315 |
| | | | 21,008,206 |
|
| TOTAL INDEPENDENT POWER AND RENEWABLE ELECTRICITY PRODUCERS | | | 47,951,918 |
|
| Media - 1.0% | | | |
| Cable & Satellite - 1.0% | | | |
| Altice U.S.A., Inc. Class A | | 478,500 | 10,436,085 |
| Multi-Utilities - 29.9% | | | |
| Multi-Utilities - 29.9% | | | |
| Avangrid, Inc. | | 435,173 | 21,040,615 |
| CenterPoint Energy, Inc. | | 888,300 | 26,773,362 |
| Dominion Resources, Inc. | | 1,646,463 | 121,986,444 |
| Public Service Enterprise Group, Inc. | | 832,870 | 48,981,085 |
| RWE AG | | 198,700 | 4,850,203 |
| Sempra Energy | | 726,818 | 87,537,960 |
| | | | 311,169,669 |
| Oil, Gas & Consumable Fuels - 2.2% | | | |
| Oil & Gas Storage & Transport - 2.2% | | | |
| Cheniere Energy, Inc. (a) | | 275,901 | 17,781,819 |
| The Williams Companies, Inc. | | 203,800 | 5,439,422 |
| | | | 23,221,241 |
| Semiconductors & Semiconductor Equipment - 0.3% | | | |
| Semiconductors - 0.3% | | | |
| First Solar, Inc. (a) | | 59,310 | 3,116,741 |
| Water Utilities - 0.6% | | | |
| Water Utilities - 0.6% | | | |
| SJW Corp. | | 106,102 | 6,490,259 |
| TOTAL COMMON STOCKS | | | |
| (Cost $852,015,742) | | | 1,022,702,376 |
|
| Money Market Funds - 1.3% | | | |
| Fidelity Cash Central Fund, 2.44% (b) | | | |
| (Cost $13,769,342) | | 13,766,588 | 13,769,342 |
| TOTAL INVESTMENT IN SECURITIES - 99.6% | | | |
| (Cost $865,785,084) | | | 1,036,471,718 |
| NET OTHER ASSETS (LIABILITIES) - 0.4% | | | 4,291,376 |
| NET ASSETS - 100% | | | $1,040,763,094 |
Legend
(a) Non-income producing
(b) Affiliated fund that is generally available only to investment companies and other accounts managed by Fidelity Investments. The rate quoted is the annualized seven-day yield of the fund at period end. A complete unaudited listing of the fund's holdings as of its most recent quarter end is available upon request. In addition, each Fidelity Central Fund's financial statements, which are not covered by the Fund's Report of Independent Registered Public Accounting Firm, are available on the SEC's website or upon request.
Affiliated Central Funds
Information regarding fiscal year to date income earned by the Fund from investments in Fidelity Central Funds is as follows:
| Fund | Income earned |
| Fidelity Cash Central Fund | $329,868 |
| Fidelity Securities Lending Cash Central Fund | 4,156 |
| Total | $334,024 |
Amounts in the income column in the above table include any capital gain distributions from underlying funds, which are presented in the corresponding line-item in the Statement of Operations, if applicable.
Investment Valuation
All investments are categorized as Level 1 under the Fair Value Hierarchy. The inputs or methodology used for valuing securities may not be an indication of the risk associated with investing in those securities. For more information on valuation inputs please refer to the Investment Valuation section in the accompanying Notes to Financial Statements.
See accompanying notes which are an integral part of the financial statements.
Financial Statements
Statement of Assets and Liabilities
| | | February 28, 2019 |
| Assets | | |
Investment in securities, at value — See accompanying schedule:
Unaffiliated issuers (cost $852,015,742) | $1,022,702,376 | |
| Fidelity Central Funds (cost $13,769,342) | 13,769,342 | |
| Total Investment in Securities (cost $865,785,084) | | $1,036,471,718 |
| Receivable for investments sold | | 2,515,223 |
| Receivable for fund shares sold | | 1,911,276 |
| Dividends receivable | | 5,131,170 |
| Distributions receivable from Fidelity Central Funds | | 33,664 |
| Prepaid expenses | | 5,977 |
| Other receivables | | 31,379 |
| Total assets | | 1,046,100,407 |
| Liabilities | | |
| Payable for investments purchased | $2,723,784 | |
| Payable for fund shares redeemed | 1,946,232 | |
| Accrued management fee | 456,608 | |
| Other affiliated payables | 175,819 | |
| Other payables and accrued expenses | 34,870 | |
| Total liabilities | | 5,337,313 |
| Net Assets | | $1,040,763,094 |
| Net Assets consist of: | | |
| Paid in capital | | $899,955,289 |
| Total distributable earnings (loss) | | 140,807,805 |
| Net Assets, for 12,198,716 shares outstanding | | $1,040,763,094 |
| Net Asset Value, offering price and redemption price per share ($1,040,763,094 ÷ 12,198,716 shares) | | $85.32 |
See accompanying notes which are an integral part of the financial statements.
Statement of Operations
| | | Year ended February 28, 2019 |
| Investment Income | | |
| Dividends | | $25,389,942 |
| Income from Fidelity Central Funds | | 334,024 |
| Total income | | 25,723,966 |
| Expenses | | |
| Management fee | $4,354,527 | |
| Transfer agent fees | 1,450,696 | |
| Accounting and security lending fees | 279,016 | |
| Custodian fees and expenses | 9,547 | |
| Independent trustees' fees and expenses | 4,321 | |
| Registration fees | 113,722 | |
| Audit | 44,234 | |
| Legal | 4,546 | |
| Interest | 671 | |
| Miscellaneous | 6,010 | |
| Total expenses before reductions | 6,267,290 | |
| Expense reductions | (188,404) | |
| Total expenses after reductions | | 6,078,886 |
| Net investment income (loss) | | 19,645,080 |
| Realized and Unrealized Gain (Loss) | | |
| Net realized gain (loss) on: | | |
| Investment securities: | | |
| Unaffiliated issuers | 39,201,427 | |
| Redemptions in-kind with affiliated entities | 26,295,315 | |
| Fidelity Central Funds | 1,425 | |
| Foreign currency transactions | 6,091 | |
| Total net realized gain (loss) | | 65,504,258 |
| Change in net unrealized appreciation (depreciation) on investment securities | | 53,870,262 |
| Net gain (loss) | | 119,374,520 |
| Net increase (decrease) in net assets resulting from operations | | $139,019,600 |
See accompanying notes which are an integral part of the financial statements.
Statement of Changes in Net Assets
| | Year ended February 28, 2019 | Year ended February 28, 2018 |
| Increase (Decrease) in Net Assets | | |
| Operations | | |
| Net investment income (loss) | $19,645,080 | $14,714,702 |
| Net realized gain (loss) | 65,504,258 | 36,453,162 |
| Change in net unrealized appreciation (depreciation) | 53,870,262 | (21,215,157) |
| Net increase (decrease) in net assets resulting from operations | 139,019,600 | 29,952,707 |
| Distributions to shareholders | (73,577,455) | – |
| Distributions to shareholders from net investment income | – | (12,115,593) |
| Distributions to shareholders from net realized gain | – | (29,852,182) |
| Total distributions | (73,577,455) | (41,967,775) |
| Share transactions | | |
| Proceeds from sales of shares | 638,656,367 | 273,622,475 |
| Reinvestment of distributions | 68,851,242 | 39,960,296 |
| Cost of shares redeemed | (449,165,874) | (280,726,603) |
| Net increase (decrease) in net assets resulting from share transactions | 258,341,735 | 32,856,168 |
| Redemption fees | – | 79 |
| Total increase (decrease) in net assets | 323,783,880 | 20,841,179 |
| Net Assets | | |
| Beginning of period | 716,979,214 | 696,138,035 |
| End of period | $1,040,763,094 | $716,979,214 |
| Other Information | | |
| Undistributed net investment income end of period | | $1,233,166 |
| Shares | | |
| Sold | 7,498,067 | 3,316,107 |
| Issued in reinvestment of distributions | 812,301 | 481,973 |
| Redeemed | (5,452,798) | (3,492,131) |
| Net increase (decrease) | 2,857,570 | 305,949 |
See accompanying notes which are an integral part of the financial statements.
Financial Highlights
Utilities Portfolio
| | | | | | |
| Years ended February 28, | 2019 | 2018 | 2017 | 2016 A | 2015 |
| Selected Per–Share Data | | | | | |
| Net asset value, beginning of period | $76.75 | $77.05 | $66.88 | $72.85 | $70.64 |
| Income from Investment Operations | | | | | |
| Net investment income (loss)B | 2.06 | 1.62 | 1.52 | 1.39 | 1.41 |
| Net realized and unrealized gain (loss) | 13.35 | 2.56 | 10.44 | (4.49) | 6.40 |
| Total from investment operations | 15.41 | 4.18 | 11.96 | (3.10) | 7.81 |
| Distributions from net investment income | (1.37) | (1.29) | (1.77) | (1.60) | (1.20) |
| Distributions from net realized gain | (5.46) | (3.19) | (.02) | (1.27) | (4.42) |
| Total distributions | (6.84)C | (4.48) | (1.79) | (2.87) | (5.61)D |
| Redemption fees added to paid in capitalB | – | –E | –E | –E | .01 |
| Net asset value, end of period | $85.32 | $76.75 | $77.05 | $66.88 | $72.85 |
| Total ReturnF | 20.17% | 4.99% | 18.21% | (4.19)% | 11.22% |
| Ratios to Average Net AssetsG,H | | | | | |
| Expenses before reductions | .78% | .78% | .79% | .80% | .80% |
| Expenses net of fee waivers, if any | .78% | .78% | .79% | .79% | .80% |
| Expenses net of all reductions | .76% | .77% | .78% | .78% | .80% |
| Net investment income (loss) | 2.45% | 2.00% | 2.09% | 2.05% | 1.89% |
| Supplemental Data | | | | | |
| Net assets, end of period (000 omitted) | $1,040,763 | $716,979 | $696,138 | $808,235 | $988,426 |
| Portfolio turnover rateI | 97%J | 66%J | 70%J | 74% | 129%J |
A For the year ended February 29.
B Calculated based on average shares outstanding during the period.
C Total distributions of $6.84 per share is comprised of distributions from net investment income of $1.373 and distributions from net realized gain of $5.463 per share.
D Total distributions of $5.61 per share is comprised of distributions from net investment income of $1.199 and distributions from net realized gain of $4.415 per share.
E Amount represents less than $.005 per share.
F Total returns would have been lower if certain expenses had not been reduced during the applicable periods shown.
G Fees and expenses of any underlying Fidelity Central Funds are not included in the Fund's expense ratio. The Fund indirectly bears its proportionate share of the expenses of any underlying Fidelity Central Funds.
H Expense ratios reflect operating expenses of the Fund. Expenses before reductions do not reflect amounts reimbursed by the investment adviser or reductions from brokerage service arrangements or reductions from other expense offset arrangements and do not represent the amount paid by the Fund during periods when reimbursements or reductions occur. Expenses net of fee waivers reflect expenses after reimbursement by the investment adviser but prior to reductions from brokerage service arrangements or other expense offset arrangements. Expenses net of all reductions represent the net expenses paid by the Fund.
I Amount does not include the portfolio activity of any underlying Fidelity Central Funds.
J Portfolio turnover rate excludes securities received or delivered in-kind.
See accompanying notes which are an integral part of the financial statements.
Notes to Financial Statements
For the period ended February 28, 2019
1. Organization.
Utilities Portfolio (the Fund) is a non-diversified fund of Fidelity Select Portfolios (the Trust) and is authorized to issue an unlimited number of shares. Share transactions on the Statement of Changes in Net Assets may contain exchanges between affiliated funds. The Trust is registered under the Investment Company Act of 1940, as amended (the 1940 Act), as an open-end management investment company organized as a Massachusetts business trust. The Fund invests primarily in securities of companies whose principal business activities fall within specific industries.
2. Investments in Fidelity Central Funds.
The Fund invests in Fidelity Central Funds, which are open-end investment companies generally available only to other investment companies and accounts managed by the investment adviser and its affiliates. The Fund's Schedule of Investments lists each of the Fidelity Central Funds held as of period end, if any, as an investment of the Fund, but does not include the underlying holdings of each Fidelity Central Fund. As an Investing Fund, the Fund indirectly bears its proportionate share of the expenses of the underlying Fidelity Central Funds.
The Money Market Central Funds seek preservation of capital and current income and are managed by Fidelity Investments Money Management, Inc. (FIMM), an affiliate of the investment adviser. Annualized expenses of the Money Market Central Funds as of their most recent shareholder report date are less than .005%.
A complete unaudited list of holdings for each Fidelity Central Fund is available upon request or at the Securities and Exchange Commission (the SEC) website at www.sec.gov. In addition, the financial statements of the Fidelity Central Funds, which are not covered by the Fund's Report of Independent Registered Public Accounting Firm, are available on the SEC website or upon request.
3. Significant Accounting Policies.
The Fund is an investment company and applies the accounting and reporting guidance of the Financial Accounting Standards Board (FASB) Accounting Standards Codification Topic 946 Financial Services – Investments Companies. The financial statements have been prepared in conformity with accounting principles generally accepted in the United States of America (GAAP), which require management to make certain estimates and assumptions at the date of the financial statements. Actual results could differ from those estimates. Subsequent events, if any, through the date that the financial statements were issued have been evaluated in the preparation of the financial statements. The following summarizes the significant accounting policies of the Fund:
Investment Valuation. Investments are valued as of 4:00 p.m. Eastern time on the last calendar day of the period. The Board of Trustees (the Board) has delegated the day to day responsibility for the valuation of the Fund's investments to the Fair Value Committee (the Committee) established by the Fund's investment adviser. In accordance with valuation policies and procedures approved by the Board, the Fund attempts to obtain prices from one or more third party pricing vendors or brokers to value its investments. When current market prices, quotations or currency exchange rates are not readily available or reliable, investments will be fair valued in good faith by the Committee, in accordance with procedures adopted by the Board. Factors used in determining fair value vary by investment type and may include market or investment specific events. The frequency with which these procedures are used cannot be predicted and they may be utilized to a significant extent. The Committee oversees the Fund's valuation policies and procedures and reports to the Board on the Committee's activities and fair value determinations. The Board monitors the appropriateness of the procedures used in valuing the Fund's investments and ratifies the fair value determinations of the Committee.
The Fund categorizes the inputs to valuation techniques used to value its investments into a disclosure hierarchy consisting of three levels as shown below:
- Level 1 – quoted prices in active markets for identical investments
- Level 2 – other significant observable inputs (including quoted prices for similar investments, interest rates, prepayment speeds, etc.)
- Level 3– unobservable inputs (including the Fund's own assumptions based on the best information available)
Valuation techniques used to value the Fund's investments by major category are as follows:
Equity securities, including restricted securities, for which market quotations are readily available, are valued at the last reported sale price or official closing price as reported by a third party pricing vendor on the primary market or exchange on which they are traded and are categorized as Level 1 in the hierarchy. In the event there were no sales during the day or closing prices are not available, securities are valued at the last quoted bid price or may be valued using the last available price and are generally categorized as Level 2 in the hierarchy. For foreign equity securities, when market or security specific events arise, comparisons to the valuation of American Depositary Receipts (ADRs), futures contracts, Exchange-Traded Funds (ETFs) and certain indexes as well as quoted prices for similar securities may be used and would be categorized as Level 2 in the hierarchy. For equity securities, including restricted securities, where observable inputs are limited, assumptions about market activity and risk are used and these securities may be categorized as Level 3 in the hierarchy.
Investments in open-end mutual funds, including the Fidelity Central Funds, are valued at their closing net asset value (NAV) each business day and are categorized as Level 1 in the hierarchy.
Changes in valuation techniques may result in transfers in or out of an assigned level within the disclosure hierarchy.
Foreign Currency. The Fund may use foreign currency contracts to facilitate transactions in foreign-denominated securities. Gains and losses from these transactions may arise from changes in the value of the foreign currency or if the counterparties do not perform under the contracts' terms.
Foreign-denominated assets, including investment securities, and liabilities are translated into U.S. dollars at the exchange rates at period end. Purchases and sales of investment securities, income and dividends received and expenses denominated in foreign currencies are translated into U.S. dollars at the exchange rate in effect on the transaction date.
The effects of exchange rate fluctuations on investments are included with the net realized and unrealized gain (loss) on investment securities. Other foreign currency transactions resulting in realized and unrealized gain (loss) are disclosed separately.
Investment Transactions and Income. For financial reporting purposes, the Fund's investment holdings and NAV include trades executed through the end of the last business day of the period. The NAV per share for processing shareholder transactions is calculated as of the close of business of the New York Stock Exchange (NYSE), normally 4:00 p.m. Eastern time and includes trades executed through the end of the prior business day. Gains and losses on securities sold are determined on the basis of identified cost. Dividend income is recorded on the ex-dividend date, except for certain dividends from foreign securities where the ex-dividend date may have passed, which are recorded as soon as the Fund is informed of the ex-dividend date. Non-cash dividends included in dividend income, if any, are recorded at the fair market value of the securities received. Income and capital gain distributions from Fidelity Central Funds, if any, are recorded on the ex-dividend date. Certain distributions received by the Fund represent a return of capital or capital gain. The Fund determines the components of these distributions subsequent to the ex-dividend date, based upon receipt of tax filings or other correspondence relating to the underlying investment. These distributions are recorded as a reduction of cost of investments and/or as a realized gain. Investment income is recorded net of foreign taxes withheld where recovery of such taxes is uncertain.
Expenses. Expenses directly attributable to a fund are charged to that fund. Expenses attributable to more than one fund are allocated among the respective funds on the basis of relative net assets or other appropriate methods. Expense estimates are accrued in the period to which they relate and adjustments are made when actual amounts are known.
Income Tax Information and Distributions to Shareholders. Each year, the Fund intends to qualify as a regulated investment company under Subchapter M of the Internal Revenue Code, including distributing substantially all of its taxable income and realized gains. As a result, no provision for U.S. Federal income taxes is required. As of February 28, 2019, the Fund did not have any unrecognized tax benefits in the financial statements; nor is the Fund aware of any tax positions for which it is reasonably possible that the total amounts of unrecognized tax benefits will significantly change in the next twelve months. The Fund files a U.S. federal tax return, in addition to state and local tax returns as required. The Fund's federal income tax returns are subject to examination by the Internal Revenue Service (IRS) for a period of three fiscal years after they are filed. State and local tax returns may be subject to examination for an additional fiscal year depending on the jurisdiction. Foreign taxes are provided for based on the Fund's understanding of the tax rules and rates that exist in the foreign markets in which it invests.
Distributions are declared and recorded on the ex-dividend date. Income and capital gain distributions are determined in accordance with income tax regulations, which may differ from GAAP. In addition, the Fund claimed a portion of the payment made to redeeming shareholders as a distribution for income tax purposes.
Capital accounts within the financial statements are adjusted for permanent book-tax differences. These adjustments have no impact on net assets or the results of operations. Capital accounts are not adjusted for temporary book-tax differences which will reverse in a subsequent period. In addition, the Fund claimed a portion of the payment made to redeeming shareholders as a distribution for income tax purposes.
Book-tax differences are primarily due to foreign currency transactions, redemptions in kind, partnerships, losses deferred due to wash sales and excise tax regulations.
As of period end, the cost and unrealized appreciation (depreciation) in securities, and derivatives if applicable, for federal income tax purposes were as follows:
| Gross unrealized appreciation | $174,561,691 |
| Gross unrealized depreciation | (14,337,396) |
| Net unrealized appreciation (depreciation) | $160,224,295 |
| Tax Cost | $876,247,423 |
The tax-based components of distributable earnings as of period end were as follows:
| Undistributed tax-exempt income | $– |
| Undistributed ordinary income | $– |
| Net unrealized appreciation (depreciation) on securities and other investments | $160,224,295 |
The Fund intends to elect to defer to its next fiscal year $19,416,492 of capital losses recognized during the period November 1, 2018 to February 28, 2019.
The tax character of distributions paid was as follows:
| | February 28, 2019 | February 28, 2018 |
| Ordinary Income | $17,473,751 | $ 12,115,593 |
| Long-term Capital Gains | 56,103,704 | 29,852,182 |
| Total | $73,577,455 | $ 41,967,775 |
New Rule Issuance. During August 2018, the U.S. Securities and Exchange Commission issued Final Rule Release No. 33-10532, Disclosure Update and Simplification. This Final Rule includes amendments specific to registered investment companies that are intended to eliminate overlap in disclosure requirements between Regulation S-X and GAAP. In accordance with these amendments, certain line-items in the Fund's financial statements have been combined or removed for the current period as outlined in the table below.
| Financial Statement | Current Line-Item Presentation (As Applicable) | Prior Line-Item Presentation (As Applicable) |
| Statement of Assets and Liabilities | Total distributable earnings (loss) | Undistributed/Distributions in excess of/Accumulated net investment income (loss)
Accumulated/Undistributed net realized gain (loss)
Net unrealized appreciation (depreciation) |
| Statement of Changes in Net Assets | N/A - removed | Undistributed/Distributions in excess of/Accumulated net investment income (loss) end of period |
| Statement of Changes in Net Assets | Distributions to shareholders | Distributions to shareholders from net investment income
Distributions to shareholders from net realized gain |
4. Purchases and Sales of Investments.
Purchases and sales of securities, other than short-term securities and in-kind transactions, aggregated $1,083,146,105 and $775,284,495, respectively.
5. Fees and Other Transactions with Affiliates.
Management Fee. Fidelity SelectCo, LLC (the investment adviser) and its affiliates provide the Fund with investment management related services for which the Fund pays a monthly management fee. The management fee is the sum of an individual fund fee rate that is based on an annual rate of .30% of the Fund's average net assets and an annualized group fee rate that averaged .24% during the period. The group fee rate is based upon the average net assets of all the mutual funds advised by Fidelity Management & Research Company (FMR) and the investment adviser. The group fee rate decreases as assets under management increase and increases as assets under management decrease. For the reporting period, the total annual management fee rate was .54% of the Fund's average net assets.
Transfer Agent Fees. Fidelity Investments Institutional Operations Company, Inc. (FIIOC), an affiliate of the investment adviser, is the Fund's transfer, dividend disbursing and shareholder servicing agent. FIIOC receives account fees and asset-based fees that vary according to account size and type of account. FIIOC pays for typesetting, printing and mailing of shareholder reports, except proxy statements. For the period, the transfer agent fees were equivalent to an annual rate of .18% of average net assets.
Accounting and Security Lending Fees. Fidelity Service Company, Inc. (FSC), an affiliate of the investment adviser, maintains the Fund's accounting records. The accounting fee is based on the level of average net assets for each month. Under a separate contract, FSC administers the security lending program. The security lending fee is based on the number and duration of lending transactions. For the period, the fees were equivalent to an annual rate of .03%.
Brokerage Commissions. The Fund placed a portion of its portfolio transactions with brokerage firms which are affiliates of the investment adviser. Brokerage commissions are included in net realized gain (loss) and change in net unrealized appreciation (depreciation) in the Statement of Operations. The commissions paid to these affiliated firms were $24,282 for the period.
Interfund Lending Program. Pursuant to an Exemptive Order issued by the SEC, the Fund, along with other registered investment companies having management contracts with Fidelity Management & Research Company (FMR) or other affiliated entities of FMR, may participate in an interfund lending program. This program provides an alternative credit facility allowing the funds to borrow from, or lend money to, other participating affiliated funds. At period end, there were no interfund loans outstanding. The Fund's activity in this program during the period for which loans were outstanding was as follows:
| Borrower or Lender | Average Loan Balance | Weighted Average Interest Rate | Interest Expense |
| Borrower | $2,275,000 | 2.65% | $671 |
Interfund Trades. The Fund may purchase from or sell securities to other Fidelity Funds under procedures adopted by the Board. The procedures have been designed to ensure these interfund trades are executed in accordance with Rule 17a-7 of the 1940 Act. Interfund trades are included within the respective purchases and sales amounts shown in the Purchases and Sales of Investments note.
Affiliated Redemptions In-Kind. During the period, 1,469,597 shares of the Fund were redeemed in-kind for investments and cash with a value of $117,288,521. The net realized gain of $26,295,315 on investments delivered through in-kind redemptions is included in the accompanying Statement of Operations. The amount of in-kind redemptions is included in share transactions in the accompanying Statement of Changes in Net Assets. The Fund recognized no gain or loss for federal income tax purposes.
6. Committed Line of Credit.
The Fund participates with other funds managed by the investment adviser or an affiliate in a $4.25 billion credit facility (the "line of credit") to be utilized for temporary or emergency purposes to fund shareholder redemptions or for other short-term liquidity purposes. The Fund has agreed to pay commitment fees on its pro-rata portion of the line of credit, which amounted to $2,071 and is reflected in Miscellaneous expenses on the Statement of Operations. During the period, the Fund did not borrow on this line of credit.
7. Security Lending.
The Fund lends portfolio securities through a lending agent from time to time in order to earn additional income. On the settlement date of the loan, the Fund receives collateral (in the form of U.S. Treasury obligations, letters of credit and/or cash) against the loaned securities and maintains collateral in an amount not less than 100% of the market value of the loaned securities during the period of the loan. The market value of the loaned securities is determined at the close of business of the Fund and any additional required collateral is delivered to the Fund on the next business day. The Fund or borrower may terminate the loan at any time, and if the borrower defaults on its obligation to return the securities loaned because of insolvency or other reasons, the Fund may apply collateral received from the borrower against the obligation. The Fund may experience delays and costs in recovering the securities loaned. Any cash collateral received is invested in the Fidelity Securities Lending Cash Central Fund. At period end, there were no security loans outstanding. Security lending income represents the income earned on investing cash collateral, less rebates paid to borrowers and any lending agent fees associated with the loan, plus any premium payments received for lending certain types of securities. Security lending income is presented in the Statement of Operations as a component of income from Fidelity Central Funds. Total security lending income during the period amounted to $4,156.
8. Expense Reductions.
Commissions paid to certain brokers with whom the investment adviser, or its affiliates, places trades on behalf of the Fund include an amount in addition to trade execution, which may be rebated back to the Fund to offset certain expenses. This amount totaled $180,901 for the period.
In addition, through arrangements with the Fund's custodian and transfer agent, credits realized as a result of certain uninvested cash balances were used to reduce the Fund's expenses. During the period, these credits reduced the Fund's custody and transfer agent expenses by $38 and $85, respectively.
In addition, during the period the investment adviser reimbursed and/or waived a portion of operating expenses in the amount of $7,380.
9. Other.
The Fund's organizational documents provide former and current trustees and officers with a limited indemnification against liabilities arising in connection with the performance of their duties to the Fund. In the normal course of business, the Fund may also enter into contracts that provide general indemnifications. The Fund's maximum exposure under these arrangements is unknown as this would be dependent on future claims that may be made against the Fund. The risk of material loss from such claims is considered remote.
Report of Independent Registered Public Accounting Firm
To the Board of Trustees of Fidelity Select Portfolios and Shareholders of Utilities Portfolio:
Opinion on the Financial Statements
We have audited the accompanying statement of assets and liabilities, including the schedule of investments, of Utilities Portfolio (one of the funds constituting Fidelity Select Portfolios, referred to hereafter as the "Fund") as of February 28, 2019, the related statement of operations for the year ended February 28, 2019, the statement of changes in net assets for each of the two years in the period ended February 28, 2019, including the related notes, and the financial highlights for each of the five years in the period ended February 28, 2019 (collectively referred to as the “financial statements”). In our opinion, the financial statements present fairly, in all material respects, the financial position of the Fund as of February 28, 2019, the results of its operations for the year then ended, the changes in its net assets for each of the two years in the period ended February 28, 2019 and the financial highlights for each of the five years in the period ended February 28, 2019 in conformity with accounting principles generally accepted in the United States of America.
Basis for Opinion
These financial statements are the responsibility of the Fund’s management. Our responsibility is to express an opinion on the Fund’s financial statements based on our audits. We are a public accounting firm registered with the Public Company Accounting Oversight Board (United States) (PCAOB) and are required to be independent with respect to the Fund in accordance with the U.S. federal securities laws and the applicable rules and regulations of the Securities and Exchange Commission and the PCAOB.
We conducted our audits of these financial statements in accordance with the standards of the PCAOB. Those standards require that we plan and perform the audit to obtain reasonable assurance about whether the financial statements are free of material misstatement, whether due to error or fraud.
Our audits included performing procedures to assess the risks of material misstatement of the financial statements, whether due to error or fraud, and performing procedures that respond to those risks. Such procedures included examining, on a test basis, evidence regarding the amounts and disclosures in the financial statements. Our audits also included evaluating the accounting principles used and significant estimates made by management, as well as evaluating the overall presentation of the financial statements. Our procedures included confirmation of securities owned as of February 28, 2019 by correspondence with the custodian and brokers; when replies were not received from brokers, we performed other auditing procedures. We believe that our audits provide a reasonable basis for our opinion.
PricewaterhouseCoopers LLP
Boston, Massachusetts
April 10, 2019
We have served as the auditor of one or more investment companies in the Fidelity group of funds since 1932.
Trustees and Officers
The Trustees, Members of the Advisory Board (if any), and officers of the trust and fund, as applicable, are listed below. The Board of Trustees governs the fund and is responsible for protecting the interests of shareholders. The Trustees are experienced executives who meet periodically throughout the year to oversee the fund's activities, review contractual arrangements with companies that provide services to the fund, oversee management of the risks associated with such activities and contractual arrangements, and review the fund's performance. Except for Mr. Michael E. Wiley each of the Trustees oversees 287 funds. Mr. Wiley oversees 195 funds.
The Trustees hold office without limit in time except that (a) any Trustee may resign; (b) any Trustee may be removed by written instrument, signed by at least two-thirds of the number of Trustees prior to such removal; (c) any Trustee who requests to be retired or who has become incapacitated by illness or injury may be retired by written instrument signed by a majority of the other Trustees; and (d) any Trustee may be removed at any special meeting of shareholders by a two-thirds vote of the outstanding voting securities of the trust. Each Trustee who is not an interested person (as defined in the 1940 Act) of the trust and the fund is referred to herein as an Independent Trustee. Each Independent Trustee shall retire not later than the last day of the calendar year in which his or her 75th birthday occurs. The Independent Trustees may waive this mandatory retirement age policy with respect to individual Trustees. Officers and Advisory Board Members hold office without limit in time, except that any officer or Advisory Board Member may resign or may be removed by a vote of a majority of the Trustees at any regular meeting or any special meeting of the Trustees. Except as indicated, each individual has held the office shown or other offices in the same company for the past five years.
The fund’s Statement of Additional Information (SAI) includes more information about the Trustees. To request a free copy, call Fidelity at 1-800-544-8544.
Experience, Skills, Attributes, and Qualifications of the Trustees. The Governance and Nominating Committee has adopted a statement of policy that describes the experience, qualifications, attributes, and skills that are necessary and desirable for potential Independent Trustee candidates (Statement of Policy). The Board believes that each Trustee satisfied at the time he or she was initially elected or appointed a Trustee, and continues to satisfy, the standards contemplated by the Statement of Policy. The Governance and Nominating Committee also engages professional search firms to help identify potential Independent Trustee candidates who have the experience, qualifications, attributes, and skills consistent with the Statement of Policy. From time to time, additional criteria based on the composition and skills of the current Independent Trustees, as well as experience or skills that may be appropriate in light of future changes to board composition, business conditions, and regulatory or other developments, have also been considered by the professional search firms and the Governance and Nominating Committee. In addition, the Board takes into account the Trustees' commitment and participation in Board and committee meetings, as well as their leadership of standing and ad hoc committees throughout their tenure.
In determining that a particular Trustee was and continues to be qualified to serve as a Trustee, the Board has considered a variety of criteria, none of which, in isolation, was controlling. The Board believes that, collectively, the Trustees have balanced and diverse experience, qualifications, attributes, and skills, which allow the Board to operate effectively in governing the fund and protecting the interests of shareholders. Information about the specific experience, skills, attributes, and qualifications of each Trustee, which in each case led to the Board's conclusion that the Trustee should serve (or continue to serve) as a trustee of the fund, is provided below.
Board Structure and Oversight Function. James C. Curvey is an interested person and currently serves as Chairman. The Trustees have determined that an interested Chairman is appropriate and benefits shareholders because an interested Chairman has a personal and professional stake in the quality and continuity of services provided to the fund. Independent Trustees exercise their informed business judgment to appoint an individual of their choosing to serve as Chairman, regardless of whether the Trustee happens to be independent or a member of management. The Independent Trustees have determined that they can act independently and effectively without having an Independent Trustee serve as Chairman and that a key structural component for assuring that they are in a position to do so is for the Independent Trustees to constitute a substantial majority for the Board. The Independent Trustees also regularly meet in executive session. Ned C. Lautenbach serves as Chairman of the Independent Trustees and as such (i) acts as a liaison between the Independent Trustees and management with respect to matters important to the Independent Trustees and (ii) with management prepares agendas for Board meetings.
Fidelity® funds are overseen by different Boards of Trustees. The fund's Board oversees Fidelity's high income and certain equity funds, and other Boards oversee Fidelity's investment-grade bond, money market, asset allocation, and other equity funds. The asset allocation funds may invest in Fidelity® funds overseen by the fund's Board. The use of separate Boards, each with its own committee structure, allows the Trustees of each group of Fidelity® funds to focus on the unique issues of the funds they oversee, including common research, investment, and operational issues. On occasion, the separate Boards establish joint committees to address issues of overlapping consequences for the Fidelity® funds overseen by each Board.
The Trustees operate using a system of committees to facilitate the timely and efficient consideration of all matters of importance to the Trustees, the fund, and fund shareholders and to facilitate compliance with legal and regulatory requirements and oversight of the fund's activities and associated risks. The Board, acting through its committees, has charged SelectCo and its affiliates with (i) identifying events or circumstances the occurrence of which could have demonstrably adverse effects on the fund's business and/or reputation; (ii) implementing processes and controls to lessen the possibility that such events or circumstances occur or to mitigate the effects of such events or circumstances if they do occur; and (iii) creating and maintaining a system designed to evaluate continuously business and market conditions in order to facilitate the identification and implementation processes described in (i) and (ii) above. Because the day-to-day operations and activities of the fund are carried out by or through SelectCo, its affiliates, and other service providers, the fund's exposure to risks is mitigated but not eliminated by the processes overseen by the Trustees. While each of the Board's committees has responsibility for overseeing different aspects of the fund's activities, oversight is exercised primarily through the Operations, Audit, and Compliance Committees. In addition, the Independent Trustees have worked with Fidelity to enhance the Board's oversight of investment and financial risks, legal and regulatory risks, technology risks, and operational risks, including the development of additional risk reporting to the Board. Appropriate personnel, including but not limited to the fund's Chief Compliance Officer (CCO), SelectCo's internal auditor, the independent accountants, the fund's Treasurer and portfolio management personnel, make periodic reports to the Board's committees, as appropriate, including an annual review of Fidelity's risk management program for the Fidelity® funds. The responsibilities of each standing committee, including their oversight responsibilities, are described further under "Standing Committees of the Trustees."
Interested Trustees*:
Correspondence intended for a Trustee who is an interested person may be sent to Fidelity Investments, 245 Summer Street, Boston, Massachusetts 02210.
Name, Year of Birth; Principal Occupations and Other Relevant Experience+
James C. Curvey (1935)
Year of Election or Appointment: 2018
Trustee
Chairman of the Board of Trustees
Mr. Curvey also serves as Trustee of other Fidelity® funds. Mr. Curvey is Vice Chairman (2007-present) and Director of FMR LLC (diversified financial services company). In addition, Mr. Curvey is an Overseer Emeritus for the Boston Symphony Orchestra, a Director of Artis-Naples, and a Trustee of Brewster Academy in Wolfeboro, New Hampshire. Previously, Mr. Curvey served as a Director of Fidelity Research & Analysis Co. (investment adviser firm, 2009-2018), Director of Fidelity Investments Money Management, Inc. (investment adviser firm, 2009-2014) and a Director of FMR and FMR Co., Inc. (investment adviser firms, 2007-2014).
* Determined to be an "Interested Trustee" by virtue of, among other things, his or her affiliation with the trust or various entities under common control with SelectCo.
+ The information includes the Trustee's principal occupation during the last five years and other information relating to the experience, attributes, and skills relevant to the Trustee's qualifications to serve as a Trustee, which led to the conclusion that the Trustee should serve as a Trustee for the fund.
Independent Trustees:
Correspondence intended for an Independent Trustee may be sent to Fidelity Investments, P.O. Box 55235, Boston, Massachusetts 02205-5235.
Name, Year of Birth; Principal Occupations and Other Relevant Experience+
Dennis J. Dirks (1948)
Year of Election or Appointment: 2018
Trustee
Mr. Dirks also serves as Trustee of other Fidelity® funds. Prior to his retirement in May 2003, Mr. Dirks was Chief Operating Officer and a member of the Board of The Depository Trust & Clearing Corporation (DTCC). He also served as President, Chief Operating Officer, and Board member of The Depository Trust Company (DTC) and President and Board member of the National Securities Clearing Corporation (NSCC). In addition, Mr. Dirks served as Chief Executive Officer and Board member of the Government Securities Clearing Corporation, Chief Executive Officer and Board member of the Mortgage-Backed Securities Clearing Corporation, as a Trustee and a member of the Finance Committee of Manhattan College (2005-2008), as a Trustee and a member of the Finance Committee of AHRC of Nassau County (2006-2008), as a member of the Independent Directors Council (IDC) Governing Council (2010-2015), and as a member of the Board of Directors for The Brookville Center for Children’s Services, Inc. (2009-2017). Mr. Dirks is a member of the Finance Committee (2016-present) and Board of Directors (2017-present) and is Treasurer (2018-present) of the Asolo Repertory Theatre.
Donald F. Donahue (1950)
Year of Election or Appointment: 2018
Trustee
Mr. Donahue also serves as a Trustee of other Fidelity® funds. Mr. Donahue is President and Chief Executive Officer of Miranda Partners, LLC (risk consulting for the financial services industry, 2012-present). Previously, Mr. Donahue served as a Member of the Advisory Board of certain Fidelity® funds (2015-2018) and Chief Executive Officer (2006-2012), Chief Operating Officer (2003-2006), and Managing Director, Customer Marketing and Development (1999-2003) of The Depository Trust & Clearing Corporation (financial markets infrastructure). Mr. Donahue serves as a Member (2007-present) and Co-Chairman (2016-present) of the Board of Directors of United Way of New York, Member of the Board of Directors of NYC Leadership Academy (2012-present) and Member of the Board of Advisors of Ripple Labs, Inc. (financial services, 2015-present). He also served as Chairman (2010-2012) and Member of the Board of Directors (2012-2013) of Omgeo, LLC (financial services), Treasurer of United Way of New York (2012-2016), and Member of the Board of Directors of XBRL US (financial services non-profit, 2009-2012) and the International Securities Services Association (2009-2012).
Alan J. Lacy (1953)
Year of Election or Appointment: 2018
Trustee
Mr. Lacy also serves as Trustee of other Fidelity® funds. Mr. Lacy serves as a Director of Bristol-Myers Squibb Company (global pharmaceuticals, 2008-present). He is a Trustee of the California Chapter of The Nature Conservancy (2015-present) and a Director of the Center for Advanced Study in the Behavioral Sciences at Stanford University (2015-present). In addition, Mr. Lacy served as Senior Adviser (2007-2014) of Oak Hill Capital Partners, L.P. (private equity) and also served as Chief Executive Officer (2005) and Vice Chairman (2005-2006) of Sears Holdings Corporation (retail) and Chief Executive Officer and Chairman of the Board of Sears, Roebuck and Co. (retail, 2000-2005). Previously, Mr. Lacy served as Chairman (2014-2017) and a member (2010-2017) of the Board of Directors of Dave & Buster’s Entertainment, Inc. (restaurant and entertainment complexes), as Chairman (2008-2011) and a member (2006-2015) of the Board of Trustees of the National Parks Conservation Association, and as a member of the Board of Directors for The Hillman Companies, Inc. (hardware wholesalers, 2010-2014), Earth Fare, Inc. (retail grocery, 2010-2014), and The Western Union Company (global money transfer, 2006-2011).
Ned C. Lautenbach (1944)
Year of Election or Appointment: 2018
Trustee
Chairman of the Independent Trustees
Mr. Lautenbach also serves as Trustee of other Fidelity® funds. Mr. Lautenbach currently serves as Chair (2018-present) and Member (2013-present) of the Board of Governors, State University System of Florida and is a member of the Council on Foreign Relations (1994-present). He is also a member and has most recently served as Chairman of the Board of Directors of Artis-Naples (2012-present). Previously, Mr. Lautenbach served as a member and then Lead Director of the Board of Directors of Eaton Corporation (diversified industrial, 1997-2016). He was also a Partner and Advisory Partner at Clayton, Dubilier & Rice, LLC (private equity investment, 1998-2010), as well as a Director of Sony Corporation (2006-2007). In addition, Mr. Lautenbach also had a 30-year career with IBM (technology company) during which time he served as Senior Vice President and a member of the Corporate Executive Committee (1968-1998).
Joseph Mauriello (1944)
Year of Election or Appointment: 2018
Trustee
Mr. Mauriello also serves as Trustee of other Fidelity® funds. Prior to his retirement in January 2006, Mr. Mauriello served in numerous senior management positions including Deputy Chairman and Chief Operating Officer (2004-2005), and Vice Chairman of Financial Services (2002-2004) of KPMG LLP US (professional services, 1965-2005). Mr. Mauriello currently serves as a member of the Independent Directors Council (IDC) Governing Council (2015-present). Previously, Mr. Mauriello served as a member of the Board of Directors of XL Group plc. (global insurance and re-insurance, 2006-2018).
Cornelia M. Small (1944)
Year of Election or Appointment: 2018
Trustee
Ms. Small also serves as Trustee of other Fidelity® funds. Ms. Small is a member of the Board of Directors (2009-present) and Chair of the Investment Committee (2010-present) of the Teagle Foundation. Ms. Small also serves on the Investment Committee of the Berkshire Taconic Community Foundation (2008-present). Previously, Ms. Small served as Chairperson (2002-2008) and a member of the Investment Committee and Chairperson (2008-2012) and a member of the Board of Trustees of Smith College. In addition, Ms. Small served as Chief Investment Officer, Director of Global Equity Investments, and a member of the Board of Directors of Scudder, Stevens & Clark and Scudder Kemper Investments.
Garnett A. Smith (1947)
Year of Election or Appointment: 2013
Trustee
Mr. Smith also serves as Trustee of other Fidelity® funds. Prior to Mr. Smith's retirement, he served as Chairman and Chief Executive Officer of Inbrand Corp. (manufacturer of personal absorbent products, 1990-1997). He also served as President (1986-1990) of Inbrand Corp. Prior to his employment with Inbrand Corp., he was employed by a retail fabric chain and North Carolina National Bank. In addition, Mr. Smith served as a Member of the Advisory Board of certain Fidelity® funds (2012-2013) and as a board member of the Jackson Hole Land Trust (2009-2012).
David M. Thomas (1949)
Year of Election or Appointment: 2018
Trustee
Mr. Thomas also serves as Trustee of other Fidelity® funds. Mr. Thomas serves as Non-Executive Chairman of the Board of Directors of Fortune Brands Home and Security (home and security products, 2011-present) and as a member of the Board of Directors (2004-present) and Presiding Director (2013-present) of Interpublic Group of Companies, Inc. (marketing communication). Previously, Mr. Thomas served as Executive Chairman (2005-2006) and Chairman and Chief Executive Officer (2000-2005) of IMS Health, Inc. (pharmaceutical and healthcare information solutions), a Director of Fortune Brands, Inc. (consumer products, 2000-2011), and a member of the Board of Trustees of the University of Florida (2013-2018).
Michael E. Wiley (1950)
Year of Election or Appointment: 2008
Trustee
Mr. Wiley also serves as Trustee or Member of the Advisory Board of other Fidelity® funds. Mr. Wiley serves as a Director of High Point Resources (exploration and production, 2005-present). Previously, Mr. Wiley served as a Director of Andeavor Corporation (independent oil refiner and marketer, 2005-2018), a Director of Andeavor Logistics LP (natural resources logistics, 2015-2018), a Director of Post Oak Bank (privately-held bank, 2004-2018), a Director of Asia Pacific Exploration Consolidated (international oil and gas exploration and production, 2008-2013), a member of the Board of Trustees of the University of Tulsa (2000-2006; 2007-2010), a Senior Energy Advisor of Katzenbach Partners, LLC (consulting, 2006-2007), an Advisory Director of Riverstone Holdings (private investment), a Director of Spinnaker Exploration Company (exploration and production, 2001-2005) and Chairman, President, and CEO of Baker Hughes, Inc. (oilfield services, 2000-2004).
+ The information includes the Trustee's principal occupation during the last five years and other information relating to the experience, attributes, and skills relevant to the Trustee's qualifications to serve as a Trustee, which led to the conclusion that the Trustee should serve as a Trustee for the fund.
Advisory Board Members and Officers:
Correspondence intended for a Member of the Advisory Board (if any) may be sent to Fidelity Investments, P.O. Box 55235, Boston, Massachusetts 02205-5235. Correspondence intended for an officer or Peter S. Lynch may be sent to Fidelity Investments, 245 Summer Street, Boston, Massachusetts 02210. Officers appear below in alphabetical order.
Name, Year of Birth; Principal Occupation
Vicki L. Fuller (1957)
Year of Election or Appointment: 2018
Member of the Advisory Board
Ms. Fuller also serves as Member of the Advisory Board of other Fidelity® funds. Ms. Fuller serves as a member of the Board of Directors, Audit Committee, and Nominating and Governance Committee of The Williams Companies, Inc. (natural gas infrastructure, 2018-present). Previously, Ms. Fuller served as the Chief Investment Officer of the New York State Common Retirement Fund (2012-2018) and held a variety of positions at AllianceBernstein L.P. (global asset management, 1985-2012), including Managing Director (2006-2012) and Senior Vice President and Senior Portfolio Manager (2001-2006).
Peter S. Lynch (1944)
Year of Election or Appointment: 2018
Member of the Advisory Board
Mr. Lynch also serves as Member of the Advisory Board of other Fidelity® funds. Mr. Lynch is Vice Chairman and a Director of FMR (investment adviser firm) and FMR Co., Inc. (investment adviser firm). In addition, Mr. Lynch serves as a Trustee of Boston College and as the Chairman of the Inner-City Scholarship Fund. Previously, Mr. Lynch served on the Special Olympics International Board of Directors (1997-2006).
Carol B. Tomé (1957)
Year of Election or Appointment: 2017
Member of the Advisory Board
Ms. Tomé also serves as Member of the Advisory Board of other Fidelity® funds. Ms. Tomé is Chief Financial Officer (2001-present) and Executive Vice President of Corporate Services (2007-present) of The Home Depot, Inc. (home improvement retailer) and a Director (2003-present) and Chair of the Audit Committee (2004-present) of United Parcel Service, Inc. (package delivery and supply chain management). Previously, Ms. Tomé served as Trustee of certain Fidelity® funds (2017), Senior Vice President of Finance and Accounting/Treasurer (2000-2007) and Vice President and Treasurer (1995-2000) of The Home Depot, Inc. and Chair of the Board (2010-2012), Vice Chair of the Board (2009 and 2013), and a Director (2008-2013) of the Federal Reserve Bank of Atlanta. Ms. Tomé is also a director or trustee of many community and professional organizations.
Elizabeth Paige Baumann (1968)
Year of Election or Appointment: 2017
Anti-Money Laundering (AML) Officer
Ms. Baumann also serves as AML Officer of other funds. She is Chief AML Officer (2012-present) and Senior Vice President (2014-present) of FMR LLC (diversified financial services company) and is an employee of Fidelity Investments. Previously, Ms. Baumann served as AML Officer of the funds (2012-2016), and Vice President (2007-2014) and Deputy Anti-Money Laundering Officer (2007-2012) of FMR LLC.
Craig S. Brown (1977)
Year of Election or Appointment: 2019
Assistant Treasurer
Mr. Brown also serves as Assistant Treasurer of other funds. Mr. Brown is an employee of Fidelity Investments (2013-present).
John J. Burke III (1964)
Year of Election or Appointment: 2018
Chief Financial Officer
Mr. Burke also serves as Chief Financial Officer of other funds. Mr. Burke serves as Head of Investment Operations for Fidelity Fund and Investment Operations (2018-present) and is an employee of Fidelity Investments (1998-present). Previously Mr. Burke served as head of Asset Management Investment Operations (2012-2018).
William C. Coffey (1969)
Year of Election or Appointment: 2018
Secretary and Chief Legal Officer (CLO)
Mr. Coffey also serves as Secretary and CLO of other funds. Mr. Coffey serves as CLO, Secretary, and Senior Vice President of Fidelity Management & Research Company and FMR Co., Inc. (investment adviser firms, 2018-present); Secretary of Fidelity SelectCo, LLC and Fidelity Investments Money Management, Inc. (investment adviser firms, 2018-present); and CLO of Fidelity Management & Research (Hong Kong) Limited, FMR Investment Management (UK) Limited, and Fidelity Management & Research (Japan) Limited (investment adviser firms, 2018-present). He is Senior Vice President and Deputy General Counsel of FMR LLC (diversified financial services company, 2010-present), and is an employee of Fidelity Investments. Previously, Mr. Coffey served as Assistant Secretary of certain funds (2009-2018) and as Vice President and Associate General Counsel of FMR LLC (2005-2009).
Timothy M. Cohen (1969)
Year of Election or Appointment: 2018
Vice President
Mr. Cohen also serves as Vice President of other funds. Mr. Cohen serves as Co-Head of Global Equity Research (2016-present), a Director of Fidelity Management & Research (Japan) Limited (investment adviser firm, 2016-present), and is an employee of Fidelity Investments. Previously, Mr. Cohen served as Chief Investment Officer - Equity and a Director of Fidelity Management & Research (U.K.) Inc. (investment adviser firm, 2013-2015) and as a Director of Fidelity Management & Research (Hong Kong) Limited (investment adviser firm, 2017).
Jonathan Davis (1968)
Year of Election or Appointment: 2010
Assistant Treasurer
Mr. Davis also serves as Assistant Treasurer of other funds. Mr. Davis serves as Assistant Treasurer of FMR Capital, Inc. (2017-present) and is an employee of Fidelity Investments. Previously, Mr. Davis served as Vice President and Associate General Counsel of FMR LLC (diversified financial services company, 2003-2010).
Adrien E. Deberghes (1967)
Year of Election or Appointment: 2018
Assistant Treasurer
Mr. Deberghes also serves as an officer of other funds. He serves as Assistant Treasurer of FMR Capital, Inc. (2017-present), Executive Vice President of Fidelity Investments Money Management, Inc. (FIMM) (investment adviser firm, 2016-present), and is an employee of Fidelity Investments (2008-present). Previously, Mr. Deberghes served as President and Treasurer of certain Fidelity® funds (2013-2018). Prior to joining Fidelity Investments, Mr. Deberghes was Senior Vice President of Mutual Fund Administration at State Street Corporation (2007-2008), Senior Director of Mutual Fund Administration at Investors Bank & Trust (2005-2007), and Director of Finance for Dunkin' Brands (2000-2005). Previously, Mr. Deberghes served in other fund officer roles.
Laura M. Del Prato (1964)
Year of Election or Appointment: 2018
Assistant Treasurer
Ms. Del Prato also serves as an officer of other funds. Ms. Del Prato is an employee of Fidelity Investments (2017-present). Prior to joining Fidelity Investments, Ms. Del Prato served as a Managing Director and Treasurer of the JPMorgan Mutual Funds (2014-2017). Prior to JPMorgan, Ms. Del Prato served as a partner at Cohen Fund Audit Services (accounting firm, 2012-2013) and KPMG LLP (accounting firm, 2004-2012).
Colm A. Hogan (1973)
Year of Election or Appointment: 2018
Deputy Treasurer
Mr. Hogan also serves as an officer of other funds. Mr. Hogan serves as Assistant Treasurer of FMR Capital, Inc. (2017-present) and is an employee of Fidelity Investments (2005-present). Previously, Mr. Hogan served as Assistant Treasurer of certain Fidelity® funds (2016-2018).
Pamela R. Holding (1964)
Year of Election or Appointment: 2018
Vice President
Ms. Holding also serves as Vice President of other funds. Ms. Holding serves as Co-Head of Global Equity Research (2018-present) and is an employee of Fidelity Investments (2013-present).
Chris Maher (1972)
Year of Election or Appointment: 2013
Assistant Treasurer
Mr. Maher serves as Assistant Treasurer of other funds. Mr. Maher is Vice President of Valuation Oversight, serves as Assistant Treasurer of FMR Capital, Inc. (2017-present), and is an employee of Fidelity Investments. Previously, Mr. Maher served as Vice President of Asset Management Compliance (2013), Vice President of the Program Management Group of FMR (investment adviser firm, 2010-2013), and Vice President of Valuation Oversight (2008-2010).
Kenneth B. Robins (1969)
Year of Election or Appointment: 2018
Chief Compliance Officer
Mr. Robins also serves as an officer of other funds. Mr. Robins serves as Compliance Officer of Fidelity Management & Research Company and FMR Co., Inc. (investment adviser firms, 2016-present) and is an employee of Fidelity Investments (2004-present). Previously, Mr. Robins served as Executive Vice President of Fidelity Investments Money Management, Inc. (investment adviser firm, 2013-2016) and served in other fund officer roles.
Stacie M. Smith (1974)
Year of Election or Appointment: 2018
President and Treasurer
Ms. Smith also serves as an officer of other funds. Ms. Smith serves as Assistant Treasurer of FMR Capital, Inc. (2017-present), is an employee of Fidelity Investments (2009-present), and has served in other fund officer roles. Prior to joining Fidelity Investments, Ms. Smith served as Senior Audit Manager of Ernst & Young LLP (accounting firm, 1996-2009). Previously, Ms. Smith served as Assistant Treasurer (2013-2018) and Deputy Treasurer (2013-2016) of certain Fidelity® funds.
Marc L. Spector (1972)
Year of Election or Appointment: 2017
Assistant Treasurer
Mr. Spector also serves as an officer of other funds. Mr. Spector serves as Assistant Treasurer of FMR Capital, Inc. (2017-present) and is an employee of Fidelity Investments (2016-present). Prior to joining Fidelity Investments, Mr. Spector served as Director at the Siegfried Group (accounting firm, 2013-2016), and prior to Siegfried Group as audit senior manager at Deloitte & Touche (accounting firm, 2005-2013).
Jim Wegmann (1979)
Year of Election or Appointment: 2019
Assistant Treasurer
Mr. Wegmann also serves as Assistant Treasurer of other funds. Mr. Wegmann is an employee of Fidelity Investments (2011-present).
Shareholder Expense Example
As a shareholder of the Fund, you incur two types of costs: (1) transaction costs, including and (2) ongoing costs, including management fees and other Fund expenses. This Example is intended to help you understand your ongoing costs (in dollars) of investing in the Fund and to compare these costs with the ongoing costs of investing in other mutual funds.
The Example is based on an investment of $1,000 invested at the beginning of the period and held for the entire period (September 1, 2018 to February 28, 2019).
Actual Expenses
The first line of the accompanying table provides information about actual account values and actual expenses. You may use the information in this line, together with the amount you invested, to estimate the expenses that you paid over the period. Simply divide your account value by $1,000.00 (for example, an $8,600 account value divided by $1,000.00 = 8.6), then multiply the result by the number in the first line under the heading entitled "Expenses Paid During Period" to estimate the expenses you paid on your account during this period. In addition, the Fund, as a shareholder in the underlying Fidelity Central Funds, will indirectly bear its pro-rata share of the fees and expenses incurred by the underlying Fidelity Central Funds. These fees and expenses are not included in the Fund's annualized expense ratio used to calculate the expense estimate in the table below.
Hypothetical Example for Comparison Purposes
The second line of the accompanying table provides information about hypothetical account values and hypothetical expenses based on the Fund's actual expense ratio and an assumed rate of return of 5% per year before expenses, which is not the Fund's actual return. The hypothetical account values and expenses may not be used to estimate the actual ending account balance or expenses you paid for the period. You may use this information to compare the ongoing costs of investing in the Fund and other funds. To do so, compare this 5% hypothetical example with the 5% hypothetical examples that appear in the shareholder reports of the other funds. In addition, the Fund, as a shareholder in the underlying Fidelity Central Funds, will indirectly bear its pro-rata share of the fees and expenses incurred by the underlying Fidelity Central Funds. These fees and expenses are not included in the Fund's annualized expense ratio used to calculate the expense estimate in the table below.
Please note that the expenses shown in the table are meant to highlight your ongoing costs only and do not reflect any transaction costs. Therefore, the second line of the table is useful in comparing ongoing costs only, and will not help you determine the relative total costs of owning different funds. In addition, if these transactional costs were included, your costs would have been higher.
| | Annualized Expense Ratio-A | Beginning
Account Value
September 1, 2018 | Ending
Account Value
February 28, 2019 | Expenses Paid
During Period-B
September 1, 2018
to February 28, 2019 |
| Actual | .78% | $1,000.00 | $1,042.20 | $3.95 |
| Hypothetical-C | | $1,000.00 | $1,020.93 | $3.91 |
A Annualized expense ratio reflects expenses net of applicable fee waivers.
B Expenses are equal to the Fund's annualized expense ratio, multiplied by the average account value over the period, multiplied by 181/365 (to reflect the one-half year period).
C 5% return per year before expenses
Distributions (Unaudited)
The fund hereby designates as a capital gain dividend with respect to the taxable year ended February 28, 2019, $53,770,455, or, if subsequently determined to be different, the net capital gain of such year.
The fund designates 100% of the dividends distributed during the fiscal year as qualifying for the dividends–received deduction for corporate shareholders.
The fund designates 100% of the dividends distributed during the fiscal year as amounts which may be taken into account as a dividend for the purposes of the maximum rate under section 1(h)(11) of the Internal Revenue Code.
The fund will notify shareholders in January 2020 of amounts for use in preparing 2019 income tax returns.
Board Approval of Investment Advisory Contracts and Management Fees
Utilities Portfolio
Each year, the Board of Trustees, including the Independent Trustees (together, the Board), votes on the renewal of the management contract with Fidelity SelectCo, LLC (SelectCo), an affiliate of Fidelity Management & Research Company (FMR), and the sub-advisory agreements with affiliates of FMR (together, the Advisory Contracts) for the fund. SelectCo and the sub-advisers are referred to herein as the Investment Advisers. The Board, assisted by the advice of fund counsel and Independent Trustees' counsel, requests and considers a broad range of information relevant to the renewal of the Advisory Contracts throughout the year.
The Board meets regularly and, at each of its meetings, covers an extensive agenda of topics and materials and considers factors that are relevant to its annual consideration of the renewal of the fund's Advisory Contracts, including the services and support provided to the fund and its shareholders. The Board has established various standing committees (Committees), each composed of and chaired by Independent Trustees with varying backgrounds, to which the Board has assigned specific subject matter responsibilities in order to enhance effective decision-making by the Board. The Board, acting directly and through its Committees, requests and receives information concerning the annual consideration of the renewal of the fund's Advisory Contracts. The Board also meets as needed to review matters specifically related to the Board's annual consideration of the renewal of the Advisory Contracts. Members of the Board may also meet with trustees of other Fidelity funds through joint ad hoc committees to discuss certain matters relevant to all of the Fidelity funds.
At its January 2019 meeting, the Board unanimously determined to renew the fund's Advisory Contracts. In reaching its determination, the Board considered all factors it believed relevant, including (i) the nature, extent, and quality of the services to be provided to the fund and its shareholders (including the investment performance of the fund); (ii) the competitiveness of the fund's management fee and total expense ratio relative to peer funds; (iii) the total costs of the services to be provided by and the profits to be realized by Fidelity from its relationships with the fund; and (iv) the extent to which, if any, economies of scale exist and would be realized as the fund grows, and whether any economies of scale are appropriately shared with fund shareholders.
In considering whether to renew the Advisory Contracts for the fund, the Board reached a determination, with the assistance of fund counsel and Independent Trustees' counsel and through the exercise of its business judgment, that the renewal of the Advisory Contracts was in the best interests of the fund and its shareholders and that the compensation payable under the Advisory Contracts was fair and reasonable. The Board's decision to renew the Advisory Contracts was not based on any single factor, but rather was based on a comprehensive consideration of all the information provided to the Board at its meetings throughout the year. The Board, in reaching its determination to renew the Advisory Contracts, was aware that shareholders of the fund have a broad range of investment choices available to them, including a wide choice among funds offered by Fidelity's competitors, and that the fund's shareholders, who have the opportunity to review and weigh the disclosure provided by the fund in its prospectus and other public disclosures, have chosen to invest in this fund, which is part of the Fidelity family of funds.
Nature, Extent, and Quality of Services Provided. The Board considered Fidelity's staffing as it relates to the fund, including the backgrounds of investment personnel of Fidelity, and also considered the fund's investment objective, strategies, and related investment philosophy. The Independent Trustees also had discussions with senior management of Fidelity's investment operations and investment groups. The Board considered the structure of the investment personnel compensation program and whether this structure provides appropriate incentives to act in the best interests of the fund. Additionally, the Board considered the portfolio managers' investments, if any, in the funds that they manage.
Resources Dedicated to Investment Management and Support Services. The Board and the Fund Oversight and Research Committees reviewed the general qualifications and capabilities of Fidelity's investment staff, including its size, education, experience, and resources, as well as Fidelity's approach to recruiting, training, managing, and compensating investment personnel. The Board noted that Fidelity has continued to increase the resources devoted to non-U.S. offices, including expansion of Fidelity's global investment organization. The Board also noted that Fidelity's analysts have extensive resources, tools and capabilities that allow them to conduct sophisticated quantitative and fundamental analysis, as well as credit analysis of issuers, counterparties and guarantors. Further, the Board considered that Fidelity's investment professionals have sufficient access to global information and data so as to provide competitive investment results over time, and that those professionals also have access to sophisticated tools that permit them to assess portfolio construction and risk and performance attribution characteristics continuously, as well as to transmit new information and research conclusions rapidly around the world. Additionally, in its deliberations, the Board considered Fidelity's trading, risk management, compliance, and technology and operations capabilities and resources, which are integral parts of the investment management process.
Shareholder and Administrative Services. The Board considered (i) the nature, extent, quality, and cost of advisory, administrative, and shareholder services performed by the Investment Advisers and their affiliates under the Advisory Contracts and under separate agreements covering transfer agency, pricing and bookkeeping, and securities lending services for the fund; (ii) the nature and extent of the supervision of third party service providers, principally custodians, subcustodians, and pricing vendors; and (iii) the resources devoted to, and the record of compliance with, the fund's compliance policies and procedures. The Board also reviewed the allocation of fund brokerage, including allocations to brokers affiliated with the Investment Advisers, the use of brokerage commissions to pay fund expenses, and the use of "soft" commission dollars to pay for research services.
The Board noted that the growth of fund assets over time across the complex allows Fidelity to reinvest in the development of services designed to enhance the value and convenience of the Fidelity funds as investment vehicles. These services include 24-hour access to account information and market information through telephone representatives and over the Internet, investor education materials and asset allocation tools, and the expanded availability of Fidelity Investor Centers.
The Board noted that it and the boards of certain other Fidelity funds had formed an ad hoc Committee on Transfer Agency Fees to review the variety of transfer agency fee structures throughout the industry and Fidelity's competitive positioning with respect to industry participants.
Investment in a Large Fund Family. The Board considered the benefits to shareholders of investing in a Fidelity fund, including the benefits of investing in a fund that is part of a large family of funds offering a variety of investment disciplines and providing a large variety of mutual fund investor services. The Board noted that Fidelity had taken, or had made recommendations that resulted in the Fidelity funds taking, a number of actions over the previous year that benefited particular funds, including: (i) continuing to dedicate additional resources to Fidelity's investment research process, which includes meetings with management of issuers of securities in which the funds invest, and to the support of the senior management team that oversees asset management; (ii) continuing efforts to enhance Fidelity's global research capabilities; (iii) launching new funds and making other enhancements to meet client needs; (iv) launching new share classes of existing funds; (v) eliminating purchase minimums and broadening eligibility requirements for certain funds and share classes; (vi) reducing management fees and total expenses for certain growth equity funds and index funds; (vii) lowering expense caps for certain existing funds and classes, and converting certain voluntary expense caps to contractual caps, to reduce expenses borne by shareholders; (viii) eliminating short-term redemption fees for funds that had such fees; (ix) rationalizing product lines and gaining increased efficiencies from fund mergers and share class consolidations; (x) continuing to develop, acquire and implement systems and technology to improve services to the funds and shareholders, strengthen information security, and increase efficiency; and (xi) continuing to implement enhancements to further strengthen Fidelity's product line to increase investors' probability of success in achieving their investment goals, including retirement income goals.
Investment Performance. The Board considered whether the fund has operated in accordance with its investment objective, as well as its record of compliance with its investment restrictions and its performance history.
The Board took into account discussions that occur at Board meetings throughout the year with representatives of the Investment Advisers about fund investment performance. In this regard the Board noted that as part of regularly scheduled fund reviews and other reports to the Board on fund performance, the Board considers annualized return information for the fund for different time periods, measured against an appropriate securities market index ("benchmark index"). In its evaluation of fund investment performance, the Board gave particular attention to information indicating changes in performance of certain Fidelity funds for specific time periods and discussed with the Investment Advisers the reasons for any overperformance or underperformance.
In addition to reviewing absolute and relative fund performance, the Independent Trustees periodically consider the appropriateness of fund performance metrics in evaluating the results achieved. In general, the Independent Trustees believe that fund performance should be evaluated based on net performance (after fees and expenses) of both the highest performing and lowest performing fund share classes, where applicable, compared to appropriate benchmark indices, over appropriate time periods that may include full market cycles, taking into account relevant factors including the following: general market conditions; issuer-specific information; and fund cash flows and other factors.
The Independent Trustees recognize that shareholders evaluate performance on a net basis over their own holding periods, for which one-, three-, and five-year periods are often used as a proxy. For this reason, the performance information reviewed by the Board also included net cumulative total return information for the fund and an appropriate benchmark index for the most recent one-, three-, and five-year periods ended June 30, 2018, as shown below.
Utilities Portfolio
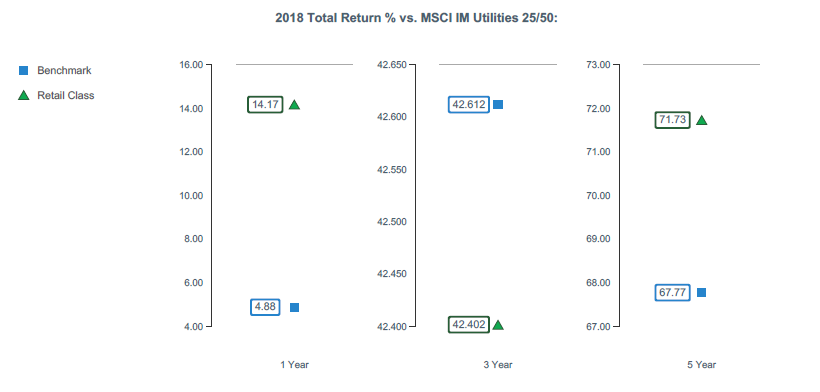
Based on its review, the Board concluded that the nature, extent, and quality of services provided to the fund under the Advisory Contracts should continue to benefit the shareholders of the fund.
Competitiveness of Management Fee and Total Expense Ratio. The Board considered the fund's management fee and total expense ratio compared to "mapped groups" of competitive funds and classes created for the purpose of facilitating the Trustees' competitive analysis of management fees and total expenses. Fidelity creates "mapped groups" by combining similar Lipper investment objective categories that have comparable investment mandates. For this purpose, all sector focused equity funds are grouped in the same mapped group. Combining Lipper investment objective categories aids the Board's management fee and total expense ratio comparisons by broadening the competitive group used for comparison.
Management Fee. The Board considered two proprietary management fee comparisons for the 12-month periods ended June 30 shown in basis points (BP) in the chart below. The group of Lipper funds used by the Board for management fee comparisons is referred to below as the "Total Mapped Group." The Total Mapped Group comparison focuses on a fund's standing in terms of gross management fees before expense reimbursements or caps relative to the total universe of funds with comparable investment mandates (i.e., sector equities), regardless of whether their management fee structures also are comparable. Funds with comparable management fee structures have similar management fee contractual arrangements (
e.g., flat rate charged for advisory services, all-inclusive fee rate,
etc.). "TMG %" represents the percentage of funds in the Total Mapped Group that had management fees that were lower than the fund's. For example, a hypothetical TMG % of 20% would mean that 80% of the funds in the Total Mapped Group had higher, and 20% had lower, management fees than the fund. The fund's actual TMG %s and the number of funds in the Total Mapped Group are in the chart below. The "Asset-Size Peer Group" (ASPG) comparison focuses on a fund's standing relative to a subset of non-Fidelity funds within the Total Mapped Group that are similar in size and management fee structure. For example, if a fund is in the first quartile of the ASPG, the fund's management fee ranks in the least expensive or lowest 25% of funds in the ASPG. The ASPG represents at least 15% of the funds in the Total Mapped Group with comparable asset size and management fee structures, subject to a minimum of 50 funds (or all funds in the Total Mapped Group if fewer than 50). Additional information, such as the ASPG quartile in which the fund's management fee rate ranked, is also included in the chart and was considered by the Board.
Utilities Portfolio
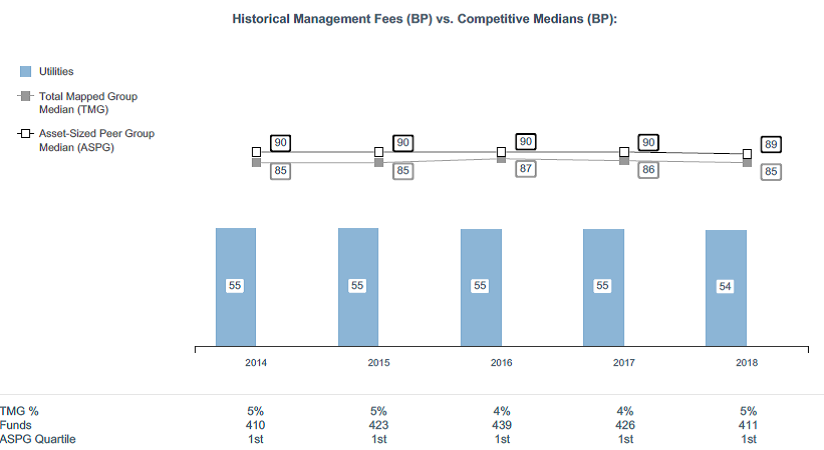
The Board noted that the fund's management fee rate ranked below the median of its Total Mapped Group and below the median of its ASPG for the 12-month period ended June 30, 2018.
The Board noted that it and the boards of other Fidelity funds formed an ad hoc Committee on Group Fee, which meets periodically, to conduct an in-depth review of the "group fee" component of the management fee of funds with such management fee structures. The Committee's focus included the mechanics of the group fee, the competitive landscape of group fee structures, Fidelity funds with no group fee component and investment products not included in group fee assets. The Board also considered that, for funds subject to the group fee, FMR agreed to voluntarily waive fees over a specified period of time in amounts designed to account for assets converted from certain funds to certain collective investment trusts.
Based on its review, the Board concluded that the fund's management fee is fair and reasonable in light of the services that the fund receives and the other factors considered.
Total Expense Ratio. In its review of the fund's total expense ratio, the Board considered the fund's management fee rate as well as other fund expenses, such as transfer agent fees, pricing and bookkeeping fees, and custodial, legal, and audit fees. The Board also noted that Fidelity may agree to waive fees and expenses from time to time, and the extent to which, if any, it has done so for the fund. As part of its review, the Board also considered the current and historical total expense ratios of the fund compared to competitive fund median expenses. The fund is compared to those funds and classes in the Total Mapped Group (used by the Board for management fee comparisons) that have a similar sales load structure.
The Board noted that the fund's total expense ratio ranked below the competitive median for the 12-month period ended June 30, 2018.
Fees Charged to Other Fidelity Clients. The Board also considered Fidelity fee structures and other information with respect to clients of Fidelity, such as other funds advised or subadvised by Fidelity, pension plan clients, and other institutional clients with similar mandates. The Board noted that a joint ad hoc committee created by it and the boards of other Fidelity funds periodically reviews and compares Fidelity's institutional investment advisory business with its business of providing services to the Fidelity funds and also noted the most recent findings of the committee. The Board noted that the committee's review included a consideration of the differences in services provided, fees charged, and costs incurred, as well as competition in the markets serving the different categories of clients.
Based on its review of total expense ratios and fees charged to other Fidelity clients, the Board concluded that the fund's total expense ratio was reasonable in light of the services that the fund and its shareholders receive and the other factors considered.
Costs of the Services and Profitability. The Board considered the revenues earned and the expenses incurred by Fidelity in conducting the business of developing, marketing, distributing, managing, administering and servicing the fund and servicing the fund's shareholders. The Board also considered the level of Fidelity's profits in respect of all the Fidelity funds.
On an annual basis, Fidelity presents to the Board information about the profitability of its relationships with the fund. Fidelity calculates profitability information for each fund, as well as aggregate profitability information for groups of Fidelity funds and all Fidelity funds, using a series of detailed revenue and cost allocation methodologies which originate with the books and records of Fidelity on which Fidelity's audited financial statements are based. The Audit Committee of the Board reviews any significant changes from the prior year's methodologies.
PricewaterhouseCoopers LLP (PwC), auditor to Fidelity and certain Fidelity funds, has been engaged annually by the Board as part of the Board's assessment of Fidelity's profitability analysis. PwC's engagement includes the review and assessment of the methodologies used by Fidelity in determining the revenues and expenses attributable to Fidelity's mutual fund business, and completion of agreed-upon procedures in respect of the mathematical accuracy of the fund profitability information and its conformity to established allocation methodologies. After considering PwC's reports issued under the engagement and information provided by Fidelity, the Board concluded that while other allocation methods may also be reasonable, Fidelity's profitability methodologies are reasonable in all material respects.
The Board also reviewed Fidelity's non-fund businesses and potential indirect benefits such businesses may have received as a result of their association with Fidelity's mutual fund business (i.e., fall-out benefits) as well as cases where Fidelity's affiliates may benefit from the fund's business. The Board noted that changes to fall-out benefits year-over-year reflect business developments at Fidelity's various businesses.
The Board considered the costs of the services provided by and the profits realized by Fidelity in connection with the operation of the fund and was satisfied that the profitability was not excessive.
Economies of Scale. The Board considered whether there have been economies of scale in respect of the management of the Fidelity funds, whether the Fidelity funds (including the fund) have appropriately benefited from any such economies of scale, and whether there is potential for realization of any further economies of scale. The Board considered the extent to which the fund will benefit from economies of scale as assets grow through increased services to the fund, through waivers or reimbursements, or through fee or expense ratio reductions. The Board also noted that a committee (the Economies of Scale Committee) created by it and the boards of other Fidelity funds periodically analyzes whether Fidelity attains economies of scale in respect of the management and servicing of the Fidelity funds, whether the Fidelity funds have appropriately benefited from such economies of scale, and whether there is potential for realization of any further economies of scale.
The Board recognized that the fund's management contract incorporates a "group fee" structure, which provides for lower group fee rates as total group assets increase, and for higher group fee rates as total group assets decrease (with "group assets" defined to include fund assets under SelectCo's management plus assets under FMR's management). SelectCo calculates the group fee rates based on a tiered asset "breakpoint" schedule that varies based on asset class. The Board considered that the group fee is designed to deliver the benefits of economies of scale to fund shareholders when total group assets increase, even if assets of any particular fund are unchanged or have declined, because some portion of Fidelity's costs are attributable to services provided to all Fidelity funds, and all funds benefit if those costs can be allocated among more assets. The Board concluded that, given the group fee structure, fund shareholders will benefit from lower management fees as group assets increase at the fund complex level, regardless of whether Fidelity achieves any such economies of scale.
The Board concluded, taking into account the analysis of the Economies of Scale Committee, that economies of scale, if any, are being appropriately shared between fund shareholders and Fidelity.
Additional Information Requested by the Board. In order to develop fully the factual basis for consideration of the Fidelity funds' advisory contracts, the Board requested and received additional information on certain topics, including: (i) fund performance trends, in particular the underperformance of certain funds, and Fidelity's long-term strategies for certain funds; (ii) Fidelity's fund profitability methodology, profitability trends for certain funds, and the impact of certain factors on fund profitability results; (iii) metrics for evaluating index fund and ETF performance and information about ETF trading characteristics; (iv) the methodology with respect to the evaluation of competitive fund data and peer group classifications and fee comparisons; (v) the expense structures for different funds and classes; (vi) information regarding other accounts managed by Fidelity, including collective investment trusts; and (vii) Fidelity's philosophies and strategies for evaluating funds and classes with lower or declining asset levels.
Based on its evaluation of all of the conclusions noted above, and after considering all factors it believed relevant, the Board concluded that the advisory fee arrangements are fair and reasonable, and that the fund's Advisory Contracts should be renewed.
SELUTL-ANN-0419
1.813626.114
Item 2.
Code of Ethics
As of the end of the period, February 28, 2019, Fidelity Select Portfolios (the trust) has adopted a code of ethics, as defined in Item 2 of Form N-CSR, that applies to its President and Treasurer and its Chief Financial Officer. A copy of the code of ethics is filed as an exhibit to this Form N-CSR.
Item 3.
Audit Committee Financial Expert
The Board of Trustees of the trust has determined that Joseph Mauriello is an audit committee financial expert, as defined in Item 3 of Form N-CSR. Mr. Mauriello is independent for purposes of Item 3 of Form N-CSR.
Item 4.
Principal Accountant Fees and Services
Fees and Services
The following table presents fees billed by PricewaterhouseCoopers LLP (“PwC”) in each of the last two fiscal years for services rendered to Air Transportation Portfolio, Automotive Portfolio, Banking Portfolio, Biotechnology Portfolio, Brokerage and Investment Management Portfolio, Chemicals Portfolio, Communication Services Portfolio, Communications Equipment Portfolio, Computers Portfolio, Construction and Housing Portfolio, Consumer Discretionary Portfolio, Consumer Finance Portfolio, Consumer Staples Portfolio, Defense and Aerospace Portfolio, Energy Portfolio, Energy Service Portfolio, Environment and Alternative Energy Portfolio, Financial Services Portfolio, Gold Portfolio, Health Care Portfolio, Health Care Services Portfolio, Industrials Portfolio, Insurance Portfolio, IT Services Portfolio, Leisure Portfolio, Materials Portfolio, Medical Technology and Devices Portfolio, Natural Gas Portfolio, Natural Resources Portfolio, Pharmaceuticals Portfolio, Retailing Portfolio, Semiconductors Portfolio, Software and IT Services Portfolio, Technology Portfolio, Telecommunications Portfolio, Transportation Portfolio, Utilities Portfolio and Wireless Portfolio (the “Funds”):
Services Billed by PwC
February 28, 2019 FeesA
| | | | |
| Audit Fees | Audit-Related Fees | Tax Fees | All Other Fees |
Air Transportation Portfolio | $34,000 | $2,800 | $2,600 | $1,400 |
Automotive Portfolio | $34,000 | $2,800 | $2,600 | $1,400 |
Banking Portfolio | $34,000 | $2,800 | $3,700 | $1,400 |
Biotechnology Portfolio | $65,000 | $5,300 | $32,800 | $2,600 |
Brokerage and Investment Management Portfolio | $34,000 | $2,800 | $3,400 | $1,400 |
Chemicals Portfolio | $33,000 | $2,800 | $2,800 | $1,400 |
Communication Services Portfolio | $41,000 | $2,900 | $2,600 | $1,400 |
Communications Equipment Portfolio | $34,000 | $2,800 | $2,600 | $1,400 |
Computers Portfolio | $34,000 | $2,900 | $3,500 | $1,400 |
Construction and Housing Portfolio | $33,000 | $2,800 | $2,600 | $1,300 |
Consumer Discretionary Portfolio | $36,000 | $2,800 | $2,600 | $1,400 |
Consumer Finance Portfolio | $35,000 | $2,800 | $2,600 | $1,400 |
Consumer Staples Portfolio | $43,000 | $3,200 | $2,600 | $1,500 |
Defense and Aerospace Portfolio | $34,000 | $2,800 | $2,600 | $1,400 |
Energy Portfolio | $37,000 | $2,900 | $3,000 | $1,400 |
Energy Service Portfolio | $34,000 | $2,900 | $3,000 | $1,400 |
Environment and Alternative Energy Portfolio | $33,000 | $2,800 | $2,600 | $1,400 |
Financial Services Portfolio | $37,000 | $2,900 | $2,600 | $1,400 |
Gold Portfolio | $59,000 | $4,900 | $6,900 | $2,400 |
Health Care Portfolio | $40,000 | $3,100 | $2,600 | $1,500 |
Health Care Services Portfolio | $34,000 | $2,800 | $2,600 | $1,400 |
Industrials Portfolio | $38,000 | $2,800 | $2,600 | $1,400 |
Insurance Portfolio | $34,000 | $2,800 | $3,700 | $1,400 |
IT Services Portfolio | $34,000 | $2,800 | $2,600 | $1,400 |
Leisure Portfolio | $34,000 | $2,800 | $2,800 | $1,400 |
Materials Portfolio | $44,000 | $3,200 | $2,600 | $1,500 |
Medical Technology and Devices Portfolio | $34,000 | $2,800 | $2,600 | $1,400 |
Natural Gas Portfolio | $33,000 | $2,800 | $2,800 | $1,400 |
Natural Resources Portfolio | $33,000 | $2,700 | $2,800 | $1,300 |
Pharmaceuticals Portfolio | $33,000 | $2,800 | $2,600 | $1,400 |
Retailing Portfolio | $34,000 | $2,800 | $2,600 | $1,400 |
Semiconductors Portfolio | $34,000 | $2,800 | $3,500 | $1,400 |
Software and IT Services Portfolio | $33,000 | $2,800 | $2,600 | $1,300 |
Technology Portfolio | $40,000 | $3,100 | $2,600 | $1,500 |
Telecommunications Portfolio | $43,000 | $3,100 | $2,600 | $1,500 |
Transportation Portfolio | $34,000 | $2,800 | $2,600 | $1,400 |
Utilities Portfolio | $36,000 | $2,800 | $2,600 | $1,400 |
Wireless Portfolio | $33,000 | $2,700 | $2,600 | $1,300 |
| | | | |
| Audit Fees | Audit-Related Fees | Tax Fees | All Other Fees |
Air Transportation Portfolio | $33,000 | $3,000 | $2,600 | $1,300 |
Automotive Portfolio | $33,000 | $3,000 | $2,600 | $1,200 |
Banking Portfolio | $32,000 | $3,000 | $2,800 | $1,200 |
Biotechnology Portfolio | $63,000 | $4,300 | $48,200 | $1,800 |
Brokerage and Investment Management Portfolio | $33,000 | $3,000 | $2,800 | $1,300 |
Chemicals Portfolio | $33,000 | $3,000 | $2,800 | $1,200 |
Communication Services Portfolio | $32,000 | $3,000 | $3,300 | $1,200 |
Communications Equipment Portfolio | $33,000 | $3,000 | $2,600 | $1,200 |
Computers Portfolio | $34,000 | $3,000 | $2,600 | $1,300 |
Construction and Housing Portfolio | $33,000 | $2,900 | $2,600 | $1,200 |
Consumer Discretionary Portfolio | $35,000 | $3,000 | $5,100 | $1,200 |
Consumer Finance Portfolio | $34,000 | $3,000 | $3,700 | $1,300 |
Consumer Staples Portfolio | $39,000 | $3,400 | $5,100 | $1,400 |
Defense and Aerospace Portfolio | $33,000 | $3,000 | $2,600 | $1,300 |
Energy Portfolio | $36,000 | $3,100 | $6,400 | $1,300 |
Energy Service Portfolio | $33,000 | $3,000 | $2,800 | $1,300 |
Environment and Alternative Energy Portfolio | $32,000 | $3,000 | $2,600 | $1,200 |
Financial Services Portfolio | $36,000 | $3,000 | $5,300 | $1,300 |
Gold Portfolio | $54,000 | $5,100 | $6,900 | $2,100 |
Health Care Portfolio | $39,000 | $3,300 | $5,100 | $1,400 |
Health Care Services Portfolio | $33,000 | $3,000 | $2,600 | $1,200 |
Industrials Portfolio | $35,000 | $3,000 | $5,100 | $1,200 |
Insurance Portfolio | $33,000 | $3,000 | $2,800 | $1,300 |
IT Services Portfolio | $33,000 | $3,000 | $2,600 | $1,300 |
Leisure Portfolio | $33,000 | $3,000 | $2,800 | $1,300 |
Materials Portfolio | $40,000 | $3,400 | $5,800 | $1,400 |
Medical Technology and Devices Portfolio | $32,000 | $3,000 | $2,600 | $1,200 |
Natural Gas Portfolio | $32,000 | $3,000 | $2,800 | $1,200 |
Natural Resources Portfolio | $32,000 | $2,900 | $4,600 | $1,200 |
Pharmaceuticals Portfolio | $32,000 | $3,000 | $2,600 | $1,200 |
Retailing Portfolio | $33,000 | $3,000 | $2,600 | $1,300 |
Semiconductors Portfolio | $34,000 | $3,000 | $2,600 | $1,300 |
Software and IT Services Portfolio | $32,000 | $2,900 | $2,600 | $1,200 |
Technology Portfolio | $36,000 | $3,300 | $2,600 | $1,400 |
Telecommunications Portfolio | $40,000 | $3,300 | $5,100 | $1,400 |
Transportation Portfolio | $32,000 | $3,000 | $2,600 | $1,200 |
Utilities Portfolio | $35,000 | $3,000 | $5,100 | $1,200 |
Wireless Portfolio | $32,000 | $2,900 | $3,300 | $1,200 |
AAmounts may reflect rounding.
The following table presents fees billed by PwC that were required to be approved by the Audit Committee for services that relate directly to the operations and financial reporting of the Funds and that are rendered on behalf of Fidelity SelectCo, LLC (“SelectCo”) and entities controlling, controlled by, or under common control with SelectCo (not including any sub-adviser whose role is primarily portfolio management and is subcontracted with or overseen by another investment adviser) that provide ongoing services to the Funds (“Fund Service Providers”):
Services Billed by PwC
| | |
| February 28, 2019A | February 28, 2018A |
Audit-Related Fees | $7,930,000 | $8,360,000 |
Tax Fees | $15,000 | $30,000 |
All Other Fees | $- | $- |
A Amounts may reflect rounding.
“Audit-Related Fees” represent fees billed for assurance and related services that are reasonably related to the performance of the fund audit or the review of the fund's financial statements and that are not reported under Audit Fees.
“Tax Fees” represent fees billed for tax compliance, tax advice or tax planning that relate directly to the operations and financial reporting of the fund.
“All Other Fees” represent fees billed for services provided to the fund or Fund Service Provider, a significant portion of which are assurance related, that relate directly to the operations and financial reporting of the fund, excluding those services that are reported under Audit Fees, Audit-Related Fees or Tax Fees.
Assurance services must be performed by an independent public accountant.
* * *
The aggregate non-audit fees billed by PwC for services rendered to the Funds, SelectCo (not including any sub-adviser whose role is primarily portfolio management and is subcontracted with or overseen by another investment adviser), and any Fund Service Provider for each of the last two fiscal years of the Funds are as follows:
| | |
Billed By | February 28, 2019A | February 28, 2018A |
PwC | $11,430,000 | $11,090,000 |
A Amounts may reflect rounding.
The trust's Audit Committee has considered non-audit services that were not pre-approved that were provided by PwC to Fund Service Providers to be compatible with maintaining the independence of PwC in its audit of the Funds, taking into account representations from PwC, in accordance with Public Company Accounting Oversight Board rules, regarding its independence from the Funds and their related entities and SelectCo’s review of the appropriateness and permissibility under applicable law of such non-audit services prior to their provision to the Fund Service Providers.
Audit Committee Pre-Approval Policies and Procedures
The trust’s Audit Committee must pre-approve all audit and non-audit services provided by a fund’s independent registered public accounting firm relating to the operations or financial reporting of the fund. Prior to the commencement of any audit or non-audit services to a fund, the Audit Committee reviews the services to determine whether they are appropriate and permissible under applicable law.
The Audit Committee has adopted policies and procedures to, among other purposes, provide a framework for the Committee’s consideration of non-audit services by the audit firms that audit the Fidelity funds. The policies and procedures require that any non-audit service provided by a fund audit firm to a Fidelity fund and any non-audit service provided by a fund auditor to a Fund Service Provider that relates directly to the operations and financial reporting of a Fidelity fund (“Covered Service”) are subject to approval by the Audit Committee before such service is provided.
All Covered Services must be approved in advance of provision of the service either: (i) by formal resolution of the Audit Committee, or (ii) by oral or written approval of the service by the Chair of the Audit Committee (or if the Chair is unavailable, such other member of the Audit Committee as may be designated by the Chair to act in the Chair’s absence). The approval contemplated by (ii) above is permitted where the Treasurer determines that action on such an engagement is necessary before the next meeting of the Audit Committee.
Non-audit services provided by a fund audit firm to a Fund Service Provider that do not relate directly to the operations and financial reporting of a Fidelity fund are reported to the Audit Committee periodically.
Non-Audit Services Approved Pursuant to Rule 2-01(c)(7)(i)(C) and (ii) of Regulation S-X (“De Minimis Exception”)
There were no non-audit services approved or required to be approved by the Audit Committee pursuant to the De Minimis Exception during the Funds’ last two fiscal years relating to services provided to (i) the Funds or (ii) any Fund Service Provider that relate directly to the operations and financial reporting of the Funds.
Item 5.
Audit Committee of Listed Registrants
Not applicable.
Item 6.
Investments
(a)
Not applicable.
(b)
Not applicable
Item 7.
Disclosure of Proxy Voting Policies and Procedures for Closed-End Management Investment Companies
Not applicable.
Item 8.
Portfolio Managers of Closed-End Management Investment Companies
Not applicable.
Item 9.
Purchase of Equity Securities by Closed-End Management Investment Company and Affiliated Purchasers
Not applicable.
Item 10.
Submission of Matters to a Vote of Security Holders
There were no material changes to the procedures by which shareholders may recommend nominees to the trust’s Board of Trustees.
Item 11.
Controls and Procedures
(a)(i) The President and Treasurer and the Chief Financial Officer have concluded that the trust’s disclosure controls and procedures (as defined in Rule 30a-3(c) under the Investment Company Act) provide reasonable assurances that material information relating to the trust is made known to them by the appropriate persons, based on their evaluation of these controls and procedures as of a date within 90 days of the filing date of this report.
(a)(ii) There was no change in the trust’s internal control over financial reporting (as defined in Rule 30a-3(d) under the Investment Company Act) that occurred during the period covered by this report that has materially affected, or is reasonably likely to materially affect, the trust’s internal control over financial reporting.
Item 12.
Disclosure of Securities Lending Activities for Closed-End Management
Investment Companies
Not applicable.
Item 13.
Exhibits
| | |
(a) | (1) | Code of Ethics pursuant to Item 2 of Form N-CSR is filed and attached hereto as EX-99.CODE ETH. |
(a) | (2) | Certification pursuant to Rule 30a-2(a) under the Investment Company Act of 1940 (17 CFR 270.30a-2(a)) is filed and attached hereto as Exhibit 99.CERT. |
(a) | (3) | Not applicable. |
(b) | | Certification pursuant to Rule 30a-2(b) under the Investment Company Act of 1940 (17 CFR 270.30a-2(b)) is furnished and attached hereto as Exhibit 99.906CERT. |
SIGNATURES
Pursuant to the requirements of the Securities Exchange Act of 1934 and the Investment Company Act of 1940, the registrant has duly caused this report to be signed on its behalf by the undersigned, thereunto duly authorized.
Fidelity Select Portfolios
| |
By: | /s/Stacie M. Smith |
| Stacie M. Smith |
| President and Treasurer |
| |
Date: | April 24, 2019 |
Pursuant to the requirements of the Securities Exchange Act of 1934 and the Investment Company Act of 1940, this report has been signed below by the following persons on behalf of the registrant and in the capacities and on the dates indicated.
| |
By: | /s/Stacie M. Smith |
| Stacie M. Smith |
| President and Treasurer |
| |
Date: | April 24, 2019 |
| |
By: | /s/John J. Burke III |
| John J. Burke III |
| Chief Financial Officer |
| |
Date: | April 24, 2019 |