UNITED STATES
SECURITIES AND EXCHANGE COMMISSION
Washington, D.C. 20549
FORM N-CSR
CERTIFIED SHAREHOLDER REPORT OF REGISTERED
MANAGEMENT INVESTMENT COMPANIES
Investment Company Act file number 811-3114
Fidelity Select Portfolios
(Exact name of registrant as specified in charter)
245 Summer St., Boston, Massachusetts 02210
(Address of principal executive offices) (Zip code)
Marc Bryant, Secretary
245 Summer St.
Boston, Massachusetts 02210
(Name and address of agent for service)
Registrant's telephone number, including area code:
617-563-7000
| |
Date of fiscal year end: | July 31 |
| |
Date of reporting period: | July 31, 2018 |
Item 1.
Reports to Stockholders
Fidelity Flex℠ Funds Fidelity Flex℠ Real Estate Fund
Annual Report July 31, 2018 |
 |
Contents
To view a fund's proxy voting guidelines and proxy voting record for the 12-month period ended June 30, visit http://www.fidelity.com/proxyvotingresults or visit the Securities and Exchange Commission's (SEC) web site at http://www.sec.gov.
You may also call 1-800-835-5092 to request a free copy of the proxy voting guidelines.
Standard & Poor's, S&P and S&P 500 are registered service marks of The McGraw-Hill Companies, Inc. and have been licensed for use by Fidelity Distributors Corporation.
Other third-party marks appearing herein are the property of their respective owners.
All other marks appearing herein are registered or unregistered trademarks or service marks of FMR LLC or an affiliated company. © 2018 FMR LLC. All rights reserved.
This report and the financial statements contained herein are submitted for the general information of the shareholders of the Fund. This report is not authorized for distribution to prospective investors in the Fund unless preceded or accompanied by an effective prospectus.
A fund files its complete schedule of portfolio holdings with the SEC for the first and third quarters of each fiscal year on Form N-Q. Forms N-Q are available on the SEC’s web site at http://www.sec.gov. A fund's Forms N-Q may be reviewed and copied at the SEC’s Public Reference Room in Washington, DC. Information regarding the operation of the SEC's Public Reference Room may be obtained by calling 1-800-SEC-0330.
For a complete list of a fund's portfolio holdings, view the most recent holdings listing, semiannual report, or annual report on Fidelity's web site at http://www.fidelity.com, http://www.institutional.fidelity.com, or http://www.401k.com, as applicable.
NOT FDIC INSURED •MAY LOSE VALUE •NO BANK GUARANTEE
Neither the Fund nor Fidelity Distributors Corporation is a bank.
Performance: The Bottom Line
Average annual total return reflects the change in the value of an investment, assuming reinvestment of distributions from dividend income and capital gains (the profits earned upon the sale of securities that have grown in value, if any) and assuming a constant rate of performance each year. The hypothetical investment and the average annual total returns do not reflect the deduction of taxes that a shareholder would pay on fund distributions or the redemption of fund shares. During periods of reimbursement by Fidelity, a fund’s total return will be greater than it would be had the reimbursement not occurred. How a fund did yesterday is no guarantee of how it will do tomorrow.
Average Annual Total Returns
| For the periods ended July 31, 2018 | Past 1 year | Life of fundA |
| Fidelity Flex℠ Real Estate Fund | 3.28% | 5.25% |
A From March 8, 2017
$10,000 Over Life of Fund
Let's say hypothetically that $10,000 was invested in Fidelity Flex℠ Real Estate Fund on March 8, 2017, when the fund started.
The chart shows how the value of your investment would have changed, and also shows how the Dow Jones U.S. Select Real Estate Securities Index℠ performed over the same period.
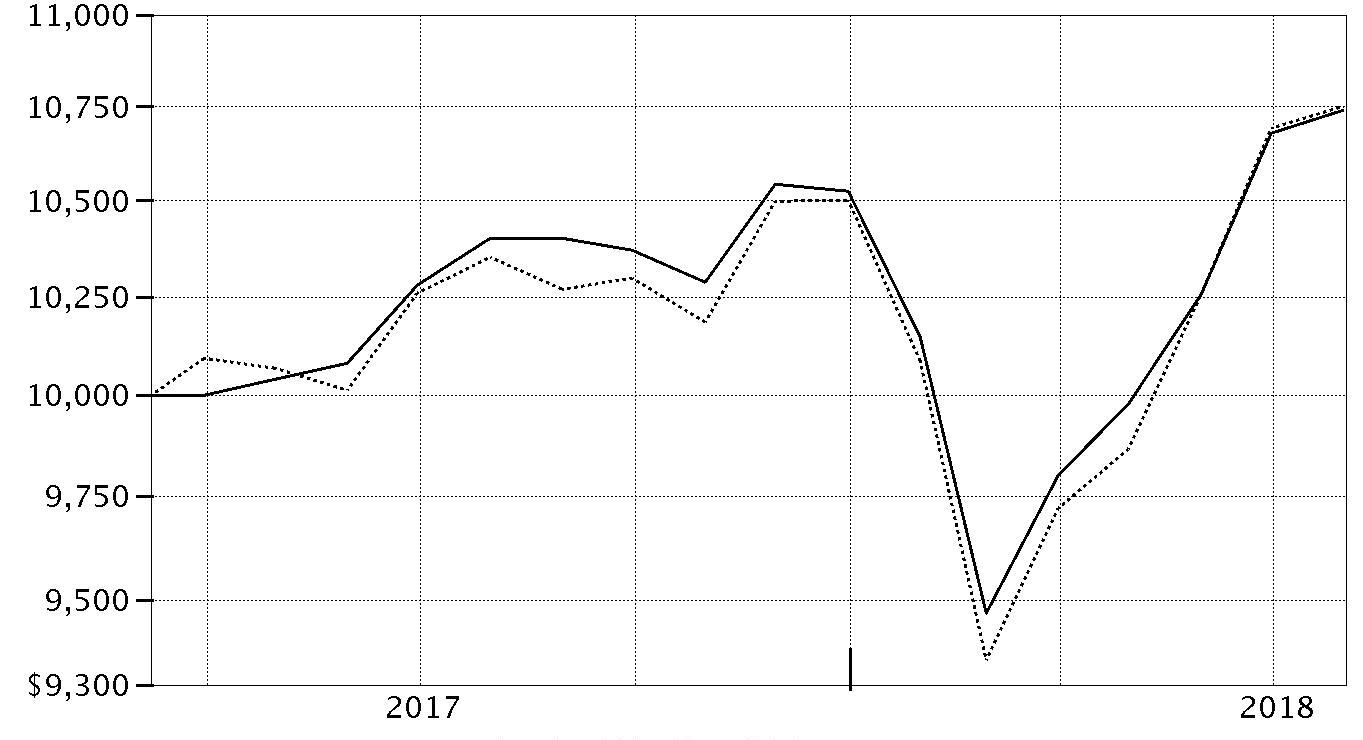
| Period Ending Values |
| $10,742 | Fidelity Flex℠ Real Estate Fund |
| $10,752 | Dow Jones U.S. Select Real Estate Securities Index℠ |
Management's Discussion of Fund Performance
Market Recap: The U.S. equity bellwether S&P 500
® index gained 16.24% for the 12 months ending July 31, 2018, despite a resurgence in volatility that challenged the multiyear bull market. Stocks maintained their steady growth until a sharp reversal in February, as volatility spiked amid fear that rising inflation and the potential for the economy to overheat would prompt the U.S. Federal Reserve to pick up the pace of interest rate hikes. The index posted its first negative monthly result since October 2016, and then lost further ground in March on fear of a global trade war. The market stabilized in April and turned upward through mid-June, when escalating trade tension between the U.S. and China soured investor sentiment. The resulting uncertainty lingered into July, but strong corporate earnings helped the S&P 500 rise 3.72% that month to cap the period. For the full one-year period, growth handily topped value, while small-caps bested large-caps. By sector, information technology (+28%) led the way, boosted by strong earnings growth from several major index constituents. Consumer discretionary rose roughly 24%, driven by retailers (+49%). Energy (+20%) gained alongside higher oil prices. Laggards were telecommunication services (-2%), consumer staples (0%) and utilities (+3%), defensive groups that struggled amid rising interest rates and a general preference for risk. Real estate (+5%) fared a bit better but still lagged, as did financials, industrials, health care (each up 13%) and materials (+11%).
Comments from Portfolio Manager Steven Buller: For the fiscal year, the fund gained 3.28%, trailing the 3.85% return of the benchmark Dow Jones U.S. Select Real Estate Securities Index℠ and significantly lagging the broad-based S&P 500
®. The fund's underperformance of the Dow Jones real estate index the past 12 months was mostly due to underweightings in the strong hotels and self-storage groups. Subpar security selection among retail real estate investment trusts (REITs) also detracted from our relative result. However, the fund was well-positioned in the lagging diversified segment, where a combination of strong security selection and an underweighting added value versus the benchmark. Overweighting the strong industrial/office category also contributed, as did an underweighting in the weak health care REIT group. Here, an overweighting in Ventas, one of the fund's largest holdings, detracted, although we benefited from lacking exposure to another poor-performing benchmark component, HCP. Another detractor was mall owner Macerich, which, in hindsight, I bought and sold at inopportune times. In self storage, lacking exposure to index components Life Storage and CubeSmart and underweighting Public Storage for most of the period hurt relative performance. Over time, I added to Public Storage, one of our largest holdings on July 31. An overweight in Extra Space Storage added value. Among industrial REITs, DCT was a notable contributor, as it agreed to be acquired at a premium price during the period. Another industrial REIT, Duke Realty, further lifted the fund's relative result.
The views expressed above reflect those of the portfolio manager(s) only through the end of the period as stated on the cover of this report and do not necessarily represent the views of Fidelity or any other person in the Fidelity organization. Any such views are subject to change at any time based upon market or other conditions and Fidelity disclaims any responsibility to update such views. These views may not be relied on as investment advice and, because investment decisions for a Fidelity fund are based on numerous factors, may not be relied on as an indication of trading intent on behalf of any Fidelity fund.
Investment Summary (Unaudited)
Top Ten Stocks as of July 31, 2018
| | % of fund's net assets |
| Simon Property Group, Inc. | 8.8 |
| Prologis, Inc. | 7.3 |
| Public Storage | 5.5 |
| Boston Properties, Inc. | 4.9 |
| UDR, Inc. | 4.9 |
| Duke Realty Corp. | 4.7 |
| Equity Residential (SBI) | 4.1 |
| Ventas, Inc. | 4.1 |
| AvalonBay Communities, Inc. | 3.9 |
| Digital Realty Trust, Inc. | 3.9 |
| | 52.1 |
Top Five REIT Sectors as of July 31, 2018
| | % of fund's net assets |
| REITs - Apartments | 19.2 |
| REITs - Office Property | 13.8 |
| REITs - Diversified | 11.9 |
| REITs - Regional Malls | 10.2 |
| REITs - Warehouse/Industrial | 9.2 |
Asset Allocation (% of fund's net assets)
| As of July 31, 2018* |
| | Stocks | 99.0% |
| | Short-Term Investments and Net Other Assets (Liabilities) | 1.0% |

* Foreign investments - 0.5%
Schedule of Investments July 31, 2018
Showing Percentage of Net Assets
| Common Stocks - 99.0% | | | |
| | | Shares | Value |
| Equity Real Estate Investment Trusts (REITs) - 98.0% | | | |
| REITs - Apartments - 19.2% | | | |
| American Homes 4 Rent Class A | | 478 | $10,583 |
| Apartment Investment & Management Co. Class A | | 155 | 6,611 |
| AvalonBay Communities, Inc. | | 159 | 28,119 |
| Camden Property Trust (SBI) | | 131 | 12,129 |
| Equity Residential (SBI) | | 447 | 29,247 |
| Essex Property Trust, Inc. | | 65 | 15,629 |
| UDR, Inc. | | 903 | 34,747 |
| | | | 137,065 |
| REITs - Diversified - 11.4% | | | |
| Cousins Properties, Inc. | | 463 | 4,315 |
| Crown Castle International Corp. | | 32 | 3,547 |
| Digital Realty Trust, Inc. | | 226 | 27,441 |
| Duke Realty Corp. | | 1,136 | 33,080 |
| Equinix, Inc. | | 20 | 8,786 |
| Washington REIT (SBI) | | 124 | 3,781 |
| | | | 80,950 |
| REITs - Health Care - 8.0% | | | |
| Healthcare Trust of America, Inc. | | 87 | 2,377 |
| Ventas, Inc. | | 512 | 28,867 |
| Welltower, Inc. | | 413 | 25,854 |
| | | | 57,098 |
| REITs - Hotels - 5.8% | | | |
| Braemar Hotels & Resorts, Inc. | | 120 | 1,372 |
| DiamondRock Hospitality Co. | | 742 | 8,845 |
| Host Hotels & Resorts, Inc. | | 1,123 | 23,516 |
| Park Hotels & Resorts, Inc. | | 69 | 2,158 |
| RLJ Lodging Trust | | 244 | 5,512 |
| | | | 41,403 |
| REITs - Manufactured Homes - 5.2% | | | |
| Equity Lifestyle Properties, Inc. | | 242 | 22,020 |
| Sun Communities, Inc. | | 155 | 15,029 |
| | | | 37,049 |
| REITs - Office Property - 13.8% | | | |
| Boston Properties, Inc. | | 280 | 35,148 |
| Brandywine Realty Trust (SBI) | | 649 | 10,702 |
| Douglas Emmett, Inc. | | 239 | 9,283 |
| Highwoods Properties, Inc. (SBI) | | 146 | 7,170 |
| Hudson Pacific Properties, Inc. | | 237 | 8,120 |
| Piedmont Office Realty Trust, Inc. Class A | | 321 | 6,349 |
| SL Green Realty Corp. | | 179 | 18,457 |
| VEREIT, Inc. | | 453 | 3,456 |
| | | | 98,685 |
| REITs - Regional Malls - 10.2% | | | |
| Simon Property Group, Inc. | | 355 | 62,554 |
| The Macerich Co. | | 173 | 10,217 |
| | | | 72,771 |
| REITs - Shopping Centers - 6.1% | | | |
| Acadia Realty Trust (SBI) | | 314 | 8,503 |
| Brixmor Property Group, Inc. | | 440 | 7,784 |
| Kimco Realty Corp. | | 605 | 10,097 |
| Regency Centers Corp. | | 235 | 14,953 |
| Urban Edge Properties | | 111 | 2,517 |
| | | | 43,854 |
| REITs - Single Tenant - 0.6% | | | |
| Spirit Realty Capital, Inc. | | 488 | 4,085 |
| REITs - Storage - 8.5% | | | |
| Extra Space Storage, Inc. | | 224 | 21,049 |
| Public Storage | | 180 | 39,209 |
| | | | 60,258 |
| REITs - Warehouse/Industrial - 9.2% | | | |
| DCT Industrial Trust, Inc. | | 204 | 13,641 |
| Prologis, Inc. | | 793 | 52,037 |
| | | | 65,678 |
|
| TOTAL EQUITY REAL ESTATE INVESTMENT TRUSTS (REITS) | | | 698,896 |
|
| Real Estate Management & Development - 1.0% | | | |
| Real Estate Development - 0.5% | | | |
| Instone Real Estate Group BV (a) | | 144 | 3,705 |
| REITs - Diversified - 0.5% | | | |
| VICI Properties, Inc. | | 164 | 3,337 |
|
| TOTAL REAL ESTATE MANAGEMENT & DEVELOPMENT | | | 7,042 |
|
| TOTAL COMMON STOCKS | | | |
| (Cost $650,750) | | | 705,938 |
|
| Money Market Funds - 1.0% | | | |
| Fidelity Cash Central Fund, 1.96% (b) | | | |
| (Cost $7,023) | | 7,021 | 7,023 |
| TOTAL INVESTMENT IN SECURITIES - 100.0% | | | |
| (Cost $657,773) | | | 712,961 |
| NET OTHER ASSETS (LIABILITIES) - 0.0% | | | (356) |
| NET ASSETS - 100% | | | $712,605 |
Legend
(a) Security exempt from registration under Rule 144A of the Securities Act of 1933. These securities may be resold in transactions exempt from registration, normally to qualified institutional buyers. At the end of the period, the value of these securities amounted to $3,705 or 0.5% of net assets.
(b) Affiliated fund that is generally available only to investment companies and other accounts managed by Fidelity Investments. The rate quoted is the annualized seven-day yield of the fund at period end. A complete unaudited listing of the fund's holdings as of its most recent quarter end is available upon request. In addition, each Fidelity Central Fund's financial statements, which are not covered by the Fund's Report of Independent Registered Public Accounting Firm, are available on the SEC's website or upon request.
Affiliated Central Funds
Information regarding fiscal year to date income earned by the Fund from investments in Fidelity Central Funds is as follows:
| Fund | Income earned |
| Fidelity Cash Central Fund | $91 |
| Total | $91 |
Amounts in the income column in the above table include any capital gain distributions from underlying funds, which are presented in the corresponding line-item in the Statement of Operations if applicable.
Investment Valuation
All investments are categorized as Level 1 under the Fair Value Hierarchy. The inputs or methodology used for valuing securities may not be an indication of the risk associated with investing in those securities. For more information on valuation inputs please refer to the Investment Valuation section in the accompanying Notes to Financial Statements.
See accompanying notes which are an integral part of the financial statements.
Financial Statements
Statement of Assets and Liabilities
| | | July 31, 2018 |
| Assets | | |
Investment in securities, at value — See accompanying schedule:
Unaffiliated issuers (cost $650,750) | $705,938 | |
| Fidelity Central Funds (cost $7,023) | 7,023 | |
| Total Investment in Securities (cost $657,773) | | $712,961 |
| Receivable for investments sold | | 344 |
| Distributions receivable from Fidelity Central Funds | | 12 |
| Other receivables | | 5 |
| Total assets | | 713,322 |
| Liabilities | | |
| Payable for investments purchased | $717 | |
| Total liabilities | | 717 |
| Net Assets | | $712,605 |
| Net Assets consist of: | | |
| Paid in capital | | $675,644 |
| Undistributed net investment income | | 3,773 |
| Accumulated undistributed net realized gain (loss) on investments and foreign currency transactions | | (22,000) |
| Net unrealized appreciation (depreciation) on investments | | 55,188 |
| Net Assets, for 68,677 shares outstanding | | $712,605 |
| Net Asset Value, offering price and redemption price per share ($712,605 ÷ 68,677 shares) | | $10.38 |
See accompanying notes which are an integral part of the financial statements.
Statement of Operations
| | | Year ended July 31, 2018 |
| Investment Income | | |
| Dividends | | $10,890 |
| Income from Fidelity Central Funds | | 91 |
| Total income | | 10,981 |
| Expenses | | |
| Independent trustees' fees and expenses | $4 | |
| Miscellaneous | 20 | |
| Total expenses | | 24 |
| Net investment income (loss) | | 10,957 |
| Realized and Unrealized Gain (Loss) | | |
| Net realized gain (loss) on: | | |
| Investment securities: | | |
| Unaffiliated issuers | (21,737) | |
| Foreign currency transactions | (5) | |
| Total net realized gain (loss) | | (21,742) |
| Change in net unrealized appreciation (depreciation) on investment securities | | 48,537 |
| Net gain (loss) | | 26,795 |
| Net increase (decrease) in net assets resulting from operations | | $37,752 |
See accompanying notes which are an integral part of the financial statements.
Statement of Changes in Net Assets
| | Year ended July 31, 2018 | For the period
March 8, 2017 (commencement of operations) to July 31, 2017 |
| Increase (Decrease) in Net Assets | | |
| Operations | | |
| Net investment income (loss) | $10,957 | $2,678 |
| Net realized gain (loss) | (21,742) | 869 |
| Change in net unrealized appreciation (depreciation) | 48,537 | 6,651 |
| Net increase (decrease) in net assets resulting from operations | 37,752 | 10,198 |
| Distributions to shareholders from net investment income | (8,803) | (1,250) |
| Distributions to shareholders from net realized gain | (936) | – |
| Total distributions | (9,739) | (1,250) |
| Share transactions | | |
| Proceeds from sales of shares | 706,550 | 255,125 |
| Reinvestment of distributions | 9,739 | 1,250 |
| Cost of shares redeemed | (297,020) | – |
| Net increase (decrease) in net assets resulting from share transactions | 419,269 | 256,375 |
| Total increase (decrease) in net assets | 447,282 | 265,323 |
| Net Assets | | |
| Beginning of period | 265,323 | – |
| End of period | $712,605 | $265,323 |
| Other Information | | |
| Undistributed net investment income end of period | $3,773 | $1,428 |
| Shares | | |
| Sold | 72,635 | 25,513 |
| Issued in reinvestment of distributions | 962 | 123 |
| Redeemed | (30,556) | – |
| Net increase (decrease) | 43,041 | 25,636 |
See accompanying notes which are an integral part of the financial statements.
Financial Highlights
Fidelity Flex Real Estate Fund
| | | |
| Years ended July 31, | 2018 | 2017 A |
| Selected Per–Share Data | | |
| Net asset value, beginning of period | $10.35 | $10.00 |
| Income from Investment Operations | | |
| Net investment income (loss)B | .28 | .11 |
| Net realized and unrealized gain (loss) | .05 | .29 |
| Total from investment operations | .33 | .40 |
| Distributions from net investment income | (.26) | (.05) |
| Distributions from net realized gain | (.04) | – |
| Total distributions | (.30) | (.05) |
| Net asset value, end of period | $10.38 | $10.35 |
| Total ReturnC,D | 3.28% | 4.01% |
| Ratios to Average Net AssetsE,F | | |
| Expenses before reductions | .01% | - %G,H |
| Expenses net of fee waivers, if any | .01% | - %G,H |
| Expenses net of all reductions | .01% | - %G,H |
| Net investment income (loss) | 2.78% | 2.64%G |
| Supplemental Data | | |
| Net assets, end of period (000 omitted) | $713 | $265 |
| Portfolio turnover rateI | 91% | 9%J |
A For the period March 8, 2017 (commencement of operations) to July 31, 2017.
B Calculated based on average shares outstanding during the period.
C Total returns for periods of less than one year are not annualized.
D Total returns would have been lower if certain expenses had not been reduced during the applicable periods shown.
E Fees and expenses of any underlying Fidelity Central Funds are not included in the Fund's expense ratio. The Fund indirectly bears its proportionate share of the expenses of any underlying Fidelity Central Funds.
F Expense ratios reflect operating expenses of the Fund. Expenses before reductions do not reflect amounts reimbursed by the investment adviser or reductions from brokerage service arrangements or reductions from other expense offset arrangements and do not represent the amount paid by the Fund during periods when reimbursements or reductions occur. Expenses net of fee waivers reflect expenses after reimbursement by the investment adviser but prior to reductions from brokerage service arrangements or other expense offset arrangements. Expenses net of all reductions represent the net expenses paid by the Fund.
G Annualized
H Amount represents less than .005%.
I Amount does not include the portfolio activity of any underlying Fidelity Central Funds.
J Amount not annualized.
See accompanying notes which are an integral part of the financial statements.
Notes to Financial Statements
For the period ended July 31, 2018
1. Organization.
Fidelity Flex Real Estate Fund (the Fund) is a non-diversified fund of Fidelity Select Portfolios (the Trust) and is authorized to issue an unlimited number of shares. Share transactions on the Statement of Changes in Net Assets may contain exchanges between affiliated funds. The Trust is registered under the Investment Company Act of 1940, as amended (the 1940 Act), as an open-end management investment company organized as a Massachusetts business trust. The Fund is available only to certain fee-based accounts offered by Fidelity.
2. Investments in Fidelity Central Funds.
The Fund invests in Fidelity Central Funds, which are open-end investment companies generally available only to other investment companies and accounts managed by the investment adviser and its affiliates. The Fund's Schedule of Investments lists each of the Fidelity Central Funds held as of period end, if any, as an investment of the Fund, but does not include the underlying holdings of each Fidelity Central Fund. As an Investing Fund, the Fund indirectly bears its proportionate share of the expenses of the underlying Fidelity Central Funds.
The Money Market Central Funds seek preservation of capital and current income and are managed by Fidelity Investments Money Management, Inc. (FIMM), an affiliate of the investment adviser. Annualized expenses of the Money Market Central Funds as of their most recent shareholder report date are less than .005%.
A complete unaudited list of holdings for each Fidelity Central Fund is available upon request or at the Securities and Exchange Commission (the SEC) website at www.sec.gov. In addition, the financial statements of the Fidelity Central Funds, which are not covered by the Fund's Report of Independent Registered Public Accounting Firm, are available on the SEC website or upon request.
3. Significant Accounting Policies.
The Fund is an investment company and applies the accounting and reporting guidance of the Financial Accounting Standards Board (FASB) Accounting Standards Codification Topic 946 Financial Services – Investments Companies. The financial statements have been prepared in conformity with accounting principles generally accepted in the United States of America (GAAP), which require management to make certain estimates and assumptions at the date of the financial statements. Actual results could differ from those estimates. Subsequent events, if any, through the date that the financial statements were issued have been evaluated in the preparation of the financial statements. The following summarizes the significant accounting policies of the Fund:
Investment Valuation. Investments are valued as of 4:00 p.m. Eastern time on the last calendar day of the period. The Board of Trustees (the Board) has delegated the day to day responsibility for the valuation of the Fund's investments to the Fair Value Committee (the Committee) established by the Fund's investment adviser. In accordance with valuation policies and procedures approved by the Board, the Fund attempts to obtain prices from one or more third party pricing vendors or brokers to value its investments. When current market prices, quotations or currency exchange rates are not readily available or reliable, investments will be fair valued in good faith by the Committee, in accordance with procedures adopted by the Board. Factors used in determining fair value vary by investment type and may include market or investment specific events. The frequency with which these procedures are used cannot be predicted and they may be utilized to a significant extent. The Committee oversees the Fund's valuation policies and procedures and reports to the Board on the Committee's activities and fair value determinations. The Board monitors the appropriateness of the procedures used in valuing the Fund's investments and ratifies the fair value determinations of the Committee.
The Fund categorizes the inputs to valuation techniques used to value its investments into a disclosure hierarchy consisting of three levels as shown below:
- Level 1 – quoted prices in active markets for identical investments
- Level 2 – other significant observable inputs (including quoted prices for similar investments, interest rates, prepayment speeds, etc.)
- Level 3 – unobservable inputs (including the Fund's own assumptions based on the best information available)
Valuation techniques used to value the Fund's investments by major category are as follows:
Equity securities, including restricted securities, for which market quotations are readily available, are valued at the last reported sale price or official closing price as reported by a third party pricing vendor on the primary market or exchange on which they are traded and are categorized as Level 1 in the hierarchy. In the event there were no sales during the day or closing prices are not available, securities are valued at the last quoted bid price or may be valued using the last available price and are generally categorized as Level 2 in the hierarchy. For foreign equity securities, when market or security specific events arise, comparisons to the valuation of American Depositary Receipts (ADRs), futures contracts, Exchange-Traded Funds (ETFs) and certain indexes as well as quoted prices for similar securities may be used and would be categorized as Level 2 in the hierarchy. Utilizing these techniques may result in transfers between Level 1 and Level 2. For equity securities, including restricted securities, where observable inputs are limited, assumptions about market activity and risk are used and these securities may be categorized as Level 3 in the hierarchy.
Investments in open-end mutual funds, including the Fidelity Central Funds, are valued at their closing net asset value (NAV) each business day and are categorized as Level 1 in the hierarchy.
Changes in valuation techniques may result in transfers in or out of an assigned level within the disclosure hierarchy.
Foreign Currency. The Fund may use foreign currency contracts to facilitate transactions in foreign-denominated securities. Gains and losses from these transactions may arise from changes in the value of the foreign currency or if the counterparties do not perform under the contracts' terms.
Foreign-denominated assets, including investment securities, and liabilities are translated into U.S. dollars at the exchange rates at period end. Purchases and sales of investment securities, income and dividends received and expenses denominated in foreign currencies are translated into U.S. dollars at the exchange rate in effect on the transaction date.
The effects of exchange rate fluctuations on investments are included with the net realized and unrealized gain (loss) on investment securities. Other foreign currency transactions resulting in realized and unrealized gain (loss) are disclosed separately.
Investment Transactions and Income. For financial reporting purposes, the Fund's investment holdings and NAV include trades executed through the end of the last business day of the period. The NAV per share for processing shareholder transactions is calculated as of the close of business of the New York Stock Exchange (NYSE), normally 4:00 p.m. Eastern time and includes trades executed through the end of the prior business day. Gains and losses on securities sold are determined on the basis of identified cost. Dividend income is recorded on the ex-dividend date, except for certain dividends from foreign securities where the ex-dividend date may have passed, which are recorded as soon as the Fund is informed of the ex-dividend date. Non-cash dividends included in dividend income, if any, are recorded at the fair market value of the securities received. Income and capital gain distributions from Fidelity Central Funds, if any, are recorded on the ex-dividend date. Certain distributions received by the Fund represent a return of capital or capital gain. The Fund determines the components of these distributions subsequent to the ex-dividend date, based upon receipt of tax filings or other correspondence relating to the underlying investment. These distributions are recorded as a reduction of cost of investments and/or as a realized gain. Investment income is recorded net of foreign taxes withheld where recovery of such taxes is uncertain.
Expenses. Expenses directly attributable to a fund are charged to that fund. Expenses attributable to more than one fund are allocated among the respective funds on the basis of relative net assets or other appropriate methods. Expense estimates are accrued in the period to which they relate and adjustments are made when actual amounts are known.
Income Tax Information and Distributions to Shareholders. Each year, the Fund intends to qualify as a regulated investment company under Subchapter M of the Internal Revenue Code, including distributing substantially all of its taxable income and realized gains. As a result, no provision for U.S. Federal income taxes is required. As of July 31, 2018, the Fund did not have any unrecognized tax benefits in the financial statements; nor is the Fund aware of any tax positions for which it is reasonably possible that the total amounts of unrecognized tax benefits will significantly change in the next twelve months. The Fund files a U.S. federal tax return, in addition to state and local tax returns as required. The Fund's federal income tax returns are subject to examination by the Internal Revenue Service (IRS) for a period of three fiscal years after they are filed. State and local tax returns may be subject to examination for an additional fiscal year depending on the jurisdiction. Foreign taxes are provided for based on the Fund's understanding of the tax rules and rates that exist in the foreign markets in which it invests.
Distributions are declared and recorded on the ex-dividend date. Income and capital gain distributions are determined in accordance with income tax regulations, which may differ from GAAP.
Capital accounts within the financial statements are adjusted for permanent book-tax differences. These adjustments have no impact on net assets or the results of operations. Capital accounts are not adjusted for temporary book-tax differences which will reverse in a subsequent period.
Book-tax differences are primarily due to foreign currency transactions and losses deferred due to wash sales.
As of period end, the cost and unrealized appreciation (depreciation) in securities, and derivatives if applicable, for federal income tax purposes were as follows:
| Gross unrealized appreciation | $43,691 |
| Gross unrealized depreciation | (11,876) |
| Net unrealized appreciation (depreciation) | $31,815 |
| Tax Cost | $681,146 |
The tax-based components of distributable earnings as of period end were as follows:
| Undistributed ordinary income | $4,069 |
| Undistributed long-term capital gain | $1,077 |
| Net unrealized appreciation (depreciation) on securities and other investments | $31,815 |
The tax character of distributions paid was as follows:
| | July 31, 2018 | July 31, 2017(a) |
| Ordinary Income | $8,828 | $ 1,250 |
| Long-term Capital Gains | 911 | – |
| Total | $9,739 | $ 1,250 |
(a) For the period March 8, 2017(commencement of operations) to July 31, 2017.
Restricted Securities. The Fund may invest in securities that are subject to legal or contractual restrictions on resale. These securities generally may be resold in transactions exempt from registration or to the public if the securities are registered. Disposal of these securities may involve time-consuming negotiations and expense, and prompt sale at an acceptable price may be difficult. Information regarding restricted securities is included at the end of the Fund's Schedule of Investments.
4. Purchases and Sales of Investments.
Purchases and sales of securities, other than short-term securities, aggregated $786,229 and $359,616, respectively.
5. Fees and Other Transactions with Affiliates.
Management Fee. Fidelity SelectCo, LLC (the investment adviser) and its affiliates provide the Fund with investment management related services and the Fund does not pay any fees for these services. Under the management contract, the investment adviser or an affiliate pays all other expenses of the Fund, excluding fees and expenses of the independent Trustees, and certain miscellaneous expenses such as proxy and shareholder meeting expenses.
Brokerage Commissions. The Fund placed a portion of its portfolio transactions with brokerage firms which are affiliates of the investment adviser. Brokerage commissions are included in net realized gain (loss) and change in net unrealized appreciation (depreciation) in the Statement of Operations. The commissions paid to these affiliated firms were $45 for the period.
Interfund Trades. The Fund may purchase from or sell securities to other Fidelity Funds under procedures adopted by the Board. The procedures have been designed to ensure these interfund trades are executed in accordance with Rule 17a-7 of the 1940 Act. Interfund trades are included within the respective purchases and sales amounts shown in the Purchases and Sales of Investments note.
6. Committed Line of Credit.
The Fund participates with other funds managed by the investment adviser or an affiliate in a $4.25 billion credit facility (the "line of credit") to be utilized for temporary or emergency purposes to fund shareholder redemptions or for other short-term liquidity purposes. The Fund has agreed to pay commitment fees on its pro-rata portion of the line of credit, which amounted to $1 and is reflected in Miscellaneous expenses on the Statement of Operations. During the period, the Fund did not borrow on this line of credit.
7. Other.
The Fund's organizational documents provide former and current trustees and officers with a limited indemnification against liabilities arising in connection with the performance of their duties to the Fund. In the normal course of business, the Fund may also enter into contracts that provide general indemnifications. The Fund's maximum exposure under these arrangements is unknown as this would be dependent on future claims that may be made against the Fund. The risk of material loss from such claims is considered remote.
At the end of the period, the investment adviser or its affiliates were the owners of record of 38% of the total outstanding shares of the Fund.
Report of Independent Registered Public Accounting Firm
To the Trustees of Fidelity Select Portfolios and Shareholders of Fidelity Flex Real Estate Fund:
Opinion on the Financial Statements and Financial Highlights
We have audited the accompanying statement of assets and liabilities of Fidelity Flex Real Estate Fund (the "Fund"), a fund of Fidelity Select Portfolios, including the schedule of investments, as of July 31, 2018, the related statement of operations for the year then ended, the statement of changes in net assets and the financial highlights for the year then ended and for the period from March 8, 2017 (commencement of operations) to July 31, 2017, and the related notes. In our opinion, the financial statements and financial highlights present fairly, in all material respects, the financial position of the Fund as of July 31, 2018, the results of its operations for the year then ended, and the changes in its net assets, and the financial highlights for the year then ended and for the period from March 8, 2017 (commencement of operations) to July 31, 2017, in conformity with accounting principles generally accepted in the United States of America.
Basis for Opinion
These financial statements and financial highlights are the responsibility of the Fund's management. Our responsibility is to express an opinion on the Fund's financial statements and financial highlights based on our audits. We are a public accounting firm registered with the Public Company Accounting Oversight Board (United States) (PCAOB) and are required to be independent with respect to the Fund in accordance with the U.S. federal securities laws and the applicable rules and regulations of the Securities and Exchange Commission and the PCAOB.
We conducted our audits in accordance with the standards of the PCAOB. Those standards require that we plan and perform the audit to obtain reasonable assurance about whether the financial statements and financial highlights are free of material misstatement, whether due to error or fraud. The Fund is not required to have, nor were we engaged to perform, an audit of its internal control over financial reporting. As part of our audits we are required to obtain an understanding of internal control over financial reporting but not for the purpose of expressing an opinion on the effectiveness of the Fund’s internal control over financial reporting. Accordingly, we express no such opinion.
Our audits included performing procedures to assess the risks of material misstatement of the financial statements and financial highlights, whether due to error or fraud, and performing procedures that respond to those risks. Such procedures included examining, on a test basis, evidence regarding the amounts and disclosures in the financial statements and financial highlights. Our audits also included evaluating the accounting principles used and significant estimates made by management, as well as evaluating the overall presentation of the financial statements and financial highlights. Our procedures included confirmation of securities owned as of July 31, 2018, by correspondence with the custodians and brokers; when replies were not received from brokers, we performed other auditing procedures. We believe that our audits provide a reasonable basis for our opinion.
/s/ Deloitte & Touche LLP
Boston, Massachusetts
September 13, 2018
We have served as the auditor of one or more of the Fidelity investment companies since 1999.
Trustees and Officers
The Trustees, Members of the Advisory Board (if any), and officers of the trust and fund, as applicable, are listed below. The Board of Trustees governs the fund and is responsible for protecting the interests of shareholders. The Trustees are experienced executives who meet periodically throughout the year to oversee the fund's activities, review contractual arrangements with companies that provide services to the fund, oversee management of the risks associated with such activities and contractual arrangements, and review the fund's performance. Except for Michael E. Wiley, each of the Trustees oversees 286 funds. Mr. Wiley oversees 197 funds.
The Trustees hold office without limit in time except that (a) any Trustee may resign; (b) any Trustee may be removed by written instrument, signed by at least two-thirds of the number of Trustees prior to such removal; (c) any Trustee who requests to be retired or who has become incapacitated by illness or injury may be retired by written instrument signed by a majority of the other Trustees; and (d) any Trustee may be removed at any special meeting of shareholders by a two-thirds vote of the outstanding voting securities of the trust. Each Trustee who is not an interested person (as defined in the 1940 Act) of the trust and the fund is referred to herein as an Independent Trustee. Each Independent Trustee shall retire not later than the last day of the calendar year in which his or her 75th birthday occurs. The Independent Trustees may waive this mandatory retirement age policy with respect to individual Trustees. Officers and Advisory Board Members hold office without limit in time, except that any officer or Advisory Board Member may resign or may be removed by a vote of a majority of the Trustees at any regular meeting or any special meeting of the Trustees. Except as indicated, each individual has held the office shown or other offices in the same company for the past five years.
The fund’s Statement of Additional Information (SAI) includes more information about the Trustees. To request a free copy, call Fidelity at 1-800-835-5092.
Experience, Skills, Attributes, and Qualifications of the Trustees. The Governance and Nominating Committee has adopted a statement of policy that describes the experience, qualifications, attributes, and skills that are necessary and desirable for potential Independent Trustee candidates (Statement of Policy). The Board believes that each Trustee satisfied at the time he or she was initially elected or appointed a Trustee, and continues to satisfy, the standards contemplated by the Statement of Policy. The Governance and Nominating Committee also engages professional search firms to help identify potential Independent Trustee candidates who have the experience, qualifications, attributes, and skills consistent with the Statement of Policy. From time to time, additional criteria based on the composition and skills of the current Independent Trustees, as well as experience or skills that may be appropriate in light of future changes to board composition, business conditions, and regulatory or other developments, have also been considered by the professional search firms and the Governance and Nominating Committee. In addition, the Board takes into account the Trustees' commitment and participation in Board and committee meetings, as well as their leadership of standing and ad hoc committees throughout their tenure.
In determining that a particular Trustee was and continues to be qualified to serve as a Trustee, the Board has considered a variety of criteria, none of which, in isolation, was controlling. The Board believes that, collectively, the Trustees have balanced and diverse experience, qualifications, attributes, and skills, which allow the Board to operate effectively in governing the fund and protecting the interests of shareholders. Information about the specific experience, skills, attributes, and qualifications of each Trustee, which in each case led to the Board's conclusion that the Trustee should serve (or continue to serve) as a trustee of the fund, is provided below.
Board Structure and Oversight Function. James C. Curvey is an interested person and currently serves as Chairman. The Trustees have determined that an interested Chairman is appropriate and benefits shareholders because an interested Chairman has a personal and professional stake in the quality and continuity of services provided to the fund. Independent Trustees exercise their informed business judgment to appoint an individual of their choosing to serve as Chairman, regardless of whether the Trustee happens to be independent or a member of management. The Independent Trustees have determined that they can act independently and effectively without having an Independent Trustee serve as Chairman and that a key structural component for assuring that they are in a position to do so is for the Independent Trustees to constitute a substantial majority for the Board. The Independent Trustees also regularly meet in executive session. Ned C. Lautenbach serves as Chairman of the Independent Trustees and as such (i) acts as a liaison between the Independent Trustees and management with respect to matters important to the Independent Trustees and (ii) with management prepares agendas for Board meetings.
Fidelity® funds are overseen by different Boards of Trustees. The fund's Board oversees Fidelity's high income and certain equity funds, and other Boards oversee Fidelity's investment-grade bond, money market, asset allocation, and other equity funds. The asset allocation funds may invest in Fidelity® funds overseen by the fund's Board. The use of separate Boards, each with its own committee structure, allows the Trustees of each group of Fidelity® funds to focus on the unique issues of the funds they oversee, including common research, investment, and operational issues. On occasion, the separate Boards establish joint committees to address issues of overlapping consequences for the Fidelity® funds overseen by each Board.
The Trustees operate using a system of committees to facilitate the timely and efficient consideration of all matters of importance to the Trustees, the fund, and fund shareholders and to facilitate compliance with legal and regulatory requirements and oversight of the fund's activities and associated risks. The Board, acting through its committees, has charged SelectCo and its affiliates with (i) identifying events or circumstances the occurrence of which could have demonstrably adverse effects on the fund's business and/or reputation; (ii) implementing processes and controls to lessen the possibility that such events or circumstances occur or to mitigate the effects of such events or circumstances if they do occur; and (iii) creating and maintaining a system designed to evaluate continuously business and market conditions in order to facilitate the identification and implementation processes described in (i) and (ii) above. Because the day-to-day operations and activities of the fund are carried out by or through SelectCo, its affiliates, and other service providers, the fund's exposure to risks is mitigated but not eliminated by the processes overseen by the Trustees. While each of the Board's committees has responsibility for overseeing different aspects of the fund's activities, oversight is exercised primarily through the Operations, Audit, and Compliance Committees. In addition, the Independent Trustees have worked with Fidelity to enhance the Board's oversight of investment and financial risks, legal and regulatory risks, technology risks, and operational risks, including the development of additional risk reporting to the Board. Appropriate personnel, including but not limited to the fund's Chief Compliance Officer (CCO), SelectCo's internal auditor, the independent accountants, the fund's Treasurer and portfolio management personnel, make periodic reports to the Board's committees, as appropriate, including an annual review of Fidelity's risk management program for the Fidelity® funds. The responsibilities of each standing committee, including their oversight responsibilities, are described further under "Standing Committees of the Trustees."
Interested Trustees*:
Correspondence intended for a Trustee who is an interested person may be sent to Fidelity Investments, 245 Summer Street, Boston, Massachusetts 02210.
Name, Year of Birth; Principal Occupations and Other Relevant Experience+
James C. Curvey (1935)
Year of Election or Appointment: 2018
Trustee
Chairman of the Board of Trustees
Mr. Curvey also serves as Trustee of other Fidelity® funds. Mr. Curvey is Vice Chairman (2007-present) and Director of FMR LLC (diversified financial services company). In addition, Mr. Curvey is an Overseer Emeritus for the Boston Symphony Orchestra, a Director of Artis-Naples, and a Trustee of Brewster Academy in Wolfeboro, New Hampshire. Previously, Mr. Curvey served as a Director of Fidelity Research & Analysis Co. (investment adviser firm, 2009-2018), Director of Fidelity Investments Money Management, Inc. (investment adviser firm, 2009-2014) and a Director of FMR and FMR Co., Inc. (investment adviser firms, 2007-2014).
Charles S. Morrison (1960)
Year of Election or Appointment: 2018
Trustee
Mr. Morrison also serves as Trustee of other funds. He serves as President of Fidelity SelectCo, LLC (investment adviser firm, 2017-present) and Fidelity Management & Research Company (FMR) (investment adviser firm, 2016-present), a Director of Fidelity Investments Money Management, Inc. (FIMM) (investment adviser firm, 2014-present), Director of Fidelity SelectCo, LLC (investment adviser firm, 2014-present), President, Asset Management (2014-present), and is an employee of Fidelity Investments. Previously, Mr. Morrison served as Vice President of Fidelity's Fixed Income and Asset Allocation Funds (2012-2014), President, Fixed Income (2011-2014), Vice President of Fidelity's Money Market Funds (2005-2009), President, Money Market Group Leader of FMR (investment adviser firm, 2009), and Senior Vice President, Money Market Group of FMR (2004-2009). Mr. Morrison also served as Vice President of Fidelity's Bond Funds (2002-2005), certain Balanced Funds (2002-2005), and certain Asset Allocation Funds (2002-2007), and as Senior Vice President (2002-2005) of Fidelity's Bond Division.
* Determined to be an "Interested Trustee" by virtue of, among other things, his or her affiliation with the trust or various entities under common control with SelectCo.
+ The information includes the Trustee's principal occupation during the last five years and other information relating to the experience, attributes, and skills relevant to the Trustee's qualifications to serve as a Trustee, which led to the conclusion that the Trustee should serve as a Trustee for the fund.
Independent Trustees:
Correspondence intended for an Independent Trustee may be sent to Fidelity Investments, P.O. Box 55235, Boston, Massachusetts 02205-5235.
Name, Year of Birth; Principal Occupations and Other Relevant Experience+
Dennis J. Dirks (1948)
Year of Election or Appointment: 2018
Trustee
Mr. Dirks also serves as Trustee of other Fidelity® funds. Prior to his retirement in May 2003, Mr. Dirks was Chief Operating Officer and a member of the Board of The Depository Trust & Clearing Corporation (DTCC). He also served as President, Chief Operating Officer, and Board member of The Depository Trust Company (DTC) and President and Board member of the National Securities Clearing Corporation (NSCC). In addition, Mr. Dirks served as Chief Executive Officer and Board member of the Government Securities Clearing Corporation, Chief Executive Officer and Board member of the Mortgage-Backed Securities Clearing Corporation, as a Trustee and a member of the Finance Committee of Manhattan College (2005-2008), as a Trustee and a member of the Finance Committee of AHRC of Nassau County (2006-2008), as a member of the Independent Directors Council (IDC) Governing Council (2010-2015), and as a member of the Board of Directors for The Brookville Center for Children’s Services, Inc. (2009-2017). Mr. Dirks is a member of the Finance Committee (2016-present), Board of Directors (2017-present) and Board of Trustees (2018-present) and is Treasurer (2018-present) of the Asolo Repertory Theatre.
Donald F. Donahue (1950)
Year of Election or Appointment: 2018
Trustee
Mr. Donahue also serves as a Trustee of other Fidelity® funds. Mr. Donahue is President and Chief Executive Officer of Miranda Partners, LLC (risk consulting for the financial services industry, 2012-present). Previously, Mr. Donahue served as a Member of the Advisory Board of certain Fidelity® funds (2015-2018) and Chief Executive Officer (2006-2012), Chief Operating Officer (2003-2006), and Managing Director, Customer Marketing and Development (1999-2003) of The Depository Trust & Clearing Corporation (financial markets infrastructure). Mr. Donahue serves as a Member (2007-present) and Co-Chairman (2016-present) of the Board of Directors of United Way of New York, Member of the Board of Directors of NYC Leadership Academy (2012-present) and Member of the Board of Advisors of Ripple Labs, Inc. (financial services, 2015-present). He also served as Chairman (2010-2012) and Member of the Board of Directors (2012-2013) of Omgeo, LLC (financial services), Treasurer of United Way of New York (2012-2016), and Member of the Board of Directors of XBRL US (financial services non-profit, 2009-2012) and the International Securities Services Association (2009-2012).
Alan J. Lacy (1953)
Year of Election or Appointment: 2018
Trustee
Mr. Lacy also serves as Trustee of other Fidelity® funds. Mr. Lacy serves as a Director of Bristol-Myers Squibb Company (global pharmaceuticals, 2008-present). He is a Trustee of the California Chapter of The Nature Conservancy (2015-present) and a Director of the Center for Advanced Study in the Behavioral Sciences at Stanford University (2015-present). In addition, Mr. Lacy served as Senior Adviser (2007-2014) of Oak Hill Capital Partners, L.P. (private equity) and also served as Chief Executive Officer (2005) and Vice Chairman (2005-2006) of Sears Holdings Corporation (retail) and Chief Executive Officer and Chairman of the Board of Sears, Roebuck and Co. (retail, 2000-2005). Previously, Mr. Lacy served as Chairman (2014-2017) and a member (2010-2017) of the Board of Directors of Dave & Buster’s Entertainment, Inc. (restaurant and entertainment complexes), as Chairman (2008-2011) and a member (2006-2015) of the Board of Trustees of the National Parks Conservation Association, and as a member of the Board of Directors for The Hillman Companies, Inc. (hardware wholesalers, 2010-2014), Earth Fare, Inc. (retail grocery, 2010-2014), and The Western Union Company (global money transfer, 2006-2011).
Ned C. Lautenbach (1944)
Year of Election or Appointment: 2018
Trustee
Chairman of the Independent Trustees
Mr. Lautenbach also serves as Trustee of other Fidelity® funds. Mr. Lautenbach currently serves as Vice Chair of the Board of Governors, State University System of Florida (2013-present) and is a member of the Council on Foreign Relations (1994-present). He is also a member and has most recently served as Chairman of the Board of Directors of Artis-Naples (2012-present). Previously, Mr. Lautenbach served as a member and then Lead Director of the Board of Directors of Eaton Corporation (diversified industrial, 1997-2016). He was also a Partner and Advisory Partner at Clayton, Dubilier & Rice, LLC (private equity investment, 1998-2010), as well as a Director of Sony Corporation (2006-2007). In addition, Mr. Lautenbach also had a 30-year career with IBM (technology company) during which time he served as Senior Vice President and a member of the Corporate Executive Committee (1968-1998).
Joseph Mauriello (1944)
Year of Election or Appointment: 2018
Trustee
Mr. Mauriello also serves as Trustee of other Fidelity® funds. Prior to his retirement in January 2006, Mr. Mauriello served in numerous senior management positions including Deputy Chairman and Chief Operating Officer (2004-2005), and Vice Chairman of Financial Services (2002-2004) of KPMG LLP US (professional services, 1965-2005). Mr. Mauriello currently serves as a member of the Board of Directors of XL Group plc. (global insurance and re-insurance, 2006-present) and the Independent Directors Council (IDC) Governing Council (2015-present). Previously, Mr. Mauriello served as a Director of the Hamilton Funds of the Bank of New York (2006-2007) and of Arcadia Resources Inc. (health care services and products, 2007-2012).
Cornelia M. Small (1944)
Year of Election or Appointment: 2018
Trustee
Ms. Small also serves as Trustee of other Fidelity® funds. Ms. Small is a member of the Board of Directors (2009-present) and Chair of the Investment Committee (2010-present) of the Teagle Foundation. Ms. Small also serves on the Investment Committee of the Berkshire Taconic Community Foundation (2008-present). Previously, Ms. Small served as Chairperson (2002-2008) and a member of the Investment Committee and Chairperson (2008-2012) and a member of the Board of Trustees of Smith College. In addition, Ms. Small served as Chief Investment Officer, Director of Global Equity Investments, and a member of the Board of Directors of Scudder, Stevens & Clark and Scudder Kemper Investments.
Garnett A. Smith (1947)
Year of Election or Appointment: 2013
Trustee
Mr. Smith also serves as Trustee of other Fidelity® funds. Prior to Mr. Smith's retirement, he served as Chairman and Chief Executive Officer of Inbrand Corp. (manufacturer of personal absorbent products, 1990-1997). He also served as President (1986-1990) of Inbrand Corp. Prior to his employment with Inbrand Corp., he was employed by a retail fabric chain and North Carolina National Bank. In addition, Mr. Smith served as a Member of the Advisory Board of certain Fidelity® funds (2012-2013) and as a board member of the Jackson Hole Land Trust (2009-2012).
David M. Thomas (1949)
Year of Election or Appointment: 2018
Trustee
Mr. Thomas also serves as Trustee of other Fidelity® funds. Mr. Thomas serves as Non-Executive Chairman of the Board of Directors of Fortune Brands Home and Security (home and security products, 2011-present), as a member of the Board of Directors (2004-present) and Presiding Director (2013-present) of Interpublic Group of Companies, Inc. (marketing communication), and as a member of the Board of Trustees of the University of Florida (2013-present). Previously, Mr. Thomas served as Executive Chairman (2005-2006) and Chairman and Chief Executive Officer (2000-2005) of IMS Health, Inc. (pharmaceutical and healthcare information solutions), and a Director of Fortune Brands, Inc. (consumer products, 2000-2011).
Michael E. Wiley (1950)
Year of Election or Appointment: 2008
Trustee
Mr. Wiley also serves as Trustee or Member of the Advisory Board of other Fidelity® funds. Mr. Wiley serves as a Director of Andeavor Corporation (independent oil refiner and marketer, 2005-present), a Director of Andeavor Logistics LP (natural resources logistics, 2015-present), and a Director of Bill Barrett Corporation (exploration and production, 2005-present). In addition, Mr. Wiley also serves as a Director of Post Oak Bank (privately-held bank, 2004-present). Previously, Mr. Wiley served as a Trustee of other Fidelity® funds (2008-2013), as a Director of Asia Pacific Exploration Consolidated (international oil and gas exploration and production, 2008-2013), as a member of the Board of Trustees of the University of Tulsa (2000-2006; 2007-2010), as a Senior Energy Advisor of Katzenbach Partners, LLC (consulting, 2006-2007), as an Advisory Director of Riverstone Holdings (private investment), Chairman, President, and CEO of Baker Hughes, Inc. (oilfield services, 2000-2004), and as Director of Spinnaker Exploration Company (exploration and production, 2001-2005).
+ The information includes the Trustee's principal occupation during the last five years and other information relating to the experience, attributes, and skills relevant to the Trustee's qualifications to serve as a Trustee, which led to the conclusion that the Trustee should serve as a Trustee for the fund.
Advisory Board Members and Officers:
Correspondence intended for a Member of the Advisory Board (if any) may be sent to Fidelity Investments, P.O. Box 55235, Boston, Massachusetts 02205-5235. Correspondence intended for an officer or Peter S. Lynch may be sent to Fidelity Investments, 245 Summer Street, Boston, Massachusetts 02210. Officers appear below in alphabetical order.
Name, Year of Birth; Principal Occupation
Peter S. Lynch (1944)
Year of Election or Appointment: 2018
Member of the Advisory Board
Mr. Lynch also serves as Member of the Advisory Board of other Fidelity® funds. Mr. Lynch is Vice Chairman and a Director of FMR (investment adviser firm) and FMR Co., Inc. (investment adviser firm). In addition, Mr. Lynch serves as a Trustee of Boston College and as the Chairman of the Inner-City Scholarship Fund. Previously, Mr. Lynch served on the Special Olympics International Board of Directors (1997-2006).
William S. Stavropoulos (1939)
Year of Election or Appointment: 2018
Member of the Advisory Board
Mr. Stavropoulos also serves as Member of the Advisory Board of other Fidelity® funds. Mr. Stavropoulos serves as President and Founder of the Michigan Baseball Foundation, the Great Lakes Loons (2007-present). Mr. Stavropoulos is Chairman Emeritus of the Board of Directors of The Dow Chemical Company, where he previously served in numerous senior management positions, including President, CEO (1995-2000; 2002-2004), Chairman of the Executive Committee (2000-2006), and as a member of the Board of Directors (1990-2006). Currently, Mr. Stavropoulos is Chairman of the Board of Directors of Univar Inc. (global distributor of commodity and specialty chemicals), a Director of Teradata Corporation (data warehousing and technology solutions), and a member of the Advisory Board for Metalmark Capital LLC (private equity investment, 2005-present). Mr. Stavropoulos is an operating advisor to Clayton, Dubilier & Rice, LLC (private equity investment). In addition, Mr. Stavropoulos is a member of the University of Notre Dame Advisory Council for the College of Science, a Trustee of the Rollin L. Gerstacker Foundation, and a Director of Artis-Naples in Naples, Florida. Previously, Mr. Stavropoulos served as Trustee of certain Fidelity® funds (2001-2018) and as a Director of Chemical Financial Corporation (bank holding company, 1993-2012) and Tyco International, Ltd. (multinational manufacturing and services, 2007-2012).
Carol B. Tomé (1957)
Year of Election or Appointment: 2017
Member of the Advisory Board
Ms. Tomé also serves as Member of the Advisory Board of other Fidelity® funds. Ms. Tomé is Chief Financial Officer (2001-present) and Executive Vice President of Corporate Services (2007-present) of The Home Depot, Inc. (home improvement retailer) and a Director (2003-present) and Chair of the Audit Committee (2004-present) of United Parcel Service, Inc. (package delivery and supply chain management). Previously, Ms. Tomé served as Trustee of certain Fidelity® funds (2017), Senior Vice President of Finance and Accounting/Treasurer (2000-2007) and Vice President and Treasurer (1995-2000) of The Home Depot, Inc. and Chair of the Board (2010-2012), Vice Chair of the Board (2009 and 2013), and a Director (2008-2013) of the Federal Reserve Bank of Atlanta. Ms. Tomé is also a director or trustee of many community and professional organizations.
Elizabeth Paige Baumann (1968)
Year of Election or Appointment: 2017
Anti-Money Laundering (AML) Officer
Ms. Baumann also serves as AML Officer of other funds. She is Chief AML Officer (2012-present) and Senior Vice President (2014-present) of FMR LLC (diversified financial services company) and is an employee of Fidelity Investments. Previously, Ms. Baumann served as AML Officer of the funds (2012-2016), and Vice President (2007-2014) and Deputy Anti-Money Laundering Officer (2007-2012) of FMR LLC.
Marc R. Bryant (1966)
Year of Election or Appointment: 2013
Secretary and Chief Legal Officer (CLO)
Mr. Bryant also serves as Secretary and CLO of other funds. Mr. Bryant serves as CLO, Secretary, and Senior Vice President of Fidelity Management & Research Company (investment adviser firm, 2015-present) and FMR Co., Inc. (investment adviser firm, 2015-present); Secretary of Fidelity SelectCo, LLC (investment adviser firm, 2015-present) and Fidelity Investments Money Management, Inc. (investment adviser firm, 2015-present); and CLO of Fidelity Management & Research (Hong Kong) Limited and FMR Investment Management (UK) Limited (investment adviser firms, 2015-present) and Fidelity Management & Research (Japan) Limited (investment adviser firm, 2016-present). He is Senior Vice President and Deputy General Counsel of FMR LLC (diversified financial services company). Previously, Mr. Bryant served as Secretary and CLO of Fidelity Rutland Square Trust II (2010-2014) and Assistant Secretary of Fidelity's Fixed Income and Asset Allocation Funds (2013-2015). Prior to joining Fidelity Investments, Mr. Bryant served as a Senior Vice President and the Head of Global Retail Legal for AllianceBernstein L.P. (2006-2010), and as the General Counsel for ProFund Advisors LLC (2001-2006).
John J. Burke III (1964)
Year of Election or Appointment: 2018
Chief Financial Officer
Mr. Burke also serves as Chief Financial Officer of other funds. Mr. Burke serves as Head of Investment Operations for Fidelity Fund and Investment Operations (2018-present) and is an employee of Fidelity Investments (1998-present). Previously Mr. Burke served as head of Asset Management Investment Operations (2012-2018).
William C. Coffey (1969)
Year of Election or Appointment: 2009
Assistant Secretary
Mr. Coffey also serves as Assistant Secretary of other funds. He is Senior Vice President and Deputy General Counsel of FMR LLC (diversified financial services company, 2010-present), and is an employee of Fidelity Investments. Previously, Mr. Coffey served as Vice President and Associate General Counsel of FMR LLC (2005-2009).
Timothy M. Cohen (1969)
Year of Election or Appointment: 2018
Vice President
Mr. Cohen also serves as Vice President of other funds. Mr. Cohen serves as Co-Head of Global Equity Research (2016-present), a Director of Fidelity Management & Research (Japan) Limited (investment adviser firm, 2016-present), and is an employee of Fidelity Investments. Previously, Mr. Cohen served as Chief Investment Officer - Equity and a Director of Fidelity Management & Research (U.K.) Inc. (investment adviser firm, 2013-2015) and as a Director of Fidelity Management & Research (Hong Kong) Limited (investment adviser firm, 2017).
Jonathan Davis (1968)
Year of Election or Appointment: 2010
Assistant Treasurer
Mr. Davis also serves as Assistant Treasurer of other funds. Mr. Davis serves as Assistant Treasurer of FMR Capital, Inc. (2017-present) and is an employee of Fidelity Investments. Previously, Mr. Davis served as Vice President and Associate General Counsel of FMR LLC (diversified financial services company, 2003-2010).
Adrien E. Deberghes (1967)
Year of Election or Appointment: 2018
Assistant Treasurer
Mr. Deberghes also serves as an officer of other funds. He serves as Assistant Treasurer of FMR Capital, Inc. (2017-present), Executive Vice President of Fidelity Investments Money Management, Inc. (FIMM) (investment adviser firm, 2016-present), and is an employee of Fidelity Investments (2008-present). Previously, Mr. Deberghes served as President and Treasurer of certain Fidelity® funds (2013-2018). Prior to joining Fidelity Investments, Mr. Deberghes was Senior Vice President of Mutual Fund Administration at State Street Corporation (2007-2008), Senior Director of Mutual Fund Administration at Investors Bank & Trust (2005-2007), and Director of Finance for Dunkin' Brands (2000-2005). Previously, Mr. Deberghes served in other fund officer roles.
Laura M. Del Prato (1964)
Year of Election or Appointment: 2018
Assistant Treasurer
Ms. Del Prato also serves as an officer of other funds. Ms. Del Prato is an employee of Fidelity Investments (2017-present). Prior to joining Fidelity Investments, Ms. Del Prato served as a Managing Director and Treasurer of the JPMorgan Mutual Funds (2014-2017). Prior to JPMorgan, Ms. Del Prato served as a partner at Cohen Fund Audit Services (accounting firm, 2012-2013) and KPMG LLP (accounting firm, 2004-2012).
Colm A. Hogan (1973)
Year of Election or Appointment: 2018
Deputy Treasurer
Mr. Hogan also serves as an officer of other funds. Mr. Hogan serves as Assistant Treasurer of FMR Capital, Inc. (2017-present) and is an employee of Fidelity Investments (2005-present). Previously, Mr. Hogan served as Assistant Treasurer of certain Fidelity® funds (2016-2018).
Pamela R. Holding (1964)
Year of Election or Appointment: 2018
Vice President
Ms. Holding also serves as a Vice President of other funds. Ms. Holding serves as Co-Head of Global Equity Research (2018-present) and is an employee of Fidelity Investments (2013-present).
Chris Maher (1972)
Year of Election or Appointment: 2013
Assistant Treasurer
Mr. Maher serves as Assistant Treasurer of other funds. Mr. Maher is Vice President of Valuation Oversight, serves as Assistant Treasurer of FMR Capital, Inc. (2017-present), and is an employee of Fidelity Investments. Previously, Mr. Maher served as Vice President of Asset Management Compliance (2013), Vice President of the Program Management Group of FMR (investment adviser firm, 2010-2013), and Vice President of Valuation Oversight (2008-2010).
Rieco E. Mello (1969)
Year of Election or Appointment: 2017
Assistant Treasurer
Mr. Mello also serves as Assistant Treasurer of other funds. Mr. Mello serves as Assistant Treasurer of FMR Capital, Inc. (2017-present) and is an employee of Fidelity Investments (1995-present).
Kenneth B. Robins (1969)
Year of Election or Appointment: 2018
Chief Compliance Officer
Mr. Robins also serves as an officer of other funds. Mr. Robins serves as Compliance Officer of Fidelity Management & Research Company and FMR Co., Inc. (investment adviser firms, 2016-present) and is an employee of Fidelity Investments (2004-present). Previously, Mr. Robins served as Executive Vice President of Fidelity Investments Money Management, Inc. (investment adviser firm, 2013-2016) and served in other fund officer roles.
Stacie M. Smith (1974)
Year of Election or Appointment: 2018
President and Treasurer
Ms. Smith also serves as an officer of other funds. Ms. Smith serves as Assistant Treasurer of FMR Capital, Inc. (2017-present), is an employee of Fidelity Investments (2009-present), and has served in other fund officer roles. Prior to joining Fidelity Investments, Ms. Smith served as Senior Audit Manager of Ernst & Young LLP (accounting firm, 1996-2009). Previously, Ms. Smith served as Assistant Treasurer (2013-2018) and Deputy Treasurer (2013-2016) of certain Fidelity® funds.
Marc L. Spector (1972)
Year of Election or Appointment: 2017
Assistant Treasurer
Mr. Spector also serves as an officer of other funds. Mr. Spector serves as Assistant Treasurer of FMR Capital, Inc. (2017-present) and is an employee of Fidelity Investments (2016-present). Prior to joining Fidelity Investments, Mr. Spector served as Director at the Siegfried Group (accounting firm, 2013-2016), and prior to Siegfried Group as audit senior manager at Deloitte & Touche (accounting firm, 2005-2013).
Renee Stagnone (1975)
Year of Election or Appointment: 2016
Assistant Treasurer
Ms. Stagnone also serves as an officer of other funds. Ms. Stagnone serves as Assistant Treasurer of FMR Capital, Inc. (2017-present) and is an employee of Fidelity Investments (1997-present). Previously, Ms. Stagnone served as Deputy Treasurer of certain Fidelity® funds (2013-2016).
Shareholder Expense Example
As a shareholder of the Fund, you incur two types of costs: (1) transaction costs, and (2) ongoing costs, including other Fund expenses. This Example is intended to help you understand your ongoing costs (in dollars) of investing in the Fund and to compare these costs with the ongoing costs of investing in other mutual funds.
The Example is based on an investment of $1,000 invested at the beginning of the period and held for the entire period (February 1, 2018 to July 31, 2018).
Actual Expenses
The first line of the accompanying table provides information about actual account values and actual expenses. You may use the information in this line, together with the amount you invested, to estimate the expenses that you paid over the period. Simply divide your account value by $1,000.00 (for example, an $8,600 account value divided by $1,000.00 = 8.6), then multiply the result by the number in the first line under the heading entitled "Expenses Paid During Period" to estimate the expenses you paid on your account during this period. In addition, the Fund, as a shareholder in the underlying Fidelity Central Funds, will indirectly bear its pro-rata share of the fees and expenses incurred by the underlying Fidelity Central Funds. These fees and expenses are not included in the Fund's annualized expense ratio used to calculate the expense estimate in the table below.
Hypothetical Example for Comparison Purposes
The second line of the accompanying table provides information about hypothetical account values and hypothetical expenses based on the Fund's actual expense ratio and an assumed rate of return of 5% per year before expenses, which is not the Fund's actual return. The hypothetical account values and expenses may not be used to estimate the actual ending account balance or expenses you paid for the period. You may use this information to compare the ongoing costs of investing in the Fund and other funds. To do so, compare this 5% hypothetical example with the 5% hypothetical examples that appear in the shareholder reports of the other funds. In addition, the Fund, as a shareholder in the underlying Fidelity Central Funds, will indirectly bear its pro-rata share of the fees and expenses incurred by the underlying Fidelity Central Funds. These fees and expenses are not included in the Fund's annualized expense ratio used to calculate the expense estimate in the table below.
Please note that the expenses shown in the table are meant to highlight your ongoing costs only and do not reflect any transaction costs. Therefore, the second line of the table is useful in comparing ongoing costs only, and will not help you determine the relative total costs of owning different funds.
| | Annualized Expense Ratio-A | Beginning
Account Value
February 1, 2018 | Ending
Account Value
July 31, 2018 | Expenses Paid
During Period-B
February 1, 2018
to July 31, 2018 |
| Actual | - %-C | $1,000.00 | $1,058.80 | $--D |
| Hypothetical-E | | $1,000.00 | $1,024.79 | $--D |
A Annualized expense ratio reflects expenses net of applicable fee waivers.
B Expenses are equal to the Fund's annualized expense ratio, multiplied by the average account value over the period, multiplied by 181/365 (to reflect the one-half year period).
C Amount represents less than .005%.
D Amount represents less than $.005.
E 5% return per year before expenses
Distributions (Unaudited)
The Board of Trustees of Fidelity Flex Real Estate Fund voted to pay on September 10, 2018, to shareholders of record at the opening of business on September 7, 2018, a distribution of $0.021 per share derived from capital gains realized from sales of portfolio securities and a dividend of $0.073 per share from net investment income.
The fund hereby designates as a capital gain dividend with respect to the taxable year ended July 31, 2018, $1,314, or, if subsequently determined to be different, the net capital gain of such year.
A total of 0.15% of the dividends distributed during the fiscal year was derived from interest on U.S. Government securities which is generally exempt from state income tax.
The fund will notify shareholders in January 2019 of amounts for use in preparing 2018 income tax returns.

Corporate Headquarters
245 Summer St.
Boston, MA 02210
www.fidelity.com
ZXL-ANN-0918
1.9881647.101
Fidelity Advisor® International Real Estate Fund - Class A, Class M, Class C and Class I
Annual Report July 31, 2018 Class A, Class M, Class C and Class I are classes of Fidelity® International Real Estate Fund |
|
Contents
To view a fund's proxy voting guidelines and proxy voting record for the 12-month period ended June 30, visit http://www.fidelity.com/proxyvotingresults or visit the Securities and Exchange Commission's (SEC) web site at http://www.sec.gov.
You may also call 1-877-208-0098 to request a free copy of the proxy voting guidelines.
Standard & Poor's, S&P and S&P 500 are registered service marks of The McGraw-Hill Companies, Inc. and have been licensed for use by Fidelity Distributors Corporation.
Other third-party marks appearing herein are the property of their respective owners.
All other marks appearing herein are registered or unregistered trademarks or service marks of FMR LLC or an affiliated company. © 2018 FMR LLC. All rights reserved.
This report and the financial statements contained herein are submitted for the general information of the shareholders of the Fund. This report is not authorized for distribution to prospective investors in the Fund unless preceded or accompanied by an effective prospectus.
A fund files its complete schedule of portfolio holdings with the SEC for the first and third quarters of each fiscal year on Form N-Q. Forms N-Q are available on the SEC’s web site at http://www.sec.gov. A fund's Forms N-Q may be reviewed and copied at the SEC’s Public Reference Room in Washington, DC. Information regarding the operation of the SEC's Public Reference Room may be obtained by calling 1-800-SEC-0330.
For a complete list of a fund's portfolio holdings, view the most recent holdings listing, semiannual report, or annual report on Fidelity's web site at http://www.fidelity.com, http://www.institutional.fidelity.com, or http://www.401k.com, as applicable.
NOT FDIC INSURED •MAY LOSE VALUE •NO BANK GUARANTEE
Neither the Fund nor Fidelity Distributors Corporation is a bank.
Performance: The Bottom Line
Average annual total return reflects the change in the value of an investment, assuming reinvestment of distributions from dividend income and capital gains (the profits earned upon the sale of securities that have grown in value, if any) and assuming a constant rate of performance each year. The hypothetical investment and the average annual total returns do not reflect the deduction of taxes that a shareholder would pay on fund distributions or the redemption of fund shares. During periods of reimbursement by Fidelity, a fund’s total return will be greater than it would be had the reimbursement not occurred. How a fund did yesterday is no guarantee of how it will do tomorrow.
Average Annual Total Returns
| For the periods ended July 31, 2018 | Past 1 year | Past 5 years | Past 10 years |
| Class A (incl. 5.75% sales charge) | 2.25% | 5.50% | 4.13% |
| Class M (incl. 3.50% sales charge) | 4.41% | 5.69% | 4.09% |
| Class C (incl. contingent deferred sales charge) | 6.70% | 5.97% | 3.97% |
| Class I | 8.88% | 7.13% | 5.06% |
Class C shares' contingent deferred sales charges included in the past one year, past five years and past ten years total return figures are 1%, 0% and 0%, respectively.
$10,000 Over 10 Years
Let's say hypothetically that $10,000 was invested in Fidelity Advisor® International Real Estate Fund - Class A on July 31, 2008, and the current 5.75% sales charge was paid.
The chart shows how the value of your investment would have changed, and also shows how the MSCI EAFE Index performed over the same period.
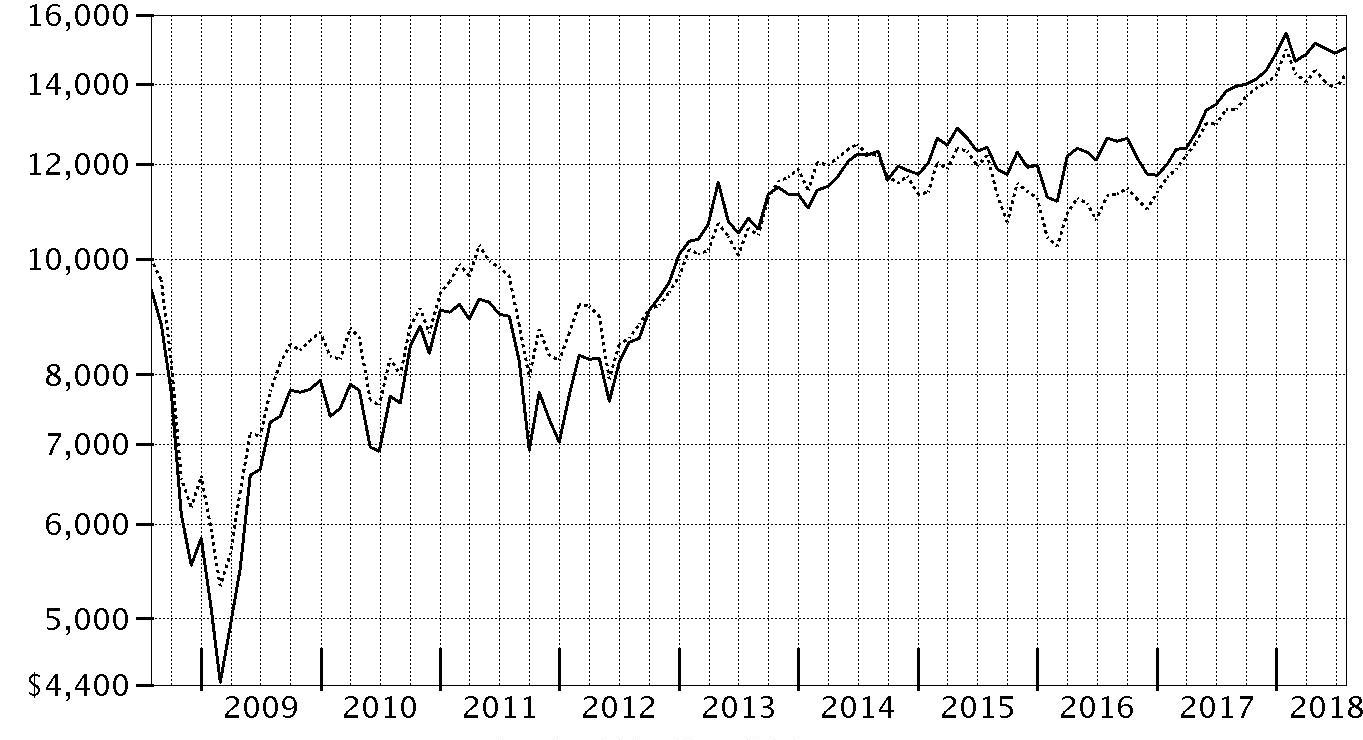
| Period Ending Values |
| $14,993 | Fidelity Advisor® International Real Estate Fund - Class A |
| $14,233 | MSCI EAFE Index |
Management's Discussion of Fund Performance
Market Recap: For the 12 months ending July 31, 2018, global real estate stocks gained 5.67%, as measured by the FTSE
® EPRA℠/NAREIT
® Developed Index, partly held back by the headwind of a strengthening U.S. dollar against many currencies. In the U.S., it was an up-and-down 12 months for real estate investment trusts (REITs), which made up 52% of the index this period, on average. U.S. REITs corrected sharply in late 2017 and the first two months of 2018 before enjoying a strong upward trend through the end of July. For the full 12 months, the group rose about 4%. Higher interest rates posed a headwind for U.S. REITs, as income-seeking investors perceived a correlation between the two factors. Still, the fundamental backdrop for U.S. REITs remained solid, with positive, if decelerating, cash-flow growth across most categories. Continental European markets performed especially well this period, gaining roughly 11%, owing to the earlier stage of their real estate recovery. Almost every country in this region fared well, led by Austria (+35%), Germany (+23%) and Sweden (+16%). Conversely, notable laggards within Europe included France (+2%) and Switzerland (+1%). Meanwhile, Japan and Hong Kong, the next-largest index allocations, returned 5% and roughly 7%, respectively, the past 12 months, while Australia (+6%) and the U.K. (+8%) each outperformed the broader market.
Comments from Portfolio Manager Guillermo de las Casas: For the fiscal year, the fund's shares Classes (excluding sales charges, if applicable) gained roughly 8% to 9%, ahead of the 7.85% return of the FTSE
® EPRA℠/NAREIT
® Developed Ex North America Index. International real estate securities faced a challenging 2018 so far, but nonetheless posted a strong return the past 12 months, largely supported by strength from October 2017 through the first month of the new year. My focus on underlying earnings growth – rather than solely on investments with the highest yields – helped the fund outperform the FTSE index, as we avoided some of the index's higher-yielding components that weighed on the recent performance of the asset class. One good example of this is Unibail-Rodamco (-5%), a mall company in Europe. I generally avoid mall companies if I see deteriorating medium- to long-term prospects. Not owning Unibail was the fund’s largest individual relative contributor for the year, as the stock underperformed along with other mall stocks, which generally lagged those of real estate developers. A non-index stake in Ichigo, a Japanese real estate owner/operator with a focus on offices and hotels, was another contributor. The company also builds and operates solar power plants on unused land nationwide. Shares of Ichigo were propelled by the firm’s strong financial results and positive transactions in its solar business. We reduced our position in Ichigo this period to take some profits. Conversely, not owning index component Link Real Estate Investment Trust, Asia's largest REIT, detracted most. We avoided this Hong Kong-based REIT based on our skepticism about the sustainability of the country’s housing prices. Unfortunately for the fund, we missed out on Link’s roughly 26% gain the past 12 months.
The views expressed above reflect those of the portfolio manager(s) only through the end of the period as stated on the cover of this report and do not necessarily represent the views of Fidelity or any other person in the Fidelity organization. Any such views are subject to change at any time based upon market or other conditions and Fidelity disclaims any responsibility to update such views. These views may not be relied on as investment advice and, because investment decisions for a Fidelity fund are based on numerous factors, may not be relied on as an indication of trading intent on behalf of any Fidelity fund.
Investment Summary (Unaudited)
Top Ten Stocks as of July 31, 2018
| | % of fund's net assets |
| Vonovia SE | 6.0 |
| Mitsubishi Estate Co. Ltd. | 5.5 |
| Mitsui Fudosan Co. Ltd. | 4.5 |
| Kojamo OYJ | 3.4 |
| Parkway Life REIT | 2.9 |
| Sino Land Ltd. | 2.7 |
| Irish Residential Properties REIT PLC | 2.4 |
| Hysan Development Co. Ltd. | 2.4 |
| Hufvudstaden AB Series A | 2.4 |
| LEG Immobilien AG | 2.3 |
| | 34.5 |
Top Five Countries as of July 31, 2018
| (excluding cash equivalents) | % of fund's net assets |
| Japan | 17.6 |
| United Kingdom | 11.0 |
| Germany | 9.6 |
| Singapore | 8.0 |
| Australia | 7.0 |
Top Five REIT Sectors as of July 31, 2018
| | % of fund's net assets |
| REITs - Management/Investment | 7.8 |
| REITs - Diversified | 6.5 |
| REITs - Apartments | 5.7 |
| REITs - Health Care | 4.4 |
| REITs - Office Property | 2.6 |
Asset Allocation (% of fund's net assets)
| As of July 31, 2018* |
| | Stocks | 95.8% |
| | Short-Term Investments and Net Other Assets (Liabilities) | 4.2% |

* Foreign investments - 95.3%
Schedule of Investments July 31, 2018
Showing Percentage of Net Assets
| Common Stocks - 95.8% | | | |
| | | Shares | Value |
| Australia - 7.0% | | | |
| 360 Capital Group Ltd. unit | | 6,024,853 | $4,453,784 |
| Abacus Property Group unit | | 2,606,270 | 7,241,868 |
| Arena (REIT) unit | | 2,769,028 | 4,731,674 |
| Mirvac Group unit | | 4,198,488 | 7,111,928 |
| National Storage (REIT) unit | | 9,495,269 | 12,063,212 |
| Propertylink Group unit | | 9,666,703 | 7,612,790 |
|
| TOTAL AUSTRALIA | | | 43,215,256 |
|
| Bailiwick of Guernsey - 0.4% | | | |
| Sirius Real Estate Ltd. | | 3,073,500 | 2,355,927 |
| Belgium - 1.7% | | | |
| Aedifica SA | | 22,500 | 2,146,927 |
| Warehouses de Pauw | | 63,686 | 8,549,297 |
|
| TOTAL BELGIUM | | | 10,696,224 |
|
| Bermuda - 6.4% | | | |
| Great Eagle Holdings Ltd. | | 1,566,752 | 7,714,942 |
| Hongkong Land Holdings Ltd. | | 1,747,200 | 12,702,144 |
| Tai Cheung Holdings Ltd. | | 11,757,000 | 12,672,135 |
| Wing Tai Properties Ltd. | | 7,822,000 | 6,118,840 |
|
| TOTAL BERMUDA | | | 39,208,061 |
|
| Cayman Islands - 0.5% | | | |
| Alibaba Group Holding Ltd. sponsored ADR (a) | | 15,600 | 2,920,788 |
| Finland - 3.4% | | | |
| Kojamo OYJ | | 1,993,800 | 21,099,623 |
| France - 3.2% | | | |
| Altarea SCA | | 27,594 | 6,059,751 |
| ARGAN SA | | 30,961 | 1,618,330 |
| Societe Fonciere Lyonnaise SA | | 171,794 | 11,731,819 |
|
| TOTAL FRANCE | | | 19,409,900 |
|
| Germany - 9.6% | | | |
| DIC Asset AG | | 271,700 | 3,100,873 |
| LEG Immobilien AG | | 128,978 | 14,514,958 |
| Scout24 AG (b) | | 94,400 | 4,912,205 |
| Vonovia SE | | 757,654 | 36,687,715 |
|
| TOTAL GERMANY | | | 59,215,751 |
|
| Greece - 0.7% | | | |
| Grivalia Properties REIC | | 430,891 | 4,318,101 |
| Hong Kong - 6.1% | | | |
| Hysan Development Co. Ltd. | | 2,736,703 | 14,975,238 |
| Magnificent Hotel Investment Ltd. | | 220,237,000 | 5,695,990 |
| Sino Land Ltd. | | 9,712,355 | 16,680,050 |
|
| TOTAL HONG KONG | | | 37,351,278 |
|
| India - 0.6% | | | |
| Oberoi Realty Ltd. | | 473,470 | 3,431,032 |
| Ireland - 3.4% | | | |
| Hibernia (REIT) PLC | | 3,445,908 | 5,866,912 |
| Irish Residential Properties REIT PLC | | 9,360,600 | 15,039,553 |
|
| TOTAL IRELAND | | | 20,906,465 |
|
| Israel - 0.5% | | | |
| Azrieli Group | | 64,100 | 3,066,927 |
| Japan - 17.6% | | | |
| Advance Residence Investment Corp. | | 4,788 | 12,456,551 |
| Comforia Residential REIT, Inc. | | 3,808 | 8,915,927 |
| Daibiru Corp. | | 327,300 | 3,366,230 |
| Ichigo, Inc. | | 664,500 | 2,959,540 |
| Japan Rental Housing Investment, Inc. | | 14,674 | 11,942,351 |
| Kenedix, Inc. | | 733,400 | 4,191,232 |
| Mitsubishi Estate Co. Ltd. | | 1,964,400 | 34,087,481 |
| Mitsui Fudosan Co. Ltd. | | 1,147,600 | 27,441,088 |
| Ship Healthcare Holdings, Inc. | | 77,300 | 2,996,874 |
|
| TOTAL JAPAN | | | 108,357,274 |
|
| Mexico - 0.9% | | | |
| Corporacion Inmobiliaria Vesta S.A.B. de CV | | 3,468,062 | 5,494,862 |
| Netherlands - 0.2% | | | |
| Instone Real Estate Group BV (b) | | 48,376 | 1,244,506 |
| New Zealand - 1.2% | | | |
| Auckland International Airport Ltd. | | 1,649,741 | 7,505,794 |
| Norway - 2.3% | | | |
| Olav Thon Eiendomsselskap A/S | | 494,858 | 9,379,469 |
| Self Storage Group ASA | | 1,548,544 | 3,132,533 |
| Selvaag Bolig ASA | | 274,100 | 1,493,719 |
|
| TOTAL NORWAY | | | 14,005,721 |
|
| Singapore - 8.0% | | | |
| Parkway Life REIT | | 8,775,400 | 17,791,240 |
| United Industrial Corp. Ltd. | | 4,115,200 | 9,522,077 |
| UOL Group Ltd. | | 2,078,347 | 10,946,302 |
| Wing Tai Holdings Ltd. | | 7,278,681 | 11,067,594 |
|
| TOTAL SINGAPORE | | | 49,327,213 |
|
| Spain - 1.5% | | | |
| Inmobiliaria Colonial SA | | 415,270 | 4,474,767 |
| Melia Hotels International SA | | 362,600 | 4,770,071 |
|
| TOTAL SPAIN | | | 9,244,838 |
|
| Sweden - 6.8% | | | |
| Amasten Holding AB (a)(c) | | 12,594,747 | 6,775,104 |
| D. Carnegie & Co. AB (a) | | 603,700 | 11,259,793 |
| Fastighets AB Trianon Class B (d) | | 443,600 | 3,531,466 |
| Hufvudstaden AB Series A | | 958,350 | 14,822,739 |
| Wallenstam AB (B Shares) | | 547,600 | 5,629,856 |
|
| TOTAL SWEDEN | | | 42,018,958 |
|
| Switzerland - 2.3% | | | |
| PSP Swiss Property AG | | 152,534 | 14,372,996 |
| United Kingdom - 11.0% | | | |
| Assura PLC | | 12,492,420 | 9,280,660 |
| Big Yellow Group PLC | | 610,400 | 7,623,233 |
| Grainger Trust PLC | | 2,315,407 | 9,311,764 |
| Great Portland Estates PLC | | 748,748 | 7,035,645 |
| Helical Bar PLC | | 1,746,045 | 7,333,668 |
| Land Securities Group PLC | | 663,518 | 8,210,850 |
| Safestore Holdings PLC | | 1,102,054 | 8,100,405 |
| Shaftesbury PLC | | 594,700 | 7,274,945 |
| St. Modwen Properties PLC | | 651,725 | 3,464,458 |
|
| TOTAL UNITED KINGDOM | | | 67,635,628 |
|
| United States of America - 0.5% | | | |
| Alphabet, Inc. Class C (a) | | 1,300 | 1,582,438 |
| Amazon.com, Inc. (a) | | 700 | 1,244,208 |
|
| TOTAL UNITED STATES OF AMERICA | | | 2,826,646 |
|
| TOTAL COMMON STOCKS | | | |
| (Cost $588,485,117) | | | 589,229,769 |
|
| Money Market Funds - 4.5% | | | |
| Fidelity Cash Central Fund, 1.96% (e) | | 27,483,728 | 27,489,225 |
| Fidelity Securities Lending Cash Central Fund 1.97% (e)(f) | | 58,767 | 58,773 |
| TOTAL MONEY MARKET FUNDS | | | |
| (Cost $27,548,692) | | | 27,547,998 |
| TOTAL INVESTMENT IN SECURITIES - 100.3% | | | |
| (Cost $616,033,809) | | | 616,777,767 |
| NET OTHER ASSETS (LIABILITIES) - (0.3)% | | | (1,618,263) |
| NET ASSETS - 100% | | | $615,159,504 |
Categorizations in the Schedule of Investments are based on country or territory of incorporation.
Legend
(a) Non-income producing
(b) Security exempt from registration under Rule 144A of the Securities Act of 1933. These securities may be resold in transactions exempt from registration, normally to qualified institutional buyers. At the end of the period, the value of these securities amounted to $6,156,711 or 1.0% of net assets.
(c) Affiliated company
(d) Security or a portion of the security is on loan at period end.
(e) Affiliated fund that is generally available only to investment companies and other accounts managed by Fidelity Investments. The rate quoted is the annualized seven-day yield of the fund at period end. A complete unaudited listing of the fund's holdings as of its most recent quarter end is available upon request. In addition, each Fidelity Central Fund's financial statements, which are not covered by the Fund's Report of Independent Registered Public Accounting Firm, are available on the SEC's website or upon request.
(f) Investment made with cash collateral received from securities on loan.
Affiliated Central Funds
Information regarding fiscal year to date income earned by the Fund from investments in Fidelity Central Funds is as follows:
| Fund | Income earned |
| Fidelity Cash Central Fund | $355,720 |
| Fidelity Securities Lending Cash Central Fund | 64,783 |
| Total | $420,503 |
Amounts in the income column in the above table include any capital gain distributions from underlying funds, which are presented in the corresponding line-item in the Statement of Operations if applicable.
Other Affiliated Issuers
An affiliated company is a company in which the Fund has ownership of at least 5% of the voting securities. Fiscal year to date transactions with companies which are or were affiliates are as follows:
| Affiliate | Value, beginning of period | Purchases | Sales Proceeds | Dividend Income | Realized Gain (loss) | Change in Unrealized appreciation (depreciation) | Value, end of period |
| Amasten Holding AB | $2,097,020 | $3,945,378 | $634,640 | $-- | $143,105 | $1,224,241 | $6,775,104 |
| Total | $2,097,020 | $3,945,378 | $634,640 | $-- | $143,105 | $1,224,241 | $6,775,104 |
Investment Valuation
The following is a summary of the inputs used, as of July 31, 2018, involving the Fund's assets and liabilities carried at fair value. The inputs or methodology used for valuing securities may not be an indication of the risk associated with investing in those securities. For more information on valuation inputs, and their aggregation into the levels used below, please refer to the Investment Valuation section in the accompanying Notes to Financial Statements.
| | Valuation Inputs at Reporting Date: |
| Description | Total | Level 1 | Level 2 | Level 3 |
| Investments in Securities: | | | | |
| Equities: | | | | |
| Consumer Discretionary | $14,842,802 | $14,842,802 | $-- | $-- |
| Financials | 7,612,790 | 7,612,790 | -- | -- |
| Health Care | 2,996,874 | 2,996,874 | -- | -- |
| Industrials | 7,505,794 | 7,505,794 | -- | -- |
| Information Technology | 9,415,431 | 9,415,431 | -- | -- |
| Real Estate | 546,856,078 | 485,327,509 | 61,528,569 | -- |
| Money Market Funds | 27,547,998 | 27,547,998 | -- | -- |
| Total Investments in Securities: | $616,777,767 | $555,249,198 | $61,528,569 | $-- |
The following is a summary of transfers between Level 1 and Level 2 for the period ended July 31, 2018. Transfers are assumed to have occurred at the beginning of the period, and are primarily attributable to the valuation techniques used for foreign equity securities, as discussed in the accompanying Notes to Financial Statements:
| Transfers | Total |
| Level 1 to Level 2 | $36,210,922 |
| Level 2 to Level 1 | $0 |
See accompanying notes which are an integral part of the financial statements.
Financial Statements
Statement of Assets and Liabilities
| | | July 31, 2018 |
| Assets | | |
Investment in securities, at value (including securities loaned of $55,767) — See accompanying schedule:
Unaffiliated issuers (cost $583,073,873) | $582,454,665 | |
| Fidelity Central Funds (cost $27,548,692) | 27,547,998 | |
| Other affiliated issuers (cost $5,411,244) | 6,775,104 | |
| Total Investment in Securities (cost $616,033,809) | | $616,777,767 |
| Receivable for investments sold | | 1,372,651 |
| Receivable for fund shares sold | | 409,012 |
| Dividends receivable | | 1,893,736 |
| Distributions receivable from Fidelity Central Funds | | 45,506 |
| Prepaid expenses | | 5,806 |
| Other receivables | | 5,498 |
| Total assets | | 620,509,976 |
| Liabilities | | |
| Payable to custodian bank | $981 | |
| Payable for investments purchased | 4,053,106 | |
| Payable for fund shares redeemed | 667,708 | |
| Accrued management fee | 350,754 | |
| Distribution and service plan fees payable | 8,386 | |
| Other affiliated payables | 116,730 | |
| Other payables and accrued expenses | 94,637 | |
| Collateral on securities loaned | 58,170 | |
| Total liabilities | | 5,350,472 |
| Net Assets | | $615,159,504 |
| Net Assets consist of: | | |
| Paid in capital | | $610,216,172 |
| Undistributed net investment income | | 9,800,848 |
| Accumulated undistributed net realized gain (loss) on investments and foreign currency transactions | | (5,609,971) |
| Net unrealized appreciation (depreciation) on investments and assets and liabilities in foreign currencies | | 752,455 |
| Net Assets | | $615,159,504 |
| Calculation of Maximum Offering Price | | |
| Class A: | | |
| Net Asset Value and redemption price per share ($11,318,576 ÷ 973,430 shares) | | $11.63 |
| Maximum offering price per share (100/94.25 of $11.63) | | $12.34 |
| Class M: | | |
| Net Asset Value and redemption price per share ($4,360,365 ÷ 378,274 shares) | | $11.53 |
| Maximum offering price per share (100/96.50 of $11.53) | | $11.95 |
| Class C: | | |
| Net Asset Value and offering price per share ($4,893,763 ÷ 431,765 shares)(a) | | $11.33 |
| International Real Estate: | | |
| Net Asset Value, offering price and redemption price per share ($244,194,897 ÷ 20,733,961 shares) | | $11.78 |
| Class I: | | |
| Net Asset Value, offering price and redemption price per share ($350,391,903 ÷ 29,944,912 shares) | | $11.70 |
(a) Redemption price per share is equal to net asset value less any applicable contingent deferred sales charge.
See accompanying notes which are an integral part of the financial statements.
Statement of Operations
| | | Year ended July 31, 2018 |
| Investment Income | | |
| Dividends | | $18,885,224 |
| Income from Fidelity Central Funds | | 420,503 |
| Income before foreign taxes withheld | | 19,305,727 |
| Less foreign taxes withheld | | (1,574,477) |
| Total income | | 17,731,250 |
| Expenses | | |
| Management fee | $3,622,340 | |
| Transfer agent fees | 975,030 | |
| Distribution and service plan fees | 100,019 | |
| Accounting and security lending fees | 268,272 | |
| Custodian fees and expenses | 141,917 | |
| Independent trustees' fees and expenses | 6,775 | |
| Registration fees | 154,592 | |
| Audit | 64,900 | |
| Legal | 5,493 | |
| Miscellaneous | 24,328 | |
| Total expenses before reductions | 5,363,666 | |
| Expense reductions | (39,019) | |
| Total expenses after reductions | | 5,324,647 |
| Net investment income (loss) | | 12,406,603 |
| Realized and Unrealized Gain (Loss) | | |
| Net realized gain (loss) on: | | |
| Investment securities: | | |
| Unaffiliated issuers (net of foreign taxes of $35,832) | 36,328,223 | |
| Fidelity Central Funds | 45 | |
| Other affiliated issuers | 143,105 | |
| Foreign currency transactions | (52,157) | |
| Total net realized gain (loss) | | 36,419,216 |
| Change in net unrealized appreciation (depreciation) on: | | |
| Investment securities: | | |
| Unaffiliated issuers | (9,003,743) | |
| Fidelity Central Funds | 7 | |
| Other affiliated issuers | 1,224,241 | |
| Assets and liabilities in foreign currencies | (38,756) | |
| Total change in net unrealized appreciation (depreciation) | | (7,818,251) |
| Net gain (loss) | | 28,600,965 |
| Net increase (decrease) in net assets resulting from operations | | $41,007,568 |
See accompanying notes which are an integral part of the financial statements.
Statement of Changes in Net Assets
| | Year ended July 31, 2018 | Year ended July 31, 2017 |
| Increase (Decrease) in Net Assets | | |
| Operations | | |
| Net investment income (loss) | $12,406,603 | $7,521,781 |
| Net realized gain (loss) | 36,419,216 | 4,415,065 |
| Change in net unrealized appreciation (depreciation) | (7,818,251) | 19,827,836 |
| Net increase (decrease) in net assets resulting from operations | 41,007,568 | 31,764,682 |
| Distributions to shareholders from net investment income | (10,124,814) | (6,452,012) |
| Distributions to shareholders from net realized gain | (4,548,679) | (10,755,458) |
| Total distributions | (14,673,493) | (17,207,470) |
| Share transactions - net increase (decrease) | 172,199,968 | (61,871,515) |
| Redemption fees | 19,597 | 42,646 |
| Total increase (decrease) in net assets | 198,553,640 | (47,271,657) |
| Net Assets | | |
| Beginning of period | 416,605,864 | 463,877,521 |
| End of period | $615,159,504 | $416,605,864 |
| Other Information | | |
| Undistributed net investment income end of period | $9,800,848 | $7,518,086 |
See accompanying notes which are an integral part of the financial statements.
Financial Highlights
Fidelity International Real Estate Fund Class A
| Years ended July 31, | 2018 | 2017 | 2016 | 2015 | 2014 |
| Selected Per–Share Data | | | | | |
| Net asset value, beginning of period | $11.03 | $10.46 | $10.56 | $10.85 | $10.11 |
| Income from Investment Operations | | | | | |
| Net investment income (loss)A | .23 | .16 | .15 | .26B | .16 |
| Net realized and unrealized gain (loss) | .69 | .79 | .02 | (.10)C | 1.09 |
| Total from investment operations | .92 | .95 | .17 | .16 | 1.25 |
| Distributions from net investment income | (.21) | (.13) | (.15) | (.14) | (.16) |
| Distributions from net realized gain | (.11) | (.25) | (.12) | (.31) | (.35) |
| Total distributions | (.32) | (.38) | (.27) | (.45) | (.51) |
| Redemption fees added to paid in capitalA,D | – | – | – | – | – |
| Net asset value, end of period | $11.63 | $11.03 | $10.46 | $10.56 | $10.85 |
| Total ReturnE,F | 8.49% | 9.48% | 1.75% | 1.67%C | 12.85% |
| Ratios to Average Net AssetsG,H | | | | | |
| Expenses before reductions | 1.36% | 1.35% | 1.35% | 1.34% | 1.38% |
| Expenses net of fee waivers, if any | 1.36% | 1.35% | 1.35% | 1.34% | 1.38% |
| Expenses net of all reductions | 1.35% | 1.35% | 1.33% | 1.34% | 1.38% |
| Net investment income (loss) | 2.03% | 1.60% | 1.51% | 2.45%B | 1.57% |
| Supplemental Data | | | | | |
| Net assets, end of period (000 omitted) | $11,319 | $10,170 | $14,020 | $17,162 | $13,933 |
| Portfolio turnover rateI | 56% | 55% | 71% | 82% | 59% |
A Calculated based on average shares outstanding during the period.
B Net investment income per share reflects large, non-recurring dividend which amounted to $.14 per share. Excluding this non-recurring dividend, the ratio of net investment income (loss) to average net assets would have been 1.15%.
C Amount includes a reimbursement from the investment adviser for an operational error which amounted to less than $.01 per share. Excluding this reimbursement, the total return would have been 1.64%.
D Amount represents less than $.005 per share.
E Total returns would have been lower if certain expenses had not been reduced during the applicable periods shown.
F Total returns do not include the effect of the sales charges.
G Fees and expenses of any underlying Fidelity Central Funds are not included in the Fund's expense ratio. The Fund indirectly bears its proportionate share of the expenses of any underlying Fidelity Central Funds.
H Expense ratios reflect operating expenses of the class. Expenses before reductions do not reflect amounts reimbursed by the investment adviser or reductions from brokerage service arrangements or reductions from other expense offset arrangements and do not represent the amount paid by the class during periods when reimbursements or reductions occur. Expenses net of fee waivers reflect expenses after reimbursement by the investment adviser but prior to reductions from brokerage service arrangements or other expense offset arrangements. Expenses net of all reductions represent the net expenses paid by the class.
I Amount does not include the portfolio activity of any underlying Fidelity Central Funds.
See accompanying notes which are an integral part of the financial statements.
Fidelity International Real Estate Fund Class M
| Years ended July 31, | 2018 | 2017 | 2016 | 2015 | 2014 |
| Selected Per–Share Data | | | | | |
| Net asset value, beginning of period | $10.93 | $10.39 | $10.49 | $10.76 | $10.04 |
| Income from Investment Operations | | | | | |
| Net investment income (loss)A | .20 | .13 | .12 | .22B | .13 |
| Net realized and unrealized gain (loss) | .68 | .77 | .02 | (.08)C | 1.07 |
| Total from investment operations | .88 | .90 | .14 | .14 | 1.20 |
| Distributions from net investment income | (.17) | (.12) | (.11) | (.10) | (.14) |
| Distributions from net realized gain | (.11) | (.25) | (.12) | (.31) | (.35) |
| Total distributions | (.28) | (.36)D | (.24)E | (.41) | (.48)F |
| Redemption fees added to paid in capitalA,G | – | – | – | – | – |
| Net asset value, end of period | $11.53 | $10.93 | $10.39 | $10.49 | $10.76 |
| Total ReturnH,I | 8.19% | 9.07% | 1.43% | 1.49%C | 12.50% |
| Ratios to Average Net AssetsJ,K | | | | | |
| Expenses before reductions | 1.65% | 1.65% | 1.66% | 1.64% | 1.66% |
| Expenses net of fee waivers, if any | 1.65% | 1.65% | 1.66% | 1.64% | 1.66% |
| Expenses net of all reductions | 1.65% | 1.65% | 1.64% | 1.63% | 1.65% |
| Net investment income (loss) | 1.74% | 1.31% | 1.20% | 2.15%B | 1.30% |
| Supplemental Data | | | | | |
| Net assets, end of period (000 omitted) | $4,360 | $4,147 | $4,545 | $4,939 | $5,563 |
| Portfolio turnover rateL | 56% | 55% | 71% | 82% | 59% |
A Calculated based on average shares outstanding during the period.
B Net Investment income per share reflects a large, non-recurring dividend which amounted to $.14 per share. Excluding this non-recurring dividend, the ratio of net investment income (loss) to average net assets would have been .86%.
C Amount includes a reimbursement from the investment adviser for an operational error which amounted to less than $.01 per share. Excluding this reimbursement, the total return would have been 1.46%.
D Total distributions of $.36 per share is comprised of distributions from net investment income of $.115 and distributions from net realized gain of $.246 per share.
E Total distributions of $.24 per share is comprised of distributions from net investment income of $.114 and distributions from net realized gain of $.121 per share.
F Total distributions of $.48 per share is comprised of distributions from net investment income of $.136 and distributions from net realized gain of $.348 per share.
G Amount represents less than $.005 per share.
H Total returns would have been lower if certain expenses had not been reduced during the applicable periods shown.
I Total returns do not include the effect of the sales charges.
J Fees and expenses of any underlying Fidelity Central Funds are not included in the Fund's expense ratio. The Fund indirectly bears its proportionate share of the expenses of any underlying Fidelity Central Funds.
K Expense ratios reflect operating expenses of the class. Expenses before reductions do not reflect amounts reimbursed by the investment adviser or reductions from brokerage service arrangements or reductions from other expense offset arrangements and do not represent the amount paid by the class during periods when reimbursements or reductions occur. Expenses net of fee waivers reflect expenses after reimbursement by the investment adviser but prior to reductions from brokerage service arrangements or other expense offset arrangements. Expenses net of all reductions represent the net expenses paid by the class.
L Amount does not include the portfolio activity of any underlying Fidelity Central Funds.
See accompanying notes which are an integral part of the financial statements.
Fidelity International Real Estate Fund Class C
| Years ended July 31, | 2018 | 2017 | 2016 | 2015 | 2014 |
| Selected Per–Share Data | | | | | |
| Net asset value, beginning of period | $10.73 | $10.21 | $10.32 | $10.60 | $9.89 |
| Income from Investment Operations | | | | | |
| Net investment income (loss)A | .15 | .09 | .07 | .17B | .08 |
| Net realized and unrealized gain (loss) | .67 | .76 | .02 | (.08)C | 1.07 |
| Total from investment operations | .82 | .85 | .09 | .09 | 1.15 |
| Distributions from net investment income | (.10) | (.09) | (.07) | (.07) | (.09) |
| Distributions from net realized gain | (.11) | (.25) | (.12) | (.30) | (.35) |
| Total distributions | (.22)D | (.33)E | (.20)F | (.37) | (.44) |
| Redemption fees added to paid in capitalA,G | – | – | – | – | – |
| Net asset value, end of period | $11.33 | $10.73 | $10.21 | $10.32 | $10.60 |
| Total ReturnH,I | 7.70% | 8.69% | .93% | .97%C | 12.04% |
| Ratios to Average Net AssetsJ,K | | | | | |
| Expenses before reductions | 2.05% | 2.09% | 2.10% | 2.09% | 2.13% |
| Expenses net of fee waivers, if any | 2.04% | 2.08% | 2.10% | 2.09% | 2.13% |
| Expenses net of all reductions | 2.04% | 2.08% | 2.09% | 2.09% | 2.13% |
| Net investment income (loss) | 1.35% | .87% | .75% | 1.70%B | .82% |
| Supplemental Data | | | | | |
| Net assets, end of period (000 omitted) | $4,894 | $4,818 | $5,668 | $6,548 | $6,504 |
| Portfolio turnover rateL | 56% | 55% | 71% | 82% | 59% |
A Calculated based on average shares outstanding during the period.
B Net Investment income per share reflects a large, non-recurring dividend which amounted to $.13 per share. Excluding this non-recurring dividend, the ratio of net investment income (loss) to average net assets would have been .41%.
C Amount includes a reimbursement from the investment adviser for an operational error which amounted to less than $.01 per share. Excluding this reimbursement, the total return would have been .94%.
D Total distributions of $.22 per share is comprised of distributions from net investment income of $.103 and distributions from net realized gain of $.112 per share.
E Total distributions of $.33 per share is comprised of distributions from net investment income of $.085 and distributions from net realized gain of $.246 per share.
F Total distributions of $.20 per share is comprised of distributions from net investment income of $.074 and distributions from net realized gain of $.121 per share.
G Amount represents less than $.005 per share.
H Total returns would have been lower if certain expenses had not been reduced during the applicable periods shown.
I Total returns do not include the effect of the contingent deferred sales charge.
J Fees and expenses of any underlying Fidelity Central Funds are not included in the Fund's expense ratio. The Fund indirectly bears its proportionate share of the expenses of any underlying Fidelity Central Funds.
K Expense ratios reflect operating expenses of the class. Expenses before reductions do not reflect amounts reimbursed by the investment adviser or reductions from brokerage service arrangements or reductions from other expense offset arrangements and do not represent the amount paid by the class during periods when reimbursements or reductions occur. Expenses net of fee waivers reflect expenses after reimbursement by the investment adviser but prior to reductions from brokerage service arrangements or other expense offset arrangements. Expenses net of all reductions represent the net expenses paid by the class.
L Amount does not include the portfolio activity of any underlying Fidelity Central Funds.
See accompanying notes which are an integral part of the financial statements.
Fidelity International Real Estate Fund
| Years ended July 31, | 2018 | 2017 | 2016 | 2015 | 2014 |
| Selected Per–Share Data | | | | | |
| Net asset value, beginning of period | $11.17 | $10.58 | $10.68 | $10.96 | $10.21 |
| Income from Investment Operations | | | | | |
| Net investment income (loss)A | .27 | .19 | .17 | .28B | .19 |
| Net realized and unrealized gain (loss) | .70 | .79 | .02 | (.09)C | 1.09 |
| Total from investment operations | .97 | .98 | .19 | .19 | 1.28 |
| Distributions from net investment income | (.24) | (.15) | (.17) | (.16) | (.18) |
| Distributions from net realized gain | (.11) | (.25) | (.12) | (.31) | (.35) |
| Total distributions | (.36)D | (.39)E | (.29) | (.47) | (.53) |
| Redemption fees added to paid in capitalA,F | – | – | – | – | – |
| Net asset value, end of period | $11.78 | $11.17 | $10.58 | $10.68 | $10.96 |
| Total ReturnG | 8.84% | 9.74% | 1.94% | 1.95%C | 13.12% |
| Ratios to Average Net AssetsH,I | | | | | |
| Expenses before reductions | 1.05% | 1.12% | 1.13% | 1.12% | 1.13% |
| Expenses net of fee waivers, if any | 1.05% | 1.12% | 1.13% | 1.12% | 1.13% |
| Expenses net of all reductions | 1.04% | 1.11% | 1.11% | 1.12% | 1.13% |
| Net investment income (loss) | 2.34% | 1.84% | 1.73% | 2.67%B | 1.82% |
| Supplemental Data | | | | | |
| Net assets, end of period (000 omitted) | $244,195 | $226,027 | $341,407 | $330,910 | $342,960 |
| Portfolio turnover rateJ | 56% | 55% | 71% | 82% | 59% |
A Calculated based on average shares outstanding during the period.
B Net Investment income per share reflects a large, non-recurring dividend which amounted to $.14 per share. Excluding this non-recurring dividend, the ratio of net investment income (loss) to average net assets would have been 1.38%.
C Amount includes a reimbursement from the investment adviser for an operational error which amounted to less than $.01 per share. Excluding this reimbursement, the total return would have been 1.92%.
D Total distributions of $.36 per share is comprised of distributions from net investment income of $.244 and distributions from net realized gain of $.112 per share.
E Total distributions of $.39 per share is comprised of distributions from net investment income of $.147 and distributions from net realized gain of $.246 per share.
F Amount represents less than $.005 per share.
G Total returns would have been lower if certain expenses had not been reduced during the applicable periods shown.
H Fees and expenses of any underlying Fidelity Central Funds are not included in the Fund's expense ratio. The Fund indirectly bears its proportionate share of the expenses of any underlying Fidelity Central Funds.
I Expense ratios reflect operating expenses of the class. Expenses before reductions do not reflect amounts reimbursed by the investment adviser or reductions from brokerage service arrangements or reductions from other expense offset arrangements and do not represent the amount paid by the class during periods when reimbursements or reductions occur. Expenses net of fee waivers reflect expenses after reimbursement by the investment adviser but prior to reductions from brokerage service arrangements or other expense offset arrangements. Expenses net of all reductions represent the net expenses paid by the class.
J Amount does not include the portfolio activity of any underlying Fidelity Central Funds.
See accompanying notes which are an integral part of the financial statements.
Fidelity International Real Estate Fund Class I
| Years ended July 31, | 2018 | 2017 | 2016 | 2015 | 2014 |
| Selected Per–Share Data | | | | | |
| Net asset value, beginning of period | $11.13 | $10.54 | $10.64 | $10.92 | $10.18 |
| Income from Investment Operations | | | | | |
| Net investment income (loss)A | .28 | .20 | .19 | .29B | .19 |
| Net realized and unrealized gain (loss) | .68 | .79 | .02 | (.09)C | 1.09 |
| Total from investment operations | .96 | .99 | .21 | .20 | 1.28 |
| Distributions from net investment income | (.28) | (.16) | (.19) | (.17) | (.19) |
| Distributions from net realized gain | (.11) | (.25) | (.12) | (.31) | (.35) |
| Total distributions | (.39) | (.40)D | (.31) | (.48) | (.54) |
| Redemption fees added to paid in capitalA,E | – | – | – | – | – |
| Net asset value, end of period | $11.70 | $11.13 | $10.54 | $10.64 | $10.92 |
| Total ReturnF | 8.88% | 9.89% | 2.15% | 2.01%C | 13.16% |
| Ratios to Average Net AssetsG,H | | | | | |
| Expenses before reductions | .96% | .95% | .97% | 1.03% | 1.12% |
| Expenses net of fee waivers, if any | .96% | .95% | .97% | 1.03% | 1.12% |
| Expenses net of all reductions | .95% | .95% | .96% | 1.03% | 1.12% |
| Net investment income (loss) | 2.44% | 2.00% | 1.89% | 2.76%B | 1.84% |
| Supplemental Data | | | | | |
| Net assets, end of period (000 omitted) | $350,392 | $171,444 | $98,238 | $37,426 | $7,336 |
| Portfolio turnover rateI | 56% | 55% | 71% | 82% | 59% |
A Calculated based on average shares outstanding during the period.
B Net Investment income per share reflects a large, non-recurring dividend which amounted to $.14 per share. Excluding this non-recurring dividend, the ratio of net investment income (loss) to average net assets would have been 1.46%.
C Amount includes a reimbursement from the investment adviser for an operational error which amounted to less than $.01 per share. Excluding this reimbursement, the total return would have been 1.98%.
D Total distributions of $.40 per share is comprised of distributions from net investment income of $.157 and distributions from net realized gain of $.246 per share.
E Amount represents less than $.005 per share.
F Total returns would have been lower if certain expenses had not been reduced during the applicable periods shown.
G Fees and expenses of any underlying Fidelity Central Funds are not included in the Fund's expense ratio. The Fund indirectly bears its proportionate share of the expenses of any underlying Fidelity Central Funds.
H Expense ratios reflect operating expenses of the class. Expenses before reductions do not reflect amounts reimbursed by the investment adviser or reductions from brokerage service arrangements or reductions from other expense offset arrangements and do not represent the amount paid by the class during periods when reimbursements or reductions occur. Expenses net of fee waivers reflect expenses after reimbursement by the investment adviser but prior to reductions from brokerage service arrangements or other expense offset arrangements. Expenses net of all reductions represent the net expenses paid by the class.
I Amount does not include the portfolio activity of any underlying Fidelity Central Funds.
See accompanying notes which are an integral part of the financial statements.
Notes to Financial Statements
For the period ended July 31, 2018
1. Organization.
Fidelity International Real Estate Fund (the Fund) is a non-diversified fund of Fidelity Select Portfolios (the Trust) and is authorized to issue an unlimited number of shares. The Trust is registered under the Investment Company Act of 1940, as amended (the 1940 Act), as an open-end management investment company organized as a Massachusetts business trust. The Fund offers Class A, Class M, Class C, International Real Estate, and Class I shares, each of which has equal rights as to assets and voting privileges. Each class has exclusive voting rights with respect to matters that affect that class.
2. Investments in Fidelity Central Funds.
The Fund invests in Fidelity Central Funds, which are open-end investment companies generally available only to other investment companies and accounts managed by the investment adviser and its affiliates. The Fund's Schedule of Investments lists each of the Fidelity Central Funds held as of period end, if any, as an investment of the Fund, but does not include the underlying holdings of each Fidelity Central Fund. As an Investing Fund, the Fund indirectly bears its proportionate share of the expenses of the underlying Fidelity Central Funds.
The Money Market Central Funds seek preservation of capital and current income and are managed by Fidelity Investments Money Management, Inc. (FIMM), an affiliate of the investment adviser. Annualized expenses of the Money Market Central Funds as of their most recent shareholder report date are less than .005%.
A complete unaudited list of holdings for each Fidelity Central Fund is available upon request or at the Securities and Exchange Commission (the SEC) website at www.sec.gov. In addition, the financial statements of the Fidelity Central Funds, which are not covered by the Fund's Report of Independent Registered Public Accounting Firm, are available on the SEC website or upon request.
3. Significant Accounting Policies.
The Fund is an investment company and applies the accounting and reporting guidance of the Financial Accounting Standards Board (FASB) Accounting Standards Codification Topic 946 Financial Services – Investments Companies. The financial statements have been prepared in conformity with accounting principles generally accepted in the United States of America (GAAP), which require management to make certain estimates and assumptions at the date of the financial statements. Actual results could differ from those estimates. Subsequent events, if any, through the date that the financial statements were issued have been evaluated in the preparation of the financial statements. The following summarizes the significant accounting policies of the Fund:
Investment Valuation. Investments are valued as of 4:00 p.m. Eastern time on the last calendar day of the period. The Board of Trustees (the Board) has delegated the day to day responsibility for the valuation of the Fund's investments to the Fair Value Committee (the Committee) established by the Fund's investment adviser. In accordance with valuation policies and procedures approved by the Board, the Fund attempts to obtain prices from one or more third party pricing vendors or brokers to value its investments. When current market prices, quotations or currency exchange rates are not readily available or reliable, investments will be fair valued in good faith by the Committee, in accordance with procedures adopted by the Board. Factors used in determining fair value vary by investment type and may include market or investment specific events. The frequency with which these procedures are used cannot be predicted and they may be utilized to a significant extent. The Committee oversees the Fund's valuation policies and procedures and reports to the Board on the Committee's activities and fair value determinations. The Board monitors the appropriateness of the procedures used in valuing the Fund's investments and ratifies the fair value determinations of the Committee.
The Fund categorizes the inputs to valuation techniques used to value its investments into a disclosure hierarchy consisting of three levels as shown below:
- Level 1 – quoted prices in active markets for identical investments
- Level 2 – other significant observable inputs (including quoted prices for similar investments, interest rates, prepayment speeds, etc.)
- Level 3 – unobservable inputs (including the Fund's own assumptions based on the best information available)
Valuation techniques used to value the Fund's investments by major category are as follows:
Equity securities, including restricted securities, for which market quotations are readily available, are valued at the last reported sale price or official closing price as reported by a third party pricing vendor on the primary market or exchange on which they are traded and are categorized as Level 1 in the hierarchy. In the event there were no sales during the day or closing prices are not available, securities are valued at the last quoted bid price or may be valued using the last available price and are generally categorized as Level 2 in the hierarchy. For foreign equity securities, when market or security specific events arise, comparisons to the valuation of American Depositary Receipts (ADRs), futures contracts, Exchange-Traded Funds (ETFs) and certain indexes as well as quoted prices for similar securities may be used and would be categorized as Level 2 in the hierarchy. Utilizing these techniques may result in transfers between Level 1 and Level 2. For equity securities, including restricted securities, where observable inputs are limited, assumptions about market activity and risk are used and these securities may be categorized as Level 3 in the hierarchy.
Investments in open-end mutual funds, including the Fidelity Central Funds, are valued at their closing net asset value (NAV) each business day and are categorized as Level 1 in the hierarchy.
Changes in valuation techniques may result in transfers in or out of an assigned level within the disclosure hierarchy. The aggregate value of investments by input level as of July 31, 2018, including information on transfers between Levels 1 and 2, is included at the end of the Fund's Schedule of Investments.
Foreign Currency. The Fund may use foreign currency contracts to facilitate transactions in foreign-denominated securities. Gains and losses from these transactions may arise from changes in the value of the foreign currency or if the counterparties do not perform under the contracts' terms.
Foreign-denominated assets, including investment securities, and liabilities are translated into U.S. dollars at the exchange rates at period end. Purchases and sales of investment securities, income and dividends received and expenses denominated in foreign currencies are translated into U.S. dollars at the exchange rate in effect on the transaction date.
The effects of exchange rate fluctuations on investments are included with the net realized and unrealized gain (loss) on investment securities. Other foreign currency transactions resulting in realized and unrealized gain (loss) are disclosed separately.
Investment Transactions and Income. For financial reporting purposes, the Fund's investment holdings and NAV include trades executed through the end of the last business day of the period. The NAV per share for processing shareholder transactions is calculated as of the close of business of the New York Stock Exchange (NYSE), normally 4:00 p.m. Eastern time and includes trades executed through the end of the prior business day. Gains and losses on securities sold are determined on the basis of identified cost. Dividend income is recorded on the ex-dividend date, except for certain dividends from foreign securities where the ex-dividend date may have passed, which are recorded as soon as the Fund is informed of the ex-dividend date. Non-cash dividends included in dividend income, if any, are recorded at the fair market value of the securities received. Income and capital gain distributions from Fidelity Central Funds, if any, are recorded on the ex-dividend date. Investment income is recorded net of foreign taxes withheld where recovery of such taxes is uncertain.
Class Allocations and Expenses. Investment income, realized and unrealized capital gains and losses, common expenses of the Fund, and certain fund-level expense reductions, if any, are allocated daily on a pro-rata basis to each class based on the relative net assets of each class to the total net assets of the Fund. Each class differs with respect to transfer agent and distribution and service plan fees incurred. Certain expense reductions may also differ by class. For the reporting period, the allocated portion of income and expenses to each class as a percent of its average net assets may vary due to the timing of recording these transactions in relation to fluctuating net assets of the classes. Expenses directly attributable to a fund are charged to that fund. Expenses attributable to more than one fund are allocated among the respective funds on the basis of relative net assets or other appropriate methods. Expense estimates are accrued in the period to which they relate and adjustments are made when actual amounts are known.
Income Tax Information and Distributions to Shareholders. Each year, the Fund intends to qualify as a regulated investment company under Subchapter M of the Internal Revenue Code, including distributing substantially all of its taxable income and realized gains. As a result, no provision for U.S. Federal income taxes is required. As of July 31, 2018, the Fund did not have any unrecognized tax benefits in the financial statements; nor is the Fund aware of any tax positions for which it is reasonably possible that the total amounts of unrecognized tax benefits will significantly change in the next twelve months. The Fund files a U.S. federal tax return, in addition to state and local tax returns as required. The Fund's federal income tax returns are subject to examination by the Internal Revenue Service (IRS) for a period of three fiscal years after they are filed. State and local tax returns may be subject to examination for an additional fiscal year depending on the jurisdiction. Foreign taxes are provided for based on the Fund's understanding of the tax rules and rates that exist in the foreign markets in which it invests. The Fund is subject to a tax imposed on capital gains by certain countries in which it invests.
Distributions are declared and recorded on the ex-dividend date. Income and capital gain distributions are declared separately for each class. Income and capital gain distributions are determined in accordance with income tax regulations, which may differ from GAAP.
Capital accounts within the financial statements are adjusted for permanent book-tax differences. These adjustments have no impact on net assets or the results of operations. Capital accounts are not adjusted for temporary book-tax differences which will reverse in a subsequent period.
Book-tax differences are primarily due to foreign currency transactions, certain foreign taxes, passive foreign investment companies (PFIC), capital loss carryforwards, expiring capital loss carryforwards and losses deferred due to wash sales.
As of period end, the cost and unrealized appreciation (depreciation) in securities, and derivatives if applicable, for federal income tax purposes were as follows:
| Gross unrealized appreciation | $26,483,698 |
| Gross unrealized depreciation | (32,858,528) |
| Net unrealized appreciation (depreciation) | $(6,374,830) |
| Tax Cost | $623,152,597 |
The tax-based components of distributable earnings as of period end were as follows:
| Undistributed ordinary income | $11,312,387 |
| Net unrealized appreciation (depreciation) on securities and other investments | $(6,369,056) |
The tax character of distributions paid was as follows:
| | July 31, 2018 | July 31, 2017 |
| Ordinary Income | $14,673,493 | $ 17,207,470 |
Short-Term Trading (Redemption) Fees. Shares held by investors in the Fund less than 90 days may have been subject to a redemption fee equal to 1.50% of the NAV of shares redeemed. All redemption fees, which reduce the proceeds of the shareholder redemption, are retained by the Fund and accounted for as an addition to paid in capital. In November 2017, the Board of Trustees approved the elimination of these redemption fees effective December 18, 2017.
Restricted Securities. The Fund may invest in securities that are subject to legal or contractual restrictions on resale. These securities generally may be resold in transactions exempt from registration or to the public if the securities are registered. Disposal of these securities may involve time-consuming negotiations and expense, and prompt sale at an acceptable price may be difficult. Information regarding restricted securities is included at the end of the Fund's Schedule of Investments.
4. Purchases and Sales of Investments.
Purchases and sales of securities, other than short-term securities, aggregated $444,045,345 and $280,337,762, respectively.
5. Fees and Other Transactions with Affiliates.
Management Fee. Fidelity SelectCo, LLC (the investment adviser) and its affiliates provide the Fund with investment management related services for which the Fund pays a monthly management fee. The management fee is the sum of an individual fund fee rate that is based on an annual rate of .45% of the Fund's average net assets and an annualized group fee rate that averaged .24% during the period. The group fee rate is based upon the average net assets of all the mutual funds advised by Fidelity Management & Research Company (FMR) and the investment adviser. The group fee rate decreases as assets under management increase and increases as assets under management decrease. For the reporting period, the total annual management fee rate was .69% of the Fund's average net assets.
Distribution and Service Plan Fees. In accordance with Rule 12b-1 of the 1940 Act, the Fund has adopted separate Distribution and Service Plans for each class of shares. Certain classes pay Fidelity Distributors Corporation (FDC), an affiliate of the investment adviser, separate Distribution and Service Fees, each of which is based on an annual percentage of each class' average net assets. In addition, FDC may pay financial intermediaries for selling shares of the Fund and providing shareholder support services. For the period, the Distribution and Service Fee rates, total fees and amounts retained by FDC were as follows:
| | Distribution Fee | Service Fee | Total Fees | Retained by FDC |
| Class A | -% | .25% | $28,146 | $1,462 |
| Class M | .25% | .25% | 21,904 | 388 |
| Class C | .75% | .25% | 49,969 | 5,419 |
| | | | $100,019 | $7,269 |
Sales Load. FDC may receive a front-end sales charge of up to 5.75% for selling Class A shares and 3.50% for selling Class M shares, some of which is paid to financial intermediaries for selling shares of the Fund. Depending on the holding period, FDC may receive contingent deferred sales charges levied on Class A, Class M and Class C redemptions. The deferred sales charges are 1.00% for Class C shares, 1.00% for certain purchases of Class A shares and .25% for certain purchases of Class M shares.
For the period, sales charge amounts retained by FDC were as follows:
| | Retained by FDC |
| Class A | $6,437 |
| Class M | 698 |
| Class C(a) | 436 |
| | $7,571 |
(a) When Class C shares are initially sold, FDC pays commissions from its own resources to financial intermediaries through which the sales are made.
Transfer Agent Fees. Fidelity Investments Institutional Operations Company, Inc., (FIIOC), an affiliate of the investment adviser, is the transfer, dividend disbursing and shareholder servicing agent for each class of the Fund. FIIOC receives account fees and asset-based fees that vary according to the account size and type of account of the shareholders of the respective classes of the Fund. FIIOC pays for typesetting, printing and mailing of shareholder reports, except proxy statements.
For the period, transfer agent fees for each class were as follows:
| | Amount | % of Class-Level Average Net Assets |
| Class A | $32,519 | .29 |
| Class M | 14,626 | .33 |
| Class C | 11,301 | .23 |
| International Real Estate | 552,012 | .23 |
| Class I | 364,572 | .14 |
| | $975,030 | |
Accounting and Security Lending Fees. Fidelity Service Company, Inc. (FSC), an affiliate of the investment adviser, maintains the Fund's accounting records. The accounting fee is based on the level of average net assets for each month. Under a separate contract, FSC administers the security lending program. The security lending fee is based on the number and duration of lending transactions. For the period, the fees were equivalent to an annual rate of .05%.
Brokerage Commissions. The Fund placed a portion of its portfolio transactions with brokerage firms which are affiliates of the investment adviser. Brokerage commissions are included in net realized gain (loss) and change in net unrealized appreciation (depreciation) in the Statement of Operations. The commissions paid to these affiliated firms were $2 for the period.
Interfund Trades. The Fund may purchase from or sell securities to other Fidelity Funds under procedures adopted by the Board. The procedures have been designed to ensure these interfund trades are executed in accordance with Rule 17a-7 of the 1940 Act. Interfund trades are included within the respective purchases and sales amounts shown in the Purchases and Sales of Investments note.
6. Committed Line of Credit.
The Fund participates with other funds managed by the investment adviser or an affiliate in a $4.25 billion credit facility (the "line of credit") to be utilized for temporary or emergency purposes to fund shareholder redemptions or for other short-term liquidity purposes. The Fund has agreed to pay commitment fees on its pro-rata portion of the line of credit, which amounted to $1,414 and is reflected in Miscellaneous expenses on the Statement of Operations. During the period, the Fund did not borrow on this line of credit.
7. Security Lending.
The Fund lends portfolio securities through a lending agent from time to time in order to earn additional income. On the settlement date of the loan, the Fund receives collateral (in the form of U.S. Treasury obligations, letters of credit and/or cash) against the loaned securities and maintains collateral in an amount not less than 100% of the market value of the loaned securities during the period of the loan. The market value of the loaned securities is determined at the close of business of the Fund and any additional required collateral is delivered to the Fund on the next business day. The Fund or borrower may terminate the loan at any time, and if the borrower defaults on its obligation to return the securities loaned because of insolvency or other reasons, the Fund may apply collateral received from the borrower against the obligation. The Fund may experience delays and costs in recovering the securities loaned. Any cash collateral received is invested in the Fidelity Securities Lending Cash Central Fund. The value of loaned securities and cash collateral at period end are disclosed on the Fund's Statement of Assets and Liabilities. Security lending income represents the income earned on investing cash collateral, less rebates paid to borrowers and any lending agent fees associated with the loan, plus any premium payments received for lending certain types of securities. Security lending income is presented in the Statement of Operations as a component of income from Fidelity Central Funds. Total security lending income during the period amounted to $64,783.
8. Expense Reductions.
Commissions paid to certain brokers with whom the investment adviser, or its affiliates, places trades on behalf of the Fund include an amount in addition to trade execution, which may be rebated back to the Fund to offset certain expenses. This amount totaled $34,477 for the period. In addition, through arrangements with the Fund's custodian, credits realized as a result of certain uninvested cash balances were used to reduce the Fund's expenses. During the period, these credits reduced the Fund's custody expenses by $52.
In addition, during the period the investment adviser reimbursed and/or waived a portion of fund-level operating expenses in the amount of $4,490.
9. Distributions to Shareholders.
Distributions to shareholders of each class were as follows:
| | Year ended
July 31, 2018 | Year ended
July 31, 2017 |
| From net investment income | | |
| Class A | $195,752 | $172,831 |
| Class M | 63,177 | 49,722 |
| Class C | 47,241 | 46,498 |
| International Real Estate | 4,956,891 | 4,709,837 |
| Class I | 4,861,753 | 1,473,124 |
| Total | $10,124,814 | $6,452,012 |
| From net realized gain | | |
| Class A | $107,906 | $324,553 |
| Class M | 42,399 | 106,361 |
| Class C | 50,358 | 134,570 |
| International Real Estate | 2,282,039 | 7,881,767 |
| Class I | 2,065,977 | 2,308,207 |
| Total | $4,548,679 | $10,755,458 |
10. Share Transactions.
Share transactions for each class were as follows and may contain automatic conversions between classes or exchanges between affiliated funds:
| | Shares | Shares | Dollars | Dollars |
| | Year ended July 31, 2018 | Year ended July 31, 2017 | Year ended July 31, 2018 | Year ended July 31, 2017 |
| Class A | | | | |
| Shares sold | 339,407 | 181,935 | $3,867,962 | $1,849,400 |
| Reinvestment of distributions | 27,005 | 48,795 | 298,868 | 481,116 |
| Shares redeemed | (314,754) | (649,016) | (3,593,331) | (6,392,090) |
| Net increase (decrease) | 51,658 | (418,286) | $573,499 | $(4,061,574) |
| Class M | | | | |
| Shares sold | 64,048 | 32,803 | $721,867 | $332,037 |
| Reinvestment of distributions | 9,612 | 15,081 | 105,576 | 147,798 |
| Shares redeemed | (74,640) | (106,218) | (848,189) | (1,035,018) |
| Net increase (decrease) | (980) | (58,334) | $(20,746) | $(555,183) |
| Class C | | | | |
| Shares sold | 112,833 | 65,324 | $1,260,510 | $644,923 |
| Reinvestment of distributions | 8,329 | 16,794 | 90,113 | 162,226 |
| Shares redeemed | (138,261) | (188,121) | (1,536,355) | (1,815,445) |
| Net increase (decrease) | (17,099) | (106,003) | $(185,732) | $(1,008,296) |
| International Real Estate | | | | |
| Shares sold | 4,614,000 | 3,759,060 | $53,516,447 | $38,129,039 |
| Reinvestment of distributions | 611,665 | 1,216,426 | 6,842,405 | 12,127,770 |
| Shares redeemed | (4,719,336) | (17,006,602) | (54,484,741) | (170,060,109) |
| Net increase (decrease) | 506,329 | (12,031,116) | $5,874,111 | $(119,803,300) |
| Class I | | | | |
| Shares sold | 17,465,869 | 10,978,201 | $199,780,614 | $111,375,436 |
| Reinvestment of distributions | 283,871 | 86,835 | 3,154,782 | 861,404 |
| Shares redeemed | (3,206,769) | (4,985,602) | (36,976,560) | (48,680,002) |
| Net increase (decrease) | 14,542,971 | 6,079,434 | $165,958,836 | $63,556,838 |
11. Other.
The Fund's organizational documents provide former and current trustees and officers with a limited indemnification against liabilities arising in connection with the performance of their duties to the Fund. In the normal course of business, the Fund may also enter into contracts that provide general indemnifications. The Fund's maximum exposure under these arrangements is unknown as this would be dependent on future claims that may be made against the Fund. The risk of material loss from such claims is considered remote.
At the end of the period, Strategic Advisers Fidelity International Fund was the owner of record of approximately 10% of the total outstanding shares of the Fund.
Report of Independent Registered Public Accounting Firm
To the Trustees of Fidelity Select Portfolios and Shareholders of Fidelity International Real Estate Fund:
Opinion on the Financial Statements and Financial Highlights
We have audited the accompanying statement of assets and liabilities of Fidelity International Real Estate Fund (the "Fund"), a fund of Fidelity Select Portfolios, including the schedule of investments, as of July 31, 2018, and the related statement of operations for the year then ended, the statement of changes in net assets for each of the two years in the period then ended, the financial highlights for each of the five years in the period then ended, and the related notes. In our opinion, the financial statements and financial highlights present fairly, in all material respects, the financial position of the Fund as of July 31, 2018, and the results of its operations for the year then ended, the changes in its net assets for each of the two years in the period then ended, and the financial highlights for each of the five years in the period then ended, in conformity with accounting principles generally accepted in the United States of America.
Basis for Opinion
These financial statements and financial highlights are the responsibility of the Fund's management. Our responsibility is to express an opinion on the Fund's financial statements and financial highlights based on our audits. We are a public accounting firm registered with the Public Company Accounting Oversight Board (United States) (PCAOB) and are required to be independent with respect to the Fund in accordance with the U.S. federal securities laws and the applicable rules and regulations of the Securities and Exchange Commission and the PCAOB.
We conducted our audits in accordance with the standards of the PCAOB. Those standards require that we plan and perform the audit to obtain reasonable assurance about whether the financial statements and financial highlights are free of material misstatement, whether due to error or fraud. The Fund is not required to have, nor were we engaged to perform, an audit of its internal control over financial reporting. As part of our audits we are required to obtain an understanding of internal control over financial reporting but not for the purpose of expressing an opinion on the effectiveness of the Fund’s internal control over financial reporting. Accordingly, we express no such opinion.
Our audits included performing procedures to assess the risks of material misstatement of the financial statements and financial highlights, whether due to error or fraud, and performing procedures that respond to those risks. Such procedures included examining, on a test basis, evidence regarding the amounts and disclosures in the financial statements and financial highlights. Our audits also included evaluating the accounting principles used and significant estimates made by management, as well as evaluating the overall presentation of the financial statements and financial highlights. Our procedures included confirmation of securities owned as of July 31, 2018, by correspondence with the custodians and brokers; when replies were not received from brokers, we performed other auditing procedures. We believe that our audits provide a reasonable basis for our opinion.
/s/ Deloitte & Touche LLP
Boston, Massachusetts
September 14, 2018
We have served as the auditor of one or more of the Fidelity investment companies since 1999.
Trustees and Officers
The Trustees, Members of the Advisory Board (if any), and officers of the trust and fund, as applicable, are listed below. The Board of Trustees governs the fund and is responsible for protecting the interests of shareholders. The Trustees are experienced executives who meet periodically throughout the year to oversee the fund's activities, review contractual arrangements with companies that provide services to the fund, oversee management of the risks associated with such activities and contractual arrangements, and review the fund's performance. Except for Michael E. Wiley, each of the Trustees oversees 286 funds. Mr. Wiley oversees 197 funds.
The Trustees hold office without limit in time except that (a) any Trustee may resign; (b) any Trustee may be removed by written instrument, signed by at least two-thirds of the number of Trustees prior to such removal; (c) any Trustee who requests to be retired or who has become incapacitated by illness or injury may be retired by written instrument signed by a majority of the other Trustees; and (d) any Trustee may be removed at any special meeting of shareholders by a two-thirds vote of the outstanding voting securities of the trust. Each Trustee who is not an interested person (as defined in the 1940 Act) of the trust and the fund is referred to herein as an Independent Trustee. Each Independent Trustee shall retire not later than the last day of the calendar year in which his or her 75th birthday occurs. The Independent Trustees may waive this mandatory retirement age policy with respect to individual Trustees. Officers and Advisory Board Members hold office without limit in time, except that any officer or Advisory Board Member may resign or may be removed by a vote of a majority of the Trustees at any regular meeting or any special meeting of the Trustees. Except as indicated, each individual has held the office shown or other offices in the same company for the past five years.
The fund’s Statement of Additional Information (SAI) includes more information about the Trustees. To request a free copy, call Fidelity at 1-800-208-0098.
Experience, Skills, Attributes, and Qualifications of the Trustees. The Governance and Nominating Committee has adopted a statement of policy that describes the experience, qualifications, attributes, and skills that are necessary and desirable for potential Independent Trustee candidates (Statement of Policy). The Board believes that each Trustee satisfied at the time he or she was initially elected or appointed a Trustee, and continues to satisfy, the standards contemplated by the Statement of Policy. The Governance and Nominating Committee also engages professional search firms to help identify potential Independent Trustee candidates who have the experience, qualifications, attributes, and skills consistent with the Statement of Policy. From time to time, additional criteria based on the composition and skills of the current Independent Trustees, as well as experience or skills that may be appropriate in light of future changes to board composition, business conditions, and regulatory or other developments, have also been considered by the professional search firms and the Governance and Nominating Committee. In addition, the Board takes into account the Trustees' commitment and participation in Board and committee meetings, as well as their leadership of standing and ad hoc committees throughout their tenure.
In determining that a particular Trustee was and continues to be qualified to serve as a Trustee, the Board has considered a variety of criteria, none of which, in isolation, was controlling. The Board believes that, collectively, the Trustees have balanced and diverse experience, qualifications, attributes, and skills, which allow the Board to operate effectively in governing the fund and protecting the interests of shareholders. Information about the specific experience, skills, attributes, and qualifications of each Trustee, which in each case led to the Board's conclusion that the Trustee should serve (or continue to serve) as a trustee of the fund, is provided below.
Board Structure and Oversight Function. James C. Curvey is an interested person and currently serves as Chairman. The Trustees have determined that an interested Chairman is appropriate and benefits shareholders because an interested Chairman has a personal and professional stake in the quality and continuity of services provided to the fund. Independent Trustees exercise their informed business judgment to appoint an individual of their choosing to serve as Chairman, regardless of whether the Trustee happens to be independent or a member of management. The Independent Trustees have determined that they can act independently and effectively without having an Independent Trustee serve as Chairman and that a key structural component for assuring that they are in a position to do so is for the Independent Trustees to constitute a substantial majority for the Board. The Independent Trustees also regularly meet in executive session. Ned C. Lautenbach serves as Chairman of the Independent Trustees and as such (i) acts as a liaison between the Independent Trustees and management with respect to matters important to the Independent Trustees and (ii) with management prepares agendas for Board meetings.
Fidelity® funds are overseen by different Boards of Trustees. The fund's Board oversees Fidelity's high income and certain equity funds, and other Boards oversee Fidelity's investment-grade bond, money market, asset allocation, and other equity funds. The asset allocation funds may invest in Fidelity® funds overseen by the fund's Board. The use of separate Boards, each with its own committee structure, allows the Trustees of each group of Fidelity® funds to focus on the unique issues of the funds they oversee, including common research, investment, and operational issues. On occasion, the separate Boards establish joint committees to address issues of overlapping consequences for the Fidelity® funds overseen by each Board.
The Trustees operate using a system of committees to facilitate the timely and efficient consideration of all matters of importance to the Trustees, the fund, and fund shareholders and to facilitate compliance with legal and regulatory requirements and oversight of the fund's activities and associated risks. The Board, acting through its committees, has charged SelectCo and its affiliates with (i) identifying events or circumstances the occurrence of which could have demonstrably adverse effects on the fund's business and/or reputation; (ii) implementing processes and controls to lessen the possibility that such events or circumstances occur or to mitigate the effects of such events or circumstances if they do occur; and (iii) creating and maintaining a system designed to evaluate continuously business and market conditions in order to facilitate the identification and implementation processes described in (i) and (ii) above. Because the day-to-day operations and activities of the fund are carried out by or through SelectCo, its affiliates, and other service providers, the fund's exposure to risks is mitigated but not eliminated by the processes overseen by the Trustees. While each of the Board's committees has responsibility for overseeing different aspects of the fund's activities, oversight is exercised primarily through the Operations, Audit, and Compliance Committees. In addition, the Independent Trustees have worked with Fidelity to enhance the Board's oversight of investment and financial risks, legal and regulatory risks, technology risks, and operational risks, including the development of additional risk reporting to the Board. Appropriate personnel, including but not limited to the fund's Chief Compliance Officer (CCO), SelectCo's internal auditor, the independent accountants, the fund's Treasurer and portfolio management personnel, make periodic reports to the Board's committees, as appropriate, including an annual review of Fidelity's risk management program for the Fidelity® funds. The responsibilities of each standing committee, including their oversight responsibilities, are described further under "Standing Committees of the Trustees."
Interested Trustees*:
Correspondence intended for a Trustee who is an interested person may be sent to Fidelity Investments, 245 Summer Street, Boston, Massachusetts 02210.
Name, Year of Birth; Principal Occupations and Other Relevant Experience+
James C. Curvey (1935)
Year of Election or Appointment: 2018
Trustee
Chairman of the Board of Trustees
Mr. Curvey also serves as Trustee of other Fidelity® funds. Mr. Curvey is Vice Chairman (2007-present) and Director of FMR LLC (diversified financial services company). In addition, Mr. Curvey is an Overseer Emeritus for the Boston Symphony Orchestra, a Director of Artis-Naples, and a Trustee of Brewster Academy in Wolfeboro, New Hampshire. Previously, Mr. Curvey served as a Director of Fidelity Research & Analysis Co. (investment adviser firm, 2009-2018), Director of Fidelity Investments Money Management, Inc. (investment adviser firm, 2009-2014) and a Director of FMR and FMR Co., Inc. (investment adviser firms, 2007-2014).
Charles S. Morrison (1960)
Year of Election or Appointment: 2018
Trustee
Mr. Morrison also serves as Trustee of other funds. He serves as President of Fidelity SelectCo, LLC (investment adviser firm, 2017-present) and Fidelity Management & Research Company (FMR) (investment adviser firm, 2016-present), a Director of Fidelity Investments Money Management, Inc. (FIMM) (investment adviser firm, 2014-present), Director of Fidelity SelectCo, LLC (investment adviser firm, 2014-present), President, Asset Management (2014-present), and is an employee of Fidelity Investments. Previously, Mr. Morrison served as Vice President of Fidelity's Fixed Income and Asset Allocation Funds (2012-2014), President, Fixed Income (2011-2014), Vice President of Fidelity's Money Market Funds (2005-2009), President, Money Market Group Leader of FMR (investment adviser firm, 2009), and Senior Vice President, Money Market Group of FMR (2004-2009). Mr. Morrison also served as Vice President of Fidelity's Bond Funds (2002-2005), certain Balanced Funds (2002-2005), and certain Asset Allocation Funds (2002-2007), and as Senior Vice President (2002-2005) of Fidelity's Bond Division.
* Determined to be an "Interested Trustee" by virtue of, among other things, his or her affiliation with the trust or various entities under common control with SelectCo.
+ The information includes the Trustee's principal occupation during the last five years and other information relating to the experience, attributes, and skills relevant to the Trustee's qualifications to serve as a Trustee, which led to the conclusion that the Trustee should serve as a Trustee for the fund.
Independent Trustees:
Correspondence intended for an Independent Trustee may be sent to Fidelity Investments, P.O. Box 55235, Boston, Massachusetts 02205-5235.
Name, Year of Birth; Principal Occupations and Other Relevant Experience+
Dennis J. Dirks (1948)
Year of Election or Appointment: 2018
Trustee
Mr. Dirks also serves as Trustee of other Fidelity® funds. Prior to his retirement in May 2003, Mr. Dirks was Chief Operating Officer and a member of the Board of The Depository Trust & Clearing Corporation (DTCC). He also served as President, Chief Operating Officer, and Board member of The Depository Trust Company (DTC) and President and Board member of the National Securities Clearing Corporation (NSCC). In addition, Mr. Dirks served as Chief Executive Officer and Board member of the Government Securities Clearing Corporation, Chief Executive Officer and Board member of the Mortgage-Backed Securities Clearing Corporation, as a Trustee and a member of the Finance Committee of Manhattan College (2005-2008), as a Trustee and a member of the Finance Committee of AHRC of Nassau County (2006-2008), as a member of the Independent Directors Council (IDC) Governing Council (2010-2015), and as a member of the Board of Directors for The Brookville Center for Children’s Services, Inc. (2009-2017). Mr. Dirks is a member of the Finance Committee (2016-present), Board of Directors (2017-present) and Board of Trustees (2018-present) and is Treasurer (2018-present) of the Asolo Repertory Theatre.
Donald F. Donahue (1950)
Year of Election or Appointment: 2018
Trustee
Mr. Donahue also serves as a Trustee of other Fidelity® funds. Mr. Donahue is President and Chief Executive Officer of Miranda Partners, LLC (risk consulting for the financial services industry, 2012-present). Previously, Mr. Donahue served as a Member of the Advisory Board of certain Fidelity® funds (2015-2018) and Chief Executive Officer (2006-2012), Chief Operating Officer (2003-2006), and Managing Director, Customer Marketing and Development (1999-2003) of The Depository Trust & Clearing Corporation (financial markets infrastructure). Mr. Donahue serves as a Member (2007-present) and Co-Chairman (2016-present) of the Board of Directors of United Way of New York, Member of the Board of Directors of NYC Leadership Academy (2012-present) and Member of the Board of Advisors of Ripple Labs, Inc. (financial services, 2015-present). He also served as Chairman (2010-2012) and Member of the Board of Directors (2012-2013) of Omgeo, LLC (financial services), Treasurer of United Way of New York (2012-2016), and Member of the Board of Directors of XBRL US (financial services non-profit, 2009-2012) and the International Securities Services Association (2009-2012).
Alan J. Lacy (1953)
Year of Election or Appointment: 2018
Trustee
Mr. Lacy also serves as Trustee of other Fidelity® funds. Mr. Lacy serves as a Director of Bristol-Myers Squibb Company (global pharmaceuticals, 2008-present). He is a Trustee of the California Chapter of The Nature Conservancy (2015-present) and a Director of the Center for Advanced Study in the Behavioral Sciences at Stanford University (2015-present). In addition, Mr. Lacy served as Senior Adviser (2007-2014) of Oak Hill Capital Partners, L.P. (private equity) and also served as Chief Executive Officer (2005) and Vice Chairman (2005-2006) of Sears Holdings Corporation (retail) and Chief Executive Officer and Chairman of the Board of Sears, Roebuck and Co. (retail, 2000-2005). Previously, Mr. Lacy served as Chairman (2014-2017) and a member (2010-2017) of the Board of Directors of Dave & Buster’s Entertainment, Inc. (restaurant and entertainment complexes), as Chairman (2008-2011) and a member (2006-2015) of the Board of Trustees of the National Parks Conservation Association, and as a member of the Board of Directors for The Hillman Companies, Inc. (hardware wholesalers, 2010-2014), Earth Fare, Inc. (retail grocery, 2010-2014), and The Western Union Company (global money transfer, 2006-2011).
Ned C. Lautenbach (1944)
Year of Election or Appointment: 2018
Trustee
Chairman of the Independent Trustees
Mr. Lautenbach also serves as Trustee of other Fidelity® funds. Mr. Lautenbach currently serves as Vice Chair of the Board of Governors, State University System of Florida (2013-present) and is a member of the Council on Foreign Relations (1994-present). He is also a member and has most recently served as Chairman of the Board of Directors of Artis-Naples (2012-present). Previously, Mr. Lautenbach served as a member and then Lead Director of the Board of Directors of Eaton Corporation (diversified industrial, 1997-2016). He was also a Partner and Advisory Partner at Clayton, Dubilier & Rice, LLC (private equity investment, 1998-2010), as well as a Director of Sony Corporation (2006-2007). In addition, Mr. Lautenbach also had a 30-year career with IBM (technology company) during which time he served as Senior Vice President and a member of the Corporate Executive Committee (1968-1998).
Joseph Mauriello (1944)
Year of Election or Appointment: 2018
Trustee
Mr. Mauriello also serves as Trustee of other Fidelity® funds. Prior to his retirement in January 2006, Mr. Mauriello served in numerous senior management positions including Deputy Chairman and Chief Operating Officer (2004-2005), and Vice Chairman of Financial Services (2002-2004) of KPMG LLP US (professional services, 1965-2005). Mr. Mauriello currently serves as a member of the Board of Directors of XL Group plc. (global insurance and re-insurance, 2006-present) and the Independent Directors Council (IDC) Governing Council (2015-present). Previously, Mr. Mauriello served as a Director of the Hamilton Funds of the Bank of New York (2006-2007) and of Arcadia Resources Inc. (health care services and products, 2007-2012).
Cornelia M. Small (1944)
Year of Election or Appointment: 2018
Trustee
Ms. Small also serves as Trustee of other Fidelity® funds. Ms. Small is a member of the Board of Directors (2009-present) and Chair of the Investment Committee (2010-present) of the Teagle Foundation. Ms. Small also serves on the Investment Committee of the Berkshire Taconic Community Foundation (2008-present). Previously, Ms. Small served as Chairperson (2002-2008) and a member of the Investment Committee and Chairperson (2008-2012) and a member of the Board of Trustees of Smith College. In addition, Ms. Small served as Chief Investment Officer, Director of Global Equity Investments, and a member of the Board of Directors of Scudder, Stevens & Clark and Scudder Kemper Investments.
Garnett A. Smith (1947)
Year of Election or Appointment: 2013
Trustee
Mr. Smith also serves as Trustee of other Fidelity® funds. Prior to Mr. Smith's retirement, he served as Chairman and Chief Executive Officer of Inbrand Corp. (manufacturer of personal absorbent products, 1990-1997). He also served as President (1986-1990) of Inbrand Corp. Prior to his employment with Inbrand Corp., he was employed by a retail fabric chain and North Carolina National Bank. In addition, Mr. Smith served as a Member of the Advisory Board of certain Fidelity® funds (2012-2013) and as a board member of the Jackson Hole Land Trust (2009-2012).
David M. Thomas (1949)
Year of Election or Appointment: 2018
Trustee
Mr. Thomas also serves as Trustee of other Fidelity® funds. Mr. Thomas serves as Non-Executive Chairman of the Board of Directors of Fortune Brands Home and Security (home and security products, 2011-present), as a member of the Board of Directors (2004-present) and Presiding Director (2013-present) of Interpublic Group of Companies, Inc. (marketing communication), and as a member of the Board of Trustees of the University of Florida (2013-present). Previously, Mr. Thomas served as Executive Chairman (2005-2006) and Chairman and Chief Executive Officer (2000-2005) of IMS Health, Inc. (pharmaceutical and healthcare information solutions), and a Director of Fortune Brands, Inc. (consumer products, 2000-2011).
Michael E. Wiley (1950)
Year of Election or Appointment: 2008
Trustee
Mr. Wiley also serves as Trustee or Member of the Advisory Board of other Fidelity® funds. Mr. Wiley serves as a Director of Andeavor Corporation (independent oil refiner and marketer, 2005-present), a Director of Andeavor Logistics LP (natural resources logistics, 2015-present), and a Director of Bill Barrett Corporation (exploration and production, 2005-present). In addition, Mr. Wiley also serves as a Director of Post Oak Bank (privately-held bank, 2004-present). Previously, Mr. Wiley served as a Trustee of other Fidelity® funds (2008-2013), as a Director of Asia Pacific Exploration Consolidated (international oil and gas exploration and production, 2008-2013), as a member of the Board of Trustees of the University of Tulsa (2000-2006; 2007-2010), as a Senior Energy Advisor of Katzenbach Partners, LLC (consulting, 2006-2007), as an Advisory Director of Riverstone Holdings (private investment), Chairman, President, and CEO of Baker Hughes, Inc. (oilfield services, 2000-2004), and as Director of Spinnaker Exploration Company (exploration and production, 2001-2005).
+ The information includes the Trustee's principal occupation during the last five years and other information relating to the experience, attributes, and skills relevant to the Trustee's qualifications to serve as a Trustee, which led to the conclusion that the Trustee should serve as a Trustee for the fund.
Advisory Board Members and Officers:
Correspondence intended for a Member of the Advisory Board (if any) may be sent to Fidelity Investments, P.O. Box 55235, Boston, Massachusetts 02205-5235. Correspondence intended for an officer or Peter S. Lynch may be sent to Fidelity Investments, 245 Summer Street, Boston, Massachusetts 02210. Officers appear below in alphabetical order.
Name, Year of Birth; Principal Occupation
Peter S. Lynch (1944)
Year of Election or Appointment: 2018
Member of the Advisory Board
Mr. Lynch also serves as Member of the Advisory Board of other Fidelity® funds. Mr. Lynch is Vice Chairman and a Director of FMR (investment adviser firm) and FMR Co., Inc. (investment adviser firm). In addition, Mr. Lynch serves as a Trustee of Boston College and as the Chairman of the Inner-City Scholarship Fund. Previously, Mr. Lynch served on the Special Olympics International Board of Directors (1997-2006).
William S. Stavropoulos (1939)
Year of Election or Appointment: 2018
Member of the Advisory Board
Mr. Stavropoulos also serves as Member of the Advisory Board of other Fidelity® funds. Mr. Stavropoulos serves as President and Founder of the Michigan Baseball Foundation, the Great Lakes Loons (2007-present). Mr. Stavropoulos is Chairman Emeritus of the Board of Directors of The Dow Chemical Company, where he previously served in numerous senior management positions, including President, CEO (1995-2000; 2002-2004), Chairman of the Executive Committee (2000-2006), and as a member of the Board of Directors (1990-2006). Currently, Mr. Stavropoulos is Chairman of the Board of Directors of Univar Inc. (global distributor of commodity and specialty chemicals), a Director of Teradata Corporation (data warehousing and technology solutions), and a member of the Advisory Board for Metalmark Capital LLC (private equity investment, 2005-present). Mr. Stavropoulos is an operating advisor to Clayton, Dubilier & Rice, LLC (private equity investment). In addition, Mr. Stavropoulos is a member of the University of Notre Dame Advisory Council for the College of Science, a Trustee of the Rollin L. Gerstacker Foundation, and a Director of Artis-Naples in Naples, Florida. Previously, Mr. Stavropoulos served as Trustee of certain Fidelity® funds (2001-2018) and as a Director of Chemical Financial Corporation (bank holding company, 1993-2012) and Tyco International, Ltd. (multinational manufacturing and services, 2007-2012).
Carol B. Tomé (1957)
Year of Election or Appointment: 2017
Member of the Advisory Board
Ms. Tomé also serves as Member of the Advisory Board of other Fidelity® funds. Ms. Tomé is Chief Financial Officer (2001-present) and Executive Vice President of Corporate Services (2007-present) of The Home Depot, Inc. (home improvement retailer) and a Director (2003-present) and Chair of the Audit Committee (2004-present) of United Parcel Service, Inc. (package delivery and supply chain management). Previously, Ms. Tomé served as Trustee of certain Fidelity® funds (2017), Senior Vice President of Finance and Accounting/Treasurer (2000-2007) and Vice President and Treasurer (1995-2000) of The Home Depot, Inc. and Chair of the Board (2010-2012), Vice Chair of the Board (2009 and 2013), and a Director (2008-2013) of the Federal Reserve Bank of Atlanta. Ms. Tomé is also a director or trustee of many community and professional organizations.
Elizabeth Paige Baumann (1968)
Year of Election or Appointment: 2017
Anti-Money Laundering (AML) Officer
Ms. Baumann also serves as AML Officer of other funds. She is Chief AML Officer (2012-present) and Senior Vice President (2014-present) of FMR LLC (diversified financial services company) and is an employee of Fidelity Investments. Previously, Ms. Baumann served as AML Officer of the funds (2012-2016), and Vice President (2007-2014) and Deputy Anti-Money Laundering Officer (2007-2012) of FMR LLC.
Marc R. Bryant (1966)
Year of Election or Appointment: 2013
Secretary and Chief Legal Officer (CLO)
Mr. Bryant also serves as Secretary and CLO of other funds. Mr. Bryant serves as CLO, Secretary, and Senior Vice President of Fidelity Management & Research Company (investment adviser firm, 2015-present) and FMR Co., Inc. (investment adviser firm, 2015-present); Secretary of Fidelity SelectCo, LLC (investment adviser firm, 2015-present) and Fidelity Investments Money Management, Inc. (investment adviser firm, 2015-present); and CLO of Fidelity Management & Research (Hong Kong) Limited and FMR Investment Management (UK) Limited (investment adviser firms, 2015-present) and Fidelity Management & Research (Japan) Limited (investment adviser firm, 2016-present). He is Senior Vice President and Deputy General Counsel of FMR LLC (diversified financial services company). Previously, Mr. Bryant served as Secretary and CLO of Fidelity Rutland Square Trust II (2010-2014) and Assistant Secretary of Fidelity's Fixed Income and Asset Allocation Funds (2013-2015). Prior to joining Fidelity Investments, Mr. Bryant served as a Senior Vice President and the Head of Global Retail Legal for AllianceBernstein L.P. (2006-2010), and as the General Counsel for ProFund Advisors LLC (2001-2006).
John J. Burke III (1964)
Year of Election or Appointment: 2018
Chief Financial Officer
Mr. Burke also serves as Chief Financial Officer of other funds. Mr. Burke serves as Head of Investment Operations for Fidelity Fund and Investment Operations (2018-present) and is an employee of Fidelity Investments (1998-present). Previously Mr. Burke served as head of Asset Management Investment Operations (2012-2018).
William C. Coffey (1969)
Year of Election or Appointment: 2009
Assistant Secretary
Mr. Coffey also serves as Assistant Secretary of other funds. He is Senior Vice President and Deputy General Counsel of FMR LLC (diversified financial services company, 2010-present), and is an employee of Fidelity Investments. Previously, Mr. Coffey served as Vice President and Associate General Counsel of FMR LLC (2005-2009).
Timothy M. Cohen (1969)
Year of Election or Appointment: 2018
Vice President
Mr. Cohen also serves as Vice President of other funds. Mr. Cohen serves as Co-Head of Global Equity Research (2016-present), a Director of Fidelity Management & Research (Japan) Limited (investment adviser firm, 2016-present), and is an employee of Fidelity Investments. Previously, Mr. Cohen served as Chief Investment Officer - Equity and a Director of Fidelity Management & Research (U.K.) Inc. (investment adviser firm, 2013-2015) and as a Director of Fidelity Management & Research (Hong Kong) Limited (investment adviser firm, 2017).
Jonathan Davis (1968)
Year of Election or Appointment: 2010
Assistant Treasurer
Mr. Davis also serves as Assistant Treasurer of other funds. Mr. Davis serves as Assistant Treasurer of FMR Capital, Inc. (2017-present) and is an employee of Fidelity Investments. Previously, Mr. Davis served as Vice President and Associate General Counsel of FMR LLC (diversified financial services company, 2003-2010).
Adrien E. Deberghes (1967)
Year of Election or Appointment: 2018
Assistant Treasurer
Mr. Deberghes also serves as an officer of other funds. He serves as Assistant Treasurer of FMR Capital, Inc. (2017-present), Executive Vice President of Fidelity Investments Money Management, Inc. (FIMM) (investment adviser firm, 2016-present), and is an employee of Fidelity Investments (2008-present). Previously, Mr. Deberghes served as President and Treasurer of certain Fidelity® funds (2013-2018). Prior to joining Fidelity Investments, Mr. Deberghes was Senior Vice President of Mutual Fund Administration at State Street Corporation (2007-2008), Senior Director of Mutual Fund Administration at Investors Bank & Trust (2005-2007), and Director of Finance for Dunkin' Brands (2000-2005). Previously, Mr. Deberghes served in other fund officer roles.
Laura M. Del Prato (1964)
Year of Election or Appointment: 2018
Assistant Treasurer
Ms. Del Prato also serves as an officer of other funds. Ms. Del Prato is an employee of Fidelity Investments (2017-present). Prior to joining Fidelity Investments, Ms. Del Prato served as a Managing Director and Treasurer of the JPMorgan Mutual Funds (2014-2017). Prior to JPMorgan, Ms. Del Prato served as a partner at Cohen Fund Audit Services (accounting firm, 2012-2013) and KPMG LLP (accounting firm, 2004-2012).
Colm A. Hogan (1973)
Year of Election or Appointment: 2018
Deputy Treasurer
Mr. Hogan also serves as an officer of other funds. Mr. Hogan serves as Assistant Treasurer of FMR Capital, Inc. (2017-present) and is an employee of Fidelity Investments (2005-present). Previously, Mr. Hogan served as Assistant Treasurer of certain Fidelity® funds (2016-2018).
Pamela R. Holding (1964)
Year of Election or Appointment: 2018
Vice President
Ms. Holding also serves as a Vice President of other funds. Ms. Holding serves as Co-Head of Global Equity Research (2018-present) and is an employee of Fidelity Investments (2013-present).
Chris Maher (1972)
Year of Election or Appointment: 2013
Assistant Treasurer
Mr. Maher serves as Assistant Treasurer of other funds. Mr. Maher is Vice President of Valuation Oversight, serves as Assistant Treasurer of FMR Capital, Inc. (2017-present), and is an employee of Fidelity Investments. Previously, Mr. Maher served as Vice President of Asset Management Compliance (2013), Vice President of the Program Management Group of FMR (investment adviser firm, 2010-2013), and Vice President of Valuation Oversight (2008-2010).
Rieco E. Mello (1969)
Year of Election or Appointment: 2017
Assistant Treasurer
Mr. Mello also serves as Assistant Treasurer of other funds. Mr. Mello serves as Assistant Treasurer of FMR Capital, Inc. (2017-present) and is an employee of Fidelity Investments (1995-present).
Kenneth B. Robins (1969)
Year of Election or Appointment: 2018
Chief Compliance Officer
Mr. Robins also serves as an officer of other funds. Mr. Robins serves as Compliance Officer of Fidelity Management & Research Company and FMR Co., Inc. (investment adviser firms, 2016-present) and is an employee of Fidelity Investments (2004-present). Previously, Mr. Robins served as Executive Vice President of Fidelity Investments Money Management, Inc. (investment adviser firm, 2013-2016) and served in other fund officer roles.
Stacie M. Smith (1974)
Year of Election or Appointment: 2018
President and Treasurer
Ms. Smith also serves as an officer of other funds. Ms. Smith serves as Assistant Treasurer of FMR Capital, Inc. (2017-present), is an employee of Fidelity Investments (2009-present), and has served in other fund officer roles. Prior to joining Fidelity Investments, Ms. Smith served as Senior Audit Manager of Ernst & Young LLP (accounting firm, 1996-2009). Previously, Ms. Smith served as Assistant Treasurer (2013-2018) and Deputy Treasurer (2013-2016) of certain Fidelity® funds.
Marc L. Spector (1972)
Year of Election or Appointment: 2017
Assistant Treasurer
Mr. Spector also serves as an officer of other funds. Mr. Spector serves as Assistant Treasurer of FMR Capital, Inc. (2017-present) and is an employee of Fidelity Investments (2016-present). Prior to joining Fidelity Investments, Mr. Spector served as Director at the Siegfried Group (accounting firm, 2013-2016), and prior to Siegfried Group as audit senior manager at Deloitte & Touche (accounting firm, 2005-2013).
Renee Stagnone (1975)
Year of Election or Appointment: 2016
Assistant Treasurer
Ms. Stagnone also serves as an officer of other funds. Ms. Stagnone serves as Assistant Treasurer of FMR Capital, Inc. (2017-present) and is an employee of Fidelity Investments (1997-present). Previously, Ms. Stagnone served as Deputy Treasurer of certain Fidelity® funds (2013-2016).
Shareholder Expense Example
As a shareholder of the Fund, you incur two types of costs: (1) transaction costs, including sales charges (loads) on purchase payments or redemption proceeds, and (2) ongoing costs, including management fees, distribution and/or service (12b-1) fees and other Fund expenses. This Example is intended to help you understand your ongoing costs (in dollars) of investing in the Fund and to compare these costs with the ongoing costs of investing in other mutual funds.
The Example is based on an investment of $1,000 invested at the beginning of the period and held for the entire period (February 1, 2018 to July 31, 2018).
Actual Expenses
The first line of the accompanying table for each class of the Fund provides information about actual account values and actual expenses. You may use the information in this line, together with the amount you invested, to estimate the expenses that you paid over the period. Simply divide your account value by $1,000.00 (for example, an $8,600 account value divided by $1,000.00 = 8.6), then multiply the result by the number in the first line for a class of the Fund under the heading entitled "Expenses Paid During Period" to estimate the expenses you paid on your account during this period. A small balance maintenance fee of $12.00 that is charged once a year may apply for certain accounts with a value of less than $2,000. This fee is not included in the table below. If it was, the estimate of expenses you paid during the period would be higher, and your ending account value lower, by this amount. In addition, the Fund, as a shareholder in the underlying Fidelity Central Funds, will indirectly bear its pro-rata share of the fees and expenses incurred by the underlying Fidelity Central Funds. These fees and expenses are not included in the Fund's annualized expense ratio used to calculate the expense estimate in the table below.
Hypothetical Example for Comparison Purposes
The second line of the accompanying table for each class of the Fund provides information about hypothetical account values and hypothetical expenses based on a Class' actual expense ratio and an assumed rate of return of 5% per year before expenses, which is not the Class' actual return. The hypothetical account values and expenses may not be used to estimate the actual ending account balance or expenses you paid for the period. You may use this information to compare the ongoing costs of investing in the Fund and other funds. To do so, compare this 5% hypothetical example with the 5% hypothetical examples that appear in the shareholder reports of the other funds. A small balance maintenance fee of $12.00 that is charged once a year may apply for certain accounts with a value of less than $2,000. This fee is not included in the table below. If it was, the estimate of expenses you paid during the period would be higher, and your ending account value lower, by this amount. In addition, the Fund, as a shareholder in the underlying Fidelity Central Funds, will indirectly bear its pro-rata share of the fees and expenses incurred by the underlying Fidelity Central Funds. These fees and expenses are not included in the Fund's annualized expense ratio used to calculate the expense estimate in the table below.
Please note that the expenses shown in the table are meant to highlight your ongoing costs only and do not reflect any transaction costs. Therefore, the second line of the table is useful in comparing ongoing costs only, and will not help you determine the relative total costs of owning different funds. In addition, if these transactional costs were included, your costs would have been higher.
| | Annualized Expense Ratio-A | Beginning
Account Value
February 1, 2018 | Ending
Account Value
July 31, 2018 | Expenses Paid
During Period-B
February 1, 2018
to July 31, 2018 |
| Class A | 1.34% | | | |
| Actual | | $1,000.00 | $970.00 | $6.55 |
| Hypothetical-C | | $1,000.00 | $1,018.15 | $6.71 |
| Class M | 1.64% | | | |
| Actual | | $1,000.00 | $968.90 | $8.01 |
| Hypothetical-C | | $1,000.00 | $1,016.66 | $8.20 |
| Class C | 2.03% | | | |
| Actual | | $1,000.00 | $966.70 | $9.90 |
| Hypothetical-C | | $1,000.00 | $1,014.73 | $10.14 |
| International Real Estate | 1.04% | | | |
| Actual | | $1,000.00 | $971.90 | $5.08 |
| Hypothetical-C | | $1,000.00 | $1,019.64 | $5.21 |
| Class I | .95% | | | |
| Actual | | $1,000.00 | $971.80 | $4.64 |
| Hypothetical-C | | $1,000.00 | $1,020.08 | $4.76 |
A Annualized expense ratio reflects expenses net of applicable fee waivers.
B Expenses are equal to each Class' annualized expense ratio, multiplied by the average account value over the period, multiplied by 181/365 (to reflect the one-half year period).
C 5% return per year before expenses
Distributions (Unaudited)
The Board of Trustees of Fidelity International Real Estate Fund voted to pay to shareholders of record at the opening of business on record date, the following distributions per share derived from capital gains realized from sales of portfolio securities, and dividends derived from net investment income:
| | Pay Date | Record Date | Dividends | Capital Gains |
| Fidelity International Real Estate Fund | | | | |
| Class A | 09/17/18 | 09/14/18 | $0.165 | $0.031 |
| Class M | 09/17/18 | 09/14/18 | $0.141 | $0.031 |
| Class C | 09/17/18 | 09/14/18 | $0.118 | $0.031 |
| International Real Estate | 09/17/18 | 09/14/18 | $0.185 | $0.031 |
| Class I | 09/17/18 | 09/14/18 | $0.193 | $0.031 |
|
Class A designates 68% and 45%, Class M designates 76% and 52%, Class C designates 95% and 67%, International Real Estate designates 62% and 39%, and Class I designates 55% and 38% of the dividends distributed in September and December, respectively during the fiscal year as amounts which may be taken into account as a dividend for purposes of the maximum rate under section 1(h)(11) of the Internal Revenue Code.
The amounts per share which represent income derived from sources within, and taxes paid to, foreign countries or possessions of the United States are as follows:
| | Pay Date | Income | Taxes |
| Fidelity International Real Estate Fund | | | |
| Class A | 09/18/17 | $0.2406 | $0.0166 |
| Class A | 12/18/17 | $0.0628 | $0.0053 |
| Class M | 09/18/17 | $0.2156 | $0.0166 |
| Class M | 12/18/17 | $0.0545 | $0.0053 |
| Class C | 09/18/17 | $0.1706 | $0.0166 |
| Class C | 12/18/17 | $0.0419 | $0.0053 |
| International Real Estate | 09/18/17 | $0.2646 | $0.0166 |
| International Real Estate | 12/18/17 | $0.0716 | $0.0053 |
| Class I | 09/18/17 | $0.2976 | $0.0166 |
| Class I | 12/18/17 | $0.0748 | $0.0053 |
|
The fund will notify shareholders in January 2019 of amounts for use in preparing 2018 income tax returns.
AIRE-ANN-0918
1.843179.111
Fidelity® International Real Estate Fund
Annual Report July 31, 2018 |
|
Contents
To view a fund's proxy voting guidelines and proxy voting record for the 12-month period ended June 30, visit http://www.fidelity.com/proxyvotingresults or visit the Securities and Exchange Commission's (SEC) web site at http://www.sec.gov.
You may also call 1-800-544-8544 to request a free copy of the proxy voting guidelines.
Standard & Poor's, S&P and S&P 500 are registered service marks of The McGraw-Hill Companies, Inc. and have been licensed for use by Fidelity Distributors Corporation.
Other third-party marks appearing herein are the property of their respective owners.
All other marks appearing herein are registered or unregistered trademarks or service marks of FMR LLC or an affiliated company. © 2018 FMR LLC. All rights reserved.
This report and the financial statements contained herein are submitted for the general information of the shareholders of the Fund. This report is not authorized for distribution to prospective investors in the Fund unless preceded or accompanied by an effective prospectus.
A fund files its complete schedule of portfolio holdings with the SEC for the first and third quarters of each fiscal year on Form N-Q. Forms N-Q are available on the SEC’s web site at http://www.sec.gov. A fund's Forms N-Q may be reviewed and copied at the SEC’s Public Reference Room in Washington, DC. Information regarding the operation of the SEC's Public Reference Room may be obtained by calling 1-800-SEC-0330.
For a complete list of a fund's portfolio holdings, view the most recent holdings listing, semiannual report, or annual report on Fidelity's web site at http://www.fidelity.com, http://www.institutional.fidelity.com, or http://www.401k.com, as applicable.
NOT FDIC INSURED •MAY LOSE VALUE •NO BANK GUARANTEE
Neither the Fund nor Fidelity Distributors Corporation is a bank.
Performance: The Bottom Line
Average annual total return reflects the change in the value of an investment, assuming reinvestment of distributions from dividend income and capital gains (the profits earned upon the sale of securities that have grown in value, if any) and assuming a constant rate of performance each year. The hypothetical investment and the average annual total returns do not reflect the deduction of taxes that a shareholder would pay on fund distributions or the redemption of fund shares. During periods of reimbursement by Fidelity, a fund’s total return will be greater than it would be had the reimbursement not occurred. How a fund did yesterday is no guarantee of how it will do tomorrow.
Average Annual Total Returns
| For the periods ended July 31, 2018 | Past 1 year | Past 5 years | Past 10 years |
| Fidelity® International Real Estate Fund | 8.84% | 7.02% | 5.01% |
$10,000 Over 10 Years
Let's say hypothetically that $10,000 was invested in Fidelity® International Real Estate Fund, a class of the fund, on July 31, 2008.
The chart shows how the value of your investment would have changed, and also shows how the MSCI EAFE Index performed over the same period.
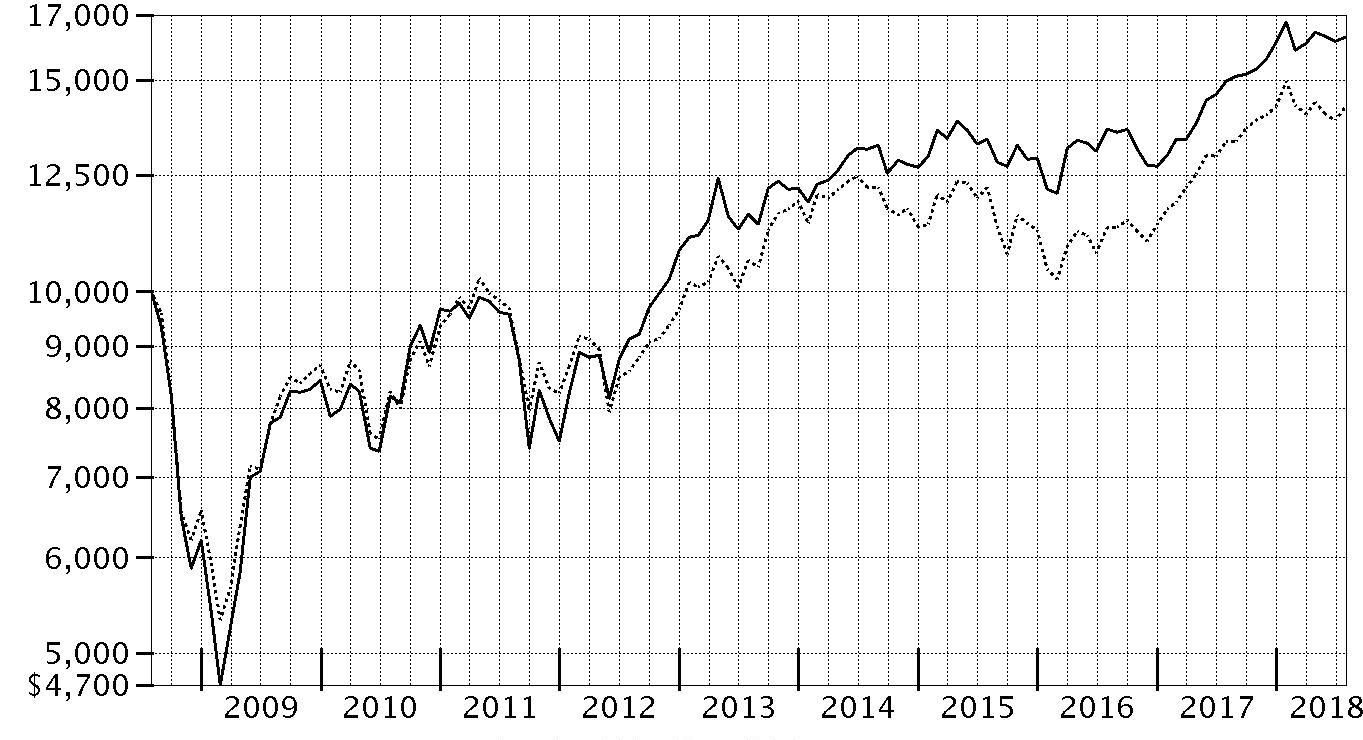
| Period Ending Values |
| $16,301 | Fidelity® International Real Estate Fund |
| $14,233 | MSCI EAFE Index |
Management's Discussion of Fund Performance
Market Recap: For the 12 months ending July 31, 2018, global real estate stocks gained 5.67%, as measured by the FTSE
® EPRA℠/NAREIT
® Developed Index, partly held back by the headwind of a strengthening U.S. dollar against many currencies. In the U.S., it was an up-and-down 12 months for real estate investment trusts (REITs), which made up 52% of the index this period, on average. U.S. REITs corrected sharply in late 2017 and the first two months of 2018 before enjoying a strong upward trend through the end of July. For the full 12 months, the group rose about 4%. Higher interest rates posed a headwind for U.S. REITs, as income-seeking investors perceived a correlation between the two factors. Still, the fundamental backdrop for U.S. REITs remained solid, with positive, if decelerating, cash-flow growth across most categories. Continental European markets performed especially well this period, gaining roughly 11%, owing to the earlier stage of their real estate recovery. Almost every country in this region fared well, led by Austria (+35%), Germany (+23%) and Sweden (+16%). Conversely, notable laggards within Europe included France (+2%) and Switzerland (+1%). Meanwhile, Japan and Hong Kong, the next-largest index allocations, returned 5% and roughly 7%, respectively, the past 12 months, while Australia (+6%) and the U.K. (+8%) each outperformed the broader market.
Comments from Portfolio Manager Guillermo de las Casas: For the fiscal year, the fund's shares Classes (excluding sales charges, if applicable) gained roughly 8% to 9%, ahead of the 7.85% return of the FTSE
® EPRA℠/NAREIT
® Developed Ex North America Index. International real estate securities faced a challenging 2018 so far, but nonetheless posted a strong return the past 12 months, largely supported by strength from October 2017 through the first month of the new year. My focus on underlying earnings growth – rather than solely on investments with the highest yields – helped the fund outperform the FTSE index, as we avoided some of the index's higher-yielding components that weighed on the recent performance of the asset class. One good example of this is Unibail-Rodamco (-5%), a mall company in Europe. I generally avoid mall companies if I see deteriorating medium- to long-term prospects. Not owning Unibail was the fund’s largest individual relative contributor for the year, as the stock underperformed along with other mall stocks, which generally lagged those of real estate developers. A non-index stake in Ichigo, a Japanese real estate owner/operator with a focus on offices and hotels, was another contributor. The company also builds and operates solar power plants on unused land nationwide. Shares of Ichigo were propelled by the firm’s strong financial results and positive transactions in its solar business. We reduced our position in Ichigo this period to take some profits. Conversely, not owning index component Link Real Estate Investment Trust, Asia's largest REIT, detracted most. We avoided this Hong Kong-based REIT based on our skepticism about the sustainability of the country’s housing prices. Unfortunately for the fund, we missed out on Link’s roughly 26% gain the past 12 months.
The views expressed above reflect those of the portfolio manager(s) only through the end of the period as stated on the cover of this report and do not necessarily represent the views of Fidelity or any other person in the Fidelity organization. Any such views are subject to change at any time based upon market or other conditions and Fidelity disclaims any responsibility to update such views. These views may not be relied on as investment advice and, because investment decisions for a Fidelity fund are based on numerous factors, may not be relied on as an indication of trading intent on behalf of any Fidelity fund.
Investment Summary (Unaudited)
Top Ten Stocks as of July 31, 2018
| | % of fund's net assets |
| Vonovia SE | 6.0 |
| Mitsubishi Estate Co. Ltd. | 5.5 |
| Mitsui Fudosan Co. Ltd. | 4.5 |
| Kojamo OYJ | 3.4 |
| Parkway Life REIT | 2.9 |
| Sino Land Ltd. | 2.7 |
| Irish Residential Properties REIT PLC | 2.4 |
| Hysan Development Co. Ltd. | 2.4 |
| Hufvudstaden AB Series A | 2.4 |
| LEG Immobilien AG | 2.3 |
| | 34.5 |
Top Five Countries as of July 31, 2018
| (excluding cash equivalents) | % of fund's net assets |
| Japan | 17.6 |
| United Kingdom | 11.0 |
| Germany | 9.6 |
| Singapore | 8.0 |
| Australia | 7.0 |
Top Five REIT Sectors as of July 31, 2018
| | % of fund's net assets |
| REITs - Management/Investment | 7.8 |
| REITs - Diversified | 6.5 |
| REITs - Apartments | 5.7 |
| REITs - Health Care | 4.4 |
| REITs - Office Property | 2.6 |
Asset Allocation (% of fund's net assets)
| As of July 31, 2018 * |
| | Stocks | 95.8% |
| | Short-Term Investments and Net Other Assets (Liabilities) | 4.2% |

* Foreign investments - 95.3%
Schedule of Investments July 31, 2018
Showing Percentage of Net Assets
| Common Stocks - 95.8% | | | |
| | | Shares | Value |
| Australia - 7.0% | | | |
| 360 Capital Group Ltd. unit | | 6,024,853 | $4,453,784 |
| Abacus Property Group unit | | 2,606,270 | 7,241,868 |
| Arena (REIT) unit | | 2,769,028 | 4,731,674 |
| Mirvac Group unit | | 4,198,488 | 7,111,928 |
| National Storage (REIT) unit | | 9,495,269 | 12,063,212 |
| Propertylink Group unit | | 9,666,703 | 7,612,790 |
|
| TOTAL AUSTRALIA | | | 43,215,256 |
|
| Bailiwick of Guernsey - 0.4% | | | |
| Sirius Real Estate Ltd. | | 3,073,500 | 2,355,927 |
| Belgium - 1.7% | | | |
| Aedifica SA | | 22,500 | 2,146,927 |
| Warehouses de Pauw | | 63,686 | 8,549,297 |
|
| TOTAL BELGIUM | | | 10,696,224 |
|
| Bermuda - 6.4% | | | |
| Great Eagle Holdings Ltd. | | 1,566,752 | 7,714,942 |
| Hongkong Land Holdings Ltd. | | 1,747,200 | 12,702,144 |
| Tai Cheung Holdings Ltd. | | 11,757,000 | 12,672,135 |
| Wing Tai Properties Ltd. | | 7,822,000 | 6,118,840 |
|
| TOTAL BERMUDA | | | 39,208,061 |
|
| Cayman Islands - 0.5% | | | |
| Alibaba Group Holding Ltd. sponsored ADR (a) | | 15,600 | 2,920,788 |
| Finland - 3.4% | | | |
| Kojamo OYJ | | 1,993,800 | 21,099,623 |
| France - 3.2% | | | |
| Altarea SCA | | 27,594 | 6,059,751 |
| ARGAN SA | | 30,961 | 1,618,330 |
| Societe Fonciere Lyonnaise SA | | 171,794 | 11,731,819 |
|
| TOTAL FRANCE | | | 19,409,900 |
|
| Germany - 9.6% | | | |
| DIC Asset AG | | 271,700 | 3,100,873 |
| LEG Immobilien AG | | 128,978 | 14,514,958 |
| Scout24 AG (b) | | 94,400 | 4,912,205 |
| Vonovia SE | | 757,654 | 36,687,715 |
|
| TOTAL GERMANY | | | 59,215,751 |
|
| Greece - 0.7% | | | |
| Grivalia Properties REIC | | 430,891 | 4,318,101 |
| Hong Kong - 6.1% | | | |
| Hysan Development Co. Ltd. | | 2,736,703 | 14,975,238 |
| Magnificent Hotel Investment Ltd. | | 220,237,000 | 5,695,990 |
| Sino Land Ltd. | | 9,712,355 | 16,680,050 |
|
| TOTAL HONG KONG | | | 37,351,278 |
|
| India - 0.6% | | | |
| Oberoi Realty Ltd. | | 473,470 | 3,431,032 |
| Ireland - 3.4% | | | |
| Hibernia (REIT) PLC | | 3,445,908 | 5,866,912 |
| Irish Residential Properties REIT PLC | | 9,360,600 | 15,039,553 |
|
| TOTAL IRELAND | | | 20,906,465 |
|
| Israel - 0.5% | | | |
| Azrieli Group | | 64,100 | 3,066,927 |
| Japan - 17.6% | | | |
| Advance Residence Investment Corp. | | 4,788 | 12,456,551 |
| Comforia Residential REIT, Inc. | | 3,808 | 8,915,927 |
| Daibiru Corp. | | 327,300 | 3,366,230 |
| Ichigo, Inc. | | 664,500 | 2,959,540 |
| Japan Rental Housing Investment, Inc. | | 14,674 | 11,942,351 |
| Kenedix, Inc. | | 733,400 | 4,191,232 |
| Mitsubishi Estate Co. Ltd. | | 1,964,400 | 34,087,481 |
| Mitsui Fudosan Co. Ltd. | | 1,147,600 | 27,441,088 |
| Ship Healthcare Holdings, Inc. | | 77,300 | 2,996,874 |
|
| TOTAL JAPAN | | | 108,357,274 |
|
| Mexico - 0.9% | | | |
| Corporacion Inmobiliaria Vesta S.A.B. de CV | | 3,468,062 | 5,494,862 |
| Netherlands - 0.2% | | | |
| Instone Real Estate Group BV (b) | | 48,376 | 1,244,506 |
| New Zealand - 1.2% | | | |
| Auckland International Airport Ltd. | | 1,649,741 | 7,505,794 |
| Norway - 2.3% | | | |
| Olav Thon Eiendomsselskap A/S | | 494,858 | 9,379,469 |
| Self Storage Group ASA | | 1,548,544 | 3,132,533 |
| Selvaag Bolig ASA | | 274,100 | 1,493,719 |
|
| TOTAL NORWAY | | | 14,005,721 |
|
| Singapore - 8.0% | | | |
| Parkway Life REIT | | 8,775,400 | 17,791,240 |
| United Industrial Corp. Ltd. | | 4,115,200 | 9,522,077 |
| UOL Group Ltd. | | 2,078,347 | 10,946,302 |
| Wing Tai Holdings Ltd. | | 7,278,681 | 11,067,594 |
|
| TOTAL SINGAPORE | | | 49,327,213 |
|
| Spain - 1.5% | | | |
| Inmobiliaria Colonial SA | | 415,270 | 4,474,767 |
| Melia Hotels International SA | | 362,600 | 4,770,071 |
|
| TOTAL SPAIN | | | 9,244,838 |
|
| Sweden - 6.8% | | | |
| Amasten Holding AB (a)(c) | | 12,594,747 | 6,775,104 |
| D. Carnegie & Co. AB (a) | | 603,700 | 11,259,793 |
| Fastighets AB Trianon Class B (d) | | 443,600 | 3,531,466 |
| Hufvudstaden AB Series A | | 958,350 | 14,822,739 |
| Wallenstam AB (B Shares) | | 547,600 | 5,629,856 |
|
| TOTAL SWEDEN | | | 42,018,958 |
|
| Switzerland - 2.3% | | | |
| PSP Swiss Property AG | | 152,534 | 14,372,996 |
| United Kingdom - 11.0% | | | |
| Assura PLC | | 12,492,420 | 9,280,660 |
| Big Yellow Group PLC | | 610,400 | 7,623,233 |
| Grainger Trust PLC | | 2,315,407 | 9,311,764 |
| Great Portland Estates PLC | | 748,748 | 7,035,645 |
| Helical Bar PLC | | 1,746,045 | 7,333,668 |
| Land Securities Group PLC | | 663,518 | 8,210,850 |
| Safestore Holdings PLC | | 1,102,054 | 8,100,405 |
| Shaftesbury PLC | | 594,700 | 7,274,945 |
| St. Modwen Properties PLC | | 651,725 | 3,464,458 |
|
| TOTAL UNITED KINGDOM | | | 67,635,628 |
|
| United States of America - 0.5% | | | |
| Alphabet, Inc. Class C (a) | | 1,300 | 1,582,438 |
| Amazon.com, Inc. (a) | | 700 | 1,244,208 |
|
| TOTAL UNITED STATES OF AMERICA | | | 2,826,646 |
|
| TOTAL COMMON STOCKS | | | |
| (Cost $588,485,117) | | | 589,229,769 |
|
| Money Market Funds - 4.5% | | | |
| Fidelity Cash Central Fund, 1.96% (e) | | 27,483,728 | 27,489,225 |
| Fidelity Securities Lending Cash Central Fund 1.97% (e)(f) | | 58,767 | 58,773 |
| TOTAL MONEY MARKET FUNDS | | | |
| (Cost $27,548,692) | | | 27,547,998 |
| TOTAL INVESTMENT IN SECURITIES - 100.3% | | | |
| (Cost $616,033,809) | | | 616,777,767 |
| NET OTHER ASSETS (LIABILITIES) - (0.3)% | | | (1,618,263) |
| NET ASSETS - 100% | | | $615,159,504 |
Categorizations in the Schedule of Investments are based on country or territory of incorporation.
Legend
(a) Non-income producing
(b) Security exempt from registration under Rule 144A of the Securities Act of 1933. These securities may be resold in transactions exempt from registration, normally to qualified institutional buyers. At the end of the period, the value of these securities amounted to $6,156,711 or 1.0% of net assets.
(c) Affiliated company
(d) Security or a portion of the security is on loan at period end.
(e) Affiliated fund that is generally available only to investment companies and other accounts managed by Fidelity Investments. The rate quoted is the annualized seven-day yield of the fund at period end. A complete unaudited listing of the fund's holdings as of its most recent quarter end is available upon request. In addition, each Fidelity Central Fund's financial statements, which are not covered by the Fund's Report of Independent Registered Public Accounting Firm, are available on the SEC's website or upon request.
(f) Investment made with cash collateral received from securities on loan.
Affiliated Central Funds
Information regarding fiscal year to date income earned by the Fund from investments in Fidelity Central Funds is as follows:
| Fund | Income earned |
| Fidelity Cash Central Fund | $355,720 |
| Fidelity Securities Lending Cash Central Fund | 64,783 |
| Total | $420,503 |
Amounts in the income column in the above table include any capital gain distributions from underlying funds, which are presented in the corresponding line-item in the Statement of Operations if applicable.
Other Affiliated Issuers
An affiliated company is a company in which the Fund has ownership of at least 5% of the voting securities. Fiscal year to date transactions with companies which are or were affiliates are as follows:
| Affiliate | Value, beginning of period | Purchases | Sales Proceeds | Dividend Income | Realized Gain (loss) | Change in Unrealized appreciation (depreciation) | Value, end of period |
| Amasten Holding AB | $2,097,020 | $3,945,378 | $634,640 | $-- | $143,105 | $1,224,241 | $6,775,104 |
| Total | $2,097,020 | $3,945,378 | $634,640 | $-- | $143,105 | $1,224,241 | $6,775,104 |
Investment Valuation
The following is a summary of the inputs used, as of July 31, 2018, involving the Fund's assets and liabilities carried at fair value. The inputs or methodology used for valuing securities may not be an indication of the risk associated with investing in those securities. For more information on valuation inputs, and their aggregation into the levels used below, please refer to the Investment Valuation section in the accompanying Notes to Financial Statements.
| | Valuation Inputs at Reporting Date: |
| Description | Total | Level 1 | Level 2 | Level 3 |
| Investments in Securities: | | | | |
| Equities: | | | | |
| Consumer Discretionary | $14,842,802 | $14,842,802 | $-- | $-- |
| Financials | 7,612,790 | 7,612,790 | -- | -- |
| Health Care | 2,996,874 | 2,996,874 | -- | -- |
| Industrials | 7,505,794 | 7,505,794 | -- | -- |
| Information Technology | 9,415,431 | 9,415,431 | -- | -- |
| Real Estate | 546,856,078 | 485,327,509 | 61,528,569 | -- |
| Money Market Funds | 27,547,998 | 27,547,998 | -- | -- |
| Total Investments in Securities: | $616,777,767 | $555,249,198 | $61,528,569 | $-- |
The following is a summary of transfers between Level 1 and Level 2 for the period ended July 31, 2018. Transfers are assumed to have occurred at the beginning of the period, and are primarily attributable to the valuation techniques used for foreign equity securities, as discussed in the accompanying Notes to Financial Statements:
| Transfers | Total |
| Level 1 to Level 2 | $36,210,922 |
| Level 2 to Level 1 | $0 |
See accompanying notes which are an integral part of the financial statements.
Financial Statements
Statement of Assets and Liabilities
| | | July 31, 2018 |
| Assets | | |
Investment in securities, at value (including securities loaned of $55,767) — See accompanying schedule:
Unaffiliated issuers (cost $583,073,873) | $582,454,665 | |
| Fidelity Central Funds (cost $27,548,692) | 27,547,998 | |
| Other affiliated issuers (cost $5,411,244) | 6,775,104 | |
| Total Investment in Securities (cost $616,033,809) | | $616,777,767 |
| Receivable for investments sold | | 1,372,651 |
| Receivable for fund shares sold | | 409,012 |
| Dividends receivable | | 1,893,736 |
| Distributions receivable from Fidelity Central Funds | | 45,506 |
| Prepaid expenses | | 5,806 |
| Other receivables | | 5,498 |
| Total assets | | 620,509,976 |
| Liabilities | | |
| Payable to custodian bank | $981 | |
| Payable for investments purchased | 4,053,106 | |
| Payable for fund shares redeemed | 667,708 | |
| Accrued management fee | 350,754 | |
| Distribution and service plan fees payable | 8,386 | |
| Other affiliated payables | 116,730 | |
| Other payables and accrued expenses | 94,637 | |
| Collateral on securities loaned | 58,170 | |
| Total liabilities | | 5,350,472 |
| Net Assets | | $615,159,504 |
| Net Assets consist of: | | |
| Paid in capital | | $610,216,172 |
| Undistributed net investment income | | 9,800,848 |
| Accumulated undistributed net realized gain (loss) on investments and foreign currency transactions | | (5,609,971) |
| Net unrealized appreciation (depreciation) on investments and assets and liabilities in foreign currencies | | 752,455 |
| Net Assets | | $615,159,504 |
| Calculation of Maximum Offering Price | | |
| Class A: | | |
| Net Asset Value and redemption price per share ($11,318,576 ÷ 973,430 shares) | | $11.63 |
| Maximum offering price per share (100/94.25 of $11.63) | | $12.34 |
| Class M: | | |
| Net Asset Value and redemption price per share ($4,360,365 ÷ 378,274 shares) | | $11.53 |
| Maximum offering price per share (100/96.50 of $11.53) | | $11.95 |
| Class C: | | |
| Net Asset Value and offering price per share ($4,893,763 ÷ 431,765 shares)(a) | | $11.33 |
| International Real Estate: | | |
| Net Asset Value, offering price and redemption price per share ($244,194,897 ÷ 20,733,961 shares) | | $11.78 |
| Class I: | | |
| Net Asset Value, offering price and redemption price per share ($350,391,903 ÷ 29,944,912 shares) | | $11.70 |
(a) Redemption price per share is equal to net asset value less any applicable contingent deferred sales charge.
See accompanying notes which are an integral part of the financial statements.
Statement of Operations
| | | Year ended July 31, 2018 |
| Investment Income | | |
| Dividends | | $18,885,224 |
| Income from Fidelity Central Funds | | 420,503 |
| Income before foreign taxes withheld | | 19,305,727 |
| Less foreign taxes withheld | | (1,574,477) |
| Total income | | 17,731,250 |
| Expenses | | |
| Management fee | $3,622,340 | |
| Transfer agent fees | 975,030 | |
| Distribution and service plan fees | 100,019 | |
| Accounting and security lending fees | 268,272 | |
| Custodian fees and expenses | 141,917 | |
| Independent trustees' fees and expenses | 6,775 | |
| Registration fees | 154,592 | |
| Audit | 64,900 | |
| Legal | 5,493 | |
| Miscellaneous | 24,328 | |
| Total expenses before reductions | 5,363,666 | |
| Expense reductions | (39,019) | |
| Total expenses after reductions | | 5,324,647 |
| Net investment income (loss) | | 12,406,603 |
| Realized and Unrealized Gain (Loss) | | |
| Net realized gain (loss) on: | | |
| Investment securities: | | |
| Unaffiliated issuers (net of foreign taxes of $35,832) | 36,328,223 | |
| Fidelity Central Funds | 45 | |
| Other affiliated issuers | 143,105 | |
| Foreign currency transactions | (52,157) | |
| Total net realized gain (loss) | | 36,419,216 |
| Change in net unrealized appreciation (depreciation) on: | | |
| Investment securities: | | |
| Unaffiliated issuers | (9,003,743) | |
| Fidelity Central Funds | 7 | |
| Other affiliated issuers | 1,224,241 | |
| Assets and liabilities in foreign currencies | (38,756) | |
| Total change in net unrealized appreciation (depreciation) | | (7,818,251) |
| Net gain (loss) | | 28,600,965 |
| Net increase (decrease) in net assets resulting from operations | | $41,007,568 |
See accompanying notes which are an integral part of the financial statements.
Statement of Changes in Net Assets
| | Year ended July 31, 2018 | Year ended July 31, 2017 |
| Increase (Decrease) in Net Assets | | |
| Operations | | |
| Net investment income (loss) | $12,406,603 | $7,521,781 |
| Net realized gain (loss) | 36,419,216 | 4,415,065 |
| Change in net unrealized appreciation (depreciation) | (7,818,251) | 19,827,836 |
| Net increase (decrease) in net assets resulting from operations | 41,007,568 | 31,764,682 |
| Distributions to shareholders from net investment income | (10,124,814) | (6,452,012) |
| Distributions to shareholders from net realized gain | (4,548,679) | (10,755,458) |
| Total distributions | (14,673,493) | (17,207,470) |
| Share transactions - net increase (decrease) | 172,199,968 | (61,871,515) |
| Redemption fees | 19,597 | 42,646 |
| Total increase (decrease) in net assets | 198,553,640 | (47,271,657) |
| Net Assets | | |
| Beginning of period | 416,605,864 | 463,877,521 |
| End of period | $615,159,504 | $416,605,864 |
| Other Information | | |
| Undistributed net investment income end of period | $9,800,848 | $7,518,086 |
See accompanying notes which are an integral part of the financial statements.
Financial Highlights
Fidelity International Real Estate Fund Class A
| Years ended July 31, | 2018 | 2017 | 2016 | 2015 | 2014 |
| Selected Per–Share Data | | | | | |
| Net asset value, beginning of period | $11.03 | $10.46 | $10.56 | $10.85 | $10.11 |
| Income from Investment Operations | | | | | |
| Net investment income (loss)A | .23 | .16 | .15 | .26B | .16 |
| Net realized and unrealized gain (loss) | .69 | .79 | .02 | (.10)C | 1.09 |
| Total from investment operations | .92 | .95 | .17 | .16 | 1.25 |
| Distributions from net investment income | (.21) | (.13) | (.15) | (.14) | (.16) |
| Distributions from net realized gain | (.11) | (.25) | (.12) | (.31) | (.35) |
| Total distributions | (.32) | (.38) | (.27) | (.45) | (.51) |
| Redemption fees added to paid in capitalA,D | – | – | – | – | – |
| Net asset value, end of period | $11.63 | $11.03 | $10.46 | $10.56 | $10.85 |
| Total ReturnE,F | 8.49% | 9.48% | 1.75% | 1.67%C | 12.85% |
| Ratios to Average Net AssetsG,H | | | | | |
| Expenses before reductions | 1.36% | 1.35% | 1.35% | 1.34% | 1.38% |
| Expenses net of fee waivers, if any | 1.36% | 1.35% | 1.35% | 1.34% | 1.38% |
| Expenses net of all reductions | 1.35% | 1.35% | 1.33% | 1.34% | 1.38% |
| Net investment income (loss) | 2.03% | 1.60% | 1.51% | 2.45%B | 1.57% |
| Supplemental Data | | | | | |
| Net assets, end of period (000 omitted) | $11,319 | $10,170 | $14,020 | $17,162 | $13,933 |
| Portfolio turnover rateI | 56% | 55% | 71% | 82% | 59% |
A Calculated based on average shares outstanding during the period.
B Net investment income per share reflects large, non-recurring dividend which amounted to $.14 per share. Excluding this non-recurring dividend, the ratio of net investment income (loss) to average net assets would have been 1.15%.
C Amount includes a reimbursement from the investment adviser for an operational error which amounted to less than $.01 per share. Excluding this reimbursement, the total return would have been 1.64%.
D Amount represents less than $.005 per share.
E Total returns would have been lower if certain expenses had not been reduced during the applicable periods shown.
F Total returns do not include the effect of the sales charges.
G Fees and expenses of any underlying Fidelity Central Funds are not included in the Fund's expense ratio. The Fund indirectly bears its proportionate share of the expenses of any underlying Fidelity Central Funds.
H Expense ratios reflect operating expenses of the class. Expenses before reductions do not reflect amounts reimbursed by the investment adviser or reductions from brokerage service arrangements or reductions from other expense offset arrangements and do not represent the amount paid by the class during periods when reimbursements or reductions occur. Expenses net of fee waivers reflect expenses after reimbursement by the investment adviser but prior to reductions from brokerage service arrangements or other expense offset arrangements. Expenses net of all reductions represent the net expenses paid by the class.
I Amount does not include the portfolio activity of any underlying Fidelity Central Funds.
See accompanying notes which are an integral part of the financial statements.
Fidelity International Real Estate Fund Class M
| Years ended July 31, | 2018 | 2017 | 2016 | 2015 | 2014 |
| Selected Per–Share Data | | | | | |
| Net asset value, beginning of period | $10.93 | $10.39 | $10.49 | $10.76 | $10.04 |
| Income from Investment Operations | | | | | |
| Net investment income (loss)A | .20 | .13 | .12 | .22B | .13 |
| Net realized and unrealized gain (loss) | .68 | .77 | .02 | (.08)C | 1.07 |
| Total from investment operations | .88 | .90 | .14 | .14 | 1.20 |
| Distributions from net investment income | (.17) | (.12) | (.11) | (.10) | (.14) |
| Distributions from net realized gain | (.11) | (.25) | (.12) | (.31) | (.35) |
| Total distributions | (.28) | (.36)D | (.24)E | (.41) | (.48)F |
| Redemption fees added to paid in capitalA,G | – | – | – | – | – |
| Net asset value, end of period | $11.53 | $10.93 | $10.39 | $10.49 | $10.76 |
| Total ReturnH,I | 8.19% | 9.07% | 1.43% | 1.49%C | 12.50% |
| Ratios to Average Net AssetsJ,K | | | | | |
| Expenses before reductions | 1.65% | 1.65% | 1.66% | 1.64% | 1.66% |
| Expenses net of fee waivers, if any | 1.65% | 1.65% | 1.66% | 1.64% | 1.66% |
| Expenses net of all reductions | 1.65% | 1.65% | 1.64% | 1.63% | 1.65% |
| Net investment income (loss) | 1.74% | 1.31% | 1.20% | 2.15%B | 1.30% |
| Supplemental Data | | | | | |
| Net assets, end of period (000 omitted) | $4,360 | $4,147 | $4,545 | $4,939 | $5,563 |
| Portfolio turnover rateL | 56% | 55% | 71% | 82% | 59% |
A Calculated based on average shares outstanding during the period.
B Net Investment income per share reflects a large, non-recurring dividend which amounted to $.14 per share. Excluding this non-recurring dividend, the ratio of net investment income (loss) to average net assets would have been .86%.
C Amount includes a reimbursement from the investment adviser for an operational error which amounted to less than $.01 per share. Excluding this reimbursement, the total return would have been 1.46%.
D Total distributions of $.36 per share is comprised of distributions from net investment income of $.115 and distributions from net realized gain of $.246 per share.
E Total distributions of $.24 per share is comprised of distributions from net investment income of $.114 and distributions from net realized gain of $.121 per share.
F Total distributions of $.48 per share is comprised of distributions from net investment income of $.136 and distributions from net realized gain of $.348 per share.
G Amount represents less than $.005 per share.
H Total returns would have been lower if certain expenses had not been reduced during the applicable periods shown.
I Total returns do not include the effect of the sales charges.
J Fees and expenses of any underlying Fidelity Central Funds are not included in the Fund's expense ratio. The Fund indirectly bears its proportionate share of the expenses of any underlying Fidelity Central Funds.
K Expense ratios reflect operating expenses of the class. Expenses before reductions do not reflect amounts reimbursed by the investment adviser or reductions from brokerage service arrangements or reductions from other expense offset arrangements and do not represent the amount paid by the class during periods when reimbursements or reductions occur. Expenses net of fee waivers reflect expenses after reimbursement by the investment adviser but prior to reductions from brokerage service arrangements or other expense offset arrangements. Expenses net of all reductions represent the net expenses paid by the class.
L Amount does not include the portfolio activity of any underlying Fidelity Central Funds.
See accompanying notes which are an integral part of the financial statements.
Fidelity International Real Estate Fund Class C
| Years ended July 31, | 2018 | 2017 | 2016 | 2015 | 2014 |
| Selected Per–Share Data | | | | | |
| Net asset value, beginning of period | $10.73 | $10.21 | $10.32 | $10.60 | $9.89 |
| Income from Investment Operations | | | | | |
| Net investment income (loss)A | .15 | .09 | .07 | .17B | .08 |
| Net realized and unrealized gain (loss) | .67 | .76 | .02 | (.08)C | 1.07 |
| Total from investment operations | .82 | .85 | .09 | .09 | 1.15 |
| Distributions from net investment income | (.10) | (.09) | (.07) | (.07) | (.09) |
| Distributions from net realized gain | (.11) | (.25) | (.12) | (.30) | (.35) |
| Total distributions | (.22)D | (.33)E | (.20)F | (.37) | (.44) |
| Redemption fees added to paid in capitalA,G | – | – | – | – | – |
| Net asset value, end of period | $11.33 | $10.73 | $10.21 | $10.32 | $10.60 |
| Total ReturnH,I | 7.70% | 8.69% | .93% | .97%C | 12.04% |
| Ratios to Average Net AssetsJ,K | | | | | |
| Expenses before reductions | 2.05% | 2.09% | 2.10% | 2.09% | 2.13% |
| Expenses net of fee waivers, if any | 2.04% | 2.08% | 2.10% | 2.09% | 2.13% |
| Expenses net of all reductions | 2.04% | 2.08% | 2.09% | 2.09% | 2.13% |
| Net investment income (loss) | 1.35% | .87% | .75% | 1.70%B | .82% |
| Supplemental Data | | | | | |
| Net assets, end of period (000 omitted) | $4,894 | $4,818 | $5,668 | $6,548 | $6,504 |
| Portfolio turnover rateL | 56% | 55% | 71% | 82% | 59% |
A Calculated based on average shares outstanding during the period.
B Net Investment income per share reflects a large, non-recurring dividend which amounted to $.13 per share. Excluding this non-recurring dividend, the ratio of net investment income (loss) to average net assets would have been .41%.
C Amount includes a reimbursement from the investment adviser for an operational error which amounted to less than $.01 per share. Excluding this reimbursement, the total return would have been .94%.
D Total distributions of $.22 per share is comprised of distributions from net investment income of $.103 and distributions from net realized gain of $.112 per share.
E Total distributions of $.33 per share is comprised of distributions from net investment income of $.085 and distributions from net realized gain of $.246 per share.
F Total distributions of $.20 per share is comprised of distributions from net investment income of $.074 and distributions from net realized gain of $.121 per share.
G Amount represents less than $.005 per share.
H Total returns would have been lower if certain expenses had not been reduced during the applicable periods shown.
I Total returns do not include the effect of the contingent deferred sales charge.
J Fees and expenses of any underlying Fidelity Central Funds are not included in the Fund's expense ratio. The Fund indirectly bears its proportionate share of the expenses of any underlying Fidelity Central Funds.
K Expense ratios reflect operating expenses of the class. Expenses before reductions do not reflect amounts reimbursed by the investment adviser or reductions from brokerage service arrangements or reductions from other expense offset arrangements and do not represent the amount paid by the class during periods when reimbursements or reductions occur. Expenses net of fee waivers reflect expenses after reimbursement by the investment adviser but prior to reductions from brokerage service arrangements or other expense offset arrangements. Expenses net of all reductions represent the net expenses paid by the class.
L Amount does not include the portfolio activity of any underlying Fidelity Central Funds.
See accompanying notes which are an integral part of the financial statements.
Fidelity International Real Estate Fund
| Years ended July 31, | 2018 | 2017 | 2016 | 2015 | 2014 |
| Selected Per–Share Data | | | | | |
| Net asset value, beginning of period | $11.17 | $10.58 | $10.68 | $10.96 | $10.21 |
| Income from Investment Operations | | | | | |
| Net investment income (loss)A | .27 | .19 | .17 | .28B | .19 |
| Net realized and unrealized gain (loss) | .70 | .79 | .02 | (.09)C | 1.09 |
| Total from investment operations | .97 | .98 | .19 | .19 | 1.28 |
| Distributions from net investment income | (.24) | (.15) | (.17) | (.16) | (.18) |
| Distributions from net realized gain | (.11) | (.25) | (.12) | (.31) | (.35) |
| Total distributions | (.36)D | (.39)E | (.29) | (.47) | (.53) |
| Redemption fees added to paid in capitalA,F | – | – | – | – | – |
| Net asset value, end of period | $11.78 | $11.17 | $10.58 | $10.68 | $10.96 |
| Total ReturnG | 8.84% | 9.74% | 1.94% | 1.95%C | 13.12% |
| Ratios to Average Net AssetsH,I | | | | | |
| Expenses before reductions | 1.05% | 1.12% | 1.13% | 1.12% | 1.13% |
| Expenses net of fee waivers, if any | 1.05% | 1.12% | 1.13% | 1.12% | 1.13% |
| Expenses net of all reductions | 1.04% | 1.11% | 1.11% | 1.12% | 1.13% |
| Net investment income (loss) | 2.34% | 1.84% | 1.73% | 2.67%B | 1.82% |
| Supplemental Data | | | | | |
| Net assets, end of period (000 omitted) | $244,195 | $226,027 | $341,407 | $330,910 | $342,960 |
| Portfolio turnover rateJ | 56% | 55% | 71% | 82% | 59% |
A Calculated based on average shares outstanding during the period.
B Net Investment income per share reflects a large, non-recurring dividend which amounted to $.14 per share. Excluding this non-recurring dividend, the ratio of net investment income (loss) to average net assets would have been 1.38%.
C Amount includes a reimbursement from the investment adviser for an operational error which amounted to less than $.01 per share. Excluding this reimbursement, the total return would have been 1.92%.
D Total distributions of $.36 per share is comprised of distributions from net investment income of $.244 and distributions from net realized gain of $.112 per share.
E Total distributions of $.39 per share is comprised of distributions from net investment income of $.147 and distributions from net realized gain of $.246 per share.
F Amount represents less than $.005 per share.
G Total returns would have been lower if certain expenses had not been reduced during the applicable periods shown.
H Fees and expenses of any underlying Fidelity Central Funds are not included in the Fund's expense ratio. The Fund indirectly bears its proportionate share of the expenses of any underlying Fidelity Central Funds.
I Expense ratios reflect operating expenses of the class. Expenses before reductions do not reflect amounts reimbursed by the investment adviser or reductions from brokerage service arrangements or reductions from other expense offset arrangements and do not represent the amount paid by the class during periods when reimbursements or reductions occur. Expenses net of fee waivers reflect expenses after reimbursement by the investment adviser but prior to reductions from brokerage service arrangements or other expense offset arrangements. Expenses net of all reductions represent the net expenses paid by the class.
J Amount does not include the portfolio activity of any underlying Fidelity Central Funds.
See accompanying notes which are an integral part of the financial statements.
Fidelity International Real Estate Fund Class I
| Years ended July 31, | 2018 | 2017 | 2016 | 2015 | 2014 |
| Selected Per–Share Data | | | | | |
| Net asset value, beginning of period | $11.13 | $10.54 | $10.64 | $10.92 | $10.18 |
| Income from Investment Operations | | | | | |
| Net investment income (loss)A | .28 | .20 | .19 | .29B | .19 |
| Net realized and unrealized gain (loss) | .68 | .79 | .02 | (.09)C | 1.09 |
| Total from investment operations | .96 | .99 | .21 | .20 | 1.28 |
| Distributions from net investment income | (.28) | (.16) | (.19) | (.17) | (.19) |
| Distributions from net realized gain | (.11) | (.25) | (.12) | (.31) | (.35) |
| Total distributions | (.39) | (.40)D | (.31) | (.48) | (.54) |
| Redemption fees added to paid in capitalA,E | – | – | – | – | – |
| Net asset value, end of period | $11.70 | $11.13 | $10.54 | $10.64 | $10.92 |
| Total ReturnF | 8.88% | 9.89% | 2.15% | 2.01%C | 13.16% |
| Ratios to Average Net AssetsG,H | | | | | |
| Expenses before reductions | .96% | .95% | .97% | 1.03% | 1.12% |
| Expenses net of fee waivers, if any | .96% | .95% | .97% | 1.03% | 1.12% |
| Expenses net of all reductions | .95% | .95% | .96% | 1.03% | 1.12% |
| Net investment income (loss) | 2.44% | 2.00% | 1.89% | 2.76%B | 1.84% |
| Supplemental Data | | | | | |
| Net assets, end of period (000 omitted) | $350,392 | $171,444 | $98,238 | $37,426 | $7,336 |
| Portfolio turnover rateI | 56% | 55% | 71% | 82% | 59% |
A Calculated based on average shares outstanding during the period.
B Net Investment income per share reflects a large, non-recurring dividend which amounted to $.14 per share. Excluding this non-recurring dividend, the ratio of net investment income (loss) to average net assets would have been 1.46%.
C Amount includes a reimbursement from the investment adviser for an operational error which amounted to less than $.01 per share. Excluding this reimbursement, the total return would have been 1.98%.
D Total distributions of $.40 per share is comprised of distributions from net investment income of $.157 and distributions from net realized gain of $.246 per share.
E Amount represents less than $.005 per share.
F Total returns would have been lower if certain expenses had not been reduced during the applicable periods shown.
G Fees and expenses of any underlying Fidelity Central Funds are not included in the Fund's expense ratio. The Fund indirectly bears its proportionate share of the expenses of any underlying Fidelity Central Funds.
H Expense ratios reflect operating expenses of the class. Expenses before reductions do not reflect amounts reimbursed by the investment adviser or reductions from brokerage service arrangements or reductions from other expense offset arrangements and do not represent the amount paid by the class during periods when reimbursements or reductions occur. Expenses net of fee waivers reflect expenses after reimbursement by the investment adviser but prior to reductions from brokerage service arrangements or other expense offset arrangements. Expenses net of all reductions represent the net expenses paid by the class.
I Amount does not include the portfolio activity of any underlying Fidelity Central Funds.
See accompanying notes which are an integral part of the financial statements.
Notes to Financial Statements
For the period ended July 31, 2018
1. Organization.
Fidelity International Real Estate Fund (the Fund) is a non-diversified fund of Fidelity Select Portfolios (the Trust) and is authorized to issue an unlimited number of shares. The Trust is registered under the Investment Company Act of 1940, as amended (the 1940 Act), as an open-end management investment company organized as a Massachusetts business trust. The Fund offers Class A, Class M, Class C, International Real Estate, and Class I shares, each of which has equal rights as to assets and voting privileges. Each class has exclusive voting rights with respect to matters that affect that class.
2. Investments in Fidelity Central Funds.
The Fund invests in Fidelity Central Funds, which are open-end investment companies generally available only to other investment companies and accounts managed by the investment adviser and its affiliates. The Fund's Schedule of Investments lists each of the Fidelity Central Funds held as of period end, if any, as an investment of the Fund, but does not include the underlying holdings of each Fidelity Central Fund. As an Investing Fund, the Fund indirectly bears its proportionate share of the expenses of the underlying Fidelity Central Funds.
The Money Market Central Funds seek preservation of capital and current income and are managed by Fidelity Investments Money Management, Inc. (FIMM), an affiliate of the investment adviser. Annualized expenses of the Money Market Central Funds as of their most recent shareholder report date are less than .005%.
A complete unaudited list of holdings for each Fidelity Central Fund is available upon request or at the Securities and Exchange Commission (the SEC) website at www.sec.gov. In addition, the financial statements of the Fidelity Central Funds, which are not covered by the Fund's Report of Independent Registered Public Accounting Firm, are available on the SEC website or upon request.
3. Significant Accounting Policies.
The Fund is an investment company and applies the accounting and reporting guidance of the Financial Accounting Standards Board (FASB) Accounting Standards Codification Topic 946 Financial Services – Investments Companies. The financial statements have been prepared in conformity with accounting principles generally accepted in the United States of America (GAAP), which require management to make certain estimates and assumptions at the date of the financial statements. Actual results could differ from those estimates. Subsequent events, if any, through the date that the financial statements were issued have been evaluated in the preparation of the financial statements. The following summarizes the significant accounting policies of the Fund:
Investment Valuation. Investments are valued as of 4:00 p.m. Eastern time on the last calendar day of the period. The Board of Trustees (the Board) has delegated the day to day responsibility for the valuation of the Fund's investments to the Fair Value Committee (the Committee) established by the Fund's investment adviser. In accordance with valuation policies and procedures approved by the Board, the Fund attempts to obtain prices from one or more third party pricing vendors or brokers to value its investments. When current market prices, quotations or currency exchange rates are not readily available or reliable, investments will be fair valued in good faith by the Committee, in accordance with procedures adopted by the Board. Factors used in determining fair value vary by investment type and may include market or investment specific events. The frequency with which these procedures are used cannot be predicted and they may be utilized to a significant extent. The Committee oversees the Fund's valuation policies and procedures and reports to the Board on the Committee's activities and fair value determinations. The Board monitors the appropriateness of the procedures used in valuing the Fund's investments and ratifies the fair value determinations of the Committee.
The Fund categorizes the inputs to valuation techniques used to value its investments into a disclosure hierarchy consisting of three levels as shown below:
- Level 1 – quoted prices in active markets for identical investments
- Level 2 – other significant observable inputs (including quoted prices for similar investments, interest rates, prepayment speeds, etc.)
- Level 3 – unobservable inputs (including the Fund's own assumptions based on the best information available)
Valuation techniques used to value the Fund's investments by major category are as follows:
Equity securities, including restricted securities, for which market quotations are readily available, are valued at the last reported sale price or official closing price as reported by a third party pricing vendor on the primary market or exchange on which they are traded and are categorized as Level 1 in the hierarchy. In the event there were no sales during the day or closing prices are not available, securities are valued at the last quoted bid price or may be valued using the last available price and are generally categorized as Level 2 in the hierarchy. For foreign equity securities, when market or security specific events arise, comparisons to the valuation of American Depositary Receipts (ADRs), futures contracts, Exchange-Traded Funds (ETFs) and certain indexes as well as quoted prices for similar securities may be used and would be categorized as Level 2 in the hierarchy. Utilizing these techniques may result in transfers between Level 1 and Level 2. For equity securities, including restricted securities, where observable inputs are limited, assumptions about market activity and risk are used and these securities may be categorized as Level 3 in the hierarchy.
Investments in open-end mutual funds, including the Fidelity Central Funds, are valued at their closing net asset value (NAV) each business day and are categorized as Level 1 in the hierarchy.
Changes in valuation techniques may result in transfers in or out of an assigned level within the disclosure hierarchy. The aggregate value of investments by input level as of July 31, 2018, including information on transfers between Levels 1 and 2, is included at the end of the Fund's Schedule of Investments.
Foreign Currency. The Fund may use foreign currency contracts to facilitate transactions in foreign-denominated securities. Gains and losses from these transactions may arise from changes in the value of the foreign currency or if the counterparties do not perform under the contracts' terms.
Foreign-denominated assets, including investment securities, and liabilities are translated into U.S. dollars at the exchange rates at period end. Purchases and sales of investment securities, income and dividends received and expenses denominated in foreign currencies are translated into U.S. dollars at the exchange rate in effect on the transaction date.
The effects of exchange rate fluctuations on investments are included with the net realized and unrealized gain (loss) on investment securities. Other foreign currency transactions resulting in realized and unrealized gain (loss) are disclosed separately.
Investment Transactions and Income. For financial reporting purposes, the Fund's investment holdings and NAV include trades executed through the end of the last business day of the period. The NAV per share for processing shareholder transactions is calculated as of the close of business of the New York Stock Exchange (NYSE), normally 4:00 p.m. Eastern time and includes trades executed through the end of the prior business day. Gains and losses on securities sold are determined on the basis of identified cost. Dividend income is recorded on the ex-dividend date, except for certain dividends from foreign securities where the ex-dividend date may have passed, which are recorded as soon as the Fund is informed of the ex-dividend date. Non-cash dividends included in dividend income, if any, are recorded at the fair market value of the securities received. Income and capital gain distributions from Fidelity Central Funds, if any, are recorded on the ex-dividend date. Investment income is recorded net of foreign taxes withheld where recovery of such taxes is uncertain.
Class Allocations and Expenses. Investment income, realized and unrealized capital gains and losses, common expenses of the Fund, and certain fund-level expense reductions, if any, are allocated daily on a pro-rata basis to each class based on the relative net assets of each class to the total net assets of the Fund. Each class differs with respect to transfer agent and distribution and service plan fees incurred. Certain expense reductions may also differ by class. For the reporting period, the allocated portion of income and expenses to each class as a percent of its average net assets may vary due to the timing of recording these transactions in relation to fluctuating net assets of the classes. Expenses directly attributable to a fund are charged to that fund. Expenses attributable to more than one fund are allocated among the respective funds on the basis of relative net assets or other appropriate methods. Expense estimates are accrued in the period to which they relate and adjustments are made when actual amounts are known.
Income Tax Information and Distributions to Shareholders. Each year, the Fund intends to qualify as a regulated investment company under Subchapter M of the Internal Revenue Code, including distributing substantially all of its taxable income and realized gains. As a result, no provision for U.S. Federal income taxes is required. As of July 31, 2018, the Fund did not have any unrecognized tax benefits in the financial statements; nor is the Fund aware of any tax positions for which it is reasonably possible that the total amounts of unrecognized tax benefits will significantly change in the next twelve months. The Fund files a U.S. federal tax return, in addition to state and local tax returns as required. The Fund's federal income tax returns are subject to examination by the Internal Revenue Service (IRS) for a period of three fiscal years after they are filed. State and local tax returns may be subject to examination for an additional fiscal year depending on the jurisdiction. Foreign taxes are provided for based on the Fund's understanding of the tax rules and rates that exist in the foreign markets in which it invests. The Fund is subject to a tax imposed on capital gains by certain countries in which it invests.
Distributions are declared and recorded on the ex-dividend date. Income and capital gain distributions are declared separately for each class. Income and capital gain distributions are determined in accordance with income tax regulations, which may differ from GAAP.
Capital accounts within the financial statements are adjusted for permanent book-tax differences. These adjustments have no impact on net assets or the results of operations. Capital accounts are not adjusted for temporary book-tax differences which will reverse in a subsequent period.
Book-tax differences are primarily due to foreign currency transactions, certain foreign taxes, passive foreign investment companies (PFIC), capital loss carryforwards, expiring capital loss carryforwards and losses deferred due to wash sales.
As of period end, the cost and unrealized appreciation (depreciation) in securities, and derivatives if applicable, for federal income tax purposes were as follows:
| Gross unrealized appreciation | $26,483,698 |
| Gross unrealized depreciation | (32,858,528) |
| Net unrealized appreciation (depreciation) | $(6,374,830) |
| Tax Cost | $623,152,597 |
The tax-based components of distributable earnings as of period end were as follows:
| Undistributed ordinary income | $11,312,387 |
| Net unrealized appreciation (depreciation) on securities and other investments | $(6,369,056) |
The tax character of distributions paid was as follows:
| | July 31, 2018 | July 31, 2017 |
| Ordinary Income | $14,673,493 | $ 17,207,470 |
Short-Term Trading (Redemption) Fees. Shares held by investors in the Fund less than 90 days may have been subject to a redemption fee equal to 1.50% of the NAV of shares redeemed. All redemption fees, which reduce the proceeds of the shareholder redemption, are retained by the Fund and accounted for as an addition to paid in capital. In November 2017, the Board of Trustees approved the elimination of these redemption fees effective December 18, 2017.
Restricted Securities. The Fund may invest in securities that are subject to legal or contractual restrictions on resale. These securities generally may be resold in transactions exempt from registration or to the public if the securities are registered. Disposal of these securities may involve time-consuming negotiations and expense, and prompt sale at an acceptable price may be difficult. Information regarding restricted securities is included at the end of the Fund's Schedule of Investments.
4. Purchases and Sales of Investments.
Purchases and sales of securities, other than short-term securities, aggregated $444,045,345 and $280,337,762, respectively.
5. Fees and Other Transactions with Affiliates.
Management Fee. Fidelity SelectCo, LLC (the investment adviser) and its affiliates provide the Fund with investment management related services for which the Fund pays a monthly management fee. The management fee is the sum of an individual fund fee rate that is based on an annual rate of .45% of the Fund's average net assets and an annualized group fee rate that averaged .24% during the period. The group fee rate is based upon the average net assets of all the mutual funds advised by Fidelity Management & Research Company (FMR) and the investment adviser. The group fee rate decreases as assets under management increase and increases as assets under management decrease. For the reporting period, the total annual management fee rate was .69% of the Fund's average net assets.
Distribution and Service Plan Fees. In accordance with Rule 12b-1 of the 1940 Act, the Fund has adopted separate Distribution and Service Plans for each class of shares. Certain classes pay Fidelity Distributors Corporation (FDC), an affiliate of the investment adviser, separate Distribution and Service Fees, each of which is based on an annual percentage of each class' average net assets. In addition, FDC may pay financial intermediaries for selling shares of the Fund and providing shareholder support services. For the period, the Distribution and Service Fee rates, total fees and amounts retained by FDC were as follows:
| | Distribution Fee | Service Fee | Total Fees | Retained by FDC |
| Class A | -% | .25% | $28,146 | $1,462 |
| Class M | .25% | .25% | 21,904 | 388 |
| Class C | .75% | .25% | 49,969 | 5,419 |
| | | | $100,019 | $7,269 |
Sales Load. FDC may receive a front-end sales charge of up to 5.75% for selling Class A shares and 3.50% for selling Class M shares, some of which is paid to financial intermediaries for selling shares of the Fund. Depending on the holding period, FDC may receive contingent deferred sales charges levied on Class A, Class M and Class C redemptions. The deferred sales charges are 1.00% for Class C shares, 1.00% for certain purchases of Class A shares and .25% for certain purchases of Class M shares.
For the period, sales charge amounts retained by FDC were as follows:
| | Retained by FDC |
| Class A | $6,437 |
| Class M | 698 |
| Class C(a) | 436 |
| | $7,571 |
(a) When Class C shares are initially sold, FDC pays commissions from its own resources to financial intermediaries through which the sales are made.
Transfer Agent Fees. Fidelity Investments Institutional Operations Company, Inc., (FIIOC), an affiliate of the investment adviser, is the transfer, dividend disbursing and shareholder servicing agent for each class of the Fund. FIIOC receives account fees and asset-based fees that vary according to the account size and type of account of the shareholders of the respective classes of the Fund. FIIOC pays for typesetting, printing and mailing of shareholder reports, except proxy statements.
For the period, transfer agent fees for each class were as follows:
| | Amount | % of Class-Level Average Net Assets |
| Class A | $32,519 | .29 |
| Class M | 14,626 | .33 |
| Class C | 11,301 | .23 |
| International Real Estate | 552,012 | .23 |
| Class I | 364,572 | .14 |
| | $975,030 | |
Accounting and Security Lending Fees. Fidelity Service Company, Inc. (FSC), an affiliate of the investment adviser, maintains the Fund's accounting records. The accounting fee is based on the level of average net assets for each month. Under a separate contract, FSC administers the security lending program. The security lending fee is based on the number and duration of lending transactions. For the period, the fees were equivalent to an annual rate of .05%.
Brokerage Commissions. The Fund placed a portion of its portfolio transactions with brokerage firms which are affiliates of the investment adviser. Brokerage commissions are included in net realized gain (loss) and change in net unrealized appreciation (depreciation) in the Statement of Operations. The commissions paid to these affiliated firms were $2 for the period.
Interfund Trades. The Fund may purchase from or sell securities to other Fidelity Funds under procedures adopted by the Board. The procedures have been designed to ensure these interfund trades are executed in accordance with Rule 17a-7 of the 1940 Act. Interfund trades are included within the respective purchases and sales amounts shown in the Purchases and Sales of Investments note.
6. Committed Line of Credit.
The Fund participates with other funds managed by the investment adviser or an affiliate in a $4.25 billion credit facility (the "line of credit") to be utilized for temporary or emergency purposes to fund shareholder redemptions or for other short-term liquidity purposes. The Fund has agreed to pay commitment fees on its pro-rata portion of the line of credit, which amounted to $1,414 and is reflected in Miscellaneous expenses on the Statement of Operations. During the period, the Fund did not borrow on this line of credit.
7. Security Lending.
The Fund lends portfolio securities through a lending agent from time to time in order to earn additional income. On the settlement date of the loan, the Fund receives collateral (in the form of U.S. Treasury obligations, letters of credit and/or cash) against the loaned securities and maintains collateral in an amount not less than 100% of the market value of the loaned securities during the period of the loan. The market value of the loaned securities is determined at the close of business of the Fund and any additional required collateral is delivered to the Fund on the next business day. The Fund or borrower may terminate the loan at any time, and if the borrower defaults on its obligation to return the securities loaned because of insolvency or other reasons, the Fund may apply collateral received from the borrower against the obligation. The Fund may experience delays and costs in recovering the securities loaned. Any cash collateral received is invested in the Fidelity Securities Lending Cash Central Fund. The value of loaned securities and cash collateral at period end are disclosed on the Fund's Statement of Assets and Liabilities. Security lending income represents the income earned on investing cash collateral, less rebates paid to borrowers and any lending agent fees associated with the loan, plus any premium payments received for lending certain types of securities. Security lending income is presented in the Statement of Operations as a component of income from Fidelity Central Funds. Total security lending income during the period amounted to $64,783.
8. Expense Reductions.
Commissions paid to certain brokers with whom the investment adviser, or its affiliates, places trades on behalf of the Fund include an amount in addition to trade execution, which may be rebated back to the Fund to offset certain expenses. This amount totaled $34,477 for the period. In addition, through arrangements with the Fund's custodian, credits realized as a result of certain uninvested cash balances were used to reduce the Fund's expenses. During the period, these credits reduced the Fund's custody expenses by $52.
In addition, during the period the investment adviser reimbursed and/or waived a portion of fund-level operating expenses in the amount of $4,490.
9. Distributions to Shareholders.
Distributions to shareholders of each class were as follows:
| | Year ended
July 31, 2018 | Year ended
July 31, 2017 |
| From net investment income | | |
| Class A | $195,752 | $172,831 |
| Class M | 63,177 | 49,722 |
| Class C | 47,241 | 46,498 |
| International Real Estate | 4,956,891 | 4,709,837 |
| Class I | 4,861,753 | 1,473,124 |
| Total | $10,124,814 | $6,452,012 |
| From net realized gain | | |
| Class A | $107,906 | $324,553 |
| Class M | 42,399 | 106,361 |
| Class C | 50,358 | 134,570 |
| International Real Estate | 2,282,039 | 7,881,767 |
| Class I | 2,065,977 | 2,308,207 |
| Total | $4,548,679 | $10,755,458 |
10. Share Transactions.
Share transactions for each class were as follows and may contain automatic conversions between classes or exchanges between affiliated funds:
| | Shares | Shares | Dollars | Dollars |
| | Year ended July 31, 2018 | Year ended July 31, 2017 | Year ended July 31, 2018 | Year ended July 31, 2017 |
| Class A | | | | |
| Shares sold | 339,407 | 181,935 | $3,867,962 | $1,849,400 |
| Reinvestment of distributions | 27,005 | 48,795 | 298,868 | 481,116 |
| Shares redeemed | (314,754) | (649,016) | (3,593,331) | (6,392,090) |
| Net increase (decrease) | 51,658 | (418,286) | $573,499 | $(4,061,574) |
| Class M | | | | |
| Shares sold | 64,048 | 32,803 | $721,867 | $332,037 |
| Reinvestment of distributions | 9,612 | 15,081 | 105,576 | 147,798 |
| Shares redeemed | (74,640) | (106,218) | (848,189) | (1,035,018) |
| Net increase (decrease) | (980) | (58,334) | $(20,746) | $(555,183) |
| Class C | | | | |
| Shares sold | 112,833 | 65,324 | $1,260,510 | $644,923 |
| Reinvestment of distributions | 8,329 | 16,794 | 90,113 | 162,226 |
| Shares redeemed | (138,261) | (188,121) | (1,536,355) | (1,815,445) |
| Net increase (decrease) | (17,099) | (106,003) | $(185,732) | $(1,008,296) |
| International Real Estate | | | | |
| Shares sold | 4,614,000 | 3,759,060 | $53,516,447 | $38,129,039 |
| Reinvestment of distributions | 611,665 | 1,216,426 | 6,842,405 | 12,127,770 |
| Shares redeemed | (4,719,336) | (17,006,602) | (54,484,741) | (170,060,109) |
| Net increase (decrease) | 506,329 | (12,031,116) | $5,874,111 | $(119,803,300) |
| Class I | | | | |
| Shares sold | 17,465,869 | 10,978,201 | $199,780,614 | $111,375,436 |
| Reinvestment of distributions | 283,871 | 86,835 | 3,154,782 | 861,404 |
| Shares redeemed | (3,206,769) | (4,985,602) | (36,976,560) | (48,680,002) |
| Net increase (decrease) | 14,542,971 | 6,079,434 | $165,958,836 | $63,556,838 |
11. Other.
The Fund's organizational documents provide former and current trustees and officers with a limited indemnification against liabilities arising in connection with the performance of their duties to the Fund. In the normal course of business, the Fund may also enter into contracts that provide general indemnifications. The Fund's maximum exposure under these arrangements is unknown as this would be dependent on future claims that may be made against the Fund. The risk of material loss from such claims is considered remote.
At the end of the period, Strategic Advisers Fidelity International Fund was the owner of record of approximately 10% of the total outstanding shares of the Fund.
Report of Independent Registered Public Accounting Firm
To the Trustees of Fidelity Select Portfolios and Shareholders of Fidelity International Real Estate Fund:
Opinion on the Financial Statements and Financial Highlights
We have audited the accompanying statement of assets and liabilities of Fidelity International Real Estate Fund (the "Fund"), a fund of Fidelity Select Portfolios, including the schedule of investments, as of July 31, 2018, and the related statement of operations for the year then ended, the statement of changes in net assets for each of the two years in the period then ended, the financial highlights for each of the five years in the period then ended, and the related notes. In our opinion, the financial statements and financial highlights present fairly, in all material respects, the financial position of the Fund as of July 31, 2018, and the results of its operations for the year then ended, the changes in its net assets for each of the two years in the period then ended, and the financial highlights for each of the five years in the period then ended, in conformity with accounting principles generally accepted in the United States of America.
Basis for Opinion
These financial statements and financial highlights are the responsibility of the Fund's management. Our responsibility is to express an opinion on the Fund's financial statements and financial highlights based on our audits. We are a public accounting firm registered with the Public Company Accounting Oversight Board (United States) (PCAOB) and are required to be independent with respect to the Fund in accordance with the U.S. federal securities laws and the applicable rules and regulations of the Securities and Exchange Commission and the PCAOB.
We conducted our audits in accordance with the standards of the PCAOB. Those standards require that we plan and perform the audit to obtain reasonable assurance about whether the financial statements and financial highlights are free of material misstatement, whether due to error or fraud. The Fund is not required to have, nor were we engaged to perform, an audit of its internal control over financial reporting. As part of our audits we are required to obtain an understanding of internal control over financial reporting but not for the purpose of expressing an opinion on the effectiveness of the Fund’s internal control over financial reporting. Accordingly, we express no such opinion.
Our audits included performing procedures to assess the risks of material misstatement of the financial statements and financial highlights, whether due to error or fraud, and performing procedures that respond to those risks. Such procedures included examining, on a test basis, evidence regarding the amounts and disclosures in the financial statements and financial highlights. Our audits also included evaluating the accounting principles used and significant estimates made by management, as well as evaluating the overall presentation of the financial statements and financial highlights. Our procedures included confirmation of securities owned as of July 31, 2018, by correspondence with the custodians and brokers; when replies were not received from brokers, we performed other auditing procedures. We believe that our audits provide a reasonable basis for our opinion.
/s/ Deloitte & Touche LLP
Boston, Massachusetts
September 14, 2018
We have served as the auditor of one or more of the Fidelity investment companies since 1999.
Trustees and Officers
The Trustees, Members of the Advisory Board (if any), and officers of the trust and fund, as applicable, are listed below. The Board of Trustees governs the fund and is responsible for protecting the interests of shareholders. The Trustees are experienced executives who meet periodically throughout the year to oversee the fund's activities, review contractual arrangements with companies that provide services to the fund, oversee management of the risks associated with such activities and contractual arrangements, and review the fund's performance. Except for Michael E. Wiley, each of the Trustees oversees 286 funds. Mr. Wiley oversees 197 funds.
The Trustees hold office without limit in time except that (a) any Trustee may resign; (b) any Trustee may be removed by written instrument, signed by at least two-thirds of the number of Trustees prior to such removal; (c) any Trustee who requests to be retired or who has become incapacitated by illness or injury may be retired by written instrument signed by a majority of the other Trustees; and (d) any Trustee may be removed at any special meeting of shareholders by a two-thirds vote of the outstanding voting securities of the trust. Each Trustee who is not an interested person (as defined in the 1940 Act) of the trust and the fund is referred to herein as an Independent Trustee. Each Independent Trustee shall retire not later than the last day of the calendar year in which his or her 75th birthday occurs. The Independent Trustees may waive this mandatory retirement age policy with respect to individual Trustees. Officers and Advisory Board Members hold office without limit in time, except that any officer or Advisory Board Member may resign or may be removed by a vote of a majority of the Trustees at any regular meeting or any special meeting of the Trustees. Except as indicated, each individual has held the office shown or other offices in the same company for the past five years.
The fund’s Statement of Additional Information (SAI) includes more information about the Trustees. To request a free copy, call Fidelity at 1-800-544-8544.
Experience, Skills, Attributes, and Qualifications of the Trustees. The Governance and Nominating Committee has adopted a statement of policy that describes the experience, qualifications, attributes, and skills that are necessary and desirable for potential Independent Trustee candidates (Statement of Policy). The Board believes that each Trustee satisfied at the time he or she was initially elected or appointed a Trustee, and continues to satisfy, the standards contemplated by the Statement of Policy. The Governance and Nominating Committee also engages professional search firms to help identify potential Independent Trustee candidates who have the experience, qualifications, attributes, and skills consistent with the Statement of Policy. From time to time, additional criteria based on the composition and skills of the current Independent Trustees, as well as experience or skills that may be appropriate in light of future changes to board composition, business conditions, and regulatory or other developments, have also been considered by the professional search firms and the Governance and Nominating Committee. In addition, the Board takes into account the Trustees' commitment and participation in Board and committee meetings, as well as their leadership of standing and ad hoc committees throughout their tenure.
In determining that a particular Trustee was and continues to be qualified to serve as a Trustee, the Board has considered a variety of criteria, none of which, in isolation, was controlling. The Board believes that, collectively, the Trustees have balanced and diverse experience, qualifications, attributes, and skills, which allow the Board to operate effectively in governing the fund and protecting the interests of shareholders. Information about the specific experience, skills, attributes, and qualifications of each Trustee, which in each case led to the Board's conclusion that the Trustee should serve (or continue to serve) as a trustee of the fund, is provided below.
Board Structure and Oversight Function. James C. Curvey is an interested person and currently serves as Chairman. The Trustees have determined that an interested Chairman is appropriate and benefits shareholders because an interested Chairman has a personal and professional stake in the quality and continuity of services provided to the fund. Independent Trustees exercise their informed business judgment to appoint an individual of their choosing to serve as Chairman, regardless of whether the Trustee happens to be independent or a member of management. The Independent Trustees have determined that they can act independently and effectively without having an Independent Trustee serve as Chairman and that a key structural component for assuring that they are in a position to do so is for the Independent Trustees to constitute a substantial majority for the Board. The Independent Trustees also regularly meet in executive session. Ned C. Lautenbach serves as Chairman of the Independent Trustees and as such (i) acts as a liaison between the Independent Trustees and management with respect to matters important to the Independent Trustees and (ii) with management prepares agendas for Board meetings.
Fidelity® funds are overseen by different Boards of Trustees. The fund's Board oversees Fidelity's high income and certain equity funds, and other Boards oversee Fidelity's investment-grade bond, money market, asset allocation, and other equity funds. The asset allocation funds may invest in Fidelity® funds overseen by the fund's Board. The use of separate Boards, each with its own committee structure, allows the Trustees of each group of Fidelity® funds to focus on the unique issues of the funds they oversee, including common research, investment, and operational issues. On occasion, the separate Boards establish joint committees to address issues of overlapping consequences for the Fidelity® funds overseen by each Board.
The Trustees operate using a system of committees to facilitate the timely and efficient consideration of all matters of importance to the Trustees, the fund, and fund shareholders and to facilitate compliance with legal and regulatory requirements and oversight of the fund's activities and associated risks. The Board, acting through its committees, has charged SelectCo and its affiliates with (i) identifying events or circumstances the occurrence of which could have demonstrably adverse effects on the fund's business and/or reputation; (ii) implementing processes and controls to lessen the possibility that such events or circumstances occur or to mitigate the effects of such events or circumstances if they do occur; and (iii) creating and maintaining a system designed to evaluate continuously business and market conditions in order to facilitate the identification and implementation processes described in (i) and (ii) above. Because the day-to-day operations and activities of the fund are carried out by or through SelectCo, its affiliates, and other service providers, the fund's exposure to risks is mitigated but not eliminated by the processes overseen by the Trustees. While each of the Board's committees has responsibility for overseeing different aspects of the fund's activities, oversight is exercised primarily through the Operations, Audit, and Compliance Committees. In addition, the Independent Trustees have worked with Fidelity to enhance the Board's oversight of investment and financial risks, legal and regulatory risks, technology risks, and operational risks, including the development of additional risk reporting to the Board. Appropriate personnel, including but not limited to the fund's Chief Compliance Officer (CCO), SelectCo's internal auditor, the independent accountants, the fund's Treasurer and portfolio management personnel, make periodic reports to the Board's committees, as appropriate, including an annual review of Fidelity's risk management program for the Fidelity® funds. The responsibilities of each standing committee, including their oversight responsibilities, are described further under "Standing Committees of the Trustees."
Interested Trustees*:
Correspondence intended for a Trustee who is an interested person may be sent to Fidelity Investments, 245 Summer Street, Boston, Massachusetts 02210.
Name, Year of Birth; Principal Occupations and Other Relevant Experience+
James C. Curvey (1935)
Year of Election or Appointment: 2018
Trustee
Chairman of the Board of Trustees
Mr. Curvey also serves as Trustee of other Fidelity® funds. Mr. Curvey is Vice Chairman (2007-present) and Director of FMR LLC (diversified financial services company). In addition, Mr. Curvey is an Overseer Emeritus for the Boston Symphony Orchestra, a Director of Artis-Naples, and a Trustee of Brewster Academy in Wolfeboro, New Hampshire. Previously, Mr. Curvey served as a Director of Fidelity Research & Analysis Co. (investment adviser firm, 2009-2018), Director of Fidelity Investments Money Management, Inc. (investment adviser firm, 2009-2014) and a Director of FMR and FMR Co., Inc. (investment adviser firms, 2007-2014).
Charles S. Morrison (1960)
Year of Election or Appointment: 2018
Trustee
Mr. Morrison also serves as Trustee of other funds. He serves as President of Fidelity SelectCo, LLC (investment adviser firm, 2017-present) and Fidelity Management & Research Company (FMR) (investment adviser firm, 2016-present), a Director of Fidelity Investments Money Management, Inc. (FIMM) (investment adviser firm, 2014-present), Director of Fidelity SelectCo, LLC (investment adviser firm, 2014-present), President, Asset Management (2014-present), and is an employee of Fidelity Investments. Previously, Mr. Morrison served as Vice President of Fidelity's Fixed Income and Asset Allocation Funds (2012-2014), President, Fixed Income (2011-2014), Vice President of Fidelity's Money Market Funds (2005-2009), President, Money Market Group Leader of FMR (investment adviser firm, 2009), and Senior Vice President, Money Market Group of FMR (2004-2009). Mr. Morrison also served as Vice President of Fidelity's Bond Funds (2002-2005), certain Balanced Funds (2002-2005), and certain Asset Allocation Funds (2002-2007), and as Senior Vice President (2002-2005) of Fidelity's Bond Division.
* Determined to be an "Interested Trustee" by virtue of, among other things, his or her affiliation with the trust or various entities under common control with SelectCo.
+ The information includes the Trustee's principal occupation during the last five years and other information relating to the experience, attributes, and skills relevant to the Trustee's qualifications to serve as a Trustee, which led to the conclusion that the Trustee should serve as a Trustee for the fund.
Independent Trustees:
Correspondence intended for an Independent Trustee may be sent to Fidelity Investments, P.O. Box 55235, Boston, Massachusetts 02205-5235.
Name, Year of Birth; Principal Occupations and Other Relevant Experience+
Dennis J. Dirks (1948)
Year of Election or Appointment: 2018
Trustee
Mr. Dirks also serves as Trustee of other Fidelity® funds. Prior to his retirement in May 2003, Mr. Dirks was Chief Operating Officer and a member of the Board of The Depository Trust & Clearing Corporation (DTCC). He also served as President, Chief Operating Officer, and Board member of The Depository Trust Company (DTC) and President and Board member of the National Securities Clearing Corporation (NSCC). In addition, Mr. Dirks served as Chief Executive Officer and Board member of the Government Securities Clearing Corporation, Chief Executive Officer and Board member of the Mortgage-Backed Securities Clearing Corporation, as a Trustee and a member of the Finance Committee of Manhattan College (2005-2008), as a Trustee and a member of the Finance Committee of AHRC of Nassau County (2006-2008), as a member of the Independent Directors Council (IDC) Governing Council (2010-2015), and as a member of the Board of Directors for The Brookville Center for Children’s Services, Inc. (2009-2017). Mr. Dirks is a member of the Finance Committee (2016-present), Board of Directors (2017-present) and Board of Trustees (2018-present) and is Treasurer (2018-present) of the Asolo Repertory Theatre.
Donald F. Donahue (1950)
Year of Election or Appointment: 2018
Trustee
Mr. Donahue also serves as a Trustee of other Fidelity® funds. Mr. Donahue is President and Chief Executive Officer of Miranda Partners, LLC (risk consulting for the financial services industry, 2012-present). Previously, Mr. Donahue served as a Member of the Advisory Board of certain Fidelity® funds (2015-2018) and Chief Executive Officer (2006-2012), Chief Operating Officer (2003-2006), and Managing Director, Customer Marketing and Development (1999-2003) of The Depository Trust & Clearing Corporation (financial markets infrastructure). Mr. Donahue serves as a Member (2007-present) and Co-Chairman (2016-present) of the Board of Directors of United Way of New York, Member of the Board of Directors of NYC Leadership Academy (2012-present) and Member of the Board of Advisors of Ripple Labs, Inc. (financial services, 2015-present). He also served as Chairman (2010-2012) and Member of the Board of Directors (2012-2013) of Omgeo, LLC (financial services), Treasurer of United Way of New York (2012-2016), and Member of the Board of Directors of XBRL US (financial services non-profit, 2009-2012) and the International Securities Services Association (2009-2012).
Alan J. Lacy (1953)
Year of Election or Appointment: 2018
Trustee
Mr. Lacy also serves as Trustee of other Fidelity® funds. Mr. Lacy serves as a Director of Bristol-Myers Squibb Company (global pharmaceuticals, 2008-present). He is a Trustee of the California Chapter of The Nature Conservancy (2015-present) and a Director of the Center for Advanced Study in the Behavioral Sciences at Stanford University (2015-present). In addition, Mr. Lacy served as Senior Adviser (2007-2014) of Oak Hill Capital Partners, L.P. (private equity) and also served as Chief Executive Officer (2005) and Vice Chairman (2005-2006) of Sears Holdings Corporation (retail) and Chief Executive Officer and Chairman of the Board of Sears, Roebuck and Co. (retail, 2000-2005). Previously, Mr. Lacy served as Chairman (2014-2017) and a member (2010-2017) of the Board of Directors of Dave & Buster’s Entertainment, Inc. (restaurant and entertainment complexes), as Chairman (2008-2011) and a member (2006-2015) of the Board of Trustees of the National Parks Conservation Association, and as a member of the Board of Directors for The Hillman Companies, Inc. (hardware wholesalers, 2010-2014), Earth Fare, Inc. (retail grocery, 2010-2014), and The Western Union Company (global money transfer, 2006-2011).
Ned C. Lautenbach (1944)
Year of Election or Appointment: 2018
Trustee
Chairman of the Independent Trustees
Mr. Lautenbach also serves as Trustee of other Fidelity® funds. Mr. Lautenbach currently serves as Vice Chair of the Board of Governors, State University System of Florida (2013-present) and is a member of the Council on Foreign Relations (1994-present). He is also a member and has most recently served as Chairman of the Board of Directors of Artis-Naples (2012-present). Previously, Mr. Lautenbach served as a member and then Lead Director of the Board of Directors of Eaton Corporation (diversified industrial, 1997-2016). He was also a Partner and Advisory Partner at Clayton, Dubilier & Rice, LLC (private equity investment, 1998-2010), as well as a Director of Sony Corporation (2006-2007). In addition, Mr. Lautenbach also had a 30-year career with IBM (technology company) during which time he served as Senior Vice President and a member of the Corporate Executive Committee (1968-1998).
Joseph Mauriello (1944)
Year of Election or Appointment: 2018
Trustee
Mr. Mauriello also serves as Trustee of other Fidelity® funds. Prior to his retirement in January 2006, Mr. Mauriello served in numerous senior management positions including Deputy Chairman and Chief Operating Officer (2004-2005), and Vice Chairman of Financial Services (2002-2004) of KPMG LLP US (professional services, 1965-2005). Mr. Mauriello currently serves as a member of the Board of Directors of XL Group plc. (global insurance and re-insurance, 2006-present) and the Independent Directors Council (IDC) Governing Council (2015-present). Previously, Mr. Mauriello served as a Director of the Hamilton Funds of the Bank of New York (2006-2007) and of Arcadia Resources Inc. (health care services and products, 2007-2012).
Cornelia M. Small (1944)
Year of Election or Appointment: 2018
Trustee
Ms. Small also serves as Trustee of other Fidelity® funds. Ms. Small is a member of the Board of Directors (2009-present) and Chair of the Investment Committee (2010-present) of the Teagle Foundation. Ms. Small also serves on the Investment Committee of the Berkshire Taconic Community Foundation (2008-present). Previously, Ms. Small served as Chairperson (2002-2008) and a member of the Investment Committee and Chairperson (2008-2012) and a member of the Board of Trustees of Smith College. In addition, Ms. Small served as Chief Investment Officer, Director of Global Equity Investments, and a member of the Board of Directors of Scudder, Stevens & Clark and Scudder Kemper Investments.
Garnett A. Smith (1947)
Year of Election or Appointment: 2013
Trustee
Mr. Smith also serves as Trustee of other Fidelity® funds. Prior to Mr. Smith's retirement, he served as Chairman and Chief Executive Officer of Inbrand Corp. (manufacturer of personal absorbent products, 1990-1997). He also served as President (1986-1990) of Inbrand Corp. Prior to his employment with Inbrand Corp., he was employed by a retail fabric chain and North Carolina National Bank. In addition, Mr. Smith served as a Member of the Advisory Board of certain Fidelity® funds (2012-2013) and as a board member of the Jackson Hole Land Trust (2009-2012).
David M. Thomas (1949)
Year of Election or Appointment: 2018
Trustee
Mr. Thomas also serves as Trustee of other Fidelity® funds. Mr. Thomas serves as Non-Executive Chairman of the Board of Directors of Fortune Brands Home and Security (home and security products, 2011-present), as a member of the Board of Directors (2004-present) and Presiding Director (2013-present) of Interpublic Group of Companies, Inc. (marketing communication), and as a member of the Board of Trustees of the University of Florida (2013-present). Previously, Mr. Thomas served as Executive Chairman (2005-2006) and Chairman and Chief Executive Officer (2000-2005) of IMS Health, Inc. (pharmaceutical and healthcare information solutions), and a Director of Fortune Brands, Inc. (consumer products, 2000-2011).
Michael E. Wiley (1950)
Year of Election or Appointment: 2008
Trustee
Mr. Wiley also serves as Trustee or Member of the Advisory Board of other Fidelity® funds. Mr. Wiley serves as a Director of Andeavor Corporation (independent oil refiner and marketer, 2005-present), a Director of Andeavor Logistics LP (natural resources logistics, 2015-present), and a Director of Bill Barrett Corporation (exploration and production, 2005-present). In addition, Mr. Wiley also serves as a Director of Post Oak Bank (privately-held bank, 2004-present). Previously, Mr. Wiley served as a Trustee of other Fidelity® funds (2008-2013), as a Director of Asia Pacific Exploration Consolidated (international oil and gas exploration and production, 2008-2013), as a member of the Board of Trustees of the University of Tulsa (2000-2006; 2007-2010), as a Senior Energy Advisor of Katzenbach Partners, LLC (consulting, 2006-2007), as an Advisory Director of Riverstone Holdings (private investment), Chairman, President, and CEO of Baker Hughes, Inc. (oilfield services, 2000-2004), and as Director of Spinnaker Exploration Company (exploration and production, 2001-2005).
+ The information includes the Trustee's principal occupation during the last five years and other information relating to the experience, attributes, and skills relevant to the Trustee's qualifications to serve as a Trustee, which led to the conclusion that the Trustee should serve as a Trustee for the fund.
Advisory Board Members and Officers:
Correspondence intended for a Member of the Advisory Board (if any) may be sent to Fidelity Investments, P.O. Box 55235, Boston, Massachusetts 02205-5235. Correspondence intended for an officer or Peter S. Lynch may be sent to Fidelity Investments, 245 Summer Street, Boston, Massachusetts 02210. Officers appear below in alphabetical order.
Name, Year of Birth; Principal Occupation
Peter S. Lynch (1944)
Year of Election or Appointment: 2018
Member of the Advisory Board
Mr. Lynch also serves as Member of the Advisory Board of other Fidelity® funds. Mr. Lynch is Vice Chairman and a Director of FMR (investment adviser firm) and FMR Co., Inc. (investment adviser firm). In addition, Mr. Lynch serves as a Trustee of Boston College and as the Chairman of the Inner-City Scholarship Fund. Previously, Mr. Lynch served on the Special Olympics International Board of Directors (1997-2006).
William S. Stavropoulos (1939)
Year of Election or Appointment: 2018
Member of the Advisory Board
Mr. Stavropoulos also serves as Member of the Advisory Board of other Fidelity® funds. Mr. Stavropoulos serves as President and Founder of the Michigan Baseball Foundation, the Great Lakes Loons (2007-present). Mr. Stavropoulos is Chairman Emeritus of the Board of Directors of The Dow Chemical Company, where he previously served in numerous senior management positions, including President, CEO (1995-2000; 2002-2004), Chairman of the Executive Committee (2000-2006), and as a member of the Board of Directors (1990-2006). Currently, Mr. Stavropoulos is Chairman of the Board of Directors of Univar Inc. (global distributor of commodity and specialty chemicals), a Director of Teradata Corporation (data warehousing and technology solutions), and a member of the Advisory Board for Metalmark Capital LLC (private equity investment, 2005-present). Mr. Stavropoulos is an operating advisor to Clayton, Dubilier & Rice, LLC (private equity investment). In addition, Mr. Stavropoulos is a member of the University of Notre Dame Advisory Council for the College of Science, a Trustee of the Rollin L. Gerstacker Foundation, and a Director of Artis-Naples in Naples, Florida. Previously, Mr. Stavropoulos served as Trustee of certain Fidelity® funds (2001-2018) and as a Director of Chemical Financial Corporation (bank holding company, 1993-2012) and Tyco International, Ltd. (multinational manufacturing and services, 2007-2012).
Carol B. Tomé (1957)
Year of Election or Appointment: 2017
Member of the Advisory Board
Ms. Tomé also serves as Member of the Advisory Board of other Fidelity® funds. Ms. Tomé is Chief Financial Officer (2001-present) and Executive Vice President of Corporate Services (2007-present) of The Home Depot, Inc. (home improvement retailer) and a Director (2003-present) and Chair of the Audit Committee (2004-present) of United Parcel Service, Inc. (package delivery and supply chain management). Previously, Ms. Tomé served as Trustee of certain Fidelity® funds (2017), Senior Vice President of Finance and Accounting/Treasurer (2000-2007) and Vice President and Treasurer (1995-2000) of The Home Depot, Inc. and Chair of the Board (2010-2012), Vice Chair of the Board (2009 and 2013), and a Director (2008-2013) of the Federal Reserve Bank of Atlanta. Ms. Tomé is also a director or trustee of many community and professional organizations.
Elizabeth Paige Baumann (1968)
Year of Election or Appointment: 2017
Anti-Money Laundering (AML) Officer
Ms. Baumann also serves as AML Officer of other funds. She is Chief AML Officer (2012-present) and Senior Vice President (2014-present) of FMR LLC (diversified financial services company) and is an employee of Fidelity Investments. Previously, Ms. Baumann served as AML Officer of the funds (2012-2016), and Vice President (2007-2014) and Deputy Anti-Money Laundering Officer (2007-2012) of FMR LLC.
Marc R. Bryant (1966)
Year of Election or Appointment: 2013
Secretary and Chief Legal Officer (CLO)
Mr. Bryant also serves as Secretary and CLO of other funds. Mr. Bryant serves as CLO, Secretary, and Senior Vice President of Fidelity Management & Research Company (investment adviser firm, 2015-present) and FMR Co., Inc. (investment adviser firm, 2015-present); Secretary of Fidelity SelectCo, LLC (investment adviser firm, 2015-present) and Fidelity Investments Money Management, Inc. (investment adviser firm, 2015-present); and CLO of Fidelity Management & Research (Hong Kong) Limited and FMR Investment Management (UK) Limited (investment adviser firms, 2015-present) and Fidelity Management & Research (Japan) Limited (investment adviser firm, 2016-present). He is Senior Vice President and Deputy General Counsel of FMR LLC (diversified financial services company). Previously, Mr. Bryant served as Secretary and CLO of Fidelity Rutland Square Trust II (2010-2014) and Assistant Secretary of Fidelity's Fixed Income and Asset Allocation Funds (2013-2015). Prior to joining Fidelity Investments, Mr. Bryant served as a Senior Vice President and the Head of Global Retail Legal for AllianceBernstein L.P. (2006-2010), and as the General Counsel for ProFund Advisors LLC (2001-2006).
John J. Burke III (1964)
Year of Election or Appointment: 2018
Chief Financial Officer
Mr. Burke also serves as Chief Financial Officer of other funds. Mr. Burke serves as Head of Investment Operations for Fidelity Fund and Investment Operations (2018-present) and is an employee of Fidelity Investments (1998-present). Previously Mr. Burke served as head of Asset Management Investment Operations (2012-2018).
William C. Coffey (1969)
Year of Election or Appointment: 2009
Assistant Secretary
Mr. Coffey also serves as Assistant Secretary of other funds. He is Senior Vice President and Deputy General Counsel of FMR LLC (diversified financial services company, 2010-present), and is an employee of Fidelity Investments. Previously, Mr. Coffey served as Vice President and Associate General Counsel of FMR LLC (2005-2009).
Timothy M. Cohen (1969)
Year of Election or Appointment: 2018
Vice President
Mr. Cohen also serves as Vice President of other funds. Mr. Cohen serves as Co-Head of Global Equity Research (2016-present), a Director of Fidelity Management & Research (Japan) Limited (investment adviser firm, 2016-present), and is an employee of Fidelity Investments. Previously, Mr. Cohen served as Chief Investment Officer - Equity and a Director of Fidelity Management & Research (U.K.) Inc. (investment adviser firm, 2013-2015) and as a Director of Fidelity Management & Research (Hong Kong) Limited (investment adviser firm, 2017).
Jonathan Davis (1968)
Year of Election or Appointment: 2010
Assistant Treasurer
Mr. Davis also serves as Assistant Treasurer of other funds. Mr. Davis serves as Assistant Treasurer of FMR Capital, Inc. (2017-present) and is an employee of Fidelity Investments. Previously, Mr. Davis served as Vice President and Associate General Counsel of FMR LLC (diversified financial services company, 2003-2010).
Adrien E. Deberghes (1967)
Year of Election or Appointment: 2018
Assistant Treasurer
Mr. Deberghes also serves as an officer of other funds. He serves as Assistant Treasurer of FMR Capital, Inc. (2017-present), Executive Vice President of Fidelity Investments Money Management, Inc. (FIMM) (investment adviser firm, 2016-present), and is an employee of Fidelity Investments (2008-present). Previously, Mr. Deberghes served as President and Treasurer of certain Fidelity® funds (2013-2018). Prior to joining Fidelity Investments, Mr. Deberghes was Senior Vice President of Mutual Fund Administration at State Street Corporation (2007-2008), Senior Director of Mutual Fund Administration at Investors Bank & Trust (2005-2007), and Director of Finance for Dunkin' Brands (2000-2005). Previously, Mr. Deberghes served in other fund officer roles.
Laura M. Del Prato (1964)
Year of Election or Appointment: 2018
Assistant Treasurer
Ms. Del Prato also serves as an officer of other funds. Ms. Del Prato is an employee of Fidelity Investments (2017-present). Prior to joining Fidelity Investments, Ms. Del Prato served as a Managing Director and Treasurer of the JPMorgan Mutual Funds (2014-2017). Prior to JPMorgan, Ms. Del Prato served as a partner at Cohen Fund Audit Services (accounting firm, 2012-2013) and KPMG LLP (accounting firm, 2004-2012).
Colm A. Hogan (1973)
Year of Election or Appointment: 2018
Deputy Treasurer
Mr. Hogan also serves as an officer of other funds. Mr. Hogan serves as Assistant Treasurer of FMR Capital, Inc. (2017-present) and is an employee of Fidelity Investments (2005-present). Previously, Mr. Hogan served as Assistant Treasurer of certain Fidelity® funds (2016-2018).
Pamela R. Holding (1964)
Year of Election or Appointment: 2018
Vice President
Ms. Holding also serves as a Vice President of other funds. Ms. Holding serves as Co-Head of Global Equity Research (2018-present) and is an employee of Fidelity Investments (2013-present).
Chris Maher (1972)
Year of Election or Appointment: 2013
Assistant Treasurer
Mr. Maher serves as Assistant Treasurer of other funds. Mr. Maher is Vice President of Valuation Oversight, serves as Assistant Treasurer of FMR Capital, Inc. (2017-present), and is an employee of Fidelity Investments. Previously, Mr. Maher served as Vice President of Asset Management Compliance (2013), Vice President of the Program Management Group of FMR (investment adviser firm, 2010-2013), and Vice President of Valuation Oversight (2008-2010).
Rieco E. Mello (1969)
Year of Election or Appointment: 2017
Assistant Treasurer
Mr. Mello also serves as Assistant Treasurer of other funds. Mr. Mello serves as Assistant Treasurer of FMR Capital, Inc. (2017-present) and is an employee of Fidelity Investments (1995-present).
Kenneth B. Robins (1969)
Year of Election or Appointment: 2018
Chief Compliance Officer
Mr. Robins also serves as an officer of other funds. Mr. Robins serves as Compliance Officer of Fidelity Management & Research Company and FMR Co., Inc. (investment adviser firms, 2016-present) and is an employee of Fidelity Investments (2004-present). Previously, Mr. Robins served as Executive Vice President of Fidelity Investments Money Management, Inc. (investment adviser firm, 2013-2016) and served in other fund officer roles.
Stacie M. Smith (1974)
Year of Election or Appointment: 2018
President and Treasurer
Ms. Smith also serves as an officer of other funds. Ms. Smith serves as Assistant Treasurer of FMR Capital, Inc. (2017-present), is an employee of Fidelity Investments (2009-present), and has served in other fund officer roles. Prior to joining Fidelity Investments, Ms. Smith served as Senior Audit Manager of Ernst & Young LLP (accounting firm, 1996-2009). Previously, Ms. Smith served as Assistant Treasurer (2013-2018) and Deputy Treasurer (2013-2016) of certain Fidelity® funds.
Marc L. Spector (1972)
Year of Election or Appointment: 2017
Assistant Treasurer
Mr. Spector also serves as an officer of other funds. Mr. Spector serves as Assistant Treasurer of FMR Capital, Inc. (2017-present) and is an employee of Fidelity Investments (2016-present). Prior to joining Fidelity Investments, Mr. Spector served as Director at the Siegfried Group (accounting firm, 2013-2016), and prior to Siegfried Group as audit senior manager at Deloitte & Touche (accounting firm, 2005-2013).
Renee Stagnone (1975)
Year of Election or Appointment: 2016
Assistant Treasurer
Ms. Stagnone also serves as an officer of other funds. Ms. Stagnone serves as Assistant Treasurer of FMR Capital, Inc. (2017-present) and is an employee of Fidelity Investments (1997-present). Previously, Ms. Stagnone served as Deputy Treasurer of certain Fidelity® funds (2013-2016).
Shareholder Expense Example
As a shareholder of the Fund, you incur two types of costs: (1) transaction costs, including sales charges (loads) on purchase payments or redemption proceeds, and (2) ongoing costs, including management fees, distribution and/or service (12b-1) fees and other Fund expenses. This Example is intended to help you understand your ongoing costs (in dollars) of investing in the Fund and to compare these costs with the ongoing costs of investing in other mutual funds.
The Example is based on an investment of $1,000 invested at the beginning of the period and held for the entire period (February 1, 2018 to July 31, 2018).
Actual Expenses
The first line of the accompanying table for each class of the Fund provides information about actual account values and actual expenses. You may use the information in this line, together with the amount you invested, to estimate the expenses that you paid over the period. Simply divide your account value by $1,000.00 (for example, an $8,600 account value divided by $1,000.00 = 8.6), then multiply the result by the number in the first line for a class of the Fund under the heading entitled "Expenses Paid During Period" to estimate the expenses you paid on your account during this period. A small balance maintenance fee of $12.00 that is charged once a year may apply for certain accounts with a value of less than $2,000. This fee is not included in the table below. If it was, the estimate of expenses you paid during the period would be higher, and your ending account value lower, by this amount. In addition, the Fund, as a shareholder in the underlying Fidelity Central Funds, will indirectly bear its pro-rata share of the fees and expenses incurred by the underlying Fidelity Central Funds. These fees and expenses are not included in the Fund's annualized expense ratio used to calculate the expense estimate in the table below.
Hypothetical Example for Comparison Purposes
The second line of the accompanying table for each class of the Fund provides information about hypothetical account values and hypothetical expenses based on a Class' actual expense ratio and an assumed rate of return of 5% per year before expenses, which is not the Class' actual return. The hypothetical account values and expenses may not be used to estimate the actual ending account balance or expenses you paid for the period. You may use this information to compare the ongoing costs of investing in the Fund and other funds. To do so, compare this 5% hypothetical example with the 5% hypothetical examples that appear in the shareholder reports of the other funds. A small balance maintenance fee of $12.00 that is charged once a year may apply for certain accounts with a value of less than $2,000. This fee is not included in the table below. If it was, the estimate of expenses you paid during the period would be higher, and your ending account value lower, by this amount. In addition, the Fund, as a shareholder in the underlying Fidelity Central Funds, will indirectly bear its pro-rata share of the fees and expenses incurred by the underlying Fidelity Central Funds. These fees and expenses are not included in the Fund's annualized expense ratio used to calculate the expense estimate in the table below.
Please note that the expenses shown in the table are meant to highlight your ongoing costs only and do not reflect any transaction costs. Therefore, the second line of the table is useful in comparing ongoing costs only, and will not help you determine the relative total costs of owning different funds. In addition, if these transactional costs were included, your costs would have been higher.
| | Annualized Expense Ratio-A | Beginning
Account Value
February 1, 2018 | Ending
Account Value
July 31, 2018 | Expenses Paid
During Period-B
February 1, 2018
to July 31, 2018 |
| Class A | 1.34% | | | |
| Actual | | $1,000.00 | $970.00 | $6.55 |
| Hypothetical-C | | $1,000.00 | $1,018.15 | $6.71 |
| Class M | 1.64% | | | |
| Actual | | $1,000.00 | $968.90 | $8.01 |
| Hypothetical-C | | $1,000.00 | $1,016.66 | $8.20 |
| Class C | 2.03% | | | |
| Actual | | $1,000.00 | $966.70 | $9.90 |
| Hypothetical-C | | $1,000.00 | $1,014.73 | $10.14 |
| International Real Estate | 1.04% | | | |
| Actual | | $1,000.00 | $971.90 | $5.08 |
| Hypothetical-C | | $1,000.00 | $1,019.64 | $5.21 |
| Class I | .95% | | | |
| Actual | | $1,000.00 | $971.80 | $4.64 |
| Hypothetical-C | | $1,000.00 | $1,020.08 | $4.76 |
A Annualized expense ratio reflects expenses net of applicable fee waivers.
B Expenses are equal to each Class' annualized expense ratio, multiplied by the average account value over the period, multiplied by 181/365 (to reflect the one-half year period).
C 5% return per year before expenses
Distributions (Unaudited)
The Board of Trustees of Fidelity International Real Estate Fund voted to pay to shareholders of record at the opening of business on record date, the following distributions per share derived from capital gains realized from sales of portfolio securities, and dividends derived from net investment income:
| | Pay Date | Record Date | Dividends | Capital Gains |
| Fidelity International Real Estate Fund | | | | |
| Class A | 09/17/18 | 09/14/18 | $0.165 | $0.031 |
| Class M | 09/17/18 | 09/14/18 | $0.141 | $0.031 |
| Class C | 09/17/18 | 09/14/18 | $0.118 | $0.031 |
| International Real Estate | 09/17/18 | 09/14/18 | $0.185 | $0.031 |
| Class I | 09/17/18 | 09/14/18 | $0.193 | $0.031 |
|
Class A designates 68% and 45%, Class M designates 76% and 52%, Class C designates 95% and 67%, International Real Estate designates 62% and 39%, and Class I designates 55% and 38% of the dividends distributed in September and December, respectively during the fiscal year as amounts which may be taken into account as a dividend for purposes of the maximum rate under section 1(h)(11) of the Internal Revenue Code.
The amounts per share which represent income derived from sources within, and taxes paid to, foreign countries or possessions of the United States are as follows:
| | Pay Date | Income | Taxes |
| Fidelity International Real Estate Fund | | | |
| Class A | 09/18/17 | $0.2406 | $0.0166 |
| Class A | 12/18/17 | $0.0628 | $0.0053 |
| Class M | 09/18/17 | $0.2156 | $0.0166 |
| Class M | 12/18/17 | $0.0545 | $0.0053 |
| Class C | 09/18/17 | $0.1706 | $0.0166 |
| Class C | 12/18/17 | $0.0419 | $0.0053 |
| International Real Estate | 09/18/17 | $0.2646 | $0.0166 |
| International Real Estate | 12/18/17 | $0.0716 | $0.0053 |
| Class I | 09/18/17 | $0.2976 | $0.0166 |
| Class I | 12/18/17 | $0.0748 | $0.0053 |
|
The fund will notify shareholders in January 2019 of amounts for use in preparing 2018 income tax returns.
Corporate Headquarters
245 Summer St.
Boston, MA 02210
www.fidelity.com
IRE-ANN-0918
1.801328.113
Fidelity® Real Estate Investment Portfolio
Annual Report July 31, 2018 |
|
Contents
To view a fund's proxy voting guidelines and proxy voting record for the 12-month period ended June 30, visit http://www.fidelity.com/proxyvotingresults or visit the Securities and Exchange Commission's (SEC) web site at http://www.sec.gov.
You may also call 1-800-544-8544 to request a free copy of the proxy voting guidelines.
Standard & Poor's, S&P and S&P 500 are registered service marks of The McGraw-Hill Companies, Inc. and have been licensed for use by Fidelity Distributors Corporation.
Other third-party marks appearing herein are the property of their respective owners.
All other marks appearing herein are registered or unregistered trademarks or service marks of FMR LLC or an affiliated company. © 2018 FMR LLC. All rights reserved.
This report and the financial statements contained herein are submitted for the general information of the shareholders of the Fund. This report is not authorized for distribution to prospective investors in the Fund unless preceded or accompanied by an effective prospectus.
A fund files its complete schedule of portfolio holdings with the SEC for the first and third quarters of each fiscal year on Form N-Q. Forms N-Q are available on the SEC’s web site at http://www.sec.gov. A fund's Forms N-Q may be reviewed and copied at the SEC’s Public Reference Room in Washington, DC. Information regarding the operation of the SEC's Public Reference Room may be obtained by calling 1-800-SEC-0330.
For a complete list of a fund's portfolio holdings, view the most recent holdings listing, semiannual report, or annual report on Fidelity's web site at http://www.fidelity.com, http://www.institutional.fidelity.com, or http://www.401k.com, as applicable.
NOT FDIC INSURED •MAY LOSE VALUE •NO BANK GUARANTEE
Neither the Fund nor Fidelity Distributors Corporation is a bank.
Performance: The Bottom Line
Average annual total return reflects the change in the value of an investment, assuming reinvestment of distributions from dividend income and capital gains (the profits earned upon the sale of securities that have grown in value, if any) and assuming a constant rate of performance each year. The hypothetical investment and the average annual total returns do not reflect the deduction of taxes that a shareholder would pay on fund distributions or the redemption of fund shares. During periods of reimbursement by Fidelity, a fund’s total return will be greater than it would be had the reimbursement not occurred. How a fund did yesterday is no guarantee of how it will do tomorrow.
Average Annual Total Returns
| For the periods ended July 31, 2018 | Past 1 year | Past 5 years | Past 10 years |
| Fidelity® Real Estate Investment Portfolio | 3.13% | 8.60% | 8.08% |
$10,000 Over 10 Years
Let's say hypothetically that $10,000 was invested in Fidelity® Real Estate Investment Portfolio on July 31, 2008.
The chart shows how the value of your investment would have changed, and also shows how the S&P 500® Index performed over the same period.
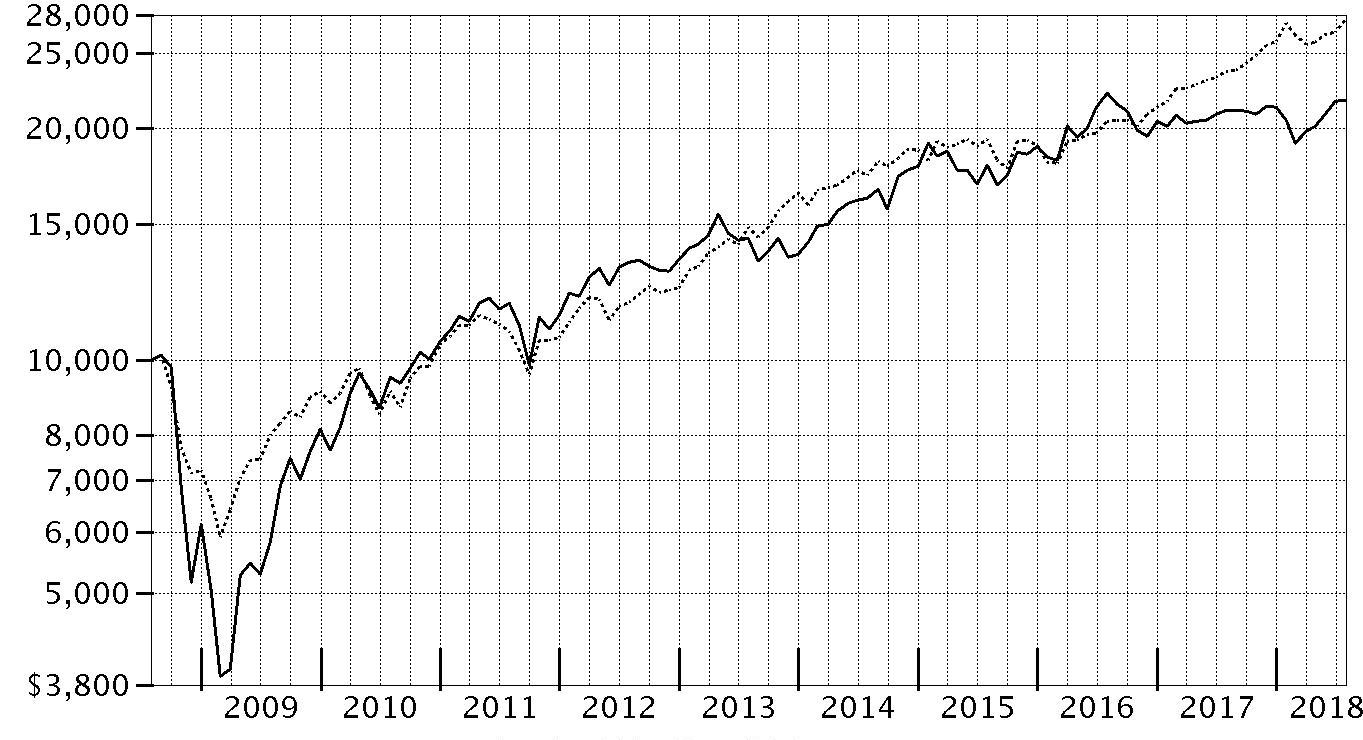
| Period Ending Values |
| $21,743 | Fidelity® Real Estate Investment Portfolio |
| $27,551 | S&P 500® Index |
Management's Discussion of Fund Performance
Market Recap: The U.S. equity bellwether S&P 500
® index gained 16.24% for the 12 months ending July 31, 2018, despite a resurgence in volatility that challenged the multiyear bull market. Stocks maintained their steady growth until a sharp reversal in February, as volatility spiked amid fear that rising inflation and the potential for the economy to overheat would prompt the U.S. Federal Reserve to pick up the pace of interest rate hikes. The index posted its first negative monthly result since October 2016, and then lost further ground in March on fear of a global trade war. The market stabilized in April and turned upward through mid-June, when escalating trade tension between the U.S. and China soured investor sentiment. The resulting uncertainty lingered into July, but strong corporate earnings helped the S&P 500 rise 3.72% that month to cap the period. For the full one-year period, growth handily topped value, while small-caps bested large-caps. By sector, information technology (+28%) led the way, boosted by strong earnings growth from several major index constituents. Consumer discretionary rose roughly 24%, driven by retailers (+49%). Energy (+20%) gained alongside higher oil prices. Laggards were telecommunication services (-2%), consumer staples (0%) and utilities (+3%), defensive groups that struggled amid rising interest rates and a general preference for risk. Real estate (+5%) fared a bit better but still lagged, as did financials, industrials, health care (each up 13%) and materials (+11%).
Comments from Portfolio Manager Steven Buller: For the fiscal year, the fund gained 3.13%, trailing the 3.85% return of the Dow Jones U.S. Select Real Estate Securities Index℠ and widely lagging the S&P 500
®. The fund's underperformance of the Dow Jones real estate index was mostly due to underweightings in two strong-performing real estate investment trust (REIT) categories – hotels and self storage. Subpar security selection among retail REITs also detracted from our relative result. Conversely, favorable positioning in the industrial/office category, where a combination of strong security selection and an overweighting, added value versus the benchmark. Our top-contributing industrial REITs were DCT and Prologis – which in April agreed to merge – as well as Duke Realty. Prologis and Duke Realty were among the fund's largest period-end holdings. Among health care REITs, an underperforming category, we lacked exposure to poor-performing benchmark component HCP, although that result was mostly offset by an overweighting in Ventas, one of the fund's largest holdings. Results also were mixed in self storage. An overweighting in Extra Space Storage helped, although lacking exposure to strong-performing index components Life Storage and CubeSmart and underweighting Public Storage for most of the period hurt relative performance. Over time, I added to Public Storage, one of our largest holdings on July 31. Another detractor was mall owner Macerich, which, in hindsight, I bought and sold at inopportune times.
The views expressed above reflect those of the portfolio manager(s) only through the end of the period as stated on the cover of this report and do not necessarily represent the views of Fidelity or any other person in the Fidelity organization. Any such views are subject to change at any time based upon market or other conditions and Fidelity disclaims any responsibility to update such views. These views may not be relied on as investment advice and, because investment decisions for a Fidelity fund are based on numerous factors, may not be relied on as an indication of trading intent on behalf of any Fidelity fund.
Investment Summary (Unaudited)
Top Ten Stocks as of July 31, 2018
| | % of fund's net assets |
| Simon Property Group, Inc. | 8.8 |
| Prologis, Inc. | 7.3 |
| Public Storage | 5.5 |
| Boston Properties, Inc. | 4.9 |
| UDR, Inc. | 4.9 |
| Duke Realty Corp. | 4.6 |
| Equity Residential (SBI) | 4.1 |
| Ventas, Inc. | 4.1 |
| AvalonBay Communities, Inc. | 3.9 |
| Digital Realty Trust, Inc. | 3.9 |
| | 52.0 |
Top Five REIT Sectors as of July 31, 2018
| | % of fund's net assets |
| REITs - Apartments | 19.2 |
| REITs - Office Property | 13.8 |
| REITs - Diversified | 11.8 |
| REITs - Regional Malls | 10.2 |
| REITs - Warehouse/Industrial | 9.2 |
Asset Allocation (% of fund's net assets)
| As of July 31, 2018 * |
| | Stocks | 98.8% |
| | Short-Term Investments and Net Other Assets (Liabilities) | 1.2% |

* Foreign investments - 0.5%
Schedule of Investments July 31, 2018
Showing Percentage of Net Assets
| Common Stocks - 98.8% | | | |
| | | Shares | Value (000s) |
| Equity Real Estate Investment Trusts (REITs) - 97.8% | | | |
| REITs - Apartments - 19.2% | | | |
| American Homes 4 Rent Class A | | 2,677,200 | $59,273 |
| Apartment Investment & Management Co. Class A | | 858,774 | 36,627 |
| AvalonBay Communities, Inc. | | 879,000 | 155,451 |
| Camden Property Trust (SBI) | | 724,300 | 67,063 |
| Equity Residential (SBI) | | 2,460,900 | 161,017 |
| Essex Property Trust, Inc. | | 361,200 | 86,851 |
| UDR, Inc. | | 4,988,941 | 191,974 |
| | | | 758,256 |
| REITs - Diversified - 11.3% | | | |
| Cousins Properties, Inc. | | 2,473,600 | 23,054 |
| Crown Castle International Corp. | | 177,800 | 19,706 |
| Digital Realty Trust, Inc. | | 1,249,100 | 151,666 |
| Duke Realty Corp. | | 6,268,700 | 182,545 |
| Equinix, Inc. | | 108,200 | 47,530 |
| Washington REIT (SBI) | | 679,600 | 20,721 |
| | | | 445,222 |
| REITs - Health Care - 8.0% | | | |
| Healthcare Trust of America, Inc. | | 479,500 | 13,100 |
| Ventas, Inc. | | 2,828,854 | 159,491 |
| Welltower, Inc. | | 2,274,240 | 142,367 |
| | | | 314,958 |
| REITs - Hotels - 5.8% | | | |
| Braemar Hotels & Resorts, Inc. | | 663,000 | 7,578 |
| DiamondRock Hospitality Co. | | 4,076,900 | 48,597 |
| Host Hotels & Resorts, Inc. | | 6,207,805 | 129,991 |
| Park Hotels & Resorts, Inc. | | 364,342 | 11,397 |
| RLJ Lodging Trust | | 1,347,300 | 30,436 |
| | | | 227,999 |
| REITs - Manufactured Homes - 5.2% | | | |
| Equity Lifestyle Properties, Inc. | | 1,334,787 | 121,452 |
| Sun Communities, Inc. | | 849,763 | 82,393 |
| | | | 203,845 |
| REITs - Office Property - 13.8% | | | |
| Boston Properties, Inc. | | 1,540,000 | 193,316 |
| Brandywine Realty Trust (SBI) | | 3,586,800 | 59,146 |
| Douglas Emmett, Inc. | | 1,312,400 | 50,974 |
| Highwoods Properties, Inc. (SBI) | | 802,923 | 39,432 |
| Hudson Pacific Properties, Inc. | | 1,297,550 | 44,454 |
| Piedmont Office Realty Trust, Inc. Class A | | 1,747,200 | 34,560 |
| SL Green Realty Corp. | | 991,246 | 102,207 |
| VEREIT, Inc. | | 2,505,700 | 19,118 |
| | | | 543,207 |
| REITs - Regional Malls - 10.2% | | | |
| Simon Property Group, Inc. | | 1,958,572 | 345,118 |
| The Macerich Co. | | 949,900 | 56,101 |
| | | | 401,219 |
| REITs - Shopping Centers - 6.1% | | | |
| Acadia Realty Trust (SBI) | | 1,733,523 | 46,944 |
| Brixmor Property Group, Inc. | | 2,385,596 | 42,201 |
| Kimco Realty Corp. | | 3,316,090 | 55,346 |
| Regency Centers Corp. | | 1,302,600 | 82,884 |
| Urban Edge Properties | | 611,300 | 13,864 |
| | | | 241,239 |
| REITs - Single Tenant - 0.6% | | | |
| Spirit Realty Capital, Inc. | | 2,698,400 | 22,586 |
| REITs - Storage - 8.4% | | | |
| Extra Space Storage, Inc. | | 1,224,940 | 115,108 |
| Public Storage | | 994,000 | 216,523 |
| | | | 331,631 |
| REITs - Warehouse/Industrial - 9.2% | | | |
| DCT Industrial Trust, Inc. | | 1,125,673 | 75,274 |
| Prologis, Inc. | | 4,376,600 | 287,192 |
| | | | 362,466 |
|
| TOTAL EQUITY REAL ESTATE INVESTMENT TRUSTS (REITS) | | | 3,852,628 |
|
| Real Estate Management & Development - 1.0% | | | |
| Real Estate Development - 0.5% | | | |
| Instone Real Estate Group BV (a) | | 794,600 | 20,442 |
| REITs - Diversified - 0.5% | | | |
| VICI Properties, Inc. | | 907,200 | 18,462 |
|
| TOTAL REAL ESTATE MANAGEMENT & DEVELOPMENT | | | 38,904 |
|
| TOTAL COMMON STOCKS | | | |
| (Cost $2,727,828) | | | 3,891,532 |
|
| Money Market Funds - 1.3% | | | |
| Fidelity Cash Central Fund, 1.96% (b) | | | |
| (Cost $51,860) | | 51,851,128 | 51,861 |
| TOTAL INVESTMENT IN SECURITIES - 100.1% | | | |
| (Cost $2,779,688) | | | 3,943,393 |
| NET OTHER ASSETS (LIABILITIES) - (0.1)% | | | (4,642) |
| NET ASSETS - 100% | | | $3,938,751 |
Legend
(a) Security exempt from registration under Rule 144A of the Securities Act of 1933. These securities may be resold in transactions exempt from registration, normally to qualified institutional buyers. At the end of the period, the value of these securities amounted to $20,442,000 or 0.5% of net assets.
(b) Affiliated fund that is generally available only to investment companies and other accounts managed by Fidelity Investments. The rate quoted is the annualized seven-day yield of the fund at period end. A complete unaudited listing of the fund's holdings as of its most recent quarter end is available upon request. In addition, each Fidelity Central Fund's financial statements, which are not covered by the Fund's Report of Independent Registered Public Accounting Firm, are available on the SEC's website or upon request.
Affiliated Central Funds
Information regarding fiscal year to date income earned by the Fund from investments in Fidelity Central Funds is as follows:
| Fund | Income earned |
| | (Amounts in thousands) |
| Fidelity Cash Central Fund | $942 |
| Fidelity Securities Lending Cash Central Fund | 5 |
| Total | $947 |
Amounts in the income column in the above table include any capital gain distributions from underlying funds, which are presented in the corresponding line-item in the Statement of Operations if applicable.
Investment Valuation
All investments are categorized as Level 1 under the Fair Value Hierarchy. The inputs or methodology used for valuing securities may not be an indication of the risk associated with investing in those securities. For more information on valuation inputs please refer to the Investment Valuation section in the accompanying Notes to Financial Statements.
See accompanying notes which are an integral part of the financial statements.
Financial Statements
Statement of Assets and Liabilities
| Amounts in thousands (except per-share amount) | | July 31, 2018 |
| Assets | | |
Investment in securities, at value — See accompanying schedule:
Unaffiliated issuers (cost $2,727,828) | $3,891,532 | |
| Fidelity Central Funds (cost $51,860) | 51,861 | |
| Total Investment in Securities (cost $2,779,688) | | $3,943,393 |
| Receivable for investments sold | | 1,932 |
| Receivable for fund shares sold | | 2,620 |
| Distributions receivable from Fidelity Central Funds | | 144 |
| Prepaid expenses | | 37 |
| Other receivables | | 372 |
| Total assets | | 3,948,498 |
| Liabilities | | |
| Payable for investments purchased | $4,100 | |
| Payable for fund shares redeemed | 2,872 | |
| Accrued management fee | 1,762 | |
| Transfer agent fee payable | 558 | |
| Other affiliated payables | 86 | |
| Other payables and accrued expenses | 369 | |
| Total liabilities | | 9,747 |
| Net Assets | | $3,938,751 |
| Net Assets consist of: | | |
| Paid in capital | | $2,724,213 |
| Undistributed net investment income | | 15,806 |
| Accumulated undistributed net realized gain (loss) on investments and foreign currency transactions | | 35,027 |
| Net unrealized appreciation (depreciation) on investments | | 1,163,705 |
| Net Assets, for 92,719 shares outstanding | | $3,938,751 |
| Net Asset Value, offering price and redemption price per share ($3,938,751 ÷ 92,719 shares) | | $42.48 |
See accompanying notes which are an integral part of the financial statements.
Statement of Operations
| Amounts in thousands | | Year ended July 31, 2018 |
| Investment Income | | |
| Dividends | | $107,353 |
| Income from Fidelity Central Funds | | 947 |
| Total income | | 108,300 |
| Expenses | | |
| Management fee | $21,420 | |
| Transfer agent fees | 7,036 | |
| Accounting and security lending fees | 1,039 | |
| Custodian fees and expenses | 37 | |
| Independent trustees' fees and expenses | 60 | |
| Registration fees | 52 | |
| Audit | 52 | |
| Legal | 55 | |
| Miscellaneous | 155 | |
| Total expenses before reductions | 29,906 | |
| Expense reductions | (233) | |
| Total expenses after reductions | | 29,673 |
| Net investment income (loss) | | 78,627 |
| Realized and Unrealized Gain (Loss) | | |
| Net realized gain (loss) on: | | |
| Investment securities: | | |
| Unaffiliated issuers | 86,645 | |
| Redemptions in-kind with affiliated entities | 36,897 | |
| Fidelity Central Funds | (1) | |
| Foreign currency transactions | 60 | |
| Total net realized gain (loss) | | 123,601 |
| Change in net unrealized appreciation (depreciation) on: | | |
| Investment securities: | | |
| Unaffiliated issuers | (107,444) | |
| Fidelity Central Funds | (1) | |
| Total change in net unrealized appreciation (depreciation) | | (107,445) |
| Net gain (loss) | | 16,156 |
| Net increase (decrease) in net assets resulting from operations | | $94,783 |
See accompanying notes which are an integral part of the financial statements.
Statement of Changes in Net Assets
| Amounts in thousands | Year ended July 31, 2018 | Year ended July 31, 2017 |
| Increase (Decrease) in Net Assets | | |
| Operations | | |
| Net investment income (loss) | $78,627 | $80,058 |
| Net realized gain (loss) | 123,601 | 130,937 |
| Change in net unrealized appreciation (depreciation) | (107,445) | (532,587) |
| Net increase (decrease) in net assets resulting from operations | 94,783 | (321,592) |
| Distributions to shareholders from net investment income | (79,829) | (80,022) |
| Distributions to shareholders from net realized gain | (91,546) | (155,078) |
| Total distributions | (171,375) | (235,100) |
| Share transactions | | |
| Proceeds from sales of shares | 597,248 | 762,883 |
| Reinvestment of distributions | 161,468 | 215,725 |
| Cost of shares redeemed | (1,064,135) | (1,668,598) |
| Net increase (decrease) in net assets resulting from share transactions | (305,419) | (689,990) |
| Redemption fees | – | 369 |
| Total increase (decrease) in net assets | (382,011) | (1,246,313) |
| Net Assets | | |
| Beginning of period | 4,320,762 | 5,567,075 |
| End of period | $3,938,751 | $4,320,762 |
| Other Information | | |
| Undistributed net investment income end of period | $15,806 | $14,859 |
| Shares | | |
| Sold | 14,437 | 17,824 |
| Issued in reinvestment of distributions | 3,841 | 5,113 |
| Redeemed | (26,234) | (39,833) |
| Net increase (decrease) | (7,956) | (16,896) |
See accompanying notes which are an integral part of the financial statements.
Financial Highlights
Fidelity Real Estate Investment Portfolio
| | | | | | |
| Years ended July 31, | 2018 | 2017 | 2016 | 2015 | 2014 |
| Selected Per–Share Data | | | | | |
| Net asset value, beginning of period | $42.92 | $47.35 | $40.80 | $37.56 | $34.03 |
| Income from Investment Operations | | | | | |
| Net investment income (loss)A | .81 | .72 | .75 | .67 | .61 |
| Net realized and unrealized gain (loss) | .49 | (3.12) | 8.36 | 3.19 | 3.58 |
| Total from investment operations | 1.30 | (2.40) | 9.11 | 3.86 | 4.19 |
| Distributions from net investment income | (.82) | (.71) | (.73) | (.63) | (.64) |
| Distributions from net realized gain | (.92) | (1.32) | (1.83) | – | (.02) |
| Total distributions | (1.74) | (2.03) | (2.56) | (.63) | (.66) |
| Redemption fees added to paid in capitalA | – | –B | –B | .01 | –B |
| Net asset value, end of period | $42.48 | $42.92 | $47.35 | $40.80 | $37.56 |
| Total ReturnC | 3.13% | (4.94)% | 24.00% | 10.34% | 12.61% |
| Ratios to Average Net AssetsD,E | | | | | |
| Expenses before reductions | .76% | .76% | .78% | .78% | .80% |
| Expenses net of fee waivers, if any | .75% | .76% | .77% | .78% | .80% |
| Expenses net of all reductions | .75% | .76% | .77% | .78% | .80% |
| Net investment income (loss) | 1.99% | 1.69% | 1.81% | 1.66% | 1.78% |
| Supplemental Data | | | | | |
| Net assets, end of period (in millions) | $3,939 | $4,321 | $5,567 | $4,382 | $4,036 |
| Portfolio turnover rateF | 20%G | 15% | 24% | 34% | 24% |
A Calculated based on average shares outstanding during the period.
B Amount represents less than $.005 per share.
C Total returns would have been lower if certain expenses had not been reduced during the applicable periods shown.
D Fees and expenses of any underlying Fidelity Central Funds are not included in the Fund's expense ratio. The Fund indirectly bears its proportionate share of the expenses of any underlying Fidelity Central Funds.
E Expense ratios reflect operating expenses of the Fund. Expenses before reductions do not reflect amounts reimbursed by the investment adviser or reductions from brokerage service arrangements or reductions from other expense offset arrangements and do not represent the amount paid by the Fund during periods when reimbursements or reductions occur. Expenses net of fee waivers reflect expenses after reimbursement by the investment adviser but prior to reductions from brokerage service arrangements or other expense offset arrangements. Expenses net of all reductions represent the net expenses paid by the Fund.
F Amount does not include the portfolio activity of any underlying Fidelity Central Funds.
G Portfolio Turnover rate excludes securities received or delivered in-kind.
See accompanying notes which are an integral part of the financial statements.
Notes to Financial Statements
For the period ended July 31, 2018
(Amounts in thousands except percentages)
1. Organization.
Fidelity Real Estate Investment Portfolio (the Fund) is a non-diversified fund of Fidelity Select Portfolios (the Trust) and is authorized to issue an unlimited number of shares. Share transactions on the Statement of Changes in Net Assets may contain exchanges between affiliated funds. The Trust is registered under the Investment Company Act of 1940, as amended (the 1940 Act), as an open-end management investment company organized as a Massachusetts business trust.
2. Investments in Fidelity Central Funds.
The Fund invests in Fidelity Central Funds, which are open-end investment companies generally available only to other investment companies and accounts managed by the investment adviser and its affiliates. The Fund's Schedule of Investments lists each of the Fidelity Central Funds held as of period end, if any, as an investment of the Fund, but does not include the underlying holdings of each Fidelity Central Fund. As an Investing Fund, the Fund indirectly bears its proportionate share of the expenses of the underlying Fidelity Central Funds.
The Money Market Central Funds seek preservation of capital and current income and are managed by Fidelity Investments Money Management, Inc. (FIMM), an affiliate of the investment adviser. Annualized expenses of the Money Market Central Funds as of their most recent shareholder report date are less than .005%.
A complete unaudited list of holdings for each Fidelity Central Fund is available upon request or at the Securities and Exchange Commission (the SEC) website at www.sec.gov. In addition, the financial statements of the Fidelity Central Funds, which are not covered by the Fund's Report of Independent Registered Public Accounting Firm, are available on the SEC website or upon request.
3. Significant Accounting Policies.
The Fund is an investment company and applies the accounting and reporting guidance of the Financial Accounting Standards Board (FASB) Accounting Standards Codification Topic 946 Financial Services – Investments Companies. The financial statements have been prepared in conformity with accounting principles generally accepted in the United States of America (GAAP), which require management to make certain estimates and assumptions at the date of the financial statements. Actual results could differ from those estimates. Subsequent events, if any, through the date that the financial statements were issued have been evaluated in the preparation of the financial statements. The following summarizes the significant accounting policies of the Fund:
Investment Valuation. Investments are valued as of 4:00 p.m. Eastern time on the last calendar day of the period. The Board of Trustees (the Board) has delegated the day to day responsibility for the valuation of the Fund's investments to the Fair Value Committee (the Committee) established by the Fund's investment adviser. In accordance with valuation policies and procedures approved by the Board, the Fund attempts to obtain prices from one or more third party pricing vendors or brokers to value its investments. When current market prices, quotations or currency exchange rates are not readily available or reliable, investments will be fair valued in good faith by the Committee, in accordance with procedures adopted by the Board. Factors used in determining fair value vary by investment type and may include market or investment specific events. The frequency with which these procedures are used cannot be predicted and they may be utilized to a significant extent. The Committee oversees the Fund's valuation policies and procedures and reports to the Board on the Committee's activities and fair value determinations. The Board monitors the appropriateness of the procedures used in valuing the Fund's investments and ratifies the fair value determinations of the Committee.
The Fund categorizes the inputs to valuation techniques used to value its investments into a disclosure hierarchy consisting of three levels as shown below:
- Level 1 – quoted prices in active markets for identical investments
- Level 2 – other significant observable inputs (including quoted prices for similar investments, interest rates, prepayment speeds, etc.)
- Level 3 – unobservable inputs (including the Fund's own assumptions based on the best information available)
Valuation techniques used to value the Fund's investments by major category are as follows:
Equity securities, including restricted securities, for which market quotations are readily available, are valued at the last reported sale price or official closing price as reported by a third party pricing vendor on the primary market or exchange on which they are traded and are categorized as Level 1 in the hierarchy. In the event there were no sales during the day or closing prices are not available, securities are valued at the last quoted bid price or may be valued using the last available price and are generally categorized as Level 2 in the hierarchy. For foreign equity securities, when market or security specific events arise, comparisons to the valuation of American Depositary Receipts (ADRs), futures contracts, Exchange-Traded Funds (ETFs) and certain indexes as well as quoted prices for similar securities may be used and would be categorized as Level 2 in the hierarchy. Utilizing these techniques may result in transfers between Level 1 and Level 2. For equity securities, including restricted securities, where observable inputs are limited, assumptions about market activity and risk are used and these securities may be categorized as Level 3 in the hierarchy.
Investments in open-end mutual funds, including the Fidelity Central Funds, are valued at their closing net asset value (NAV) each business day and are categorized as Level 1 in the hierarchy.
Changes in valuation techniques may result in transfers in or out of an assigned level within the disclosure hierarchy.
Foreign Currency. The Fund may use foreign currency contracts to facilitate transactions in foreign-denominated securities. Gains and losses from these transactions may arise from changes in the value of the foreign currency or if the counterparties do not perform under the contracts' terms.
Foreign-denominated assets, including investment securities, and liabilities are translated into U.S. dollars at the exchange rates at period end. Purchases and sales of investment securities, income and dividends received and expenses denominated in foreign currencies are translated into U.S. dollars at the exchange rate in effect on the transaction date.
The effects of exchange rate fluctuations on investments are included with the net realized and unrealized gain (loss) on investment securities. Other foreign currency transactions resulting in realized and unrealized gain (loss) are disclosed separately.
Investment Transactions and Income. For financial reporting purposes, the Fund's investment holdings and NAV include trades executed through the end of the last business day of the period. The NAV per share for processing shareholder transactions is calculated as of the close of business of the New York Stock Exchange (NYSE), normally 4:00 p.m. Eastern time and includes trades executed through the end of the prior business day. Gains and losses on securities sold are determined on the basis of identified cost. Dividend income is recorded on the ex-dividend date, except for certain dividends from foreign securities where the ex-dividend date may have passed, which are recorded as soon as the Fund is informed of the ex-dividend date. Non-cash dividends included in dividend income, if any, are recorded at the fair market value of the securities received. Income and capital gain distributions from Fidelity Central Funds, if any, are recorded on the ex-dividend date. Certain distributions received by the Fund represent a return of capital or capital gain. The Fund determines the components of these distributions subsequent to the ex-dividend date, based upon receipt of tax filings or other correspondence relating to the underlying investment. These distributions are recorded as a reduction of cost of investments and/or as a realized gain.
Expenses. Expenses directly attributable to a fund are charged to that fund. Expenses attributable to more than one fund are allocated among the respective funds on the basis of relative net assets or other appropriate methods. Expense estimates are accrued in the period to which they relate and adjustments are made when actual amounts are known.
Deferred Trustee Compensation. Under a Deferred Compensation Plan (the Plan), certain independent Trustees have elected to defer receipt of a portion of their annual compensation. Deferred amounts are invested in a cross-section of Fidelity funds, are marked-to-market and remain in the Fund until distributed in accordance with the Plan. The investment of deferred amounts and the offsetting payable to the Trustees of $311 are included in the accompanying Statement of Assets and Liabilities in other receivables and other payables and accrued expenses, respectively.
Income Tax Information and Distributions to Shareholders. Each year, the Fund intends to qualify as a regulated investment company under Subchapter M of the Internal Revenue Code, including distributing substantially all of its taxable income and realized gains. As a result, no provision for U.S. Federal income taxes is required. As of July 31, 2018, the Fund did not have any unrecognized tax benefits in the financial statements; nor is the Fund aware of any tax positions for which it is reasonably possible that the total amounts of unrecognized tax benefits will significantly change in the next twelve months. The Fund files a U.S. federal tax return, in addition to state and local tax returns as required. The Fund's federal income tax returns are subject to examination by the Internal Revenue Service (IRS) for a period of three fiscal years after they are filed. State and local tax returns may be subject to examination for an additional fiscal year depending on the jurisdiction. Foreign taxes are provided for based on the Fund's understanding of the tax rules and rates that exist in the foreign markets in which it invests.
Distributions are declared and recorded on the ex-dividend date. Income and capital gain distributions are determined in accordance with income tax regulations, which may differ from GAAP. In addition, the Fund claimed a portion of the payment made to redeeming shareholders as a distribution for income tax purposes.
Capital accounts within the financial statements are adjusted for permanent book-tax differences. These adjustments have no impact on net assets or the results of operations. Capital accounts are not adjusted for temporary book-tax differences which will reverse in a subsequent period.
Book-tax differences are primarily due foreign currency transactions, redemptions in kind, non-taxable dividends, deferred trustees compensation, and losses deferred due to wash sales.
As of period end, the cost and unrealized appreciation (depreciation) in securities, and derivatives if applicable, for federal income tax purposes were as follows:
| Gross unrealized appreciation | $1,191,135 |
| Gross unrealized depreciation | (49,249) |
| Net unrealized appreciation (depreciation) | $1,141,886 |
| Tax Cost | $2,801,507 |
The tax-based components of distributable earnings as of period end were as follows:
| Undistributed ordinary income | $16,118 |
| Undistributed long-term capital gain | $56,846 |
| Net unrealized appreciation (depreciation) on securities and other investments | $1,141,886 |
The tax character of distributions paid was as follows:
| | July 31, 2018 | July 31, 2017 |
| Ordinary Income | $79,829 | $ 80,022 |
| Long-term Capital Gains | 91,546 | 155,078 |
| Total | $171,375 | $ 235,100 |
Restricted Securities. The Fund may invest in securities that are subject to legal or contractual restrictions on resale. These securities generally may be resold in transactions exempt from registration or to the public if the securities are registered. Disposal of these securities may involve time-consuming negotiations and expense, and prompt sale at an acceptable price may be difficult. Information regarding restricted securities is included at the end of the Fund's Schedule of Investments.
4. Purchases and Sales of Investments.
Purchases and sales of securities, other than short-term securities and in-kind transactions, aggregated $769,350 and $959,394, respectively.
5. Fees and Other Transactions with Affiliates.
Management Fee. Fidelity Management & Research Company (the investment adviser) and its affiliates provide the Fund with investment management related services for which the Fund pays a monthly management fee. The management fee is the sum of an individual fund fee rate that is based on an annual rate of .30% of the Fund's average net assets and an annualized group fee rate that averaged .24% during the period. The group fee rate is based upon the average net assets of all the mutual funds advised by Fidelity Management & Research Company (FMR) and the investment adviser. The group fee rate decreases as assets under management increase and increases as assets under management decrease. For the reporting period, the total annual management fee rate was .54% of the Fund's average net assets.
Transfer Agent Fees. Fidelity Investments Institutional Operations Company, Inc. (FIIOC), an affiliate of the investment adviser, is the Fund's transfer, dividend disbursing and shareholder servicing agent. FIIOC receives account fees and asset-based fees that vary according to account size and type of account. FIIOC pays for typesetting, printing and mailing of shareholder reports, except proxy statements. For the period, the transfer agent fees were equivalent to an annual rate of .18% of average net assets.
Accounting and Security Lending Fees. Fidelity Service Company, Inc. (FSC), an affiliate of the investment adviser, maintains the Fund's accounting records. The accounting fee is based on the level of average net assets for each month. Under a separate contract, FSC administers the security lending program. The security lending fee is based on the number and duration of lending transactions. For the period, the fees were equivalent to an annual rate of .03%.
Brokerage Commissions. The Fund placed a portion of its portfolio transactions with brokerage firms which are affiliates of the investment adviser. Brokerage commissions are included in net realized gain (loss) and change in net unrealized appreciation (depreciation) in the Statement of Operations. The commissions paid to these affiliated firms were $14 for the period.
Interfund Trades. The Fund may purchase from or sell securities to other Fidelity Funds under procedures adopted by the Board. The procedures have been designed to ensure these interfund trades are executed in accordance with Rule 17a-7 of the 1940 Act. Interfund trades are included within the respective purchases and sales amounts shown in the Purchases and Sales of Investments note.
Redemptions In-Kind. During the period, 2,672 shares of the Fund held by an affiliated entity were redeemed in-kind for investments and cash, with a value of $102,755. The net realized gain of $36,897 on investments delivered through in-kind redemptions is included in the accompanying Statement of Operations. The amount of the in-kind redemptions is included in share transactions in the accompanying Statement of Changes in Net Assets as well as the Notes to Financial Statements. The Fund recognized no gain or loss for federal income tax purposes.
6. Committed Line of Credit.
The Fund participates with other funds managed by the investment adviser or an affiliate in a $4.25 billion credit facility (the "line of credit") to be utilized for temporary or emergency purposes to fund shareholder redemptions or for other short-term liquidity purposes. The Fund has agreed to pay commitment fees on its pro-rata portion of the line of credit, which amounted to $11 and is reflected in Miscellaneous expenses on the Statement of Operations. During the period, the Fund did not borrow on this line of credit.
7. Security Lending.
The Fund lends portfolio securities through a lending agent from time to time in order to earn additional income. On the settlement date of the loan, the Fund receives collateral (in the form of U.S. Treasury obligations, letters of credit and/or cash) against the loaned securities and maintains collateral in an amount not less than 100% of the market value of the loaned securities during the period of the loan. The market value of the loaned securities is determined at the close of business of the Fund and any additional required collateral is delivered to the Fund on the next business day. The Fund or borrower may terminate the loan at any time, and if the borrower defaults on its obligation to return the securities loaned because of insolvency or other reasons, the Fund may apply collateral received from the borrower against the obligation. The Fund may experience delays and costs in recovering the securities loaned. Any cash collateral received is invested in the Fidelity Securities Lending Cash Central Fund. At period end, there were no security loans outstanding. Security lending income represents the income earned on investing cash collateral, less rebates paid to borrowers and any lending agent fees associated with the loan, plus any premium payments received for lending certain types of securities. Security lending income is presented in the Statement of Operations as a component of income from Fidelity Central Funds. Total security lending income during the period amounted to $5.
8. Expense Reductions.
Commissions paid to certain brokers with whom the investment adviser, or its affiliates, places trades on behalf of the Fund include an amount in addition to trade execution, which may be rebated back to the Fund to offset certain expenses. This amount totaled $194 for the period. Through arrangements with the Fund's custodian, credits realized as a result of certain uninvested cash balances were used to reduce the Fund's expenses. During the period, these credits reduced the Fund's expenses by $1.
In addition, during the period the investment adviser reimbursed and/or waived a portion of operating expenses in the amount of $38.
9. Other.
The Fund's organizational documents provide former and current trustees and officers with a limited indemnification against liabilities arising in connection with the performance of their duties to the Fund. In the normal course of business, the Fund may also enter into contracts that provide general indemnifications. The Fund's maximum exposure under these arrangements is unknown as this would be dependent on future claims that may be made against the Fund. The risk of material loss from such claims is considered remote.
Report of Independent Registered Public Accounting Firm
To the Trustees of Fidelity Select Portfolios and Shareholders of Fidelity Real Estate Investment Portfolio:
Opinion on the Financial Statements and Financial Highlights
We have audited the accompanying statement of assets and liabilities of Fidelity Real Estate Investment Portfolio (the "Fund"), a fund of Fidelity Select Portfolios, including the schedule of investments, as of July 31, 2018, and the related statement of operations for the year then ended, the statement of changes in net assets for each of the two years in the period then ended, the financial highlights for each of the five years in the period then ended, and the related notes. In our opinion, the financial statements and financial highlights present fairly, in all material respects, the financial position of the Fund as of July 31, 2018, and the results of its operations for the year then ended, the changes in its net assets for each of the two years in the period then ended, and the financial highlights for each of the five years in the period then ended, in conformity with accounting principles generally accepted in the United States of America.
Basis for Opinion
These financial statements and financial highlights are the responsibility of the Fund's management. Our responsibility is to express an opinion on the Fund's financial statements and financial highlights based on our audits. We are a public accounting firm registered with the Public Company Accounting Oversight Board (United States) (PCAOB) and are required to be independent with respect to the Fund in accordance with the U.S. federal securities laws and the applicable rules and regulations of the Securities and Exchange Commission and the PCAOB.
We conducted our audits in accordance with the standards of the PCAOB. Those standards require that we plan and perform the audit to obtain reasonable assurance about whether the financial statements and financial highlights are free of material misstatement, whether due to error or fraud. The Fund is not required to have, nor were we engaged to perform, an audit of its internal control over financial reporting. As part of our audits we are required to obtain an understanding of internal control over financial reporting but not for the purpose of expressing an opinion on the effectiveness of the Fund’s internal control over financial reporting. Accordingly, we express no such opinion.
Our audits included performing procedures to assess the risks of material misstatement of the financial statements and financial highlights, whether due to error or fraud, and performing procedures that respond to those risks. Such procedures included examining, on a test basis, evidence regarding the amounts and disclosures in the financial statements and financial highlights. Our audits also included evaluating the accounting principles used and significant estimates made by management, as well as evaluating the overall presentation of the financial statements and financial highlights. Our procedures included confirmation of securities owned as of July 31, 2018, by correspondence with the custodians and brokers; when replies were not received from brokers, we performed other auditing procedures. We believe that our audits provide a reasonable basis for our opinion.
/s/ Deloitte & Touche LLP
Boston, Massachusetts
September 12, 2018
We have served as the auditor of one or more of the Fidelity investment companies since 1999.
Trustees and Officers
The Trustees, Members of the Advisory Board (if any), and officers of the trust and fund, as applicable, are listed below. The Board of Trustees governs the fund and is responsible for protecting the interests of shareholders. The Trustees are experienced executives who meet periodically throughout the year to oversee the fund's activities, review contractual arrangements with companies that provide services to the fund, oversee management of the risks associated with such activities and contractual arrangements, and review the fund's performance. Except for Michael Wiley, each of the Trustees oversees 286 funds. Mr. Wiley oversees 197 funds.
The Trustees hold office without limit in time except that (a) any Trustee may resign; (b) any Trustee may be removed by written instrument, signed by at least two-thirds of the number of Trustees prior to such removal; (c) any Trustee who requests to be retired or who has become incapacitated by illness or injury may be retired by written instrument signed by a majority of the other Trustees; and (d) any Trustee may be removed at any special meeting of shareholders by a two-thirds vote of the outstanding voting securities of the trust. Each Trustee who is not an interested person (as defined in the 1940 Act) of the trust and the fund is referred to herein as an Independent Trustee. Each Independent Trustee shall retire not later than the last day of the calendar year in which his or her 75th birthday occurs. The Independent Trustees may waive this mandatory retirement age policy with respect to individual Trustees. Officers and Advisory Board Members hold office without limit in time, except that any officer or Advisory Board Member may resign or may be removed by a vote of a majority of the Trustees at any regular meeting or any special meeting of the Trustees. Except as indicated, each individual has held the office shown or other offices in the same company for the past five years.
The fund’s Statement of Additional Information (SAI) includes more information about the Trustees. To request a free copy, call Fidelity at 1-800-544-8544.
Experience, Skills, Attributes, and Qualifications of the Trustees. The Governance and Nominating Committee has adopted a statement of policy that describes the experience, qualifications, attributes, and skills that are necessary and desirable for potential Independent Trustee candidates (Statement of Policy). The Board believes that each Trustee satisfied at the time he or she was initially elected or appointed a Trustee, and continues to satisfy, the standards contemplated by the Statement of Policy. The Governance and Nominating Committee also engages professional search firms to help identify potential Independent Trustee candidates who have the experience, qualifications, attributes, and skills consistent with the Statement of Policy. From time to time, additional criteria based on the composition and skills of the current Independent Trustees, as well as experience or skills that may be appropriate in light of future changes to board composition, business conditions, and regulatory or other developments, have also been considered by the professional search firms and the Governance and Nominating Committee. In addition, the Board takes into account the Trustees' commitment and participation in Board and committee meetings, as well as their leadership of standing and ad hoc committees throughout their tenure.
In determining that a particular Trustee was and continues to be qualified to serve as a Trustee, the Board has considered a variety of criteria, none of which, in isolation, was controlling. The Board believes that, collectively, the Trustees have balanced and diverse experience, qualifications, attributes, and skills, which allow the Board to operate effectively in governing the fund and protecting the interests of shareholders. Information about the specific experience, skills, attributes, and qualifications of each Trustee, which in each case led to the Board's conclusion that the Trustee should serve (or continue to serve) as a trustee of the fund, is provided below.
Board Structure and Oversight Function. James C. Curvey is an interested person and currently serves as Chairman. The Trustees have determined that an interested Chairman is appropriate and benefits shareholders because an interested Chairman has a personal and professional stake in the quality and continuity of services provided to the fund. Independent Trustees exercise their informed business judgment to appoint an individual of their choosing to serve as Chairman, regardless of whether the Trustee happens to be independent or a member of management. The Independent Trustees have determined that they can act independently and effectively without having an Independent Trustee serve as Chairman and that a key structural component for assuring that they are in a position to do so is for the Independent Trustees to constitute a substantial majority for the Board. The Independent Trustees also regularly meet in executive session. Ned C. Lautenbach serves as Chairman of the Independent Trustees and as such (i) acts as a liaison between the Independent Trustees and management with respect to matters important to the Independent Trustees and (ii) with management prepares agendas for Board meetings.
Fidelity® funds are overseen by different Boards of Trustees. The fund's Board oversees Fidelity's high income and certain equity funds, and other Boards oversee Fidelity's investment-grade bond, money market, asset allocation, and other equity funds. The asset allocation funds may invest in Fidelity® funds overseen by the fund's Board. The use of separate Boards, each with its own committee structure, allows the Trustees of each group of Fidelity® funds to focus on the unique issues of the funds they oversee, including common research, investment, and operational issues. On occasion, the separate Boards establish joint committees to address issues of overlapping consequences for the Fidelity® funds overseen by each Board.
The Trustees operate using a system of committees to facilitate the timely and efficient consideration of all matters of importance to the Trustees, the fund, and fund shareholders and to facilitate compliance with legal and regulatory requirements and oversight of the fund's activities and associated risks. The Board, acting through its committees, has charged SelectCo and its affiliates with (i) identifying events or circumstances the occurrence of which could have demonstrably adverse effects on the fund's business and/or reputation; (ii) implementing processes and controls to lessen the possibility that such events or circumstances occur or to mitigate the effects of such events or circumstances if they do occur; and (iii) creating and maintaining a system designed to evaluate continuously business and market conditions in order to facilitate the identification and implementation processes described in (i) and (ii) above. Because the day-to-day operations and activities of the fund are carried out by or through SelectCo, its affiliates, and other service providers, the fund's exposure to risks is mitigated but not eliminated by the processes overseen by the Trustees. While each of the Board's committees has responsibility for overseeing different aspects of the fund's activities, oversight is exercised primarily through the Operations, Audit, and Compliance Committees. In addition, the Independent Trustees have worked with Fidelity to enhance the Board's oversight of investment and financial risks, legal and regulatory risks, technology risks, and operational risks, including the development of additional risk reporting to the Board. Appropriate personnel, including but not limited to the fund's Chief Compliance Officer (CCO), SelectCo's internal auditor, the independent accountants, the fund's Treasurer and portfolio management personnel, make periodic reports to the Board's committees, as appropriate, including an annual review of Fidelity's risk management program for the Fidelity® funds. The responsibilities of each standing committee, including their oversight responsibilities, are described further under "Standing Committees of the Trustees."
Interested Trustees*:
Correspondence intended for a Trustee who is an interested person may be sent to Fidelity Investments, 245 Summer Street, Boston, Massachusetts 02210.
Name, Year of Birth; Principal Occupations and Other Relevant Experience+
James C. Curvey (1935)
Year of Election or Appointment: 2018
Trustee
Chairman of the Board of Trustees
Mr. Curvey also serves as Trustee of other Fidelity® funds. Mr. Curvey is Vice Chairman (2007-present) and Director of FMR LLC (diversified financial services company). In addition, Mr. Curvey is an Overseer Emeritus for the Boston Symphony Orchestra, a Director of Artis-Naples, and a Trustee of Brewster Academy in Wolfeboro, New Hampshire. Previously, Mr. Curvey served as a Director of Fidelity Research & Analysis Co. (investment adviser firm, 2009-2018), Director of Fidelity Investments Money Management, Inc. (investment adviser firm, 2009-2014) and a Director of FMR and FMR Co., Inc. (investment adviser firms, 2007-2014).
Charles S. Morrison (1960)
Year of Election or Appointment: 2018
Trustee
Mr. Morrison also serves as Trustee of other funds. He serves as President of Fidelity SelectCo, LLC (investment adviser firm, 2017-present) and Fidelity Management & Research Company (FMR) (investment adviser firm, 2016-present), a Director of Fidelity Investments Money Management, Inc. (FIMM) (investment adviser firm, 2014-present), Director of Fidelity SelectCo, LLC (investment adviser firm, 2014-present), President, Asset Management (2014-present), and is an employee of Fidelity Investments. Previously, Mr. Morrison served as Vice President of Fidelity's Fixed Income and Asset Allocation Funds (2012-2014), President, Fixed Income (2011-2014), Vice President of Fidelity's Money Market Funds (2005-2009), President, Money Market Group Leader of FMR (investment adviser firm, 2009), and Senior Vice President, Money Market Group of FMR (2004-2009). Mr. Morrison also served as Vice President of Fidelity's Bond Funds (2002-2005), certain Balanced Funds (2002-2005), and certain Asset Allocation Funds (2002-2007), and as Senior Vice President (2002-2005) of Fidelity's Bond Division.
* Determined to be an "Interested Trustee" by virtue of, among other things, his or her affiliation with the trust or various entities under common control with SelectCo.
+ The information includes the Trustee's principal occupation during the last five years and other information relating to the experience, attributes, and skills relevant to the Trustee's qualifications to serve as a Trustee, which led to the conclusion that the Trustee should serve as a Trustee for the fund.
Independent Trustees:
Correspondence intended for an Independent Trustee may be sent to Fidelity Investments, P.O. Box 55235, Boston, Massachusetts 02205-5235.
Name, Year of Birth; Principal Occupations and Other Relevant Experience+
Dennis J. Dirks (1948)
Year of Election or Appointment: 2018
Trustee
Mr. Dirks also serves as Trustee of other Fidelity® funds. Prior to his retirement in May 2003, Mr. Dirks was Chief Operating Officer and a member of the Board of The Depository Trust & Clearing Corporation (DTCC). He also served as President, Chief Operating Officer, and Board member of The Depository Trust Company (DTC) and President and Board member of the National Securities Clearing Corporation (NSCC). In addition, Mr. Dirks served as Chief Executive Officer and Board member of the Government Securities Clearing Corporation, Chief Executive Officer and Board member of the Mortgage-Backed Securities Clearing Corporation, as a Trustee and a member of the Finance Committee of Manhattan College (2005-2008), as a Trustee and a member of the Finance Committee of AHRC of Nassau County (2006-2008), as a member of the Independent Directors Council (IDC) Governing Council (2010-2015), and as a member of the Board of Directors for The Brookville Center for Children’s Services, Inc. (2009-2017). Mr. Dirks is a member of the Finance Committee (2016-present), Board of Directors (2017-present) and Board of Trustees (2018-present) and is Treasurer (2018-present) of the Asolo Repertory Theatre.
Donald F. Donahue (1950)
Year of Election or Appointment: 2018
Trustee
Mr. Donahue also serves as a Trustee of other Fidelity® funds. Mr. Donahue is President and Chief Executive Officer of Miranda Partners, LLC (risk consulting for the financial services industry, 2012-present). Previously, Mr. Donahue served as a Member of the Advisory Board of certain Fidelity® funds (2015-2018) and Chief Executive Officer (2006-2012), Chief Operating Officer (2003-2006), and Managing Director, Customer Marketing and Development (1999-2003) of The Depository Trust & Clearing Corporation (financial markets infrastructure). Mr. Donahue serves as a Member (2007-present) and Co-Chairman (2016-present) of the Board of Directors of United Way of New York, Member of the Board of Directors of NYC Leadership Academy (2012-present) and Member of the Board of Advisors of Ripple Labs, Inc. (financial services, 2015-present). He also served as Chairman (2010-2012) and Member of the Board of Directors (2012-2013) of Omgeo, LLC (financial services), Treasurer of United Way of New York (2012-2016), and Member of the Board of Directors of XBRL US (financial services non-profit, 2009-2012) and the International Securities Services Association (2009-2012).
Alan J. Lacy (1953)
Year of Election or Appointment: 2018
Trustee
Mr. Lacy also serves as Trustee of other Fidelity® funds. Mr. Lacy serves as a Director of Bristol-Myers Squibb Company (global pharmaceuticals, 2008-present). He is a Trustee of the California Chapter of The Nature Conservancy (2015-present) and a Director of the Center for Advanced Study in the Behavioral Sciences at Stanford University (2015-present). In addition, Mr. Lacy served as Senior Adviser (2007-2014) of Oak Hill Capital Partners, L.P. (private equity) and also served as Chief Executive Officer (2005) and Vice Chairman (2005-2006) of Sears Holdings Corporation (retail) and Chief Executive Officer and Chairman of the Board of Sears, Roebuck and Co. (retail, 2000-2005). Previously, Mr. Lacy served as Chairman (2014-2017) and a member (2010-2017) of the Board of Directors of Dave & Buster’s Entertainment, Inc. (restaurant and entertainment complexes), as Chairman (2008-2011) and a member (2006-2015) of the Board of Trustees of the National Parks Conservation Association, and as a member of the Board of Directors for The Hillman Companies, Inc. (hardware wholesalers, 2010-2014), Earth Fare, Inc. (retail grocery, 2010-2014), and The Western Union Company (global money transfer, 2006-2011).
Ned C. Lautenbach (1944)
Year of Election or Appointment: 2018
Trustee
Chairman of the Independent Trustees
Mr. Lautenbach also serves as Trustee of other Fidelity® funds. Mr. Lautenbach currently serves as Vice Chair of the Board of Governors, State University System of Florida (2013-present) and is a member of the Council on Foreign Relations (1994-present). He is also a member and has most recently served as Chairman of the Board of Directors of Artis-Naples (2012-present). Previously, Mr. Lautenbach served as a member and then Lead Director of the Board of Directors of Eaton Corporation (diversified industrial, 1997-2016). He was also a Partner and Advisory Partner at Clayton, Dubilier & Rice, LLC (private equity investment, 1998-2010), as well as a Director of Sony Corporation (2006-2007). In addition, Mr. Lautenbach also had a 30-year career with IBM (technology company) during which time he served as Senior Vice President and a member of the Corporate Executive Committee (1968-1998).
Joseph Mauriello (1944)
Year of Election or Appointment: 2018
Trustee
Mr. Mauriello also serves as Trustee of other Fidelity® funds. Prior to his retirement in January 2006, Mr. Mauriello served in numerous senior management positions including Deputy Chairman and Chief Operating Officer (2004-2005), and Vice Chairman of Financial Services (2002-2004) of KPMG LLP US (professional services, 1965-2005). Mr. Mauriello currently serves as a member of the Board of Directors of XL Group plc. (global insurance and re-insurance, 2006-present) and the Independent Directors Council (IDC) Governing Council (2015-present). Previously, Mr. Mauriello served as a Director of the Hamilton Funds of the Bank of New York (2006-2007) and of Arcadia Resources Inc. (health care services and products, 2007-2012).
Cornelia M. Small (1944)
Year of Election or Appointment: 2018
Trustee
Ms. Small also serves as Trustee of other Fidelity® funds. Ms. Small is a member of the Board of Directors (2009-present) and Chair of the Investment Committee (2010-present) of the Teagle Foundation. Ms. Small also serves on the Investment Committee of the Berkshire Taconic Community Foundation (2008-present). Previously, Ms. Small served as Chairperson (2002-2008) and a member of the Investment Committee and Chairperson (2008-2012) and a member of the Board of Trustees of Smith College. In addition, Ms. Small served as Chief Investment Officer, Director of Global Equity Investments, and a member of the Board of Directors of Scudder, Stevens & Clark and Scudder Kemper Investments.
Garnett A. Smith (1947)
Year of Election or Appointment: 2013
Trustee
Mr. Smith also serves as Trustee of other Fidelity® funds. Prior to Mr. Smith's retirement, he served as Chairman and Chief Executive Officer of Inbrand Corp. (manufacturer of personal absorbent products, 1990-1997). He also served as President (1986-1990) of Inbrand Corp. Prior to his employment with Inbrand Corp., he was employed by a retail fabric chain and North Carolina National Bank. In addition, Mr. Smith served as a Member of the Advisory Board of certain Fidelity® funds (2012-2013) and as a board member of the Jackson Hole Land Trust (2009-2012).
David M. Thomas (1949)
Year of Election or Appointment: 2018
Trustee
Mr. Thomas also serves as Trustee of other Fidelity® funds. Mr. Thomas serves as Non-Executive Chairman of the Board of Directors of Fortune Brands Home and Security (home and security products, 2011-present), as a member of the Board of Directors (2004-present) and Presiding Director (2013-present) of Interpublic Group of Companies, Inc. (marketing communication), and as a member of the Board of Trustees of the University of Florida (2013-present). Previously, Mr. Thomas served as Executive Chairman (2005-2006) and Chairman and Chief Executive Officer (2000-2005) of IMS Health, Inc. (pharmaceutical and healthcare information solutions), and a Director of Fortune Brands, Inc. (consumer products, 2000-2011).
Michael E. Wiley (1950)
Year of Election or Appointment: 2008
Trustee
Mr. Wiley also serves as Trustee or Member of the Advisory Board of other Fidelity® funds. Mr. Wiley serves as a Director of Andeavor Corporation (independent oil refiner and marketer, 2005-present), a Director of Andeavor Logistics LP (natural resources logistics, 2015-present), and a Director of Bill Barrett Corporation (exploration and production, 2005-present). In addition, Mr. Wiley also serves as a Director of Post Oak Bank (privately-held bank, 2004-present). Previously, Mr. Wiley served as a Trustee of other Fidelity® funds (2008-2013), as a Director of Asia Pacific Exploration Consolidated (international oil and gas exploration and production, 2008-2013), as a member of the Board of Trustees of the University of Tulsa (2000-2006; 2007-2010), as a Senior Energy Advisor of Katzenbach Partners, LLC (consulting, 2006-2007), as an Advisory Director of Riverstone Holdings (private investment), Chairman, President, and CEO of Baker Hughes, Inc. (oilfield services, 2000-2004), and as Director of Spinnaker Exploration Company (exploration and production, 2001-2005).
+ The information includes the Trustee's principal occupation during the last five years and other information relating to the experience, attributes, and skills relevant to the Trustee's qualifications to serve as a Trustee, which led to the conclusion that the Trustee should serve as a Trustee for the fund.
Advisory Board Members and Officers:
Correspondence intended for a Member of the Advisory Board (if any) may be sent to Fidelity Investments, P.O. Box 55235, Boston, Massachusetts 02205-5235. Correspondence intended for an officer or Peter S. Lynch may be sent to Fidelity Investments, 245 Summer Street, Boston, Massachusetts 02210. Officers appear below in alphabetical order.
Name, Year of Birth; Principal Occupation
Peter S. Lynch (1944)
Year of Election or Appointment: 2018
Member of the Advisory Board
Mr. Lynch also serves as Member of the Advisory Board of other Fidelity® funds. Mr. Lynch is Vice Chairman and a Director of FMR (investment adviser firm) and FMR Co., Inc. (investment adviser firm). In addition, Mr. Lynch serves as a Trustee of Boston College and as the Chairman of the Inner-City Scholarship Fund. Previously, Mr. Lynch served on the Special Olympics International Board of Directors (1997-2006).
William S. Stavropoulos (1939)
Year of Election or Appointment: 2018
Member of the Advisory Board
Mr. Stavropoulos also serves as Member of the Advisory Board of other Fidelity® funds. Mr. Stavropoulos serves as President and Founder of the Michigan Baseball Foundation, the Great Lakes Loons (2007-present). Mr. Stavropoulos is Chairman Emeritus of the Board of Directors of The Dow Chemical Company, where he previously served in numerous senior management positions, including President, CEO (1995-2000; 2002-2004), Chairman of the Executive Committee (2000-2006), and as a member of the Board of Directors (1990-2006). Currently, Mr. Stavropoulos is Chairman of the Board of Directors of Univar Inc. (global distributor of commodity and specialty chemicals), a Director of Teradata Corporation (data warehousing and technology solutions), and a member of the Advisory Board for Metalmark Capital LLC (private equity investment, 2005-present). Mr. Stavropoulos is an operating advisor to Clayton, Dubilier & Rice, LLC (private equity investment). In addition, Mr. Stavropoulos is a member of the University of Notre Dame Advisory Council for the College of Science, a Trustee of the Rollin L. Gerstacker Foundation, and a Director of Artis-Naples in Naples, Florida. Previously, Mr. Stavropoulos served as Trustee of certain Fidelity® funds (2001-2018) and as a Director of Chemical Financial Corporation (bank holding company, 1993-2012) and Tyco International, Ltd. (multinational manufacturing and services, 2007-2012).
Carol B. Tomé (1957)
Year of Election or Appointment: 2017
Member of the Advisory Board
Ms. Tomé also serves as Member of the Advisory Board of other Fidelity® funds. Ms. Tomé is Chief Financial Officer (2001-present) and Executive Vice President of Corporate Services (2007-present) of The Home Depot, Inc. (home improvement retailer) and a Director (2003-present) and Chair of the Audit Committee (2004-present) of United Parcel Service, Inc. (package delivery and supply chain management). Previously, Ms. Tomé served as Trustee of certain Fidelity® funds (2017), Senior Vice President of Finance and Accounting/Treasurer (2000-2007) and Vice President and Treasurer (1995-2000) of The Home Depot, Inc. and Chair of the Board (2010-2012), Vice Chair of the Board (2009 and 2013), and a Director (2008-2013) of the Federal Reserve Bank of Atlanta. Ms. Tomé is also a director or trustee of many community and professional organizations.
Elizabeth Paige Baumann (1968)
Year of Election or Appointment: 2017
Anti-Money Laundering (AML) Officer
Ms. Baumann also serves as AML Officer of other funds. She is Chief AML Officer (2012-present) and Senior Vice President (2014-present) of FMR LLC (diversified financial services company) and is an employee of Fidelity Investments. Previously, Ms. Baumann served as AML Officer of the funds (2012-2016), and Vice President (2007-2014) and Deputy Anti-Money Laundering Officer (2007-2012) of FMR LLC.
Marc R. Bryant (1966)
Year of Election or Appointment: 2013
Secretary and Chief Legal Officer (CLO)
Mr. Bryant also serves as Secretary and CLO of other funds. Mr. Bryant serves as CLO, Secretary, and Senior Vice President of Fidelity Management & Research Company (investment adviser firm, 2015-present) and FMR Co., Inc. (investment adviser firm, 2015-present); Secretary of Fidelity SelectCo, LLC (investment adviser firm, 2015-present) and Fidelity Investments Money Management, Inc. (investment adviser firm, 2015-present); and CLO of Fidelity Management & Research (Hong Kong) Limited and FMR Investment Management (UK) Limited (investment adviser firms, 2015-present) and Fidelity Management & Research (Japan) Limited (investment adviser firm, 2016-present). He is Senior Vice President and Deputy General Counsel of FMR LLC (diversified financial services company). Previously, Mr. Bryant served as Secretary and CLO of Fidelity Rutland Square Trust II (2010-2014) and Assistant Secretary of Fidelity's Fixed Income and Asset Allocation Funds (2013-2015). Prior to joining Fidelity Investments, Mr. Bryant served as a Senior Vice President and the Head of Global Retail Legal for AllianceBernstein L.P. (2006-2010), and as the General Counsel for ProFund Advisors LLC (2001-2006).
John J. Burke III (1964)
Year of Election or Appointment: 2018
Chief Financial Officer
Mr. Burke also serves as Chief Financial Officer of other funds. Mr. Burke serves as Head of Investment Operations for Fidelity Fund and Investment Operations (2018-present) and is an employee of Fidelity Investments (1998-present). Previously Mr. Burke served as head of Asset Management Investment Operations (2012-2018).
William C. Coffey (1969)
Year of Election or Appointment: 2009
Assistant Secretary
Mr. Coffey also serves as Assistant Secretary of other funds. He is Senior Vice President and Deputy General Counsel of FMR LLC (diversified financial services company, 2010-present), and is an employee of Fidelity Investments. Previously, Mr. Coffey served as Vice President and Associate General Counsel of FMR LLC (2005-2009).
Timothy M. Cohen (1969)
Year of Election or Appointment: 2018
Vice President
Mr. Cohen also serves as Vice President of other funds. Mr. Cohen serves as Co-Head of Global Equity Research (2016-present), a Director of Fidelity Management & Research (Japan) Limited (investment adviser firm, 2016-present), and is an employee of Fidelity Investments. Previously, Mr. Cohen served as Chief Investment Officer - Equity and a Director of Fidelity Management & Research (U.K.) Inc. (investment adviser firm, 2013-2015) and as a Director of Fidelity Management & Research (Hong Kong) Limited (investment adviser firm, 2017).
Jonathan Davis (1968)
Year of Election or Appointment: 2010
Assistant Treasurer
Mr. Davis also serves as Assistant Treasurer of other funds. Mr. Davis serves as Assistant Treasurer of FMR Capital, Inc. (2017-present) and is an employee of Fidelity Investments. Previously, Mr. Davis served as Vice President and Associate General Counsel of FMR LLC (diversified financial services company, 2003-2010).
Adrien E. Deberghes (1967)
Year of Election or Appointment: 2018
Assistant Treasurer
Mr. Deberghes also serves as an officer of other funds. He serves as Assistant Treasurer of FMR Capital, Inc. (2017-present), Executive Vice President of Fidelity Investments Money Management, Inc. (FIMM) (investment adviser firm, 2016-present), and is an employee of Fidelity Investments (2008-present). Previously, Mr. Deberghes served as President and Treasurer of certain Fidelity® funds (2013-2018). Prior to joining Fidelity Investments, Mr. Deberghes was Senior Vice President of Mutual Fund Administration at State Street Corporation (2007-2008), Senior Director of Mutual Fund Administration at Investors Bank & Trust (2005-2007), and Director of Finance for Dunkin' Brands (2000-2005). Previously, Mr. Deberghes served in other fund officer roles.
Laura M. Del Prato (1964)
Year of Election or Appointment: 2018
Assistant Treasurer
Ms. Del Prato also serves as an officer of other funds. Ms. Del Prato is an employee of Fidelity Investments (2017-present). Prior to joining Fidelity Investments, Ms. Del Prato served as a Managing Director and Treasurer of the JPMorgan Mutual Funds (2014-2017). Prior to JPMorgan, Ms. Del Prato served as a partner at Cohen Fund Audit Services (accounting firm, 2012-2013) and KPMG LLP (accounting firm, 2004-2012).
Colm A. Hogan (1973)
Year of Election or Appointment: 2018
Deputy Treasurer
Mr. Hogan also serves as an officer of other funds. Mr. Hogan serves as Assistant Treasurer of FMR Capital, Inc. (2017-present) and is an employee of Fidelity Investments (2005-present). Previously, Mr. Hogan served as Assistant Treasurer of certain Fidelity® funds (2016-2018).
Pamela R. Holding (1964)
Year of Election or Appointment: 2018
Vice President
Ms. Holding also serves as a Vice President of other funds. Ms. Holding serves as Co-Head of Global Equity Research (2018-present) and is an employee of Fidelity Investments (2013-present).
Chris Maher (1972)
Year of Election or Appointment: 2013
Assistant Treasurer
Mr. Maher serves as Assistant Treasurer of other funds. Mr. Maher is Vice President of Valuation Oversight, serves as Assistant Treasurer of FMR Capital, Inc. (2017-present), and is an employee of Fidelity Investments. Previously, Mr. Maher served as Vice President of Asset Management Compliance (2013), Vice President of the Program Management Group of FMR (investment adviser firm, 2010-2013), and Vice President of Valuation Oversight (2008-2010).
Rieco E. Mello (1969)
Year of Election or Appointment: 2017
Assistant Treasurer
Mr. Mello also serves as Assistant Treasurer of other funds. Mr. Mello serves as Assistant Treasurer of FMR Capital, Inc. (2017-present) and is an employee of Fidelity Investments (1995-present).
Kenneth B. Robins (1969)
Year of Election or Appointment: 2018
Chief Compliance Officer
Mr. Robins also serves as an officer of other funds. Mr. Robins serves as Compliance Officer of Fidelity Management & Research Company and FMR Co., Inc. (investment adviser firms, 2016-present) and is an employee of Fidelity Investments (2004-present). Previously, Mr. Robins served as Executive Vice President of Fidelity Investments Money Management, Inc. (investment adviser firm, 2013-2016) and served in other fund officer roles.
Stacie M. Smith (1974)
Year of Election or Appointment: 2018
President and Treasurer
Ms. Smith also serves as an officer of other funds. Ms. Smith serves as Assistant Treasurer of FMR Capital, Inc. (2017-present), is an employee of Fidelity Investments (2009-present), and has served in other fund officer roles. Prior to joining Fidelity Investments, Ms. Smith served as Senior Audit Manager of Ernst & Young LLP (accounting firm, 1996-2009). Previously, Ms. Smith served as Assistant Treasurer (2013-2018) and Deputy Treasurer (2013-2016) of certain Fidelity® funds.
Marc L. Spector (1972)
Year of Election or Appointment: 2017
Assistant Treasurer
Mr. Spector also serves as an officer of other funds. Mr. Spector serves as Assistant Treasurer of FMR Capital, Inc. (2017-present) and is an employee of Fidelity Investments (2016-present). Prior to joining Fidelity Investments, Mr. Spector served as Director at the Siegfried Group (accounting firm, 2013-2016), and prior to Siegfried Group as audit senior manager at Deloitte & Touche (accounting firm, 2005-2013).
Renee Stagnone (1975)
Year of Election or Appointment: 2016
Assistant Treasurer
Ms. Stagnone also serves as an officer of other funds. Ms. Stagnone serves as Assistant Treasurer of FMR Capital, Inc. (2017-present) and is an employee of Fidelity Investments (1997-present). Previously, Ms. Stagnone served as Deputy Treasurer of certain Fidelity® funds (2013-2016).
Shareholder Expense Example
As a shareholder of the Fund, you incur two types of costs: (1) transaction costs, and (2) ongoing costs, including management fees and other Fund expenses. This Example is intended to help you understand your ongoing costs (in dollars) of investing in the Fund and to compare these costs with the ongoing costs of investing in other mutual funds.
The Example is based on an investment of $1,000 invested at the beginning of the period and held for the entire period (February 1, 2018 to July 31, 2018).
Actual Expenses
The first line of the accompanying table provides information about actual account values and actual expenses. You may use the information in this line, together with the amount you invested, to estimate the expenses that you paid over the period. Simply divide your account value by $1,000.00 (for example, an $8,600 account value divided by $1,000.00 = 8.6), then multiply the result by the number in the first line under the heading entitled "Expenses Paid During Period" to estimate the expenses you paid on your account during this period. A small balance maintenance fee of $12.00 that is charged once a year may apply for certain accounts with a value of less than $2,000. This fee is not included in the table below. If it was, the estimate of expenses you paid during the period would be higher, and your ending account value lower, by this amount. In addition, the Fund, as a shareholder in the underlying Fidelity Central Funds, will indirectly bear its pro-rata share of the fees and expenses incurred by the underlying Fidelity Central Funds. These fees and expenses are not included in the Fund's annualized expense ratio used to calculate the expense estimate in the table below.
Hypothetical Example for Comparison Purposes
The second line of the accompanying table provides information about hypothetical account values and hypothetical expenses based on the Fund's actual expense ratio and an assumed rate of return of 5% per year before expenses, which is not the Fund's actual return. The hypothetical account values and expenses may not be used to estimate the actual ending account balance or expenses you paid for the period. You may use this information to compare the ongoing costs of investing in the Fund and other funds. To do so, compare this 5% hypothetical example with the 5% hypothetical examples that appear in the shareholder reports of the other funds. A small balance maintenance fee of $12.00 that is charged once a year may apply for certain accounts with a value of less than $2,000. This fee is not included in the table below. If it was, the estimate of expenses you paid during the period would be higher, and your ending account value lower, by this amount. In addition, the Fund, as a shareholder in the underlying Fidelity Central Funds, will indirectly bear its pro-rata share of the fees and expenses incurred by the underlying Fidelity Central Funds. These fees and expenses are not included in the Fund's annualized expense ratio used to calculate the expense estimate in the table below.
Please note that the expenses shown in the table are meant to highlight your ongoing costs only and do not reflect any transaction costs. Therefore, the second line of the table is useful in comparing ongoing costs only, and will not help you determine the relative total costs of owning different funds.
| | Annualized Expense Ratio-A | Beginning
Account Value
February 1, 2018 | Ending
Account Value
July 31, 2018 | Expenses Paid
During Period-B
February 1, 2018
to July 31, 2018 |
| Actual | .75% | $1,000.00 | $1,061.40 | $3.83 |
| Hypothetical-C | | $1,000.00 | $1,021.08 | $3.76 |
A Annualized expense ratio reflects expenses net of applicable fee waivers.
B Expenses are equal to the Fund's annualized expense ratio, multiplied by the average account value over the period, multiplied by 181/365 (to reflect the one-half year period).
C 5% return per year before expenses
Distributions (Unaudited)
The Board of Trustees of Fidelity Real Estate Investment Portfolio voted to pay on September 10, 2018, to shareholders of record at the opening of business on September 7, 2018, a distribution of $0.619 per share derived from capital gains realized from sales of portfolio securities and a dividend of $0.229 per share from net investment income.
The fund hereby designates as a capital gain dividend with respect to the taxable year ended July 31, 2018, $84,727,263, or, if subsequently determined to be different, the net capital gain of such year.
A total of 0.13% of the dividends distributed during the fiscal year was derived from interest on U.S. Government securities which is generally exempt from state income tax.
The fund will notify shareholders in January 2019 of amounts for use in preparing 2018 income tax returns.
Corporate Headquarters
245 Summer St.
Boston, MA 02210
www.fidelity.com
REA-ANN-0918
1.700141.121
Item 2.
Code of Ethics
As of the end of the period, July 31, 2018, Fidelity Select Portfolios (the trust) has adopted a code of ethics, as defined in Item 2 of Form N-CSR, that applies to its President and Treasurer and its Chief Financial Officer. A copy of the code of ethics is filed as an exhibit to this Form N-CSR.
Item 3.
Audit Committee Financial Expert
The Board of Trustees of the trust has determined that Joseph Mauriello is an audit committee financial expert, as defined in Item 3 of Form N-CSR. Mr. Mauriello is independent for purposes of Item 3 of Form N-CSR.
Item 4.
Principal Accountant Fees and Services
Fees and Services
The following table presents fees billed by Deloitte & Touche LLP, the member firms of Deloitte Touche Tohmatsu, and their respective affiliates (collectively, “Deloitte Entities”) in each of the last two fiscal years for services rendered to Fidelity Flex Real Estate Fund, Fidelity International Real Estate Fund and Fidelity Real Estate Investment Portfolio (the “Funds”):
Services Billed by Deloitte Entities
July 31, 2018 FeesA
| | | | |
| Audit Fees | Audit-Related Fees | Tax Fees | All Other Fees |
Fidelity Flex Real Estate Fund | $39,000 | $100 | $6,200 | $1,100 |
Fidelity International Real Estate Fund | $43,000 | $100 | $6,200 | $1,300 |
Fidelity Real Estate Investment Portfolio | $39,000 | $100 | $6,000 | $1,200 |
| | | | |
| Audit Fees | Audit-Related Fees | Tax Fees | All Other Fees |
Fidelity Flex Real Estate Fund | $32,000 | $- | $6,100 | $300 |
Fidelity International Real Estate Fund | $47,000 | $100 | $6,300 | $1,400 |
Fidelity Real Estate Investment Portfolio | $42,000 | $100 | $6,100 | $1,200 |
A Amounts may reflect rounding.
B Fidelity Flex Real Estate Fund commenced operations on March 8, 2017.
The following table presents fees billed by Deloitte Entities that were required to be approved by the Audit Committee for services that relate directly to the operations and financial reporting of the Funds and that are rendered on behalf of Fidelity SelectCo, LLC (“SelectCo”) and entities controlling, controlled by, or under common control with SelectCo (not including any sub-adviser whose role is primarily portfolio management and is subcontracted with or overseen by another investment adviser) that provide ongoing services to the Funds (“Fund Service Providers”):
Services Billed by Deloitte Entities
| | |
| July 31, 2018A | July 31, 2017A,B |
Audit-Related Fees | $5,000 | $- |
Tax Fees | $5,000 | $25,000 |
All Other Fees | $- | $- |
A Amounts may reflect rounding.
B May include amounts billed prior to the Fidelity Flex Real Estate Fund’s commencement of operations.
“Audit-Related Fees” represent fees billed for assurance and related services that are reasonably related to the performance of the fund audit or the review of the fund's financial statements and that are not reported under Audit Fees.
“Tax Fees” represent fees billed for tax compliance, tax advice or tax planning that relate directly to the operations and financial reporting of the fund.
“All Other Fees” represent fees billed for services provided to the fund or Fund Service Provider, a significant portion of which are assurance related, that relate directly to the operations and financial reporting of the fund, excluding those services that are reported under Audit Fees, Audit-Related Fees or Tax Fees.
Assurance services must be performed by an independent public accountant.
* * *
The aggregate non-audit fees billed by Deloitte Entities for services rendered to the Funds, SelectCo (not including any sub-adviser whose role is primarily portfolio management and is subcontracted with or overseen by another investment adviser), and any Fund Service Provider for each of the last two fiscal years of the Funds are as follows:
| | |
Billed By | July 31, 2018A | July 31, 2017A,B |
Deloitte Entities | $365,000 | $520,000 |
A Amounts may reflect rounding.
B May include amounts billed prior to the Fidelity Flex Real Estate Fund’s commencement of operations.
The trust's Audit Committee has considered non-audit services that were not pre-approved that were provided by Deloitte Entities to Fund Service Providers to be compatible with maintaining the independence of Deloitte Entities in its audit of the Funds, taking into account representations from Deloitte Entities, in accordance with Public Company Accounting Oversight Board rules, regarding its independence from the Funds and its related entities and SelectCo’s review of the appropriateness and permissibility under applicable law of such non-audit services prior to their provision to the Fund Service Providers.
Audit Committee Pre-Approval Policies and Procedures
The trust’s Audit Committee must pre-approve all audit and non-audit services provided by a fund’s independent registered public accounting firm relating to the operations or financial reporting of the fund. Prior to the commencement of any audit or non-audit services to a fund, the Audit Committee reviews the services to determine whether they are appropriate and permissible under applicable law.
The Audit Committee has adopted policies and procedures to, among other purposes, provide a framework for the Committee’s consideration of non-audit services by the audit firms that audit the Fidelity funds. The policies and procedures require that any non-audit service provided by a fund audit firm to a Fidelity fund and any non-audit service provided by a fund auditor to a Fund Service Provider that relates directly to the operations and financial reporting of a Fidelity fund (“Covered Service”) are subject to approval by the Audit Committee before such service is provided.
All Covered Services must be approved in advance of provision of the service either: (i) by formal resolution of the Audit Committee, or (ii) by oral or written approval of the service by the Chair of the Audit Committee (or if the Chair is unavailable, such other member of the Audit Committee as may be designated by the Chair to act in the Chair’s absence). The approval contemplated by (ii) above is permitted where the Treasurer determines that action on such an engagement is necessary before the next meeting of the Audit Committee.
Non-audit services provided by a fund audit firm to a Fund Service Provider that do not relate directly to the operations and financial reporting of a Fidelity fund are reported to the Audit Committee periodically.
Non-Audit Services Approved Pursuant to Rule 2-01(c)(7)(i)(C) and (ii) of Regulation S-X (“De Minimis Exception”)
There were no non-audit services approved or required to be approved by the Audit Committee pursuant to the De Minimis Exception during the Funds’ last two fiscal years relating to services provided to (i) the Funds or (ii) any Fund Service Provider that relate directly to the operations and financial reporting of the Funds.
Item 5.
Audit Committee of Listed Registrants
Not applicable.
Item 6.
Investments
(a)
Not applicable.
(b)
Not applicable
Item 7.
Disclosure of Proxy Voting Policies and Procedures for Closed-End Management Investment Companies
Not applicable.
Item 8.
Portfolio Managers of Closed-End Management Investment Companies
Not applicable.
Item 9.
Purchase of Equity Securities by Closed-End Management Investment Company and Affiliated Purchasers
Not applicable.
Item 10.
Submission of Matters to a Vote of Security Holders
There were no material changes to the procedures by which shareholders may recommend nominees to the trust’s Board of Trustees.
Item 11.
Controls and Procedures
(a)(i) The President and Treasurer and the Chief Financial Officer have concluded that the trust’s disclosure controls and procedures (as defined in Rule 30a-3(c) under the Investment Company Act) provide reasonable assurances that material information relating to the trust is made known to them by the appropriate persons, based on their evaluation of these controls and procedures as of a date within 90 days of the filing date of this report.
(a)(ii) There was no change in the trust’s internal control over financial reporting (as defined in Rule 30a-3(d) under the Investment Company Act) that occurred during the period covered by this report that has materially affected, or is reasonably likely to materially affect, the trust’s internal control over financial reporting.
Item 12.
Disclosure of Securities Lending Activities for Closed-End Management
Investment Companies
Not applicable.
Item 13.
Exhibits
| | |
(a) | (1) | Code of Ethics pursuant to Item 2 of Form N-CSR is filed and attached hereto as EX-99.CODE ETH. |
(a) | (2) | Certification pursuant to Rule 30a-2(a) under the Investment Company Act of 1940 (17 CFR 270.30a-2(a)) is filed and attached hereto as Exhibit 99.CERT. |
(a) | (3) | Not applicable. |
(b) | | Certification pursuant to Rule 30a-2(b) under the Investment Company Act of 1940 (17 CFR 270.30a-2(b)) is furnished and attached hereto as Exhibit 99.906CERT. |
SIGNATURES
Pursuant to the requirements of the Securities Exchange Act of 1934 and the Investment Company Act of 1940, the registrant has duly caused this report to be signed on its behalf by the undersigned, thereunto duly authorized.
Fidelity Select Portfolios
| |
By: | /s/Stacie M. Smith |
| Stacie M. Smith |
| President and Treasurer |
| |
Date: | September 26, 2018 |
Pursuant to the requirements of the Securities Exchange Act of 1934 and the Investment Company Act of 1940, this report has been signed below by the following persons on behalf of the registrant and in the capacities and on the dates indicated.
| |
By: | /s/Stacie M. Smith |
| Stacie M. Smith |
| President and Treasurer |
| |
Date: | September 26, 2018 |
| |
By: | /s/John J. Burke III |
| John J. Burke III |
| Chief Financial Officer |
| |
Date: | September 26, 2018 |