|
|
Vanguard® Explorer™ Fund |
|
|
|
|
> Annual Report |
|
|
|
October 31, 2006 |
|
|
> | Vanguard Explorer Fund’s Investor Shares posted a 13.6% return for the 2006 |
| fiscal year. This result was a bit better than the return of its peer group, but |
| fell short of the fund’s benchmark’s return. |
| |
| |
> | Some solid stock selections by the advisors in the consumer discretionary, |
| energy, and health care sectors added to the fund’s performance. |
| |
| |
> | Disappointing results from several sectors, particularly consumer staples, |
| telecommunication services, information technology, and industrials, detracted |
| from fund performance. |
Contents | |
| |
Your Fund’s Total Returns | 1 |
Chairman’s Letter | 2 |
Advisors’ Report | 7 |
Fund Profile | 13 |
Performance Summary | 14 |
Financial Statements | 16 |
Your Fund’s After-Tax Returns | 29 |
About Your Fund’s Expenses | 30 |
Glossary | 32 |
Please note: The opinions expressed in this report are just that—informed opinions. They should not be considered promises or advice. Also, please keep in mind that the information and opinions cover the period through the date on the cover of this report. Of course, the risks of investing in your fund are spelled out in the prospectus.
Your Fund’s Total Returns
Fiscal Year Ended October 31, 2006 | |
| Total |
| Returns |
Vanguard Explorer Fund | |
Investor Shares | 13.6% |
Admiral™ Shares1 | 13.8 |
Russell 2500 Growth Index | 15.6 |
Average Small-Cap Growth Fund2 | 12.8 |
Dow Jones Wilshire 5000 Index | 16.6 |
Your Fund’s Performance at a Glance | | | | |
October 31, 2005–October 31, 2006 | | | | |
| | | Distributions Per Share |
| Starting | Ending | Income | Capital |
| Share Price | Share Price | Dividends | Gains |
Vanguard Explorer Fund | | | | |
Investor Shares | $76.67 | $80.26 | $0.230 | $6.206 |
Admiral Shares | 71.47 | 74.82 | 0.346 | 5.776 |
1 | A lower-cost class of shares available to many longtime shareholders and to those with significant investments in the fund. |
2 | Derived from data provided by Lipper Inc. |
1

Chairman’s Letter
Dear Shareholder,
For the 12 months ended October 31, 2006, Vanguard Explorer Fund’s Investor Shares returned 13.6% (13.8% for Admiral Shares). The fund outpaced the result of its small-cap growth peer group by 0.8 percentage point, but fell shy of its benchmark index, the Russell 2500 Growth Index, by 2 percentage points. Astute stock selection in a few of the fund’s larger sector holdings was offset by disappointing results in several others.
If your Explorer investment is in a taxable account, you may wish to refer to our report on after-tax performance on page 29.
Stocks produced fitful rallies and familiar patterns
U.S. stock prices advanced in fits and starts during the past 12 months, reflecting the uncertainty that pervaded the market for much of the period. The broad market rallied at the start of the fiscal year, buoyed by strong corporate earnings growth and vigorous economic expansion. In mid-May, as investors responded to increasingly pungent whiffs of inflation, anxiety moved to the fore, and market indexes pulled back sharply. In late summer, optimism regained the upper hand. The broad market staged a powerful rally to post a 12-month return of 16.6%.
As has been the case for much of the past five years, smaller-capitalization stocks outperformed large-caps, and
2
value-oriented stocks bested their growth-oriented counterparts. International stocks were especially strong performers; European and emerging-markets stocks led the way.
Rate hikes and inflation concerns drove the bond market
The fixed income markets reflected some of these same uncertainties, with the back-and-forth pattern most pronounced among the longest-maturity bonds. The Federal Reserve Board tightened monetary policy by raising its target for the federal funds rate six times during the fiscal year, to 5.25%, and the yields of short-term issues followed closely behind. The yields of longer-term securities, by contrast, dipped early in the year, rose sharply on inflation worries in May, then finished the period a bit above their starting point. The broad taxable bond market returned
5.2%. Corporate bonds generally outperformed government issues. Municipal bonds did better still.
A solid year, but a jagged trajectory
The fund’s performance was respectable on an absolute basis, though its trajectory was jagged. In the first six months, the fund returned 18.6%, while in the second half of the fiscal year, it posted a –4.2% return. The fund’s shift in course reflected the market for small-cap growth stocks. Initially, these stocks enjoyed excellent results as investors embraced some of the more speculative names; they then cooled off as investors’ diminished appetite for risk began to favor less risky, large-cap issues.
During the year, the advisors’ dual focus on strong earnings growth and reasonable stock valuations seemed out of sync with a small-cap market that placed greater
Market Barometer | | | |
| | Average Annual Total Returns |
| | Periods Ended October 31, 2006 |
| One Year | Three Years | Five Years |
Stocks | | | |
Russell 1000 Index (Large-caps) | 16.0% | 11.9% | 7.9% |
Russell 2000 Index (Small-caps) | 20.0 | 14.5 | 13.8 |
Dow Jones Wilshire 5000 Index (Entire market) | 16.6 | 12.4 | 8.9 |
MSCI All Country World Index ex USA (International) | 28.9 | 23.0 | 16.7 |
| | | |
Bonds | | | |
Lehman Aggregate Bond Index (Broad taxable market) | 5.2% | 3.9% | 4.5% |
Lehman Municipal Bond Index | 5.7 | 4.8 | 5.1 |
Citigroup 3-Month Treasury Bill Index | 4.5 | 2.8 | 2.3 |
| | | |
CPI | | | |
Consumer Price Index | 1.3% | 2.9% | 2.6% |
3
emphasis on earnings growth than attractive prices. The fund typically has lower price/earnings and price/book ratios than the index, which suggests a preference for reasonable stock prices. These lower figures indicate that the advisors, in aggregate, stay away from some of the more speculative, highly valued stocks that inhabit the small-cap universe.
En route to outpacing its peer group of funds, Explorer’s strengths included holdings in the consumer discretionary, health care, and energy sectors—which together accounted for more than 40% of fund assets, on average. Among consumer-oriented stocks, the fund’s Internet retailers and specialty apparel sellers outperformed the index components. Its health care holdings, which included a slightly larger weighting in biotechnology stocks than did the index, turned in superior relative results. The fund’s energy holdings also turned in respectable results, despite volatile, but falling, energy prices.
The fund’s shortfall versus the index resulted primarily from comparatively small positions in a few top-performing sectors and some missed opportunities and subpar stock selections in others. In consumer staples, the fund missed out entirely on, or held significantly smaller positions in, some of the index’s best performers. Among telecommunication services stocks, the fund held few of the best-performing securities. Despite an overweighting in tech stocks, the fund’s sector holdings, in aggregate, underperformed the index sector. The fund’s industrials holdings fell a bit short
Expense Ratios1 | | | |
Your fund compared with its peer group | | | |
| | | Average |
| Investor | Admiral | Small-Cap |
| Shares | Shares | Growth Fund |
Explorer Fund | 0.46% | 0.28% | 1.68% |
1 | Fund expense ratios reflect the 12 months ended October 31, 2006. Peer-group expense ratio is derived from data provided by Lipper Inc. and captures information through year-end 2005. |
4
of the index sector’s return because of the sector’s relatively light weighting in select industries.
The fund’s long-term results continue their excellent trend
Your fund’s showing for the 2006 fiscal year was quite solid. However, it is seldom wise to pass judgment on a fund based on performance over such a short period. A look at longer-term results can shed light on the fund’s enduring character.
The table below shows the growth of hypothetical $10,000 investments in the Explorer Fund and in its comparative yardsticks. As you can see, your fund’s 10.3% average annual return would have grown that initial amount to $26,552—almost $6,500 more than the index (which does not incur investment costs) and $5,150 more than the average small-cap growth fund.
The fund’s advisory team—which includes six independent advisors—gives shareholders access to a deep pool of investment talent. We remain confident that this multiadvisor approach will serve the fund well in the future and will continue to provide competitive results. Your fund’s low costs also give it an ongoing advantage over its peers, as the fund is able to cycle more of its returns back to you, the investor.
The value of balance and diversification endures
As investors have learned over the years, the stock and bond markets can harbor many uncertainties. There is simply no
Total Returns | | |
Ten Years Ended October 31, 2006 | | |
| Average | Final Value of a $10,000 |
| Annual Return | Initial Investment |
Explorer Fund Investor Shares | 10.3% | $26,552 |
Russell 2500 Growth Index | 7.2 | 20,065 |
Average Small-Cap Growth Fund | 7.9 | 21,402 |
Dow Jones Wilshire 5000 Index | 8.9 | 23,395 |
The figures shown represent past performance, which is not a guarantee of future results. (Current performance may be lower or higher than the performance data cited. For performance data current to the most recent month-end, visit our website at www.vanguard.com.) Note, too, that both investment returns and principal value can fluctuate widely, so an investor's shares, when sold, could be worth more or less than their original cost.
5
way to know what will happen year by year, much less day to day. That’s why Vanguard suggests that the best preparation for long-term investing is to select an appropriate, diversified mix of stock, bond, and money market mutual funds that fits your goals, time horizon, and risk tolerance.
Once you have made your initial decision, it is critical to stick with it, resisting the temptation to alter course. A balanced portfolio will never deliver the best (or worst) possible returns, but the ride is sure to be less bumpy than one that encompasses a higher degree of risk. A balanced portfolio gives you the chance to take part in some of the rewards that each asset class offers, and also dampens the effects of downturns. As a component of the stock portion of a diversified portfolio, the Explorer Fund can play a valuable role in helping you toward your long-term goals.
Thank you for your continued confidence in Vanguard.
Sincerely,

John J. Brennan
Chairman and Chief Executive Officer
November 16, 2006
A Change in the Way We List Fund Holdings
As you will see when you turn to the Financial Statements, the list of the fund’s investments is shorter than it used to be. This is because the Securities and Exchange Commission now permits mutual fund companies to publish an abbreviated list of fund holdings in semiannual and annual reports.
• | The Statement of Net Assets now lists each fund’s 50 largest holdings, along with any other holdings that, in total for any issuer, represent 1% or more of the fund’s net assets. |
• | If you want to see a complete list of your fund’s securities, you can find it on our website at www.vanguard.com and at the SEC’s website (www.sec.gov). Or you can call us at 800-662-7447 to request a copy of the list. |
We think the SEC decision is good news for the shareholders, because it allows us to highlight essential information while also helping us to save money for you. The list in this report focuses on the securities that are most important to the fund and excludes details about smaller holdings that have minimal impact on performance. And because the list is so much shorter, the fund will see substantial savings in printing and mailing costs and in the amount of paper we use.
Our reports continue to include the Fund Profiles, which provide an excellent overall snapshot of your fund and its top holdings.
6
Advisors’ Report
During the fiscal year ended October 31, 2006, Vanguard Explorer Fund’s Investor Shares gained 13.6%, and the lower-cost Admiral Shares gained 13.8%. This performance reflected the combined efforts of your fund’s six independent advisors. The use of multiple advisors provides exposure to distinct, yet complementary, investment approaches, enhancing the fund’s diversification.
The advisors, the percentage of fund assets each manages, and a brief description of their investment strategies are presented in the table on page 12. The advisors have also prepared a discussion of the investment environment that existed during the fiscal year and of how their portfolio positioning reflects this assessment.
Grantham, Mayo,
Van Otterloo & Co. LLC
Portfolio Manager:
Sam Wilderman, CFA, Partner and
Director of U.S. Equity Management
Examining the market environment over the past 12 months requires splitting the time frame into two separate, distinctly different periods. From November 2005 through May 10, 2006, low-quality “junk” stocks continued their multiyear run. Record profit margins at low-quality companies, coupled with a historically low risk premium, created a near-perfect environment for these stocks. For the same six-month period in the previous fiscal year, junk stocks, as we measure them, returned 18.7%, while high-quality stocks returned 5.7%.
During the May 10 meeting of the Federal Reserve Board’s Open Market Committee, the Fed’s new chairman, Ben Bernanke, indicated that inflation was a major concern and that further rate increases would likely be required. This announcement prompted a spike in volatility and was a key inflection point for the performance of high- and low-quality stocks. Safety instantly became a more prominent concern for investors, and the performances of junk stocks and quality stocks reversed. From May 10 through the end of the fiscal year, previously high-flying junk stocks returned –0.9%, while quality stocks gained 7.5%. As more time passes, May 10 looks increasingly like a key turning point for the performance of junk stocks.
Our sector positioning was positive for the period, contributing to returns versus the benchmark. Overweighted positions in the “other energy” sector, which includes exploration and service companies, and in the consumer staples group contributed to relative returns. Individual stock selection, however, severely detracted from returns relative to the benchmark. In particular, selections among technology, health care, materials & processing, and producer durables hurt relative returns. Among GMO’s stock selection disciplines, both the valuation and momentum disciplines detracted from relative returns.
Over the 12 months, we moved the GMO subportfolio from underweighted positions in auto & transportation, integrated oils, and producer durables to overweightings in these sectors. The portfolio also shifted from overweightings in the “other energy” and utilities sectors to underweightings in both.
7
As of October 31, the largest sectors in our subportfolio were consumer discretionary, technology, and materials & processing. (Note that in this commentary we used the names of Russell equity sectors, rather than the Global Industry Classification Standard sector names that appear in other sections of this report.)
Vanguard Quantitative Equity Group
Portfolio Manager:
James D. Troyer, CFA, Principal
Our investment process evaluates each stock in the benchmark for its performance potential based on market sentiment, valuation, and earnings quality relative to its peers. We believe that at least one of these three elements will capture the market’s tendency to overreact to short-term news. We attempt to capitalize on this tendency by buying and selling stocks within industry peer groups, in order to add incremental return relative to our small-capitalization benchmark. We keep our portfolio’s exposure to industry and other risk factors in line with that of its benchmark. Thus, our largest sector is information technology—at 21% of the portfolio—not because of our view about stocks in that sector, but because they make up 21% of our stock universe, as represented in the benchmark index.
Based on our research to date, we have concluded that attempting to add value by over- or underweighting sectors is not worth the additional risk. Chiefly, this is because we prefer to take many small positions, rather than a few big ones. With only ten sectors to choose from, one wrong sector choice can adversely affect performance much more than one stock selection gone awry in a well-diversified portfolio. Similarly, we do not tilt toward or away from either the larger-cap or smaller-cap names in the benchmark
Over short periods, the different components of our model have differing levels of effectiveness. Over time, however, the fluctuations between these components offset one another, resulting in a strategy that has served us well over the long term. During the past year, our valuation component added the most value; the sentiment component had a positive effect, and the earnings-quality component was negative. Our most successful positions were in Akamai Technologies, Joy Global, Allegheny Technologies, and Sotheby’s Holdings. Red Hat, Eagle Materials, and Ryland Group did not perform well.
Granahan Investment
Management, Inc.
Portfolio Manager:
Jack Granahan, Managing Partner
The sectors that contributed most to performance in our subportfolio during the fiscal year were technology, health care, financial services, and auto & transportation. All but one of these sectors were overweighted relative to the Russell 2500 Growth Index. We underweighted the financial services sector. (We refer to index sectors as categorized by Russell, rather than by the Global Industry Classification Standard used in other sections of this report.)
8
Several categories penalized the subportfolio’s performance. Areas of weakness included the consumer-oriented sectors, materials & processing, producer durables, energy, and utilities, along with several small categories that totaled 1% of portfolio assets.
The subportfolio earned most of its positive return in the first half of the fiscal year. In the second half, returns were affected by more critical evaluations of earnings reports, caution concerning the drag on the economy from the decline in housing activity, and uncertainties in many growth companies related to stock option issues.
Strong performers in technology were generally identified with strong earnings trends. One example was Akamai Technologies, whose growth is being driven by the explosive increase in video applications on the Internet. For Brocade Communications Systems, a provider of data storage switches and systems, earnings growth accelerated after a period of hesitation. Atheros benefited as growth in chip sets for wireless communications increased.
In health care, acquisition activity helped boost interest in small biotech companies. Several of our holdings were bought at premiums, including Abgenix (biopharmaceuticals), Serologicals (life-science reagents), Cambridge Antibody Technology (antibodies), and Sirna Therapeutics (RNA interference technology).
Overall, our portfolio holdings continued to show strong growth in revenue and earnings. Revenue growth in health care, materials & processing, energy, producer durables, and technology has been especially solid. A key question for the future is how much further profit margins might improve, now that companies have seen several strong years. Our focus continues to be on relatively small companies with a case for earnings growth.
Wellington Management
Company, LLP
Portfolio Manager:
Kenneth L. Abrams, Senior Vice President
and Partner
For our portion of the fund, we utilize research and analysis of individual companies to select stocks that have exceptional growth potential relative to their valuations in the marketplace. We consider each stock individually before purchase and continually monitor developments at these companies for comparison with our expectations for growth.
Over the fiscal year, our subportfolio benefited from favorable security selection in the health care, energy, and consumer discretionary sectors. Within health care, biotechnology firm Abgenix was acquired at a premium by Amgen, and Human Genome Sciences benefited from positive results of phase II trials for its hepatitis C treatment, Albuferon. Manor Care rose
9
on strong enrollment trends for long-term care. Among energy holdings, shares of TETRA Technologies, an oil and gas services company, climbed on strong earnings and guidance spurred by gains in its business related to decommissioned wells. Petroleum refiner Alon USA Energy benefited from strong profit margins in the refining industry. Finally, within the consumer discretionary sector, shares of Charter Communications rose sharply as the broadband company began to reap the benefits of its “triple play” strategy of cable, voice, and data services.
Our portfolio’s detractors over the fiscal period included Revlon, the maker of cosmetics and personal-care products. The company saw increasing competitive pressures and experienced disappointment with product-line introductions, which led to reduced earnings expectations. Shares of software company Red Hat suffered as investors worried about competitive pressures from Oracle and integration issues related to the acquisition of JBoss. Finally, Powerwave Technologies, a vendor of wireless subsystems, declined because of lower-than-expected demand from U.S. operators and recent production issues.
Our sector positioning continues to be predominantly a consequence of our bottom-up stock-selection process. As of October 31, the subportfolio was somewhat defensively postured, as we leaned toward utilities and financials and away from industrials and information technology.
Chartwell Investment Partners, L.P.
Portfolio Manager:
Edward N. Antoian, CFA, Managing Partner
In the current environment, we see investment opportunities across many sectors of the small-cap universe. Among business services firms, we are focused on consulting companies of various specialties, as well as on companies benefiting from continued growth in transaction processing. In financial services, we highlight companies that are participating in the growth and automation of the stock exchanges. In addition, we see strength in pricing for the insurance industry. In consumer services, many of our investments have been in lodging, where demand continues to vastly outpace growth in supply. In health care, we have favored outsourced pharmaceutical research and laboratory services, as well as drug discovery.
We think the backdrop for our fundamental approach to growth investing continues to be favorable. Three basic themes emerge from all of the market chatter: The economy is growing at a good pace, which supports the business plans of many small companies; an end to rising interest rates may be at hand; and cost pressures from energy markets have stabilized.
Looking ahead, we think this is a market environment in which well-managed small companies with good products can do well. We are alert to volatility, which could arise from changes in the interest rate
10
outlook or in gross domestic product forecasts, or even from the usual short-term profit-taking that can follow quick increases in stock price. Yet, we continue to own a diverse selection of companies that we believe can grow profits at relatively fast rates over time.
Kalmar Investment Advisers
Portfolio Manager:
Ford B. Draper, Jr., President and
Chief Investment Officer
The 12 months ended October 31 represented Kalmar’s second year of managing a subportfolio for the Explorer Fund, employing our bottom-up “Growth-with-Value” investment style.
Our results over the fiscal year can best be viewed in two phases. During the first six months, our subportfolio—although increasing in value—appreciated less than the Russell 2500 Growth Index as lower-quality, volatile, commodity-driven companies led in a broad-market rally with a speculative tone. After that, the market corrected sharply on spiking oil prices and rising geopoliticial tensions, then recovered appealingly as investors reacted to relief on these fronts and to the Federal Reserve’s halt in interest rate increases, as well as to signs of greater confidence in an economic “soft landing.”
Our longer-term investment philosophy was beneficial through these ups and downs, keeping us from being distracted by the many abrupt turnabouts in market leadership among sectors. The strength of earnings results from our legitimate growth businesses also drew favorable attention to their stocks. Such good growers often tend to outperform in periods when the economy is slowing, as it has been.
Perhaps the clearest example of this “better business” effect was in our materials-related holdings. As industrial commodity prices pulled back sharply, many commodity cyclical companies that had been leaders faced abrupt corrections. In contrast, the stocks of our value-added businesses appreciated handsomely.
Projecting forward into 2007, in the context of a reasonably healthy world economy, our sense is that U.S. economic growth can continue, albeit at lower rates. There may be economic risks, however, given prolonged drag from the slump in the housing sector. Accordingly, Kalmar’s strategy is to emphasize stocks of highly profitable, more stable businesses that ought to be able to prosper despite a more challenging environment. If our companies can deliver strong growth in such an environment, their stocks should do well.
11
Vanguard Explorer Fund Investment Advisors
| Fund Assets Managed | |
Investment Advisor | % | $ Million | Investment Strategy |
Grantham, Mayo, | 28 | 3,248 | Employs a highly disciplined approach to buying |
Van Otterloo & Co. LLC | | | and selling stocks ranked among the 3,000 largest |
| | | in the U.S. market, minus the very largest 500. |
| | | Stocks are compared with one another and |
| | | evaluated monthly using three disciplines, each of |
| | | which represents an individual subportfolio. |
Vanguard Quantitative | 23 | 2,707 | Conducts quantitative management using models |
Equity Group | | | that assess valuation, marketplace sentiment, and |
| | | balance-sheet characteristics of companies as |
| | | compared with their peers. |
Granahan Investment | 21 | 2,428 | Bases its investment process on the beliefs that |
Management, Inc. | | | earnings drive stock prices and that small, dynamic |
| | | companies with exceptional growth prospects have |
| | | the greatest long-term potential. A bottom-up, |
| | | fundamental approach places companies in one |
| | | of three life-cycle categories: core growth, pioneer, |
| | | and special situation. In each, the process looks |
| | | for companies with strong earnings growth and |
| | | leadership in their markets. |
Wellington Management | 12 | 1,423 | Conducts research and analysis of individual |
Company, LLP | | | companies to select stocks believed to have |
| | | exceptional growth potential relative to their market |
| | | valuations. Each stock is considered individually |
| | | before purchase, and company developments |
| | | are continually monitored for comparison with |
| | | expectations for growth. |
Chartwell Investment | 7 | 858 | Uses a bottom-up, fundamental, research-driven |
Partners, L.P. | | | stock-selection strategy focusing on companies |
| | | with sustainable growth, strong management |
| | | teams,competitive positions, and outstanding |
| | | product and service offerings. These companies |
| | | should continually demonstrate growth in earnings per share. |
Kalmar Investment Advisers | 7 | 825 | Employs a “Growth-with-Value” strategy using |
| | | creative, bottom-up research to uncover vigorously |
| | | growing, high-quality businesses. The process also |
| | | seeks out stocks that are inefficiently valued or that |
| | | offer value through longer-term company |
| | | ownership.The strategy has a dual objective of |
| | | superior returns with lower risk. |
Cash Investments1 | 2 | 292 | — |
1 | These short-term reserves are invested by Vanguard in equity index products to simulate investment in stocks. Each advisor also may maintain a modest cash position. |
12
Fund Profile
As of October 31, 2006
Portfolio Characteristics | | |
| Comparative | Broad |
| Fund | Index1 | Index2 |
Number of Stocks | 1,088 | 1,609 | 4,956 |
Median Market Cap | $2.2B | $2.2B | $28.7B |
Price/Earnings Ratio | 22.6x | 27.1x | 17.7x |
Price/Book Ratio | 3.1x | 3.7x | 2.6x |
Yield | | 0.5% | 1.6% |
Investor Shares | 0.3% | | |
Admiral Shares | 0.5% | | |
Return on Equity | 12.9% | 13.1% | 15.4% |
Earnings Growth Rate | 21.0% | 19.0% | 15.5% |
Foreign Holdings | 2.2% | 0.0% | 1.1% |
Turnover Rate | 96% | — | — |
Expense Ratio | | — | — |
Investor Shares | 0.46% | | |
Admiral Shares | 0.28% | | |
Short-Term Reserves | 2% | — | — |
Sector Diversification (% of portfolio) | |
| Comparative | Broad |
| Fund | Index1 | Index2 |
Consumer Discretionary | 18% | 17% | 12% |
Consumer Staples | 2 | 2 | 9 |
Energy | 6 | 7 | 9 |
Financials | 10 | 11 | 22 |
Health Care | 16 | 19 | 12 |
Industrials | 17 | 16 | 11 |
Information Technology | 22 | 21 | 16 |
Materials | 5 | 5 | 3 |
Telecommunication Services | 1 | 2 | 3 |
Utilities | 1 | 0 | 3 |
Short-Term Reserves | 2% | — | — |
Volatility Measures3 | |
| Fund Versus | Fund Versus |
| Comparative Index1 | Broad Index2 |
R-Squared | 0.99 | 0.82 |
Beta | 0.98 | 1.53 |
Ten Largest Holdings4 (% of total net assets) |
| | |
Akamai Technologies, Inc. | internet software and services | 0.8% |
O’Reilly Automotive, Inc. | automotive retail | 0.7 |
Cephalon, Inc. | biotechnology | 0.7 |
Swift Transportation Co., Inc. | trucking | 0.6 |
The Dun &Bradstreet Corp. | diversified commerical and professional services | 0.6 |
MSC Industrial Direct Co., Inc. Class A | trading companies and distributors | 0.6 |
American Eagle Outfitters, Inc. | apparel retail | 0.5 |
IDEXX Laboratories Corp. | health care equipment | 0.5 |
Terex Corp. | construction, farm machinery, and heavy trucks | 0.5 |
Alliance Data Systems Corp. | data processing and outsourced data services | 0.5 |
Top Ten | | 6.0% |
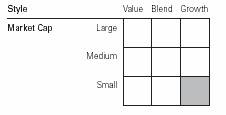
Investment Focus
1 | Russell 2500 Growth Index. |
2 | Dow Jones Wilshire 5000 Index. |
3 | For an explanation of R-squared, beta, and other terms used here, see the Glossary on page 32. |
4 | “Ten Largest Holdings” excludes any temporary cash investments and equity index products. |
13
Performance Summary
All of the returns in this report represent past performance, which is not a guarantee of future results that may be achieved by the fund. (Current performance may be lower or higher than the performance data cited. For performance data current to the most recent month-end, visit our website at www.vanguard.com.) Note, too, that both investment returns and principal value can fluctuate widely, so an investor’s shares, when sold, could be worth more or less than their original cost. The returns shown do not reflect taxes that a shareholder would pay on fund distributions or on the sale of fund shares.
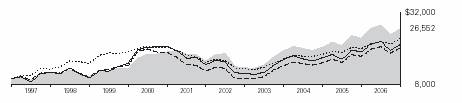
Cumulative Performance: October 31, 1996–October 31, 2006
Initial Investment of $10,000
| | | |
| | | |
| | Average Annual Total Returns | Final Value |
| | Periods Ended October 31, 2006 | of a $10,000 |
| One Year | Five Years | Ten Years | Investment |
Explorer Fund Investor Shares | 13.59% | 10.97% | 10.26% | $26,552 |
Dow Jones Wilshire 5000 Index | 16.61 | 8.89 | 8.87 | 23,395 |
Russell 2500 Growth Index | 15.56 | 9.91 | 7.21 | 20,065 |
Average Small-Cap Growth Fund1 | 12.82 | 7.74 | 7.91 | 21,402 |
| | | Final Value |
| | Since | of a $100,000 |
| One Year | Inception2 | Investment |
Explorer Fund Admiral Shares | 13.79% | 10.38% | $163,290 |
Dow Jones Wilshire 5000 Index | 16.61 | 7.87 | 145,682 |
Russell 2500 Growth Index | 15.56 | 9.16 | 154,547 |
1 | Derived from data provided by Lipper Inc. |
14
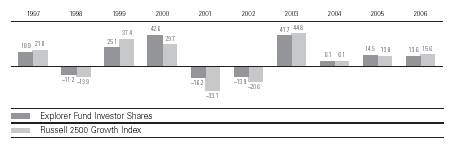
Fiscal-Year Total Returns (%): October 31, 1996–October 31, 2006
Average Annual Total Returns: Periods Ended September 30, 2006
This table presents average annual total returns through the latest calendar quarter—rather than through the end of the fiscal period. Securities and Exchange Commission rules require that we provide this information.
| Inception Date | One Year | Five Years | Ten Years |
Investor Shares | 12/11/1967 | 5.55% | 11.62% | 9.54% |
Admiral Shares | 11/12/2001 | 5.74 | 9.591 | — |
1 Return since inception.
Note: See Financial Highlights tables on pages 22 and 23 for dividend and capital gains information.
15
Financial Statements
Statement of Net Assets—Investments Summary
As of October 31, 2006
This Statement summarizes the fund’s holdings by asset type (common stocks, bonds, etc.) and by industry sector. Details are reported for each of the fund’s 50 largest individual holdings and for investments that, in total for any issuer, represent more than 1% of the fund’s net assets. The total value of smaller holdings is reported as a single amount within each category.
The fund provides a complete list of its holdings four times in each fiscal year, at the quarter-ends. For the second and fourth fiscal quarters, the complete listing of the fund’s holdings is available electronically on Vanguard.com® and on the Securities and Exchange Commission’s website (www.sec.gov), or you can have it mailed to you without charge by calling 800-662-7447. For the first and third fiscal quarters, the fund files the lists with the SEC on Form N-Q. Shareholders can look up the fund’s Forms N-Q on the SEC’s website. Forms N-Q may also be reviewed and copied at the SEC’s Public Reference Room (see the back cover of this report for further information).
| | | Market | Percentage |
| | | Value• | of Net |
| | Shares | ($000) | Assets |
Common Stocks | | | |
Consumer Discretionary | | | |
* | O’Reilly Automotive, Inc. | 2,561,950 | 82,725 | 0.7% |
| American Eagle Outfitters, Inc. | 1,332,201 | 61,015 | 0.5% |
| Family Dollar Stores, Inc. | 1,360,346 | 40,062 | 0.4% |
| Phillips-Van Heusen Corp. | 865,300 | 39,596 | 0.4% |
* | Lamar Advertising Co. Class A | 656,260 | 37,853 | 0.3% |
* | Dollar Tree Stores, Inc. | 1,157,764 | 35,995 | 0.3% |
† | Other—Consumer Discretionary | | 1,818,225 | 15.4% |
| | | 2,115,471 | 18.0% |
| | | | |
† Consumer Staples | | 249,185 | 2.1% |
| | | | |
Energy | | | |
* | Helix Energy Solutions Group, Inc. | 1,353,200 | 43,708 | 0.4% |
| St. Mary Land & Exploration Co. | 1,003,300 | 37,413 | 0.3% |
† | Other—Energy | | 553,131 | 4.7% |
| | | 634,252 | 5.4% |
Financials | | | |
| Jefferies Group, Inc. | 1,743,700 | 50,097 | 0.4% |
* | Affiliated Managers Group, Inc. | 496,330 | 49,702 | 0.4% |
| CapitalSource Inc. REIT | 1,775,996 | 49,266 | 0.4% |
| Cash America International Inc. | 1,014,200 | 41,917 | 0.4% |
| Brown & Brown, Inc. | 1,205,170 | 35,263 | 0.3% |
| Cullen/Frost Bankers, Inc. | 642,300 | 34,787 | 0.3% |
^ The First Marblehead Corp. | 511,153 | 34,477 | 0.3% |
† | Other—Financials | | 798,994 | 6.8% |
| | | 1,094,503 | 9.3% |
Health Care | | | |
* | Cephalon, Inc. | 1,125,615 | 78,996 | 0.7% |
* | IDEXX Laboratories Corp. | 732,958 | 60,989 | 0.5% |
* | Henry Schein, Inc. | 923,520 | 45,890 | 0.4% |
16
| | | Market | Percentage |
| | | Value• | of Net |
| | Shares | ($000) | Assets |
| Pharmaceutical Product Development, Inc. | 1,310,736 | 41,485 | 0.4% |
* | Human Genome Sciences, Inc. | 2,716,600 | 36,267 | 0.3% |
| Manor Care, Inc. | 734,707 | 35,259 | 0.3% |
| DENTSPLY International Inc. | 1,121,689 | 35,086 | 0.3% |
† | Other—Health Care | | 1,559,438 | 13.2% |
| | | 1,893,410 | 16.1% |
Industrials | | | |
* | Swift Transportation Co., Inc. | 2,946,697 | 74,109 | 0.6% |
* | The Dun & Bradstreet Corp. | 894,700 | 69,107 | 0.6% |
| MSC Industrial Direct Co., Inc. Class A | 1,606,869 | 65,753 | 0.6% |
* | Terex Corp. | 1,149,700 | 59,508 | 0.5% |
| Donaldson Co., Inc. | 1,312,900 | 49,299 | 0.4% |
| Watsco, Inc. | 880,400 | 43,844 | 0.4% |
* | The Advisory Board Co. | 761,135 | 42,030 | 0.4% |
* | Wesco International, Inc. | 620,500 | 40,500 | 0.3% |
| Fastenal Co. | 932,200 | 37,512 | 0.3% |
† | Other—Industrials | | 1,471,466 | 12.5% |
| | | 1,953,128 | 16.6% |
Information Technology | | | |
* | Akamai Technologies, Inc. | 2,040,845 | 95,634 | 0.8% |
* | Alliance Data Systems Corp. | 969,544 | 58,871 | 0.5% |
* | Brocade Communications Systems, Inc. | 5,905,400 | 47,893 | 0.4% |
* | MPS Group, Inc. | 3,097,621 | 47,239 | 0.4% |
* | Red Hat, Inc. | 2,732,813 | 44,763 | 0.4% |
* | Integrated Device Technology Inc. | 2,599,122 | 41,196 | 0.4% |
* | Citrix Systems, Inc. | 1,306,641 | 38,585 | 0.3% |
* | Ingram Micro, Inc. Class A | 1,842,700 | 37,978 | 0.3% |
* | BMC Software, Inc. | 1,231,500 | 37,327 | 0.3% |
* | Polycom, Inc. | 1,351,375 | 37,028 | 0.3% |
* | Ceridian Corp. | 1,568,450 | 36,968 | 0.3% |
* | Informatica Corp. | 2,972,214 | 36,826 | 0.3% |
| FactSet Research Systems Inc. | 693,377 | 35,293 | 0.3% |
| Tektronix, Inc. | 1,137,000 | 34,531 | 0.3% |
* | VeriFone Holdings, Inc. | 1,174,800 | 34,316 | 0.3% |
* | CommScope, Inc. | 1,073,200 | 34,246 | 0.3% |
† | Other—Information Technology | | 1,851,397 | 15.7% |
| | | 2,550,091 | 21.6% |
Materials | | | |
| Allegheny Technologies Inc. | 537,600 | 42,325 | 0.4% |
| AptarGroup Inc. | 631,400 | 34,670 | 0.3% |
| Steel Dynamics, Inc. | 566,900 | 34,076 | 0.3% |
† | Other—Materials | | 437,822 | 3.7% |
| | | 548,893 | 4.7% |
17
| | Market | Percentage |
| | Value• | of Net |
| Shares | ($000) | Assets |
† Telecommunication Services | | 98,739 | 0.8% |
† Utilities | | 72,962 | 0.6% |
| | | |
Exchange-Traded Funds | | | |
^2Vanguard Small-Cap ETF | 1,862,353 | 124,349 | 1.0% |
^2Vanguard Small-Cap Growth ETF | 713,200 | 45,395 | 0.4% |
| | 169,744 | 1.4% |
Total Common Stocks (Cost $9,928,252) | | 11,380,378 | 96.6%1 |
Temporary Cash Investments | | | |
Money Market Fund | | | |
3 Vanguard Market Liquidity Fund, 5.289% | 375,833,343 | 375,833 | 3.2% |
3 Vanguard Market Liquidity Fund, | | | |
5.289%—Note G | 123,763,230 | 123,763 | 1.1% |
| | 499,596 | 4.3% |
| Face | | |
| Amount | | |
| ($000) | | |
Repurchase Agreement | | | |
Deutsche Bank 5.300%, 11/1/06 | | | |
(Dated 10/31/06, Repurchase Value | | | |
$27,604,000, Collateralized by | | | |
Federal Home Loan Mortgage Corp., | | | |
5.000%–5.500%, 9/1/19–9/1/35) | 27,600 | 27,600 | 0.2% |
| | | |
U.S. Agency Obligations | | | |
4 Federal Home Loan Mortgage Corp. | | | |
5 5.150%–5.187%, 12/26/06–2/16/07 | 22,000 | 21,815 | 0.2% |
| | | |
Total Temporary Cash Investments (Cost $549,011) | | 549,011 | 4.7%1 |
Total Investments (Cost $10,477,263) | | 11,929,389 | 101.3% |
Other Assets and Liabilities | | | |
Other Assets—Note C | | 111,032 | 0.9% |
Liabilities—Note G | | (259,181) | (2.2%) |
| | (148,149) | (1.3%) |
Net Assets (100%) | | 11,781,240 | 100.0% |
18
At October 31, 2006, net assets consisted of:6 | |
| Amount |
| ($000) |
Paid-in Capital | 9,247,715 |
Undistributed Net Investment Income | 14,153 |
Accumulated Net Realized Gains | 1,062,939 |
Unrealized Appreciation | |
Investment Securities | 1,452,126 |
Futures Contracts | 4,307 |
Foreign Currencies | — |
Net Assets | 11,781,240 |
| |
Investor Shares—Net Assets | |
Applicable to 106,119,909 outstanding $.001 par value shares | |
of beneficial interest (unlimited authorization) | 8,517,110 |
Net Asset Value Per Share—Investor Shares | $80.26 |
| |
Admiral Shares—Net Assets | |
Applicable to 43,624,160 outstanding $.001 par value shares | |
of beneficial interest (unlimited authorization) | 3,264,130 |
Net Asset Value Per Share—Admiral Shares | $74.82 |
• | See Note A in Notes to Financial Statements. |
* | Non-income-producing security. |
† | Represents the aggregate value, by category, of securities that are not among the 50 largest holdings and, in total for any issuer, represent 1% or less of net assets. |
^ | Part of security position is on loan to broker-dealers. See Note G in Notes to Financial Statements. |
1 | The fund invests a portion of its cash reserves in equity markets through the use of index futures contracts. After giving effect to futures investments, the fund’s effective common stock and temporary cash investment positions represent 98.3% and 3.0%, respectively, of net assets. See Note E in Notes to Financial Statements. |
2 | Considered an affiliated company of the fund as the issuer is another member of The Vanguard Group. |
3 | Affiliated money market fund available only to Vanguard funds and certain trusts and accounts managed by Vanguard. Rate shown is the 7-day yield. |
4 | The issuer operates under a congressional charter; its securities are neither issued nor guaranteed by the U.S. government. If needed, access to additional funding from the U.S. Treasury (beyond the issuer’s line of credit) would require congressional action. |
5 | Securities with a value of $21,815,000 and cash of $2,800,000 have been segregated as initial margin for open futures contracts. |
6 | See Note E in Notes to Financial Statements for the tax-basis components of net assets. REIT—Real Estate Investment Trust. |
19
Statement of Operations
| Year Ended |
| October 31, 2006 |
| ($000) |
Investment Income | |
Income | |
Dividends1,2 | 65,504 |
Interest2 | 26,075 |
Security Lending | 4,982 |
Total Income | 96,561 |
Expenses | |
Investment Advisory Fees—Note B | |
Basic Fee | 19,593 |
Performance Adjustment | (3,024) |
The Vanguard Group—Note C | |
Management and Administrative—Investor Shares | 25,187 |
Management and Administrative—Admiral Shares | 3,621 |
Marketing and Distribution—Investor Shares | 2,131 |
Marketing and Distribution—Admiral Shares | 794 |
Custodian Fees | 143 |
Auditing Fees | 28 |
Shareholders’ Reports—Investor Shares | 317 |
Shareholders’ Reports—Admiral Shares | 5 |
Trustees’ Fees and Expenses | 14 |
Total Expenses | 48,809 |
Expenses Paid Indirectly—Note D | (502) |
Net Expenses | 48,307 |
Net Investment Income | 48,254 |
Realized Net Gain (Loss) | |
Investment Securities Sold2 | 1,190,501 |
Futures Contracts | 24,819 |
Foreign Currencies | (33) |
Realized Net Gain (Loss) | 1,215,287 |
Change in Unrealized Appreciation (Depreciation) | |
Investment Securities | 106,712 |
Futures Contracts | 6,465 |
Foreign Currencies | 1 |
Change in Unrealized Appreciation (Depreciation) | 113,178 |
Net Increase (Decrease) in Net Assets Resulting from Operations | 1,376,719 |
1 | Dividends are net of foreign withholding taxes of $126,000. |
2 | Dividend income, interest income, and realized net gain (loss) from affiliated companies of the fund were $1,539,000, $22,742,000, and $1,138,000, respectively. |
20
Statement of Changes in Net Assets
| Year Ended October 31, |
| 2006 | 2005 |
| ($000) | ($000) |
Increase (Decrease) in Net Assets | | |
Operations | | |
Net Investment Income | 48,254 | 18,100 |
Realized Net Gain (Loss) | 1,215,287 | 958,645 |
Change in Unrealized Appreciation (Depreciation) | 113,178 | 266,311 |
Net Increase (Decrease) in Net Assets Resulting from Operations | 1,376,719 | 1,243,056 |
Distributions | | |
Net Investment Income | | |
Investor Shares | (23,606) | — |
Admiral Shares | (12,258) | — |
Realized Capital Gain1 | | |
Investor Shares | (636,946) | (8,028) |
Admiral Shares | (204,628) | (1,311) |
Total Distributions | (877,438) | (9,339) |
Capital Share Transactions—Note H | | |
Investor Shares | 301,408 | (518,704) |
Admiral Shares | 742,483 | 1,060,504 |
Net Increase (Decrease) from Capital Share Transactions | 1,043,891 | 541,800 |
Total Increase (Decrease) | 1,543,172 | 1,775,517 |
Net Assets | | |
Beginning of Period | 10,238,068 | 8,462,551 |
End of Period2 | 11,781,240 | 10,238,068 |
1 | Includes fiscal 2006 and 2005 short-term gain distributions totaling $212,902,000 and $0, respectively. Short-term gain distributions are treated as ordinary income dividends for tax purposes. |
2 | Net Assets—End of Period includes undistributed net investment income of $14,153,000 and $6,872,000. |
21
Financial Highlights
Explorer Fund Investor Shares | | | | | |
| | | | Year Ended October 31, |
For a Share Outstanding Throughout Each Period | 2006 | 2005 | 2004 | 2003 | 2002 |
Net Asset Value, Beginning of Period | $76.67 | $67.01 | $63.17 | $44.60 | $51.91 |
Investment Operations | | | | | |
Net Investment Income (Loss) | .302 | .111 | (.05) | (.012) | (.005) |
Net Realized and Unrealized Gain (Loss) | | | | | |
on Investments | 9.724 | 9.622 | 3.89 | 18.587 | (7.200) |
Total from Investment Operations | 10.026 | 9.733 | 3.84 | 18.575 | (7.205) |
Distributions | | | | | |
Dividends from Net Investment Income | (.230) | — | — | (.005) | (.105) |
Distributions from Realized Capital Gains | (6.206) | (.073) | — | — | — |
Total Distributions | (6.436) | (.073) | — | (.005) | (.105) |
Net Asset Value, End of Period | $80.26 | $76.67 | $67.01 | $63.17 | $44.60 |
| | | | | |
Total Return | 13.59% | 14.53% | 6.08% | 41.65% | –13.93% |
| | | | | |
Ratios/Supplemental Data | | | | | |
Net Assets, End of Period (Millions) | $8,517 | $7,836 | $7,302 | $5,662 | $3,432 |
Ratio of Total Expenses to Average Net Assets1 | 0.46% | 0.51% | 0.57% | 0.72% | 0.70% |
Ratio of Net Investment Income (Loss) to | | | | | |
Average Net Assets | 0.36% | 0.16% | (0.11%) | (0.08%) | (0.01%) |
Portfolio Turnover Rate | 96% | 80% | 82% | 77% | 69% |
1 | Includes performance-based investment advisory fee increases (decreases) of (0.03%), (0.01%), 0.02%, 0.07%, and 0.07%. |
22
Explorer Fund Admiral Shares | | | | | |
| | | | | Nov. 12, |
| | | | | 20011 to |
| Year Ended October 31, | Oct. 31, |
For a Share Outstanding Throughout Each Period | 2006 | 2005 | 2004 | 2003 | 2002 |
Net Asset Value, Beginning of Period | $71.47 | $62.37 | $58.71 | $41.43 | $50.00 |
Investment Operations | | | | | |
Net Investment Income | .422 | .215 | .04 | .064 | .035 |
Net Realized and Unrealized Gain (Loss) | | | | | |
on Investments | 9.050 | 8.953 | 3.62 | 17.259 | (8.498) |
Total from Investment Operations | 9.472 | 9.168 | 3.66 | 17.323 | (8.463) |
Distributions | | | | | |
Dividends from Net Investment Income | (.346) | — | — | (.043) | (.107) |
Distributions from Realized Capital Gains | (5.776) | (.068) | — | — | — |
Total Distributions | (6.122) | (.068) | — | (.043) | (.107) |
Net Asset Value, End of Period | $74.82 | $71.47 | $62.37 | $58.71 | $41.43 |
| | | | | |
Total Return | 13.79% | 14.70% | 6.23% | 41.85% | –16.98% |
| | | | | |
Ratios/Supplemental Data | | | | | |
Net Assets, End of Period (Millions) | $3,264 | $2,402 | $1,161 | $721 | $293 |
Ratio of Total Expenses to Average Net Assets2 | 0.28% | 0.34% | 0.43% | 0.57% | 0.61%* |
Ratio of Net Investment Income to | | | | | |
Average Net Assets | 0.54% | 0.33% | 0.04% | 0.05% | 0.13%* |
Portfolio Turnover Rate | 96% | 80% | 82% | 77% | 69% |
| | | | | | |
2 | Includes performance-based investment advisory fee increases (decreases) of (0.03%), (0.01%), 0.02%, 0.07%, and 0.07%. |
See accompanying Notes, which are an integral part of the Financial Statements.
23
Notes to Financial Statements
Vanguard Explorer Fund is registered under the Investment Company Act of 1940 as an open-end investment company, or mutual fund. The fund offers two classes of shares, Investor Shares and Admiral Shares. Investor Shares are available to any investor who meets the fund’s minimum purchase requirements. Admiral Shares are designed for investors who meet certain administrative, servicing, tenure, and account-size criteria.
A. The following significant accounting policies conform to generally accepted accounting principles for U.S. mutual funds. The fund consistently follows such policies in preparing its financial statements.
1. Security Valuation: Securities are valued as of the close of trading on the New York Stock Exchange (generally 4:00 p.m., Eastern time) on the valuation date. Equity securities are valued at the latest quoted sales prices or official closing prices taken from the primary market in which each security trades; such securities not traded on the valuation date are valued at the mean of the latest quoted bid and asked prices. Securities for which market quotations are not readily available, or whose values have been affected by events occurring before the fund’s pricing time but after the close of the securities’ primary markets, are valued at their fair values calculated according to procedures adopted by the board of trustees. These procedures include obtaining quotations from an independent pricing service, monitoring news to identify significant market- or security-specific events, and evaluating changes in the values of foreign market proxies (for example, ADRs, futures contracts, or exchange-traded funds) between the time the foreign markets close and the fund’s pricing time. When fair-value pricing is employed, the prices of securities used by a fund to calculate its net asset value may differ from quoted or published prices for the same securities. Investments in Vanguard Market Liquidity Fund are valued at that fund’s net asset value. Temporary cash investments acquired over 60 days to maturity are valued using the latest bid prices or using valuations based on a matrix system (which considers such factors as security prices, yields, maturities, and ratings), both as furnished by independent pricing services. Other temporary cash investments are valued at amortized cost, which approximates market value.
2. Foreign Currency: Securities and other assets and liabilities denominated in foreign currencies are translated into U.S. dollars at the exchange rates on the valuation date as employed by Morgan Stanley Capital International (MSCI) in the calculation of its indexes. As part of the fund’s fair-value procedures, exchange rates may be adjusted if they change significantly before the fund’s pricing time but after the time at which the MSCI rates are determined (generally 11:00 a.m., Eastern time).
Realized gains (losses) and unrealized appreciation (depreciation) on investment securities include the effects of changes in exchange rates since the securities were purchased, combined with the effects of changes in security prices. Fluctuations in the value of other assets and liabilities resulting from changes in exchange rates are recorded as unrealized foreign currency gains (losses) until the asset or liability is settled in cash, when they are recorded as realized foreign currency gains (losses).
3. Futures Contracts: The fund uses index futures contracts to a limited extent, with the objective of maintaining full exposure to the stock market while maintaining liquidity. The fund may purchase or sell futures contracts to achieve a desired level of investment, whether to accommodate portfolio turnover or cash flows from capital share transactions. The primary risks associated with the use of futures contracts are imperfect correlation between changes in market values of stocks held by the fund and the prices of futures contracts, and the possibility of an illiquid market.
24
Futures contracts are valued at their quoted daily settlement prices. The aggregate principal amounts of the contracts are not recorded in the Statement of Net Assets. Fluctuations in the value of the contracts are recorded in the Statement of Net Assets as an asset (liability) and in the Statement of Operations as unrealized appreciation (depreciation) until the contracts are closed, when they are recorded as realized futures gains (losses).
4. Repurchase Agreements: The fund may invest in repurchase agreements. Securities pledged as collateral for repurchase agreements are held by a custodian bank until the agreements mature. Each agreement requires that the market value of the collateral be sufficient to cover payments of interest and principal; however, in the event of default or bankruptcy by the other party to the agreement, retention of the collateral may be subject to legal proceedings.
5. Federal Income Taxes: The fund intends to continue to qualify as a regulated investment company and distribute all of its taxable income. Accordingly, no provision for federal income taxes is required in the financial statements.
6. Distributions: Distributions to shareholders are recorded on the ex-dividend date.
7. Security Lending: The fund may lend its securities to qualified institutional borrowers to earn additional income. Security loans are required to be secured at all times by collateral at least equal to the market value of securities loaned. The fund invests cash collateral received in Vanguard Market Liquidity Fund, and records a liability for the return of the collateral, during the period the securities are on loan. Security lending income represents the income earned on investing cash collateral, less expenses associated with the loan.
8. Other: Dividend income is recorded on the ex-dividend date. Interest income includes income distributions received from Vanguard Market Liquidity Fund and is accrued daily. Security transactions are accounted for on the date securities are bought or sold. Costs used to determine realized gains (losses) on the sale of investment securities are those of the specific securities sold.
Each class of shares has equal rights as to assets and earnings, except that each class separately bears certain class-specific expenses related to maintenance of shareholder accounts (included in Management and Administrative expenses) and shareholder reporting. Marketing and distribution expenses are allocated to each class of shares based on a method approved by the board of trustees. Income, other non-class-specific expenses, and gains and losses on investments are allocated to each class of shares based on its relative net assets.
B. Grantham, Mayo, Van Otterloo & Co. LLC (“GMO”), Granahan Investment Management, Inc., Wellington Management Company, LLP, Chartwell Investment Partners, L.P., and Kalmar Investment Advisers each provide investment advisory services to a portion of the fund for a fee calculated at an annual percentage rate of average net assets managed by the advisor. The basic fees of GMO, Granahan Investment Management, Inc., Wellington Management Company, and Chartwell Investment Partners are subject to quarterly adjustments based on performance for the preceding three years relative to the Russell 2500 Growth Index. In accordance with the advisory contract entered into with Kalmar Investment Advisers in February 2005, beginning in February 2007 the investment advisory fee will be subject to quarterly adjustments based on performance since April 30, 2005, relative to the Russell 2500 Growth Index.
25
The Vanguard Group provides investment advisory services to a portion of the fund on an at-cost basis; the fund paid Vanguard advisory fees of $672,000 for the year ended October 31, 2006.
For the year ended October 31, 2006, the aggregate investment advisory fee represented an effective annual basic rate of 0.17% of the fund’s average net assets before a decrease of $3,024,000 (0.03%) based on performance.
C. The Vanguard Group furnishes at cost corporate management, administrative, marketing, and distribution services. The costs of such services are allocated to the fund under methods approved by the board of trustees. The fund has committed to provide up to 0.40% of its net assets in capital contributions to Vanguard. At October 31, 2006, the fund had contributed capital of $1,190,000 to Vanguard (included in Other Assets), representing 0.01% of the fund’s net assets and 1.19% of Vanguard’s capitalization. The fund’s trustees and officers are also directors and officers of Vanguard.
D. The fund has asked its investment advisors to direct certain security trades, subject to obtaining the best price and execution, to brokers who have agreed to rebate to the fund part of the commissions generated. Such rebates are used solely to reduce the fund’s management and administrative expenses. The fund’s custodian bank has also agreed to reduce its fees when the fund maintains cash on deposit in the non-interest-bearing custody account. For the year ended October 31, 2006, these arrangements reduced the fund’s management and administrative expenses by $470,000 and custodian fees by $32,000.
E. Distributions are determined on a tax basis and may differ from net investment income and realized capital gains for financial reporting purposes. Differences may be permanent or temporary. Permanent differences are reclassified among capital accounts in the financial statements to reflect their tax character. Temporary differences arise when certain items of income, expense, gain, or loss are recognized in different periods for financial statement and tax purposes; these differences will reverse at some time in the future. Differences in classification may also result from the treatment of short-term gains as ordinary income for tax purposes.
During the year ended October 31, 2006, the fund realized net foreign currency losses of $33,000, which decreased distributable net income for tax purposes; accordingly, such losses have been reclassified from accumulated net realized gains to undistributed net investment income. Certain of the fund’s investments are in securities considered to be “passive foreign investment companies,” for which any unrealized appreciation and/or realized gains are required to be included in distributable net income for tax purposes. Unrealized appreciation on passive foreign investment company holdings at October 31, 2006, was $7,651,000.
The fund used a tax accounting practice to treat a portion of the price of capital shares redeemed during the year as distributions from net investment income and realized capital gains. Accordingly, the fund has reclassified $5,076,000 from undistributed net investment income, and $154,741,000 from accumulated net realized gains, to paid-in capital.
For tax purposes, at October 31, 2006, the fund had $160,263,000 of ordinary income and $954,472,000 of long-term capital gains available for distribution.
At October 31, 2006, the cost of investment securities for tax purposes was $10,494,926,000. Net unrealized appreciation of investment securities for tax purposes was $1,434,463,000, consisting of unrealized gains of $1,872,950,000 on securities that had risen in value since their purchase and $438,487,000 in unrealized losses on securities that had fallen in value since their purchase.
26
At October 31, 2006, the aggregate settlement value of open futures contracts expiring in December 2006 and the related unrealized appreciation (depreciation) were:
| | | ($000) |
| | Aggregate | Unrealized |
| Number of | Settlement | Appreciation |
Futures Contracts | Long Contracts | Value | (Depreciation) |
Russell 2000 Index | 434 | 167,307 | 4,270 |
E-mini NASDAQ 100 Index | 712 | 24,817 | 65 |
E-mini Russell 2000 Index | 34 | 2,621 | (28) |
Unrealized appreciation (depreciation) on open futures contracts is required to be treated as realized gain (loss) for tax purposes.
F. During the year ended October 31, 2006, the fund purchased $10,993,854,000 of investment securities and sold $10,726,991,000 of investment securities, other than temporary cash investments.
G. The market value of securities on loan to broker-dealers at October 31, 2006, was $118,545,000, for which the fund received cash collateral of $123,763,000.
H. Capital share transactions for each class of shares were:
| | | Year Ended October 31, |
| | 2006 | | | 2005 |
| Amount | Shares | | Amount | Shares |
| ($000) | (000) | ($000) | (000) |
Investor Shares | | | | |
Issued | 1,425,082 | 17,937 | 1,728,503 | 23,376 |
Issued in Lieu of Cash Distributions | 648,833 | 8,577 | 7,866 | 106 |
Redeemed | (1,772,507) | (22,598) | (2,255,073) | (30,239) |
Net Increase (Decrease)—Investor Shares | 301,408 | 3,916 | (518,704) | (6,757) |
Admiral Shares | | | | |
Issued | 1,219,648 | 16,488 | 1,422,697 | 20,258 |
Issued in Lieu of Cash Distributions | 207,776 | 2,951 | 1,242 | 18 |
Redeemed | (684,941) | (9,428) | (363,435) | (5,277) |
Net Increase (Decrease)—Admiral Shares | 742,483 | 10,011 | 1,060,504 | 14,999 |
I.In June 2006, the Financial Accounting Standards Board issued Interpretation No. 48 (“FIN 48”), “Accounting for Uncertainty in Income Taxes.” FIN 48 establishes the minimum threshold for recognizing, and a system for measuring, the benefits of tax-return positions in financial statements. FIN 48 will be effective for the fund’s fiscal year beginning November 1, 2007. Management is in the process of analyzing the fund’s tax positions for purposes of implementing FIN 48; based on the analysis completed to date, management does not believe the adoption of FIN 48 will result in any material impact to the fund’s financial statements.
27
Report of Independent Registered Public Accounting Firm
To the Trustees and Shareholders of Vanguard Explorer Fund:
In our opinion, the accompanying statement of net assets—investments summary and the related statements of operations and of changes in net assets and the financial highlights present fairly, in all material respects, the financial position of Vanguard Explorer Fund (the “Fund”) at October 31, 2006, the results of its operations for the year then ended, the changes in its net assets for each of the two years in the period then ended and the financial highlights for each of the periods indicated, in conformity with accounting principles generally accepted in the United States of America. These financial statements and financial highlights (hereafter referred to as “financial statements”) are the responsibility of the Fund’s management; our responsibility is to express an opinion on these financial statements based on our audits. We conducted our audits of these financial statements in accordance with the standards of the Public Company Accounting Oversight Board (United States). Those standards require that we plan and perform the audit to obtain reasonable assurance about whether the financial statements are free of material misstatement. An audit includes examining, on a test basis, evidence supporting the amounts and disclosures in the financial statements, assessing the accounting principles used and significant estimates made by management, and evaluating the overall financial statement presen-tation. We believe that our audits, which included confirmation of securities at October 31, 2006 by correspondence with the custodians and brokers, provide a reasonable basis for our opinion.
PricewaterhouseCoopers LLP
Philadelphia, Pennsylvania
December 18, 2006
Special 2006 tax information (unaudited) for Vanguard Explorer Fund
This information for the fiscal year ended October 31, 2006, is included pursuant to provisions of the Internal Revenue Code.
The fund distributed $769,821,000 as capital gain dividends (from net long-term capital gains) to shareholders during the fiscal year.
The fund distributed $44,869,000 of qualified dividend income to shareholders during the fiscal year.
For corporate shareholders, 27.9% of investment income (dividend income plus short-term gains, if any) qualifies for the dividends-received deduction.
28
Your Fund’s After-Tax Returns
This table presents returns for your fund both before and after taxes. The after-tax returns are shown in two ways: (1) assuming that an investor owned the fund during the entire period and paid taxes on the fund’s distributions, and (2) assuming that an investor paid taxes on the fund’s distributions and sold all shares at the end of each period.
Calculations are based on the highest individual federal income tax and capital gains tax rates in effect at the times of the distributions and the hypothetical sales. State and local taxes were not considered. After-tax returns reflect any qualified dividend income, using actual prior-year figures and estimates for 2006. (In the example, returns after the sale of fund shares may be higher than those assuming no sale. This occurs when the sale would have produced a capital loss. The calculation assumes that the investor received a tax deduction for the loss.)
The table shows returns for Investor Shares only; returns for other share classes will differ. Please note that your actual after-tax returns will depend on your tax situation and may differ from those shown. Also note that if you own the fund in a tax-deferred account, such as an individual retirement account or a 401(k) plan, this information does not apply to you. Such accounts are not subject to current taxes.
Finally, keep in mind that a fund’s performance—whether before or after taxes—does not guarantee future results.
Average Annual Total Returns: Explorer Fund Investor Shares | | | |
Periods Ended October 31, 2006 | | | |
| One | Five | Ten |
| Year | Years | Years |
Returns Before Taxes | 13.59% | 10.97% | 10.26% |
Returns After Taxes on Distributions | 11.84 | 10.60 | 8.54 |
Returns After Taxes on Distributions and Sale of Fund Shares | 10.05 | 9.45 | 8.05 |
29
About Your Fund’s Expenses
As a shareholder of the fund, you incur ongoing costs, which include costs for portfolio management, administrative services, and shareholder reports (like this one), among others. Operating expenses, which are deducted from a fund’s gross income, directly reduce the investment return of the fund.
A fund’s expenses are expressed as a percentage of its average net assets. This figure is known as the expense ratio. The following examples are intended to help you understand the ongoing costs (in dollars) of investing in your fund and to compare these costs with those of other mutual funds. The examples are based on an investment of $1,000 made at the beginning of the period shown and held for the entire period.
The table below illustrates your fund’s costs in two ways:
• Based on actual fund return. This section helps you to estimate the actual expenses that you paid over the period. The “Ending Account Value” shown is derived from the fund’s actual return, and the third column shows the dollar amount that would have been paid by an investor who started with $1,000 in the fund. You may use the information here, together with the amount you invested, to estimate the expenses that you paid over the period.
To do so, simply divide your account value by $1,000 (for example, an $8,600 account value divided $1,000 = 8.6), then multiply the result by the number given for your fund under the heading “Expenses Paid During Period.”
• Based on hypothetical 5% yearly return. This section is intended to help you compare your fund’s costs with those of other mutual funds. It assumes that the fund had a yearly return of 5% before expenses, but that the expense ratio is unchanged. In this case—because the return used is not the fund’s actual return—the results do not apply to your investment. The example is useful in making comparisons because the Securities and Exchange Commission requires all mutual funds to calculate expenses based on a 5% return. You can assess your fund’s costs by comparing this hypothetical example with the hypothetical examples that appear in shareholder reports of other funds.
Six Months Ended October 31, 2006 | | | |
| Beginning | Ending | Expenses |
| Account Value | Account Value | Paid During |
Explorer Fund | 4/30/2006 | 10/31/2006 | Period1 |
Based on Actual Fund Return | | | |
Investor Shares | $1,000.00 | $957.64 | $2.22 |
Admiral Shares | 1,000.00 | 958.49 | 1.33 |
Based on Hypothetical 5% Yearly Return | | | |
Investor Shares | $1,000.00 | $1,022.94 | $2.29 |
Admiral Shares | 1,000.00 | 1,023.84 | 1.38 |
1 | The calculations are based on expenses incurred in the most recent six-month period. The fund’s annualized six-month expense ratios for that period are 0.45% for Investor Shares and 0.27% for Admiral Shares. The dollar amounts shown as “Expenses Paid” are equal to the annualized expense ratio multiplied by the average account value over the period, multiplied by the number of days in the most recent six-month period, then divided by the number of days in the most recent 12-month period. |
30
Note that the expenses shown in the table on page 30 are meant to highlight and help you compare ongoing costs only and do not reflect any transactional costs or account maintenance fees. They do not include your fund’s low-balance fee, which is described in the prospectus. If this fee were applied to your account, your costs would be higher. Your fund does not charge transaction fees, such as purchase or redemption fees, nor does it carry a “sales load.”
The calculations assume no shares were bought or sold during the period. Your actual costs may have been higher or lower, depending on the amount of your investment and the timing of any purchases or redemptions.
You can find more information about the fund’s expenses, including annual expense ratios, in the Financial Statements section of this report. For additional information on operating expenses and other shareholder costs, please refer to the appropriate fund prospectus.
31
Glossary
Beta. A measure of the magnitude of a fund’s past share-price fluctuations in relation to the ups and downs of a given market index. The index is assigned a beta of 1.00. Compared with a given index, a fund with a beta of 1.20 typically would have seen its share price rise or fall by 12% when the index rose or fell by 10%. A fund’s beta should be reviewed in conjunction with its R-squared (see definition below). The lower the R-squared, the less correlation there is between the fund and the index, and the less reliable beta is as an indicator of volatility.
Earnings Growth Rate. The average annual rate of growth in earnings over the past five years for the stocks now in a fund.
Expense Ratio. The percentage of a fund’s average net assets used to pay its annual administrative and advisory expenses. These expenses directly reduce returns to investors.
Foreign Holdings. The percentage of a fund represented by stocks or depositary receipts of companies based outside the United States.
Median Market Cap. An indicator of the size of companies in which a fund invests; the midpoint of market capitalization (market price x shares outstanding) of a fund’s stocks, weighted by the proportion of the fund’s assets invested in each stock. Stocks representing half of the fund’s assets have market capitalizations above the median, and the rest are below it.
Price/Book Ratio. The share price of a stock divided by its net worth, or book value, per share. For a fund, the weighted average price/book ratio of the stocks it holds.
Price/Earnings Ratio. The ratio of a stock’s current price to its per-share earnings over the past year. For a fund, the weighted average P/E of the stocks it holds. P/E is an indicator of market expectations about corporate prospects; the higher the P/E, the greater the expectations for a company’s future growth.
R-Squared. A measure of how much of a fund’s past returns can be explained by the returns from the market in general, as measured by a given index. If a fund’s total returns were precisely synchronized with an index’s returns, its R-squared would be 1.00. If the fund’s returns bore no relationship to the index’s returns, its R-squared would be 0.
Return on Equity. The annual average rate of return generated by a company during the past five years for each dollar of shareholder’s equity (net income divided by shareholder’s equity). For a fund, the weighted average return on equity for the companies whose stocks it holds.
Short-Term Reserves. The percentage of a fund invested in highly liquid, short-term securities that can be readily converted to cash.
Turnover Rate. An indication of the fund’s trading activity. Funds with high turnover rates incur higher transaction costs and may be more likely to distribute capital gains (which may be taxable to investors). The turnover rate excludes in-kind transactions, which have minimal impact on costs.
Yield. A snapshot of a fund’s income from interest and dividends. The yield, expressed as a percentage of the fund’s net asset value, is based on income earned over the past 30 days and is annualized, or projected forward for the coming year. The index yield is based on the current annualized rate of income provided by securities in the index.
32
This page intentionally left blank.
This page intentionally left blank.
This page intentionally left blank.
The People Who Govern Your Fund
The trustees of your mutual fund are there to see that the fund is operated and managed in your best interests since, as a shareholder, you are a part owner of the fund. Your fund’s trustees also serve on the board of directors of The Vanguard Group, Inc., which is owned by the Vanguard funds and provides services to them on an at-cost basis.
A majority of Vanguard’s board members are independent, meaning that they have no affiliation with Vanguard or the funds they oversee, apart from the sizable personal investments they have made as private individuals.
Our independent board members bring distinguished backgrounds in business, academia, and public service to their task of working with Vanguard officers to establish the policies and oversee the activities of the funds. Among board members’ responsibilities are selecting investment advisors for the funds; monitoring fund operations, performance, and costs; reviewing contracts; nominating and selecting new trustees/directors; and electing Vanguard officers.
Each trustee serves a fund until its termination; or until the trustee’s retirement, resignation, or death; or otherwise as specified in the fund’s organizational documents. Any trustee may be removed at a shareholders’ meeting by a vote representing two-thirds of the net asset value of all shares of the fund together with shares of other Vanguard funds organized within the same trust. The table on these two pages shows information for each trustee and executive officer of the fund. The mailing address of the trustees and officers is P.O. Box 876, Valley Forge, PA 19482.
Chairman of the Board, Chief Executive Officer, and Trustee |
| |
John J. Brennan1 | |
Born 1954 | Principal Occupation(s) During the Past Five Years: Chairman of the Board, Chief |
Trustee since May 1987; | Executive Officer, and Director/Trustee of The Vanguard Group, Inc., and of each |
Chairman of the Board and | of the investment companies served by The Vanguard Group. |
Chief Executive Officer | |
144 Vanguard Funds Overseen |
| |
Independent Trustees | |
| |
Charles D. Ellis | |
Born 1937 | Principal Occupation(s) During the Past Five Years: Applecore Partners (pro bono ventures |
Trustee since January 2001 | in education); Senior Advisor to Greenwich Associates (international business strategy |
144 Vanguard Funds Overseen | consulting); Successor Trustee of Yale University; Overseer of the Stern School of Business |
| at New York University; Trustee of the Whitehead Institute for Biomedical Research. |
| |
Rajiv L. Gupta | |
Born 1945 | Principal Occupation(s) During the Past Five Years: Chairman and Chief Executive Officer |
Trustee since December 20012 | of Rohm and Haas Co. (chemicals); Board Member of the American Chemistry Council; |
144 Vanguard Funds Overseen | Director of Tyco International, Ltd. (diversified manufacturing and services) (since 2005); |
| Trustee of Drexel University and of the Chemical Heritage Foundation. |
| |
Amy Gutmann | |
Born 1949 | Principal Occupation(s) During the Past Five Years: President of the University of |
Trustee since June 2006 | Pennsylvania since 2004; Professor in the School of Arts and Sciences, Annenberg School |
144 Vanguard Funds Overseen | for Communication, and Graduate School of Education of the University of Pennsylvania |
| since 2004; Provost (2001–2004) and Laurance S. Rockefeller Professor of Politics and the |
| University Center for Human Values (1990–2004), Princeton University; Director of Carnegie |
| Corporation of New York and of Philadelphia 2016 (since 2005) and of Schuylkill River |
| Development Corporation and Greater Philadelphia Chamber of Commerce (since 2004). |
JoAnn Heffernan Heisen | |
Born 1950 | Principal Occupation(s) During the Past Five Years: Corporate Vice President and Chief |
Trustee since July 1998 | Global Diversity Officer (since January 2006), Vice President and Chief Information |
144 Vanguard Funds Overseen | Officer (1997–2005), and Member of the Executive Committee of Johnson & Johnson |
| (pharmaceuticals/consumer products); Director of the University Medical Center at |
| Princeton and Women’s Research and Education Institute. |
| |
André F. Perold | |
Born 1952 | Principal Occupation(s) During the Past Five Years: George Gund Professor of Finance and |
Trustee since December 2004 | Banking, Harvard Business School (since 2000); Senior Associate Dean, Director of Faculty |
144 Vanguard Funds Overseen | Recruiting, and Chair of Finance Faculty, Harvard Business School; Director and Chairman |
| of UNX, Inc. (equities trading firm) (since 2003); Director of registered investment |
| companies advised by Merrill Lynch Investment Managers and affiliates (1985–2004), |
| Genbel Securities Limited (South African financial services firm) (1999–2003), Gensec |
| Bank (1999–2003), Sanlam, Ltd. (South African insurance company) (2001–2003), and |
| Stockback, Inc. (credit card firm) (2000–2002). |
| |
Alfred M. Rankin, Jr. | |
Born 1941 | Principal Occupation(s) During the Past Five Years: Chairman, President, Chief Executive |
Trustee since January 1993 | Officer, and Director of NACCO Industries, Inc. (forklift trucks/housewares/ lignite); |
144 Vanguard Funds Overseen | Director of Goodrich Corporation (industrial products/aircraft systems and services). |
| |
J. Lawrence Wilson | |
Born 1936 | Principal Occupation(s) During the Past Five Years: Retired Chairman and Chief Executive |
Trustee since April 1985 | Officer of Rohm and Haas Co. (chemicals); Director of Cummins Inc. (diesel engines), |
144 Vanguard Funds Overseen | MeadWestvaco Corp. (packaging products), and AmerisourceBergen Corp. (pharmaceutical |
| distribution); Trustee of Vanderbilt University and of Culver Educational Foundation. |
| |
Executive Officers1 | |
| |
Heidi Stam | |
Born 1956 | Principal Occupation(s) During the Past Five Years: Principal of The Vanguard Group, Inc., |
Secretary since July 2005 | since November 1997; General Counsel of The Vanguard Group since July 2005; |
144 Vanguard Funds Overseen | Secretary of The Vanguard Group and of each of the investment companies served |
| by The Vanguard Group since July 2005. |
| |
Thomas J. Higgins | |
Born 1957 | Principal Occupation(s) During the Past Five Years: Principal of The Vanguard Group, Inc.; |
Treasurer since July 1998 | Treasurer of each of the investment companies served by The Vanguard Group. |
144 Vanguard Funds Overseen | |
| |
Vanguard Senior Management Team |
| |
R. Gregory Barton | Kathleen C. Gubanich | Michael S. Miller |
Mortimer J. Buckley | Paul A. Heller | Ralph K. Packard |
James H. Gately | F. William McNabb, III | George U. Sauter |
| |
Founder | |
| |
John C. Bogle | |
Chairman and Chief Executive Officer, 1974–1996 |
1 Officers of the funds are “interested persons” as defined in the Investment Company Act of 1940.
2 December 2002 for Vanguard Equity Income Fund, Vanguard Growth Equity Fund, the Vanguard Municipal Bond Funds, and the Vanguard State Tax-Exempt Funds.
More information about the trustees is in the Statement of Additional Information, available from The Vanguard Group.
| 
|
| P.O. Box 2600 |
| Valley Forge, PA 19482-2600 |
Connect with Vanguard™ > www.vanguard.com
Fund Information > 800-662-7447 | Vanguard, Connect with Vanguard, VIPER, and the ship |
| logo are trademarks of The Vanguard Group, Inc. |
Direct Investor Account Services > 800-662-2739 | |
| All other marks are the exclusive property of their |
Institutional Investor Services > 800-523-1036 | respective owners. |
| |
Text Telephone > 800-952-3335 | All comparative mutual fund data are from Lipper Inc. |
| or Morningstar, Inc., unless otherwise noted. |
| |
| |
| |
| |
This material may be used in conjunction | You can obtain a free copy of Vanguard’s proxy voting |
with the offering of shares of any Vanguard | guidelines by visiting our website, www.vanguard.com, |
fund only if preceded or accompanied by | and searching for “proxy voting guidelines,” or by calling |
the fund’s current prospectus. | Vanguard at 800-662-2739. They are also available from |
| the SEC’s website, www.sec.gov. In addition, you may |
| obtain a free report on how your fund voted the proxies for |
| securities it owned during the 12 months ended June 30. |
| To get the report, visit either www.vanguard.com |
| or www.sec.gov. |
| |
| You can review and copy information about your fund |
| at the SEC’s Public Reference Room in Washington, D.C. |
| To find out more about this public service, call the SEC |
| at 202-551-8090. Information about your fund is also |
| available on the SEC’s website, and you can receive |
| copies of this information, for a fee, by sending a |
| request in either of two ways: via e-mail addressed to |
| publicinfo@sec.gov or via regular mail addressed to the |
| Public Reference Section, Securities and Exchange |
| Commission, Washington, DC 20549-0102. |
| |
| |
| |
| |
| © 2006 The Vanguard Group, Inc. |
| All rights reserved. |
| Vanguard Marketing Corporation, Distributor. |
| |
| Q240 122006 |
Item 4: Principal Accountant Fees and Services.
(a) Audit Fees.
(b) Audit-Related Fees.
Includes fees billed in connection with assurance and related services provided to the Registrant, The Vanguard Group, Inc., Vanguard Marketing Corporation, and other registered investment companies in the Vanguard Group.
(c) Tax Fees.
Includes fees billed in connection with tax compliance, planning and advice services provided to the Registrant, The Vanguard Group, Inc., Vanguard Marketing Corporation, and other registered investment companies in the Vanguard Group and related to income and excise taxes.
(d) All Other Fees.
Includes fees billed for services related to risk management and privacy matters. Services were provided to the Registrant, The Vanguard Group, Inc., Vanguard Marketing Corporation, and other registered investment companies in the Vanguard Group.
(e) (1) Pre-Approval Policies. The policy of the Registrant’s Audit Committee is to consider and, if appropriate, approve before the principal accountant is engaged for such services, all specific audit and non-audit services provided to: (1) the Registrant; (2) The Vanguard Group, Inc.; (3) other entities controlled by The Vanguard Group, Inc. that provide ongoing services to the Registrant; and (4) other registered investment companies in the Vanguard Group. In making a determination, the Audit Committee considers whether the services are consistent with maintaining the principal accountant’s independence.
In the event of a contingency situation in which the principal accountant is needed to provide services in between scheduled Audit Committee meetings, the Chairman of the Audit Committee would be called on to consider and, if appropriate, pre-approve audit or permitted non-audit services in an amount sufficient to complete services through the next Audit Committee meeting, and to determine if such services would be consistent with maintaining the accountant’s independence. At the next scheduled Audit Committee meeting, services and fees would be presented to the Audit Committee for formal consideration, and, if appropriate, approval by the entire Audit Committee. The Audit Committee would again consider whether such services and fees are consistent with maintaining the principal accountant’s independence.
The Registrant’s Audit Committee is informed at least annually of all audit and non-audit services provided by the principal accountant to the Vanguard complex, whether such services are provided to: (1) the Registrant; (2) The Vanguard Group, Inc.; (3) other entities controlled by The Vanguard Group, Inc. that provide ongoing services to the Registrant; or other registered investment companies in the Vanguard Group.
(2) No percentage of the principal accountant’s fees or services were approved pursuant to the waiver provision of paragraph (c)(7)(i)(C) of Rule 2-01 of Regulation S-X.
(g) Aggregate Non-Audit Fees.
Includes fees billed for non-audit services provided to the Registrant, The Vanguard Group, Inc., Vanguard Marketing Corporation, and other registered investment companies in the Vanguard Group.
(h) For the most recent fiscal year, the Audit Committee has determined that the provision of all non-audit services was consistent with maintaining the principal accountant’s independence.
| Explorer Fund | Shares | Market
Value
($000)
|
|---|
|
| Common Stocks (96.6%)1 | | |
|
| Consumer Discretionary (18.0%) |
| Auto Components (0.5%) |
| * TRW Automotive Holdings Corp. | 738,800 | 18,950 |
| * Tenneco Automotive, Inc. | 706,800 | 16,044 |
| * The Goodyear Tire &Rubber Co. | 826,103 | 12,664 |
| ArvinMeritor, Inc. | 168,400 | 2,529 |
| Modine Manufacturing Co. | 67,200 | 1,600 |
| Bandag, Inc. | 33,500 | 1,470 |
| * Drew Industries, Inc. | 51,700 | 1,404 |
| BorgWarner, Inc. | 18,900 | 1,087 |
| Noble International, Ltd. | 14,670 | 261 |
| Automobiles (0.3%) |
| Thor Industries, Inc. | 661,400 | 28,983 |
| ^ Winnebago Industries, Inc. | 272,400 | 9,068 |
| Distributors (0.1%) |
| * Keystone Automotive Industries, Inc. | 246,200 | 9,469 |
| Diversified Consumer Services (1.2%) |
| * ITT Educational Services, Inc. | 491,400 | 33,882 |
| * Laureate Education Inc. | 404,035 | 21,301 |
| Service Corp. International | 1,684,250 | 15,360 |
| * DeVry, Inc. | 511,975 | 12,467 |
| Sotheby's | 303,822 | 11,545 |
| * Career Education Corp. | 364,352 | 8,118 |
| ServiceMaster Co. | 694,900 | 7,873 |
| Jackson Hewitt Tax Service Inc. | 226,700 | 7,844 |
| ^ Pre-Paid Legal Services, Inc. | 159,700 | 6,779 |
| * Bright Horizons Family Solutions, Inc. | 117,721 | 4,523 |
| * Steiner Leisure Ltd. | 80,015 | 3,652 |
| Matthews International Corp. | 73,800 | 2,835 |
| Regis Corp. | 67,300 | 2,527 |
| * Vertrue Inc. | 13,000 | 585 |
| * Lincoln Educational Services | 23,427 | 391 |
| Hotels, Restaurants &Leisure (2.5%) |
| Brinker International, Inc. | 580,500 | 26,953 |
| * Papa John's International, Inc. | 604,333 | 22,179 |
| * Rare Hospitality International Inc. | 697,765 | 21,987 |
| * Penn National Gaming, Inc. | 521,842 | 19,084 |
| * Life Time Fitness, Inc. | 359,275 | 18,513 |
| Ruby Tuesday, Inc. | 490,300 | 13,606 |
| * Ruth's Chris Steak House | 613,100 | 12,072 |
| Applebee's International, Inc. | 455,961 | 10,405 |
| * Gaylord Entertainment Co. | 210,400 | 9,792 |
| * Texas Roadhouse, Inc. | 596,188 | 8,615 |
| CBRL Group, Inc. | 186,551 | 8,191 |
| * Sonic Corp. | 347,025 | 7,895 |
| * Scientific Games Corp. | 274,920 | 7,706 |
| Orient-Express Hotel Ltd. | 192,350 | 7,588 |
| * Panera Bread Co. | 122,670 | 7,581 |
| * O'Charley's Inc. | 379,100 | 7,540 |
| Hilton Hotels Corp. | 220,940 | 6,390 |
| Choice Hotel International, Inc. | 146,900 | 6,158 |
| * CEC Entertainment Inc. | 171,750 | 5,920 |
| Domino's Pizza, Inc. | 214,851 | 5,840 |
| * P.F. Chang's China Bistro, Inc. | 131,600 | 5,504 |
| * Fortune Brands, Inc. | 177,700 | 5,377 |
| * Burger King Holdings Inc. | 313,230 | 5,256 |
| Tim Hortons, Inc. | 177,510 | 5,130 |
| * McCormick &Schmick's Seafood Restaurants, Inc. | 188,700 | 4,961 |
| * Red Robin Gourmet Burgers, Inc. | 98,475 | 4,750 |
| Dover Downs Gaming &Entertainment, Inc. | 272,850 | 3,866 |
| IHOP Corp. | 73,300 | 3,824 |
| * Chipotle Mexican Grill, Inc. | 65,000 | 3,796 |
| OSI Restaurant Partners, Inc. | 107,700 | 3,583 |
| International Game Technology | 77,525 | 3,296 |
| * Jack in the Box Inc. | 53,900 | 3,024 |
| * WMS Industries, Inc. | 84,368 | 2,981 |
| Darden Restaurants Inc. | 51,500 | 2,158 |
| CKE Restaurants Inc. | 86,400 | 1,688 |
| * Morton's Restaurant Group Inc. | 72,500 | 1,174 |
| * MTR Gaming Group Inc. | 107,000 | 1,137 |
| * Denny's Corp. | 206,070 | 876 |
| Station Casinos, Inc. | 5,400 | 326 |
| Household Durables (1.4%) |
| * Helen of Troy Ltd. | 914,300 | 22,501 |
| * NVR, Inc. | 39,450 | 22,151 |
| Harman International Industries, Inc. | 157,325 | 16,102 |
| Ethan Allen Interiors, Inc. | 401,200 | 14,291 |
| Tenma Corp. | 773,000 | 13,129 |
| Ryland Group, Inc. | 231,600 | 10,637 |
| ^ Garmin Ltd. | 149,200 | 7,969 |
| MDC Holdings, Inc. | 137,909 | 6,876 |
| Kimball International, Inc. Class B | 266,600 | 6,625 |
| * ^ Tempur-Pedic International Inc. | 328,300 | 6,481 |
| Fortune Brands, Inc. | 61,115 | 4,703 |
| Beazer Homes USA, Inc. | 108,400 | 4,698 |
| * Champion Enterprises, Inc. | 484,400 | 4,486 |
| M/I Homes, Inc. | 108,900 | 3,912 |
| Tupperware Corp. | 176,900 | 3,756 |
| KB Home | 82,400 | 3,703 |
| The Yankee Candle Co., Inc. | 100,100 | 3,388 |
| ^ Brookfield Homes Corp. | 96,920 | 3,145 |
| * Hovnanian Enterprises Inc. Class A | 100,400 | 3,097 |
| Standard Pacific Corp. | 86,000 | 2,084 |
| * Interface, Inc. | 99,751 | 1,451 |
| Blyth, Inc. | 30,800 | 737 |
| Leggett &Platt, Inc. | 22,200 | 518 |
| The Stanley Works | 7,500 | 357 |
| Internet &Catalog Retail (0.9%) |
| * VistaPrint Ltd. | 1,022,020 | 31,969 |
| * priceline.com, Inc. | 624,500 | 25,161 |
| * Coldwater Creek Inc. | 801,861 | 24,449 |
| * PetMed Express, Inc. | 582,300 | 7,279 |
| * Hollywood Media Corp. | 1,561,823 | 6,575 |
| * IAC/InterActiveCorp | 173,180 | 5,365 |
| Leisure Equipment &Products (0.5%) |
| SCP Pool Corp. | 733,000 | 30,038 |
| * MarineMax, Inc. | 267,733 | 7,633 |
| Oakley, Inc. | 280,300 | 5,208 |
| Polaris Industries, Inc. | 90,800 | 3,888 |
| * JAKKS Pacific, Inc. | 175,700 | 3,811 |
| Brunswick Corp. | 100,300 | 3,160 |
| * Marvel Entertainment, Inc. | 19,700 | 499 |
| Media (2.0%) |
| * Lamar Advertising Co. Class A | 656,260 | 37,853 |
| * DreamWorks Animation SKG, Inc. | 1,017,167 | 26,904 |
| Harte-Hanks, Inc. | 789,300 | 19,930 |
| Catalina Marketing Corp. | 750,600 | 19,028 |
| * TiVo Inc. | 2,935,400 | 18,757 |
| * LodgeNet Entertainment Corp. | 749,129 | 17,230 |
| * Charter Communications, Inc. | 7,300,600 | 16,791 |
| ADVO, Inc. | 434,800 | 12,766 |
| * Harris Interactive Inc. | 1,640,674 | 10,960 |
| Warner Music Group Corp. | 327,886 | 8,502 |
| * Morningstar, Inc. | 203,471 | 8,326 |
| John Wiley &Sons Class A | 217,900 | 7,692 |
| Meredith Corp. | 138,800 | 7,287 |
| Dow Jones &Co., Inc. | 119,500 | 4,193 |
| * Interpublic Group of Cos., Inc. | 329,600 | 3,596 |
| World Wrestling Entertainment, Inc. | 154,500 | 2,576 |
| * RCN Corp. | 87,991 | 2,541 |
| * Valassis Communications, Inc. | 154,600 | 2,321 |
| * Gemstar-TV Guide International, Inc. | 624,971 | 2,175 |
| The McClatchy Co. Class A | 48,700 | 2,111 |
| Sinclair Broadcast Group, Inc. | 232,300 | 2,095 |
| * Spanish Broadcasting System, Inc. | 432,726 | 2,034 |
| Regal Entertainment Group Class A | 66,890 | 1,387 |
| Martha Stewart Living Omnimedia, Inc. | 54,700 | 1,160 |
| * XM Satellite Radio Holdings, Inc. | 54,300 | 633 |
| Courier Corp. | 8,081 | 317 |
| Value Line, Inc. | 2,100 | 112 |
| Multiline Retail (0.7%) |
| Family Dollar Stores, Inc. | 1,360,346 | 40,062 |
| * Dollar Tree Stores, Inc. | 1,157,764 | 35,995 |
| Golden Eagle Retail Group Ltd. | 11,034,000 | 7,285 |
| * ^ Conn's, Inc. | 159,800 | 3,838 |
| Speciality Retail (6.2%) |
| * O'Reilly Automotive, Inc. | 2,561,950 | 82,725 |
| American Eagle Outfitters, Inc. | 1,332,201 | 61,015 |
| * Hibbett Sporting Goods, Inc. | 1,027,498 | 30,044 |
| * AnnTaylor Stores Corp. | 656,700 | 28,908 |
| Claire's Stores, Inc. | 915,500 | 25,954 |
| * Guess ?, Inc. | 452,700 | 25,781 |
| * Tween Brands, Inc. | 586,220 | 24,516 |
| * Charming Shoppes, Inc. | 1,581,966 | 23,413 |
| * The Gymboree Corp. | 486,100 | 22,584 |
| * The Dress Barn, Inc. | 1,006,700 | 21,866 |
| * Tractor Supply Co. | 445,305 | 21,562 |
| Men's Wearhouse, Inc. | 538,603 | 21,463 |
| Aaron Rents, Inc. | 791,890 | 19,702 |
| Ross Stores, Inc. | 659,297 | 19,403 |
| Borders Group, Inc. | 894,000 | 18,408 |
| * Genesco, Inc. | 482,000 | 18,109 |
| United Auto Group, Inc. | 747,700 | 17,182 |
| * ^ Select Comfort Corp. | 751,976 | 16,077 |
| * CarMax, Inc. | 351,100 | 15,554 |
| * Guitar Center, Inc. | 334,630 | 14,513 |
| * Payless ShoeSource, Inc. | 514,900 | 13,774 |
| Advance Auto Parts, Inc. | 391,884 | 13,724 |
| Williams-Sonoma, Inc. | 375,900 | 12,784 |
| * DSW Inc. Class A | 359,537 | 12,440 |
| Circuit City Stores, Inc. | 452,900 | 12,219 |
| * GameStop Corp. Class A | 214,815 | 10,968 |
| * Aeropostale, Inc. | 369,000 | 10,815 |
| Group 1 Automotive, Inc. | 186,900 | 10,711 |
| * Rent-A-Center, Inc. | 370,400 | 10,653 |
| * Build-A-Bear-Workshop, Inc. | 302,500 | 8,827 |
| * Charlotte Russe Holding Inc. | 319,058 | 8,822 |
| * The Children's Place Retail Stores, Inc. | 120,400 | 8,451 |
| PETsMART, Inc. | 277,430 | 7,984 |
| bebe stores, inc | 276,000 | 6,853 |
| Tiffany &Co. | 191,050 | 6,824 |
| Abercrombie &Fitch Co. | 75,100 | 5,757 |
| Barnes &Noble, Inc. | 131,854 | 5,447 |
| * The Wet Seal, Inc. Class A | 865,308 | 5,400 |
| Christopher &Banks Corp. | 197,900 | 5,341 |
| * Pacific Sunwear of California, Inc. | 269,075 | 4,741 |
| Cato Corp. Class A | 204,400 | 4,679 |
| RadioShack Corp. | 223,800 | 3,993 |
| * Urban Outfitters, Inc. | 209,485 | 3,666 |
| Talbots Inc. | 129,200 | 3,623 |
| Lithia Motors, Inc. | 97,800 | 2,494 |
| * ^ Citi Trends Inc. | 52,100 | 2,044 |
| * Zumiez Inc. | 30,400 | 999 |
| * Jos. A. Bank Clothiers, Inc. | 27,300 | 811 |
| The Buckle, Inc. | 13,700 | 542 |
| Stein Mart, Inc. | 30,100 | 493 |
| * Dick's Sporting Goods, Inc. | 9,200 | 458 |
| Textiles, Apparel &Luxury Goods (1.6%) |
| Phillips-Van Heusen Corp. | 865,300 | 39,596 |
| * Quiksilver, Inc. | 1,439,900 | 20,087 |
| Polo Ralph Lauren Corp. | 243,070 | 17,258 |
| * Carter's, Inc. | 580,470 | 16,387 |
| K-Swiss, Inc. | 448,495 | 15,841 |
| Steven Madden, Ltd. | 301,500 | 13,007 |
| * Deckers Outdoor Corp. | 184,500 | 9,810 |
| * Columbia Sportswear Co. | 172,600 | 9,638 |
| Liz Claiborne, Inc. | 222,800 | 9,395 |
| * Timberland Co. | 264,000 | 7,616 |
| * Iconix Brand Group Inc. | 330,000 | 6,151 |
| * Volcom, Inc. | 159,535 | 5,226 |
| Oxford Industries, Inc. | 99,000 | 5,225 |
| * Fossil, Inc. | 230,150 | 5,026 |
| Wolverine World Wide, Inc. | 175,200 | 4,969 |
| * Skechers U.S.A., Inc. | 125,500 | 3,751 |
| ^ Charles &Colvard Ltd. | 181,125 | 1,617 |
| Kenneth Cole Productions, Inc. | 60,300 | 1,533 |
|
|
| | | 2,115,471 |
|
|
| Consumer Staples (2.1%) |
| * Energizer Holdings, Inc. | 387,350 | 30,271 |
| * Central Garden and Pet Co. | 443,280 | 22,151 |
| Nu Skin Enterprises, Inc. | 890,800 | 17,032 |
| Alberto-Culver Co. Class B | 314,500 | 15,980 |
| Tyson Foods, Inc. | 1,099,800 | 15,892 |
| * Performance Food Group Co. | 478,500 | 13,910 |
| * The Pantry, Inc. | 232,602 | 12,695 |
| * Hansen Natural Corp. | 378,300 | 12,011 |
| * NBTY, Inc. | 415,548 | 11,561 |
| Brown-Forman Corp. Class B | 135,400 | 9,775 |
| Longs Drug Stores, Inc. | 208,690 | 8,982 |
| Flowers Foods, Inc. | 319,000 | 8,667 |
| MGP Ingredients, Inc. | 323,000 | 7,251 |
| McCormick &Co., Inc. | 187,000 | 6,994 |
| The Great Atlantic &Pacific Tea Co., Inc. | 225,200 | 6,231 |
| Andersons, Inc. | 138,000 | 4,961 |
| Estee Lauder Cos. Class A | 109,500 | 4,423 |
| * ^ Wild Oats Markets Inc. | 222,573 | 4,002 |
| * BJ's Wholesale Club, Inc. | 133,900 | 3,836 |
| * Jones Soda Co. Private Placement | 387,800 | 3,816 |
| * ^ Bare Escentuals, Inc. | 121,470 | 3,721 |
| Church &Dwight, Inc. | 91,300 | 3,704 |
| Lancaster Colony Corp. | 86,281 | 3,499 |
| * Smithfield Foods, Inc. | 109,600 | 2,946 |
| Corn Products International, Inc. | 77,900 | 2,819 |
| Vector Group Ltd. | 117,668 | 2,017 |
| * Pathmark Stores, Inc. | 192,400 | 1,949 |
| * Ralcorp Holdings, Inc. | 34,100 | 1,686 |
| * Playtex Products, Inc. | 104,900 | 1,462 |
| Seaboard Corp. | 951 | 1,343 |
| Sanderson Farms, Inc. | 43,400 | 1,151 |
| ^ National Beverage Corp. | 75,700 | 867 |
| ^ Mannatech, Inc. | 42,300 | 664 |
| Alico, Inc. | 8,400 | 521 |
| Spartan Stores, Inc. | 19,100 | 395 |
|
|
| | | 249,185 |
|
|
| Energy (5.4%) |
| * Helix Energy Solutions Group, Inc. | 1,353,200 | 43,708 |
| St. Mary Land &Exploration Co. | 1,003,300 | 37,413 |
| * FMC Technologies Inc. | 490,800 | 29,669 |
| Tidewater Inc. | 494,850 | 24,609 |
| Holly Corp. | 471,000 | 22,401 |
| * Western Oil Sands Inc. | 863,800 | 22,319 |
| * Grant Prideco, Inc. | 587,150 | 22,177 |
| * Comstock Resources, Inc. | 732,900 | 20,448 |
| Frontier Oil Corp. | 651,800 | 19,163 |
| * Superior Energy Services, Inc. | 606,800 | 18,993 |
| * Grey Wolf, Inc. | 2,588,195 | 18,117 |
| * TETRA Technologies, Inc. | 648,300 | 16,791 |
| Patterson-UTI Energy, Inc. | 700,721 | 16,257 |
| Foundation Coal Holdings, Inc. | 436,800 | 16,035 |
| * Hornbeck Offshore Services, Inc. | 428,510 | 15,465 |
| * OPTI Canada Inc. | 915,600 | 14,685 |
| RPC Inc. | 671,000 | 14,574 |
| * Ultra Petroleum Corp. | 263,500 | 14,063 |
| World Fuel Services Corp. | 304,700 | 13,108 |
| Rowan Cos., Inc. | 391,800 | 13,078 |
| Helmerich &Payne, Inc. | 541,668 | 12,973 |
| XTO Energy, Inc. | 268,258 | 12,517 |
| * Universal Compression Holdings, Inc. | 205,800 | 12,402 |
| Tesoro Petroleum Corp. | 172,100 | 11,004 |
| * Oil States International, Inc. | 358,603 | 10,414 |
| * Unit Corp. | 214,200 | 9,937 |
| * W-H Energy Services, Inc. | 192,300 | 9,005 |
| * Atwood Oceanics, Inc. | 193,000 | 8,917 |
| * Hercules Offshore, Inc. | 223,000 | 7,943 |
| CARBO Ceramics Inc. | 219,450 | 7,396 |
| * Todco Class A | 214,359 | 7,316 |
| Range Resources Corp. | 265,426 | 7,206 |
| * Basic Energy Services Inc. | 294,500 | 7,198 |
| * Complete Production Services, Inc. | 351,600 | 6,782 |
| * Global Industries Ltd. | 407,296 | 6,761 |
| * Parker Drilling Co. | 825,500 | 6,761 |
| * Veritas DGC Inc. | 87,729 | 6,317 |
| * VeraSun Energy Corp. | 342,400 | 6,297 |
| * Giant Industries, Inc. | 76,000 | 6,154 |
| ENSCO International, Inc. | 124,000 | 6,072 |
| * Oceaneering International, Inc. | 168,300 | 6,057 |
| * Pioneer Drilling Co. | 415,900 | 5,461 |
| * Forest Oil Corp. | 157,005 | 5,125 |
| Niko Resources Ltd. | 77,475 | 4,702 |
| W&T Offshore, Inc. | 127,100 | 4,292 |
| * NATCO Group Inc. | 120,500 | 3,993 |
| * National Oilwell Varco Inc. | 56,380 | 3,405 |
| * Vaalco Energy, Inc. | 397,700 | 3,297 |
| * Cameron International Corp. | 63,500 | 3,181 |
| * Bois d'Arc Energy, Inc. | 175,600 | 2,824 |
| Pogo Producing Co. | 41,500 | 1,857 |
| * Bronco Drilling Co., Inc. | 86,400 | 1,472 |
| * Denbury Resources, Inc. | 40,800 | 1,173 |
| * NS Group Inc. | 17,872 | 1,168 |
| * ^ GeoGlobal Resources Inc. | 147,000 | 1,164 |
| * Plains Exploration &Production Co. | 26,700 | 1,129 |
| * Matrix Service Co. | 59,700 | 858 |
| * Callon Petroleum Co. | 25,400 | 391 |
| Alon USA Energy, Inc. | 9,200 | 258 |
|
|
| | | 634,252 |
|
|
| Financials (9.3%) |
| Jefferies Group, Inc. | 1,743,700 | 50,097 |
| * Affiliated Managers Group, Inc. | 496,330 | 49,702 |
| CapitalSource Inc. REIT | 1,775,996 | 49,266 |
| Cash America International Inc. | 1,014,200 | 41,917 |
| Brown &Brown, Inc. | 1,205,170 | 35,263 |
| Cullen/Frost Bankers, Inc. | 642,300 | 34,787 |
| ^ The First Marblehead Corp. | 511,153 | 34,477 |
| W.R. Berkley Corp. | 792,215 | 29,201 |
| Aspen Insurance Holdings Ltd. | 1,108,375 | 27,510 |
| U-Store-It Trust REIT | 1,229,000 | 26,989 |
| * Nasdaq Stock Market Inc. | 698,695 | 24,964 |
| * Investment Technology Group, Inc. | 503,500 | 23,513 |
| Reinsurance Group of America, Inc. | 360,200 | 20,315 |
| Jones Lang LaSalle Inc. | 207,000 | 19,044 |
| Nuveen Investments, Inc. Class A | 377,100 | 18,591 |
| * First Cash Financial Services, Inc. | 838,783 | 18,126 |
| Investors Financial Services Corp. | 439,195 | 17,269 |
| International Bancshares Corp. | 505,400 | 15,506 |
| SL Green Realty Corp. REIT | 126,156 | 15,271 |
| Redwood Trust, Inc. REIT | 275,200 | 15,128 |
| Apollo Investment Corp. | 693,425 | 14,950 |
| * IntercontinentalExchange Inc. | 166,620 | 14,066 |
| United Dominion Realty Trust REIT | 432,700 | 14,006 |
| Platinum Underwriters Holdings, Ltd. | 466,200 | 13,921 |
| Webster Financial Corp. | 286,208 | 13,830 |
| TCF Financial Corp. | 514,600 | 13,395 |
| SEI Investments Co. | 224,200 | 12,618 |
| IndyMac Bancorp, Inc. | 276,500 | 12,567 |
| * E*TRADE Financial Corp. | 515,540 | 12,002 |
| * Conseco, Inc. | 583,400 | 11,866 |
| Equity Inns, Inc. REIT | 703,100 | 11,798 |
| Raymond James Financial, Inc. | 346,800 | 11,049 |
| First Community Bancorp | 202,800 | 10,844 |
| Federated Investors, Inc. | 313,899 | 10,764 |
| International Securities Exchange, Inc. | 209,510 | 10,758 |
| Forest City Enterprise Class A | 191,200 | 10,497 |
| The Phoenix Cos., Inc. | 655,200 | 10,378 |
| * EZCORP, Inc. | 228,834 | 10,336 |
| Bank of Hawaii Corp. | 189,300 | 9,876 |
| Hancock Holding Co. | 191,900 | 9,844 |
| Willis Group Holdings Ltd. | 256,775 | 9,765 |
| Federal Realty Investment Trust REIT | 121,200 | 9,714 |
| Hanover Insurance Group Inc. | 210,500 | 9,546 |
| Kilroy Realty Corp. REIT | 120,100 | 9,047 |
| * CB Richard Ellis Group, Inc. | 297,810 | 8,943 |
| * AmeriCredit Corp. | 342,786 | 8,765 |
| Waddell &Reed Financial, Inc. | 315,000 | 8,033 |
| Taubman Co. REIT | 170,700 | 8,006 |
| Tanger Factory Outlet Centers, Inc. REIT | 204,700 | 7,635 |
| * Piper Jaffray Cos., Inc. | 108,800 | 7,524 |
| * Arch Capital Group Ltd. | 113,475 | 7,295 |
| * Knight Capital Group, Inc. Class A | 376,500 | 7,022 |
| UCBH Holdings, Inc. | 401,400 | 6,880 |
| Host Marriott Corp. REIT | 291,040 | 6,711 |
| Student Loan Corp. | 31,900 | 6,603 |
| Leucadia National Corp. | 241,500 | 6,368 |
| Essex Property Trust, Inc. REIT | 47,700 | 6,357 |
| ^ Corus Bankshares Inc. | 304,500 | 6,251 |
| Maguire Properties, Inc. REIT | 139,700 | 5,974 |
| Zenith National Insurance Corp. | 125,277 | 5,828 |
| A.G. Edwards &Sons, Inc. | 98,800 | 5,637 |
| Advanta Corp. Class B | 143,493 | 5,631 |
| Wilmington Trust Corp. | 133,900 | 5,568 |
| Max Re Capital Ltd. | 220,700 | 5,138 |
| * Security Capital Assurance, Ltd. | 203,200 | 5,121 |
| ASTA Funding, Inc. | 146,003 | 4,970 |
| HCC Insurance Holdings, Inc. | 142,000 | 4,780 |
| Erie Indemnity Co. Class A | 93,000 | 4,710 |
| BankUnited Financial Corp. | 170,624 | 4,602 |
| Radian Group, Inc. | 80,100 | 4,269 |
| * Philadelphia Consolidated Holding Corp. | 107,300 | 4,198 |
| BlackRock, Inc. | 27,300 | 4,118 |
| * GFI Group Inc. | 70,090 | 4,042 |
| The PMI Group Inc. | 93,800 | 4,001 |
| Nara Bancorp, Inc. | 196,799 | 3,739 |
| * World Acceptance Corp. | 71,651 | 3,582 |
| Global Signal, Inc. REIT | 61,300 | 3,329 |
| Sterling Financial Corp. | 94,132 | 3,131 |
| ^ The St. Joe Co. | 54,800 | 2,947 |
| * eHealth, Inc. | 128,100 | 2,834 |
| StanCorp Financial Group, Inc. | 60,800 | 2,778 |
| * Universal American Financial Corp. | 147,300 | 2,738 |
| * Douglas Emmett, Inc. REIT | 107,840 | 2,572 |
| * Penson Worldwide, Inc. | 102,320 | 2,488 |
| * Asset Acceptance Capital Corp. | 132,513 | 2,360 |
| Safety Insurance Group, Inc. | 45,100 | 2,255 |
| First Republic Bank | 52,000 | 2,025 |
| Glimcher Realty Trust REIT | 73,400 | 1,891 |
| Independent Bank Corp. (MI) | 77,803 | 1,859 |
| Acadia Realty Trust REIT | 68,700 | 1,755 |
| Suffolk Bancorp | 49,100 | 1,715 |
| Eaton Vance Corp. | 47,800 | 1,484 |
| Pacific Capital Bancorp | 47,643 | 1,465 |
| Texas United Bancshares | 43,245 | 1,460 |
| Flagstar Bancorp, Inc. | 96,100 | 1,444 |
| * ^ Tejon Ranch Co. | 29,500 | 1,431 |
| * Primus Guaranty, Ltd. | 122,386 | 1,399 |
| Downey Financial Corp. | 17,700 | 1,219 |
| * Intervest Bancshares Corp. | 32,700 | 1,169 |
| City Holding Co. | 29,636 | 1,162 |
| Advance America Cash Advance Centers Inc. | 71,428 | 1,071 |
| * Accredited Home Lenders Holding Co. | 34,800 | 1,065 |
| Center Financial Corp. | 44,000 | 1,063 |
| Consolidated-Tomoka Land Co. | 13,800 | 893 |
| * Move, Inc. | 178,600 | 854 |
| * Nelnet, Inc. | 26,100 | 768 |
| Wilshire Bancorp Inc. | 36,149 | 715 |
| American Financial Group, Inc. | 13,300 | 637 |
| Frontier Financial Corp. | 20,953 | 608 |
| Capital Corp. of the West | 17,000 | 514 |
| * Dollar Financial Corp. | 19,200 | 446 |
| Prosperity Bancshares, Inc. | 12,525 | 434 |
| Saul Centers, Inc. REIT | 8,900 | 433 |
| PFF Bancorp, Inc. | 13,700 | 425 |
| * Rewards Network Inc. | 71,700 | 406 |
| TriCo Bancshares | 13,302 | 346 |
| Westamerica Bancorporation | 6,100 | 304 |
| S.Y. Bancorp, Inc. | 10,000 | 295 |
| City Bank Lynnwood (WA) | 5,400 | 290 |
| Great Southern Bancorp, Inc. | 8,900 | 279 |
| Kimco Realty Corp. REIT | 6,240 | 277 |
| U.S.B. Holding Co., Inc. | 10,791 | 245 |
| * Thomas Weisel Partners Group, Inc. | 13,300 | 213 |
| Vineyard National Bancorp Co. | 8,205 | 179 |
| CVB Financial Corp. | 6,400 | 93 |
| Camden National Corp. | 1,360 | 60 |
| Smithtown Bancorp, Inc. | 200 | 6 |
|
|
| | | 1,094,503 |
|
|
| Health Care (16.1%) |
| Biotechnology (4.2%) |
| * Cephalon, Inc. | 1,125,615 | 78,996 |
| * Human Genome Sciences, Inc. | 2,716,600 | 36,267 |
| * Medarex, Inc. | 2,149,300 | 27,769 |
| * Alkermes, Inc. | 1,520,888 | 25,551 |
| * Vertex Pharmaceuticals, Inc. | 579,425 | 23,525 |
| * PDL BioPharma Inc. | 1,046,100 | 22,104 |
| * Celgene Corp. | 404,500 | 21,616 |
| * ICOS Corp. | 676,039 | 21,444 |
| * Millennium Pharmaceuticals, Inc. | 1,568,200 | 18,348 |
| * Nuvelo, Inc. | 775,800 | 14,306 |
| * InterMune Inc. | 618,000 | 13,658 |
| * Amylin Pharmaceuticals, Inc. | 283,200 | 12,450 |
| * Isis Pharmaceuticals, Inc. | 1,397,649 | 11,992 |
| * QLT Inc. | 1,384,900 | 11,772 |
| * Sirna Therapeutics, Inc. | 914,400 | 11,549 |
| * Regeneron Pharmaceuticals, Inc. | 552,200 | 11,072 |
| * Zymogenetics, Inc. | 678,437 | 10,889 |
| * Rigel Pharmaceuticals, Inc. | 955,800 | 10,581 |
| * MedImmune Inc. | 293,850 | 9,415 |
| * Myriad Genetics, Inc. | 316,200 | 8,503 |
| * ^ Telik, Inc. | 433,241 | 8,210 |
| * Seattle Genetics, Inc. | 1,358,504 | 7,200 |
| * Arena Pharmaceuticals, Inc. | 455,850 | 6,952 |
| * CV Therapeutics, Inc. | 502,400 | 6,506 |
| * Alnylam Pharmaceuticals Inc. | 322,400 | 6,358 |
| * BioMarin Pharmaceutical Inc. | 380,000 | 6,091 |
| * Cytokinetics, Inc. | 729,049 | 5,315 |
| * Cell Genesys, Inc. | 1,210,500 | 5,302 |
| * ImmunoGen, Inc. | 1,286,000 | 5,131 |
| * Enzon Pharmaceuticals, Inc. | 555,600 | 4,756 |
| * Myogen, Inc. | 89,102 | 4,660 |
| * Martek Biosciences Corp. | 185,200 | 4,393 |
| * ImClone Systems, Inc. | 136,000 | 4,255 |
| * Tanox, Inc. | 297,379 | 3,994 |
| * Cubist Pharmaceuticals, Inc. | 137,170 | 3,055 |
| * United Therapeutics Corp. | 40,725 | 2,437 |
| * Keryx Biopharmaceuticals, Inc. | 148,160 | 2,080 |
| * Progenics Pharmaceuticals, Inc. | 75,300 | 1,967 |
| * Genomic Health, Inc. | 110,200 | 1,796 |
| * Digene Corp. | 36,850 | 1,711 |
| * ^ ADVENTRX Pharmaceuticals, Inc. | 174,000 | 586 |
| * Lexicon Genetics Inc. | 127,100 | 507 |
| * Sangamo BioSciences, Inc. | 57,429 | 322 |
| * Trimeris, Inc. | 34,600 | 264 |
| Health Care Equipment &Supplies (3.6%) |
| * IDEXX Laboratories Corp. | 732,958 | 60,989 |
| DENTSPLY International Inc. | 1,121,689 | 35,086 |
| * Respironics, Inc. | 733,250 | 25,898 |
| * Align Technology, Inc. | 1,568,600 | 21,741 |
| Bausch &Lomb, Inc. | 390,000 | 20,881 |
| Cooper Cos., Inc. | 350,440 | 20,196 |
| * Varian Medical Systems, Inc. | 294,700 | 16,167 |
| * Cyberonics, Inc. | 889,200 | 16,032 |
| Arrow International, Inc. | 404,400 | 14,457 |
| * Advanced Medical Optics, Inc. | 319,806 | 13,064 |
| * IntraLase Corp. | 661,433 | 13,004 |
| Hogy Medical Co., Ltd. | 289,300 | 11,675 |
| * Edwards Lifesciences Corp. | 266,100 | 11,424 |
| * Hologic, Inc. | 227,546 | 10,956 |
| West Pharmaceutical Services, Inc. | 259,625 | 10,915 |
| * Gen-Probe Inc. | 190,325 | 9,111 |
| Hillenbrand Industries, Inc. | 153,600 | 9,013 |
| Dade Behring Holdings Inc. | 232,700 | 8,477 |
| PolyMedica Corp. | 194,675 | 8,089 |
| * ResMed Inc. | 174,080 | 7,658 |
| * ^ Palomar Medical Technologies, Inc. | 162,200 | 7,638 |
| * SonoSite, Inc. | 238,166 | 6,788 |
| * Candela Corp. | 447,075 | 6,326 |
| * Zoll Medical Corp. | 157,337 | 6,089 |
| * Intuitive Surgical, Inc. | 57,064 | 5,660 |
| * Cytyc Corp. | 195,903 | 5,176 |
| * Inverness Medical Innovations, Inc. | 123,850 | 4,668 |
| * ICU Medical, Inc. | 109,986 | 4,647 |
| * Viasys Healthcare Inc. | 162,000 | 4,641 |
| * Abaxis, Inc. | 210,600 | 4,225 |
| * Haemonetics Corp. | 84,080 | 3,834 |
| * Greatbatch, Inc. | 160,722 | 3,615 |
| * Thoratec Corp. | 159,000 | 2,504 |
| Vital Signs, Inc. | 39,509 | 2,227 |
| * Biosite Inc. | 41,000 | 1,883 |
| Mentor Corp. | 40,000 | 1,872 |
| * OraSure Technologies, Inc. | 186,700 | 1,449 |
| Meridian Bioscience Inc. | 58,800 | 1,355 |
| * Immucor Inc. | 48,449 | 1,334 |
| Beckman Coulter, Inc. | 22,900 | 1,318 |
| * Quidel Corp. | 84,560 | 1,312 |
| * American Medical Systems Holdings, Inc. | 60,100 | 1,070 |
| * SurModics, Inc. | 20,123 | 702 |
| Young Innovations, Inc. | 10,361 | 374 |
| * Symmetry Medical Inc. | 11,800 | 184 |
| * Neurometrix Inc. | 3,400 | 55 |
| * ArthroCare Corp. | 978 | 40 |
| Health Care Providers &Services (3.9%) |
| * Henry Schein, Inc. | 923,520 | 45,890 |
| Manor Care, Inc. | 734,707 | 35,259 |
| * Health Net Inc. | 806,700 | 33,486 |
| Universal Health Services Class B | 510,122 | 27,011 |
| * LifePoint Hospitals, Inc. | 744,500 | 26,430 |
| * Pediatrix Medical Group, Inc. | 571,100 | 25,660 |
| * Lincare Holdings, Inc. | 763,900 | 25,636 |
| * AMN Healthcare Services, Inc. | 894,322 | 22,617 |
| * Triad Hospitals, Inc. | 566,600 | 20,981 |
| * Genesis Healthcare Corp. | 422,100 | 20,442 |
| * VCA Antech, Inc. | 463,400 | 15,000 |
| * Matria Healthcare, Inc. | 483,300 | 13,629 |
| * DaVita, Inc. | 202,885 | 11,286 |
| * Healthways, Inc. | 265,000 | 11,223 |
| * Apria Healthcare Group Inc. | 442,000 | 10,294 |
| * MWI Veterinary Supply Inc. | 291,143 | 9,756 |
| * United Surgical Partners International, Inc. | 384,658 | 9,547 |
| * Community Health Systems, Inc. | 281,800 | 9,144 |
| * PSS World Medical, Inc. | 454,178 | 9,138 |
| * Sierra Health Services, Inc. | 263,200 | 9,012 |
| * Molina Healthcare Inc. | 225,900 | 8,862 |
| * Radiation Therapy Services, Inc. | 237,883 | 7,079 |
| * ^ Nighthawk Radiology Holdings, Inc. | 299,280 | 6,090 |
| * Magellan Health Services, Inc. | 123,200 | 5,376 |
| * Patterson Cos | 150,600 | 4,947 |
| * Odyssey Healthcare, Inc. | 364,950 | 4,836 |
| * WellCare Health Plans Inc. | 79,400 | 4,665 |
| Owens &Minor, Inc. Holding Co. | 146,300 | 4,610 |
| Brookdale Senior Living Inc. | 84,722 | 4,077 |
| * AMERIGROUP Corp. | 122,300 | 3,664 |
| * AmSurg Corp. | 143,563 | 3,018 |
| * Sunrise Senior Living, Inc. | 65,500 | 2,044 |
| * Psychiatric Solutions, Inc. | 59,400 | 1,972 |
| Omnicare, Inc. | 51,200 | 1,939 |
| * Symbion, Inc. | 112,587 | 1,869 |
| * MedCath Corp. | 66,900 | 1,772 |
| Chemed Corp. | 49,000 | 1,739 |
| * Healthspring, Inc. | 67,300 | 1,355 |
| * Sun Healthcare Group Inc. | 95,200 | 1,245 |
| * RehabCare Group, Inc. | 53,900 | 693 |
| * inVentiv Health, Inc. | 15,392 | 440 |
| Heath Care Technology (0.5%) |
| * Emdeon Corp. | 2,364,451 | 27,546 |
| IMS Health, Inc. | 369,460 | 10,289 |
| * Per-Se Technologies, Inc. | 340,450 | 8,334 |
| * Cerner Corp. | 114,000 | 5,507 |
| Computer Programs and Systems, Inc. | 56,100 | 1,919 |
| Life Science Tools &Services (1.8%) |
| Pharmaceutical Product Development, Inc. | 1,310,736 | 41,485 |
| * Covance, Inc. | 549,265 | 32,132 |
| * Techne Corp. | 435,474 | 24,334 |
| * Qiagen NV | 1,070,300 | 16,921 |
| * Nektar Therapeutics | 1,150,900 | 16,607 |
| * Affymetrix, Inc. | 503,400 | 12,837 |
| * Illumina, Inc. | 235,365 | 10,347 |
| * Diversa Corp. | 952,971 | 8,872 |
| * Luminex Corp. | 539,600 | 8,698 |
| * Exelixis, Inc. | 881,830 | 8,554 |
| * Kendle International Inc. | 171,500 | 5,937 |
| * Millipore Corp. | 77,700 | 5,014 |
| * PAREXEL International Corp. | 164,500 | 4,869 |
| * Waters Corp. | 95,500 | 4,756 |
| * Ventana Medical Systems, Inc. | 56,858 | 2,296 |
| * Bruker BioSciences Corp. | 241,282 | 1,921 |
| * Varian, Inc. | 25,720 | 1,206 |
| * Albany Molecular Research, Inc. | 95,500 | 1,137 |
| * Molecular Devices Corp. | 26,770 | 539 |
| Pharmaceuticals (2.1%) |
| * Endo Pharmaceuticals Holdings, Inc. | 908,420 | 25,926 |
| * King Pharmaceuticals, Inc. | 1,324,500 | 22,159 |
| * Adams Respiratory Therapeutics, Inc. | 424,987 | 18,317 |
| Kissei Pharmaceutical Co. | 847,000 | 14,789 |
| Mylan Laboratories, Inc. | 704,490 | 14,442 |
| * Watson Pharmaceuticals, Inc. | 485,800 | 13,073 |
| * Salix Pharmaceuticals, Ltd. | 908,514 | 12,110 |
| * Barr Pharmaceuticals Inc. | 210,765 | 11,038 |
| Medicis Pharmaceutical Corp. | 300,400 | 10,526 |
| * Xenoport Inc. | 394,513 | 9,496 |
| Alpharma, Inc. Class A | 428,500 | 9,457 |
| Valeant Pharmaceuticals International | 505,876 | 9,450 |
| * Axcan Pharma Inc. | 611,700 | 9,004 |
| * Noven Pharmaceuticals, Inc. | 392,149 | 8,710 |
| * Sciele Pharma, Inc. | 345,800 | 7,542 |
| * ^ Pain Therapeutics, Inc. | 806,200 | 6,740 |
| * K-V Pharmaceutical Co. Class A | 297,600 | 6,642 |
| * Durect Corp. | 1,270,000 | 5,906 |
| CNS, Inc. | 140,500 | 5,206 |
| * Adolor Corp. | 351,641 | 4,821 |
| * Impax Laboratories, Inc. | 662,300 | 4,623 |
| * ViroPharma Inc. | 271,600 | 3,620 |
| * Hi-Tech Pharmacal Co., Inc. | 159,820 | 2,410 |
| * ^ Nastech Pharmaceutical Co., Inc. | 134,700 | 2,369 |
| * Kos Pharmaceuticals, Inc. | 33,900 | 1,687 |
| * The Medicines Co. | 56,300 | 1,462 |
| Perrigo Co. | 78,800 | 1,410 |
| * Penwest Pharmaceuticals Co. | 79,551 | 1,410 |
| * ^ New River Pharmaceuticals Inc. | 20,400 | 1,038 |
| * ^ AtheroGenics, Inc. | 58,700 | 763 |
|
|
| | | 1,893,410 |
|
|
| Industrials (16.6%) |
| Aerospace &Defense (0.7%) |
| * Alliant Techsystems, Inc. | 248,100 | 19,156 |
| * BE Aerospace, Inc. | 677,403 | 17,125 |
| * Ceradyne, Inc. | 284,339 | 11,729 |
| Precision Castparts Corp. | 156,969 | 10,683 |
| United Industrial Corp. | 148,900 | 6,702 |
| * AAR Corp. | 142,560 | 3,712 |
| * Orbital Sciences Corp. | 161,600 | 2,935 |
| * K&F Industries Holdings | 121,100 | 2,354 |
| * Ladish Co., Inc. | 61,700 | 1,926 |
| * Teledyne Technologies, Inc. | 41,300 | 1,723 |
| Triumph Group, Inc. | 30,100 | 1,449 |
| * Innovative Solutions and Support, Inc. | 80,600 | 1,285 |
| * DynCorp International Inc. Cl. A | 57,000 | 599 |
| Air Freight &Logistics (0.4%) |
| UTI Worldwide, Inc. | 802,585 | 20,747 |
| * EGL, Inc. | 403,800 | 13,725 |
| Forward Air Corp. | 197,800 | 6,423 |
| Pacer International, Inc. | 78,900 | 2,421 |
| * ABX Air, Inc. | 335,534 | 1,929 |
| * Hub Group, Inc. | 31,300 | 850 |
| Airlines (1.0%) |
| * Continental Airlines, Inc. Class B | 822,400 | 30,330 |
| * AMR Corp. | 859,400 | 24,355 |
| * US Airways Group Inc. | 423,900 | 21,136 |
| * JetBlue Airways Corp. | 1,446,800 | 18,172 |
| * AirTran Holdings, Inc. | 1,074,400 | 10,712 |
| * Alaska Air Group, Inc. | 168,000 | 6,745 |
| * ExpressJet Holdings, Inc. | 523,200 | 4,154 |
| Skywest, Inc. | 99,000 | 2,639 |
| Building Products (0.6%) |
| * USG Corp. | 396,800 | 19,400 |
| * NCI Building Systems, Inc. | 285,200 | 17,069 |
| * Trex Co., Inc. | 465,000 | 12,285 |
| ^ Simpson Manufacturing Co. | 213,900 | 6,073 |
| Lennox International Inc. | 134,300 | 3,621 |
| ^ American Woodmark Corp. | 81,900 | 3,030 |
| Insteel Industries, Inc. | 123,400 | 2,214 |
| ^ PW Eagle, Inc. | 29,000 | 1,029 |
| Universal Forest Products, Inc. | 22,600 | 1,026 |
| * Builders FirstSource, Inc. | 56,506 | 894 |
| Commercial Services &Supplies (3.8%) |
| * The Dun &Bradstreet Corp. | 894,700 | 69,107 |
| * The Advisory Board Co. | 761,135 | 42,030 |
| Equifax, Inc. | 799,600 | 30,409 |
| * Corrections Corp. of America | 588,147 | 26,872 |
| The Corporate Executive Board Co. | 297,307 | 26,704 |
| Manpower Inc. | 354,505 | 24,025 |
| Robert Half International, Inc. | 594,507 | 21,729 |
| * Monster Worldwide Inc. | 512,700 | 20,769 |
| * ChoicePoint Inc. | 430,550 | 15,668 |
| Herman Miller, Inc. | 356,100 | 12,207 |
| * Allied Waste Industries, Inc. | 993,150 | 12,067 |
| * Cenveo Inc. | 501,300 | 9,946 |
| HNI Corp. | 220,200 | 9,902 |
| * Covanta Holding Corp. | 464,400 | 9,441 |
| * Global Cash Access, Inc. | 550,755 | 8,785 |
| * Tetra Tech, Inc. | 441,650 | 8,029 |
| * Mobile Mini, Inc. | 249,051 | 8,012 |
| * Spherion Corp. | 1,031,587 | 7,479 |
| Steelcase Inc. | 448,100 | 7,425 |
| * Labor Ready, Inc. | 385,928 | 6,758 |
| Administaff, Inc. | 191,500 | 6,597 |
| * Consolidated Graphics, Inc. | 104,325 | 6,486 |
| John H. Harland Co. | 158,600 | 6,485 |
| The Brink's Co. | 122,700 | 6,441 |
| * Copart, Inc. | 214,300 | 6,200 |
| * Huron Consulting Group Inc. | 103,600 | 4,140 |
| * Stericycle, Inc. | 48,700 | 3,444 |
| Kelly Services, Inc. Class A | 117,269 | 3,375 |
| * Kforce Inc. | 221,208 | 3,311 |
| * United Stationers, Inc. | 64,100 | 3,061 |
| McGrath RentCorp | 91,103 | 2,460 |
| * IHS Inc.-Class A | 67,900 | 2,347 |
| Watson Wyatt &Co. Holdings | 48,000 | 2,167 |
| * American Reprographics Co. | 51,400 | 1,825 |
| Brady Corp. Class A | 48,500 | 1,795 |
| * On Assignment, Inc. | 153,400 | 1,741 |
| * Volt Information Sciences Inc. | 32,600 | 1,288 |
| * CBIZ Inc. | 174,900 | 1,231 |
| * Geo Group Inc. | 32,350 | 1,229 |
| * Heidrick &Struggles International, Inc. | 14,225 | 581 |
| * SITEL Corp. | 91,100 | 392 |
| Waste Industries USA, Inc. | 8,565 | 247 |
| * Teletech Holdings Inc. | 8,300 | 161 |
| Construction &Engineering (0.5%) |
| Chicago Bridge &Iron Co. N.V | 780,985 | 19,181 |
| Washington Group International, Inc. | 267,200 | 15,129 |
| * Jacobs Engineering Group Inc. | 179,000 | 13,522 |
| Granite Construction Co. | 141,700 | 7,383 |
| * EMCOR Group, Inc. | 107,300 | 6,347 |
| * Perini Corp. | 54,100 | 1,337 |
| Comfort Systems USA, Inc. | 38,500 | 447 |
| Electrical Equipment (1.5%) |
| * Thomas &Betts Corp. | 485,000 | 24,992 |
| * Energy Conversion Devices, Inc. | 587,477 | 21,613 |
| * Suntech Power Holdings Co., Ltd. ADR | 762,600 | 19,828 |
| * General Cable Corp. | 483,900 | 18,195 |
| Acuity Brands, Inc. | 320,200 | 15,863 |
| Franklin Electric, Inc. | 280,000 | 15,103 |
| Roper Industries Inc. | 239,860 | 11,477 |
| * ^ Encore Wire Corp. | 395,157 | 10,622 |
| Ametek, Inc. | 211,080 | 9,853 |
| * ^ Lamson &Sessions Co. | 285,600 | 6,249 |
| * Superior Essex Inc. | 150,966 | 5,660 |
| * Genlyte Group, Inc. | 72,686 | 5,616 |
| A.O. Smith Corp. | 126,100 | 4,434 |
| * FuelCell Energy, Inc. | 320,200 | 2,120 |
| Regal-Beloit Corp. | 35,500 | 1,755 |
| Baldor Electric Co. | 26,300 | 844 |
| Vicor Corp. | 61,500 | 732 |
| Industrial Conglomerates (0.3%) |
| Carlisle Co., Inc. | 223,025 | 18,665 |
| * McDermott International, Inc. | 349,475 | 15,622 |
| Machinery (3.6%) |
| * Terex Corp. | 1,149,700 | 59,508 |
| Donaldson Co., Inc. | 1,312,900 | 49,299 |
| The Manitowoc Co., Inc. | 607,710 | 33,351 |
| Harsco Corp. | 383,995 | 31,346 |
| Albany International Corp. | 794,400 | 26,700 |
| Oshkosh Truck Corp. | 549,890 | 24,861 |
| Cummins Inc. | 156,400 | 19,860 |
| JLG Industries, Inc. | 630,400 | 17,431 |
| Trinity Industries, Inc. | 446,110 | 16,087 |
| Joy Global Inc. | 411,300 | 16,086 |
| Lincoln Electric Holdings, Inc. | 221,667 | 13,630 |
| * Navistar International Corp. | 445,757 | 12,361 |
| The Timken Co. | 382,599 | 11,497 |
| The Toro Co. | 228,900 | 9,879 |
| * Flowserve Corp. | 171,300 | 9,079 |
| Mueller Industries Inc. | 210,500 | 7,719 |
| * Gardner Denver Inc. | 222,800 | 7,573 |
| Bucyrus International, Inc. | 178,359 | 7,473 |
| Kaydon Corp. | 176,700 | 7,386 |
| * The Middleby Corp. | 73,200 | 6,596 |
| Crane Co. | 166,600 | 6,487 |
| Nordson Corp. | 121,700 | 5,604 |
| Freightcar America Inc. | 82,200 | 4,371 |
| * Columbus McKinnon Corp. | 186,500 | 4,105 |
| Graco, Inc. | 91,300 | 3,721 |
| Valmont Industries, Inc. | 47,300 | 2,639 |
| Wabtec Corp. | 80,700 | 2,533 |
| * AGCO Corp. | 83,900 | 2,244 |
| The Greenbrier Cos., Inc. | 8,000 | 300 |
| Marine (0.3%) |
| * American Commercial Lines Inc. | 270,900 | 17,378 |
| Horizon Lines Inc. | 646,250 | 15,090 |
| * Kirby Corp. | 226,800 | 7,945 |
| Road &Rail (1.8%) |
| * Swift Transportation Co., Inc. | 2,946,697 | 74,109 |
| Heartland Express, Inc. | 1,374,320 | 22,443 |
| Knight Transportation, Inc. | 1,207,600 | 22,002 |
| Con-way, Inc. | 357,048 | 16,842 |
| Werner Enterprises, Inc. | 750,100 | 13,764 |
| Landstar System, Inc. | 250,100 | 11,615 |
| Ryder System, Inc. | 205,000 | 10,793 |
| J.B. Hunt Transport Services, Inc. | 429,500 | 9,294 |
| * Celadon Group Inc. | 432,700 | 8,117 |
| * Old Dominion Freight Line, Inc. | 292,955 | 8,103 |
| * Amerco, Inc. | 80,781 | 7,409 |
| Arkansas Best Corp. | 104,800 | 4,295 |
| * Kansas City Southern | 50,200 | 1,425 |
| * Saia, Inc. | 27,600 | 740 |
| * P.A.M. Transportation Services, Inc. | 24,400 | 618 |
| * U.S. Xpress Enterprises, Inc. | 25,221 | 498 |
| Trading Companies &Distributors (2.1%) |
| MSC Industrial Direct Co., Inc. Class A | 1,606,869 | 65,753 |
| Watsco, Inc. | 880,400 | 43,844 |
| * Wesco International, Inc. | 620,500 | 40,500 |
| Fastenal Co. | 932,200 | 37,512 |
| * United Rentals, Inc. | 1,062,800 | 25,178 |
| GATX Corp. | 319,100 | 13,903 |
| * H&E Equipment Services, Inc. | 505,927 | 13,574 |
| * Williams Scotsman International Inc. | 365,910 | 8,610 |
| Applied Industrial Technology, Inc. | 95,125 | 2,734 |
|
|
| | | 1,953,128 |
|
|
| Information Technology (21.6%) |
| Communications Equipment (2.8%) |
| * Polycom, Inc. | 1,351,375 | 37,028 |
| * CommScope, Inc. | 1,073,200 | 34,246 |
| * Avocent Corp. | 736,038 | 27,020 |
| * Foundry Networks, Inc. | 1,947,602 | 24,657 |
| * ViaSat, Inc. | 746,900 | 20,271 |
| * Stratex Networks, Inc. | 4,095,776 | 19,127 |
| * Ciena Corp. | 755,385 | 17,759 |
| Harris Corp. | 357,200 | 15,217 |
| ADTRAN Inc. | 617,650 | 14,293 |
| * NICE-Systems Ltd. ADR | 463,377 | 14,258 |
| * Sycamore Networks, Inc. | 3,769,700 | 14,136 |
| * Tellabs, Inc. | 900,500 | 9,491 |
| * Powerwave Technologies, Inc. | 1,407,500 | 9,163 |
| * Mastec Inc. | 792,000 | 8,672 |
| * Interdigital Communications Corp. | 211,917 | 7,578 |
| * Comverse Technology, Inc. | 328,324 | 7,148 |
| * Tekelec | 480,325 | 7,085 |
| * ^ UTStarcom, Inc. | 648,200 | 6,981 |
| * Bookham, Inc. | 2,176,400 | 6,812 |
| * ^ Finisar Corp. | 1,932,500 | 6,725 |
| * Redback Networks Inc. | 372,424 | 5,892 |
| * Arris Group Inc. | 325,304 | 4,359 |
| * Ixia | 442,875 | 4,052 |
| * Anaren, Inc. | 76,000 | 1,528 |
| * JDS Uniphase Corp. | 94,625 | 1,375 |
| * C-COR Inc. | 112,688 | 1,126 |
| * Sirenza Microdevices, Inc. | 85,100 | 624 |
| * Radyne Comstream Inc. | 45,887 | 463 |
| * Optical Cable Corp. | 8,891 | 1 |
| Computers &Peripherals (1.3%) |
| * Brocade Communications Systems, Inc. | 5,905,400 | 47,893 |
| * Western Digital Corp. | 1,544,200 | 28,228 |
| * Electronics for Imaging, Inc. | 1,063,000 | 25,129 |
| * Hutchinson Technology, Inc. | 645,800 | 14,950 |
| * NCR Corp. | 343,450 | 14,260 |
| * Emulex Corp. | 329,777 | 6,200 |
| * Komag, Inc. | 159,728 | 6,110 |
| * QLogic Corp. | 210,000 | 4,322 |
| * Intermec, Inc. | 165,095 | 3,731 |
| * Hypercom Corp. | 431,000 | 2,797 |
| * ^ Neoware Systems, Inc. | 191,100 | 2,287 |
| * Rimage Corp. | 14,800 | 354 |
| Electronic Equipment &Instruments (2.9%) |
| * Ingram Micro, Inc. Class A | 1,842,700 | 37,978 |
| Tektronix, Inc. | 1,137,000 | 34,531 |
| * Benchmark Electronics, Inc. | 907,425 | 24,092 |
| * Trimble Navigation Ltd. | 467,150 | 21,592 |
| * Littelfuse, Inc. | 603,300 | 20,428 |
| * Plexus Corp. | 776,454 | 17,020 |
| CDW Corp. | 249,000 | 16,352 |
| * Mettler-Toledo International Inc. | 217,600 | 14,938 |
| Molex, Inc. | 412,400 | 14,393 |
| * Avnet, Inc. | 527,600 | 12,494 |
| * Brightpoint, Inc. | 982,214 | 11,885 |
| AVX Corp. | 706,900 | 11,141 |
| * Rofin-Sinar Technologies Inc. | 146,500 | 9,021 |
| * TTM Technologies, Inc. | 725,160 | 8,811 |
| * Itron, Inc. | 143,648 | 7,820 |
| * Anixter International Inc. | 130,400 | 7,793 |
| * Arrow Electronics, Inc. | 217,000 | 6,477 |
| * Insight Enterprises, Inc. | 300,125 | 6,450 |
| * Rogers Corp. | 90,200 | 6,311 |
| * Vishay Intertechnology, Inc. | 433,500 | 5,848 |
| Daktronics, Inc. | 224,000 | 5,311 |
| * Coherent, Inc. | 161,756 | 5,213 |
| Amphenol Corp. | 72,225 | 4,904 |
| * ^ Multi-Fineline Electronix, Inc. | 170,300 | 4,113 |
| * Aeroflex, Inc. | 370,988 | 4,007 |
| CTS Corp. | 253,600 | 3,581 |
| National Instruments Corp. | 112,300 | 3,502 |
| * Tech Data Corp. | 83,400 | 3,282 |
| Technitrol, Inc. | 122,600 | 3,092 |
| * L-1 Identity Solutions Inc. | 205,541 | 2,941 |
| * ScanSource, Inc. | 90,900 | 2,853 |
| * Sanmina-SCI Corp. | 635,820 | 2,511 |
| * Dolby Laboratories Inc. | 85,700 | 1,696 |
| * Cogent Inc. | 138,175 | 1,589 |
| * DTS Inc. | 58,800 | 1,258 |
| MTS Systems Corp. | 31,600 | 1,052 |
| * Global Imaging Systems, Inc. | 30,400 | 662 |
| * Staktek Holdings Inc. | 27,700 | 169 |
| * LoJack Corp. | 7,400 | 148 |
| Internet Software &Services (2.2%) |
| * Akamai Technologies, Inc. | 2,040,845 | 95,634 |
| * WebEx Communications, Inc. | 685,850 | 26,371 |
| * Digital Insight Corp. | 623,118 | 19,180 |
| * Ariba, Inc. | 1,996,725 | 15,075 |
| * aQuantive, Inc. | 508,970 | 13,834 |
| * RealNetworks, Inc. | 1,070,900 | 11,758 |
| * Marchex, Inc. | 792,100 | 11,232 |
| * VeriSign, Inc. | 458,785 | 9,488 |
| * The Knot, Inc. | 340,000 | 8,150 |
| * ValueClick, Inc. | 381,675 | 7,175 |
| * j2 Global Communications, Inc. | 233,344 | 6,403 |
| United Online, Inc. | 338,722 | 4,580 |
| * Websense, Inc. | 162,200 | 4,439 |
| * DealerTrack Holdings Inc. | 162,945 | 4,153 |
| * Vignette Corp. | 221,000 | 3,602 |
| * ^ Bankrate, Inc. | 99,000 | 3,163 |
| * Digitas Inc. | 255,800 | 2,701 |
| * Digital River, Inc. | 42,900 | 2,482 |
| * EarthLink, Inc. | 341,400 | 2,397 |
| Stellent Inc. | 196,200 | 2,192 |
| * Art Technology Group, Inc. | 755,705 | 1,889 |
| * SonicWALL, Inc. | 135,400 | 1,422 |
| * Travelzoo, Inc. | 20,800 | 677 |
| * NIC Inc. | 44,938 | 217 |
| * Liquidity Services, Inc. | 2,827 | 48 |
| * Interwoven Inc. | 2,400 | 31 |
| IT Services (4.0%) |
| * Alliance Data Systems Corp. | 969,544 | 58,871 |
| * MPS Group, Inc. | 3,097,621 | 47,239 |
| * Ceridian Corp. | 1,568,450 | 36,968 |
| * VeriFone Holdings, Inc. | 1,174,800 | 34,316 |
| * DST Systems, Inc. | 542,100 | 33,496 |
| * Euronet Worldwide, Inc. | 919,721 | 27,334 |
| MoneyGram International, Inc. | 693,500 | 23,725 |
| * CheckFree Corp. | 597,204 | 23,578 |
| ^ Heartland Payment Systems, Inc. | 846,466 | 22,618 |
| * Affiliated Computer Services, Inc. Class A | 309,100 | 16,531 |
| * SRA International, Inc. | 455,450 | 14,597 |
| * ManTech International Corp. | 424,711 | 14,466 |
| Global Payments Inc. | 308,219 | 13,472 |
| * CSG Systems International, Inc. | 489,270 | 13,201 |
| * Iron Mountain, Inc. | 301,700 | 13,085 |
| * BISYS Group, Inc. | 1,183,769 | 13,069 |
| * Sapient Corp. | 2,255,200 | 12,291 |
| Acxiom Corp. | 478,950 | 11,854 |
| * Sykes Enterprises, Inc. | 420,302 | 8,528 |
| * Cognizant Technology Solutions Corp. | 85,574 | 6,442 |
| * Convergys Corp. | 264,000 | 5,599 |
| * Keane, Inc. | 399,100 | 4,626 |
| * Tyler Technologies, Inc. | 247,700 | 3,515 |
| MasterCard, Inc. Class A | 37,290 | 2,763 |
| * ^ Kanbay International Inc. | 76,032 | 2,159 |
| infoUSA Inc. | 169,128 | 1,859 |
| Talx Corp. | 65,452 | 1,592 |
| * Lightbridge, Inc. | 106,698 | 1,233 |
| Startek, Inc. | 64,300 | 877 |
| Gevity HR, Inc. | 32,313 | 730 |
| * Infocrossing, Inc. | 44,200 | 558 |
| * eFunds Corp. | 15,700 | 389 |
| * BearingPoint, Inc. | 33,700 | 281 |
| Integral Systems, Inc. | 8,500 | 227 |
| * iGATE Corp. | 29,600 | 167 |
| * CACI International, Inc. | 2,200 | 127 |
| Semiconductors &Semiconductor Equipment (4.3%) |
| * Integrated Device Technology Inc. | 2,599,122 | 41,196 |
| * MEMC Electronic Materials, Inc. | 885,415 | 31,432 |
| * Cymer, Inc. | 658,137 | 30,491 |
| * LAM Research Corp. | 526,678 | 26,044 |
| * Atheros Communications | 1,190,300 | 25,865 |
| * Microsemi Corp. | 1,250,860 | 24,517 |
| * Trident Microsystems, Inc. | 1,145,373 | 24,213 |
| * ON Semiconductor Corp. | 3,510,697 | 21,837 |
| * Varian Semiconductor Equipment Associates, Inc. | 587,300 | 21,431 |
| Intersil Corp. | 815,400 | 19,121 |
| * Entegris Inc. | 1,565,100 | 17,545 |
| * ^ OmniVision Technologies, Inc. | 1,063,400 | 17,461 |
| * International Rectifier Corp. | 358,225 | 12,885 |
| * RF Micro Devices, Inc. | 1,658,600 | 12,108 |
| * Agere Systems Inc. | 702,100 | 11,922 |
| * Silicon Laboratories Inc. | 348,600 | 11,375 |
| * Tessera Technologies, Inc. | 310,200 | 10,829 |
| * Teradyne, Inc. | 712,100 | 9,984 |
| * Cypress Semiconductor Corp. | 569,800 | 9,567 |
| * Atmel Corp. | 1,479,700 | 8,508 |
| * Amkor Technology, Inc. | 1,227,600 | 8,483 |
| * Novellus Systems, Inc. | 300,736 | 8,315 |
| * Silicon Image, Inc. | 638,814 | 7,557 |
| * Verigy Ltd. | 442,100 | 7,427 |
| * ATMI, Inc. | 229,325 | 7,267 |
| * FormFactor Inc. | 172,043 | 6,569 |
| * Cirrus Logic, Inc. | 857,685 | 6,055 |
| * Micrel, Inc. | 530,300 | 5,918 |
| * Conexant Systems, Inc. | 2,999,500 | 5,789 |
| * PortalPlayer Inc. | 463,468 | 5,576 |
| * Zoran Corp. | 392,000 | 5,457 |
| National Semiconductor Corp. | 206,119 | 5,007 |
| * ^ SiRF Technology Holdings, Inc. | 172,946 | 4,863 |
| * LSI Logic Corp. | 441,300 | 4,435 |
| * Supertex, Inc. | 94,300 | 4,188 |
| * Diodes Inc. | 84,500 | 3,721 |
| * Advanced Energy Industries, Inc. | 219,928 | 3,457 |
| * Marvell Technology Group Ltd. | 173,690 | 3,175 |
| * Silicon Storage Technology, Inc. | 683,453 | 2,864 |
| * FEI Co. | 117,625 | 2,689 |
| * ^ EMCORE Corp. | 409,445 | 2,354 |
| * Fairchild Semiconductor International, Inc. | 134,400 | 2,165 |
| * ^ Genesis Microchip Inc. | 165,300 | 1,694 |
| * Intevac, Inc. | 78,200 | 1,617 |
| * Mattson Technology, Inc. | 165,264 | 1,616 |
| * Kopin Corp. | 369,801 | 1,320 |
| * Cabot Microelectronics Corp. | 42,900 | 1,225 |
| Cohu, Inc. | 61,700 | 1,220 |
| * Netlogic Microsystems Inc. | 26,800 | 531 |
| * Asyst Technologies, Inc. | 67,200 | 499 |
| * Veeco Instruments, Inc. | 13,100 | 245 |
| Software (4.1%) |
| * Red Hat, Inc. | 2,732,813 | 44,763 |
| * Citrix Systems, Inc. | 1,306,641 | 38,585 |
| * BMC Software, Inc. | 1,231,500 | 37,327 |
| * Informatica Corp. | 2,972,214 | 36,826 |
| FactSet Research Systems Inc. | 693,377 | 35,293 |
| * Cadence Design Systems, Inc. | 1,411,400 | 25,208 |
| * Progress Software Corp. | 626,425 | 18,035 |
| * ^ Concur Technologies, Inc. | 1,097,900 | 17,501 |
| Fair Isaac, Inc. | 428,200 | 15,685 |
| * Cognos Inc. | 409,900 | 14,953 |
| * MicroStrategy Inc. | 124,600 | 14,871 |
| * BEA Systems, Inc. | 877,800 | 14,282 |
| * MICROS Systems, Inc. | 275,636 | 13,694 |
| * Sonic Solutions, Inc. | 833,600 | 13,454 |
| * Opsware, Inc. | 1,203,800 | 10,943 |
| * salesforce.com, Inc. | 232,700 | 9,080 |
| * Sybase, Inc. | 353,791 | 8,615 |
| * Nuance Communications, Inc. | 746,410 | 8,614 |
| * Hyperion Solutions Corp. | 224,741 | 8,405 |
| * Transaction Systems Architects, Inc. | 248,144 | 8,365 |
| Jack Henry &Associates Inc. | 366,100 | 7,977 |
| * Quest Software, Inc. | 471,918 | 6,951 |
| * Ulticom, Inc. | 668,000 | 6,680 |
| * SPSS, Inc. | 237,087 | 6,560 |
| * Intergraph Corp. | 144,200 | 6,300 |
| * TIBCO Software Inc. | 637,400 | 5,896 |
| * Smith Micro Software, Inc. | 337,913 | 5,748 |
| * Witness Systems, Inc. | 310,183 | 5,503 |
| * Macrovision Corp. | 198,541 | 5,283 |
| * Autodesk, Inc. | 136,978 | 5,034 |
| * Novell, Inc. | 542,800 | 3,257 |
| * Activision, Inc. | 192,300 | 2,965 |
| Quality Systems, Inc. | 67,117 | 2,848 |
| * McAfee Inc. | 82,300 | 2,381 |
| * Advent Software, Inc. | 47,200 | 1,747 |
| * Mentor Graphics Corp. | 98,600 | 1,663 |
| * ANSYS, Inc. | 33,100 | 1,523 |
| * Radiant Systems, Inc. | 130,551 | 1,437 |
| QAD Inc. | 158,917 | 1,313 |
| * NetScout Systems, Inc. | 91,600 | 741 |
| * Net 1 UEPS Technologies, Inc. | 27,526 | 678 |
| * Compuware Corp. | 24,200 | 195 |
|
|
| | | 2,550,091 |
|
|
| Materials (4.7%) |
| Allegheny Technologies Inc. | 537,600 | 42,325 |
| AptarGroup Inc. | 631,400 | 34,670 |
| Steel Dynamics, Inc. | 566,900 | 34,076 |
| Albemarle Corp. | 436,250 | 28,369 |
| Carpenter Technology Corp. | 255,000 | 27,282 |
| Reliance Steel &Aluminum Co. | 781,866 | 26,857 |
| * Pactiv Corp. | 822,300 | 25,360 |
| * Hercules, Inc. | 1,356,500 | 24,688 |
| * AK Steel Corp. | 1,557,500 | 23,253 |
| ^ Cleveland-Cliffs Inc. | 521,798 | 22,067 |
| Eagle Materials, Inc. | 574,400 | 21,080 |
| Ferro Corp. | 1,037,900 | 20,467 |
| United States Steel Corp. | 301,700 | 20,395 |
| Martin Marietta Materials, Inc. | 220,700 | 19,422 |
| Minerals Technologies, Inc. | 335,000 | 18,479 |
| Commercial Metals Co. | 619,700 | 16,490 |
| Cytec Industries, Inc. | 281,800 | 15,609 |
| * Oregon Steel Mills, Inc. | 253,900 | 13,812 |
| Florida Rock Industries, Inc. | 263,700 | 11,313 |
| Airgas, Inc. | 281,300 | 10,636 |
| * RTI International Metals, Inc. | 157,900 | 9,682 |
| * Titanium Metals Corp. | 317,900 | 9,372 |
| * Hecla Mining Co. | 1,105,882 | 7,199 |
| Celanese Corp. Series A | 343,600 | 7,082 |
| Chaparral Steel Co. | 170,000 | 7,070 |
| NewMarket Corp. | 88,000 | 5,658 |
| Packaging Corp. of America | 206,200 | 4,736 |
| * W.R. Grace &Co. | 342,500 | 4,590 |
| * Stillwater Mining Co. | 366,900 | 3,944 |
| Greif Inc. Class A | 40,500 | 3,795 |
| AMCOL International Corp. | 136,500 | 3,591 |
| Ball Corp. | 81,700 | 3,398 |
| Quanex Corp. | 92,700 | 3,106 |
| Olympic Steel, Inc. | 101,600 | 2,509 |
| * Huntsman Corp. | 135,900 | 2,347 |
| A.M. Castle &Co. | 65,800 | 2,200 |
| * OM Group, Inc. | 35,000 | 1,995 |
| Sonoco Products Co. | 55,800 | 1,980 |
| * PolyOne Corp. | 224,800 | 1,843 |
| * Aleris International Inc. | 30,300 | 1,561 |
| * Century Aluminum Co. | 39,100 | 1,522 |
| Texas Industries, Inc. | 22,000 | 1,366 |
| * Crown Holdings, Inc. | 49,400 | 960 |
| * Nalco Holding Co. | 31,600 | 639 |
| International Flavors &Fragrances, Inc. | 2,300 | 98 |
|
|
| | | 548,893 |
|
|
| Telecommunication Services (0.8%) |
| * NeuStar, Inc. Class A | 740,015 | 21,623 |
| * Level 3 Communications, Inc. | 3,552,600 | 18,793 |
| * American Tower Corp. Class A | 252,295 | 9,088 |
| Telephone &Data Systems, Inc. | 151,073 | 7,380 |
| * SBA Communications Corp. | 249,625 | 6,667 |
| * Leap Wireless International, Inc. | 101,644 | 5,637 |
| Citizens Communications Co. | 377,600 | 5,536 |
| * Cincinnati Bell Inc. | 1,062,619 | 4,984 |
| ^ Golden Telecom, Inc. | 96,488 | 3,571 |
| * General Communication, Inc. | 244,030 | 3,199 |
| * Syniverse Holdings Inc. | 211,400 | 3,118 |
| * Cbeyond Inc. | 86,600 | 2,628 |
| Commonwealth Telephone Enterprises, Inc. | 38,978 | 1,632 |
| * U.S. Cellular Corp. | 18,400 | 1,167 |
| * Covad Communications Group, Inc. | 700,000 | 931 |
| North Pittsburgh Systems, Inc. | 29,409 | 775 |
| * Dobson Communications Corp. | 82,900 | 643 |
| * iPCS, Inc. | 9,180 | 495 |
| Atlantic Tele-Network, Inc. | 22,711 | 439 |
| Centennial Communications Corp. Class A | 42,892 | 221 |
| * Echelon Telecom, Inc. | 10,358 | 184 |
| Shenandoah Telecommunications Co. | 600 | 28 |
|
|
| | | 98,739 |
|
|
| Utilities (0.6%) |
| UGI Corp. Holding Co. | 686,200 | 18,184 |
| * El Paso Electric Co. | 775,900 | 18,125 |
| PNM Resources Inc. | 630,300 | 17,749 |
| CenterPoint Energy Inc. | 327,400 | 5,068 |
| Ormat Technologies Inc. | 106,000 | 4,070 |
| Equitable Resources, Inc. | 60,900 | 2,468 |
| ALLETE, Inc. | 32,100 | 1,448 |
| Cleco Corp. | 53,900 | 1,385 |
| IDACORP, Inc. | 33,600 | 1,325 |
| WGL Holdings Inc. | 37,200 | 1,207 |
| Southwest Gas Corp. | 25,000 | 897 |
| Portland General Electric Co. | 33,800 | 871 |
| Westar Energy, Inc. | 6,500 | 165 |
|
|
| | | 72,962 |
|
|
| Exchange-Traded Funds (1.4%) |
| ^2Vanguard Small-Cap ETF | 1,862,353 | 124,349 |
| ^2Vanguard Small-Cap Growth ETF | 713,200 | 45,395 |
|
|
| | | 169,744 |
|
|
|
| Total Common Stocks |
| (Cost $9,928,252) | | 11,380,378 |
|
| Temporary Cash Investments (4.7%)1 |
|
| Money Markets Fund (4.3%) |
|
| 3 Vanguard Market Liquidity Fund, 5.289% | 375,833,343 | 375,833 |
| 3 Vanguard Market Liquidity Fund, 5.289% | 123,763,230 | 123,763 |
|
|
| | | 499,596 |
|
|
|
| | Face |
| | Amount |
| | ($000) |
|
| Repurchase Agreement (0.2%) |
|
| Deutsche Bank 5.300%, 11/1/06 |
| (Dated 10/31/06, Repurchase Value |
| $27,604,000, Collateralized by |
| Federal Home Loan Mortgage Corp., |
| 5.000%-5.500%, 9/1/19-9/1/35) | 27,600 | 27,600 |
|
| U.S. Agency Obligations (0.2%) |
|
| 4 Federal Home Loan Mortgage Corp. |
| 5 5.187%, 2/16/07 | 2,000 | 1,970 |
| 5 5.150%, 12/26/06 | 20,000 | 19,845 |
|
|
| | | 21,815 |
|
| Total Temporary Cash Investments |
| (Cost $549,011) | | 549,011 |
|
| Total Investments (101.3%) |
| (Cost $10,477,263) | | 11,929,389 |
|
| Other Assets and Liabilities—Net (-1.3%) | | (148,149) |
|
| Net Assets (100%) | | 11,781,240 |
|
(a) Disclosure Controls and Procedures. The Principal Executive and Financial Officers concluded that the Registrant’s Disclosure Controls and Procedures are effective based on their evaluation of the Disclosure Controls and Procedures as of a date within 90 days of the filing date of this report.
(b) Internal Control Over Financial Reporting. There were no significant changes in Registrant’s internal control over financial reporting or in other factors that could significantly affect this control subsequent to the date of the evaluation, including any corrective actions with regard to significant deficiencies and material weaknesses.
(a) Code of Ethics.
(b) Certifications.
Pursuant to the requirements of the Securities Exchange Act of 1934 and the Investment Company Act of 1940, the registrant has duly caused this report to be signed on its behalf by the undersigned, thereunto duly authorized.
Pursuant to the requirements of the Securities Exchange Act of 1934 and the Investment Company Act of 1940, this report has been signed below by the following persons on behalf of the registrant and in the capacities and on the dates indicated.
* By Power of Attorney. See File Number 002-65955-99, filed on July 27, 2006. Incorporated by Reference.