UNITED STATES
SECURITIES AND EXCHANGE COMMISSION
Washington, D.C. 20549
FORM N-CSR
CERTIFIED SHAREHOLDER REPORT
OF
REGISTERED MANAGEMENT INVESTMENT COMPANIES
Investment Company Act file number: 811-1530
Name of Registrant: Vanguard Explorer Fund
Address of Registrant:
P.O. Box 2600
Valley Forge, PA 19482
Name and address of agent for service:
Heidi Stam, Esquire
P.O. Box 876
Valley Forge, PA 19482
Registrant’s telephone number, including area code: (610) 669-1000
Date of fiscal year end: October 31
Date of reporting period: November 1, 2007–October 31, 2008
Item 1: Reports to Shareholders

> For fiscal year 2008, Vanguard Explorer Fund returned about –40%, a disappointing result that nevertheless was a bit better than the returns of the fund’s comparative standards.
> All sectors posted double-digit declines as stocks suffered their worst losses since the 2000–2002 bear market.
> Information technology stocks, the fund’s largest position, were among the worst performers.
Contents | |
| |
Your Fund’s Total Returns | 1 |
President’s Letter | 2 |
Advisors’ Report | 7 |
Fund Profile | 13 |
Performance Summary | 14 |
Financial Statements | 16 |
Your Fund’s After-Tax Returns | 31 |
About Your Fund’s Expenses | 32 |
Glossary | 34 |
Please note: The opinions expressed in this report are just that—informed opinions. They should not be considered promises or advice. Also, please keep in mind that the information and opinions cover the period through the date on the front of this report. Of course, the risks of investing in your fund are spelled out in the prospectus.
Your Fund’s Total Returns
Fiscal Year Ended October 31, 2008 | | |
| Ticker | Total |
| Symbol | Returns |
Vanguard Explorer Fund | | |
Investor Shares | VEXPX | –40.17% |
AdmiralTM Shares1 | VEXRX | –40.07 |
Russell 2500 Growth Index | | –41.00 |
Average Small-Cap Growth Fund2 | | –42.01 |
Your Fund’s Performance at a Glance |
October 31, 2007–October 31, 2008 | | | | |
| | | Distributions Per Share |
| Starting | Ending | Income | Capital |
| Share Price | Share Price | Dividends | Gains |
Vanguard Explorer Fund | | | | |
Investor Shares | $83.93 | $45.54 | $0.310 | $6.786 |
Admiral Shares | 78.25 | 42.45 | 0.427 | 6.316 |
1 A lower-cost class of shares available to many longtime shareholders and to those with significant investments in the fund.
2 Derived from data provided by Lipper Inc.
1
President’s Letter

Dear Shareholder,
For the fiscal year ended October 31, 2008, Vanguard Explorer Fund returned –40.17% for Investor Shares and –40.07% for Admiral Shares. Although these results are disappointing in absolute terms—as were most equity returns for the period—they demonstrate relative strength.
After trailing the benchmark Russell 2500 Growth Index by more than 2 percentage points during the fiscal first half, Explorer finished the year ahead of the benchmark and retained a lead over its peer-group average. The advisors’ valuation-conscious approach to selecting growth stocks moderated the fund’s decline in the period’s tumultuous final months.
Effective August 7, the fund was reopened to all investors and the $25,000 annual investment limit was removed. Given the changes in the financial markets, Vanguard concluded that it was no longer necessary to restrict cash flows into the fund.
If you own shares of the fund in a taxable account, see page 31 for a report on after-tax returns for the 12 months, based on the highest tax bracket.
Stock prices fell sharply in a global upheaval
Global stock markets started the 12-month period near all-time highs, but then declined sharply, laid low by the financial crisis that originated in the fixed income markets. The descent traced a series of jagged ups and downs. During the week ended October 10, for example, the U.S. stock market returned about –18%. When
2
Wall Street opened the following Monday, stocks surged, returning more than 10% over the next six and a half hours.
For the full 12 months, the broad U.S. stock market returned –36.43%; international stocks returned –48.27%. The pain was especially acute in emerging markets—among the strongest performers in recent years—as investors became increasingly risk-averse.
Bond market averages masked disparate returns
The broad U.S. taxable bond market registered an unremarkable return of 0.30% for the 12 months, but by its own typically sedate standards, the dislocations were extreme. The strong performance of U.S. Treasury and government securities was offset by double-digit declines in the corporate bond market. These dynamics led to unusually large differences between the yields of Treasuries and their corresponding private-sector securities—both a reflection and a cause of the credit market’s distress. Despite their generally high creditworthiness, municipal bonds also fell in price, with the broad tax-exempt market registering a 12-month return of –3.30%.
The U.S. Federal Reserve Board responded to the turmoil with new lending programs and a dramatic easing of monetary policy. Over the full 12 months, the Fed reduced its target for the federal funds rate from 4.50% to 1.00%.
Market Barometer | | | |
| Average Annual Total Returns |
| Periods Ended October 31, 2008 |
| One Year | Three Years | Five Years |
Stocks | | | |
Russell 1000 Index (Large-caps) | –36.80% | –5.51% | 0.37% |
Russell 2000 Index (Small-caps) | –34.16 | –4.79 | 1.57 |
Dow Jones Wilshire 5000 Index (Entire market) | –36.43 | –5.10 | 0.81 |
MSCI All Country World Index ex USA (International) | –48.27 | –3.93 | 5.05 |
| | | |
| | | |
Bonds | | | |
Lehman U.S. Aggregate Bond Index (Broad taxable market) | 0.30% | 3.60% | 3.48% |
Lehman Municipal Bond Index | –3.30 | 1.71 | 2.73 |
Citigroup 3-Month Treasury Bill Index | 2.31 | 3.93 | 3.10 |
| | | |
| | | |
CPI | | | |
Consumer Price Index | 3.66% | 2.83% | 3.20% |
3
In the face of stiff headwinds, stock selection had mixed results
Information technology stocks—often regarded as “classic” growth stocks—continued to be the largest-weighted sector in the Explorer Fund, averaging almost one-quarter of the portfolio during the year. These stocks fell sharply as investors became anxious about the tech sector’s prospects, in view of both slower global economic growth and the major losses sustained by financial services firms, which are heavy users of technology.
The fund’s tech holdings returned –48%, accounting for more than one-quarter of the 12-month decline. Distress was widespread among the various technology segments, especially semiconductors, software, data processing, and communications equipment.
A sizable position in industrial stocks suffered a similar fate (–45%). The waning of the global boom in construction and infrastructure development weakened the performance of a wide range of equipment manufacturers. Even those involved in the burgeoning market for solar power were beaten back.
Health care holdings, the fund’s second-largest position during the year, offered scant relief. Bolstered by double-digit gains in several biotechnology companies, this sector (–30%) declined less than most.
Expense Ratios1 | | | |
Your Fund Compared With Its Peer Group | | | |
| | | Average |
| Investor | Admiral | Small-Cap |
| Shares | Shares | Growth Fund |
Explorer Fund | 0.41% | 0.23% | 1.61% |
1 The fund expense ratios shown are from the prospectus dated August 18, 2008. For the fiscal year ended October 31, 2008, the fund’s expense ratios were 0.44% for Investor Shares and 0.26% for Admiral Shares. The peer-group expense ratio is derived from data provided by Lipper Inc. and captures information through year-end 2007.
4
Purveyors of medical equipment and supplies, managed care companies, and life sciences systems and services companies were among the notably poor performers.
In an environment lacking many bright spots, the advisors’ selections among consumer staples and energy stocks kept the fund a few steps ahead of its benchmark. And, even though household budgets were under stress, the fund’s consumer discretionary holdings also held up better. Together, these three sectors added more than 2 percentage points to the fund’s return over its benchmark.
Over the fiscal year, two advisor-related changes were made, one of which was noted in the semiannual report.
In February, Vanguard Quantitative Equity Group added to its portion of the fund by assuming primary responsibility for the assets previously managed by Grantham, Mayo, Van Otterloo & Co. LLC. In June, Century Capital Management, LLC, joined the fund’s team of investment advisors. For more information on the fund’s positioning and performance during the year, please see the Advisors’ Report, which begins on page 7.
Risk/reward trade-offs are always part of investing
For the ten years ended October 31, 2008, Explorer Fund’s Investor Shares returned an average of 5.66% annually, a seemingly modest result that was nevertheless about 2 percentage points better than the benchmark index return and the average
Total Returns | |
Ten Years Ended October 31, 2008 | |
| Average |
| Annual Return |
Explorer Fund Investor Shares | 5.66% |
Russell 2500 Growth Index | 3.10 |
Average Small-Cap Growth Fund1 | 3.84 |
The figures shown represent past performance, which is not a guarantee of future results. (Current performance may be lower or higher than the performance data cited. For performance data current to the most recent month-end, visit our website at www.vanguard.com/performance.) Note, too, that both investment returns and principal value can fluctuate widely, so an investor’s shares, when sold, could be worth more or less than their original cost.
1 Derived from data provided by Lipper Inc.
5
return of small-cap growth funds. Your fund benefited from the skills of a diverse set of investment advisors with different, yet complementary, strategies, and also from its low expenses.
As shareholders, you know that Vanguard encourages investors not to evaluate a fund based on its short-term results, which can be quite volatile. But even long-term results can vary widely depending on when measurement begins and ends. Seemingly small shifts in starting and ending dates can produce significant changes in returns.
The decade through October 2008 is a case in point. The steep bear market of 2008 has joined the 2000–2002 bear market in the ten-year calculation. The impact of this one-year shift is dramatic: A year ago, Explorer Fund’s ten-year average annual return was a more robust 9.92%.
Some have dubbed the past ten years a “lost decade,” because bonds significantly outperformed most stocks, and many have noted the similarities with the decade ended in 1979. Such periods serve as an uncomfortable but useful reminder that, while stocks can be expected to outperform less-risky asset classes over time, they do not always do so.
Nevertheless, we believe that the case for long-term equity investing remains sound, and that recent experience should not fundamentally alter an investor’s long-term asset allocation target.
Although the stock market’s occasional rough patches can shake an investor’s confidence, history suggests that following the time-tested principles of diversification and balance among the major asset classes can put you in a good position to benefit from the market’s long-term opportunities. By offering exceptionally broad diversification—across small-cap growth-oriented stocks and across active investment strategies—the Explorer Fund can play a useful role in a well-designed portfolio.
Thank you for entrusting your assets to Vanguard.
Sincerely,

F. William McNabb III
President and Chief Executive Officer
November 12, 2008
6
Advisors’ Report
For the fiscal year ended October 31, 2008, Vanguard Explorer Fund returned –40.17% for Investor Shares (–40.07% for the lower-cost Admiral Shares). Your fund is managed by seven independent advisors. This provides exposure to distinct, yet complementary, investment approaches, enhancing the fund’s diversification.
The table on page 12 lists the advisors, the amount and percentage of fund assets each manages, and brief descriptions of their investment strategies. The advisors have also provided comments on their assessment of the investment environment during the past 12 months and the notable successes and shortfalls in their portfolios. These comments were prepared on November 11, 2008.
Granahan Investment
Management, Inc.
Portfolio Manager:
Jack Granahan, Managing Partner
Investment environment: The credit issues that surfaced in mid-2007 have turned concern into a severe global slowdown. Although the massive monetary injections by governments could eventually help, it appears that lower asset prices will be necessary to stabilize effective demand. Current trends in employment are not encouraging. Positive factors for equities still include generally good corporate balance sheets and very conservative guidance by most management teams; time will tell whether they have been sufficiently conservative. The sharp reduction in equity prices probably reflects most of these lower expectations, thus possibly offering significant investment potential in the few companies that can show growth.
Successes: We generally measure success this year in relative rather than absolute terms. Only 12% of the companies in our portion of the portfolio had gains, and only one of our ten industry sectors produced absolute gains—consumer staples. Our largest sector, health care, did have several significant winners, including Rigel Pharmaceuticals, with good clinical results for a rheumatoid arthritis drug; Axcan Pharma, which was acquired; and Haemonetics, on the strength of its accelerating earnings case. We kept Haemonetics and sold the other two. Our strategy in health care is to emphasize companies that reduce costs, improve patient outcome, and have low reimbursement risk.
Shortfalls: In a reversal from last year, our technology stocks faced severe pressure as the slowdown in enterprise spending on information technology spread from the United States to Europe, which has been a solid source of growth. This caused us to shift our overweighted position to benchmark-neutral. Company-specific factors affected firms such as VeriFone Holdings, only now emerging from issues with a new enterprise resource system, and Cadence Design Systems, with weak demand for its design software combined with changed product pricing. Ciena was cyclically affected as its telecommunications customers pushed out orders. We added to VeriFone, reduced our position in Cadence, and eliminated Ciena.
7
Kalmar Investment Advisers
Portfolio Manager: Ford B. Draper, Jr.,
President and Chief Investment Officer
Investment environment: With central bankers and governments around the world pulling out all policy stops to resolve the financial crisis and revive growth, the credit freeze should gradually thaw. Meanwhile, the real economy will get worse before it improves. As stock markets come to grips with the decline in earnings prospects, they will stabilize and start to rise well before the economy; indeed, markets may have discounted much of the earnings decline already. Taking a longer-term perspective, from today’s very depressed levels, we believe the stock market represents a generational opportunity for exceptional future returns.
Successes: Our holdings in energy—notably, exploration and production companies—and in IT, consumer discretionary, and industrial firms such as equipment makers, generally held up better than the market because of their stronger business prospects and finances. Our best gain resulted from the takeover of Longs Drug Stores.
Shortfalls: Most of our other sector exposures generally kept pace with the declining market, though we suffered by owning no biotech companies, which were among the few stocks that rose. Our biggest disappointment was Chicago Bridge & Iron, which incurred losses on two significant liquefied natural gas construction projects.
Wellington Management Company, LLP
Portfolio Manager:
Kenneth L. Abrams,
Senior Vice President and Partner
Investment environment: Equity markets fell sharply in the period amid a significant deterioration in both credit-market conditions and investor confidence. Forced deleveraging by financial institutions triggered an unprecedented set of bank failures and mergers, reshaping the global financial map. Impaired access to capital spilled over into the real economy, and reduced expectations for global growth forced energy and commodity prices sharply lower.
Successes: In the consumer discretionary sector, DreamWorks Animation shares gained on solid first-quarter earnings that exceeded expectations. People’s United Financial shares benefited from management’s ability to avoid subprime loans and much of the resulting credit crisis.
Shortfalls: Shares of managed care provider Health Net fell after management lowered its fiscal year earnings forecast due to disappointing third-quarter results. In the industrials sector, shares of Hong Kong-based China Everbright International—an environmental
8
protection investment firm—fell after the company reported lower-than-expected third-quarter earnings.
Vanguard Quantitative Equity Group
Portfolio Manager:
James D. Troyer, CFA, Principal
Investment environment: The stock market return for January–October 2008 was among the worst-five calendar-year results since 1926. Mid- and small-cap growth stocks declined more than their value-oriented counterparts. In our model, the valuation component added the most value to our portion of the portfolio; the market-sentiment and earnings-quality components were neutral for the 12 months.
Successes: Health care, especially equipment providers, was one of our best-performing sectors. Longs Drug Stores and respiratory-device-maker Respironics posted gains. Consumer staples companies—notably, retailers of food and other household staples—were also among our best performers.
Shortfalls: As it was during the fiscal first half, capital goods was our worst-performing industry for the year. Manitowoc, a diversified manufacturer of industrial equipment, was our worst pick.
AXA Rosenberg Investment Management LLC
Portfolio Manager: William E. Ricks, Ph.D.
Americas Chief Executive and Chief
Investment Officer
Investment environment: Equity markets in the United States and around the globe tumbled as the U.S. financial crisis entered a critical crossroads and extreme volatility and economic uncertainty dominated markets. Valuation differentials between companies have expanded, and investors have increasingly taken disparate views on individual companies’ earnings and return potential. We remain focused on fundamental stock selection driven by earnings and valuations.
Successes: Our portion of the portfolio had a persistent, albeit modest, underweighting to consumer discretionary stocks, which proved to be among the weakest performers for the 12 months. Stock selection within the sector also added significant value: We overweighted Priceline.com and underweighted Sirius XM Radio and Goodyear Tire & Rubber. Stock selection in the financial and health care sectors also added to our performance. In financials, persistent underweighting to banks, broker/dealers, and real estate investment trusts (REITs) paid off.
9
Shortfalls: Global cyclicals sold off sharply on the depressed economic outlook. Our stock selection was weak in the energy and industrial sectors, particularly with overweightings in ATP Oil & Gas, Rowan Companies, and Manitowoc: All three suffered significant share price drops.
Chartwell Investment Partners, L.P.
Portfolio Managers:
Edward N. Antoian,
CFA, CPA, Managing Partner
John A. Heffern, Managing Partner
Investment Environment: “Change” is the big theme for the period just ended and for the quarters ahead: change in political direction, economic conditions, climate patterns, global order, and market leadership. In many important areas of our lives, change has arrived or is on the way, and few are prepared. This change ushers in another important theme: “adaptation.” Managements, companies, even social orders are buffeted by change, but ultimately most will adapt to new realities, eventually grow, and thrive.
Successes: On a relative basis, providers of business services were our top performers. FTI Consulting posted a gain, as its outsourced services were in great demand during the economic downturn. Low exposure to consumer cyclicals also added value.
Shortfalls: Stock selection in capital spending and basic industry significantly detracted from the performance of our portion of the portfolio. AerCap Holdings, an integrated global aviation company whose principal business activity is aircraft leasing, was hindered by the unprecedented rise in commodity prices during late spring and early summer. We expect the stock to rebound, as oil prices have fallen to levels that are profitable for the airline industry.
Century Capital Management, LLC
Portfolio Manager:
Alexander L.Thorndike,
Chief Investment Officer and
Managing Partner
Investment Environment: It will take time to assess the U.S. government’s management of the financial bailout plan announced in October, as well as its fiscal stimulus packages and the Federal Reserve Board’s interest rate cuts. We expect these actions will eventually stabilize the capital markets and lubricate the wheels of a sustainable recovery. We do, however, believe that increased regulation and oversight will redefine the relationship between commerce and government. Patience and persistence are required during the current downturn. We continue to believe that future corporate earnings expectations remain too high, but we are encouraged that equity valuations appear to be at 30-year lows. We are cautiously optimistic that current market
10
conditions may allow us to invest in tomorrow’s leadership franchises at today’s laggard valuations.
Successes: Since Century Capital Management became an investment advisor to the Explorer Fund in early June, the information technology and consumer staples sectors have contributed most to the performance of our portion of the portfolio. Websense and Ralcorp Holdings were among our best-performing stocks. Websense recently reported better-than-expected quarterly earnings and raised expectations for 2008. Ralcorp benefited from a “trade-down” trend by cost-conscious consumers from branded to private-label products.
Shortfalls: The health care and industrials sectors detracted most from our performance. Bruker and General Cable were among the worst performers for the period. Bruker recently reported below-expectation sales for its scientific instruments, and General Cable was hurt by the global economic slowdown in infrastructure spending.
11
Vanguard Explorer Fund Investment Advisors | | |
| | | |
| Fund Assets Managed | |
Investment Advisor | % | $ Million | Investment Strategy |
Granahan Investment | 26 | 1,857 | Bases its investment process on the beliefs that |
Management, Inc. | | | earnings drive stock prices and that small, dynamic |
| | | companies with exceptional growth prospects have the |
| | | greatest long-term potential. A bottom-up, fundamental |
| | | approach places companies in one of three life-cycle |
| | | categories: pioneer, core growth, and special situation. |
| | | In each, the process looks for companies with strong |
| | | earnings growth and leadership in their markets. |
Kalmar Investment Advisers | 14 | 1,002 | Employs a “growth with value” strategy using creative, |
| | | bottom-up research to uncover vigorously growing, |
| | | high-quality businesses. The process also seeks out |
| | | stocks that are inefficiently valued or that offer value |
| | | through longer-term company ownership. The strategy |
| | | has a dual objective of superior returns with lower risk. |
Wellington Management | 14 | 993 | Conducts research and analysis of individual companies |
Company, LLP | | | to select stocks believed to have exceptional growth |
| | | potential relative to their market valuations. Each stock |
| | | is considered individually before purchase, and company |
| | | developments are continually monitored for comparison |
| | | with expectations for growth. |
Vanguard Quantitative | 14 | 974 | Employs a quantitative fundamental management |
Equity Group | | | approach, using models that assess valuation, market |
| | | sentiment, and earnings quality of companies as |
| | | compared with their peers. |
AXA Rosenberg Investment | 12 | 878 | Employs an investment philosophy grounded in funda- |
Management LLC | | | mental analysis using a two-part quantitative model: |
| | | a valuation model, which compares a stock’s price to |
| | | its fair value, and an earnings forecast model, which |
| | | identifies companies likely to have superior earnings. |
Chartwell Investment Partners, L.P. | 9 | 601 | Uses a bottom-up, fundamental, research-driven stock- |
| | | selection strategy focusing on companies with sustain- |
| | | able growth, strong management teams, competitive |
| | | positions, and outstanding product and service offerings. |
| | | These companies should continually demonstrate |
| | | growth in earnings per share. |
Century Capital Management, LLC | 6 | 394 | Employs a fundamental, bottom-up approach that |
| | | attempts to identify reasonably priced companies that |
| | | will grow faster than the overall market. Companies |
| | | also must have a superior return on equity, high |
| | | recurring revenues, and improving margins. |
Cash Investments | 5 | 350 | These short-term reserves are invested by Vanguard |
| | | in equity index products to simulate investment in |
| | | stocks. Each advisor also may maintain a modest cash |
| | | position. |
| | | | | |
12
Explorer Fund
Fund Profile
As of October 31, 2008
Portfolio Characteristics | | |
| | Comparative | Broad |
| Fund | Index1 | Index2 |
Number of Stocks | 991 | 1,516 | 4,647 |
Median Market Cap | $1.7B | $1.7B | $27.5B |
Price/Earnings Ratio | 16.2x | 17.5x | 12.8x |
Price/Book Ratio | 1.9x | 2.2x | 1.8x |
Yield3 | | 0.9% | 2.6% |
Investor Shares | 0.3% | | |
Admiral Shares | 0.5% | | |
Return on Equity | 15.4% | 16.3% | 20.4% |
Earnings Growth Rate | 23.0% | 21.4% | 17.8% |
Foreign Holdings | 3.1% | 0.0% | 0.0% |
Turnover Rate | 112% | — | — |
Expense Ratio | | | |
(10/31/2007)4 | | — | — |
Investor Shares | 0.41% | | |
Admiral Shares | 0.23% | | |
Short-Term Reserves | 2.5% | — | — |
Sector Diversification (% of equity exposure) |
| | Comparative | Broad |
| Fund | Index1 | Index2 |
Consumer Discretionary | 12.8% | 15.0% | 8.8% |
Consumer Staples | 4.1 | 3.5 | 11.1 |
Energy | 7.2 | 8.2 | 12.5 |
Financials | 7.6 | 6.2 | 16.7 |
Health Care | 20.8 | 22.0 | 13.7 |
Industrials | 16.8 | 19.5 | 11.1 |
Information Technology | 24.6 | 19.2 | 15.6 |
Materials | 4.4 | 4.5 | 3.4 |
Telecommunication | | | |
Services | 0.8 | 1.1 | 3.0 |
Utilities | 0.9 | 0.8 | 4.1 |
Volatility Measures5 | |
| Fund Versus | Fund Versus |
| Comparative Index1 | Broad Index2 |
R-Squared | 0.99 | 0.93 |
Beta | 0.95 | 1.20 |
Ten Largest Holdings6 (% of portfolio) | |
| | |
Cephalon, Inc. | biotechnology | 1.4% |
Microsemi Corp. | semiconductors | 1.0 |
O'Reilly Automotive, Inc. | automotive retail | 0.8 |
DeVry, Inc. | education services | 0.7 |
Polycom, Inc. | communications | |
| equipment | 0.7 |
AptarGroup Inc. | metal and glass | |
| containers | 0.7 |
Henry Schein, Inc. | health care | |
| distributors | 0.7 |
The Dun & Bradstreet Corp. | diversified | |
| commercial and | |
| professional services | 0.7 |
Alliance Data Systems Corp. | data processing and | |
| outsourced services | 0.7 |
Stericycle, Inc. | environmental and | |
| facilities services | 0.6 |
Top Ten | | 8.0% |
1 Russell 2500 Growth Index.
2 Dow Jones Wilshire 5000 Index.
3 30-day SEC yield for the fund; annualized dividend yield for the indexes. See the Glossary.
4 The expense ratios shown are from the prospectus dated August 18, 2008. For the fiscal year ended October 31, 2008, expense ratios were 0.44% for Investor Shares and 0.26% for Admiral Shares.
5 For an explanation of R-squared, beta, and other terms used here, see the Glossary.
6 The holdings listed exclude any temporary cash investments and equity index products.
13
Explorer Fund
Performance Summary
All of the returns in this report represent past performance, which is not a guarantee of future results that may be achieved by the fund. (Current performance may be lower or higher than the performance data cited. For performance data current to the most recent month-end, visit our website at www.vanguard.com/performance.) Note, too, that both investment returns and principal value can fluctuate widely, so an investor’s shares, when sold, could be worth more or less than their original cost. The returns shown do not reflect taxes that a shareholder would pay on fund distributions or on the sale of fund shares.
Cumulative Performance: October 31, 1998–October 31, 2008
Initial Investment of $10,000

| Average Annual Total Returns | Final Value |
| Periods Ended October 31, 2008 | of a $10,000 |
| One Year | Five Years | Ten Years | Investment |
Explorer Fund Investor Shares1 | –40.17% | –0.98% | 5.66% | $17,347 |
Dow Jones Wilshire 5000 Index | –36.43 | 0.81 | 1.27 | 11,350 |
Russell 2500 Growth Index | –41.00 | –0.17 | 3.10 | 13,574 |
Average Small-Cap Growth Fund2 | –42.01 | –2.04 | 3.84 | 14,572 |
| | | | Final Value |
| | | Since | of a $100,000 |
| One Year | Five Years | Inception3 | Investment |
Explorer Fund Admiral Shares | –40.07% | –0.81% | 1.78% | $113,058 |
Dow Jones Wilshire 5000 Index | –36.43 | 0.81 | 0.94 | 106,766 |
Russell 2500 Growth Index | –41.00 | –0.17 | 1.34 | 109,738 |
1 Total returns do not include the account service fee that may be applicable to certain accounts with balances below $10,000.
2 Derived from data provided by Lipper Inc.
3 Performance for the fund’s Admiral Shares and comparative standards is calculated since the Admiral Shares’ inception: November 12, 2001.
14
Explorer Fund
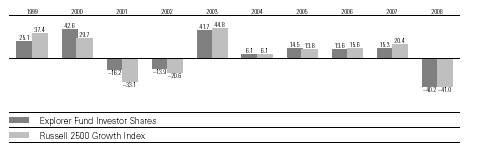
Fiscal-Year Total Returns (%): October 31, 1998–October 31, 2008
Average Annual Total Returns: Periods Ended September 30, 2008
This table presents average annual total returns through the latest calendar quarter—rather than through the end of the fiscal period. Securities and Exchange Commission rules require that we provide this information.
| Inception Date | One Year | Five Years | Ten Years |
Investor Shares1 | 12/11/1967 | –22.57% | 5.51% | 8.87% |
Admiral Shares | 11/12/2001 | –22.44 | 5.68 | 5.292 |
1 Total returns do not include the account service fee that may be applicable to certain accounts with balances below $10,000.
2 Return since inception.
Note: See Financial Highlights tables for dividend and capital gains information.
15
Explorer Fund
Financial Statements
Statement of Net Assets—Investments Summary
As of October 31, 2008
This Statement summarizes the fund’s holdings by asset type (common stocks, bonds, etc.) and by industry sector. Details are reported for each of the fund’s 50 largest individual holdings and for investments that, in total for any issuer, represent more than 1% of the fund’s net assets. The total value of smaller holdings is reported as a single amount within each category.
The fund provides a complete list of its holdings four times in each fiscal year, at the quarter-ends. For the second and fourth fiscal quarters, the complete listing of the fund’s holdings is available electronically on Vanguard.com and on the Securities and Exchange Commission’s website (www.sec.gov), or you can have it mailed to you without charge by calling 800-662-7447. For the first and third fiscal quarters, the fund files the lists with the SEC on Form N-Q. Shareholders can look up the fund’s Forms N-Q on the SEC’s website. Forms N-Q may also be reviewed and copied at the SEC’s Public Reference Room (see the back cover of this report for further information).
| | | Market | Percentage |
| | | Value• | of Net |
| | Shares | ($000) | Assets |
Common Stocks | | | |
Consumer Discretionary | | | |
* | O’Reilly Automotive, Inc. | 2,043,012 | 55,386 | 0.8% |
| DeVry, Inc. | 901,870 | 51,127 | 0.7% |
* | Dollar Tree, Inc. | 901,451 | 34,273 | 0.5% |
| Service Corp. International | 4,801,600 | 33,131 | 0.5% |
* | DreamWorks Animation SKG, Inc. | 997,967 | 28,043 | 0.4% |
| Ross Stores, Inc. | 810,297 | 26,489 | 0.4% |
* | WMS Industries, Inc. | 1,025,099 | 25,627 | 0.4% |
† | Consumer Discretionary—Other | | 583,337 | 8.2% |
| | | 837,413 | 11.9% |
Consumer Staples | | | |
*,^ | Chattem, Inc. | 349,383 | 26,438 | 0.4% |
| Church & Dwight, Inc. | 440,640 | 26,037 | 0.4% |
* | Ralcorp Holdings, Inc. | 380,100 | 25,725 | 0.4% |
† | Consumer Staples—Other | | 188,492 | 2.6% |
| | | 266,692 | 3.8% |
Energy | | | |
* | Ultra Petroleum Corp. | 656,350 | 30,553 | 0.4% |
* | Comstock Resources, Inc. | 617,303 | 30,507 | 0.4% |
* | Atwood Oceanics, Inc. | 992,540 | 27,275 | 0.4% |
* | Southwestern Energy Co. | 755,580 | 26,914 | 0.4% |
† | Energy—Other | | 356,242 | 5.1% |
| | | 471,491 | 6.7% |
Exchange-Traded Funds | | | |
1 | Vanguard Small-Cap ETF | 1,165,083 | 54,304 | 0.8% |
1 | Vanguard Small-Cap Growth ETF | 713,200 | 32,893 | 0.4% |
| | | 87,197 | 1.2% |
16
Explorer Fund
| | | Market | Percentage |
| | | Value• | of Net |
| | Shares | ($000) | Assets |
Financials | | | |
| Cash America International Inc. | 965,000 | 34,132 | 0.5% |
| People’s United Financial Inc. | 1,619,975 | 28,350 | 0.4% |
2 | Advanta Corp. Class A | 1,023,300 | 2,425 | 0.0% |
† | Financials—Other | | 386,579 | 5.5% |
| | | 451,486 | 6.4% |
Health Care | | | |
* | Cephalon, Inc. | 1,353,105 | 97,045 | 1.4% |
* | Henry Schein, Inc. | 1,016,292 | 47,573 | 0.7% |
* | Edwards Lifesciences Corp. | 702,820 | 37,137 | 0.5% |
* | IDEXX Laboratories Inc. | 1,007,150 | 35,442 | 0.5% |
| DENTSPLY International Inc. | 1,086,989 | 33,023 | 0.5% |
* | ResMed Inc. | 960,360 | 32,902 | 0.5% |
* | Alexion Pharmaceuticals, Inc. | 802,440 | 32,699 | 0.5% |
| Pharmaceutical Product Development, Inc. | 1,041,456 | 32,264 | 0.5% |
* | Psychiatric Solutions, Inc. | 955,750 | 31,817 | 0.5% |
* | Regeneron Pharmaceuticals, Inc. | 1,638,064 | 31,615 | 0.5% |
* | Haemonetics Corp. | 479,400 | 28,313 | 0.4% |
* | Alkermes, Inc. | 2,819,600 | 27,858 | 0.4% |
* | Endo Pharmaceuticals Holdings, Inc. | 1,428,740 | 26,432 | 0.4% |
| PDL BioPharma Inc. | 2,540,768 | 24,772 | 0.4% |
† | Health Care—Other | | 860,537 | 11.9% |
| | | 1,379,429 | 19.6% |
Industrials | | | |
| The Dun & Bradstreet Corp. | 634,100 | 46,727 | 0.7% |
* | Stericycle, Inc. | 778,680 | 45,498 | 0.7% |
| MSC Industrial Direct Co., Inc. Class A | 1,016,340 | 36,446 | 0.5% |
* | Kansas City Southern | 887,351 | 27,393 | 0.4% |
* | RBC Bearings Inc. | 1,041,518 | 24,715 | 0.4% |
† | Industrials—Other | | 919,201 | 12.9% |
| | | 1,099,980 | 15.6% |
| Information Technology | | | |
* | Microsemi Corp. | 3,113,380 | 67,685 | 1.0% |
* | Polycom, Inc. | 2,342,445 | 49,215 | 0.7% |
* | Alliance Data Systems Corp. | 921,404 | 46,218 | 0.7% |
* | Mettler-Toledo International Inc. | 547,131 | 41,877 | 0.6% |
* | Ariba, Inc. | 3,517,009 | 37,632 | 0.5% |
* | FEI Co. | 1,602,502 | 33,669 | 0.5% |
| FactSet Research Systems Inc. | 784,550 | 30,433 | 0.4% |
^ | Heartland Payment Systems, Inc. | 1,706,992 | 29,719 | 0.4% |
* | VeriFone Holdings, Inc. | 2,396,300 | 27,222 | 0.4% |
* | ON Semiconductor Corp. | 5,071,025 | 25,913 | 0.4% |
* | Riverbed Technology, Inc. | 1,987,900 | 24,908 | 0.4% |
† | Information Technology—Other | | 1,225,844 | 17.3% |
| | | 1,640,335 | 23.3% |
Materials | | | |
| AptarGroup Inc. | 1,579,600 | 47,893 | 0.7% |
| Sensient Technologies Corp. | 1,273,300 | 32,125 | 0.5% |
| Albemarle Corp. | 1,021,170 | 24,866 | 0.4% |
† | Materials—Other | | 182,141 | 2.5% |
| | | 287,025 | 4.1% |
| | | | |
† Telecommunication Services | | 48,438 | 0.7% |
| | | | |
† Utilities | | 46,243 | 0.6% |
Total Common Stocks (Cost $8,676,933) | | 6,615,729 | 93.9%3 |
17
Explorer Fund
| | | Market | Percentage |
| | | Value• | of Net |
| | Shares | ($000) | Assets |
Temporary Cash Investments | | | |
Money Market Fund | | | |
4,5 | Vanguard Market Liquidity Fund, 2.217% | 460,318,555 | 460,319 | 6.5% |
| | | | |
| | | | |
| | Face | | |
| | Amount | | |
| | ($000) | | |
Repurchase Agreement | | | |
| JPMorgan Securities Inc. 0.230%, 11/3/08 | | | |
| (Dated 10/31/08, Repurchase Value $41,901,000, | | | |
| collateralized by Federal National Mortgage Assn. | | | |
| 5.500%, 9/1/35–6/1/38) | 41,900 | 41,900 | 0.6% |
| | | | |
†6U.S. Government Agency Obligations | | 26,984 | 0.4% |
Total Temporary Cash Investments (Cost $529,196) | | 529,203 | 7.5%3 |
Total Investments (Cost $9,206,129) | | 7,144,932 | 101.4% |
Other Assets and Liabilities | | | |
Other Assets | | 83,310 | 1.2% |
Liabilities5 | | (179,169) | (2.6%) |
| | | (95,859) | (1.4%) |
Net Assets | | 7,049,073 | 100.0% |
18
Explorer Fund
At October 31, 2008, net assets consisted of: | |
| Amount |
| ($000) |
Paid-in Capital | 9,943,754 |
Undistributed Net Investment Income | 13,262 |
Accumulated Net Realized Losses | (834,803) |
Unrealized Appreciation (Depreciation) | |
Investment Securities | (2,061,197) |
Futures Contracts | (11,848) |
Foreign Currencies | (95) |
Net Assets | 7,049,073 |
| |
| |
Investor Shares—Net Assets | |
Applicable to 110,366,834 outstanding $.001 par value shares of | |
beneficial interest (unlimited authorization) | 5,025,715 |
Net Asset Value Per Share—Investor Shares | $45.54 |
| |
| |
Admiral Shares—Net Assets | |
Applicable to 47,668,092 outstanding $.001 par value shares of | |
beneficial interest (unlimited authorization) | 2,023,358 |
Net Asset Value Per Share—Admiral Shares | $42.45 |
• See Note A in Notes to Financial Statements.
* Non-income-producing security.
^ Part of security position is on loan to broker-dealers. The total value of securities on loan is $82,936,000.
† Represents the aggregate value, by category, of securities that are not among the 50 largest holdings and, in total for any issuer, represent 1% or less of net assets.
1 Considered an affiliated company of the fund as the issuer is another member of The Vanguard Group.
2 Considered an affiliated company of the fund as the fund owns more than 5% of the outstanding voting securities of such company.
3 The fund invests a portion of its cash reserves in equity markets through the use of index futures contracts. After giving effect to futures investments, the fund’s effective common stock and temporary cash investment positions represent 97.6% and 3.8%, respectively, of net assets.
4 Affiliated money market fund available only to Vanguard funds and certain trusts and accounts managed by Vanguard. Rate shown is the 7-day yield.
5 Includes $84,415,000 of collateral received for securities on loan.
6 Securities with a value of $26,984,000 have been segregated as initial margin for open futures contracts.
See accompanying Notes, which are an integral part of the Financial Statements.
19
Explorer Fund
Statement of Operations
| Year Ended |
| October 31, 2008 |
| ($000) |
Investment Income | |
Income | |
Dividends1,2 | 58,761 |
Interest2 | 18,290 |
Security Lending | 8,613 |
Total Income | 85,664 |
Expenses | |
Investment Advisory Fees—Note B | |
Basic Fee | 17,981 |
Performance Adjustment | (2,213) |
The Vanguard Group—Note C | |
Management and Administrative—Investor Shares | 18,898 |
Management and Administrative—Admiral Shares | 2,208 |
Marketing and Distribution—Investor Shares | 1,621 |
Marketing and Distribution—Admiral Shares | 794 |
Custodian Fees | 88 |
Auditing Fees | 34 |
Shareholders’ Reports—Investor Shares | 237 |
Shareholders’ Reports—Admiral Shares | 112 |
Trustees’ Fees and Expenses | 17 |
Total Expenses | 39,777 |
Expenses Paid Indirectly | (529) |
Net Expenses | 39,248 |
Net Investment Income | 46,416 |
Realized Net Gain (Loss) | |
Investment Securities Sold2 | (701,538) |
Futures Contracts | (94,115) |
Covered Call Options Written | 835 |
Foreign Currencies | (257) |
Realized Net Gain (Loss) | (795,075) |
Change in Unrealized Appreciation (Depreciation) | |
Investment Securities | (4,085,912) |
Futures Contracts | (27,274) |
Covered Call Options Written | — |
Foreign Currencies | (108) |
Change in Unrealized Appreciation (Depreciation) | (4,113,294) |
Net Increase (Decrease) in Net Assets Resulting from Operations | (4,861,953) |
1 Dividends are net of foreign withholding taxes of $541,000.
2 Dividend income, interest income, and realized net gain (loss) from affiliated companies of the fund were $2,001,000, $15,907,000, and ($11,440,000), respectively.
See accompanying Notes, which are an integral part of the Financial Statements.
20
Explorer Fund
Statement of Changes in Net Assets
| Year Ended October 31, |
| 2008 | 2007 |
| ($000) | ($000) |
Increase (Decrease) in Net Assets | | |
Operations | | |
Net Investment Income | 46,416 | 59,448 |
Realized Net Gain (Loss) | (795,075) | 1,101,439 |
Change in Unrealized Appreciation (Depreciation) | (4,113,294) | 583,721 |
Net Increase (Decrease) in Net Assets Resulting from Operations | (4,861,953) | 1,744,608 |
Distributions | | |
Net Investment Income | | |
Investor Shares | (32,844) | (33,478) |
Admiral Shares | (19,834) | (18,985) |
Realized Capital Gain1 | | |
Investor Shares | (718,966) | (776,690) |
Admiral Shares | (293,376) | (300,195) |
Total Distributions | (1,065,020) | (1,129,348) |
Capital Share Transactions | | |
Investor Shares | 294,591 | (19,018) |
Admiral Shares | 92,430 | 211,543 |
Net Increase (Decrease) from Capital Share Transactions | 387,021 | 192,525 |
Total Increase (Decrease) | (5,539,952) | 807,785 |
Net Assets | | |
Beginning of Period | 12,589,025 | 11,781,240 |
End of Period2 | 7,049,073 | 12,589,025 |
1 Includes fiscal 2008 and 2007 short-term gain distributions totaling $233,468,000 and $122,716,000, respectively. Short-term gain distributions are treated as ordinary income dividends for tax purposes.
2 Net Assets—End of Period includes undistributed net investment income of $13,262,000 and $18,187,000. See accompanying Notes, which are an integral part of the Financial Statements.
21
Explorer Fund
Financial Highlights
Investor Shares | | | | | |
| | | | | |
| | | | | |
| | | | |
For a Share Outstanding | Year Ended October 31, |
Throughout Each Period | 2008 | 2007 | 2006 | 2005 | 2004 |
Net Asset Value, Beginning of Period | $83.93 | $80.26 | $76.67 | $67.01 | $63.17 |
Investment Operations | | | | | |
Net Investment Income (Loss) | .295 | .362 | .302 | .111 | (.050) |
Net Realized and Unrealized Gain (Loss) | | | | | |
on Investments | (31.589) | 11.052 | 9.724 | 9.622 | 3.890 |
Total from Investment Operations | (31.294) | 11.414 | 10.026 | 9.733 | 3.840 |
Distributions | | | | | |
Dividends from Net Investment Income | (.310) | (.320) | (.230) | — | — |
Distributions from Realized Capital Gains | (6.786) | (7.424) | (6.206) | (.073) | — |
Total Distributions | (7.096) | (7.744) | (6.436) | (.073) | — |
Net Asset Value, End of Period | $45.54 | $83.93 | $80.26 | $76.67 | $67.01 |
| | | | | |
| | | | | |
Total Return1 | –40.17% | 15.31% | 13.59% | 14.53% | 6.08% |
| | | | | |
| | | | | |
Ratios/Supplemental Data | | | | | |
Net Assets, End of Period (Millions) | $5,026 | $8,937 | $8,517 | $7,836 | $7,302 |
Ratio of Total Expenses to | | | | | |
Average Net Assets2 | 0.44% | 0.41% | 0.46% | 0.51% | 0.57% |
Ratio of Net Investment Income (Loss) to | | | | | |
Average Net Assets | 0.40% | 0.44% | 0.36% | 0.16% | (0.11%) |
Portfolio Turnover Rate | 112% | 90% | 96% | 80% | 82% |
1 Total returns do not include the account service fee that may be applicable to certain accounts with balances below $10,000.
2 Includes performance-based investment advisory fee increases (decreases) of (0.02%), (0.04%), (0.03%), (0.01%), and 0.02%. See accompanying Notes, which are an integral part of the Financial Statements.
22
Explorer Fund
Financial Highlights
Admiral Shares | | | | | |
| | | | | |
| | | | |
For a Share Outstanding | Year Ended October 31, |
Throughout Each Period | 2008 | 2007 | 2006 | 2005 | 2004 |
Net Asset Value, Beginning of Period | $78.25 | $74.82 | $71.47 | $62.37 | $58.71 |
Investment Operations | | | | | |
Net Investment Income | .385 | .478 | .422 | .215 | .040 |
Net Realized and Unrealized Gain (Loss) | | | | | |
on Investments | (29.442) | 10.299 | 9.050 | 8.953 | 3.620 |
Total from Investment Operations | (29.057) | 10.777 | 9.472 | 9.168 | 3.660 |
Distributions | | | | | |
Dividends from Net Investment Income | (.427) | (.437) | (.346) | — | — |
Distributions from Realized Capital Gains | (6.316) | (6.910) | (5.776) | (.068) | — |
Total Distributions | (6.743) | (7.347) | (6.122) | (.068) | — |
Net Asset Value, End of Period | $42.45 | $78.25 | $74.82 | $71.47 | $62.37 |
| | | | | |
| | | | | |
Total Return | –40.07% | 15.53% | 13.79% | 14.70% | 6.23% |
| | | | |
| | | | |
Ratios/Supplemental Data | | | | |
Net Assets, End of Period (Millions) | $2,023 | $3,652 | $3,264 | $2,402 | $1,161 |
Ratio of Total Expenses to | | | | | |
Average Net Assets1 | 0.26% | 0.23% | 0.28% | 0.34% | 0.43% |
Ratio of Net Investment Income to | | | | | |
Average Net Assets | 0.58% | 0.62% | 0.54% | 0.33% | 0.04% |
Portfolio Turnover Rate | 112% | 90% | 96% | 80% | 82% |
| | | | | | |
1 Includes performance-based investment advisory fee increases (decreases) of (0.02%), (0.04%), (0.03%), (0.01%), and 0.02%. See accompanying Notes, which are an integral part of the Financial Statements.
23
Explorer Fund
Notes to Financial Statements
Vanguard Explorer Fund is registered under the Investment Company Act of 1940 as an open-end investment company, or mutual fund. The fund offers two classes of shares: Investor Shares and Admiral Shares. Investor Shares are available to any investor who meets the fund’s minimum purchase requirements. Admiral Shares are designed for investors who meet certain administrative, service, tenure, and account-size criteria.
A. The following significant accounting policies conform to generally accepted accounting principles for U.S. mutual funds. The fund consistently follows such policies in preparing its financial statements.
1. Security Valuation: Securities are valued as of the close of trading on the New York Stock Exchange (generally 4 p.m., Eastern time) on the valuation date. Equity securities are valued at the latest quoted sales prices or official closing prices taken from the primary market in which each security trades; such securities not traded on the valuation date are valued at the mean of the latest quoted bid and asked prices. Securities for which market quotations are not readily available, or whose values have been affected by events occurring before the fund’s pricing time but after the close of the securities’ primary markets, are valued at their fair values calculated according to procedures adopted by the board of trustees. These procedures include obtaining quotations from an independent pricing service, monitoring news to identify significant market- or security-specific events, and evaluating changes in the values of foreign market proxies (for example, ADRs, futures contracts, or exchange-traded funds), between the time the foreign markets close and the fund’s pricing time. When fair-value pricing is employed, the prices of securities used by a fund to calculate its net asset value may differ from quoted or published prices for the same securities. Investments in Vanguard Market Liquidity Fund are valued at that fund’s net asset value. Temporary cash investments acquired over 60 days to maturity are valued using the latest bid prices or using valuations based on a matrix system (which considers such factors as security prices, yields, maturities, and ratings), both as furnished by independent pricing services. Other temporary cash investments are valued at amortized cost, which approximates market value.
2. Foreign Currency: Securities and other assets and liabilities denominated in foreign currencies are translated into U.S. dollars using exchange rates obtained from an independent third party as of the fund’s pricing time on the valuation date. Realized gains (losses) and unrealized appreciation (depreciation) on investment securities include the effects of changes in exchange rates since the securities were purchased, combined with the effects of changes in security prices. Fluctuations in the value of other assets and liabilities resulting from changes in exchange rates are recorded as unrealized foreign currency gains (losses) until the assets or liabilities are settled in cash, at which time they are recorded as realized foreign currency gains (losses).
3. Covered Call Options Written: The fund may write covered call options on security holdings that are considered to be attractive long-term investments but are believed to be overvalued in the short-term. When the fund writes options, the premium received by the fund is recorded as an asset with an equal liability that is marked-to-market to reflect the current market value of the options written. Fluctuations in the value of the options are recorded as unrealized appreciation (depreciation) until expired, closed, or exercised, at which time realized gains (losses) are recognized. Options are valued at their latest quoted sales prices. Options not traded on the valuation date are valued at the latest quoted asked prices.
4. Futures Contracts: The fund uses index futures contracts to a limited extent, with the objective of maintaining full exposure to the stock market while maintaining liquidity. The fund may purchase or sell futures contracts to achieve a desired level of investment, whether to accommodate portfolio turnover
24
Explorer Fund
or cash flows from capital share transactions. The primary risks associated with the use of futures contracts are imperfect correlation between changes in market values of stocks held by the fund and the prices of futures contracts, and the possibility of an illiquid market.
Futures contracts are valued at their quoted daily settlement prices. The aggregate principal amounts of the contracts are not recorded in the Statement of Net Assets. Fluctuations in the value of the contracts are recorded in the Statement of Net Assets as an asset (liability) and in the Statement of Operations as unrealized appreciation (depreciation) until the contracts are closed, when they are recorded as realized futures gains (losses).
5. Repurchase Agreements: The fund may invest in repurchase agreements. Securities pledged as collateral for repurchase agreements are held by a custodian bank until the agreements mature. Each agreement requires that the market value of the collateral be sufficient to cover payments of interest and principal; however, in the event of default or bankruptcy by the other party to the agreement, retention of the collateral may be subject to legal proceedings.
6. Federal Income Taxes: The fund intends to continue to qualify as a regulated investment company and distribute all of its taxable income. Management has analyzed the fund’s tax positions taken on federal income tax returns for all open tax years (tax years ended October 31, 2005–2008), and has concluded that no provision for federal income tax is required in the fund’s financial statements.
7. Distributions: Distributions to shareholders are recorded on the ex-dividend date.
8. Security Lending: The fund may lend its securities to qualified institutional borrowers to earn additional income. Security loans are required to be secured at all times by collateral at least equal to the market value of securities loaned. The fund invests cash collateral received in Vanguard Market Liquidity Fund, and records a liability for the return of the collateral, during the period the securities are on loan. Security lending income represents the income earned on investing cash collateral, less expenses associated with the loan.
9. Other: Dividend income is recorded on the ex-dividend date. Interest income includes income distributions received from Vanguard Market Liquidity Fund and is accrued daily. Security transactions are accounted for on the date securities are bought or sold. Costs used to determine realized gains (losses) on the sale of investment securities are those of the specific securities sold.
Each class of shares has equal rights as to assets and earnings, except that each class separately bears certain class-specific expenses related to maintenance of shareholder accounts (included in Management and Administrative expenses) and shareholder reporting. Marketing and distribution expenses are allocated to each class of shares based on a method approved by the board of trustees. Income, other non-class-specific expenses, and gains and losses on investments are allocated to each class of shares based on its relative net assets.
B. AXA Rosenberg Investment Management LLC, Century Capital Management, LLC, Chartwell Investment Partners, L.P., Granahan Investment Management, Inc., Kalmar Investment Advisers, and Wellington Management Company, LLP, each provide investment advisory services to a portion of the fund for fees calculated at an annual percentage rate of average net assets managed by the advisor. The basic fees of Chartwell Investment Partners, Granahan Investment Management, Inc., Kalmar Investment Advisers, and Wellington Management Company, LLP, are subject to quarterly adjustments based on performance for the preceding three years relative to the Russell 2500 Growth Index. The basic fee for AXA Rosenberg Investment Management LLC is subject to quarterly adjustments based on performance since July 31, 2007, relative to the Russell 2500 Growth Index. In accordance with the
25
Explorer Fund
advisory contract entered into with Century Capital Management, LLC, in June 2008, beginning August 1, 2009, the investment advisory fee will be subject to quarterly adjustments based on performance since October 31, 2008, relative to a 50/50 blend of the Russell 2500 Index and the Russell 2500 Growth Index. Until February 2008, a portion of the fund was managed by Grantham, Mayo, Van Otterloo & Co. LLC. The basic fee paid to Grantham, Mayo, Van Otterloo & Co. LLC was subject to quarterly adjustments based on performance for the preceding three years relative to the Russell 2500 Growth Index.
The Vanguard Group provides investment advisory services to a portion of the fund on an at-cost basis; the fund paid Vanguard advisory fees of $454,000 for the year ended October 31, 2008.
For the year ended October 31, 2008, the aggregate investment advisory fee represented an effective annual basic rate of 0.18% of the fund’s average net assets, before a decrease of $2,213,000 (0.02%) based on performance.
C. The Vanguard Group furnishes at cost corporate management, administrative, marketing, and distribution services. The costs of such services are allocated to the fund under methods approved by the board of trustees. The fund has committed to provide up to 0.40% of its net assets in capital contributions to Vanguard. At October 31, 2008, the fund had contributed capital of $825,000 to Vanguard (included in Other Assets), representing 0.01% of the fund’s net assets and 0.82% of Vanguard’s capitalization. The fund’s trustees and officers are also directors and officers of Vanguard.
D. The fund has asked its investment advisors to direct certain security trades, subject to obtaining the best price and execution, to brokers who have agreed to rebate to the fund part of the commissions generated. Such rebates are used solely to reduce the fund’s management and administrative expenses. The fund’s custodian bank has also agreed to reduce its fees when the fund maintains cash on deposit in the non-interest-bearing custody account. For the year ended October 31, 2008, these arrangements reduced the fund’s management and administrative expenses by $498,000 and custodian fees by $31,000. The total expense reduction represented an effective annual rate of 0.01% of the fund’s average net assets.
E. Distributions are determined on a tax basis and may differ from net investment income and realized capital gains for financial reporting purposes. Differences may be permanent or temporary. Permanent differences are reclassified among capital accounts in the financial statements to reflect their tax character. Temporary differences arise when certain items of income, expense, gain, or loss are recognized in different periods for financial statement and tax purposes; these differences will reverse at some time in the future. Differences in classification may also result from the treatment of short-term gains as ordinary income for tax purposes.
During the year ended October 31, 2008, the fund realized net foreign currency losses of $257,000, which decreased distributable net income for tax purposes; accordingly, such losses have been reclassified from accumulated net realized losses to undistributed net investment income. Certain of the fund’s investments were in securities considered to be “passive foreign investment companies,” for which any unrealized appreciation and/or realized gains are required to be included in distributable net income for tax purposes. During the year ended October 31, 2008, the fund realized gains on the sale of passive foreign investment companies of $1,594,000, which have been included in current and prior periods’ taxable income; accordingly, such gains have been reclassified from accumulated net realized losses to undistributed net investment income.
26
Explorer Fund
For tax purposes, at October 31, 2008, the fund had $34,524,000 of ordinary income available for distribution. The fund had available realized losses of $784,127,000 to offset future net capital gains through October 31, 2016.
At October 31, 2008, the cost of investment securities for tax purposes was $9,268,828,000. Net unrealized depreciation of investment securities for tax purposes was $2,123,896,000, consisting of unrealized gains of $361,972,000 on securities that had risen in value since their purchase and $2,485,868,000 in unrealized losses on securities that had fallen in value since their purchase.
At October 31, 2008, the aggregate settlement value of open futures contracts expiring in December 2008 and the related unrealized appreciation (depreciation) were:
| | | ($000) |
| Number of | Aggregate | Unrealized |
| Long (Short) | Settlement | Appreciation |
Futures Contracts | Contracts | Value | (Depreciation) |
E-mini Russell 2000 Index | 4,002 | 214,707 | (7,615) |
E-mini S&P MidCap Index | 574 | 32,626 | 1,790 |
S&P MidCap 400 Index | 41 | 11,652 | (4,059) |
E-mini NASDAQ 100 Index | 255 | 6,819 | (1,964) |
Unrealized appreciation (depreciation) on open futures contracts is required to be treated as realized gain (loss) for tax purposes.
F. During the year ended October 31, 2008, the fund purchased $10,951,394,000 of investment securities and sold $11,531,826,000 of investment securities, other than temporary cash investments.
G. Capital share transactions for each class of shares were:
| | | Year Ended October 31, |
| | 2008 | | | 2007 |
| Amount | Shares | | Amount | Shares |
| ($000) | (000) | | ($000) | (000) |
Investor Shares | | | | | |
Issued | 981,528 | 15,527 | | 1,002,407 | 12,663 |
Issued in Lieu of Cash Distributions | 742,180 | 10,728 | | 798,597 | 10,589 |
Redeemed | (1,429,117) | (22,368) | | (1,820,022) | (22,892) |
Net Increase (Decrease)—Investor Shares | 294,591 | 3,887 | | (19,018) | 360 |
Admiral Shares | | | | | |
Issued | 459,208 | 7,554 | | 762,605 | 10,288 |
Issued in Lieu of Cash Distributions | 293,573 | 4,559 | | 309,959 | 4,415 |
Redeemed | (660,351) | (11,114) | | (861,021) | (11,658) |
Net Increase (Decrease)—Admiral Shares | 92,430 | 999 | | 211,543 | 3,045 |
27
Explorer Fund
H. Certain of the fund’s investments are in companies that are considered to be affiliated companies of the fund because the fund owns more than 5% of the outstanding voting securities of the company. Transactions during the period in securities of these companies were as follows:
| | | Current Period Transactions | |
| Oct. 31, 2007 | | Proceeds from | | Oct. 31, 2008 |
| Market | Purchases | Securities | Dividend | Market |
| Value | at Cost | Sold | Income | Value |
| ($000) | ($000) | ($000) | ($000) | ($000) |
Advanta Corp. | NA1 | 7,992 | 1,403 | 579 | 2,425 |
RBC Bearings Inc. | NA1 | 41,775 | 9,506 | — | NA2 |
The Advisory Board Co. | 60,415 | 22,394 | 34,369 | — | NA2 |
| 60,415 | | | 579 | 2,425 |
I. In September 2006, the Financial Accounting Standards Board issued Statement of Financial Accounting Standards No. 157 (“FAS 157”), “Fair Value Measurements.” FAS 157 establishes a framework for measuring fair value and expands disclosures about fair value measurements in financial statements.
The various inputs that may be used to determine the value of the fund’s investments are summarized in three broad levels. The inputs or methodologies used for valuing securities are not necessarily an indication of the risk associated with investing in those securities.
Level 1—Quoted prices in active markets for identical securities.
Level 2—Other significant observable inputs (including quoted prices for similar securities, interest rates, prepayment speeds, credit risk, etc.).
Level 3—Significant unobservable inputs (including the fund’s own assumptions used to determine the fair value of investments).
The following table summarizes the fund’s investments as of October 31, 2008, based on the inputs used to value them:
| Investments | Futures |
| in Securities | Contracts |
Valuation Inputs | ($000) | ($000) |
Level 1—Quoted prices | 7,036,532 | (11,848) |
Level 2—Other significant observable inputs | 103,832 | — |
Level 3—Significant unobservable inputs | 4,568 | — |
Total | 7,144,932 | (11,848) |
1 At October 31, 2007, the issuer was not an affiliated company of the fund.
2 At October 31, 2008, the security was still held, but the issuer was no longer an affiliated company of the fund.
28
Explorer Fund
The following table summarizes changes in investments valued based on Level 3 inputs during the year ended October 31, 2008:
| Investments |
| in Securities |
Amount valued based on Level 3 Inputs | ($000) |
Balance as of October 31, 2007 | — |
Transfers in and/or out of Level 3 | 4,568 |
Balance as of October 31, 2008 | 4,568 |
J. The following table summarizes the fund’s covered call options written during the year ended October 31, 2008:
| Number of | Premiums |
| Contracts | Received |
Covered Call Options | Written | ($000) |
Balance at October 31, 2007 | — | — |
Options written | 12,056 | 835 |
Options expired | (8,580) | (402) |
Options closed | (3,476) | (433) |
Options exercised | — | — |
Options open at October 31, 2008 | — | — |
29
Report of Independent Registered
Public Accounting Firm
To the Trustees of Trustees and Shareholders of Vanguard Explorer Fund:
In our opinion, the accompanying statement of net assets—investments summary and the related statements of operations and of changes in net assets and the financial highlights present fairly, in all material respects, the financial position of Vanguard Explorer Fund (the “Fund”) at October 31, 2008, the results of its operations for the year then ended, the changes in its net assets for each of the two years in the period then ended and the financial highlights for each of the five years in the period then ended, in conformity with accounting principles generally accepted in the United States of America. These financial statements and financial highlights (hereafter referred to as "financial statements") are the responsibility of the Fund's management; our responsibility is to express an opinion on these financial statements based on our audits. We conducted our audits of these financial statements in accordance with the standards of the Public Company Accounting Oversight Board (United States). Those standards require that we plan and perform the audit to obtain reasonable assurance about whether the financial statements are free of material misstatement. An audit includes examining, on a test basis, evidence supporting the amounts and disclosures in the financial statements, assessing the accounting principles used and significant estimates made by management, and evaluating the overall financial statement presentation. We believe that our audits, which included confirmation of securities at October 31, 2008 by correspondence with the custodians and brokers, and by agreement to the underlying ownership records for Vanguard Market Liquidity Fund, provide a reasonable basis for our opinion.
PricewaterhouseCoopers LLP
Philadelphia, Pennsylvania
December 19, 2008
Special 2008 tax information (unaudited) for Vanguard Explorer Fund
This information for the fiscal year ended October 31, 2008, is included pursuant to provisions of the Internal Revenue Code.
The fund distributed $778,981,000 as capital gain dividends (from net long-term capital gains) to shareholders during the fiscal year.
For nonresident alien shareholders, 100% of short-term capital gain dividends distributed by the fund are qualified short-term capital gains.
The fund distributed $52,888,000 of qualified dividend income to shareholders during the fiscal year.
For corporate shareholders,100.0% of investment income (dividend income plus short-term gains, if any) qualifies for the dividends-received deduction.
30
Your Fund’s After-Tax Returns
This table presents returns for your fund both before and after taxes. The after-tax returns are shown in two ways: (1) assuming that an investor owned the fund during the entire period and paid taxes on the fund’s distributions, and (2) assuming that an investor paid taxes on the fund’s distributions and sold all shares at the end of each period.
Calculations are based on the highest individual federal income tax and capital gains tax rates in effect at the times of the distributions and the hypothetical sales. State and local taxes were not considered. After-tax returns reflect any qualified dividend income, using actual prior-year figures and estimates for 2008. (In the example, returns after the sale of fund shares may be higher than those assuming no sale. This occurs when the sale would have produced a capital loss. The calculation assumes that the investor received a tax deduction for the loss.)
The table shows returns for Investor Shares only; returns for other share classes will differ. Please note that your actual after-tax returns will depend on your tax situation and may differ from those shown. Also note that if you own the fund in a tax-deferred account, such as an individual retirement account or a 401(k) plan, this information does not apply to you. Such accounts are not subject to current taxes.
Finally, keep in mind that a fund’s performance—whether before or after taxes—does not guarantee future results.
Average Annual Total Returns: Explorer Fund Investor Shares1 |
Periods Ended October 31, 2008 | | | |
| One | Five | Ten |
| Year | Years | Years |
Returns Before Taxes | –40.17% | –0.98% | 5.66% |
Returns After Taxes on Distributions | –41.26 | –1.97 | 4.08 |
Returns After Taxes on Distributions and Sale of Fund Shares | –24.43 | –0.58 | 4.52 |
1 Total returns do not include the account service fee that may be applicable to certain accounts with balances below $10,000.
31
About Your Fund’s Expenses
As a shareholder of the fund, you incur ongoing costs, which include costs for portfolio management, administrative services, and shareholder reports (like this one), among others. Operating expenses, which are deducted from a fund’s gross income, directly reduce the investment return of the fund.
A fund’s expenses are expressed as a percentage of its average net assets. This figure is known as the expense ratio. The following examples are intended to help you understand the ongoing costs (in dollars) of investing in your fund and to compare these costs with those of other mutual funds. The examples are based on an investment of $1,000 made at the beginning of the period shown and held for the entire period.
The accompanying table illustrates your fund’s costs in two ways:
• Based on actual fund return. This section helps you to estimate the actual expenses that you paid over the period. The “Ending Account Value” shown is derived from the fund’s actual return, and the third column shows the dollar amount that would have been paid by an investor who started with $1,000 in the fund. You may use the information here, together with the amount you invested, to estimate the expenses that you paid over the period.
To do so, simply divide your account value by $1,000 (for example, an $8,600 account value divided by $1,000 = 8.6), then multiply the result by the number given for your fund under the heading “Expenses Paid During Period.”
• Based on hypothetical 5% yearly return. This section is intended to help you compare your fund’s costs with those of other mutual funds. It assumes that the fund had a yearly return of 5% before expenses, but that the expense ratio is unchanged. In this case—because the return used is not the fund’s actual return—the results do not apply to your investment. The example is useful in making comparisons because the Securities and Exchange Commission requires all mutual funds to calculate expenses based on a 5% return. You can assess your fund’s costs by comparing this hypothetical example with the hypothetical examples that appear in shareholder reports of other funds.
Six Months Ended October 31, 2008 | | | |
| Beginning | Ending | Expenses |
| Account Value | Account Value | Paid During |
Explorer Fund | 4/30/2008 | 10/31/2008 | Period1 |
Based on Actual Fund Return | | | |
Investor Shares | $1,000.00 | $692.94 | $1.96 |
Admiral Shares | 1,000.00 | 693.51 | 1.20 |
Based on Hypothetical 5% Yearly Return | | | |
Investor Shares | $1,000.00 | $1,022.89 | $2.35 |
Admiral Shares | 1,000.00 | 1,023.79 | 1.43 |
1 The calculations are based on expenses incurred in the most recent six-month period. The fund’s annualized six-month expense ratios for that period are 0.46% for Investor Shares and 0.28% for Admiral Shares. The dollar amounts shown as “Expenses Paid” are equal to the annualized expense ratio multiplied by the average account value over the period, multiplied by the number of days in the most recent six-month period, then divided by the number of days in the most recent 12-month period.
32
Note that the expenses shown in the table are meant to highlight and help you compare ongoing costs only and do not reflect transaction costs incurred by the fund for buying and selling securities. Further, the expenses do not include the account service fee described in the prospectus. If such a fee were applied to your account, your costs would be higher. Your fund does not charge transaction fees, such as purchase or redemption fees, nor does it carry a “sales load.”
The calculations assume no shares were bought or sold during the period. Your actual costs may have been higher or lower, depending on the amount of your investment and the timing of any purchases or redemptions.
You can find more information about the fund’s expenses, including annual expense ratios, in the Financial Statements section of this report. For additional information on operating expenses and other shareholder costs, please refer to your fund’s current prospectus.
33
Glossary
Beta. A measure of the magnitude of a fund’s past share-price fluctuations in relation to the ups and downs of a given market index. The index is assigned a beta of 1.00. Compared with a given index, a fund with a beta of 1.20 typically would have seen its share price rise or fall by 12% when the index rose or fell by 10%. For this report, beta is based on returns over the past 36 months for both the fund and the index. Note that a fund’s beta should be reviewed in conjunction with its R-squared (see definition). The lower the R-squared, the less correlation there is between the fund and the index, and the less reliable beta is as an indicator of volatility.
Earnings Growth Rate. The average annual rate of growth in earnings over the past five years for the stocks now in a fund.
Equity Exposure. A measure that reflects a fund’s investments in stocks and stock futures. Any holdings in short-term reserves are excluded.
Expense Ratio. The percentage of a fund’s average net assets used to pay its annual administrative and advisory expenses. These expenses directly reduce returns to investors.
Foreign Holdings. The percentage of a fund represented by stocks or depositary receipts of companies based outside the United States.
Inception Date. The date on which the assets of a fund (or one of its share classes) are first invested in accordance with the fund’s investment objective. For funds with a subscription period, the inception date is the day after that period ends. Investment performance is measured from the inception date.
Median Market Cap. An indicator of the size of companies in which a fund invests; the midpoint of market capitalization (market price x shares outstanding) of a fund’s stocks, weighted by the proportion of the fund’s assets invested in each stock. Stocks representing half of the fund’s assets have market capitalizations above the median, and the rest are below it.
Price/Book Ratio. The share price of a stock divided by its net worth, or book value, per share. For a fund, the weighted average price/book ratio of the stocks it holds.
Price/Earnings Ratio. The ratio of a stock’s current price to its per-share earnings over the past year. For a fund, the weighted average P/E of the stocks it holds. P/E is an indicator of market expectations about corporate prospects; the higher the P/E, the greater the expectations for a company’s future growth.
R-Squared. A measure of how much of a fund’s past returns can be explained by the returns from the market in general, as measured by a given index. If a fund’s total returns were precisely synchronized with an index’s returns, its R-squared would be 1.00. If the fund’s returns bore no relationship to the index’s returns, its R-squared would be 0. For this report, R-squared is based on returns over the past 36 months for both the fund and the index.
Return on Equity. The annual average rate of return generated by a company during the past five years for each dollar of shareholder’s equity (net income divided by shareholder’s equity). For a fund, the weighted average return on equity for the companies whose stocks it holds.
Short-Term Reserves. The percentage of a fund invested in highly liquid, short-term securities that can be readily converted to cash.
Turnover Rate. An indication of the fund’s trading activity. Funds with high turnover rates incur higher transaction costs and may be more likely to distribute capital gains (which may be taxable to investors). The turnover rate excludes in-kind transactions, which have minimal impact on costs.
34
Yield. A fund’s 30-day SEC yield is derived using a formula specified by the U.S. Securities and Exchange Commission. Under the formula, data related to the fund’s security holdings in the previous 30 days are used to calculate the fund’s hypothetical net income for that period, which is then annualized and divided by the fund’s estimated average net assets over the calculation period. For the purposes of this calculation, a security’s income is based on its current market yield to maturity (in the case of bonds) or its projected dividend yield (for stocks). Because the SEC yield represents hypothetical annualized income, it will differ—at times significantly—from the fund’s actual experience. As a result, the fund’s income distributions may be higher or lower than implied by the SEC yield.
35
The People Who Govern Your Fund
The trustees of your mutual fund are there to see that the fund is operated and managed in your best interests since, as a shareholder, you are a part owner of the fund. Your fund’s trustees also serve on the board of directors of The Vanguard Group, Inc., which is owned by the Vanguard funds and provides services to them on an at-cost basis.
A majority of Vanguard’s board members are independent, meaning that they have no affiliation with Vanguard or the funds they oversee, apart from the sizable personal investments they have made as private individuals.
Our independent board members bring distinguished backgrounds in business, academia, and public service to their task of working with Vanguard officers to establish the policies and oversee the activities of the funds. Among board members’ responsibilities are selecting investment advisors for the funds; monitoring fund operations, performance, and costs; reviewing contracts; nominating and selecting new trustees/directors; and electing Vanguard officers.
Each trustee serves a fund until its termination; or until the trustee’s retirement, resignation, or death; or otherwise as specified in the fund’s organizational documents. Any trustee may be removed at a shareholders’ meeting by a vote representing two-thirds of the net asset value of all shares of the fund together with shares of other Vanguard funds organized within the same trust. The table on these two pages shows information for each trustee and executive officer of the fund. The mailing address of the trustees and officers is P.O. Box 876, Valley Forge, PA 19482.
Chairman of the Board and Trustee
John J. Brennan1
Born 1954 Principal Occupation(s) During the Past Five Years: Chairman of the Board and Director/ Trustee Since May 1987; Trustee of The Vanguard Group, Inc., and of each of the investment companies served Chairman of the Board by The Vanguard Group; Chief Executive Officer and President of The Vanguard Group 156 Vanguard Funds Overseen and of each of the investment companies served by The Vanguard Group (1996–2008).
Independent Trustees
Charles D. Ellis
Born 1937 Principal Occupation(s) During the Past Five Years: Applecore Partners (pro bono ventures Trustee Since January 2001 in education); Senior Advisor to Greenwich Associates (international business strategy 156 Vanguard Funds Overseen consulting); Successor Trustee of Yale University; Overseer of the Stern School of Business at New York University; Trustee of the Whitehead Institute for Biomedical Research.
Emerson U. Fullwood
Born 1948 Principal Occupation(s) During the Past Five Years: Executive Chief Staff and Marketing Trustee Since January 2008 Officer for North America since 2004 and Corporate Vice President of Xerox Corporation 156 Vanguard Funds Overseen (photocopiers and printers); Director of SPX Corporation (multi-industry manufacturing), of the United Way of Rochester, and of the Boy Scouts of America.
Rajiv L. Gupta
Born 1945 Principal Occupation(s) During the Past Five Years: Chairman, President, and Trustee Since December 20012 Chief Executive Officer of Rohm and Haas Co. (chemicals); Board Member of 156 Vanguard Funds Overseen the American Chemistry Council; Director of Tyco International, Ltd. (diversified manufacturing and services), since 2005.
Amy Gutmann
Born 1949 Principal Occupation(s) During the Past Five Years: President of the University of
Trustee Since June 2006 Pennsylvania since 2004; Professor in the School of Arts and Sciences, Annenberg School 156 Vanguard Funds Overseen for Communication, and Graduate School of Education of the University of Pennsylvania since 2004; Provost (2001–2004) and Laurance S. Rockefeller Professor of Politics and the University Center for Human Values (1990–2004), Princeton University; Director of Carnegie Corporation of New York since 2005 and of Schuylkill River Development Corporation and Greater Philadelphia Chamber of Commerce since 2004; Trustee of the National Constitution Center since 2007.
JoAnn Heffernan Heisen
Born 1950 Principal Occupation(s) During the Past Five Years: Corporate Vice President and Trustee Since July 1998 Chief Global Diversity Officer since 2006, Vice President and Chief Information 156 Vanguard Funds Overseen Officer (1997–2005), and Member of the Executive Committee of Johnson & Johnson (pharmaceuticals/consumer products); Director of the University Medical Center at Princeton and Women’s Research and Education Institute.
André F. Perold
Born 1952 Principal Occupation(s) During the Past Five Years: George Gund Professor of Finance Trustee Since December 2004 and Banking, Harvard Business School; Senior Associate Dean and Director of Faculty 156 Vanguard Funds Overseen Recruiting, Harvard Business School; Director and Chairman of UNX, Inc. (equities trading firm); Chair of the Investment Committee of HighVista Strategies LLC (private investment firm) since 2005.
Alfred M. Rankin, Jr.
Born 1941 Principal Occupation(s) During the Past Five Years: Chairman, President, Chief Executive Trustee Since January 1993 Officer, and Director of NACCO Industries, Inc. (forklift trucks/housewares/lignite); Director 156 Vanguard Funds Overseen of Goodrich Corporation (industrial products/aircraft systems and services).
J. Lawrence Wilson
Born 1936 Principal Occupation(s) During the Past Five Years: Retired Chairman and Chief Executive Trustee Since April 1985 Officer of Rohm and Haas Co. (chemicals); Director of Cummins Inc. (diesel engines) and 156 Vanguard Funds Overseen AmerisourceBergen Corp. (pharmaceutical distribution); Trustee of Vanderbilt University and of Culver Educational Foundation.
Executive Officers1
Thomas J. Higgins
Born 1957 Principal Occupation(s) During the Past Five Years: Principal of The Vanguard Group, Inc.; Chief Financial Officer Treasurer of each of the investment companies served by The Vanguard Group; Chief Since September 2008 Financial Officer of each of the investment companies served by The Vanguard Treasurer Since July 1998 Group since 2008. 156 Vanguard Funds Overseen
F. William McNabb III
Born 1957 Principal Occupation(s) During the Past Five Years: Chief Executive Officer, Director, Chief Executive Officer and President of The Vanguard Group, Inc., since 2008; Chief Executive Officer and Since August 31, 2008 President of each of the investment companies served by The Vanguard Group since President Since March 2008 2008; Director of Vanguard Marketing Corporation; Managing Director of The Vanguard 156 Vanguard Funds Overseen Group (1995–2008).
Heidi Stam
Born 1956 Principal Occupation(s) During the Past Five Years: Managing Director of The Vanguard Secretary Since July 2005 Group, Inc., since 2006; General Counsel of The Vanguard Group since 2005; Secretary of 156 Vanguard Funds Overseen The Vanguard Group and of each of the investment companies served by The Vanguard Group since 2005; Director and Senior Vice President of Vanguard Marketing Corporation since 2005; Principal of The Vanguard Group (1997–2006).
Vanguard Senior Management Team | | | |
| | | | |
R. Gregory Barton | Kathleen C. Gubanich | Michael S. Miller | Ralph K. Packard | George U. Sauter |
Mortimer J. Buckley | Paul A. Heller | James M. Norris | Glenn W. Reed | |
Founder
John C. Bogle
Chairman and Chief Executive Officer, 1974–1996
1 These individuals are “interested persons” as defined in the Investment Company Act of 1940.
2 December 2002 for Vanguard Equity Income Fund, Vanguard Growth Equity Fund, the Vanguard Municipal Bond Funds, and the Vanguard State Tax-Exempt Funds.
More information about the trustees is in the Statement of Additional Information, available from The Vanguard Group.

P.O. Box 2600
Valley Forge, PA 19482-2600
Connect with Vanguard®> www.vanguard.com | |
| |
| |
| |
| |
Fund Information > 800-662-7447 | All comparative mutual fund data are from Lipper Inc. |
| or Morningstar, Inc., unless otherwise noted. |
Direct Investor Account Services>800-662-2739 | You can obtain a free copy of Vanguard’s proxy voting |
| guidelines by visiting our website, www.vanguard.com, |
Institutional Investor Services > 800-523-1036 | and searching for “proxy voting guidelines,” or by |
| calling Vanguard at 800-662-2739. The guidelines are |
Text Telephone for People | also available from the SEC’s website, www.sec.gov. |
With Hearing Impairment > 800-952-3335 | In addition, you may obtain a free report on how your |
| fund voted the proxies for securities it owned during |
| the 12 months ended June 30. To get the report, visit |
| either www.vanguard.com or www.sec.gov. |
This material may be used in conjunction | |
with the offering of shares of any Vanguard | |
fund only if preceded or accompanied by | You can review and copy information about your fund |
the fund’s current prospectus. | at the SEC’s Public Reference Room in Washington, D.C. |
| To find out more about this public service, call the SEC |
| at 202-551-8090. Information about your fund is also |
| available on the SEC’s website, and you can receive |
| copies of this information, for a fee, by sending a |
CFA® is a trademark owned by CFA Institute. | request in either of two ways: via e-mail addressed to |
| publicinfo@sec.gov or via regular mail addressed to the |
The funds or securities referred to herein are not | Public Reference Section, Securities and Exchange |
sponsored, endorsed, or promoted by MSCI, and MSCI | Commission, Washington, DC 20549-0102. |
bears no liability with respect to any such funds or | |
securities. For any such funds or securities, the | |
prospectus or the Statement of Additional Information | |
contains a more detailed description of the limited | |
relationship MSCI has with The Vanguard Group and | |
any related funds. | |
| | | |
Russell is a trademark of The Frank Russell Company. | | |
| |
| |
| |
| |
| |
| |
| |
| |
| © 2008 The Vanguard Group, Inc. |
| All rights reserved. |
| Vanguard Marketing Corporation, Distributor. |
| |
| Q240 122008 |
Vanguard® Explorer™ Fund | | |
Schedule of Investments | | |
October 31, 2008 | | |
| | | Market |
| | | Value |
| | Shares | ($000) |
Common Stocks (93.9%)1 | | |
Consumer Discretionary (11.9%) | | |
* | O’Reilly Automotive, Inc. | 2,043,012 | 55,386 |
| DeVry, Inc. | 901,870 | 51,127 |
* | Dollar Tree, Inc. | 901,451 | 34,273 |
| Service Corp. International | 4,801,600 | 33,131 |
* | DreamWorks Animation SKG, Inc. | 997,967 | 28,043 |
| Ross Stores, Inc. | 810,297 | 26,489 |
* | WMS Industries, Inc. | 1,025,099 | 25,627 |
* | Urban Outfitters, Inc. | 987,336 | 21,465 |
| Aaron Rents, Inc. | 782,640 | 19,402 |
* | GameStop Corp. Class A | 678,985 | 18,597 |
* | Marvel Entertainment, Inc. | 556,500 | 17,914 |
| Penske Automotive Group Inc. | 2,056,700 | 16,844 |
* | Big Lots Inc. | 685,798 | 16,754 |
* | Tractor Supply Co. | 401,535 | 16,688 |
*,^ | Jos. A. Bank Clothiers, Inc. | 649,488 | 16,542 |
| Matthews International Corp. | 344,100 | 15,357 |
* | Skechers U.S.A., Inc. | 1,113,500 | 15,121 |
| Foot Locker, Inc. | 995,400 | 14,553 |
* | LKQ Corp. | 1,228,470 | 14,054 |
* | Capella Education Co. | 276,659 | 13,114 |
| Tiffany & Co. | 457,698 | 12,564 |
* | The Warnaco Group, Inc. | 407,100 | 12,136 |
* | Lamar Advertising Co. Class A | 768,200 | 11,654 |
| Autoliv, Inc. | 513,900 | 10,977 |
| John Wiley & Sons Class A | 315,250 | 10,964 |
* | Apollo Group, Inc. Class A | 156,900 | 10,906 |
* | Papa John’s International, Inc. | 471,262 | 10,632 |
* | Penn National Gaming, Inc. | 547,985 | 10,554 |
| Tupperware Brands Corp. | 379,630 | 9,605 |
| Burger King Holdings Inc. | 454,130 | 9,028 |
* | Rent-A-Center, Inc. | 607,410 | 8,868 |
*,^ | Life Time Fitness, Inc. | 456,730 | 8,696 |
| WABCO Holdings Inc. | 471,814 | 8,667 |
* | TRW Automotive Holdings Corp. | 1,354,200 | 8,559 |
* | thinkorswim Group, Inc. | 1,030,600 | 8,245 |
| RadioShack Corp. | 613,318 | 7,765 |
| OfficeMax, Inc. | 873,400 | 7,031 |
| BorgWarner, Inc. | 307,800 | 6,916 |
*,^ | Netflix.com, Inc. | 269,135 | 6,664 |
* | Corinthian Colleges, Inc. | 447,982 | 6,397 |
* | ITT Educational Services, Inc. | 70,900 | 6,214 |
| Advance Auto Parts, Inc. | 186,234 | 5,810 |
* | The Dress Barn, Inc. | 540,272 | 5,165 |
* | Scientific Games Corp. | 278,750 | 5,017 |
* | Chipotle Mexican Grill, Inc. Class B | 117,050 | 5,006 |
* | Tenneco Automotive, Inc. | 1,014,006 | 4,979 |
* | The Gymboree Corp. | 189,059 | 4,889 |
* | The Children’s Place Retail Stores, Inc. | 145,859 | 4,876 |
| CBRL Group, Inc. | 243,939 | 4,859 |
| Darden Restaurants Inc. | 216,275 | 4,795 |
* | CEC Entertainment Inc. | 181,194 | 4,653 |
* | Morningstar, Inc. | 121,925 | 4,565 |
*,^ | Chipotle Mexican Grill, Inc. | 85,600 | 4,344 |
* | Priceline.com, Inc. | 78,000 | 4,105 |
* | Hanesbrands Inc. | 234,600 | 4,098 |
* | NVR, Inc. | 8,300 | 4,069 |
* | Aeropostale, Inc. | 155,800 | 3,772 |
* | The Wet Seal, Inc. Class A | 1,224,950 | 3,601 |
*,^ | Zale Corp. | 211,000 | 3,600 |
* | Bally Technologies Inc. | 162,400 | 3,597 |
* | Pre-Paid Legal Services, Inc. | 88,408 | 3,490 |
* | Texas Roadhouse, Inc. | 488,038 | 3,426 |
Page 1
Vanguard® Explorer Fund | | |
Schedule of Investments | | |
October 31, 2008 | | |
| | | Market |
| | | Value |
| | Shares | ($000) |
* | Hot Topic, Inc. | 498,200 | 3,228 |
* | Deckers Outdoor Corp. | 37,700 | 3,199 |
* | The Goodyear Tire & Rubber Co. | 350,203 | 3,124 |
| Family Dollar Stores, Inc. | 114,300 | 3,076 |
* | Jack in the Box Inc. | 152,900 | 3,073 |
* | Hollywood Media Corp. | 1,564,823 | 3,004 |
| Limited Brands, Inc. | 237,200 | 2,842 |
* | Fossil, Inc. | 153,700 | 2,790 |
| Wolverine World Wide, Inc. | 112,900 | 2,653 |
* | FGX International Holdings Ltd. | 207,091 | 2,278 |
^ | NutriSystem, Inc. | 156,614 | 2,216 |
* | Fuel Systems Solutions, Inc. | 77,200 | 2,196 |
* | 1-800-FLOWERS.COM, Inc. | 400,908 | 2,145 |
| Harte-Hanks, Inc. | 304,500 | 2,138 |
* | Denny’s Corp. | 1,152,300 | 2,063 |
* | True Religion Apparel, Inc. | 121,900 | 2,042 |
^ | Polaris Industries, Inc. | 58,900 | 1,983 |
* | Global Sources Ltd. | 243,452 | 1,923 |
*,^ | Martha Stewart Living Omnimedia, Inc. | 350,102 | 1,831 |
| Ameristar Casinos, Inc. | 183,000 | 1,685 |
* | Collective Brands, Inc. | 117,922 | 1,508 |
* | Coinstar, Inc. | 58,460 | 1,402 |
| Guess ?, Inc. | 60,100 | 1,308 |
| Phillips-Van Heusen Corp. | 52,800 | 1,294 |
| Strayer Education, Inc. | 5,600 | 1,267 |
| Interactive Data Corp. | 53,300 | 1,257 |
| Hillenbrand Inc. | 63,900 | 1,214 |
* | Jo-Ann Stores, Inc. | 62,754 | 1,202 |
| The Buckle, Inc. | 44,700 | 1,177 |
* | Hawk Corp. Class A | 75,003 | 1,084 |
| National CineMedia Inc. | 128,891 | 1,044 |
* | Perry Ellis International Corp. | 106,423 | 1,042 |
| Borders Group, Inc. | 306,170 | 1,038 |
| Liz Claiborne, Inc. | 119,830 | 977 |
*,^ | Conn’s, Inc. | 68,550 | 929 |
* | Wonder Auto Technology, Inc. | 216,644 | 864 |
* | Buffalo Wild Wings Inc. | 28,500 | 806 |
| Choice Hotels International, Inc. | 29,100 | 796 |
| PetSmart, Inc. | 38,800 | 764 |
* | Mediacom Communications Corp. | 164,766 | 732 |
| Systemax Inc. | 51,600 | 731 |
*,^ | Palm Harbor Homes, Inc. | 84,600 | 728 |
^ | Talbots Inc. | 69,620 | 683 |
* | Town Sports International Holdings, Inc. | 255,726 | 637 |
* | Interpublic Group of Cos., Inc. | 118,300 | 614 |
*,^ | CarMax, Inc. | 54,300 | 577 |
| International Speedway Corp. | 17,867 | 561 |
* | Citi Trends Inc. | 31,400 | 525 |
| Dover Downs Gaming & Entertainment, Inc. | 100,550 | 515 |
* | Lodgian, Inc. | 86,660 | 442 |
^ | DineEquity, Inc. | 19,481 | 351 |
* | Wendy’s/Arby’s Group, Inc. | 96,600 | 350 |
| CPI Corp. | 47,665 | 348 |
* | Sirius XM Radio Inc. | 984,300 | 333 |
* | Alloy, Inc. | 66,260 | 333 |
| Monro Muffler Brake, Inc. | 14,200 | 306 |
* | Mothers Work, Inc. | 34,392 | 302 |
* | AnnTaylor Stores Corp. | 23,880 | 300 |
| Pulte Homes, Inc. | 19,900 | 222 |
| Haverty Furniture Cos., Inc. | 14,160 | 139 |
* | Barry RG Corp Ohio | 23,030 | 119 |
* | K12 Inc. | 3,900 | 107 |
* | Red Lion Hotels Corp. | 38,360 | 106 |
* | Charlotte Russe Holding Inc. | 12,400 | 105 |
Page 2
Vanguard® Explorer Fund | | |
Schedule of Investments | | |
October 31, 2008 | | |
| | | Market |
| | | Value |
| | Shares | ($000) |
| Hasbro, Inc. | 3,400 | 99 |
* | Aristotle Corp | 13,280 | 81 |
* | Einstein Noah Restaurant Group Inc. | 9,300 | 75 |
| CKE Restaurants Inc. | 7,300 | 62 |
| Finish Line, Inc. | 4,319 | 41 |
| Dover Motorsports, Inc. | 18,817 | 40 |
* | Sally Beauty Co. Inc. | 7,500 | 38 |
| Blyth, Inc. | 2,770 | 24 |
| Cinemark Holdings Inc. | 2,850 | 24 |
* | Champion Enterprises, Inc. | 9,620 | 18 |
* | Overstock.com, Inc. | 1,312 | 16 |
* | Central European Media Enterprises Ltd. Class A | 400 | 11 |
* | Motorcar Parts of America, Inc. | 2,060 | 9 |
* | Nathan’s Famous Inc | 418 | 7 |
* | Retail Ventures, Inc. | 570 | 1 |
| | | 837,413 |
Consumer Staples (3.8%) | | |
*,^ | Chattem, Inc. | 349,383 | 26,438 |
| Church & Dwight, Inc. | 440,640 | 26,037 |
* | Ralcorp Holdings, Inc. | 380,100 | 25,725 |
| Nu Skin Enterprises, Inc. | 1,797,235 | 23,166 |
| Ruddick Corp. | 805,200 | 23,061 |
* | United Natural Foods, Inc. | 963,604 | 21,527 |
* | Central European Distribution Corp. | 611,040 | 17,592 |
* | Constellation Brands, Inc. Class A | 1,200,221 | 15,051 |
| Herbalife Ltd. | 553,039 | 13,511 |
| Spartan Stores, Inc. | 387,400 | 10,456 |
| Tyson Foods, Inc. | 1,047,600 | 9,156 |
* | Smithfield Foods, Inc. | 639,900 | 6,732 |
| PriceSmart, Inc. | 449,850 | 6,703 |
| Diamond Foods, Inc. | 224,482 | 6,562 |
^ | Cal-Maine Foods, Inc. | 191,119 | 5,617 |
* | BJ’s Wholesale Club, Inc. | 135,240 | 4,760 |
| McCormick & Co., Inc. | 131,700 | 4,433 |
* | Dean Foods Co. | 144,200 | 3,152 |
* | Darling International, Inc. | 358,900 | 2,706 |
* | NBTY, Inc. | 111,748 | 2,612 |
* | Boston Beer Co., Inc. Class A | 64,600 | 2,441 |
* | Energizer Holdings, Inc. | 35,050 | 1,712 |
| Alberto-Culver Co. | 64,800 | 1,667 |
* | Omega Protein Corp. | 150,997 | 1,114 |
| Nash-Finch Co. | 23,500 | 927 |
* | Winn-Dixie Stores, Inc. | 58,200 | 874 |
* | Elizabeth Arden, Inc. | 33,080 | 572 |
* | AgFeed Industries, Inc. | 116,620 | 511 |
* | The Pantry, Inc. | 21,800 | 480 |
* | Physicians Formula Holdings, Inc. | 109,049 | 385 |
| Flowers Foods, Inc. | 9,500 | 282 |
^ | Whole Foods Market, Inc. | 19,200 | 206 |
* | Overhill Farms Inc. | 32,386 | 144 |
| Inter Parfums, Inc. | 9,300 | 108 |
* | China Sky One Medical Inc. | 9,800 | 88 |
* | Schiff Nutrition International, Inc. | 9,800 | 58 |
| Coca-Cola Bottling Co. | 1,201 | 53 |
| Arden Group Inc. Class A | 328 | 49 |
* | National Beverage Corp. | 1,600 | 15 |
* | Medifast, Inc. | 1,500 | 8 |
* | Natural Alternatives International, Inc. | 205 | 1 |
| | | 266,692 |
Energy (6.7%) | | |
* | Ultra Petroleum Corp. | 656,350 | 30,553 |
* | Comstock Resources, Inc. | 617,303 | 30,507 |
* | Atwood Oceanics, Inc. | 992,540 | 27,275 |
Page 3
Vanguard® Explorer Fund | | |
Schedule of Investments | | |
October 31, 2008 | | |
| | | Market |
| | | Value |
| | Shares | ($000) |
* | Southwestern Energy Co. | 755,580 | 26,914 |
* | Petrohawk Energy Corp. | 1,277,350 | 24,206 |
| XTO Energy, Inc. | 550,925 | 19,806 |
| Tidewater Inc. | 445,055 | 19,409 |
| Walter Industries, Inc. | 392,066 | 15,193 |
| Core Laboratories N.V. | 202,040 | 14,890 |
* | Superior Energy Services, Inc. | 545,170 | 11,623 |
* | Encore Acquisition Co. | 366,100 | 11,404 |
| Southern Union Co. | 638,400 | 10,993 |
| Range Resources Corp. | 237,290 | 10,018 |
* | Unit Corp. | 258,139 | 9,691 |
| Niko Resources Ltd. | 212,040 | 9,289 |
* | Mariner Energy Inc. | 601,636 | 8,658 |
* | Arena Resources, Inc. | 277,800 | 8,467 |
* | Tesco Corp. | 742,700 | 8,452 |
* | Gulfmark Offshore, Inc. | 209,569 | 7,754 |
* | Oil States International, Inc. | 325,957 | 7,539 |
| St. Mary Land & Exploration Co. | 286,875 | 7,140 |
* | GMX Resources Inc. | 186,800 | 7,052 |
* | Grey Wolf, Inc. | 1,095,050 | 7,030 |
* | Oceaneering International, Inc. | 248,100 | 6,989 |
| CARBO Ceramics Inc. | 144,999 | 6,274 |
*,^ | Delta Petroleum Corp. | 662,000 | 6,223 |
| Berry Petroleum Class A | 250,250 | 5,831 |
* | Bristow Group, Inc. | 228,050 | 5,649 |
* | National Oilwell Varco Inc. | 188,338 | 5,629 |
* | Helix Energy Solutions Group, Inc. | 530,100 | 5,598 |
* | Lundin Petroleum AB | 1,157,600 | 5,526 |
| Penn Virginia Corp. | 145,895 | 5,423 |
| Massey Energy Co. | 218,251 | 5,039 |
* | Whiting Petroleum Corp. | 92,700 | 4,819 |
* | Swift Energy Co. | 139,300 | 4,469 |
* | Parker Drilling Co. | 851,871 | 4,362 |
| W&T Offshore, Inc. | 210,028 | 4,026 |
* | ION Geophysical Corp. | 574,100 | 3,766 |
^ | Frontline Ltd. | 116,100 | 3,692 |
* | Rosetta Resources, Inc. | 336,306 | 3,548 |
* | Contango Oil & Gas Co. | 63,298 | 3,481 |
* | Matrix Service Co. | 283,065 | 3,468 |
* | IHS Inc. Class A | 92,900 | 3,288 |
* | Concho Resources, Inc. | 154,000 | 3,272 |
* | SEACOR Holdings Inc. | 46,799 | 3,143 |
| Foundation Coal Holdings, Inc. | 146,100 | 3,033 |
* | McMoRan Exploration Co. | 205,200 | 2,912 |
* | Alpha Natural Resources, Inc. | 79,400 | 2,840 |
* | Clean Energy Fuels Corp. | 341,600 | 2,630 |
| Ship Finance International Ltd. | 169,948 | 2,320 |
* | Willbros Group, Inc. | 139,000 | 2,153 |
* | Pioneer Drilling Co. | 223,013 | 1,726 |
* | Clayton Williams Energy, Inc. | 33,600 | 1,627 |
* | GeoResources Inc. | 99,800 | 1,491 |
| Patterson-UTI Energy, Inc. | 111,900 | 1,485 |
| Teekay Tankers Ltd. | 119,980 | 1,458 |
* | Callon Petroleum Co. | 119,575 | 1,234 |
* | Aventine Renewable Energy Holdings, Inc. | 562,505 | 1,097 |
| DHT Maritime | 190,080 | 1,000 |
* | Warren Resources Inc. | 180,451 | 955 |
| Rowan Cos., Inc. | 49,485 | 898 |
* | Basic Energy Services Inc. | 60,200 | 823 |
* | PHI Inc. Non-Voting Shares | 31,600 | 663 |
* | Stone Energy Corp. | 21,621 | 656 |
* | Patriot Coal Corp. | 32,700 | 518 |
* | ATP Oil & Gas Corp. | 38,302 | 461 |
* | EXCO Resources, Inc. | 45,500 | 418 |
Page 4
Vanguard® Explorer Fund | | |
Schedule of Investments | | |
October 31, 2008 | | |
| | | Market |
| | | Value |
| | Shares | ($000) |
* | Energy Partners, Ltd. | 75,167 | 325 |
* | Dresser Rand Group, Inc. | 12,400 | 278 |
* | Approach Resources Inc. | 24,600 | 268 |
* | Hornbeck Offshore Services, Inc. | 8,489 | 202 |
* | T-3 Energy Services, Inc. | 8,123 | 196 |
* | Gulfport Energy Corp. | 24,641 | 174 |
* | PetroQuest Energy, Inc. | 12,527 | 125 |
* | Bolt Technology Corp. | 7,050 | 57 |
* | Union Drilling, Inc. | 7,000 | 38 |
* | TETRA Technologies, Inc. | 4,420 | 31 |
* | International Coal Group, Inc. | 4,402 | 21 |
| | | 471,491 |
Exchange-Traded Funds (1.2%) | | |
2 | Vanguard Small-Cap ETF | 1,165,083 | 54,304 |
2 | Vanguard Small-Cap Growth ETF | 713,200 | 32,893 |
| | | 87,197 |
Financials (6.4%) | | |
| Cash America International Inc. | 965,000 | 34,132 |
| People’s United Financial Inc. | 1,619,975 | 28,350 |
| Platinum Underwriters Holdings, Ltd. | 594,300 | 18,863 |
* | Nasdaq Stock Market Inc. | 536,000 | 17,399 |
| SEI Investments Co. | 928,200 | 16,411 |
| Jefferies Group, Inc. | 969,363 | 15,345 |
* | ProAssurance Corp. | 266,600 | 14,650 |
| U-Store-It Trust REIT | 2,066,850 | 14,179 |
| UMB Financial Corp. | 307,800 | 13,953 |
| Waddell & Reed Financial, Inc. | 931,400 | 13,524 |
*,^ | Western Alliance Bancorp | 885,572 | 13,115 |
* | Interactive Brokers Group, Inc. | 607,370 | 12,979 |
| CapitalSource Inc. REIT | 1,679,649 | 12,429 |
* | Arch Capital Group Ltd. | 174,300 | 12,157 |
* | Affiliated Managers Group, Inc. | 233,040 | 10,808 |
| Huntington Bancshares Inc. | 1,135,000 | 10,726 |
| First American Corp. | 498,100 | 10,166 |
*,^ | Reinsurance Group of America, Inc. Class A | 257,400 | 9,611 |
| MFA Mortgage Investments, Inc. REIT | 1,705,250 | 9,379 |
| City National Corp. | 175,000 | 9,368 |
| RenaissanceRe Holdings Ltd. | 197,350 | 9,058 |
^ | Popular, Inc. | 1,119,117 | 8,505 |
| PartnerRe Ltd. | 122,100 | 8,265 |
^ | Greenhill & Co., Inc. | 117,650 | 7,761 |
| Lazard Ltd. Class A | 250,335 | 7,553 |
* | Stifel Financial Corp. | 163,975 | 7,158 |
| optionsXpress Holdings Inc. | 396,650 | 7,045 |
^ | Redwood Trust, Inc. REIT | 395,700 | 6,030 |
| Cullen/Frost Bankers, Inc. | 101,800 | 5,698 |
| QC Holdings Inc. | 587,686 | 4,737 |
| CIT Group Inc. | 1,100,600 | 4,556 |
| Validus Holdings, Ltd. | 240,000 | 4,258 |
| Aon Corp. | 100,000 | 4,230 |
| Brown & Brown, Inc. | 203,600 | 4,178 |
*,^ | Portfolio Recovery Associates, Inc. | 113,350 | 4,067 |
| IPC Holdings Ltd. | 139,214 | 3,844 |
| BancorpSouth, Inc. | 157,300 | 3,818 |
*,^ | The St. Joe Co. | 108,500 | 3,355 |
| Axis Capital Holdings Ltd. | 116,900 | 3,329 |
| Federated Investors, Inc. | 137,500 | 3,327 |
| Eaton Vance Corp. | 140,350 | 3,088 |
* | SVB Financial Group | 49,560 | 2,550 |
| Taubman Co. REIT | 74,800 | 2,485 |
3 | Advanta Corp. Class A | 1,023,300 | 2,425 |
| Janus Capital Group Inc. | 201,500 | 2,366 |
* | Knight Capital Group, Inc. Class A | 162,200 | 2,345 |
* | Riskmetrics Group Inc. | 150,000 | 2,311 |
Page 5
Vanguard® Explorer Fund | | |
Schedule of Investments | | |
October 31, 2008 | | |
| | | Market |
| | | Value |
| | Shares | ($000) |
| Transatlantic Holdings, Inc. | 50,600 | 2,168 |
| Ventas, Inc. REIT | 55,700 | 2,009 |
* | Cardtronics Inc. | 351,483 | 1,961 |
| Washington REIT | 64,800 | 1,943 |
| Home Properties, Inc. REIT | 40,800 | 1,652 |
^ | GLG Partners, Inc. | 481,737 | 1,542 |
| Mid-America Apartment Communities, Inc. REIT | 42,200 | 1,487 |
| Nationwide Health Properties, Inc. REIT | 47,300 | 1,411 |
| City Holding Co. | 29,636 | 1,240 |
| Highwood Properties, Inc. REIT | 48,600 | 1,206 |
| PS Business Parks, Inc. REIT | 26,200 | 1,186 |
| Apartment Investment & Management Co. Class A REIT | 65,536 | 959 |
| Digital Realty Trust, Inc. REIT | 25,600 | 857 |
* | EZCORP, Inc. | 50,200 | 795 |
^ | National Financial Partners Corp. | 113,260 | 754 |
| DuPont Fabros Technology Inc. | 115,900 | 722 |
| Rayonier Inc. REIT | 19,300 | 638 |
| Capitol Federal Financial | 11,700 | 544 |
* | Broadpoint Securities Group | 178,400 | 526 |
| Camden Property Trust REIT | 14,500 | 489 |
| Forest City Enterprise Class A | 36,900 | 439 |
| Suffolk Bancorp | 12,800 | 415 |
| Federal Realty Investment Trust REIT | 2,900 | 178 |
| Tanger Factory Outlet Centers, Inc. REIT | 4,400 | 159 |
| Hancock Holding Co. | 3,500 | 155 |
* | PMA Capital Corp. Class A | 18,519 | 86 |
| Associated Estates Realty Corp. REIT | 7,100 | 58 |
* | Guaranty Bancorp | 4,993 | 21 |
| | | 451,486 |
Health Care (19.6%) | | |
* | Cephalon, Inc. | 1,353,105 | 97,045 |
* | Henry Schein, Inc. | 1,016,292 | 47,573 |
* | Edwards Lifesciences Corp. | 702,820 | 37,137 |
* | IDEXX Laboratories Inc. | 1,007,150 | 35,442 |
| DENTSPLY International Inc. | 1,086,989 | 33,023 |
* | ResMed Inc. | 960,360 | 32,902 |
* | Alexion Pharmaceuticals, Inc. | 802,440 | 32,699 |
| Pharmaceutical Product Development, Inc. | 1,041,456 | 32,264 |
* | Psychiatric Solutions, Inc. | 955,750 | 31,817 |
* | Regeneron Pharmaceuticals, Inc. | 1,638,064 | 31,615 |
* | Haemonetics Corp. | 479,400 | 28,313 |
* | Alkermes, Inc. | 2,819,600 | 27,858 |
* | Endo Pharmaceuticals Holdings, Inc. | 1,428,740 | 26,432 |
| PDL BioPharma Inc. | 2,540,768 | 24,772 |
| Perrigo Co. | 693,850 | 23,591 |
* | Qiagen NV | 1,609,300 | 22,949 |
* | Isis Pharmaceuticals, Inc. | 1,567,449 | 22,038 |
* | Hologic, Inc. | 1,761,609 | 21,562 |
* | Covance, Inc. | 397,907 | 19,895 |
* | BioMarin Pharmaceutical Inc. | 971,959 | 17,806 |
* | Varian Medical Systems, Inc. | 387,455 | 17,633 |
^ | Martek Biosciences Corp. | 581,713 | 17,352 |
* | Medarex, Inc. | 2,415,900 | 16,984 |
* | Seattle Genetics, Inc. | 1,649,904 | 16,961 |
* | Waters Corp. | 386,094 | 16,911 |
| Cooper Cos., Inc. | 980,232 | 16,154 |
* | Celera Corp. | 1,400,005 | 15,834 |
* | Nektar Therapeutics | 2,772,600 | 15,332 |
* | Immucor Inc. | 567,580 | 15,069 |
* | Vertex Pharmaceuticals, Inc. | 565,865 | 14,831 |
| STERIS Corp. | 430,902 | 14,668 |
* | Patterson Cos. | 569,950 | 14,437 |
| Techne Corp. | 195,050 | 13,462 |
* | Luminex Corp. | 717,600 | 13,383 |
Page 6
Vanguard® Explorer Fund | | |
Schedule of Investments | | |
October 31, 2008 | | |
| | | Market |
| | | Value |
| | Shares | ($000) |
* | Sun Healthcare Group Inc. | 1,163,700 | 13,359 |
* | Celgene Corp. | 202,710 | 13,026 |
* | ImClone Systems, Inc. | 181,727 | 12,496 |
* | Coventry Health Care Inc. | 907,100 | 11,965 |
* | MWI Veterinary Supply Inc. | 343,043 | 11,880 |
* | Community Health Systems, Inc. | 550,400 | 11,283 |
* | Watson Pharmaceuticals, Inc. | 430,564 | 11,268 |
* | Eclipsys Corp. | 752,900 | 11,181 |
| Beckman Coulter, Inc. | 222,950 | 11,130 |
* | Align Technology, Inc. | 1,597,500 | 11,071 |
* | Warner Chilcott Ltd. | 766,814 | 10,636 |
* | Invitrogen Corp. | 366,774 | 10,559 |
* | DaVita, Inc. | 182,185 | 10,339 |
* | Cougar Biotechnology Inc. | 393,683 | 10,000 |
| Hikma Pharmaceuticals PLC | 1,831,450 | 9,550 |
* | Masimo Corp. | 298,145 | 9,538 |
*,^ | Amedisys Inc. | 160,562 | 9,057 |
| Teleflex Inc. | 170,870 | 9,054 |
* | Bruker BioSciences Corp. | 2,142,310 | 8,762 |
* | Humana Inc. | 293,700 | 8,691 |
* | Human Genome Sciences, Inc. | 2,567,300 | 8,292 |
| Owens & Minor, Inc. | 184,700 | 7,992 |
* | Health Net Inc. | 615,100 | 7,922 |
* | OSI Pharmaceuticals, Inc. | 198,650 | 7,539 |
* | Wright Medical Group, Inc. | 317,269 | 7,354 |
| PerkinElmer, Inc. | 388,838 | 6,976 |
| Shire Pharmaceuticals Group PLC ADR | 175,000 | 6,904 |
* | Durect Corp. | 1,583,700 | 6,509 |
* | Thoratec Corp. | 250,190 | 6,160 |
* | Cyberonics, Inc. | 471,700 | 6,009 |
| Analogic Corp. | 133,680 | 5,903 |
* | Myriad Genetics, Inc. | 86,987 | 5,488 |
* | Amylin Pharmaceuticals, Inc. | 518,700 | 5,296 |
* | Gentiva Health Services, Inc. | 194,232 | 5,273 |
| Hill-Rom Holdings, Inc. | 228,800 | 5,207 |
* | Cerner Corp. | 135,147 | 5,032 |
* | Integra LifeSciences Holdings | 132,708 | 4,982 |
| Medicis Pharmaceutical Corp. | 343,050 | 4,895 |
* | The Medicines Co. | 277,700 | 4,840 |
* | CardioNet, Inc. | 181,530 | 4,645 |
* | VCA Antech, Inc. | 252,600 | 4,572 |
*,4 | Impax Laboratories, Inc. | 570,900 | 4,568 |
* | AthenaHealth Inc. | 146,850 | 4,494 |
* | Varian, Inc. | 121,806 | 4,489 |
*,^ | Eurand NV | 456,692 | 4,339 |
* | Sirona Dental Systems Inc. | 266,368 | 4,254 |
* | Lincare Holdings, Inc. | 158,800 | 4,184 |
* | United Therapeutics Corp. | 47,700 | 4,161 |
* | Bio-Rad Laboratories, Inc. Class A | 46,200 | 3,945 |
* | ImmunoGen, Inc. | 809,800 | 3,749 |
* | Onyx Pharmaceuticals, Inc. | 136,300 | 3,677 |
* | Exelixis, Inc. | 1,050,000 | 3,612 |
| West Pharmaceutical Services, Inc. | 89,800 | 3,585 |
* | Kendle International Inc. | 186,940 | 3,378 |
* | Cypress Bioscience, Inc. | 612,800 | 3,334 |
* | Zoll Medical Corp. | 137,848 | 3,319 |
* | Charles River Laboratories, Inc. | 91,600 | 3,282 |
* | Inverness Medical Innovations, Inc. | 171,186 | 3,278 |
| Invacare Corp. | 179,046 | 3,257 |
* | Kindred Healthcare, Inc. | 223,500 | 3,239 |
| Chemed Corp. | 72,500 | 3,175 |
* | WellCare Health Plans Inc. | 130,300 | 3,149 |
* | American Medical Systems Holdings, Inc. | 290,600 | 3,144 |
* | CONMED Corp. | 113,000 | 2,961 |
Page 7
Vanguard® Explorer Fund | | |
Schedule of Investments | | |
October 31, 2008 | | |
| | | Market |
| | | Value |
| | Shares | ($000) |
* | Alnylam Pharmaceuticals Inc. | 128,200 | 2,949 |
* | Nuvasive, Inc. | 62,015 | 2,920 |
* | Merit Medical Systems, Inc. | 153,900 | 2,816 |
* | Questcor Pharmaceuticals, Inc. | 339,361 | 2,627 |
* | CryoLife Inc. | 192,500 | 2,579 |
* | Conceptus, Inc. | 158,142 | 2,562 |
* | Emergent BioSolutions Inc. | 140,100 | 2,523 |
* | CorVel Corp. | 93,388 | 2,505 |
* | Emergency Medical Services LP Class A | 74,918 | 2,462 |
* | Cytokinetics, Inc. | 843,249 | 2,403 |
* | HMS Holdings Corp. | 96,800 | 2,398 |
| Omnicare, Inc. | 85,000 | 2,343 |
* | Obagi Medical Products, Inc. | 275,100 | 2,289 |
* | Mylan Inc. | 264,402 | 2,266 |
* | Illumina, Inc. | 73,200 | 2,257 |
* | Centene Corp. | 115,000 | 2,167 |
* | Sequenom, Inc. | 120,300 | 2,165 |
* | PAREXEL International Corp. | 202,657 | 2,108 |
| Universal Health Services Class B | 48,400 | 2,035 |
* | PSS World Medical, Inc. | 108,700 | 1,972 |
* | Cross Country Healthcare, Inc. | 171,768 | 1,944 |
* | ICON PLC - ADR | 76,598 | 1,943 |
* | Cynosure Inc. | 216,320 | 1,895 |
* | Catalyst Health Solutions, Inc. | 105,550 | 1,781 |
* | Affymetrix, Inc. | 470,414 | 1,736 |
* | CV Therapeutics, Inc. | 182,109 | 1,699 |
* | Dionex Corp. | 30,000 | 1,615 |
* | Cepheid, Inc. | 122,600 | 1,455 |
* | Advanced Medical Optics, Inc. | 227,880 | 1,406 |
* | AMN Healthcare Services, Inc. | 154,504 | 1,389 |
* | Millipore Corp. | 25,800 | 1,339 |
* | ev3 Inc. | 206,915 | 1,339 |
* | Volcano Corp. | 82,773 | 1,287 |
* | Natus Medical Inc. | 82,858 | 1,268 |
* | Noven Pharmaceuticals, Inc. | 101,435 | 1,141 |
* | Albany Molecular Research, Inc. | 89,587 | 1,133 |
*,^ | Enzon Pharmaceuticals, Inc. | 225,100 | 1,119 |
* | Sunrise Senior Living, Inc. | 363,860 | 1,099 |
* | Pediatrix Medical Group, Inc. | 28,225 | 1,091 |
* | Orthofix International N.V. | 77,472 | 1,050 |
| Atrion Corp. | 8,441 | 835 |
* | Harvard Bioscience, Inc. | 265,386 | 823 |
| Datascope Corp. | 13,900 | 697 |
*,^ | Idera Pharmaceuticals, Inc. | 70,320 | 683 |
* | Gen-Probe Inc. | 13,200 | 621 |
| Ensign Group Inc. | 37,100 | 608 |
* | Osteotech, Inc. | 158,611 | 506 |
* | Vivus, Inc. | 81,000 | 493 |
* | Capital Senior Living Corp. | 81,200 | 365 |
* | Auxilium Pharmaceuticals, Inc. | 17,500 | 344 |
* | Biomimetic Therapeutics, Inc. | 41,200 | 337 |
* | Momenta Pharmaceuticals, Inc. | 35,800 | 326 |
* | Sucampo Pharmaceuticals Inc. | 37,680 | 310 |
* | Pain Therapeutics, Inc. | 33,738 | 308 |
| Young Innovations, Inc. | 16,748 | 285 |
* | VNUS Medical Technologies, Inc. | 18,036 | 278 |
* | Medical Action Industries Inc. | 22,200 | 255 |
* | Neurocrine Biosciences, Inc. | 54,673 | 226 |
* | SonoSite, Inc. | 8,570 | 181 |
* | AngioDynamics, Inc. | 13,782 | 174 |
* | Animal Health International, Inc. | 24,692 | 159 |
* | Anika Resh Inc. | 21,328 | 129 |
* | Aspect Medical Systems, Inc. | 28,552 | 94 |
* | A.D.A.M., Inc. | 17,558 | 75 |
Page 8
Vanguard® Explorer Fund | | |
Schedule of Investments | | |
October 31, 2008 | | |
| | | Market |
| | | Value |
| | Shares | ($000) |
* | Angeion Corp. | 19,144 | 74 |
* | AMERIGROUP Corp. | 2,460 | 61 |
* | Sonic Innovations, Inc. | 28,680 | 48 |
* | Vascular Solutions, Inc. | 3,000 | 28 |
* | Columbia Laboratories Inc. | 15,100 | 24 |
* | eResearch Technology, Inc. | 2,800 | 18 |
* | Symmetry Medical Inc. | 970 | 13 |
* | RehabCare Group, Inc. | 702 | 12 |
* | Bioanalytical Systems, Inc. | 2,680 | 11 |
* | Allied Healthcare Products, Inc. | 300 | 1 |
| | | 1,379,429 |
Industrials (15.6%) | | |
| The Dun & Bradstreet Corp. | 634,100 | 46,727 |
* | Stericycle, Inc. | 778,680 | 45,498 |
| MSC Industrial Direct Co., Inc. Class A | 1,016,340 | 36,446 |
* | Kansas City Southern | 887,351 | 27,392 |
* | RBC Bearings Inc. | 1,041,518 | 24,715 |
* | Corrections Corp. of America | 1,251,216 | 23,911 |
* | Covanta Holding Corp. | 1,094,703 | 23,602 |
* | Tetra Tech, Inc. | 1,067,478 | 23,474 |
| Kennametal, Inc. | 1,082,910 | 22,979 |
| Ametek, Inc. | 679,090 | 22,580 |
| Equifax, Inc. | 849,354 | 22,151 |
* | Clean Harbors Inc. | 336,790 | 22,083 |
* | Alliant Techsystems, Inc. | 264,090 | 21,798 |
| McGrath RentCorp | 945,000 | 21,489 |
* | Waste Connections, Inc. | 616,851 | 20,880 |
*,^ | JetBlue Airways Corp. | 3,736,200 | 20,736 |
| Knight Transportation, Inc. | 1,186,900 | 18,872 |
| UTI Worldwide, Inc. | 1,439,513 | 16,929 |
| Donaldson Co., Inc. | 475,630 | 16,718 |
* | FTI Consulting, Inc. | 283,346 | 16,505 |
* | Quanta Services, Inc. | 798,194 | 15,772 |
| Con-way, Inc. | 453,100 | 15,424 |
* | Iron Mountain, Inc. | 616,650 | 14,972 |
* | Genesee & Wyoming Inc. Class A | 448,300 | 14,951 |
* | The Advisory Board Co. | 587,920 | 14,492 |
| Watsco, Inc. | 349,700 | 14,369 |
* | Teledyne Technologies, Inc. | 312,200 | 14,227 |
* | EnerSys | 1,059,130 | 14,002 |
| J.B. Hunt Transport Services, Inc. | 469,700 | 13,354 |
| Robert Half International, Inc. | 680,600 | 12,843 |
* | Shaw Group, Inc. | 706,155 | 12,633 |
* | US Airways Group Inc. | 1,233,550 | 12,508 |
| Heartland Express, Inc. | 744,420 | 11,419 |
* | Aecom Technology Corp. | 626,654 | 11,048 |
| Chicago Bridge & Iron Co. N.V. | 862,455 | 10,686 |
| Lennox International Inc. | 343,900 | 10,255 |
| The Manitowoc Co., Inc. | 1,030,544 | 10,141 |
| Ritchie Brothers Auctioneers Inc. | 527,380 | 9,793 |
* | Geo Group Inc. | 549,455 | 9,703 |
| Roper Industries Inc. | 201,625 | 9,144 |
| Healthcare Services Group, Inc. | 540,050 | 8,943 |
* | Navistar International Corp. | 294,817 | 8,880 |
| Acuity Brands, Inc. | 253,304 | 8,856 |
| Harsco Corp. | 358,390 | 8,483 |
* | AerCap Holdings NV | 1,279,150 | 8,110 |
* | MPS Group, Inc. | 1,028,445 | 8,012 |
* | McDermott International, Inc. | 429,521 | 7,358 |
*,^ | Suntech Power Holdings Co., Ltd. ADR | 414,000 | 7,245 |
* | Axsys Technologies, Inc. | 107,799 | 7,118 |
* | Jacobs Engineering Group Inc. | 190,275 | 6,932 |
* | TrueBlue, Inc. | 805,353 | 6,709 |
| Mine Safety Appliances Co. | 247,596 | 6,685 |
Page 9
Vanguard® Explorer Fund | | |
Schedule of Investments | | |
October 31, 2008 | | |
| | | Market |
| | | Value |
| | Shares | ($000) |
* | Stanley Inc. | 179,722 | 6,157 |
* | Mobile Mini, Inc. | 358,990 | 6,031 |
* | Esterline Technologies Corp. | 164,110 | 5,916 |
* | SunPower Corp. Class B | 196,638 | 5,822 |
* | Delta Air Lines Inc. | 523,150 | 5,744 |
| Ryder System, Inc. | 143,104 | 5,670 |
| GATX Corp. | 198,100 | 5,656 |
^ | Genco Shipping and Trading Ltd. | 254,583 | 5,308 |
| Barnes Group, Inc. | 353,190 | 5,125 |
* | Perini Corp. | 267,478 | 5,087 |
| Curtiss-Wright Corp. | 136,850 | 5,050 |
* | Hansen Transmissions | 2,977,202 | 4,994 |
| American Ecology Corp. | 279,300 | 4,899 |
| Crane Co. | 277,323 | 4,540 |
| Flowserve Corp. | 77,935 | 4,436 |
* | Kadant Inc. | 268,800 | 4,419 |
* | Flow International Corp. | 1,144,000 | 4,393 |
| The Brink’s Co. | 88,900 | 4,311 |
* | AGCO Corp. | 135,000 | 4,255 |
* | Kirby Corp. | 121,800 | 4,180 |
* | Sykes Enterprises, Inc. | 259,465 | 4,141 |
* | Thomas & Betts Corp. | 152,580 | 3,624 |
| Nordson Corp. | 95,950 | 3,543 |
* | Energy Conversion Devices, Inc. | 100,500 | 3,431 |
* | Resources Connection, Inc. | 197,300 | 3,421 |
* | GeoEye Inc. | 156,000 | 3,376 |
* | TransDigm Group, Inc. | 109,700 | 3,306 |
| Bucyrus International, Inc. | 135,300 | 3,265 |
| Hubbell Inc. Class B | 90,600 | 3,250 |
| Titan International, Inc. | 278,185 | 3,216 |
* | Continental Airlines, Inc. Class B | 169,500 | 3,207 |
| HEICO Corp. | 81,400 | 3,131 |
* | General Cable Corp. | 181,150 | 3,094 |
* | Vestas Wind Systems A/S | 74,901 | 3,068 |
* | Chart Industries, Inc. | 220,650 | 3,005 |
* | Atlas Air Worldwide Holdings, Inc. | 154,400 | 2,983 |
| Herman Miller, Inc. | 133,400 | 2,935 |
* | GrafTech International Ltd. | 339,000 | 2,749 |
| Knoll, Inc. | 187,000 | 2,704 |
| Triumph Group, Inc. | 59,900 | 2,627 |
* | CoStar Group, Inc. | 72,600 | 2,615 |
* | Mastec Inc. | 293,022 | 2,555 |
| China Everbright International, Ltd. | 28,881,000 | 2,520 |
^ | Horizon Lines Inc. | 527,994 | 2,476 |
* | Hertz Global Holdings Inc. | 343,342 | 2,469 |
* | EMCOR Group, Inc. | 137,800 | 2,449 |
| Insteel Industries, Inc. | 226,500 | 2,324 |
* | Orbital Sciences Corp. | 112,700 | 2,309 |
| CIRCOR International, Inc. | 75,200 | 2,305 |
*,^ | RSC Holdings Inc. | 311,200 | 2,284 |
*,^ | Trex Co., Inc. | 139,400 | 2,274 |
| Interface, Inc. | 317,400 | 2,238 |
* | Beacon Roofing Supply, Inc. | 163,294 | 2,234 |
* | American Reprographics Co. | 207,350 | 2,206 |
* | Michael Baker Corp. | 91,001 | 2,169 |
* | Cenveo Inc. | 437,700 | 2,114 |
* | GT Solar International Inc. | 444,500 | 2,049 |
* | Gardner Denver Inc. | 79,300 | 2,032 |
| Federal Signal Corp. | 236,992 | 2,017 |
| Robbins & Myers, Inc. | 94,000 | 1,918 |
* | Columbus McKinnon Corp. | 134,668 | 1,891 |
| Pall Corp. | 70,100 | 1,851 |
* | TBS International Ltd. | 213,790 | 1,830 |
* | Exponent, Inc. | 62,180 | 1,830 |
Page 10
Vanguard® Explorer Fund | | |
Schedule of Investments | | |
October 31, 2008 | | |
| | | Market |
| | | Value |
| | Shares | ($000) |
^ | Lindsay Manufacturing Co. | 38,100 | 1,813 |
* | On Assignment, Inc. | 274,484 | 1,784 |
| The Toro Co. | 50,300 | 1,692 |
| AAON, Inc. | 99,374 | 1,639 |
| The Timken Co. | 101,900 | 1,618 |
| Deluxe Corp. | 128,907 | 1,568 |
* | CRA International Inc. | 54,787 | 1,483 |
| Pacer International, Inc. | 131,200 | 1,481 |
* | EnPro Industries, Inc. | 64,533 | 1,433 |
| The Corporate Executive Board Co. | 46,800 | 1,396 |
| Textainer Group Holdings Ltd. | 125,700 | 1,386 |
*,^ | AMREP Corp. | 45,200 | 1,361 |
* | K-Tron International, Inc | 13,968 | 1,313 |
| Graham Corp. | 58,618 | 1,231 |
| VSE Corp. | 33,627 | 1,103 |
| Watson Wyatt & Co. Holdings | 25,100 | 1,066 |
* | Hudson Highland Group, Inc. | 200,940 | 1,053 |
* | Dynamex Inc. | 43,000 | 1,050 |
* | Huron Consulting Group Inc. | 17,500 | 951 |
| Comfort Systems USA, Inc. | 100,081 | 934 |
* | WESCO International, Inc. | 45,000 | 895 |
* | USA Truck, Inc. | 52,600 | 777 |
*,^ | China Architectural Engineering Inc. | 188,854 | 744 |
* | GP Strategies Corp. | 117,140 | 705 |
* | Spherion Corp. | 190,605 | 606 |
* | Kforce Inc. | 75,156 | 591 |
* | Old Dominion Freight Line, Inc. | 19,300 | 586 |
* | Navigant Consulting, Inc. | 32,388 | 524 |
* | Altra Holdings Inc. | 56,699 | 507 |
* | Copart, Inc. | 13,900 | 485 |
* | LECG Corp. | 94,348 | 453 |
| Ampco-Pittsburgh Corp. | 18,367 | 434 |
* | PRG-Schultz International, Inc. | 98,200 | 416 |
| KBR Inc. | 26,600 | 395 |
| Apogee Enterprises, Inc. | 40,000 | 394 |
| CDI Corp. | 30,300 | 394 |
* | Duff & Phelps Corp. | 18,300 | 348 |
| Copa Holdings SA Class A | 12,800 | 325 |
| The Eastern Co. | 27,174 | 319 |
* | Casella Waste Systems, Inc. | 61,325 | 309 |
| NN, Inc. | 29,598 | 213 |
*,^ | C & D Technologies, Inc. | 60,921 | 213 |
| Bluelinx Holdings Inc. | 77,502 | 208 |
| The Standard Register Co. | 25,600 | 208 |
| Eagle Bulk Shipping Inc. | 19,980 | 199 |
| Wabtec Corp. | 4,800 | 191 |
* | YRC Worldwide, Inc. | 41,500 | 190 |
| Applied Industrial Technology, Inc. | 8,464 | 171 |
| Industrial Services of America, Inc. | 19,900 | 154 |
| TAL International Group, Inc. | 9,290 | 154 |
| Landstar System, Inc. | 3,400 | 131 |
* | Ultrapetrol Bahamas Ltd. | 31,282 | 129 |
* | A.T. Cross Co. Class A | 23,888 | 127 |
* | Waste Services, Inc. | 19,100 | 114 |
| EnergySolutions | 22,476 | 101 |
* | SL Industries, Inc. | 5,933 | 63 |
* | ICT Group, Inc. | 11,690 | 62 |
| Twin Disc, Inc. | 6,190 | 48 |
* | Taylor Devices Inc. | 13,776 | 46 |
* | CAI International Inc. | 4,900 | 39 |
* | Korn/Ferry International | 2,550 | 35 |
* | ICF International, Inc. | 555 | 10 |
* | MFRI, Inc. | 1,400 | 10 |
* | Nortech Systems, Inc. | 2,090 | 9 |
Page 11
Vanguard® Explorer Fund | | |
Schedule of Investments | | |
October 31, 2008 | | |
| | | Market |
| | | Value |
| | Shares | ($000) |
| Providence and Worcester Railroad Co. | 600 | 8 |
* | Tecumseh Products Co. Class A | 208 | 4 |
* | Servotronics Inc. | 100 | 1 |
| | | 1,099,980 |
Information Technology (23.3%) | | |
* | Microsemi Corp. | 3,113,380 | 67,685 |
* | Polycom, Inc. | 2,342,445 | 49,215 |
* | Alliance Data Systems Corp. | 921,404 | 46,218 |
* | Mettler-Toledo International Inc. | 547,131 | 41,877 |
* | Ariba, Inc. | 3,517,009 | 37,632 |
* | FEI Co. | 1,602,502 | 33,669 |
| FactSet Research Systems Inc. | 784,550 | 30,433 |
^ | Heartland Payment Systems, Inc. | 1,706,992 | 29,719 |
* | VeriFone Holdings, Inc. | 2,396,300 | 27,222 |
* | ON Semiconductor Corp. | 5,071,025 | 25,913 |
* | Riverbed Technology, Inc. | 1,987,900 | 24,908 |
* | Red Hat, Inc. | 1,781,313 | 23,709 |
* | Verigy Ltd. | 1,630,400 | 23,641 |
| Syntel, Inc. | 938,337 | 23,336 |
* | Euronet Worldwide, Inc. | 1,935,150 | 23,067 |
| Global Payments Inc. | 557,370 | 22,579 |
* | PMC Sierra Inc. | 4,567,500 | 21,376 |
* | TiVo Inc. | 3,008,500 | 20,668 |
* | Hewitt Associates, Inc. | 724,041 | 20,193 |
* | Concur Technologies, Inc. | 788,412 | 19,892 |
* | NICE-Systems Ltd. ADR | 879,567 | 19,667 |
* | MKS Instruments, Inc. | 1,033,350 | 19,169 |
* | Netezza Corp. | 1,905,600 | 18,484 |
* | Blue Coat Systems, Inc. | 1,356,224 | 18,309 |
| Intersil Corp. | 1,296,600 | 17,750 |
* | Progress Software Corp. | 759,686 | 17,427 |
* | ANSYS, Inc. | 601,859 | 17,231 |
* | Sycamore Networks, Inc. | 5,054,200 | 16,881 |
* | Ingram Micro, Inc. Class A | 1,248,700 | 16,645 |
* | Synopsys, Inc. | 904,300 | 16,531 |
* | salesforce.com, inc. | 525,300 | 16,263 |
* | FLIR Systems, Inc. | 502,018 | 16,115 |
* | Teradyne, Inc. | 3,139,942 | 16,014 |
* | Cymer, Inc. | 630,400 | 15,426 |
* | Littelfuse, Inc. | 779,750 | 14,550 |
| Amphenol Corp. | 498,410 | 14,279 |
* | Sapient Corp. | 2,588,005 | 14,208 |
* | S1 Corp. | 2,207,385 | 13,840 |
* | Websense, Inc. | 679,178 | 13,258 |
* | Cogent Inc. | 1,428,225 | 13,054 |
* | Affiliated Computer Services, Inc. Class A | 305,410 | 12,522 |
* | SAIC, Inc. | 666,100 | 12,303 |
* | j2 Global Communications, Inc. | 740,144 | 11,931 |
* | Avnet, Inc. | 705,435 | 11,809 |
* | ATMI, Inc. | 969,185 | 11,785 |
* | NeuStar, Inc. Class A | 577,680 | 11,380 |
* | CyberSource Corp. | 934,800 | 11,358 |
* | Solera Holdings, Inc. | 456,000 | 11,350 |
* | BMC Software, Inc. | 430,800 | 11,123 |
* | Informatica Corp. | 774,264 | 10,878 |
* | Power Integrations, Inc. | 500,550 | 10,507 |
* | HLTH Corp. | 1,242,200 | 10,298 |
* | Itron, Inc. | 210,070 | 10,184 |
| ADTRAN Inc. | 661,430 | 10,054 |
* | Tessera Technologies, Inc. | 581,690 | 10,052 |
* | CACI International, Inc. | 239,569 | 9,865 |
* | Macrovision Solutions Corp. | 890,120 | 9,863 |
* | VistaPrint Ltd. | 569,325 | 9,718 |
* | Atmel Corp. | 2,326,709 | 9,656 |
Page 12
Vanguard® Explorer Fund | | |
Schedule of Investments | | |
October 31, 2008 | | |
| | | Market |
| | | Value |
| | Shares | ($000) |
* | MICROS Systems, Inc. | 558,531 | 9,512 |
* | Skyworks Solutions, Inc. | 1,321,900 | 9,425 |
* | McAfee Inc. | 287,105 | 9,345 |
* | Compuware Corp. | 1,459,526 | 9,312 |
* | Sybase, Inc. | 343,902 | 9,158 |
* | Varian Semiconductor Equipment Associates, Inc. | 452,750 | 8,883 |
* | EarthLink, Inc. | 1,189,820 | 8,210 |
* | ValueClick, Inc. | 1,066,665 | 7,893 |
| Marchex, Inc. | 1,020,088 | 7,834 |
* | Cadence Design Systems, Inc. | 1,871,260 | 7,616 |
* | Sohu.com Inc. | 138,490 | 7,609 |
* | Digital River, Inc. | 304,170 | 7,537 |
| Diebold, Inc. | 251,600 | 7,478 |
| Take-Two Interactive Software, Inc. | 607,870 | 7,209 |
* | Commvault Systems, Inc. | 628,400 | 6,724 |
* | Net 1 UEPS Technologies, Inc. | 477,300 | 6,682 |
* | Parametric Technology Corp. | 514,310 | 6,681 |
* | Interwoven Inc. | 520,569 | 6,564 |
| Blackbaud, Inc. | 429,450 | 6,528 |
* | Novell, Inc. | 1,388,554 | 6,471 |
* | Hittite Microwave Corp. | 193,500 | 6,341 |
* | Silicon Laboratories Inc. | 243,300 | 6,316 |
* | Integrated Device Technology Inc. | 967,086 | 6,151 |
* | LSI Corp. | 1,590,147 | 6,122 |
* | OpNext, Inc. | 1,529,798 | 6,119 |
* | EPIQ Systems, Inc. | 438,950 | 5,965 |
* | Trimble Navigation Ltd. | 285,750 | 5,878 |
* | VeriSign, Inc. | 267,895 | 5,679 |
| National Instruments Corp. | 223,000 | 5,664 |
* | Harris Stratex Networks, Inc. Class A | 850,775 | 5,641 |
* | SPSS, Inc. | 239,425 | 5,593 |
* | Emulex Corp. | 556,249 | 5,284 |
* | Manhattan Associates, Inc. | 311,416 | 5,235 |
* | Perot Systems Corp. | 356,584 | 5,131 |
* | Broadcom Corp. | 300,000 | 5,124 |
* | Kenexa Corp. | 572,759 | 5,103 |
* | Brooks Automation, Inc. | 737,600 | 5,053 |
* | Lawson Software, Inc. | 948,428 | 5,046 |
* | Quest Software, Inc. | 363,958 | 4,822 |
* | Stratasys, Inc. | 392,000 | 4,735 |
* | DTS Inc. | 226,774 | 4,683 |
* | Acme Packet, Inc. | 986,426 | 4,676 |
* | DealerTrack Holdings Inc. | 435,000 | 4,668 |
*,^ | Data Domain, Inc. | 250,995 | 4,633 |
* | Wind River Systems Inc. | 523,680 | 4,577 |
* | Hutchinson Technology, Inc. | 666,850 | 4,561 |
* | RF Micro Devices, Inc. | 2,231,200 | 4,440 |
* | PROS Holdings, Inc. | 817,894 | 4,392 |
* | Silicon Motion Technology Corp. ADR | 1,252,200 | 4,358 |
* | DemandTec, Inc. | 600,580 | 4,330 |
| Harris Corp. | 117,550 | 4,226 |
*,^ | Netlogic Microsystems Inc. | 197,925 | 4,180 |
| Broadridge Financial Solutions LLC | 333,200 | 4,032 |
* | Metavante Technologies | 237,400 | 3,981 |
* | Taleo Corp. Class A | 287,900 | 3,973 |
* | Dolby Laboratories Inc. | 124,400 | 3,927 |
* | Ulticom, Inc. | 676,000 | 3,870 |
* | TriQuint Semiconductor, Inc. | 856,810 | 3,839 |
* | ADC Telecommunications, Inc. | 599,098 | 3,798 |
* | Blackboard Inc. | 150,160 | 3,676 |
| Xilinx, Inc. | 195,000 | 3,592 |
* | ManTech International Corp. | 65,511 | 3,534 |
* | Coherent, Inc. | 137,814 | 3,487 |
| MTS Systems Corp. | 105,985 | 3,442 |
Page 13
Vanguard® Explorer Fund | | |
Schedule of Investments | | |
October 31, 2008 | | |
| | | Market |
| | | Value |
| | Shares | ($000) |
| Jack Henry & Associates Inc. | 178,400 | 3,391 |
*,^ | Renesola Ltd. ADR | 532,270 | 3,343 |
| IXYS Corp. | 407,764 | 3,238 |
* | NetApp, Inc. | 238,475 | 3,227 |
* | Atheros Communications, Inc. | 177,750 | 3,194 |
* | Diodes Inc. | 317,775 | 3,140 |
* | Plexus Corp. | 167,400 | 3,124 |
* | Wright Express Corp. | 221,800 | 3,036 |
| Jabil Circuit, Inc. | 356,200 | 2,996 |
* | Integral Systems, Inc. | 116,406 | 2,860 |
* | Ceva, Inc. | 326,383 | 2,774 |
* | AsiaInfo Holdings, Inc. | 240,500 | 2,643 |
* | Ultratech, Inc. | 174,279 | 2,628 |
* | JDA Software Group, Inc. | 175,509 | 2,506 |
* | Anixter International Inc. | 70,500 | 2,370 |
* | Cirrus Logic, Inc. | 404,746 | 2,323 |
* | Ciena Corp. | 237,400 | 2,281 |
* | Multi-Fineline Electronix, Inc. | 194,700 | 2,274 |
* | NetScout Systems, Inc. | 230,805 | 2,220 |
* | Vocus, Inc. | 129,850 | 2,185 |
* | GSI Commerce, Inc. | 209,000 | 2,163 |
* | Arrow Electronics, Inc. | 118,488 | 2,068 |
* | Bookham, Inc. | 3,784,600 | 2,044 |
* | The Hackett Group Inc. | 677,142 | 2,018 |
* | Western Digital Corp. | 121,500 | 2,005 |
* | Forrester Research, Inc. | 70,600 | 1,980 |
* | QLogic Corp. | 162,300 | 1,951 |
* | SkillSoft PLC | 252,400 | 1,943 |
* | Lexmark International, Inc. | 74,700 | 1,929 |
* | Sonic Solutions, Inc. | 938,400 | 1,914 |
| United Online, Inc. | 251,622 | 1,862 |
* | Super Micro Computer Inc. | 292,280 | 1,836 |
* | CSG Systems International, Inc. | 109,445 | 1,820 |
* | AuthenTec, Inc. | 961,100 | 1,807 |
* | Amkor Technology, Inc. | 443,422 | 1,800 |
* | Cypress Semiconductor Corp. | 356,872 | 1,788 |
* | Internet Brands Inc. | 274,600 | 1,782 |
* | TIBCO Software Inc. | 344,858 | 1,776 |
*,^ | UTStarcom, Inc. | 691,100 | 1,645 |
* | iGATE Corp. | 224,899 | 1,527 |
* | Radiant Systems, Inc. | 252,900 | 1,333 |
* | Measurement Specialties, Inc. | 119,374 | 1,275 |
* | OSI Systems Inc. | 108,400 | 1,247 |
* | Telecommunication Systems, Inc. | 167,506 | 1,152 |
* | Vignette Corp. | 131,700 | 1,069 |
* | Powerwave Technologies, Inc. | 1,093,900 | 1,039 |
| Pegasystems Inc. | 75,300 | 985 |
| Fair Isaac, Inc. | 59,628 | 930 |
* | OPNET Technologies, Inc. | 72,565 | 916 |
* | Akamai Technologies, Inc. | 62,700 | 902 |
* | Comtech Telecommunications Corp. | 18,000 | 872 |
* | RightNow Technologies Inc. | 132,192 | 870 |
* | CPI International, Inc. | 87,400 | 862 |
* | Harmonic, Inc. | 120,000 | 853 |
* | Sumtotal Systems Inc. | 263,600 | 846 |
* | PC Mall, Inc. | 188,420 | 844 |
* | Veeco Instruments, Inc. | 99,627 | 771 |
* | TeleTech Holdings, Inc. | 84,000 | 759 |
* | TNS Inc. | 50,918 | 722 |
* | Silicon Image, Inc. | 147,700 | 675 |
* | Spreadtrum Communications, Inc. | 514,840 | 654 |
| Total System Services, Inc. | 47,104 | 647 |
* | Insight Enterprises, Inc. | 65,799 | 640 |
* | Oplink Communications, Inc. | 78,256 | 635 |
Page 14
Vanguard® Explorer Fund | | |
Schedule of Investments | | |
October 31, 2008 | | |
| | | Market |
| | | Value |
| | Shares | ($000) |
* | SeaChange International, Inc. | 80,181 | 613 |
*,^ | Airvana, Inc. | 139,300 | 612 |
* | Mentor Graphics Corp. | 82,300 | 604 |
* | Vishay Intertechnology, Inc. | 136,320 | 588 |
* | Gerber Scientific, Inc. | 122,673 | 586 |
* | Standard Microsystem Corp. | 32,536 | 586 |
* | Rofin-Sinar Technologies Inc. | 26,150 | 583 |
* | ScanSource, Inc. | 29,200 | 579 |
| MAXIMUS, Inc. | 17,949 | 573 |
* | Double-Take Software Inc. | 73,200 | 542 |
* | Tollgrade Communications, Inc. | 120,638 | 531 |
* | Online Resources Corp. | 149,100 | 522 |
| QAD Inc. | 96,398 | 492 |
| PC-Tel, Inc. | 82,420 | 484 |
* | Keynote Systems Inc. | 46,519 | 456 |
* | Avanex Corp. | 122,815 | 381 |
| Cass Information Systems, Inc. | 9,100 | 316 |
* | Techwell, Inc. | 36,000 | 315 |
* | Ness Technologies Inc. | 37,700 | 279 |
* | Cabot Microelectronics Corp. | 9,000 | 259 |
* | IntriCon Corp. | 48,000 | 252 |
* | Computer Task Group, Inc. | 50,047 | 250 |
* | Perceptron, Inc. | 58,898 | 250 |
* | TechTeam Global, Inc. | 42,119 | 246 |
* | Semtech Corp. | 19,400 | 235 |
* | Zygo Corp. | 25,706 | 221 |
* | Electro Scientific Industries, Inc. | 25,826 | 216 |
* | Nuance Communications, Inc. | 23,500 | 215 |
* | Internap Network Services Corp. | 75,023 | 215 |
* | Internet Gold-Golden Lines Ltd. | 39,949 | 207 |
* | Tekelec | 15,800 | 200 |
* | Actel Corp. | 15,394 | 186 |
* | WebMD Health Corp. Class A | 8,100 | 181 |
* | F5 Networks, Inc. | 6,500 | 161 |
* | EMS Technologies, Inc. | 7,500 | 157 |
* | BigBand Networks Inc. | 38,756 | 143 |
* | Inx Inc. | 24,282 | 139 |
* | Equinix, Inc. | 2,100 | 131 |
* | Semitool, Inc. | 19,792 | 117 |
* | Data I/O Corp. | 34,611 | 99 |
* | KVH Industries, Inc. | 14,840 | 87 |
* | PLX Technology, Inc. | 24,081 | 83 |
* | Bottomline Technologies, Inc. | 10,164 | 80 |
* | SonicWALL, Inc. | 14,467 | 65 |
* | Brocade Communications Systems, Inc. | 13,500 | 51 |
* | Avocent Corp. | 2,168 | 33 |
* | Versant Corp. | 1,601 | 26 |
* | Web.com Group, Inc. | 4,495 | 22 |
* | Applied Micro Circuits Corp. | 1,800 | 9 |
* | CommScope, Inc. | 400 | 6 |
* | Datalink Corp. | 1,197 | 4 |
* | Logility, Inc. | 200 | 1 |
| | | 1,640,335 |
Materials (4.1%) | | |
| AptarGroup Inc. | 1,579,600 | 47,893 |
| Sensient Technologies Corp. | 1,273,300 | 32,125 |
| Albemarle Corp. | 1,021,170 | 24,866 |
| Hercules, Inc. | 1,415,174 | 23,789 |
| Terra Industries, Inc. | 808,968 | 17,789 |
| Minerals Technologies, Inc. | 273,552 | 15,527 |
| FMC Corp. | 307,800 | 13,402 |
| Arch Chemicals, Inc. | 444,081 | 12,599 |
* | OM Group, Inc. | 431,400 | 9,206 |
| Sealed Air Corp. | 513,800 | 8,694 |
Page 15
Vanguard® Explorer Fund | | |
Schedule of Investments | | |
October 31, 2008 | | |
| | | Market |
| | | Value |
| | Shares | ($000) |
| RPM International, Inc. | 471,900 | 6,701 |
| Airgas, Inc. | 152,200 | 5,838 |
* | LSB Industries, Inc. | 702,558 | 5,775 |
| Commercial Metals Co. | 518,900 | 5,760 |
| International Flavors & Fragrances, Inc. | 172,410 | 5,496 |
* | Century Aluminum Co. | 424,300 | 5,333 |
* | Pactiv Corp. | 195,000 | 4,594 |
| Innophos Holdings Inc. | 170,396 | 4,558 |
| Nalco Holding Co. | 273,712 | 3,865 |
| Greif Inc. Class A | 84,200 | 3,417 |
| Compass Minerals International, Inc. | 61,700 | 3,389 |
| Ferro Corp. | 213,010 | 3,297 |
*,^ | ShengdaTech Inc. | 492,277 | 2,496 |
* | Intrepid Potash, Inc. | 113,700 | 2,472 |
| Steel Dynamics, Inc. | 178,700 | 2,130 |
| Schnitzer Steel Industries, Inc. Class A | 78,200 | 2,106 |
| Ball Corp. | 59,200 | 2,025 |
| CF Industries Holdings, Inc. | 25,900 | 1,663 |
* | Crown Holdings, Inc. | 82,100 | 1,657 |
| Reliance Steel & Aluminum Co. | 61,900 | 1,550 |
| Martin Marietta Materials, Inc. | 18,400 | 1,442 |
| NewMarket Corp. | 32,110 | 1,210 |
| Scotts Miracle-Gro Co. | 35,955 | 939 |
| AK Steel Holding Corp. | 67,000 | 933 |
* | Solutia Inc. | 87,800 | 846 |
* | GenTek, Inc. | 25,000 | 450 |
| Worthington Industries, Inc. | 36,876 | 445 |
| Innospec, Inc. | 48,683 | 426 |
* | Universal Stainless & Alloy Products, Inc. | 8,400 | 155 |
| Stepan Co. | 3,330 | 119 |
* | Bway Holding Co. | 6,380 | 48 |
| | | 287,025 |
Telecommunication Services (0.7%) | | |
* | American Tower Corp. Class A | 434,555 | 14,041 |
* | Clearwire Corp. | 1,489,600 | 12,915 |
| Partner Communications Company Ltd. | 536,300 | 10,018 |
| Telephone & Data Systems, Inc. | 130,400 | 3,501 |
* | Syniverse Holdings Inc. | 162,237 | 3,050 |
| NTELOS Holdings Corp. | 105,900 | 2,753 |
* | Centennial Communications Corp. Class A | 370,100 | 1,318 |
* | Premiere Global Services, Inc. | 46,510 | 463 |
* | SBA Communications Corp. | 16,300 | 342 |
| Consolidated Communications Holdings, Inc. | 3,610 | 37 |
| | | 48,438 |
Utilities (0.6%) | | |
| UGI Corp. Holding Co. | 609,900 | 14,558 |
| ITC Holdings Corp. | 295,200 | 11,979 |
| Ormat Technologies Inc. | 351,000 | 8,480 |
| CenterPoint Energy Inc. | 426,000 | 4,908 |
| Sierra Pacific Resources | 483,242 | 4,006 |
| CMS Energy Corp. | 114,225 | 1,171 |
* | El Paso Electric Co. | 44,500 | 824 |
| Energen Corp. | 9,200 | 309 |
| Southwest Water Co. | 1,030 | 8 |
| | | 46,243 |
| | | |
Total Common Stocks (Cost $8,676,933) | | 6,615,729 |
Page 16
Vanguard® Explorer Fund | | |
Schedule of Investments | | |
October 31, 2008 | | |
| | | Market |
| | | Value |
| | Shares | ($000) |
Temporary Cash Investments (7.5%)1 | | |
Money Market Fund (6.5%) | | |
5,6 | Vanguard Market Liquidity Fund, 2.217% | 460,318,555 | 460,319 |
| | | |
| | Face | |
| | Amount | |
| | ($000) | |
Repurchase Agreement (0.6%) | | |
| JPMorgan Securities Inc., 0.230%, 11/3/08 | | |
| (Dated 10/31/08, Repurchase Value $41,901,000, collateralized by Federal National Mortgage Assn. | | |
| 5.500%, 9/1/35–6/1/38) | 41,900 | 41,900 |
| | | |
U.S. Government Agency Obligations (0.4%) | | |
7,8 | Federal Home Loan Bank, 2.433%, 11/6/08 | 18,500 | 18,497 |
7,8 | Federal Home Loan Bank, 2.576%, 11/24/08 | 8,000 | 7,991 |
7,8 | Federal Home Loan Mortgage Corp., 1.912%, 2/27/09 | 500 | 496 |
| | | 26,984 |
Total Temporary Cash Investments (Cost $529,196) | | 529,203 |
Total Investments (101.4%) (Cost $9,206,129) | | 7,144,932 |
6Other Assets and Liabilities—Net (–1.4%) | | (95,859) |
Net Assets (100%) | | 7,049,073 |
* Non-income-producing security.
^ Part of security position is on loan to broker-dealers. The total value of securities on loan is $82,936,000.
1 The fund invests a portion of its cash reserves in equity markets through the use of index futures contracts. After giving effect to futures investments, the fund’s effective common stock and temporary cash investment positions represent 97.6% and 3.8%, respectively, of net assets.
2 Considered an affiliated company of the fund as the issuer is another member of The Vanguard Group.
3 Considered an affiliated company of the fund as the fund owns more than 5% of the outstanding voting securities of such company.
4 Restricted security represents 0.1% of net assets.
5 Affiliated money market fund available only to Vanguard funds and certain trusts and accounts managed by Vanguard. Rate shown is the 7-day yield.
6 Includes $84,415,000 of collateral received for securities on loan.
7 The issuer operates under a congressional charter; its securities are neither issued nor guaranteed by the U.S. government.
8 Securities with a value of $26,984,000 have been segregated as initial margin for open futures contracts.
ADR—American Depositary Receipt.
REIT—Real Estate Investment Trust.
| © 2008 Vanguard Group. Inc. |
Page 17 | All rights reserved. |
| Vanguard Marketing Corporation, Distributor. |
| |
| |
| SNA240 122008 |
Item 2: Code of Ethics. The Registrant has adopted a code of ethics that applies to the Registrant’s principal executive officer, principal financial officer, principal accounting officer or controller or persons performing similar functions. The Code of Ethics was amended during the reporting period covered by this report to make certain technical, non-material changes.
Item 3: Audit Committee Financial Expert. The following members of the Audit Committee have been determined by the Registrant’s Board of Trustees to be Audit Committee Financial Experts serving on its Audit Committee, and to be independent: Charles D. Ellis, Rajiv L. Gupta, JoAnn Heffernan Heisen, André F. Perold, Alfred M. Rankin, Jr., and J. Lawrence Wilson.
Item 4: Principal Accountant Fees and Services.
(a) Audit Fees.
Audit Fees of the Registrant
Fiscal Year Ended October 31, 2008: $34,000
Fiscal Year Ended October 31, 2007: $33,000
Aggregate Audit Fees of Registered Investment Companies in the Vanguard Group.
Fiscal Year Ended October 31, 2008: $3,055,590
Fiscal Year Ended October 31, 2007: $2,835,320
(b) Audit-Related Fees.
Fiscal Year Ended October 31, 2008: $626,240
Fiscal Year Ended October 31, 2007: $630,400
Includes fees billed in connection with assurance and related services provided to the Registrant, The Vanguard Group, Inc., Vanguard Marketing Corporation, and other registered investment companies in the Vanguard Group.
(c) Tax Fees.
Fiscal Year Ended October 31, 2008: $230,400
Fiscal Year Ended October 31, 2007: $215,900
Includes fees billed in connection with tax compliance, planning and advice services provided to the Registrant, The Vanguard Group, Inc., Vanguard Marketing Corporation, and other registered investment companies in the Vanguard Group and related to income and excise taxes.
(d) All Other Fees.
Fiscal Year Ended October 31, 2008: $0
Fiscal Year Ended October 31, 2007: $0
Includes fees billed for services related to risk management and privacy matters. Services were provided to the Registrant, The Vanguard Group, Inc., Vanguard Marketing Corporation, and other registered investment companies in the Vanguard Group.
(e) (1) Pre-Approval Policies. The policy of the Registrant’s Audit Committee is to consider and, if appropriate, approve before the principal accountant is engaged for such services, all specific audit and non-audit services provided to: (1) the Registrant; (2) The Vanguard Group, Inc.; (3) other entities controlled by The Vanguard Group, Inc. that provide ongoing services to the Registrant; and (4) other registered investment companies in the Vanguard Group. In making a determination, the Audit Committee considers whether the services are consistent with maintaining the principal accountant’s independence.
In the event of a contingency situation in which the principal accountant is needed to provide services in between scheduled Audit Committee meetings, the Chairman of the Audit Committee would be called on to consider and, if appropriate, pre-approve audit or permitted non-audit
services in an amount sufficient to complete services through the next Audit Committee meeting, and to determine if such services would be consistent with maintaining the accountant’s independence. At the next scheduled Audit Committee meeting, services and fees would be presented to the Audit Committee for formal consideration, and, if appropriate, approval by the entire Audit Committee. The Audit Committee would again consider whether such services and fees are consistent with maintaining the principal accountant’s independence.
The Registrant’s Audit Committee is informed at least annually of all audit and non-audit services provided by the principal accountant to the Vanguard complex, whether such services are provided to: (1) the Registrant; (2) The Vanguard Group, Inc.; (3) other entities controlled by The Vanguard Group, Inc. that provide ongoing services to the Registrant; or (4) other registered investment companies in the Vanguard Group.
(2) No percentage of the principal accountant’s fees or services were approved pursuant to the waiver provision of paragraph (c)(7)(i)(C) of Rule 2-01 of Regulation S-X.
(f) For the most recent fiscal year, over 50% of the hours worked under the principal accountant’s engagement were not performed by persons other than full-time, permanent employees of the principal accountant.
(g) Aggregate Non-Audit Fees.
Fiscal Year Ended October 31, 2008: $230,400
Fiscal Year Ended October 31, 2007: $215,900
Includes fees billed for non-audit services provided to the Registrant, The Vanguard Group, Inc., Vanguard Marketing Corporation, and other registered investment companies in the Vanguard Group.
(h) For the most recent fiscal year, the Audit Committee has determined that the provision of all non-audit services was consistent with maintaining the principal accountant’s independence.
Item 5: Not Applicable.
Item 6: Not Applicable.
Item 7: Not Applicable.
Item 8: Not Applicable.
Item 9: Not Applicable.
Item 10: Not Applicable.
Item 11: Controls and Procedures.
(a) Disclosure Controls and Procedures. The Principal Executive and Financial Officers concluded that the Registrant's Disclosure Controls and Procedures are effective based on their evaluation of the Disclosure Controls and Procedures as of a date within 90 days of the filing date of this report.
(b) Internal Control Over Financial Reporting. There were no significant changes in Registrant’s Internal Control Over Financial Reporting or in other factors that could significantly affect this control subsequent to the date of the evaluation, including any corrective actions with regard to significant deficiencies and material weaknesses.
Item 12: Exhibits.
(a) Code of Ethics.
(b) Certifications.
Pursuant to the requirements of the Securities Exchange Act of 1934 and the Investment Company Act of 1940, the registrant has duly caused this report to be signed on its behalf by the undersigned, thereunto duly authorized.
| VANGUARD EXPLORER FUND |
| |
BY: | /s/ F. WILLIAM MCNABB III* |
| F. WILLIAM MCNABB III |
| CHIEF EXECUTIVE OFFICER |
Date: December 16, 2008
Pursuant to the requirements of the Securities Exchange Act of 1934 and the Investment Company Act of 1940, this report has been signed below by the following persons on behalf of the registrant and in the capacities and on the dates indicated.
| VANGUARD EXPLORER FUND |
| |
BY: | /s/ F. WILLIAM MCNABB III* |
| F. WILLIAM MCNABB III |
| CHIEF EXECUTIVE OFFICER |
Date: December 16, 2008
| VANGUARD EXPLORER FUND |
| |
BY: | /s/ THOMAS J. HIGGINS* |
| THOMAS J. HIGGINS |
| CHIEF FINANCIAL OFFICER |
Date: December 16, 2008
* By: /s/ Heidi Stam
Heidi Stam, pursuant to a Power of Attorney filed on January 18, 2008, see file Number 2-29601, Incorporated by Reference; and pursuant to a Power of Attorney filed on September 26, 2008, see File Number 2-47371, Incorporated by Reference.