UNITED STATES
SECURITIES AND EXCHANGE COMMISSION
Washington, D.C. 20549
FORM N-CSR
CERTIFIED SHAREHOLDER REPORT
OF
REGISTERED MANAGEMENT INVESTMENT COMPANIES
| | |
| Investment Company Act file number: 811-1530 |
|
| Name of Registrant: | Vanguard Explorer Fund |
| |
| Address of Registrant: | P.O. Box 2600 |
| | Valley Forge, PA 19482 |
| |
| Name and address of agent for service: | Heidi Stam, Esquire |
| | P.O. Box 876 |
| | Valley Forge, PA 19482 |
| |
| Registrant’s telephone number, including area code: (610) 669-1000 |
|
| Date of fiscal year end: October 31 | |
| |
| Date of reporting period: November 1, 2010 – October 31, 2011 |
|
| Item 1: Reports to Shareholders | |

Annual Report | October 31, 2011
Vanguard ExplorerTM Fund
> For the fiscal year ended October 31, 2011, Vanguard Explorer Fund returned
nearly 11%, exceeding the average return of peer funds but lagging the result of
its benchmark index.
> The advisors’ stock choices in the information technology and health care
sectors were the biggest contributors to performance.
> For the ten years ended October 31, the fund’s annualized return was
significantly ahead of its peer group average and in line with that of its index.
| |
| Contents | |
| Your Fund’s Total Returns. | 1 |
| Chairman’s Letter. | 2 |
| Advisors’ Report. | 7 |
| Fund Profile. | 12 |
| Performance Summary. | 13 |
| Financial Statements. | 15 |
| Your Fund’s After-Tax Returns. | 29 |
| About Your Fund’s Expenses. | 30 |
| Glossary. | 32 |
Please note: The opinions expressed in this report are just that—informed opinions. They should not be considered promises or advice.
Also, please keep in mind that the information and opinions cover the period through the date on the front of this report. Of course, the
risks of investing in your fund are spelled out in the prospectus.
See the Glossary for definitions of investment terms used in this report.
About the cover: Vanguard was named for the HMS Vanguard, flagship of British Admiral Horatio Nelson. A ship—whose
performance and safety depend on the work of all hands—has served as a fitting metaphor for the Vanguard crew as we
strive to help clients reach their financial goals.
Your Fund’s Total Returns
| |
| Fiscal Year Ended October 31, 2011 | |
| |
| | Total |
| | Returns |
| Vanguard Explorer Fund | |
| Investor Shares | 10.76% |
| Admiral™ Shares | 10.94 |
| Russell 2500 Growth Index | 11.91 |
| Small-Cap Growth Funds Average | 8.81 |
| Small-Cap Growth Funds Average: Derived from data provided by Lipper Inc. |
| Admiral Shares carry lower expenses and are available to investors who meet certain account-balance requirements. |
Your Fund’s Performance at a Glance
October 31, 2010 , Through October 31, 2011
| | | | |
| | | | Distributions Per Share |
| | Starting | Ending | Income | Capital |
| | Share Price | Share Price | Dividends | Gains |
| Vanguard Explorer Fund | | | | |
| Investor Shares | $66.02 | $73.02 | $0.106 | $0.000 |
| Admiral Shares | 61.50 | 68.04 | 0.189 | 0.000 |
1

Chairman’s Letter
Dear Shareholder,
Vanguard Explorer Fund recorded solid double-digit gains for the third straight year, although the pace of its advance slowed in the face of concerns about the economic outlook both nationally and internationally.
For the 12 months ended October 31, 2011, the fund returned 10.76% for Investor Shares and 10.94% for Admiral Shares. This result trailed that of the benchmark Russell 2500 Growth Index, which notched a gain of 11.91%, but exceeded the average return of small-capitalization growth funds.
After rallying in the first half of the year, the fund gave up some ground in the second half amid concerns about stubbornly high U.S. unemployment and the European debt crisis. Health care and information technology stocks were primary drivers of the fund’s performance. Stock choices within the consumer discretionary sector restrained results.
Note: If you own shares of the Explorer Fund in a taxable account, you may wish to review information about the fund’s after-tax returns later in this report.
A positive finish to an anxious 12 months
U.S. stock indexes ended the 12 months with solid returns, though the gains were shadowed by anxiety in a volatile period. This turbulence was so pronounced, in fact, that a one-month change in the start date would have yielded a very different
2
perspective on performance. For the 12 months through October 31, the broad U.S. stock market returned 7.67%. For the 12 months ended September 30, however, the return was a mere 0.31%.
Volatility has been a theme in international markets, too. International stock markets returned a combined –4.66% as stock prices retreated in Europe. Prices also fell in the Pacific region’s developed economies and emerging markets, where growth has moderated.
Unsteady yields reflected fast-changing sentiment
Taxable bonds produced strong returns and municipal bonds solid but unspectacular results, though as in the stock market, investor sentiment was
volatile. The yield of the 10-year U.S. Treasury note, a benchmark for longer-term interest rates, began the 12 months at 2.61%, drifted higher as the economic expansion seemed to gather steam, then fluttered lower to close the period at 2.17%. The decline in Treasury yields (and rise in prices) was driven by Europe’s sovereign debt dramas, underwhelming economic reports, and a flight to safety that was prompted, paradoxically, by a rating agency’s decision to downgrade the U.S. government debt. Vanguard’s confidence in the full faith and credit of the U.S. Treasury remains unshaken.
Taxable investment-grade bonds returned 5.00% for the full 12 months. It’s important to note, of course, that as yields decline, the opportunity for similarly
| | | |
| Market Barometer | | | |
| |
| | Average Annual Total Returns |
| | Periods Ended October 31, 2011 |
| | One | Three | Five |
| | Year | Years | Years |
| Stocks | | | |
| Russell 1000 Index (Large-caps) | 8.01% | 12.22% | 0.54% |
| Russell 2000 Index (Small-caps) | 6.71 | 12.87 | 0.68 |
| Dow Jones U.S. Total Stock Market Index | 7.67 | 12.58 | 0.90 |
| MSCI All Country World Index ex USA (International) | -4.66 | 12.92 | -0.37 |
| |
| Bonds | | | |
| Barclays Capital U.S. Aggregate Bond Index (Broad | | | |
| taxable market) | 5.00% | 8.87% | 6.41% |
| Barclays Capital Municipal Bond Index (Broad | | | |
| tax-exempt market) | 3.78 | 8.31 | 4.80 |
| Citigroup Three-Month U.S. Treasury Bill Index | 0.10 | 0.15 | 1.53 |
| |
| CPI | | | |
| Consumer Price Index | 3.53% | 1.49% | 2.33% |
3
strong returns diminishes. The broad municipal market returned 3.78%. The returns on money market instruments hovered near 0%, consistent with the Federal Reserve Board’s target for short-term interest rates.
Progress slows a bit for small-cap growth stocks
Following the brutal downturn of 2008, small-cap growth stocks rebounded strongly in a rally that extended well into 2011. Investors were optimistic that small companies in markets with healthy growth potential could reap big profits as the business cycle improved.
That optimism faltered in the late summer, weighed down by weakness in the U.S. economy and intensifying concerns about
Europe. Still, for the year, small-cap growth stocks significantly outpaced the broader market as measured by the Dow Jones U.S. Total Stock Market Index. In this environment, Vanguard Explorer Fund was able to extend its streak of double-digit fiscal-year returns that dates to 2009.
Information technology, a traditional focus of growth portfolios, was a strong point for the fund. Especially in the first half of the year, investors expected a pickup in business investment and consumer spending to lift a broad range of tech companies, including semiconductor makers and software firms. The advisors’ choices within the sector were on target, leading the fund’s stocks to outperform those in the benchmark index.
| | | |
| Expense Ratios | | | |
| Your Fund Compared With Its Peer Group | | | |
| | Investor | Admiral | Peer Group |
| | Shares | Shares | Average |
| Explorer Fund | 0.49% | 0.32% | 1.61% |
The fund expense ratios shown are from the prospectus dated February 23, 2011, and represent estimated costs for the current fiscal year.
For the fiscal year ended October 31, 2011, the fund’s expense ratios were 0.50% for Investor Shares and 0.34% for Admiral Shares. The
peer-group expense ratio is derived from data provided by Lipper Inc. and captures information through year-end 2010.
Peer group: Small-Cap Growth Funds.
4
The same was true in the health care sector, where the fund’s stocks also posted a better showing than those in the benchmark, with gains in biotechnology and managed care. Health care, in general, benefited from the perception that demand for medical services is relatively insulated from changes in the broader economy.
Relative to the benchmark, the fund lost ground in the consumer discretionary, consumer staples, and industrials sectors, where the advisors’ selections lagged their counterparts in the index.
Fund performance was solid over the past decade
For the ten years ended October 31, 2011, Explorer Fund’s Investor Shares posted an average annual return of 6.51%, signifi-
cantly outperforming the 4.72% average return of competing small-cap growth funds though a bit behind the benchmark index’s annualized return of 6.85%.
This solid record is especially noteworthy when you consider that the past decade was punctuated by both the aftermath of the technology bubble’s bursting and the 2008 financial crisis. The fund’s long-term performance is a tribute to its low costs and the skill of its multiple advisors in navigating stormy waters.
Because Explorer focuses on smaller companies, its returns can be more volatile than those of funds investing in larger-cap stocks. However, the fund’s use of multiple advisors with diverse strategies, as well as its broad exposure to small-cap growth
| |
| Total Returns | |
| Ten Years Ended October 31, 2011 | |
| | Average |
| | Annual Return |
| Explorer Fund Investor Shares | 6.51% |
| Russell 2500 Growth Index | 6.85 |
| Small-Cap Growth Funds Average | 4.72 |
| Small-Cap Growth Funds Average: Derived from data provided by Lipper Inc. |
The figures shown represent past performance, which is not a guarantee of future results. (Current performance may be lower or higher than the performance data cited. For performance data current to the most recent month-end, visit our website at vanguard.com/performance.) Note, too, that both investment returns and principal value can fluctuate widely, so an investor’s shares, when sold, could be worth more or less than their original cost.
5
stocks, can help mitigate the risk that may come from investing in this segment of the market. Over time, we would expect the fund’s talented advisors to deliver better returns than those of the benchmark index.
Remember to focus on the power of diversification
The past year turned out to be another one of great volatility; it felt as if some of the anxiety of 2008 had returned. We understand that it’s difficult not to be discouraged when markets are shaky. But we would emphasize—as we always have—the importance of maintaining a prudent asset allocation of broadly diversified, low-cost investments regardless of the market environment.
In addition to maintaining appropriate diversification, it’s wise not to overreact to day-to-day, much less minute-to-minute, headlines. We’re convinced that investors stand a better chance of reaching their financial goals by keeping a long-term perspective.
A well-balanced portfolio can help cushion some of the market’s downward moves while letting you participate in its long-term potential for growth. With its low costs and broad diversification among small-cap growth stocks, Vanguard Explorer Fund can play an important role in such an investment plan.
As always, thank you for entrusting your assets to Vanguard.
Sincerely,

F. William McNabb III
Chairman and Chief Executive Officer
November 11, 2011
6
Advisors’ Report
For the 12 months ended October 31, 2011, Vanguard Explorer Fund returned almost 11% for both share classes. Your fund is managed by six independent advisors, a strategy that enhances the fund’s diversification by providing exposure to distinct, yet complementary, investment approaches. It’s not uncommon for different advisors to have different views about individual securities or the broader investment environment.
The table following this report lists the advisors, the amount and percentage of fund assets each manages, and brief descriptions of their investment strategies. The advisors have provided the following assessment of the investment environment during the past 12 months and the notable successes and shortfalls in their portfolios. These comments were prepared on November 11, 2011.
Wellington Management Company, llp
Portfolio Manager:
Kenneth L. Abrams, Senior Vice President
and Equity Portfolio Manager
Equities posted mixed results for the period, advancing in the United States but declining on the whole in other parts of the developed world. For the fiscal year, capital markets have been driven largely by top-down macroeconomic factors. In such an environment, the U.S. small-capitalization market does not appear to be in control of its destiny. Regardless, we remain true to our process, using an opportunistic and flexible investment approach to build the portfolio from the bottom up, investing in small, high-quality companies.
Successes: Stock selection was particularly strong within the health care sector. Rising holdings such as Elan, Regeneron, and Exelixis added to the portfolio’s returns both on an absolute basis and in relation to the benchmark. Our selections among information technology, telecommunications services, and energy stocks also contributed.
Shortfalls: Allocation across sectors, a residual effect of our stock-by-stock decision-making process, hindered results. Security selection suffered within the consumer, industrials, and materials sectors, outweighing more favorable stock picks in other sectors. DreamWorks Animation was our biggest detractor. Retailer Talbots, which we eliminated during the period, also underperformed. Our new position in materials holding Ferro declined as well.
Granahan Investment Management, Inc.
Portfolio Manager:
Jack Granahan, CFA, Managing Partner
The first half of fiscal year 2011 was positive for small-cap growth stocks as the Fed’s quantitative easing kicked stocks into high gear. In the second half, however, the end of the quantitative easing program, concerns over a fading domestic recovery, and continued fears of a sovereign debt default in Greece drove the market down.
We have seen earnings growth moderate from the dazzling rebound growth rates of 2010, and our stocks have performed relatively well in this environment. Trailing
7
12-month earnings growth rates for small-caps are still high at 27%, especially when compared with the 18% year-over-year growth of large companies tracked by the S&P 500 Index. Valuations for our companies have moderated recently and are lower than those of the Russell 2500 Growth Index. U.S. corporations, particularly smaller companies, have strong balance sheets, revenue growth, and margins that are expanding.
Successes: Health care, materials, and technology were our strongest sectors. Biopharmaceutical companies Regeneron (products for inflammatory diseases) and Cubist (anti-infective products for acute care) led the health care outperformance. The materials and technology sectors were driven by strong merger-and-acquisition activity. We had 17 buyouts this past year, including Fronteer Gold in materials and NetLogic Microsystems (knowledge-based processors), Verigy, and Varian Semiconductor Equipment Associates (both semiconductor equipment companies) in technology.
Shortfalls: Although our best-performing stock, PriceSmart (warehouse clubs in Central America), was in the consumer sector, our performance in both discretionary and staples lagged the index. In consumer discretionary, Constant Contact and Vistaprint (micro- and small-business marketing companies) announced investment plans and a commensurate sacrifice of near-term earnings growth. In consumer staples, earnings growth for Ruddick, a grocery store operator, will be
limited by food cost inflation. We have eliminated these names. Clearwire, in utilities, has been mired in negotiations with partners. The fundamentals of the 4G network underlying its business have improved over the last year, and we are holding the stock.
Kalmar Investment Advisers
Portfolio Manager:
Ford B. Draper, Jr., President and
Chief Investment Officer
The deepening Eurozone sovereign debt crisis is dominating world equity markets, producing extreme volatility and pushing Europe into recession. Meanwhile, China’s growth is slowing and the United States is struggling to move ahead, with encouraging recent signs. This level of turbulence makes both the economic and market outlook abnormally uncertain.
As we see it, all this reinforces the importance of owning stocks of high-quality, well-managed growth companies that possess the ability to gain competitive advantages during tough times and thus emerge stronger when the outlook improves. Moreover, given the market’s behavior, the stocks of such companies seem very cheap in a longer-term context and therefore appear to offer wonderful opportunities.
Successes: Our more notable winners included Alliance Data Systems, Herbalife, Ariba, Petrohawk Energy, Brigham Exploration, Gentex, and specialty retailer Tractor Supply.
8
Shortfalls: Our disappointments included Alpha Natural Resources, DeVry, Hospira, McDermott International, and Navistar.
Century Capital Management, LLC
Portfolio Manager:
Alexander L. Thorndike, Chief Investment
Officer and Managing Partner
The U.S. economic recovery is slowing, but we are not expecting a recession yet. The markets appear to be signaling an expectation that current trends will continue for the foreseeable future. With Europe likely heading into a recession, Asia’s economies slowing, and foreign exchange remaining volatile, we are more interested in domestic-oriented businesses.
On the positive side, valuations have dropped nearly to the levels we saw in late 2008 and early 2009. Generally, companies appear to be in great fiscal shape. Pricing power is a major focus, because we believe that the highest-quality companies are likely to improve their market share, reinvest in their business, and improve their profitability and competitive position during these challenging conditions.
Successes: Health care was our best-performing sector for the period, led by HealthSpring and Alexion Pharmaceuticals. The industrials sector also outperformed, aided by Ladish Co. and Chart Industries.
Shortfalls: Energy was the weakest sector, with Pioneer Drilling Co. and Carrizo Oil & Gas among the top detractors.
Financials also lagged, as Och-Ziff Capital Management Group and HFF underperformed.
Chartwell Investment Partners, L.P.
Portfolio Managers:
Edward N. Antoian, CFA, CPA,
Managing Partner
John A. Heffern, Managing Partner and
Senior Portfolio Manager
The investment environment remains volatile as global financial markets wrestle with government deficits that are forcing austerity measures, decelerating corporate earnings, and the absence of international consensus over the way forward. Against this backdrop, our portfolio decisions steadfastly reflect our bias toward quality, leadership, defensible margins, and a pattern of successful execution based on growth-oriented business models.
Successes: Ulta Salon Cosmetics & Fragrance was our top-performing holding, driven by superior earnings results. Also contributing were investments in two acquired companies: HealthSpring, a managed care provider, and NetLogic Microsystems, a semiconductor manufacturer.
Shortfalls: Our investment in Skilled Healthcare Group was adversely affected by a larger-than-expected Medicare rate cut, while Kforce, a temporary staffing company, was pressured by volume and margin uncertainty arising from a weak midyear earnings report.
9
Vanguard Quantitative Equity Group
Portfolio Manager:
James D. Troyer, CFA, Principal
What a contrast between the first half of the fiscal year and the second. After a strong early rally, the fund declined sharply from May through September, only to rebound in October.
Driving the pullback and increasing overall market volatility were the continued worries of a stalling U.S. economy, a lack of improvement in the employment picture, and the unresolved European sovereign debt crisis. Most economists are not forecasting a U.S. recession, although many have reduced their growth estimates for the next year or two, and this has cast a cloud of uncertainty over the near-term prospects for equities.
Small-cap growth stocks, the focus of your investment in the Explorer Fund, outperformed the broad market, led by the returns of consumer-oriented and energy firms. Telecommunications and financial company results lagged.
Successes: Our stock selections were strongest in the financial, technology, and consumer discretionary categories. In financials, World Acceptance Corp. and Credit Acceptance Corp. contributed most to our sector outperformance. Atmel Corp., Cardtronics, Manhattan Associates, and TIBCO Software were the largest contributors to our relative returns in technology, while Domino’s Pizza, Fossil, Polaris Industries, and Tempur-Pedic led in consumer discretionary.
Shortfalls: Our stock picks were most disappointing in consumer staples. The bulk of our underperformance in this sector resulted from underweighting Green Mountain Coffee Roasters, which rose more than 150% for the period.
10
Vanguard Explorer Fund Investment Advisors
| | | |
| | Fund Assets Managed | |
| Investment Advisor | % | $ Million | Investment Strategy |
| Wellington Management | 28 | 2,523 | Conducts research and analysis of individual |
| Company, LLP | | | companies to select stocks believed to have |
| | | | exceptional growth potential relative to their market |
| | | | valuations. Each stock is considered individually before |
| | | | purchase, and company developments are continually |
| | | | monitored for comparison with expectations for |
| | | | growth. |
| Granahan Investment | 25 | 2,263 | Bases its investment process on the beliefs that |
| Management, Inc. | | | earnings drive stock prices and that small, dynamic |
| | | | companies with exceptional growth prospects have the |
| | | | greatest long-term potential. A bottom-up, fundamental |
| | | | approach places companies in one of three life-cycle |
| | | | categories: pioneer, core growth, and special situation. |
| | | | In each, the process looks for companies with strong |
| | | | earnings growth potential and leadership in their |
| | | | markets. |
| Kalmar Investment Advisers | 23 | 2,082 | Employs a “growth with value” strategy using creative, |
| | | | bottom-up research to uncover vigorously growing, |
| | | | high-quality businesses whose stocks can also be |
| | | | bought inefficiently valued. The strategy has a dual |
| | | | objective of strong returns with lower risk. |
| Century Capital Management, | 10 | 897 | Employs a fundamental, bottom-up approach that |
| LLC | | | attempts to identify reasonably priced companies that |
| | | | will grow faster than the overall market. Companies |
| | | | also must have a superior return on equity, high |
| | | | recurring revenues, and improving margins. |
| Chartwell Investment Partners, | 9 | 808 | Uses a bottom-up, fundamental, research-driven |
| L.P. | | | stock-selection strategy focusing on companies with |
| | | | sustainable growth, strong management teams, |
| | | | competitive positions, and outstanding product and |
| | | | service offerings. These companies should continually |
| | | | demonstrate growth in earnings per share. |
| Vanguard Quantitative Equity | 4 | 362 | Employs a quantitative fundamental management |
| Group | | | approach, using models that assess valuation, growth |
| | | | prospects, management decisions, market sentiment, |
| | | | and earnings quality of companies as compared with |
| | | | their peers. |
| Cash Investments | 1 | 218 | These short-term reserves are invested by Vanguard in |
| | | | equity index products to simulate investment in stocks. |
| | | | Each advisor also may maintain a modest cash |
| | | | position. |
11
Explorer Fund
Fund Profile
As of October 31, 2011
| | |
| Share-Class Characteristics | |
| | Investor | Admiral |
| | Shares | Shares |
| Ticker Symbol | VEXPX | VEXRX |
| Expense Ratio1 | 0.49% | 0.32% |
| 30-Day SEC Yield | 0.05% | 0.22% |
| | | |
| Portfolio Characteristics | | |
| | | Russell | DJ |
| | | 2500 | U.S. Total |
| | | Growth | Market |
| | Fund | Index | Index |
| Number of Stocks | 585 | 1,434 | 3,749 |
| Median Market Cap | $2.2B | $2.6B | $30.4B |
| Price/Earnings Ratio | 22.4x | 23.7x | 14.9x |
| Price/Book Ratio | 2.5x | 3.3x | 2.1x |
| Return on Equity | 10.9% | 14.2% | 19.1% |
| Earnings Growth Rate 11.0% | 10.3% | 7.2% |
| Dividend Yield | 0.5% | 0.8% | 2.0% |
| Foreign Holdings | 5.1% | 0.0% | 0.0% |
| Turnover Rate | 89% | — | — |
| Short-Term Reserves | 1.6% | — | — |
| | | |
| Sector Diversification (% of equity exposure) |
| | | Russell | DJ |
| | | 2500 | U.S. Total |
| | | Growth | Market |
| | Fund | Index | Index |
| Consumer | | | |
| Discretionary | 15.1% | 15.0% | 12.4% |
| Consumer Staples | 2.6 | 3.8 | 10.1 |
| Energy | 7.4 | 8.7 | 10.7 |
| Financials | 6.7 | 8.1 | 15.1 |
| Health Care | 18.6 | 15.9 | 11.1 |
| Industrials | 17.0 | 16.5 | 10.9 |
| Information | | | |
| Technology | 25.9 | 22.6 | 19.3 |
| Materials | 4.8 | 7.7 | 4.3 |
| Telecommunication | | | |
| Services | 1.5 | 1.3 | 2.6 |
| Utilities | 0.4 | 0.4 | 3.5 |
| | |
| Volatility Measures | | |
| | | DJ |
| | U.S. Total |
| | Russell 2500 | Market |
| | Growth Index | Index |
| R-Squared | 1.00 | 0.93 |
| Beta | 0.97 | 1.13 |
| These measures show the degree and timing of the fund’s fluctuations compared with the indexes over 36 months. |
| | |
| Ten Largest Holdings (% of total net assets) |
| Alliance Data Systems | Data Processing & | |
| Corp. | Outsourced | |
| | Services | 1.2% |
| VeriFone Systems Inc. | Data Processing & | |
| | Outsourced | |
| | Services | 0.9 |
| Cooper Cos Inc. | Health Care | |
| | Supplies | 0.9 |
| Sapient Corp. | IT Consulting & | |
| | Other Services | 0.8 |
| Bruker Corp. | Life Sciences Tools | |
| | & Services | 0.8 |
| Ariba Inc. | Systems Software | 0.8 |
| TiVo Inc. | Application | |
| | Software | 0.7 |
| Genesee & Wyoming | | |
| Inc. Class A | Railroads | 0.7 |
| Microsemi Corp. | Semiconductors | 0.7 |
| Life Time Fitness Inc. | Leisure Facilities | 0.6 |
| Top Ten | | 8.1% |
| The holdings listed exclude any temporary cash investments and equity index products. |
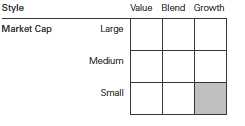
Investment Focus
1 The expense ratios shown are from the prospectus dated February 23, 2011, and represent estimated costs for the current fiscal year. For
the fiscal year ended October 31, 2011, the expense ratios were 0.50% for Investor Shares and 0.34% for Admiral Shares.
12
Explorer Fund
Performance Summary
All of the returns in this report represent past performance, which is not a guarantee of future
results that may be achieved by the fund. (Current performance may be lower or higher than
the performance data cited. For performance data current to the most recent month-end, visit
our website at vanguard.com/performance.) Note, too, that both investment returns and principal
value can fluctuate widely, so an investor’s shares, when sold, could be worth more or less than
their original cost. The returns shown do not reflect taxes that a shareholder would pay on fund
distributions or on the sale of fund shares.
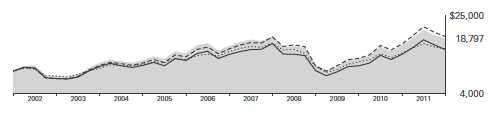
Cumulative Performance: October 31, 2001, Through October 31, 2011
Initial Investment of $10,000
| | | | | |
| | | Average Annual Total Returns | |
| | | Periods Ended October 31, 2011 | |
| | | | | | Final Value |
| | | One | Five | Ten | of a $10,000 |
| | | Year | Years | Years | Investment |
| | Explorer Fund Investor Shares | 10.76% | 2.24% | 6.51% | $18,797 |
| •••••••• | Dow Jones U.S. Total Stock Market | | | | |
| | Index | 7.67 | 0.90 | 4.82 | 16,011 |
| – – – – | Russell 2500 Growth Index | 11.91 | 3.88 | 6.85 | 19,399 |
| | Small-Cap Growth Funds Average | 8.81 | 1.76 | 4.72 | 15,854 |
| Small-Cap Growth Funds Average: Derived from data provided by Lipper Inc. |
| | | | |
| | | | Since | Final Value |
| | One | Five | Inception | of a $50,000 |
| | Year | Years | (11/12/2001) | Investment |
| Explorer Fund Admiral Shares | 10.94% | 2.42% | 6.31% | $92,031 |
| Dow Jones U.S. Total Stock Market | | | | |
| Index | 7.67 | 0.90 | 4.31 | 76,178 |
| Russell 2500 Growth Index | 11.91 | 3.88 | 6.48 | 93,466 |
| "Since Inception" performance is calculated from the Admiral Shares’ inception date for both the fund and its comparative standards. |
See Financial Highlights for dividend and capital gains information.
13
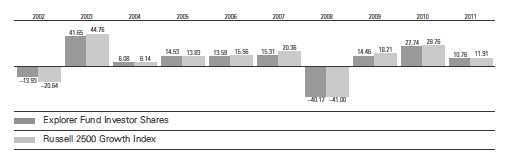
Explorer Fund
Fiscal-Year Total Returns (%): October 31, 2001, Through October 31, 2011
Average Annual Total Returns: Periods Ended September 30, 2011
This table presents returns through the latest calendar quarter—rather than through the end of the fiscal period.
Securities and Exchange Commission rules require that we provide this information.
| | | | |
| | Inception | One | Five | Ten |
| | Date | Year | Years | Years |
| Investor Shares | 12/11/1967 | -0.53% | 0.16% | 5.74% |
| Admiral Shares | 11/12/2001 | -0.36 | 0.34 | 4.811 |
| 1 Return since inception. |
Explorer Fund
Financial Statements
Statement of Net Assets—Investments Summary
As of October 31, 2011
This Statement summarizes the fund’s holdings by asset type. Details are reported for each of the fund’s 50 largest individual holdings and for investments that, in total for any issuer, represent more than 1% of the fund’s net assets. The total value of smaller holdings is reported as a single amount within each category.
The fund reports a complete list of its holdings in regulatory filings four times in each fiscal year, at the quarter-ends. For the second and fourth fiscal quarters, the complete listing of the fund’s holdings is available electronically on vanguard.com and on the Securities and Exchange Commission’s website (sec.gov), or you can have it mailed to you without charge by calling 800-662-7447. For the first and third fiscal quarters, the fund files the lists with the SEC on Form N-Q. Shareholders can look up the fund’s Forms N-Q on the SEC’s website. Forms N-Q may also be reviewed and copied at the SEC’s Public Reference Room (see the back cover of this report for further information).
| | | | |
| | | | Market | Percentage |
| | | | Value | of Net |
| | | Shares | ($000) | Assets |
| Common Stocks | | | |
| Consumer Discretionary | | | |
| * | Life Time Fitness Inc. | 1,346,145 | 58,059 | 0.6% |
| * | Cheesecake Factory Inc. | 1,715,651 | 48,021 | 0.5% |
| | Gentex Corp. | 1,423,455 | 42,875 | 0.5% |
| * | LKQ Corp. | 1,455,520 | 42,472 | 0.5% |
| * | CarMax Inc. | 1,406,070 | 42,266 | 0.5% |
| | Express Inc. | 1,705,825 | 38,535 | 0.4% |
| *,^ | Liz Claiborne Inc. | 4,715,920 | 37,775 | 0.4% |
| | Aaron’s Inc. | 1,354,290 | 36,241 | 0.4% |
| | Consumer Discretionary—Other † | | 982,986 | 10.7% |
| | | | 1,329,230 | 14.5% |
| Consumer Staples | | | |
| * | Smithfield Foods Inc. | 1,693,950 | 38,724 | 0.4% |
| | Pricesmart Inc. | 464,890 | 35,350 | 0.4% |
| | Consumer Staples—Other † | | 152,271 | 1.7% |
| | | | 226,345 | 2.5% |
| Energy | | | |
| * | Superior Energy Services Inc. | 1,704,480 | 47,930 | 0.6% |
| * | Key Energy Services Inc. | 2,941,775 | 38,037 | 0.4% |
| | Core Laboratories NV | 345,491 | 37,403 | 0.4% |
| * | Carrizo Oil & Gas Inc. | 1,315,230 | 35,774 | 0.4% |
| | Energy—Other † | | 494,945 | 5.4% |
| | | | 654,089 | 7.2% |
| Exchange-Traded Funds | | | |
| 1 | Vanguard Small-Cap ETF | 865,083 | 61,205 | 0.7% |
| ^,1 | Vanguard Small-Cap Growth ETF | 713,200 | 55,444 | 0.6% |
| ^ | iShares Russell 2000 Index Fund | 508,160 | 37,588 | 0.4% |
| | | | 154,237 | 1.7% |
15
Explorer Fund
| | | | |
| | | | Market | Percentage |
| | | | Value | of Net |
| | | Shares | ($000) | Assets |
| Financials | | | |
| | Cash America International Inc. | 826,248 | 45,237 | 0.5% |
| *,2 | HFF Inc. Class A | 3,152,558 | 34,678 | 0.4% |
| | Financials—Other † | | 479,673 | 5.2% |
| | | | 559,588 | 6.1% |
| Health Care | | | |
| | Cooper Cos. Inc. | 1,131,888 | 78,440 | 0.9% |
| * | Bruker Corp. | 5,085,100 | 73,378 | 0.8% |
| * | Coventry Health Care Inc. | 1,791,685 | 56,994 | 0.6% |
| * | Alkermes plc | 3,176,235 | 55,552 | 0.6% |
| * | Health Management Associates Inc. Class A | 6,252,187 | 54,769 | 0.6% |
| * | Elan Corp. plc ADR | 4,506,888 | 54,038 | 0.6% |
| * | Salix Pharmaceuticals Ltd. | 1,571,965 | 53,848 | 0.6% |
| * | Healthspring Inc. | 854,410 | 46,087 | 0.5% |
| | Universal Health Services Inc. Class B | 982,600 | 39,275 | 0.4% |
| * | Seattle Genetics Inc. | 1,637,664 | 36,029 | 0.4% |
| | Health Care—Other † | | 1,098,210 | 12.0% |
| | | | 1,646,620 | 18.0% |
| Industrials | | | |
| * | Genesee & Wyoming Inc. Class A | 1,109,985 | 65,722 | 0.7% |
| | Kennametal Inc. | 1,485,027 | 57,753 | 0.6% |
| * | IHS Inc. Class A | 576,140 | 48,390 | 0.5% |
| | Belden Inc. | 1,364,800 | 44,056 | 0.5% |
| | Triumph Group Inc. | 743,050 | 43,171 | 0.5% |
| | MSC Industrial Direct Co. Class A | 606,005 | 41,214 | 0.5% |
| * | BE Aerospace Inc. | 1,018,842 | 38,441 | 0.4% |
| | Chicago Bridge & Iron Co. NV | 1,046,761 | 38,290 | 0.4% |
| * | Corrections Corp. of America | 1,576,185 | 35,039 | 0.4% |
| | Industrials—Other † | | 1,082,442 | 11.8% |
| | | | 1,494,518 | 16.3% |
| Information Technology | | | |
| * | Alliance Data Systems Corp. | 1,028,170 | 105,326 | 1.1% |
| * | VeriFone Systems Inc. | 1,895,905 | 80,026 | 0.9% |
| | Sapient Corp. | 6,082,590 | 75,181 | 0.8% |
| * | Ariba Inc. | 2,314,947 | 73,338 | 0.8% |
| *,2 | TiVo Inc. | 6,112,920 | 66,203 | 0.7% |
| * | Microsemi Corp. | 3,363,335 | 62,087 | 0.7% |
| | MKS Instruments Inc. | 1,956,970 | 52,134 | 0.6% |
| * | Teradyne Inc. | 3,536,920 | 50,649 | 0.5% |
| * | RF Micro Devices Inc. | 6,106,515 | 44,822 | 0.5% |
| * | Rovi Corp. | 892,060 | 44,193 | 0.5% |
| * | MICROS Systems Inc. | 856,771 | 42,170 | 0.5% |
| * | Parametric Technology Corp. | 1,934,346 | 40,292 | 0.4% |
| | Syntel Inc. | 796,225 | 38,935 | 0.4% |
| | j2 Global Communications Inc. | 1,136,950 | 34,995 | 0.4% |
| * | IAC/InterActiveCorp | 854,675 | 34,896 | 0.4% |
| | Information Technology—Other † | | 1,453,726 | 15.9% |
| | | | 2,298,973 | 25.1% |
16
Explorer Fund
| | | | | |
| | | | | Market | Percentage |
| | | | | Value | of Net |
| | | | Shares | ($000) | Assets |
| Materials | | | | | |
| Silgan Holdings Inc. | | | 980,290 | 36,800 | 0.4% |
| Materials—Other † | | | | 384,773 | 4.2% |
| | | | | 421,573 | 4.6% |
| |
| Telecommunication Services † | | | | 132,128 | 1.5% |
| |
| Utilities † | | | | 29,095 | 0.3% |
| Total Common Stocks (Cost $7,639,361) | | | 8,946,396 | 97.8%3 |
| |
| | Coupon | | | | |
| Temporary Cash Investments | | | | | |
| Money Market Fund | | | | | |
| 4,5 Vanguard Market Liquidity Fund | 0.128% | | 268,647,027 | 268,647 | 2.9% |
| |
| | | | Face | | |
| | | Maturity | Amount | | |
| | | Date | ($000) | | |
| Repurchase Agreement | | | | | |
| Deutsche Bank Securities, Inc. | | | | | |
| (Dated 10/31/11, Repurchase | | | | | |
| Value $21,600,000, collateralized | | | | | |
| by Government National | | | | | |
| Mortgage Assn. | | | | | |
| 4.500%, 8/20/41) | 0.110% | 11/1/11 | 21,600 | 21,600 | 0.2% |
| |
| 6U.S. Government and Agency Obligations † | | | 15,597 | 0.2% |
| Total Temporary Cash Investments (Cost $305,846) | | | 305,844 | 3.3%3 |
| Total Investments (Cost $7,945,207) | | | | 9,252,240 | 101.1% |
| Other Assets and Liabilities | | | | | |
| Other Assets | | | | 147,483 | 1.6% |
| Liabilities5 | | | | (247,218) | (2.7%) |
| | | | | (99,735) | (1.1%) |
| Net Assets | | | | 9,152,505 | 100.0% |
17
Explorer Fund
| |
| At October 31, 2011, net assets consisted of: | |
| | Amount |
| | ($000) |
| Paid-in Capital | 8,056,173 |
| Overdistributed Net Investment Income | (3,542) |
| Accumulated Net Realized Losses | (206,462) |
| Unrealized Appreciation (Depreciation) | |
| Investment Securities | 1,307,033 |
| Futures Contracts | (718) |
| Foreign Currencies | 21 |
| Net Assets | 9,152,505 |
| |
| |
| Investor Shares—Net Assets | |
| Applicable to 80,305,460 outstanding $.001 par value shares of | |
| beneficial interest (unlimited authorization) | 5,864,187 |
| Net Asset Value Per Share—Investor Shares | $73.02 |
| |
| |
| Admiral Shares—Net Assets | |
| Applicable to 48,329,276 outstanding $.001 par value shares of | |
| beneficial interest (unlimited authorization) | 3,288,318 |
| Net Asset Value Per Share—Admiral Shares | $68.04 |
See Note A in Notes to Financial Statements.
* Non-income-producing security.
^ Part of security position is on loan to broker-dealers. The total value of securities on loan is $58,720,000.
† Represents the aggregate value, by category, of securities that are not among the 50 largest holdings and, in total for any issuer, represent
1% or less of net assets.
1 Considered an affiliated company of the fund as the issuer is another member of The Vanguard Group.
2 Considered an affiliated company of the fund as the fund owns more than 5% of the outstanding voting securities of such company.
3 The fund invests a portion of its cash reserves in equity markets through the use of index futures contracts. After giving effect to futures
investments, the fund’s effective common stock and temporary cash investment positions represent 98.8% and 2.3%, respectively, of
net assets.
4 Affiliated money market fund available only to Vanguard funds and certain trusts and accounts managed by Vanguard. Rate shown is
the 7-day yield.
5 Includes $61,897,000 of collateral received for securities on loan.
6 Securities with a value of $12,598,000 have been segregated as initial margin for open futures contracts.
ADR—American Depositary Receipt.
See accompanying Notes, which are an integral part of the Financial Statements.
18
Explorer Fund
Statement of Operations
| |
| | Year Ended |
| | October 31, 2011 |
| | ($000) |
| Investment Income | |
| Income | |
| Dividends1,2 | 57,123 |
| Interest2 | 601 |
| Security Lending | 2,787 |
| Total Income | 60,511 |
| Expenses | |
| Investment Advisory Fees—Note B | |
| Basic Fee | 20,200 |
| Performance Adjustment | (56) |
| The Vanguard Group—Note C | |
| Management and Administrative—Investor Shares | 17,329 |
| Management and Administrative—Admiral Shares | 3,620 |
| Marketing and Distribution—Investor Shares | 1,438 |
| Marketing and Distribution—Admiral Shares | 756 |
| Custodian Fees | 202 |
| Auditing Fees | 38 |
| Shareholders’ Reports—Investor Shares | 151 |
| Shareholders’ Reports—Admiral Shares | 29 |
| Trustees’ Fees and Expenses | 23 |
| Total Expenses | 43,730 |
| Expenses Paid Indirectly | (405) |
| Net Expenses | 43,325 |
| Net Investment Income | 17,186 |
| Realized Net Gain (Loss) | |
| Investment Securities Sold2 | 1,387,581 |
| Futures Contracts | 18,176 |
| Foreign Currencies | (112) |
| Realized Net Gain (Loss) | 1,405,645 |
| Change in Unrealized Appreciation (Depreciation) | |
| Investment Securities | (406,004) |
| Futures Contracts | (5,747) |
| Foreign Currencies | 21 |
| Change in Unrealized Appreciation (Depreciation) | (411,730) |
| Net Increase (Decrease) in Net Assets Resulting from Operations | 1,011,101 |
| 1 Dividends are net of foreign withholding taxes of $217,000. |
| 2 Dividend income, interest income, and realized net gain (loss) from affiliated companies of the fund were $2,079,000, |
| $537,000, and ($11,473,000), respectively. |
See accompanying Notes, which are an integral part of the Financial Statements.
19
Explorer Fund
Statement of Changes in Net Assets
| | |
| | Year Ended October 31, |
| | 2011 | 2010 |
| | ($000) | ($000) |
| Increase (Decrease) in Net Assets | | |
| Operations | | |
| Net Investment Income | 17,186 | 21,883 |
| Realized Net Gain (Loss) | 1,405,645 | 666,088 |
| Change in Unrealized Appreciation (Depreciation) | (411,730) | 1,406,632 |
| Net Increase (Decrease) in Net Assets Resulting from Operations | 1,011,101 | 2,094,603 |
| Distributions | | |
| Net Investment Income | | |
| Investor Shares | (9,771) | (10,678) |
| Admiral Shares | (9,545) | (7,955) |
| Realized Capital Gain | | |
| Investor Shares | — | — |
| Admiral Shares | — | — |
| Total Distributions | (19,316) | (18,633) |
| Capital Share Transactions | | |
| Investor Shares | (1,113,873) | (865,430) |
| Admiral Shares | 121,274 | 13,342 |
| Net Increase (Decrease) from Capital Share Transactions | (992,599) | (852,088) |
| Total Increase (Decrease) | (814) | 1,223,882 |
| Net Assets | | |
| Beginning of Period | 9,153,319 | 7,929,437 |
| End of Period1 | 9,152,505 | 9,153,319 |
| 1 Net Assets—End of Period includes undistributed (overdistributed) net investment income of ($3,542,000) and ($1,300,000). |
See accompanying Notes, which are an integral part of the Financial Statements.
20
Explorer Fund
Financial Highlights
| | | | | |
| Investor Shares | | | | | |
| |
| For a Share Outstanding | Year Ended October 31, |
| Throughout Each Period | 2011 | 2010 | 2009 | 2008 | 2007 |
| Net Asset Value, Beginning of Period | $66.02 | $51.77 | $45.54 | $83.93 | $80.26 |
| Investment Operations | | | | | |
| Net Investment Income | . 077 | .109 | .178 | . 295 | . 362 |
| Net Realized and Unrealized Gain (Loss) | | | | | |
| on Investments | 7.029 | 14.239 | 6.334 | (31.589) | 11.052 |
| Total from Investment Operations | 7.106 | 14.348 | 6.512 | (31.294) | 11.414 |
| Distributions | | | | | |
| Dividends from Net Investment Income | (.106) | (. 098) | (. 282) | (. 310) | (. 320) |
| Distributions from Realized Capital Gains | — | — | — | (6.786) | (7.424) |
| Total Distributions | (.106) | (. 098) | (. 282) | (7.096) | (7.744) |
| Net Asset Value, End of Period | $73.02 | $66.02 | $51.77 | $45.54 | $83.93 |
| |
| Total Return1 | 10.76% | 27.74% | 14.46% | -40.17% | 15.31% |
| |
| Ratios/Supplemental Data | | | | | |
| Net Assets, End of Period (Millions) | $5,864 | $6,290 | $5,677 | $5,026 | $8,937 |
| Ratio of Total Expenses to | | | | | |
| Average Net Assets2 | 0.50% | 0.49% | 0.54% | 0.44% | 0.41% |
| Ratio of Net Investment Income to | | | | | |
| Average Net Assets | 0.12% | 0.19% | 0.38% | 0.40% | 0.44% |
| Portfolio Turnover Rate | 89%3 | 82% | 95% | 112% | 90% |
| 1 Total returns do not include account service fees that may have applied in the periods shown. Fund prospectuses provide information about |
| any applicable account service fees. |
| 2 Includes performance-based investment advisory fee increases (decreases) of 0.00%, (0.01%), (0.01%), (0.02%) and (0.04%). |
| 3 Excludes the value of portfolio securities received or delivered as a result of in-kind purchases or redemptions of the fund’s capital shares. |
See accompanying Notes, which are an integral part of the Financial Statements.
21
Explorer Fund
Financial Highlights
| | | | | |
| Admiral Shares | | | | | |
| |
| For a Share Outstanding | Year Ended October 31, |
| Throughout Each Period | 2011 | 2010 | 2009 | 2008 | 2007 |
| Net Asset Value, Beginning of Period | $61.50 | $48.21 | $42.45 | $78.25 | $74.82 |
| Investment Operations | | | | | |
| Net Investment Income | .179 | . 206 | . 246 | . 385 | . 478 |
| Net Realized and Unrealized Gain (Loss) | | | | | |
| on Investments | 6.550 | 13.259 | 5.881 | (29.442) | 10.299 |
| Total from Investment Operations | 6.729 | 13.465 | 6.127 | (29.057) | 10.777 |
| Distributions | | | | | |
| Dividends from Net Investment Income | (.189) | (.175) | (. 367) | (. 427) | (. 437) |
| Distributions from Realized Capital Gains | — | — | — | (6.316) | (6.910) |
| Total Distributions | (.189) | (.175) | (. 367) | (6.743) | (7.347) |
| Net Asset Value, End of Period | $68.04 | $61.50 | $48.21 | $42.45 | $78.25 |
| |
| Total Return | 10.94% | 27.98% | 14.66% | -40.07% | 15.53% |
| |
| Ratios/Supplemental Data | | | | | |
| Net Assets, End of Period (Millions) | $3,288 | $2,864 | $2,252 | $2,023 | $3,652 |
| Ratio of Total Expenses to | | | | | |
| Average Net Assets1 | 0.34% | 0.32% | 0.34% | 0.26% | 0.23% |
| Ratio of Net Investment Income to | | | | | |
| Average Net Assets | 0.28% | 0.36% | 0.58% | 0.58% | 0.62% |
| Portfolio Turnover Rate | 89%2 | 82% | 95% | 112% | 90% |
| 1 Includes performance-based investment advisory fee increases (decreases) of 0.00%, (0.01%), (0.01%), (0.02%), and (0.04%). | |
| 2 Excludes the value of portfolio securities received or delivered as a result of in-kind purchases or redemptions of the fund’s capital shares. |
See accompanying Notes, which are an integral part of the Financial Statements.
22
Explorer Fund
Notes to Financial Statements
Vanguard Explorer Fund is registered under the Investment Company Act of 1940 as an open-end investment company, or mutual fund. The fund offers two classes of shares: Investor Shares and Admiral Shares. Investor Shares are available to any investor who meets the fund’s minimum purchase requirements. Admiral Shares are designed for investors who meet certain administrative, service, and account-size criteria.
A. The following significant accounting policies conform to generally accepted accounting principles for U.S. mutual funds. The fund consistently follows such policies in preparing its financial statements.
1. Security Valuation: Securities are valued as of the close of trading on the New York Stock Exchange (generally 4 p.m., Eastern time) on the valuation date. Equity securities are valued at the latest quoted sales prices or official closing prices taken from the primary market in which each security trades; such securities not traded on the valuation date are valued at the mean of the latest quoted bid and asked prices. Securities for which market quotations are not readily available, or whose values have been affected by events occurring before the fund’s pricing time but after the close of the securities’ primary markets, are valued at their fair values calculated according to procedures adopted by the board of trustees. These procedures include obtaining quotations from an independent pricing service, monitoring news to identify significant market- or security-specific events, and evaluating changes in the values of foreign market proxies (for example, ADRs, futures contracts, or exchange-traded funds), between the time the foreign markets close and the fund’s pricing time. When fair-value pricing is employed, the prices of securities used by a fund to calculate its net asset value may differ from quoted or published prices for the same securities. Investments in Vanguard Market Liquidity Fund are valued at that fund’s net asset value. Temporary cash investments acquired over 60 days to maturity are valued using the latest bid prices or using valuations based on a matrix system (which considers such factors as security prices, yields, maturities, and ratings), both as furnished by independent pricing services. Other temporary cash investments are valued at amortized cost, which approximates market value.
2. Foreign Currency: Securities and other assets and liabilities denominated in foreign currencies are translated into U.S. dollars using exchange rates obtained from an independent third party as of the fund’s pricing time on the valuation date. Realized gains (losses) and unrealized appreciation (depreciation) on investment securities include the effects of changes in exchange rates since the securities were purchased, combined with the effects of changes in security prices. Fluctuations in the value of other assets and liabilities resulting from changes in exchange rates are recorded as unrealized foreign currency gains (losses) until the assets or liabilities are settled in cash, at which time they are recorded as realized foreign currency gains (losses).
3. Futures Contracts: The fund uses index futures contracts to a limited extent, with the objective of maintaining full exposure to the stock market while maintaining liquidity. The fund may purchase or sell futures contracts to achieve a desired level of investment, whether to accommodate portfolio turnover or cash flows from capital share transactions. The primary risks associated with the use of futures contracts are imperfect correlation between changes in market values of stocks held by the fund and the prices of futures contracts, and the possibility of an illiquid market.
23
Explorer Fund
Futures contracts are valued at their quoted daily settlement prices. The aggregate principal amounts of the contracts are not recorded in the Statement of Net Assets. Fluctuations in the value of the contracts are recorded in the Statement of Net Assets as an asset (liability) and in the Statement of Operations as unrealized appreciation (depreciation) until the contracts are closed, when they are recorded as realized futures gains (losses).
4. Repurchase Agreements: The fund may enter into repurchase agreements. Securities pledged as collateral for repurchase agreements are held by a custodian bank until the agreements mature. Each agreement requires that the market value of the collateral be sufficient to cover payments of interest and principal. In the event of default or bankruptcy by the other party to the agreement, the fund may sell or retain the collateral, however such action may be subject to legal proceedings.
5. Federal Income Taxes: The fund intends to continue to qualify as a regulated investment company and distribute all of its taxable income. Management has analyzed the fund’s tax positions taken for all open federal income tax years (October 31, 2008–2011), and has concluded that no provision for federal income tax is required in the fund’s financial statements.
6. Distributions: Distributions to shareholders are recorded on the ex-dividend date.
7. Security Lending: The fund may lend its securities to qualified institutional borrowers to earn additional income. Security loans are required to be secured at all times by collateral at least equal to the market value of securities loaned. The fund invests cash collateral received in Vanguard Market Liquidity Fund, and records a liability for the return of the collateral, during the period the securities are on loan. Security lending income represents fees charged to borrowers plus income earned on investing cash collateral, less expenses associated with the loan.
8. Other: Dividend income is recorded on the ex-dividend date. Interest income includes income distributions received from Vanguard Market Liquidity Fund and is accrued daily. Security transactions are accounted for on the date securities are bought or sold. Costs used to determine realized gains (losses) on the sale of investment securities are those of the specific securities sold.
Each class of shares has equal rights as to assets and earnings, except that each class separately bears certain class-specific expenses related to maintenance of shareholder accounts (included in Management and Administrative expenses) and shareholder reporting. Marketing and distribution expenses are allocated to each class of shares based on a method approved by the board of trustees. Income, other non-class-specific expenses, and gains and losses on investments are allocated to each class of shares based on its relative net assets.
B. Granahan Investment Management, Inc., Wellington Management Company, LLP, Kalmar Investment Advisers, Chartwell Investment Partners, L.P., and Century Capital Management, LLC, each provide investment advisory services to a portion of the fund for a fee calculated at an annual percentage rate of average net assets managed by the advisor. The basic fees of Granahan Investment Management, Inc., Kalmar Investment Advisers, Wellington Management Company, LLP, and Chartwell Investment Partners, L.P. are subject to quarterly adjustments based on performance for the preceding three years relative to the Russell 2500 Growth Index. The basic fee for Century Capital Management, LLC, is subject to quarterly adjustments based on performance for the preceding three years relative to a 50/50 blend of the Russell 2500 Index and Russell 2500 Growth Index.
24
Explorer Fund
The Vanguard Group provides investment advisory services to a portion of the fund on an at-cost basis; the fund paid Vanguard advisory fees of $463,000 for the year ended October 31, 2011.
For the year ended October 31, 2011, the aggregate investment advisory fee represented an effective annual basic rate of 0.21% of the fund’s average net assets, before a decrease of $56,000 (0.00%) based on performance.
C. The Vanguard Group furnishes at cost corporate management, administrative, marketing, and distribution services. The costs of such services are allocated to the fund under methods approved by the board of trustees. The fund has committed to provide up to 0.40% of its net assets in capital contributions to Vanguard. At October 31, 2011, the fund had contributed capital of $1,387,000 to Vanguard (included in Other Assets), representing 0.02% of the fund’s net assets and 0.55% of Vanguard’s capitalization. The fund’s trustees and officers are also directors and officers of Vanguard.
D. The fund has asked its investment advisors to direct certain security trades, subject to obtaining the best price and execution, to brokers who have agreed to rebate to the fund part of the commissions generated. Such rebates are used solely to reduce the fund’s management and administrative expenses. For the year ended October 31, 2011, these arrangements reduced the fund’s expenses by $405,000 (an annual rate of 0.00% of average net assets).
E. Various inputs may be used to determine the value of the fund’s investments. These inputs are summarized in three broad levels for financial statement purposes. The inputs or methodologies used to value securities are not necessarily an indication of the risk associated with investing in those securities.
Level 1—Quoted prices in active markets for identical securities.
Level 2—Other significant observable inputs (including quoted prices for similar securities, interest rates, prepayment speeds, credit risk, etc.).
Level 3—Significant unobservable inputs (including the fund’s own assumptions used to determine the fair value of investments).
The following table summarizes the market value of the fund’s investments as of October 31, 2011, based on the inputs used to value them:
| | | |
| | Level 1 | Level 2 | Level 3 |
| Investments | ($000) | ($000) | ($000) |
| Common Stocks | 8,906,210 | 40,186 | — |
| Temporary Cash Investments | 268,647 | 37,197 | — |
| Futures Contracts—Assets1 | 1,126 | — | — |
| Futures Contracts—Liabilities1 | (4,696) | — | — |
| Total | 9,171,287 | 77,383 | — |
| 1 Represents variation margin on the last day of the reporting period. |
25
Explorer Fund
F. At October 31, 2011, the aggregate settlement value of open futures contracts and the related unrealized appreciation (depreciation) were:
| | | | |
| | | | ($000) |
| | | | Aggregate | |
| | | Number of | Settlement | Unrealized |
| | | Long (Short) | Value | Appreciation |
| Futures Contracts | Expiration | Contracts | Long (Short) | (Depreciation) |
| E-mini Russell 2000 Index | December 2011 | 1,098 | 81,175 | (2,745) |
| E-mini S&P MidCap 400 Index | December 2011 | 215 | 19,051 | 2,027 |
Unrealized appreciation (depreciation) on open futures contracts is required to be treated as realized gain (loss) for tax purposes.
G. Distributions are determined on a tax basis and may differ from net investment income and realized capital gains for financial reporting purposes. Differences may be permanent or temporary. Permanent differences are reclassified among capital accounts in the financial statements to reflect their tax character. Temporary differences arise when certain items of income, expense, gain, or loss are recognized in different periods for financial statement and tax purposes; these differences will reverse at some time in the future. Differences in classification may also result from the treatment of short-term gains as ordinary income for tax purposes.
During the year ended October 31, 2011, the fund realized net foreign currency losses of $112,000, which decreased distributable net income for tax purposes; accordingly, such losses have been reclassified from accumulated net realized losses to overdistributed net investment income.
During the year ended October 31, 2011, the fund realized $40,256,000 of net capital gains resulting from in-kind redemptions—in which shareholders exchanged fund shares for securities held by the fund rather than for cash. Because such gains are not taxable to the fund, and are not distributed to shareholders, they have been reclassified from accumulated net realized losses to paid-in capital.
For tax purposes, at October 31, 2011, the fund had $16,189,000 of ordinary income available for distribution. The fund had available capital loss carryforwards totaling $192,848,000 to offset future net capital gains through October 31, 2017.
At October 31, 2011, the cost of investment securities for tax purposes was $7,959,713,000. Net unrealized appreciation of investment securities for tax purposes was $1,292,527,000, consisting of unrealized gains of $1,875,572,000 on securities that had risen in value since their purchase and $583,045,000 in unrealized losses on securities that had fallen in value since their purchase.
H. During the year ended October 31, 2011, the fund purchased $8,496,165,000 of investment securities and sold $9,376,119,000 of investment securities, other than temporary cash investments. Realized net gains for the twelve months ended October 31, 2011, include $6,566,000 received from AXA Rosenberg Investment Management, a former investment advisor to the fund, as a result of a settlement with the Securities and Exchange Commission related to a coding error in its quantitative investment process. The settlement proceeds represent 0.07% of the fund’s average net assets for the twelve months ended October 31, 2011.
26
Explorer Fund
I. Certain of the fund’s investments are in companies that are considered to be affiliated companies of the fund because the fund owns more than 5% of the outstanding voting securities of the company. Transactions during the period in securities of these companies were as follows:
| | | | | |
| | | Current Period Transactions | |
| | Oct. 31, 2010 | | Proceeds from | | Oct. 31, 2011 |
| | Market | Purchases | Securities | Dividend | Market |
| | Value | at Cost | Sold | Income | Value |
| | ($000) | ($000) | ($000) | ($000) | ($000) |
| ABIOMED Inc. | 20,101 | 1,694 | 9,493 | — | NA1 |
| Beacon Roofing Supply Inc. | 38,932 | 32,290 | 55,314 | — | NA1 |
| HFF Inc. Class A | NA2 | 44,186 | 1,648 | — | 34,678 |
| Liz Claiborne Inc. | NA3 | 19,012 | 4,486 | — | NA3 |
| Sabra Healthcare REIT Inc. | NA3 | 10,733 | 12,293 | 835 | NA3 |
| TiVo Inc. | NA2 | 18,626 | 15,913 | — | 66,203 |
| Vonage Holdings Corp. | NA3 | 18,415 | 5,873 | — | NA3 |
| | 59,033 | | | 835 | 100,881 |
1 Not applicable—At October 31, 2011, the security was still held, but the issuer was no longer an affiliated company of the fund.
2 Not applicable—At October 31, 2010, the issuer was not an affiliated company of the fund.
3 Not applicable—At October 31, 2010, and October 31, 2011, the issuer was not an affiliated company of the fund, but it was affiliated
during the period.
J. Capital share transactions for each class of shares were:
| | | | |
| | Year Ended October 31, |
| | 2011 | 2010 |
| | Amount | Shares | Amount | Shares |
| | ($000) | (000) | ($000) | (000) |
| Investor Shares | | | | |
| Issued | 1,036,029 | 14,148 | 836,502 | 13,941 |
| Issued in Lieu of Cash Distributions | 9,647 | 133 | 10,536 | 182 |
| Redeemed | (2,159,549) | (29,243) | (1,712,468) | (28,532) |
| Net Increase (Decrease)—Investor Shares | (1,113,873) | (14,962) | (865,430) | (14,409) |
| Admiral Shares | | | | |
| Issued | 1,282,862 | 18,703 | 578,617 | 10,179 |
| Issued in Lieu of Cash Distributions | 8,743 | 130 | 7,302 | 135 |
| Redeemed | (1,170,331) | (17,067) | (572,577) | (10,460) |
| Net Increase (Decrease)—Admiral Shares | 121,274 | 1,766 | 13,342 | (146) |
K. In preparing the financial statements as of October 31, 2011, management considered the impact of subsequent events for potential recognition or disclosure in these financial statements.
27
Report of Independent Registered
Public Accounting Firm
To the Trustees and Shareholders of Vanguard Explorer Fund:
In our opinion, the accompanying statement of net assets-investments summary and the related statements of operations and of changes in net assets and the financial highlights present fairly, in all material respects, the financial position of Vanguard Explorer Fund (the “Fund”) at October 31, 2011, the results of its operations for the year then ended, the changes in its net assets for each of the two years in the period then ended and the financial highlights for each of the five years in the period then ended, in conformity with accounting principles generally accepted in the United States of America. These financial statements and financial highlights (hereafter referred to as “financial statements”) are the responsibility of the Fund’s management; our responsibility is to express an opinion on these financial statements based on our audits. We conducted our audits of these financial statements in accordance with the standards of the Public Company Accounting Oversight Board (United States). Those standards require that we plan and perform the audit to obtain reasonable assurance about whether the financial statements are free of material misstatement. An audit includes examining, on a test basis, evidence supporting the amounts and disclosures in the financial statements, assessing the accounting principles used and significant estimates made by management, and evaluating the overall financial statement presentation. We believe that our audits, which included confirmation of securities at October 31, 2011 by correspondence with the custodians and brokers and by agreement to the underlying ownership records of Vanguard Market Liquidity Fund, provide a reasonable basis for our opinion.
PricewaterhouseCoopers LLP
Philadelphia, Pennsylvania
December 12, 2011
Special 2011 tax information (unaudited) for Vanguard Explorer Fund
This information for the fiscal year ended October 31, 2011, is included pursuant to provisions of the
Internal Revenue Code.
The fund distributed $19,316,000 of qualified dividend income to shareholders during the fiscal year.
For corporate shareholders, 100% of investment income (dividend income plus short-term gains, if any)
qualifies for the dividends-received deduction.
28
Your Fund’s After-Tax Returns
This table presents returns for your fund both before and after taxes. The after-tax returns are shown in two ways: (1) assuming that an investor owned the fund during the entire period and paid taxes on the fund’s distributions, and (2) assuming that an investor paid taxes on the fund’s distributions and sold all shares at the end of each period.
Calculations are based on the highest individual federal income tax and capital gains tax rates in effect at the times of the distributions and the hypothetical sales. State and local taxes were not considered. After-tax returns reflect any qualified dividend income, using actual prior-year figures and estimates for 2011. (In the example, returns after the sale of fund shares may be higher than those assuming no sale. This occurs when the sale would have produced a capital loss. The calculation assumes that the investor received a tax deduction for the loss.)
The table shows returns for Investor Shares only; returns for other share classes will differ. Please note that your actual after-tax returns will depend on your tax situation and may differ from those shown. Also note that if you own the fund in a tax-deferred account, such as an individual retirement account or a 401(k) plan, this information does not apply to you. Such accounts are not subject to current taxes.
Finally, keep in mind that a fund’s performance—whether before or after taxes—does not guarantee future results.
Average Annual Total Returns: Explorer Fund Investor Shares
Periods Ended October 31, 2011
| | | |
| | One | Five | Ten |
| | Year | Years | Years |
| Returns Before Taxes | 10.76% | 2.24% | 6.51% |
| Returns After Taxes on Distributions | 10.74 | 1.51 | 5.96 |
| Returns After Taxes on Distributions and Sale of Fund Shares | 7.03 | 1.75 | 5.59 |
29
About Your Fund’s Expenses
As a shareholder of the fund, you incur ongoing costs, which include costs for portfolio management, administrative services, and shareholder reports (like this one), among others. Operating expenses, which are deducted from a fund’s gross income, directly reduce the investment return of the fund.
A fund’s expenses are expressed as a percentage of its average net assets. This figure is known as the expense ratio. The following examples are intended to help you understand the ongoing costs (in dollars) of investing in your fund and to compare these costs with those of other mutual funds. The examples are based on an investment of $1,000 made at the beginning of the period shown and held for the entire period.
The accompanying table illustrates your fund’s costs in two ways:
• Based on actual fund return. This section helps you to estimate the actual expenses that you paid over the period. The ”Ending Account Value“ shown is derived from the fund‘s actual return, and the third column shows the dollar amount that would have been paid by an investor who started with $1,000 in the fund. You may use the information here, together with the amount you invested, to estimate the expenses that you paid over the period.
To do so, simply divide your account value by $1,000 (for example, an $8,600 account value divided by $1,000 = 8.6), then multiply the result by the number given for your fund under the heading ”Expenses Paid During Period.“
• Based on hypothetical 5% yearly return. This section is intended to help you compare your fund‘s costs with those of other mutual funds. It assumes that the fund had a yearly return of 5% before expenses, but that the expense ratio is unchanged. In this case—because the return used is not the fund’s actual return—the results do not apply to your investment. The example is useful in making comparisons because the Securities and Exchange Commission requires all mutual funds to calculate expenses based on a 5% return. You can assess your fund’s costs by comparing this hypothetical example with the hypothetical examples that appear in shareholder reports of other funds.
Note that the expenses shown in the table are meant to highlight and help you compare ongoing costs only and do not reflect transaction costs incurred by the fund for buying and selling securities. Further, the expenses do not include any purchase, redemption, or account service fees described in the fund prospectus. If such fees were applied to your account, your costs would be higher. Your fund does not carry a “sales load.”
The calculations assume no shares were bought or sold during the period. Your actual costs may have been higher or lower, depending on the amount of your investment and the timing of any purchases or redemptions.
You can find more information about the fund’s expenses, including annual expense ratios, in the Financial Statements section of this report. For additional information on operating expenses and other shareholder costs, please refer to your fund’s current prospectus.
30
| | | |
| Six Months Ended October 31, 2011 | | | |
| | Beginning | Ending | Expenses |
| | Account Value | Account Value | Paid During |
| Explorer Fund | 4/30/2011 | 10/31/2011 | Period |
| Based on Actual Fund Return | | | |
| Investor Shares | $1,000.00 | $887.67 | $2.38 |
| Admiral Shares | 1,000.00 | 888.37 | 1.62 |
| Based on Hypothetical 5% Yearly Return | | | |
| Investor Shares | $1,000.00 | $1,022.68 | $2.55 |
| Admiral Shares | 1,000.00 | 1,023.49 | 1.73 |
The calculations are based on expenses incurred in the most recent six-month period. The fund’s annualized six-month expense ratios for that
period are 0.50% for Investor Shares and 0.34% for Admiral Shares. The dollar amounts shown as “Expenses Paid” are equal to the
annualized expense ratio multiplied by the average account value over the period, multiplied by the number of days in the most recent
six-month period, then divided by the number of days in the most recent 12-month period.
31
Glossary
30-Day SEC Yield. A fund’s 30-day SEC yield is derived using a formula specified by the U.S. Securities and Exchange Commission. Under the formula, data related to the fund’s security holdings in the previous 30 days are used to calculate the fund’s hypothetical net income for that period, which is then annualized and divided by the fund’s estimated average net assets over the calculation period. For the purposes of this calculation, a security’s income is based on its current market yield to maturity (for bonds; excluding inflation for inflation-protected securities), its actual income (for asset-backed securities), or its projected dividend yield (for stocks). Because the SEC yield represents hypothetical annualized income, it will differ—at times significantly—from the fund’s actual experience. As a result, the fund’s income distributions may be higher or lower than implied by the SEC yield.
Beta. A measure of the magnitude of a fund’s past share-price fluctuations in relation to the ups and downs of a given market index. The index is assigned a beta of 1.00. Compared with a given index, a fund with a beta of 1.20 typically would have seen its share price rise or fall by 12% when the index rose or fell by 10%. For this report, beta is based on returns over the past 36 months for both the fund and the index. Note that a fund’s beta should be reviewed in conjunction with its R-squared (see definition). The lower the R-squared, the less correlation there is between the fund and the index, and the less reliable beta is as an indicator of volatility.
Dividend Yield. Dividend income earned by stocks, expressed as a percentage of the aggregate market value (or of net asset value, for a fund). The yield is determined by dividing the amount of the annual dividends by the aggregate value (or net asset value) at the end of the period. For a fund, the dividend yield is based solely on stock holdings and does not include any income produced by other investments.
Earnings Growth Rate. The average annual rate of growth in earnings over the past five years for the stocks now in a fund.
Equity Exposure. A measure that reflects a fund’s investments in stocks and stock futures. Any holdings in short-term reserves are excluded.
Expense Ratio. The percentage of a fund’s average net assets used to pay its annual administrative and advisory expenses. These expenses directly reduce returns to investors.
Foreign Holdings. The percentage of a fund represented by securities or depositary receipts of companies based outside the United States.
Inception Date. The date on which the assets of a fund (or one of its share classes) are first invested in accordance with the fund’s investment objective. For funds with a subscription period, the inception date is the day after that period ends. Investment performance is measured from the inception date.
Median Market Cap. An indicator of the size of companies in which a fund invests; the midpoint of market capitalization (market price x shares outstanding) of a fund’s stocks, weighted by the proportion of the fund’s assets invested in each stock. Stocks representing half of the fund’s assets have market capitalizations above the median, and the rest are below it.
Price/Book Ratio. The share price of a stock divided by its net worth, or book value, per share. For a fund, the weighted average price/book ratio of the stocks it holds.
32
Price/Earnings Ratio. The ratio of a stock’s current price to its per-share earnings over the past year. For a fund, the weighted average P/E of the stocks it holds. P/E is an indicator of market expectations about corporate prospects; the higher the P/E, the greater the expectations for a company’s future growth.
R-Squared. A measure of how much of a fund’s past returns can be explained by the returns from the market in general, as measured by a given index. If a fund’s total returns were precisely synchronized with an index’s returns, its R-squared would be 1.00. If the fund’s returns bore no relationship to the index’s returns, its R-squared would be 0. For this report, R-squared is based on returns over the past 36 months for both the fund and the index.
Return on Equity. The annual average rate of return generated by a company during the past five years for each dollar of shareholder’s equity (net income divided by shareholder’s equity). For a fund, the weighted average return on equity for the companies whose stocks it holds.
Short-Term Reserves. The percentage of a fund invested in highly liquid, short-term securities that can be readily converted to cash.
Turnover Rate. An indication of the fund’s trading activity. Funds with high turnover rates incur higher transaction costs and may be more likely to distribute capital gains (which may be taxable to investors). The turnover rate excludes in-kind transactions, which have minimal impact on costs.
33
This page intentionally left blank.
This page intentionally left blank.
The People Who Govern Your Fund
The trustees of your mutual fund are there to see that the fund is operated and managed in your best interests since, as a shareholder, you are a part owner of the fund. Your fund’s trustees also serve on the board of directors of The Vanguard Group, Inc., which is owned by the Vanguard funds and provides services to them on an at-cost basis.
A majority of Vanguard’s board members are independent, meaning that they have no affiliation with Vanguard or the funds they oversee, apart from the sizable personal investments they have made as private individuals. The independent board members have distinguished backgrounds in business, academia, and public service. Each of the trustees and executive officers oversees 180 Vanguard funds.
The following table provides information for each trustee and executive officer of the fund. More information about the trustees is in the Statement of Additional Information, which can be obtained, without charge, by contacting Vanguard at 800-662-7447, or online at vanguard.com.
| |
| Interested Trustee1 | and President (2006–2008) of Rohm and Haas Co. |
| | (chemicals); Director of Tyco International, Ltd. |
| F. William McNabb III | (diversified manufacturing and services) and Hewlett- |
| Born 1957. Trustee Since July 2009. Chairman of the | Packard Co. (electronic computer manufacturing); |
| Board. Principal Occupation(s) During the Past Five | Senior Advisor at New Mountain Capital; Trustee |
| Years: Chairman of the Board of The Vanguard Group, | of The Conference Board; Member of the Board of |
| Inc., and of each of the investment companies served | Managers of Delphi Automotive LLP (automotive |
| by The Vanguard Group, since January 2010; Director | components). |
| of The Vanguard Group since 2008; Chief Executive | |
| Officer and President of The Vanguard Group and of | Amy Gutmann |
| each of the investment companies served by The | Born 1949. Trustee Since June 2006. Principal |
| Vanguard Group since 2008; Director of Vanguard | Occupation(s) During the Past Five Years: President |
| Marketing Corporation; Managing Director of The | of the University of Pennsylvania; Christopher H. |
| Vanguard Group (1995–2008). | Browne Distinguished Professor of Political Science |
| | in the School of Arts and Sciences with secondary |
| | appointments at the Annenberg School for Commu- |
| Independent Trustees | nication and the Graduate School of Education |
| | of the University of Pennsylvania; Director of |
| Emerson U. Fullwood | Carnegie Corporation of New York, Schuylkill River |
| Born 1948. Trustee Since January 2008. Principal | Development Corporation, and Greater Philadelphia |
| Occupation(s) During the Past Five Years: Executive | Chamber of Commerce; Trustee of the National |
| Chief Staff and Marketing Officer for North America | Constitution Center; Chair of the Presidential |
| and Corporate Vice President (retired 2008) of Xerox | Commission for the Study of Bioethical Issues. |
| Corporation (document management products and | |
| services); Executive in Residence and 2010 | JoAnn Heffernan Heisen |
| Distinguished Minett Professor at the Rochester | Born 1950. Trustee Since July 1998. Principal |
| Institute of Technology; Director of SPX Corporation | Occupation(s) During the Past Five Years: Corporate |
| (multi-industry manufacturing), the United Way of | Vice President and Chief Global Diversity Officer |
| Rochester, Amerigroup Corporation (managed health | (retired 2008) and Member of the Executive |
| care), the University of Rochester Medical Center, | Committee (1997–2008) of Johnson & Johnson |
| Monroe Community College Foundation, and North | (pharmaceuticals/consumer products); Director of |
| Carolina A&T University. | Skytop Lodge Corporation (hotels), the University |
| | Medical Center at Princeton, the Robert Wood |
| Rajiv L. Gupta | Johnson Foundation, and the Center for Work Life |
| Born 1945. Trustee Since December 2001.2 | Policy; Member of the Advisory Board of the |
| Principal Occupation(s) During the Past Five Years: | Maxwell School of Citizenship and Public Affairs |
| Chairman and Chief Executive Officer (retired 2009) | at Syracuse University. |
| | |
| F. Joseph Loughrey | Thomas J. Higgins | |
| Born 1949. Trustee Since October 2009. Principal | Born 1957. Chief Financial Officer Since September |
| Occupation(s) During the Past Five Years: President | 2008. Principal Occupation(s) During the Past Five |
| and Chief Operating Officer (retired 2009) and Vice | Years: Principal of The Vanguard Group, Inc.; Chief |
| Chairman of the Board (2008–2009) of Cummins Inc. | Financial Officer of each of the investment companies |
| (industrial machinery); Director of SKF AB (industrial | served by The Vanguard Group since 2008; Treasurer |
| machinery), Hillenbrand, Inc. (specialized consumer | of each of the investment companies served by The |
| services), the Lumina Foundation for Education, and | Vanguard Group (1998–2008). |
| Oxfam America; Chairman of the Advisory Council | | |
| for the College of Arts and Letters and Member | Kathryn J. Hyatt | |
| of the Advisory Board to the Kellogg Institute for | Born 1955. Treasurer Since November 2008. Principal |
| International Studies at the University of Notre Dame. | Occupation(s) During the Past Five Years: Principal |
| | of The Vanguard Group, Inc.; Treasurer of each of |
| André F. Perold | the investment companies served by The Vanguard |
| Born 1952. Trustee Since December 2004. Principal | Group since 2008; Assistant Treasurer of each of the |
| Occupation(s) During the Past Five Years: George | investment companies served by The Vanguard Group |
| Gund Professor of Finance and Banking at the Harvard | (1988–2008). | |
| Business School (retired July 2011); Chief Investment | | |
| Officer and co-Managing Partner of HighVista | Heidi Stam | |
| Strategies LLC (private investment firm); Director of | Born 1956. Secretary Since July 2005. Principal |
| Rand Merchant Bank; Overseer of the Museum of | Occupation(s) During the Past Five Years: Managing |
| Fine Arts Boston. | Director of The Vanguard Group, Inc., since 2006; |
| | General Counsel of The Vanguard Group since 2005; |
| Alfred M. Rankin, Jr. | Secretary of The Vanguard Group and of each of the |
| Born 1941. Trustee Since January 1993. Principal | investment companies served by The Vanguard Group |
| Occupation(s) During the Past Five Years: Chairman, | since 2005; Director and Senior Vice President of |
| President, and Chief Executive Officer of NACCO | Vanguard Marketing Corporation since 2005; |
| Industries, Inc. (forklift trucks/housewares/lignite); | Principal of The Vanguard Group (1997–2006). |
| Director of Goodrich Corporation (industrial products/ | | |
| aircraft systems and services) and the National | | |
| Association of Manufacturers; Chairman of the | Vanguard Senior Management Team |
| Federal Reserve Bank of Cleveland; Vice Chairman | | |
| of University Hospitals of Cleveland; President of | R. Gregory Barton | Chris D. McIsaac |
| the Board of The Cleveland Museum of Art. | Mortimer J. Buckley | Michael S. Miller |
| | Kathleen C. Gubanich | James M. Norris |
| Peter F. Volanakis | Paul A. Heller | Glenn W. Reed |
| Born 1955. Trustee Since July 2009. Principal | Martha G. King | George U. Sauter |
| Occupation(s) During the Past Five Years: President | | |
| and Chief Operating Officer (retired 2010) of Corning | | |
| Incorporated (communications equipment); Director of | Chairman Emeritus and Senior Advisor |
| Corning Incorporated (2000–2010) and Dow Corning | | |
| (2001–2010); Overseer of the Amos Tuck School of | John J. Brennan | |
| Business Administration at Dartmouth College. | Chairman, 1996–2009 | |
| | Chief Executive Officer and President, 1996–2008 |
| |
| Executive Officers | | |
| | Founder | |
| Glenn Booraem | | |
| Born 1967. Controller Since July 2010. Principal | John C. Bogle | |
| Occupation(s) During the Past Five Years: Principal | Chairman and Chief Executive Officer, 1974–1996 |
| of The Vanguard Group, Inc.; Controller of each of | | |
| the investment companies served by The Vanguard | | |
| Group since 2010; Assistant Controller of each of | | |
| the investment companies served by The Vanguard | | |
| Group (2001–2010). | | |
1 Mr. McNabb is considered an “interested person,” as defined in the Investment Company Act of 1940, because he is an officer of the
Vanguard funds.
2 December 2002 for Vanguard Equity Income Fund, Vanguard Growth Equity Fund, the Vanguard Municipal Bond Funds, and the Vanguard
State Tax-Exempt Funds.

P.O. Box 2600
Valley Forge, PA 19482-2600
| |
| Connect with Vanguard® > vanguard.com | |
| |
| |
| |
| Fund Information > 800-662-7447 | CFA® is a trademark owned by CFA Institute. |
| Direct Investor Account Services > 800-662-2739 | |
| Institutional Investor Services > 800-523-1036 | |
| Text Telephone for People | |
| With Hearing Impairment > 800-749-7273 | |
| |
| This material may be used in conjunction | |
| with the offering of shares of any Vanguard | |
| fund only if preceded or accompanied by | |
| the fund’s current prospectus. | |
| |
| All comparative mutual fund data are from Lipper Inc. or | |
| Morningstar, Inc., unless otherwise noted. | |
| |
| You can obtain a free copy of Vanguard’s proxy voting | |
| guidelines by visiting vanguard.com/proxyreporting or by | |
| calling Vanguard at 800-662-2739. The guidelines are | |
| also available from the SEC’s website, sec.gov. In | |
| addition, you may obtain a free report on how your fund | |
| voted the proxies for securities it owned during the 12 | |
| months ended June 30. To get the report, visit either | |
| vanguard.com/proxyreporting or sec.gov. | |
| |
| You can review and copy information about your fund at | |
| the SEC’s Public Reference Room in Washington, D.C. To | |
| find out more about this public service, call the SEC at | |
| 202-551-8090. Information about your fund is also | |
| available on the SEC’s website, and you can receive | |
| copies of this information, for a fee, by sending a | |
| request in either of two ways: via e-mail addressed to | |
| publicinfo@sec.gov or via regular mail addressed to the | |
| Public Reference Section, Securities and Exchange | |
| Commission, Washington, DC 20549-1520. | |
| |
| |
| | © 2011 The Vanguard Group, Inc. |
| | All rights reserved. |
| | Vanguard Marketing Corporation, Distributor. |
| |
| | Q240 122011 |
Vanguard® Explorer Fund
Schedule of Investments
October 31, 2011
| | | |
| | | | Market |
| | | | Value |
| | | Shares | ($000) |
| |
| Common Stocks (97.8%)1 | | |
| Consumer Discretionary (14.5%) | | |
| * | Life Time Fitness Inc. | 1,346,145 | 58,059 |
| * | Cheesecake Factory Inc. | 1,715,651 | 48,021 |
| | Gentex Corp. | 1,423,455 | 42,875 |
| * | LKQ Corp. | 1,455,520 | 42,472 |
| * | CarMax Inc. | 1,406,070 | 42,266 |
| | Express Inc. | 1,705,825 | 38,535 |
| *,^ | Liz Claiborne Inc. | 4,715,920 | 37,775 |
| | Aaron's Inc. | 1,354,290 | 36,241 |
| * | Steven Madden Ltd. | 940,627 | 34,709 |
| | Tractor Supply Co. | 488,980 | 34,688 |
| | Lennar Corp. Class A | 1,875,290 | 31,017 |
| * | Urban Outfitters Inc. | 1,122,695 | 30,593 |
| | DSW Inc. Class A | 577,550 | 30,229 |
| * | Bally Technologies Inc. | 810,860 | 29,410 |
| * | TRW Automotive Holdings Corp. | 686,131 | 28,886 |
| | Williams-Sonoma Inc. | 728,059 | 27,331 |
| * | DreamWorks Animation SKG Inc. Class A | 1,430,140 | 26,529 |
| * | O'Reilly Automotive Inc. | 339,711 | 25,835 |
| * | MGM Resorts International | 2,238,450 | 25,787 |
| | Cinemark Holdings Inc. | 1,245,050 | 25,735 |
| | DeVry Inc. | 679,195 | 25,592 |
| * | Pier 1 Imports Inc. | 2,002,923 | 25,057 |
| * | Pulte Group Inc. | 4,791,915 | 24,822 |
| * | Buffalo Wild Wings Inc. | 336,050 | 22,253 |
| | Texas Roadhouse Inc. Class A | 1,482,060 | 21,238 |
| * | AMC Networks Inc. Class A | 650,000 | 21,203 |
| * | Live Nation Entertainment Inc. | 2,179,380 | 20,464 |
| | Service Corp. International | 2,002,130 | 20,021 |
| * | Steiner Leisure Ltd. | 410,000 | 19,754 |
| * | Dana Holding Corp. | 1,352,800 | 19,129 |
| * | Sally Beauty Holdings Inc. | 976,665 | 18,742 |
| * | Select Comfort Corp. | 855,650 | 17,772 |
| | Belo Corp. Class A | 2,758,200 | 17,487 |
| * | GameStop Corp. Class A | 676,695 | 17,303 |
| * | GNC Holdings Inc. Class A | 667,507 | 16,521 |
| | Men's Wearhouse Inc. | 511,600 | 15,798 |
| * | Carter's Inc. | 394,700 | 15,034 |
| * | Fossil Inc. | 140,330 | 14,547 |
| | MDC Partners Inc. Class A | 796,227 | 13,408 |
| *,^ | Dunkin' Brands Group Inc. | 437,465 | 12,735 |
| * | Coinstar Inc. | 261,471 | 12,483 |
| * | Tempur-Pedic International Inc. | 169,065 | 11,507 |
| | Tiffany & Co. | 144,000 | 11,481 |
| * | American Public Education Inc. | 317,150 | 11,357 |
| * | Crocs Inc. | 589,085 | 10,409 |
| * | Pinnacle Entertainment Inc. | 918,162 | 10,394 |
| * | Genesco Inc. | 171,775 | 10,124 |
| | Group 1 Automotive Inc. | 218,041 | 9,934 |
| * | WMS Industries Inc. | 425,894 | 9,331 |
| * | K12 Inc. | 259,478 | 9,095 |
| * | Domino's Pizza Inc. | 259,981 | 8,327 |
| * | JOS A Bank Clothiers Inc. | 150,000 | 8,016 |
| | Bebe Stores Inc. | 1,103,350 | 7,922 |
| * | BJ's Restaurants Inc. | 145,000 | 7,675 |
| | Chico's FAS Inc. | 620,900 | 7,674 |
| | Monro Muffler Brake Inc. | 198,125 | 7,348 |
| * | Lululemon Athletica Inc. | 130,000 | 7,342 |
| * | Shutterfly Inc. | 164,150 | 6,840 |
| * | Peet's Coffee & Tea Inc. | 106,894 | 6,811 |
| * | SodaStream International Ltd. | 175,000 | 5,964 |
| * | Zagg Inc. | 431,500 | 5,821 |
1
Vanguard® Explorer Fund
Schedule of Investments
October 31, 2011
| | | |
| | | | Market |
| | | | Value |
| | | Shares | ($000) |
| * | ITT Educational Services Inc. | 93,904 | 5,818 |
| * | Hibbett Sports Inc. | 140,613 | 5,792 |
| | Weight Watchers International Inc. | 75,500 | 5,634 |
| * | Modine Manufacturing Co. | 456,500 | 4,825 |
| | Brunswick Corp. | 244,795 | 4,323 |
| | Strayer Education Inc. | 50,000 | 4,261 |
| | DR Horton Inc. | 357,500 | 3,979 |
| | PetSmart Inc. | 72,595 | 3,408 |
| | Polaris Industries Inc. | 51,158 | 3,240 |
| | John Wiley & Sons Inc. Class A | 48,777 | 2,320 |
| * | Ulta Salon Cosmetics & Fragrance Inc. | 34,197 | 2,301 |
| | Brinker International Inc. | 97,299 | 2,228 |
| * | Capella Education Co. | 63,800 | 2,221 |
| * | ANN Inc. | 83,171 | 2,216 |
| * | Sirius XM Radio Inc. | 1,015,000 | 1,817 |
| | Finish Line Inc. Class A | 89,956 | 1,808 |
| | Ameristar Casinos Inc. | 96,100 | 1,778 |
| | Hillenbrand Inc. | 65,600 | 1,385 |
| | Sinclair Broadcast Group Inc. Class A | 143,800 | 1,378 |
| * | Warnaco Group Inc. | 27,552 | 1,353 |
| | Foot Locker Inc. | 56,300 | 1,231 |
| | Harman International Industries Inc. | 24,100 | 1,040 |
| * | Goodyear Tire & Rubber Co. | 55,300 | 794 |
| * | Dick's Sporting Goods Inc. | 20,000 | 782 |
| * | Conn's Inc. | 50,500 | 465 |
| * | American Axle & Manufacturing Holdings Inc. | 40,000 | 388 |
| | Sotheby's | 9,082 | 320 |
| * | Tenneco Inc. | 6,777 | 222 |
| * | Vitamin Shoppe Inc. | 4,600 | 174 |
| * | Krispy Kreme Doughnuts Inc. Warrants Exp. 03/02/2012 | 8,183 | 1 |
| | | | 1,329,230 |
| Consumer Staples (2.5%) | | |
| * | Smithfield Foods Inc. | 1,693,950 | 38,724 |
| | Pricesmart Inc. | 464,890 | 35,350 |
| | Herbalife Ltd. | 559,493 | 34,890 |
| | Nu Skin Enterprises Inc. Class A | 642,707 | 32,476 |
| * | Cott Corp. | 3,131,764 | 22,173 |
| * | United Natural Foods Inc. | 598,194 | 21,840 |
| *,^ | Boston Beer Co. Inc. Class A | 83,453 | 7,384 |
| * | Hansen Natural Corp. | 77,200 | 6,878 |
| | McCormick & Co. Inc. | 134,450 | 6,529 |
| * | Green Mountain Coffee Roasters Inc. | 100,000 | 6,502 |
| | Diamond Foods Inc. | 90,000 | 5,918 |
| | B&G Foods Inc. Class A | 110,140 | 2,337 |
| * | Rite Aid Corp. | 1,249,900 | 1,450 |
| | Church & Dwight Co. Inc. | 27,800 | 1,228 |
| * | Darling International Inc. | 55,500 | 778 |
| | Lancaster Colony Corp. | 8,220 | 547 |
| * | Smart Balance Inc. | 75,800 | 496 |
| | Ruddick Corp. | 10,300 | 450 |
| | Vector Group Ltd. | 22,470 | 395 |
| | | | 226,345 |
| Energy (7.2%) | | |
| * | Superior Energy Services Inc. | 1,704,480 | 47,930 |
| * | Key Energy Services Inc. | 2,941,775 | 38,037 |
| | Core Laboratories NV | 345,491 | 37,403 |
| * | Carrizo Oil & Gas Inc. | 1,315,230 | 35,774 |
| * | Hornbeck Offshore Services Inc. | 988,070 | 32,448 |
| * | Rosetta Resources Inc. | 672,600 | 29,823 |
| | Tidewater Inc. | 550,095 | 27,081 |
| * | SandRidge Energy Inc. | 3,338,565 | 25,573 |
| * | Atwood Oceanics Inc. | 573,441 | 24,509 |
| * | Comstock Resources Inc. | 1,339,030 | 24,424 |
| * | Quicksilver Resources Inc. | 3,063,600 | 23,590 |
2
Vanguard® Explorer Fund
Schedule of Investments
October 31, 2011
| | | |
| | | | Market |
| | | | Value |
| | | Shares | ($000) |
| * | ION Geophysical Corp. | 3,081,495 | 23,481 |
| * | Tetra Technologies Inc. | 2,285,416 | 21,711 |
| * | Kodiak Oil & Gas Corp. | 3,003,688 | 20,756 |
| * | Brigham Exploration Co. | 501,640 | 18,267 |
| * | Southwestern Energy Co. | 397,625 | 16,716 |
| * | Clean Energy Fuels Corp. | 1,318,620 | 15,586 |
| * | Complete Production Services Inc. | 425,640 | 13,961 |
| | Niko Resources Ltd. | 240,475 | 13,334 |
| * | Tesco Corp. | 842,297 | 13,030 |
| * | Rex Energy Corp. | 810,410 | 12,545 |
| * | Whiting Petroleum Corp. | 264,900 | 12,331 |
| | RPC Inc. | 637,029 | 11,830 |
| * | McDermott International Inc. | 1,068,590 | 11,733 |
| * | Pioneer Drilling Co. | 1,179,350 | 11,664 |
| * | Newpark Resources Inc. | 1,268,120 | 11,324 |
| * | Oasis Petroleum Inc. | 373,750 | 10,966 |
| | Cabot Oil & Gas Corp. | 128,700 | 10,003 |
| | SM Energy Co. | 106,467 | 8,827 |
| | Berry Petroleum Co. Class A | 235,450 | 8,135 |
| | Oceaneering International Inc. | 140,740 | 5,887 |
| * | Basic Energy Services Inc. | 280,950 | 5,153 |
| | CARBO Ceramics Inc. | 35,319 | 4,798 |
| | HollyFrontier Corp. | 110,746 | 3,399 |
| * | C&J Energy Services Inc. | 185,650 | 3,130 |
| | Golar LNG Ltd. | 62,200 | 2,515 |
| * | CVR Energy Inc. | 87,800 | 2,174 |
| * | Gulfport Energy Corp. | 69,300 | 2,158 |
| * | Stone Energy Corp. | 78,900 | 1,916 |
| * | Western Refining Inc. | 118,100 | 1,887 |
| * | Energy XXI Bermuda Ltd. | 64,000 | 1,880 |
| | W&T Offshore Inc. | 82,328 | 1,621 |
| * | Clayton Williams Energy Inc. | 23,032 | 1,505 |
| * | Mitcham Industries Inc. | 102,800 | 1,499 |
| | Patterson-UTI Energy Inc. | 68,800 | 1,398 |
| * | Cloud Peak Energy Inc. | 14,313 | 329 |
| | Helmerich & Payne Inc. | 900 | 48 |
| | | | 654,089 |
| Exchange-Traded Funds (1.7%) | | |
| 2 | Vanguard Small-Cap ETF | 865,083 | 61,205 |
| ^,2 | Vanguard Small-Cap Growth ETF | 713,200 | 55,444 |
| ^ | iShares Russell 2000 Index Fund | 508,160 | 37,588 |
| | | | 154,237 |
| Financials (6.1%) | | |
| | Cash America International Inc. | 826,248 | 45,237 |
| *,3 | HFF Inc. Class A | 3,152,558 | 34,678 |
| * | NASDAQ OMX Group Inc. | 1,348,777 | 33,787 |
| * | Affiliated Managers Group Inc. | 318,875 | 29,531 |
| | International Bancshares Corp. | 1,568,125 | 28,414 |
| * | National Financial Partners Corp. | 1,876,647 | 25,654 |
| * | First Republic Bank | 876,717 | 24,285 |
| | East West Bancorp Inc. | 1,213,092 | 23,619 |
| | MFA Financial Inc. | 3,464,025 | 23,382 |
| | Evercore Partners Inc. Class A | 851,500 | 23,365 |
| | Redwood Trust Inc. | 1,992,185 | 23,149 |
| * | Signature Bank | 410,325 | 22,876 |
| | National Penn Bancshares Inc. | 2,917,028 | 22,753 |
| | Och-Ziff Capital Management Group LLC Class A | 2,055,150 | 22,422 |
| * | LPL Investment Holdings Inc. | 772,335 | 22,406 |
| | Mid-America Apartment Communities Inc. | 337,875 | 21,083 |
| | MB Financial Inc. | 1,056,090 | 17,499 |
| | PS Business Parks Inc. | 320,443 | 17,057 |
| * | eHealth Inc. | 1,055,225 | 15,670 |
| | Jefferies Group Inc. | 983,713 | 13,044 |
| | Essex Property Trust Inc. | 82,300 | 11,749 |
3
Vanguard® Explorer Fund
Schedule of Investments
October 31, 2011
| | |
| | | Market |
| | | Value |
| | Shares | ($000) |
| Cardinal Financial Corp. | 926,612 | 9,952 |
| Alterra Capital Holdings Ltd. | 277,190 | 6,010 |
| Tanger Factory Outlet Centers | 152,350 | 4,290 |
| Brown & Brown Inc. | 179,775 | 3,969 |
| First Midwest Bancorp Inc. | 429,947 | 3,874 |
| Rayonier Inc. | 56,327 | 2,351 |
| * World Acceptance Corp. | 31,476 | 2,129 |
| Validus Holdings Ltd. | 68,680 | 1,879 |
| QC Holdings Inc. | 566,930 | 1,848 |
| * Ezcorp Inc. Class A | 66,529 | 1,848 |
| * Credit Acceptance Corp. | 25,853 | 1,782 |
| Nelnet Inc. Class A | 80,976 | 1,739 |
| * First Cash Financial Services Inc. | 37,261 | 1,546 |
| Bank of the Ozarks Inc. | 50,250 | 1,250 |
| Highwoods Properties Inc. | 39,800 | 1,233 |
| Camden Property Trust | 19,000 | 1,152 |
| CBL & Associates Properties Inc. | 72,900 | 1,121 |
| Omega Healthcare Investors Inc. | 57,600 | 1,023 |
| Potlatch Corp. | 30,737 | 998 |
| National Health Investors Inc. | 22,200 | 992 |
| Digital Realty Trust Inc. | 15,765 | 983 |
| * CBRE Group Inc. Class A | 53,874 | 958 |
| Extra Space Storage Inc. | 42,300 | 953 |
| Federal Realty Investment Trust | 8,500 | 755 |
| Advance America Cash Advance Centers Inc. | 71,900 | 606 |
| Universal Health Realty Income Trust | 15,900 | 604 |
| Apartment Investment & Management Co. | 20,000 | 493 |
| Erie Indemnity Co. Class A | 5,900 | 466 |
| * Tejon Ranch Co. | 16,300 | 424 |
| Amtrust Financial Services Inc. | 11,200 | 284 |
| Washington Real Estate Investment Trust | 7,500 | 217 |
| * Investors Bancorp Inc. | 14,300 | 199 |
| | | 559,588 |
| Health Care (18.0%) | | |
| Cooper Cos. Inc. | 1,131,888 | 78,440 |
| * Bruker Corp. | 5,085,100 | 73,378 |
| * Coventry Health Care Inc. | 1,791,685 | 56,994 |
| * Alkermes plc | 3,176,235 | 55,552 |
| * Health Management Associates Inc. Class A | 6,252,187 | 54,769 |
| * Elan Corp. plc ADR | 4,506,888 | 54,038 |
| * Salix Pharmaceuticals Ltd. | 1,571,965 | 53,848 |
| * Healthspring Inc. | 854,410 | 46,087 |
| Universal Health Services Inc. Class B | 982,600 | 39,275 |
| * Seattle Genetics Inc. | 1,637,664 | 36,029 |
| * Cubist Pharmaceuticals Inc. | 879,380 | 33,249 |
| * Henry Schein Inc. | 451,150 | 31,274 |
| * Luminex Corp. | 1,422,590 | 31,240 |
| * ResMed Inc. | 1,087,250 | 30,769 |
| * BioMarin Pharmaceutical Inc. | 889,700 | 30,348 |
| * Health Net Inc. | 1,081,310 | 30,050 |
| * Allscripts Healthcare Solutions Inc. | 1,569,095 | 30,048 |
| * Kindred Healthcare Inc. | 2,558,619 | 29,808 |
| * Bio-Rad Laboratories Inc. Class A | 283,810 | 28,253 |
| DENTSPLY International Inc. | 746,350 | 27,585 |
| Pharmaceutical Product Development Inc. | 820,250 | 27,060 |
| * ICON plc ADR | 1,600,445 | 26,887 |
| * Onyx Pharmaceuticals Inc. | 644,500 | 26,379 |
| * Alexion Pharmaceuticals Inc. | 380,350 | 25,677 |
| West Pharmaceutical Services Inc. | 639,750 | 24,867 |
| * Mettler-Toledo International Inc. | 161,359 | 24,785 |
| * ABIOMED Inc. | 1,570,213 | 23,647 |
| * Edwards Lifesciences Corp. | 310,200 | 23,395 |
| * Insulet Corp. | 1,384,215 | 22,590 |
| * PAREXEL International Corp. | 1,000,225 | 22,035 |
4
Vanguard® Explorer Fund
Schedule of Investments
October 31, 2011
| | | |
| | | | Market |
| | | | Value |
| | | Shares | ($000) |
| * | WellCare Health Plans Inc. | 427,215 | 20,938 |
| * | MWI Veterinary Supply Inc. | 276,038 | 20,841 |
| * | Jazz Pharmaceuticals Inc. | 508,300 | 19,803 |
| * | Volcano Corp. | 779,640 | 19,436 |
| * | Sirona Dental Systems Inc. | 394,628 | 18,903 |
| * | Questcor Pharmaceuticals Inc. | 442,474 | 17,969 |
| * | Regeneron Pharmaceuticals Inc. | 318,451 | 17,610 |
| * | IPC The Hospitalist Co. Inc. | 404,200 | 16,948 |
| * | Covance Inc. | 326,057 | 16,541 |
| * | Gen-Probe Inc. | 273,005 | 16,408 |
| * | Brookdale Senior Living Inc. Class A | 984,850 | 16,329 |
| * | Amylin Pharmaceuticals Inc. | 1,403,110 | 16,164 |
| * | QIAGEN NV | 1,097,600 | 15,125 |
| | Quality Systems Inc. | 363,600 | 14,148 |
| * | Warner Chilcott plc Class A | 777,600 | 14,090 |
| | Hikma Pharmaceuticals plc | 1,300,350 | 14,084 |
| * | Momenta Pharmaceuticals Inc. | 945,290 | 13,990 |
| * | NxStage Medical Inc. | 592,304 | 13,617 |
| | Patterson Cos. Inc. | 415,800 | 13,085 |
| * | WuXi PharmaTech Cayman Inc. ADR | 1,027,450 | 12,771 |
| *,^ | Cadence Pharmaceuticals Inc. | 2,168,394 | 12,642 |
| | Invacare Corp. | 556,249 | 12,488 |
| | Hill-Rom Holdings Inc. | 369,975 | 12,457 |
| * | Akorn Inc. | 1,361,285 | 12,238 |
| * | Targacept Inc. | 685,636 | 12,067 |
| * | Cyberonics Inc. | 414,600 | 11,941 |
| * | SXC Health Solutions Corp. | 247,642 | 11,595 |
| * | Nektar Therapeutics | 2,137,500 | 11,585 |
| * | Exelixis Inc. | 1,489,045 | 11,510 |
| * | Ardea Biosciences Inc. | 572,640 | 11,401 |
| * | Immunogen Inc. | 823,400 | 11,182 |
| * | Align Technology Inc. | 478,000 | 11,008 |
| * | Catalyst Health Solutions Inc. | 195,764 | 10,761 |
| * | Incyte Corp. Ltd. | 748,630 | 10,309 |
| * | Isis Pharmaceuticals Inc. | 824,939 | 6,839 |
| * | Cepheid Inc. | 155,264 | 5,571 |
| * | Air Methods Corp. | 56,400 | 4,558 |
| * | SonoSite Inc. | 139,000 | 4,308 |
| * | NPS Pharmaceuticals Inc. | 476,195 | 2,462 |
| * | Impax Laboratories Inc. | 119,660 | 2,263 |
| * | Charles River Laboratories International Inc. | 69,700 | 2,250 |
| * | United Therapeutics Corp. | 51,374 | 2,247 |
| | STERIS Corp. | 70,203 | 2,175 |
| * | Medicines Co. | 113,154 | 2,118 |
| * | Team Health Holdings Inc. | 101,500 | 2,063 |
| | Chemed Corp. | 34,506 | 2,048 |
| * | AMERIGROUP Corp. | 36,164 | 2,012 |
| * | AVEO Pharmaceuticals Inc. | 118,300 | 1,900 |
| * | AMN Healthcare Services Inc. | 388,253 | 1,840 |
| | Medicis Pharmaceutical Corp. Class A | 47,800 | 1,830 |
| | Perrigo Co. | 18,092 | 1,633 |
| * | Orthofix International NV | 44,000 | 1,545 |
| * | Molina Healthcare Inc. | 49,750 | 1,054 |
| * | Kinetic Concepts Inc. | 11,700 | 800 |
| * | Array Biopharma Inc. | 266,145 | 641 |
| * | Arthrocare Corp. | 19,650 | 592 |
| * | IDEXX Laboratories Inc. | 7,757 | 558 |
| | PDL BioPharma Inc. | 84,500 | 513 |
| *,^ | PharmAthene Inc. | 266,700 | 453 |
| | Computer Programs & Systems Inc. | 7,600 | 388 |
| * | Spectrum Pharmaceuticals Inc. | 31,000 | 344 |
| * | Columbia Laboratories Inc. | 135,500 | 343 |
| * | Hi-Tech Pharmacal Co. Inc. | 8,200 | 291 |
| * | Genomic Health Inc. | 12,692 | 272 |
5
Vanguard® Explorer Fund
Schedule of Investments
October 31, 2011
| | | |
| | | | Market |
| | | | Value |
| | | Shares | ($000) |
| | Atrion Corp. | 1,000 | 225 |
| * | Tornier NV | 6,195 | 144 |
| | | | 1,646,620 |
| Industrials (16.3%) | | |
| * | Genesee & Wyoming Inc. Class A | 1,109,985 | 65,722 |
| | Kennametal Inc. | 1,485,027 | 57,753 |
| * | IHS Inc. Class A | 576,140 | 48,390 |
| | Belden Inc. | 1,364,800 | 44,056 |
| | Triumph Group Inc. | 743,050 | 43,171 |
| | MSC Industrial Direct Co. Class A | 606,005 | 41,214 |
| * | BE Aerospace Inc. | 1,018,842 | 38,441 |
| | Chicago Bridge & Iron Co. NV | 1,046,761 | 38,290 |
| * | Corrections Corp. of America | 1,576,185 | 35,039 |
| * | RBC Bearings Inc. | 833,344 | 33,750 |
| * | Middleby Corp. | 394,485 | 33,247 |
| * | Kansas City Southern | 515,265 | 32,549 |
| * | Teledyne Technologies Inc. | 589,110 | 32,089 |
| | Pentair Inc. | 870,680 | 31,301 |
| | Progressive Waste Solutions Ltd. | 1,448,405 | 30,489 |
| * | AerCap Holdings NV | 2,426,916 | 28,783 |
| | Manpower Inc. | 659,960 | 28,471 |
| | Lennox International Inc. | 798,365 | 25,699 |
| * | EnerSys | 1,132,140 | 25,507 |
| | Knight Transportation Inc. | 1,677,025 | 25,491 |
| | Armstrong World Industries Inc. | 593,995 | 25,298 |
| * | Meritor Inc. | 2,540,125 | 24,182 |
| * | Swift Transportation Co. | 2,570,530 | 22,878 |
| * | US Airways Group Inc. | 3,920,605 | 22,622 |
| | Con-way Inc. | 753,410 | 22,203 |
| | United Stationers Inc. | 686,500 | 21,838 |
| * | Huron Consulting Group Inc. | 605,430 | 21,801 |
| * | Clean Harbors Inc. | 373,639 | 21,772 |
| | Flowserve Corp. | 228,905 | 21,217 |
| * | Navistar International Corp. | 489,610 | 20,598 |
| | Trinity Industries Inc. | 747,895 | 20,395 |
| * | Moog Inc. Class A | 499,506 | 19,346 |
| | AMETEK Inc. | 487,620 | 19,271 |
| * | Beacon Roofing Supply Inc. | 1,022,350 | 18,842 |
| * | Rush Enterprises Inc. Class A | 975,651 | 18,830 |
| | Corporate Executive Board Co. | 485,205 | 17,754 |
| | Landstar System Inc. | 396,530 | 17,697 |
| | UTi Worldwide Inc. | 1,152,235 | 16,834 |
| * | United Rentals Inc. | 699,186 | 16,368 |
| * | Chart Industries Inc. | 287,705 | 16,258 |
| * | Advisory Board Co. | 245,858 | 15,059 |
| * | Stericycle Inc. | 174,815 | 14,611 |
| | ABM Industries Inc. | 722,200 | 14,603 |
| * | AGCO Corp. | 331,250 | 14,519 |
| * | GeoEye Inc. | 426,070 | 14,303 |
| * | TrueBlue Inc. | 1,052,310 | 13,912 |
| | Titan International Inc. | 600,100 | 13,502 |
| | Robbins & Myers Inc. | 294,173 | 13,147 |
| | Woodward Inc. | 378,300 | 12,817 |
| | Watsco Inc. | 198,960 | 12,268 |
| | Donaldson Co. Inc. | 186,380 | 11,938 |
| *,^ | A123 Systems Inc. | 3,461,130 | 11,872 |
| | TAL International Group Inc. | 416,438 | 11,589 |
| * | II-VI Inc. | 593,850 | 11,289 |
| | Gardner Denver Inc. | 139,232 | 10,767 |
| * | DigitalGlobe Inc. | 526,690 | 10,744 |
| * | Esterline Technologies Corp. | 184,700 | 10,325 |
| * | Exponent Inc. | 205,022 | 9,878 |
| * | General Cable Corp. | 340,040 | 9,535 |
| * | Kforce Inc. | 673,626 | 8,595 |
6
Vanguard® Explorer Fund
Schedule of Investments
October 31, 2011
| | | |
| | | | Market |
| | | | Value |
| | | Shares | ($000) |
| * | CAI International Inc. | 478,500 | 7,469 |
| * | Alaska Air Group Inc. | 105,637 | 7,028 |
| * | Korn/Ferry International | 400,000 | 6,388 |
| | Interface Inc. Class A | 483,250 | 6,302 |
| | Robert Half International Inc. | 231,800 | 6,126 |
| * | Old Dominion Freight Line Inc. | 135,450 | 4,953 |
| | HEICO Corp. Class A | 119,888 | 4,713 |
| * | HUB Group Inc. Class A | 138,887 | 4,342 |
| | HEICO Corp. | 66,033 | 3,765 |
| * | Atlas Air Worldwide Holdings Inc. | 89,103 | 3,432 |
| | Waste Connections Inc. | 82,808 | 2,820 |
| * | Flow International Corp. | 1,060,468 | 2,747 |
| * | Hertz Global Holdings Inc. | 229,900 | 2,667 |
| * | Copart Inc. | 56,400 | 2,456 |
| * | WABCO Holdings Inc. | 48,094 | 2,415 |
| | Copa Holdings SA Class A | 34,400 | 2,376 |
| | Heartland Express Inc. | 175,070 | 2,348 |
| | Toro Co. | 41,235 | 2,228 |
| | Towers Watson & Co. Class A | 32,400 | 2,129 |
| | Deluxe Corp. | 89,409 | 2,112 |
| | Healthcare Services Group Inc. | 114,465 | 1,986 |
| | Applied Industrial Technologies Inc. | 58,697 | 1,973 |
| | Hubbell Inc. Class B | 32,400 | 1,937 |
| * | Trimas Corp. | 96,677 | 1,884 |
| | Cubic Corp. | 38,422 | 1,810 |
| | KBR Inc. | 59,509 | 1,661 |
| * | Sauer-Danfoss Inc. | 41,808 | 1,619 |
| * | Avis Budget Group Inc. | 95,000 | 1,339 |
| | Steelcase Inc. Class A | 167,879 | 1,244 |
| * | Furmanite Corp. | 171,400 | 1,143 |
| | Nordson Corp. | 21,182 | 982 |
| | Actuant Corp. Class A | 40,693 | 916 |
| * | Coleman Cable Inc. | 80,700 | 821 |
| * | Generac Holdings Inc. | 32,600 | 745 |
| * | Colfax Corp. | 28,700 | 725 |
| | Textainer Group Holdings Ltd. | 25,574 | 702 |
| * | JetBlue Airways Corp. | 150,000 | 672 |
| | Intersections Inc. | 34,500 | 583 |
| * | DXP Enterprises Inc. | 18,582 | 464 |
| | Standex International Corp. | 10,600 | 409 |
| | AAR Corp. | 19,500 | 389 |
| | Werner Enterprises Inc. | 16,252 | 385 |
| * | Quality Distribution Inc. | 30,900 | 348 |
| * | WESCO International Inc. | 4,861 | 236 |
| | | | 1,494,518 |
| Information Technology (25.1%) | | |
| * | Alliance Data Systems Corp. | 1,028,170 | 105,326 |
| * | VeriFone Systems Inc. | 1,895,905 | 80,026 |
| | Sapient Corp. | 6,082,590 | 75,181 |
| * | Ariba Inc. | 2,314,947 | 73,338 |
| *,3 | TiVo Inc. | 6,112,920 | 66,203 |
| * | Microsemi Corp. | 3,363,335 | 62,087 |
| | MKS Instruments Inc. | 1,956,970 | 52,134 |
| * | Teradyne Inc. | 3,536,920 | 50,649 |
| * | RF Micro Devices Inc. | 6,106,515 | 44,822 |
| * | Rovi Corp. | 892,060 | 44,193 |
| * | MICROS Systems Inc. | 856,771 | 42,170 |
| * | Parametric Technology Corp. | 1,934,346 | 40,292 |
| | Syntel Inc. | 796,225 | 38,935 |
| | j2 Global Communications Inc. | 1,136,950 | 34,995 |
| * | IAC/InterActiveCorp | 854,675 | 34,896 |
| | ADTRAN Inc. | 1,026,535 | 34,492 |
| * | Trimble Navigation Ltd. | 845,635 | 34,172 |
| * | ValueClick Inc. | 1,872,385 | 32,954 |
7
Vanguard® Explorer Fund
Schedule of Investments
October 31, 2011
| | |
| | | Market |
| | | Value |
| | Shares | ($000) |
| * Netlogic Microsystems Inc. | 659,160 | 32,431 |
| * Cardtronics Inc. | 1,274,352 | 31,770 |
| Power Integrations Inc. | 883,815 | 31,490 |
| * F5 Networks Inc. | 302,495 | 31,444 |
| * NICE Systems Ltd. ADR | 865,068 | 30,935 |
| Jabil Circuit Inc. | 1,480,275 | 30,434 |
| * Cadence Design Systems Inc. | 2,727,500 | 30,193 |
| * Take-Two Interactive Software Inc. | 1,852,355 | 29,230 |
| * Atmel Corp. | 2,711,951 | 28,638 |
| * Silicon Laboratories Inc. | 669,620 | 28,626 |
| * Convergys Corp. | 2,652,845 | 28,385 |
| * WebMD Health Corp. | 771,991 | 27,753 |
| * Polycom Inc. | 1,674,065 | 27,672 |
| * Informatica Corp. | 587,688 | 26,740 |
| Factset Research Systems Inc. | 265,950 | 26,441 |
| * Euronet Worldwide Inc. | 1,337,530 | 25,908 |
| * Riverbed Technology Inc. | 935,550 | 25,802 |
| * FEI Co. | 647,370 | 25,739 |
| * SolarWinds Inc. | 883,600 | 25,501 |
| * ON Semiconductor Corp. | 3,304,750 | 25,017 |
| * Fortinet Inc. | 1,084,110 | 25,000 |
| * Celestica Inc. | 2,935,742 | 24,367 |
| * Nuance Communications Inc. | 874,780 | 23,164 |
| Avago Technologies Ltd. | 651,770 | 22,010 |
| Littelfuse Inc. | 449,250 | 21,995 |
| * RightNow Technologies Inc. | 504,600 | 21,703 |
| * CACI International Inc. Class A | 363,200 | 19,936 |
| Maxim Integrated Products Inc. | 757,050 | 19,804 |
| * Concur Technologies Inc. | 423,660 | 19,709 |
| Heartland Payment Systems Inc. | 886,852 | 19,298 |
| * Genpact Ltd. | 1,188,665 | 19,197 |
| * Acme Packet Inc. | 516,885 | 18,716 |
| * TeleTech Holdings Inc. | 1,051,180 | 18,375 |
| * Progress Software Corp. | 865,400 | 18,225 |
| * Red Hat Inc. | 362,800 | 18,013 |
| Black Box Corp. | 626,200 | 17,527 |
| * Varian Semiconductor Equipment Associates Inc. | 270,080 | 16,953 |
| * Acxiom Corp. | 1,275,000 | 16,817 |
| * SuccessFactors Inc. | 621,930 | 16,606 |
| * Digital River Inc. | 826,635 | 15,152 |
| * RADWARE Ltd. | 549,900 | 14,539 |
| * FleetCor Technologies Inc. | 500,228 | 13,986 |
| * Synchronoss Technologies Inc. | 449,600 | 13,515 |
| National Instruments Corp. | 502,838 | 13,431 |
| * LogMeIn Inc. | 322,800 | 13,128 |
| * Sourcefire Inc. | 474,826 | 13,081 |
| Jack Henry & Associates Inc. | 397,850 | 12,894 |
| * BroadSoft Inc. | 351,200 | 12,643 |
| * Kenexa Corp. | 551,032 | 12,602 |
| * Ultimate Software Group Inc. | 208,729 | 12,561 |
| * Entropic Communications Inc. | 2,144,300 | 12,480 |
| * Salesforce.com Inc. | 93,440 | 12,443 |
| * SunPower Corp. Class B | 1,301,236 | 12,297 |
| Cypress Semiconductor Corp. | 637,587 | 12,184 |
| * Cymer Inc. | 280,240 | 12,176 |
| * CommVault Systems Inc. | 255,500 | 10,879 |
| * Travelzoo Inc. | 321,200 | 10,233 |
| FLIR Systems Inc. | 371,140 | 9,761 |
| * Nanometrics Inc. | 551,766 | 9,314 |
| * Gartner Inc. | 220,872 | 8,508 |
| * Aspen Technology Inc. | 481,350 | 8,347 |
| * DealerTrack Holdings Inc. | 365,000 | 7,917 |
| * KIT Digital Inc. | 835,540 | 7,520 |
| * QLIK Technologies Inc. | 257,600 | 7,360 |
8
Vanguard® Explorer Fund
Schedule of Investments
October 31, 2011
| | |
| | | Market |
| | | Value |
| | Shares | ($000) |
| * Super Micro Computer Inc. | 444,527 | 7,112 |
| * Diodes Inc. | 317,775 | 7,109 |
| * Hittite Microwave Corp. | 129,050 | 6,788 |
| * Cavium Inc. | 169,725 | 5,548 |
| * Interactive Intelligence Group | 198,931 | 5,520 |
| Pegasystems Inc. | 135,300 | 5,113 |
| * Mitek Systems Inc. | 470,495 | 4,757 |
| * TIBCO Software Inc. | 120,487 | 3,481 |
| * Volterra Semiconductor Corp. | 140,025 | 3,319 |
| * Finisar Corp. | 154,600 | 3,168 |
| * comScore Inc. | 149,232 | 3,150 |
| * Advent Software Inc. | 108,761 | 2,980 |
| Global Payments Inc. | 63,700 | 2,925 |
| * ANSYS Inc. | 48,700 | 2,647 |
| * NCR Corp. | 136,534 | 2,600 |
| * Manhattan Associates Inc. | 54,038 | 2,289 |
| MAXIMUS Inc. | 56,524 | 2,280 |
| Opnet Technologies Inc. | 51,066 | 2,234 |
| * LSI Corp. | 350,500 | 2,191 |
| * Monolithic Power Systems Inc. | 175,000 | 2,180 |
| * Anixter International Inc. | 34,431 | 2,021 |
| * Lattice Semiconductor Corp. | 319,040 | 2,020 |
| Intersil Corp. Class A | 165,495 | 1,981 |
| DST Systems Inc. | 39,196 | 1,967 |
| * Perficient Inc. | 202,000 | 1,925 |
| * Ixia | 164,975 | 1,869 |
| * Brightpoint Inc. | 174,055 | 1,767 |
| * PROS Holdings Inc. | 110,000 | 1,745 |
| * Booz Allen Hamilton Holding Corp. | 109,741 | 1,735 |
| * Entegris Inc. | 188,200 | 1,686 |
| * Zebra Technologies Corp. | 45,800 | 1,637 |
| * PMC - Sierra Inc. | 255,000 | 1,617 |
| * JDS Uniphase Corp. | 133,495 | 1,602 |
| Daktronics Inc. | 156,200 | 1,578 |
| * Mentor Graphics Corp. | 125,360 | 1,424 |
| * Coherent Inc. | 27,660 | 1,410 |
| * Ancestry.com Inc. | 58,226 | 1,326 |
| * ATMI Inc. | 59,000 | 1,204 |
| * ShoreTel Inc. | 200,000 | 1,170 |
| * Nova Measuring Instruments Ltd. | 150,000 | 1,091 |
| * Netgear Inc. | 26,650 | 945 |
| * Websense Inc. | 51,251 | 914 |
| * Silicon Graphics International Corp. | 55,700 | 805 |
| * Exar Corp. | 112,100 | 685 |
| * Magma Design Automation Inc. | 111,269 | 588 |
| Stamps.com Inc. | 15,500 | 505 |
| * Aviat Networks Inc. | 239,847 | 492 |
| * Ceva Inc. | 8,000 | 249 |
| * Virtusa Corp. | 15,000 | 244 |
| | | 2,298,973 |
| Materials (4.6%) | | |
| Silgan Holdings Inc. | 980,290 | 36,800 |
| * WR Grace & Co. | 800,075 | 33,435 |
| Albemarle Corp. | 563,035 | 30,004 |
| * Graphic Packaging Holding Co. | 6,678,104 | 29,517 |
| * KapStone Paper and Packaging Corp. | 1,613,746 | 26,465 |
| * Smurfit Kappa Group plc | 3,831,103 | 26,102 |
| Sensient Technologies Corp. | 683,345 | 25,256 |
| Ball Corp. | 728,875 | 25,197 |
| Minerals Technologies Inc. | 450,600 | 24,711 |
| * Ferro Corp. | 3,253,855 | 21,053 |
| FMC Corp. | 260,125 | 20,521 |
| Olin Corp. | 1,062,510 | 20,039 |
| CF Industries Holdings Inc. | 112,550 | 18,264 |
9
Vanguard® Explorer Fund
Schedule of Investments
October 31, 2011
| | | | | |
| | | | | | Market |
| | | | | | Value |
| | | | | Shares | ($000) |
| | Schnitzer Steel Industries Inc. | | | 323,250 | 15,128 |
| | Schweitzer-Mauduit International Inc. | | | 185,500 | 13,044 |
| | Aptargroup Inc. | | | 236,120 | 11,327 |
| | Balchem Corp. | | | 291,500 | 10,748 |
| * | Intrepid Potash Inc. | | | 270,400 | 7,525 |
| * | OM Group Inc. | | | 196,812 | 5,690 |
| * | Crown Holdings Inc. | | | 94,775 | 3,203 |
| * | Rockwood Holdings Inc. | | | 60,795 | 2,799 |
| | NewMarket Corp. | | | 13,073 | 2,538 |
| | Worthington Industries Inc. | | | 108,850 | 1,881 |
| * | Hecla Mining Co. | | | 292,700 | 1,835 |
| | Westlake Chemical Corp. | | | 43,300 | 1,784 |
| | Eastman Chemical Co. | | | 43,324 | 1,702 |
| | Innophos Holdings Inc. | | | 21,500 | 946 |
| | Myers Industries Inc. | | | 76,900 | 940 |
| * | Pilot Gold Inc. | | | 592,361 | 885 |
| | Haynes International Inc. | | | 12,650 | 740 |
| * | Horsehead Holding Corp. | | | 40,000 | 347 |
| * | Noranda Aluminum Holding Corp. | | | 37,100 | 344 |
| * | Handy & Harman Ltd. | | | 24,100 | 289 |
| * | Coeur d'Alene Mines Corp. | | | 11,200 | 286 |
| | Airgas Inc. | | | 3,300 | 228 |
| | | | | | 421,573 |
| Telecommunication Services (1.5%) | | | | |
| * | tw telecom inc Class A | | | 1,854,085 | 34,301 |
| * | Vonage Holdings Corp. | | | 10,198,339 | 34,165 |
| * | SBA Communications Corp. Class A | | | 794,048 | 30,245 |
| * | Cogent Communications Group Inc. | | | 1,052,150 | 16,887 |
| | AboveNet Inc. | | | 130,869 | 7,767 |
| * | Clearwire Corp. Class A | | | 3,182,510 | 6,110 |
| | Consolidated Communications Holdings Inc. | | | 71,100 | 1,342 |
| * | MetroPCS Communications Inc. | | | 154,209 | 1,311 |
| | | | | | 132,128 |
| Utilities (0.3%) | | | | |
| | IDACORP Inc. | | | 720,530 | 29,095 |
| |
| |
| Total Common Stocks (Cost $7,639,361) | | | | 8,946,396 |
| |
| |
| | | Coupon | | | |
| |
| Temporary Cash Investments (3.3%)1 | | | | |
| Money Market Fund (2.9%) | | | | |
| 4,5 | Vanguard Market Liquidity Fund | 0.128% | | 268,647,027 | 268,647 |
| |
| |
| | | | | Face | |
| | | | Maturity | Amount | |
| | | | Date | ($000) | |
| Repurchase Agreement (0.2%) | | | | |
| | Deutsche Bank Securities, Inc.(Dated 10/31/11, | | | | |
| | Repurchase Value $21,600,000, collateralized by | | | | |
| | Government National Mortgage Assn. 4.500%, | | | | |
| | 8/20/41) | 0.110% | 11/1/11 | 21,600 | 21,600 |
| |
| U.S. Government and Agency Obligations (0.2%) | | | | |
| 6,7 | Fannie Mae Discount Notes | 0.025% | 12/28/11 | 2,500 | 2,500 |
| 7,8 | Federal Home Loan Bank Discount Notes | 0.025% | 12/2/11 | 3,000 | 3,000 |
| 7,8 | Federal Home Loan Bank Discount Notes | 0.060% | 1/4/12 | 100 | 100 |
10
Vanguard® Explorer Fund
Schedule of Investments
October 31, 2011
| | | | |
| | | | Face | Market |
| | | Maturity | Amount | Value |
| | Coupon | Date | ($000) | ($000) |
| 7,8 Federal Home Loan Bank Discount Notes | 0.040% | 1/27/12 | 10,000 | 9,997 |
| | | | | 15,597 |
| Total Temporary Cash Investments (Cost $305,846) | | | | 305,844 |
| Total Investments (101.1%) (Cost $7,945,207) | | | | 9,252,240 |
| Other Assets and Liabilities—Net (-1.1%)5 | | | | (99,735) |
| Net Assets (100%) | | | | 9,152,505 |
* Non-income-producing security.
^ Part of security position is on loan to broker-dealers. The total value of securities on loan is $58,720,000.
1 The fund invests a portion of its cash reserves in equity markets through the use of index futures contracts. After giving effect to futures
investments, the fund's effective common stock and temporary cash investment positions represent 98.8% and 2.3%, respectively, of net
assets.
2 Considered an affiliated company of the fund as the issuer is another member of The Vanguard Group.
3 Considered an affiliated company of the fund as the fund owns more than 5% of the outstanding voting securities of such company.
4 Affiliated money market fund available only to Vanguard funds and certain trusts and accounts managed by Vanguard. Rate shown is the 7-day
yield.
5 Includes $61,897,000 of collateral received for securities on loan.
6 The issuer is under federal conservatorship and is dependent upon the continued support of the U.S. Treasury to avoid receivership.
7 Securities with a value of $12,598,000 have been segregated as initial margin for open futures contracts.
8 The issuer operates under a congressional charter; its securities are not backed by the full faith and credit of the U.S. government.
ADR—American Depositary Receipt.
11
Report of Independent Registered Public Accounting Firm
To the Trustees and Shareholders of Vanguard Explorer Fund:
We have audited, in accordance with the standards of the Public Company Accounting Oversight Board (United States), the financial statements (not presented herein) of Vanguard Explorer Fund (the "Fund") as of October 31, 2011 and for the year then ended and have issued our unqualified report thereon dated December 12, 2011. Our audit included an audit of the Fund's schedule of investments as of October 31, 2011. This schedule of investments is the responsibility of the Fund's management. Our responsibility is to express an opinion on this schedule of investments based on our audit.
In our opinion, the accompanying schedule of investments referred to above, when read in conjunction with the financial statements of the Fund referred to above, presents fairly, in all material respects, the information set forth therein.
PricewaterhouseCoopers LLP
Philadelphia, PA
December 12, 2011
© 2011 The Vanguard Group. Inc.
All rights reserved.
Vanguard Marketing Corporation, Distributor.
SNA 240_122011
Item 2: Code of Ethics. The Registrant has adopted a code of ethics that applies to the Registrant’s principal executive officer, principal financial officer, principal accounting officer or controller or persons performing similar functions. The Code of Ethics was amended during the reporting period covered by this report to make certain technical, non-material changes.
Item 3: Audit Committee Financial Expert. The following members of the Audit Committee have been determined by the Registrant’s Board of Trustees to be Audit Committee Financial Experts serving on its Audit Committee, and to be independent: Charles D. Ellis, Rajiv L. Gupta, JoAnn Heffernan Heisen, André F. Perold, and Alfred M. Rankin, Jr.
Item 4: Principal Accountant Fees and Services.
(a) Audit Fees.
Audit Fees of the Registrant
Fiscal Year Ended October 31, 2011: $38,000
Fiscal Year Ended October 31, 2010: $37,000
Aggregate Audit Fees of Registered Investment Companies in the Vanguard Group.
Fiscal Year Ended October 31, 2011: $3,978,540
Fiscal Year Ended October 31, 2010: $3,607,060
(b) Audit-Related Fees.
Fiscal Year Ended October 31, 2011: $1,341,750
Fiscal Year Ended October 31, 2010: $791,350
Includes fees billed in connection with assurance and related services provided to the Registrant, The Vanguard Group, Inc., Vanguard Marketing Corporation, and other registered investment companies in the Vanguard Group.
(c) Tax Fees.
Fiscal Year Ended October 31, 2011: $373,830
Fiscal Year Ended October 31, 2010: $336,090
Includes fees billed in connection with tax compliance, planning and advice services provided to the Registrant, The Vanguard Group, Inc., Vanguard Marketing Corporation, and other registered investment companies in the Vanguard Group and related to income and excise taxes.
(d) All Other Fees.
Fiscal Year Ended October 31, 2011: $16,000
Fiscal Year Ended October 31, 2010: $16,000
Includes fees billed for services related to risk management and privacy matters. Services were provided to the Registrant, The Vanguard Group, Inc., Vanguard Marketing Corporation, and other registered investment companies in the Vanguard Group.
(e) (1) Pre-Approval Policies. The policy of the Registrant’s Audit Committee is to consider and, if appropriate, approve before the principal accountant is engaged for such services, all specific audit and non-audit services provided to: (1) the Registrant; (2) The Vanguard Group, Inc.; (3) other entities controlled by The Vanguard Group, Inc. that provide ongoing services to the Registrant; and (4) other registered investment companies in the Vanguard Group. In making a determination, the Audit Committee considers whether the services are consistent with maintaining the principal accountant’s independence.
In the event of a contingency situation in which the principal accountant is needed to provide services in between scheduled Audit Committee meetings, the Chairman of the Audit Committee would be called on to consider and, if appropriate, pre-approve audit or permitted non-audit services in an amount sufficient to complete services through the next Audit Committee meeting, and to determine if such services would be consistent with maintaining the accountant’s independence. At the next scheduled Audit Committee meeting, services and fees would be presented to the Audit Committee for formal consideration, and, if appropriate, approval by the entire Audit Committee. The Audit Committee would again consider whether such services and fees are consistent with maintaining the principal accountant’s independence.
The Registrant’s Audit Committee is informed at least annually of all audit and non-audit services provided by the principal accountant to the Vanguard complex, whether such services are provided to: (1) the Registrant; (2) The Vanguard Group, Inc.; (3) other entities controlled by The Vanguard Group, Inc. that provide ongoing services to the Registrant; or (4) other registered investment companies in the Vanguard Group.
(2) No percentage of the principal accountant’s fees or services were approved pursuant to the waiver provision of paragraph (c)(7)(i)(C) of Rule 2-01 of Regulation S-X.
(f) For the most recent fiscal year, over 50% of the hours worked under the principal accountant’s engagement were not performed by persons other than full-time, permanent employees of the principal accountant.
(g) Aggregate Non-Audit Fees.
Fiscal Year Ended October 31, 2011: $389,830
Fiscal Year Ended October 31, 2010: $352,090
Includes fees billed for non-audit services provided to the Registrant, The Vanguard Group, Inc., Vanguard Marketing Corporation, and other registered investment companies in the Vanguard Group.
(h) For the most recent fiscal year, the Audit Committee has determined that the provision of all non-audit services was consistent with maintaining the principal accountant’s independence.
Item 5: Audit Committee of Listed Registrants.
Not Applicable. Item 6: Investments. Not Applicable.
Item 7: Disclosure of Proxy Voting Policies and Procedures for Closed-End Management Investment Companies.
Not Applicable.
Item 8: Portfolio Managers of Closed-End Management Investment Companies. Not Applicable.
Item 9: Purchase of Equity Securities by Closed-End Management Investment Company and Affiliated Purchasers.
Not Applicable.
Item 10: Submission of Matters to a Vote of Security Holders. Not Applicable.
Item 11: Controls and Procedures.
(a) Disclosure Controls and Procedures. The Principal Executive and Financial Officers concluded that the Registrant's Disclosure Controls and Procedures are effective based on their evaluation of the Disclosure Controls and Procedures as of a date within 90 days of the filing date of this report.
(b) Internal Control Over Financial Reporting. There were no significant changes in Registrant’s Internal Control Over Financial Reporting or in other factors that could significantly affect this control subsequent to the date of the evaluation, including any corrective actions with regard to significant deficiencies and material weaknesses.
Item 12: Exhibits.
(a) Code of Ethics.
(b) Certifications.
Pursuant to the requirements of the Securities Exchange Act of 1934 and the Investment Company Act of 1940, the registrant has duly caused this report to be signed on its behalf by the undersigned, thereunto duly authorized.
| |
| | VANGUARD EXPLORER FUND |
| |
| BY: | /s/ F. WILLIAM MCNABB III* |
| | F. WILLIAM MCNABB III |
| | CHIEF EXECUTIVE OFFICER |
| |
| Date: December 20, 2011 |
Pursuant to the requirements of the Securities Exchange Act of 1934 and the Investment Company Act of 1940, this report has been signed below by the following persons on behalf of the registrant and in the capacities and on the dates indicated.
| |
| | VANGUARD EXPLORER FUND |
| |
| BY: | /s/ F. WILLIAM MCNABB III* |
| | F. WILLIAM MCNABB III |
| | CHIEF EXECUTIVE OFFICER |
| |
| Date: December 20, 2011 |
|
| | VANGUARD EXPLORER FUND |
| |
| BY: | /s/ THOMAS J. HIGGINS* |
| | THOMAS J. HIGGINS |
| | CHIEF FINANCIAL OFFICER |
| |
| Date: December 20, 2011 |
* By: /s/ Heidi Stam
Heidi Stam, pursuant to a Power of Attorney filed on November 28, 2011 see file Number
33-23444, Incorporated by Reference.