UNITED STATES
SECURITIES AND EXCHANGE COMMISSION
Washington, D.C. 20549
FORM N-CSR
CERTIFIED SHAREHOLDER REPORT
OF
REGISTERED MANAGEMENT INVESTMENT COMPANIES
Investment Company Act file number: 811-1530
Name of Registrant: Vanguard Explorer Fund
Address of Registrant:
P.O. Box 2600
Valley Forge, PA 19482
Name and address of agent for service:
Heidi Stam, Esquire
P.O. Box 876
Valley Forge, PA 19482
Registrant’s telephone number, including area code: (610) 669-1000
Date of fiscal year end: October 31
Date of reporting period: November 1, 2009 – October 31, 2010
Item 1: Reports to Shareholders
 |
| Vanguard Explorer™ Fund |
| Annual Report |
|
|
| October 31, 2010 |
|
 |
|
|
|
> For the fiscal year ended October 31, 2010, Vanguard Explorer Fund returned about 28%.
> The fund trailed its benchmark, the Russell 2500 Growth Index, for the period, but slightly outperformed its peer group.
> The fund benefited from positive results in all ten stock sectors, but information technology and consumer discretionary holdings were the biggest contributors to performance.
| |
| Contents | |
| Your Fund’s Total Returns. | 1 |
| Chairman’s Letter. | 2 |
| Advisors’ Report. | 7 |
| Fund Profile. | 12 |
| Performance Summary. | 13 |
| Financial Statements. | 15 |
| Your Fund’s After-Tax Returns. | 29 |
| About Your Fund’s Expenses. | 30 |
| Glossary. | 32 |
Please note: The opinions expressed in this report are just that—informed opinions. They should not be considered promises or advice. Also, please keep in mind that the information and opinions cover the period through the date on the front of this report. Of course, the risks of investing in your fund are spelled out in the prospectus.
See the Glossary for definitions of investment terms used in this report.
Cover photograph: Jean Maher.
Your Fund’s Total Returns
| |
| Fiscal Year Ended October 31, 2010 | |
| | Total |
| | Returns |
| Vanguard Explorer Fund | |
| Investor Shares | 27.74% |
| Admiral™ Shares | 27.98 |
| Russell 2500 Growth Index | 28.76 |
| Small-Cap Growth Funds Average | 27.45 |
Small-Cap Growth Funds Average: Derived from data provided by Lipper Inc.
Admiral Shares carry lower expenses and are available to investors who meet certain account-balance requirements.
| | | | |
| Your Fund’s Performance at a Glance | | | | |
| October 31, 2009, Through October 31, 2010 | | | | |
| | | | Distributions Per Share |
| | Starting | Ending | Income | Capital |
| | Share Price | Share Price | Dividends | Gains |
| Vanguard Explorer Fund | | | | |
| Investor Shares | $51.77 | $66.02 | $0.098 | $0.000 |
| Admiral Shares | 48.21 | 61.50 | 0.175 | 0.000 |
1

Chairman’s Letter
Dear Shareholder,
The fiscal year ended October 31, 2010, was a phenomenal one for small-capitalization stocks, which significantly outperformed their large-cap counterparts. Small-cap growth stocks performed particularly well and led Vanguard Explorer Fund to an impressive gain of about 28% for the period. Despite its strong absolute performance, the fund lagged its benchmark, the Russell 2500 Growth Index, by about 1 percentage point. However, the fund bested the average return of small-cap growth funds for the period.
Please note that in August the Explorer Fund’s board of trustees restructured the fund’s investment advisory team, removing AXA Rosenberg as an advisor and apportioning the assets it had managed to several of the six remaining advisors. The restructuring did not affect the Explorer Fund’s primary investment objective or strategy.
On another topic, in October Vanguard broadened the availability of our Admiral Shares, which typically carry a lower expense ratio than Investor Shares. We reduced the minimum investment for Admiral Shares in most of our actively managed funds from $100,000 to $50,000 as part of our ongoing efforts to lower the cost of investing for our clients.
2
Note: If you own shares of the Explorer Fund in a taxable account, you may wish to review information about the fund’s after-tax returns later in this report.
Stock market performance was better than it felt
Global stock prices rallied at the start of the period, but struggled through the spring and summer, weighed down by Europe’s sovereign debt crisis and the slow pace of economic recovery in the United States. In the fiscal year’s final months, the mood turned. Stock prices climbed on continued strength in corporate earnings. In the United States, stocks also seemed to get a boost from the Federal Reserve Board’s hints that it would try to stimulate the economy with a second round of U.S. Treasury bond purchases. (In early November, the Fed announced that it would buy as much as $600 billion in Treasuries.)
For the 12 months, the broad U.S. stock market returned about 19%, a performance that was better than it felt in a year of ups and downs. Small-capitalization stocks did even better. International stocks returned about 13% on the strength of a powerful rally in emerging markets and solid single-digit gains in developed markets in Europe and the Pacific region.
Despite shrinking yields, bonds attracted investor dollars
Although fixed income yields have fallen to generational lows, investors continued to bid up bond prices. The broad U.S. bond market produced a 12-month return of
| | | |
| Market Barometer | | | |
| |
| | | Average Annual Total Returns |
| | | Periods Ended October 31, 2010 |
| | One | Three | Five |
| | Year | Years | Years |
| Stocks | | | |
| Russell 1000 Index (Large-caps) | 17.67% | -6.14% | 1.99% |
| Russell 2000 Index (Small-caps) | 26.58 | -3.91 | 3.07 |
| Dow Jones U.S. Total Stock Market Index | 19.04 | -5.55 | 2.52 |
| MSCI All Country World Index ex USA (International) | 13.08 | -7.62 | 6.21 |
| |
| Bonds | | | |
| Barclays Capital U.S. Aggregate Bond Index (Broad | | | |
| taxable market) | 8.01% | 7.23% | 6.45% |
| Barclays Capital Municipal Bond Index (Broad | | | |
| tax-exempt market) | 7.78 | 5.79 | 5.20 |
| Citigroup Three-Month U.S. Treasury Bill Index | 0.12 | 0.89 | 2.41 |
| |
| CPI | | | |
| Consumer Price Index | 1.17% | 1.54% | 1.89% |
3
about 8% as the yield of the 10-year U.S. Treasury note fell from 3.39% at the start of the period to 2.61% at the close. Tax-exempt municipal bonds also rallied. Bond prices and yields move in opposite directions, of course, so abundant returns built on rising prices could mean leaner pickings in the years ahead.
The yields of money market securities hovered near 0%, consistent with the Federal Reserve Board’s target for short-term rates.
An impressive year for small-cap growth stocks
Vanguard Explorer Fund invests in small U.S. companies that have the potential to grow. Because it focuses on smaller companies, Explorer’s returns tend to be more volatile than those of funds investing in larger-cap stocks. However, the fund’s use of multiple advisors with diverse strategies, as well as its broad exposure to small-cap growth stocks, can help mitigate the risk that may come from investing in this often-volatile segment of the market.
For the fiscal year ended October 31, small- and mid-sized stocks significantly outperformed the broad market. Within the small-cap arena, growth stocks outperformed their value counterparts. Given this investment environment, the Investor Shares of the Explorer Fund returned 27.74% for the 12 months.
| | | |
| Expense Ratios | | | |
| Your Fund Compared With Its Peer Group | | | |
| | Investor | Admiral | Peer Group |
| | Shares | Shares | Average |
| Explorer Fund | 0.54% | 0.34% | 1.64% |
The fund expense ratios shown are from the prospectus dated October 14, 2010, and represent estimated costs for the current fiscal year. For the fiscal year ended October 31, 2010, the fund’s expense ratios were 0.49% for Investor Shares and 0.32% for Admiral Shares. The peer-group expense ratio is derived from data provided by Lipper Inc. and captures information through year-end 2009.
Peer group: Small-Cap Growth Funds.
4
The fund posted double-digit gains in all sectors of the market. Although its overall return was impressive, the advisors’ stock selection in some sectors hindered the fund’s performance relative to its benchmark.
Information technology was the biggest contributor to the fund’s gain for the year. Explorer’s most heavily weighted sector—which accounted for about 27% of assets, on average, during the period—added more than 9 percentage points to the total return. However, the fund’s tech holdings lagged the sector’s return in the benchmark, as the advisors’ stock selections failed to keep pace. Notable culprits were the fund’s semiconductor stocks, which posted disappointing results.
Improved consumer confidence helped boost consumer stocks across the board, including holdings in hotels, restaurants, providers of luxury goods, and auto parts and equipment firms. Strong stock selection in the health care sector—most notably among health care equipment and biotech-nology firms—also boosted performance. In industrials, equipment and machinery companies rose on news of high demand in emerging markets, most notably China.
Relative to the benchmark index, the fund lost ground in the energy and financial sectors, where the advisors’ selections did not rise as far as the index groups. In energy, holdings in oil and gas exploration and production companies weighed on returns, while in financials, insurance companies were the biggest laggards.
| |
| Total Returns | |
| Ten Years Ended October 31, 2010 | |
| | Average |
| | Annual Return |
| Explorer Fund Investor Shares | 3.58% |
| Russell 2500 Growth Index | 1.49 |
| Small-Cap Growth Funds Average | 0.11 |
| Small-Cap Growth Funds Average: Derived from data provided by Lipper Inc. | |
The figures shown represent past performance, which is not a guarantee of future results. (Current performance may be lower or higher than the performance data cited. For performance data current to the most recent month-end, visit our website at vanguard.com/performance.) Note, too, that both investment returns and principal value can fluctuate widely, so an investor’s shares, when sold, could be worth more or less than their original cost.
5
The fund’s long-term record is solid, despite volatile times
Although it lagged its benchmark index in the past 12 months, Vanguard Explorer Fund remains ahead over the long term. For the ten years ended October 31, the fund’s Investor Shares posted an average annual return of 3.58%, outperforming both the index (+1.49%) and the average return of competing small-cap growth funds (+0.11%) over that period.
Although the fund’s ten-year returns may not seem impressive at first glance, keep in mind the period that they represent. This was a decade in which the stock market experienced giddy highs but also endured steep plunges, not to mention the deepest recession since the Great Depression.
For the period, the fund outperformed the broad U.S. stock market, which returned an average of 1.02% per year.
The Explorer Fund’s solid long-term performance is a tribute to the skill and knowledge of its multiple advisors. As a shareholder, you have also benefited from the fund’s low costs, which allow you to keep more of its returns.
Regardless of market conditions, stay focused on the future
The ups and downs of the stock market seem all too familiar these days. Although this volatility can be nerve-wracking, it’s also a good reminder that you shouldn’t let such unpredictability unduly influence your long-term investment strategy.
Vanguard encourages you to create a plan that includes a mix of stocks, bonds, and short-term investments appropriate for your goals and risk tolerance—and to stick with that plan, regardless of market conditions.
A well-balanced portfolio can help cushion some of the market’s downward swings while allowing you to participate in its long-term potential for growth. With its low costs and broad diversification among small-cap growth stocks, Vanguard Explorer Fund can play an important role in such an investment plan.
Thank you for entrusting your assets to Vanguard.
Sincerely,

F. William McNabb III
Chairman and Chief Executive Officer
November 15, 2010
6
Advisors’ Report
For the 12 months ended October 31, 2010, Vanguard Explorer Fund returned almost 28% for both share classes. Your fund is managed by six independent advisors, a strategy that enhances the fund’s diversification by providing exposure to distinct, yet complementary, investment approaches. It’s not uncommon for different advisors to have different views about individual securities or the broader investment environment.
The table following this report lists the advisors, the amount and percentage of fund assets each manages, and brief descriptions of their investment strategies. The advisors have provided the following assessment of the investment environment during the past 12 months and the notable successes and shortfalls in their portfolios. These comments were prepared on November 16, 2010.
Granahan Investment Management, Inc.
Portfolio Manager:
Jack Granahan, CFA, Managing Partner
Most of this fiscal year’s gain occurred in the first six months, though we did see continuing, albeit more volatile, gains in the latter half. One could read the recent volatility as reflecting summer fears of a double-dip recession being replaced by an initially optimistic interpretation of the latest easing by the Federal Reserve. The fragility of foreign currency relationships remains a challenge internationally, and high unemployment and weak housing conditions remain problems domestically.
On the company level, our portfolio has seen generally strong sales and earnings trends in 2010 as compared with 2009; last year managements produced earnings through effective cost controls, but this year we have seen top-line growth as well. Sales acceleration has been most pronounced in our technology, durables, and, recently, energy sector holdings.
Successes: Six of our nine sectors produced positive performance relative to the benchmark. Technology and health care, our two largest sectors, contributed the most. In technology, performance typically reflected the sector’s strong earnings growth; Acme Packet and Riverbed Technology were leaders. In health care, improving prospects for new products were important, as exemplified by Edwards Lifesciences, Nektar Therapeutics, and Seattle Genetics.
Shortfalls: Poor selection hurt us in the consumer discretionary and financial services sectors. Videogame retailer GameStop, despite market share gain, was hindered by negative psychology associated with digital downloading. We added to our position. In financials, Euronet Worldwide penalized results over the year, though performance improved in recent months as the company’s earnings stabilized in a difficult money-transfer environment; we added to the position.
7
Wellington Management Company, llp
Portfolio Manager:
Kenneth L. Abrams, Senior Vice President
and Equity Portfolio Manager
U.S. equities rebounded in the fiscal year as investors shrugged off concerns about the pace of economic growth. Strong corporate earnings, a rebound in growth in China, and robust merger-and-acquisition activity helped fuel stocks’ more recent rise.
Successes: Our portion of the fund benefited from security selection in the consumer discretionary sector, with positive performance from holdings such as TRW Automotive, Tenneco, and The Cheesecake Factory. TRW and Tenneco, producers of vehicle components, reported better-than-expected results thanks to rebounding global demand. TRW’s management also raised its revenue guidance, citing reduced costs, new business wins, and higher levels of vehicle production.
Shortfalls: Conversely, our primary detractors in the fiscal year were information technology and energy holdings, including Comstock Resources and SunPower. Shares of Comstock declined after the company announced it would not be able to clear its backlog of wells awaiting completion until early 2011, causing a drop in production levels. Despite its technology leadership, SunPower has suffered along with the rest of the solar industry, and recent earnings have continued to disappoint.
Kalmar Investment Advisers
Portfolio Manager:
Ford B. Draper, Jr., President and Chief Investment Officer
The summer market correction turned into a rally as fear of a double-dip recession waned in favor of a vision of continuing slow growth, reinforced by new monetary stimulus from the Federal Reserve. Because overall growth may be challenging, our research has concentrated on companies better able to gain market share and improve margins, thus producing strong differentiated earnings growth.
Successes: Examples of such successful holdings included The Cooper Companies, the worldwide contact lens provider, which benefited from significant improvement in manufacturing efficiency and enhanced market share. Other good performers included Rovi, whose interactive video guides are gaining sales among cable operators and entertainment hardware manufacturers, and O’Reilly Automotive, the well-managed auto parts distributor, which benefited from margin improvement in a large acquisition.
Shortfalls: Problematic holdings have been our natural gas exploration and production companies, which expanded reserves strongly, but suffered from declining gas prices. GameStop, the world’s largest videogame retailer, was also a laggard; the company has recently been threatened by direct-to-consumer Web downloads.
8
Vanguard Quantitative Equity Group
Portfolio Manager:
James D. Troyer, CFA, Principal
The investment environment remained volatile during the fiscal year. A strong first half foundered on the European debt crisis and concerns over future growth in the United States. The Federal Reserve’s quantitative easing program kicked off a strong conclusion to the year in the final two months. Broad, macro themes dominated investor behavior and caused rapid swings in returns. Value-oriented stocks in the Russell 2500 Growth Index lagged growth stocks slightly, while large-capitalization companies underperformed smaller-caps.
Successes: Our quantitative process was successful for the period. Of the five themes in our model, we enjoyed strong performance from our valuation and management-decisions themes and positive results in our quality and growth themes.
Shortfalls: Our market sentiment indicator lagged for the year.
Chartwell Investment Partners, L.P.
Portfolio Managers:
Edward N. Antoian, CFA, CPA, Managing Partner
John A. Heffern, Managing Partner and Senior Portfolio Manager
Investors have become more discerning about quality and growth as domestic and global economies labor along a path of uneven recovery. During the period, valuations normalized for many companies that were badly hurt in the recession, but now the market shows a renewed focus on identifying companies capable of maintaining sales growth and margin expansion into the coming year. The result could be a narrow group of companies leading market performance.
Our research remains oriented toward companies that executed well during the latest period of turbulence, emerged with stronger franchises and enhanced profit margins, and are well positioned to maintain distance from competitors over time. These are the key characteristics of our time-tested, bottom-up approach to small- and mid-cap growth investing.
9
Successes: Stock selection within business services and technology added value, along with an overweighted position in technology. IT services stocks (VanceInfo Technologies and Sapient) were especially strong. NetApp, a data management and storage solutions provider, also outperformed.
Shortfalls: The only sectors that materially detracted from performance were consumer and financial services. Stock selection disappointed in consumer services, namely in recreational products (WMS Industries) and department stores (Kohl’s). Overweighted exposure in financials hurt performance.
Century Capital Management, LLC
Portfolio Manager:
Alexander L. Thorndike, Chief Investment Officer and Managing Partner
The stock market extended its move to the upside. There was a tug of war along the way, with improving economic and company fundamentals on one side versus concerns about unemployment, debt-related stress points in Europe, and the longer-term strength of the economic
recovery on the other. Most of the economic data released recently has reinforced the notion that the economy is growing, albeit very slowly, calming concerns about the possibility of a double-dip recession. The Federal Reserve’s August announcement that it would try to bolster the economy by buying long-term Treasury bonds was a catalyst for stocks.
Successes: Consumer discretionary was our best-performing sector for the period, led by priceline.com and Monro Muffler Brake. Health care stocks also contributed, particularly Bruker and SXC Health Solutions.
Shortfalls: Materials and telecommunication services were our weakest sectors for the period. Detractors included Schnitzer Steel Industries, Greif, and Neutral Tandem.
10
| | | |
| Vanguard Explorer Fund Investment Advisors | |
| |
| | Fund Assets Managed | |
| Investment Advisor | % | $ Million | Investment Strategy |
| Granahan Investment | 28 | 2,527 | Bases its investment process on the beliefs that |
| Management, Inc. | | | earnings drive stock prices and that small, dynamic |
| | | | companies with exceptional growth prospects have the |
| | | | greatest long-term potential. A bottom-up, fundamental |
| | | | approach places companies in one of three life-cycle |
| | | | categories: pioneer, core growth, and special situation. |
| | | | In each, the process looks for companies with strong |
| | | | earnings growth potential and leadership in their |
| | | | markets. |
| Wellington Management | 22 | 2,035 | Conducts research and analysis of individual |
| Company, LLP | | | companies to select stocks believed to have |
| | | | exceptional growth potential relative to their market |
| | | | valuations. Each stock is considered individually before |
| | | | purchase, and company developments are continually |
| | | | monitored for comparison with expectations for |
| | | | growth. |
| Kalmar Investment Advisers | 20 | 1,850 | Employs a “growth with value” strategy using creative, |
| | | | bottom-up research to uncover vigorously growing, |
| | | | high-quality businesses whose stocks can also be |
| | | | bought inefficiently valued. The strategy has a dual |
| | | | objective of strong returns with lower risk. |
| Vanguard Quantitative Equity | 10 | 870 | Employs a quantitative fundamental management |
| Group | | | approach, using models that assess valuation, growth |
| | | | prospects, management decisions, market sentiment, |
| | | | and earnings quality of companies as compared with |
| | | | their peers. |
| Chartwell Investment Partners, | 9 | 851 | Uses a bottom-up, fundamental, research-driven |
| L.P. | | | stock-selection strategy focusing on companies with |
| | | | sustainable growth, strong management teams, |
| | | | competitive positions, and outstanding product and |
| | | | service offerings. These companies should continually |
| | | | demonstrate growth in earnings per share. |
| Century Capital Management, | 9 | 792 | Employs a fundamental, bottom-up approach that |
| LLC | | | attempts to identify reasonably priced companies that |
| | | | will grow faster than the overall market. Companies |
| | | | also must have a superior return on equity, high |
| | | | recurring revenues, and improving margins. |
| Cash Investments | 2 | 228 | These short-term reserves are invested by Vanguard in |
| | | | equity index products to simulate investment in stocks. |
| | | | Each advisor also may maintain a modest cash |
| | | | position. |
11
Explorer Fund
Fund Profile
As of October 31, 2010
| | |
| Share-Class Characteristics | |
| | Investor | Admiral |
| | Shares | Shares |
| Ticker Symbol | VEXPX | VEXRX |
| Expense Ratio1 | 0.54% | 0.34% |
| 30-Day SEC Yield | 0.00% | 0.16% |
| | | |
| Portfolio Characteristics | | |
| | | Russell | DJ |
| | | 2500 | U.S. Total |
| | | Growth | Market |
| | Fund | Index | Index |
| Number of Stocks | 661 | 1,564 | 3,920 |
| Median Market Cap | $2.1B | $2.2B | $28.5B |
| Price/Earnings Ratio | 24.6x | 26.5x | 16.9x |
| Price/Book Ratio | 2.6x | 3.4x | 2.2x |
| Return on Equity | 12.8% | 14.4% | 19.2% |
| Earnings Growth Rate | 10.0% | 8.7% | 6.5% |
| Dividend Yield | 0.5% | 0.6% | 1.8% |
| Foreign Holdings | 4.1% | 0.0% | 0.0% |
| Turnover Rate | 82% | — | — |
| Short-Term Reserves | 2.4% | — | — |
| | | |
| Sector Diversification (% of equity exposure) |
| | | Russell | DJ |
| | | 2500 | U.S. Total |
| | | Growth | Market |
| | Fund | Index | Index |
| Consumer | | | |
| Discretionary | 15.3% | 19.2% | 11.8% |
| Consumer Staples | 3.2 | 2.8 | 10.0 |
| Energy | 4.6 | 4.6 | 9.8 |
| Financials | 7.1 | 7.1 | 16.3 |
| Health Care | 18.3 | 15.8 | 11.0 |
| Industrials | 17.8 | 17.7 | 11.1 |
| Information | | | |
| Technology | 27.3 | 23.9 | 19.4 |
| Materials | 4.3 | 6.8 | 4.4 |
| Telecommunication | | | |
| Services | 1.3 | 1.8 | 2.8 |
| Utilities | 0.8 | 0.3 | 3.4 |
| | |
| Volatility Measures | | |
| | | DJ |
| | | U.S. Total |
| | Russell 2500 | Market |
| | Growth Index | Index |
| R-Squared | 1.00 | 0.94 |
| Beta | 0.95 | 1.12 |
These measures show the degree and timing of the fund’s fluctuations compared with the indexes over 36 months.
| | |
| Ten Largest Holdings (% of total net assets) |
| Kennametal Inc. | Industrial | |
| | Machinery | 0.9% |
| Bruker Corp. | Life Sciences Tools | |
| | & Services | 0.8 |
| TiVo Inc. | Application | |
| | Software | 0.7 |
| Cooper Cos. Inc. | Health Care | |
| | Supplies | 0.7 |
| O'Reilly Automotive Inc. | Automotive Retail | 0.7 |
| WMS Industries Inc. | Casinos & Gaming | 0.7 |
| Sapient Corp. | IT Consulting & | |
| | Other Services | 0.6 |
| MICROS Systems Inc. | Systems Software | 0.6 |
| Rovi Corp. | Systems Software | 0.6 |
| Alliance Data Systems, | Data Processing & | |
| Corp. | Outsourced | |
| | Services | 0.6 |
| Top Ten | | 6.9% |
The holdings listed exclude any temporary cash investments and equity index products.
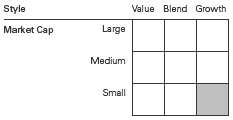
Investment Focus
1 The expense ratios shown are from the prospectus dated October 14, 2010, and represent estimated costs for the current fiscal year. For the fiscal year ended October 31, 2010, the expense ratios were 0.49% for Investor Shares and 0.32% for Admiral Shares.
12
Explorer Fund
Performance Summary
All of the returns in this report represent past performance, which is not a guarantee of future results that may be achieved by the fund. (Current performance may be lower or higher than the performance data cited. For performance data current to the most recent month-end, visit our website at vanguard.com/performance.) Note, too, that both investment returns and principal value can fluctuate widely, so an investor’s shares, when sold, could be worth more or less than their original cost. The returns shown do not reflect taxes that a shareholder would pay on fund distributions or on the sale of fund shares.
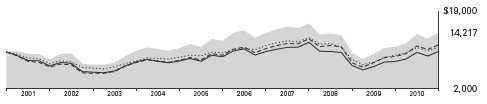
Cumulative Performance: October 31, 2000, Through October 31, 2010
Initial Investment of $10,000
| | | | | |
| | | Average Annual Total Returns | |
| | | Periods Ended October 31, 2010 | |
| | | | | | Final Value |
| | | One | Five | Ten | of a $10,000 |
| | | Year | Years | Years | Investment |
| | Explorer Fund Investor Shares | 27.74% | 2.76% | 3.58% | $14,217 |
| •••••••• | Dow Jones U.S. Total Stock Market | | | | |
| | Index | 19.04 | 2.52 | 1.02 | 11,073 |
| – – – – | Russell 2500 Growth Index | 28.76 | 4.55 | 1.49 | 11,594 |
| | Small-Cap Growth Funds Average | 27.45 | 2.49 | 0.11 | 10,114 |
| Small-Cap Growth Funds Average: Derived from data provided by Lipper Inc. | | | |
| | | | |
| | | | Since | Final Value |
| | One | Five | Inception | of a $50,000 |
| | Year | Years | (11/12/2001) | Investment |
| Explorer Fund Admiral Shares | 27.98% | 2.94% | 5.81% | $82,953 |
| Dow Jones U.S. Total Stock Market | | | | |
| Index | 19.04 | 2.52 | 3.95 | 70,752 |
| Russell 2500 Growth Index | 28.76 | 4.55 | 5.89 | 83,516 |
| "Since Inception" performance is calculated from the Admiral Shares’ inception date for both the fund and its comparative standards. |
See Financial Highlights for dividend and capital gains information.
13
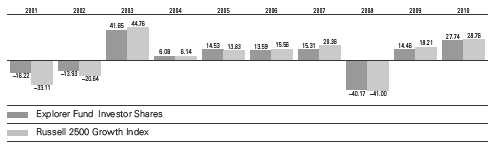
Explorer Fund
Fiscal-Year Total Returns (%): October 31, 2000, Through October 31, 2010
Average Annual Total Returns: Periods Ended September 30, 2010
This table presents average annual total returns through the latest calendar quarter—rather than through the end of the fiscal period. Securities and Exchange Commission rules require that we provide this information.
| | | | |
| | Inception | One | Five | Ten |
| | Date | Year | Years | Years |
| Investor Shares | 12/11/1967 | 15.96% | 1.36% | 2.82% |
| Admiral Shares | 11/12/2001 | 16.17 | 1.54 | 5.411 |
| 1 Return since inception. | | | | |
14
Explorer Fund
Financial Statements
Statement of Net Assets—Investments Summary
As of October 31, 2010
This Statement summarizes the fund’s holdings by asset type. Details are reported for each of the fund’s 50 largest individual holdings and for investments that, in total for any issuer, represent more than 1% of the fund’s net assets. The total value of smaller holdings is reported as a single amount within each category.
The fund reports a complete list of its holdings in regulatory filings four times in each fiscal year, at the quarter-ends. For the second and fourth fiscal quarters, the complete listing of the fund’s holdings is available electronically on vanguard.com and on the Securities and Exchange Commission’s website (sec.gov), or you can have it mailed to you without charge by calling 800-662-7447. For the first and third fiscal quarters, the fund files the lists with the SEC on Form N-Q. Shareholders can look up the fund’s Forms N-Q on the SEC’s website. Forms N-Q may also be reviewed and copied at the SEC’s Public Reference Room (see the back cover of this report for further information).
| | | | |
| | | | Market | Percentage |
| | | | Value | of Net |
| | | Shares | ($000) | Assets |
| Common Stocks | | | |
| Consumer Discretionary | | | |
| * | O’Reilly Automotive Inc. | 1,044,657 | 61,112 | 0.7% |
| * | WMS Industries Inc. | 1,374,959 | 59,989 | 0.7% |
| * | LKQ Corp. | 2,220,820 | 48,281 | 0.5% |
| * | GameStop Corp. Class A | 2,114,815 | 41,577 | 0.5% |
| | Williams-Sonoma Inc. | 1,263,499 | 40,899 | 0.4% |
| * | DreamWorks Animation SKG Inc. Class A | 1,111,200 | 39,225 | 0.4% |
| | DeVry Inc. | 789,395 | 37,780 | 0.4% |
| * | Life Time Fitness Inc. | 1,034,865 | 37,390 | 0.4% |
| | Cinemark Holdings Inc. | 2,086,900 | 36,625 | 0.4% |
| * | CarMax Inc. | 1,142,970 | 35,421 | 0.4% |
| | Consumer Discretionary—Other † | | 886,402 | 9.7% |
| | | | 1,324,701 | 14.5% |
| Consumer Staples | | | |
| | Ruddick Corp. | 1,338,260 | 46,705 | 0.5% |
| | Herbalife Ltd. | 728,035 | 46,492 | 0.5% |
| | Consumer Staples—Other † | | 185,822 | 2.0% |
| | | | 279,019 | 3.0% |
| |
| Energy † | | 390,607 | 4.3% |
| |
| Exchange-Traded Funds | | | |
| ^,1 | Vanguard Small-Cap ETF | 1,165,083 | 76,930 | 0.8% |
| ^ | iShares Russell 2000 Index Fund | 864,155 | 60,759 | 0.7% |
| ^,1 | Vanguard Small-Cap Growth ETF | 713,200 | 49,860 | 0.5% |
| | | | 187,549 | 2.0% |
| |
| Financials † | | 588,403 | 6.4% |
| |
| Health Care | | | |
| * | Bruker Corp. | 4,825,343 | 72,332 | 0.8% |
| | Cooper Cos. Inc. | 1,265,010 | 62,416 | 0.7% |
15
Explorer Fund
| | | | |
| | | | Market | Percentage |
| | | | Value | of Net |
| | | Shares | ($000) | Assets |
| * | Mettler-Toledo International Inc. | 395,504 | 51,637 | 0.6% |
| * | ResMed Inc. | 1,440,450 | 45,907 | 0.5% |
| * | Coventry Health Care Inc. | 1,939,501 | 45,423 | 0.5% |
| * | Nektar Therapeutics | 3,095,206 | 45,097 | 0.5% |
| * | Seattle Genetics Inc. | 2,688,254 | 44,060 | 0.5% |
| * | Regeneron Pharmaceuticals Inc. | 1,491,700 | 38,904 | 0.4% |
| * | Health Management Associates Inc. Class A | 4,459,300 | 35,719 | 0.4% |
| | DENTSPLY International Inc. | 1,134,100 | 35,599 | 0.4% |
| *,2 | ABIOMED Inc. | 1,949,700 | 20,101 | 0.2% |
| | Health Care—Other † | | 1,102,505 | 12.0% |
| | | | 1,599,700 | 17.5% |
| Industrials | | | |
| | Kennametal Inc. | 2,424,655 | 82,778 | 0.9% |
| | MSC Industrial Direct Co. Class A | 832,805 | 47,420 | 0.5% |
| * | Genesee & Wyoming Inc. Class A | 960,130 | 44,387 | 0.5% |
| *,2 | Beacon Roofing Supply Inc. | 2,637,676 | 38,932 | 0.4% |
| * | Stericycle Inc. | 530,255 | 38,040 | 0.4% |
| | Watsco Inc. | 678,810 | 37,993 | 0.4% |
| | AMETEK Inc. | 655,565 | 35,433 | 0.4% |
| | Industrials—Other † | | 1,223,825 | 13.4% |
| | | | 1,548,808 | 16.9% |
| Information Technology | | | |
| * | TiVo Inc. | 5,805,460 | 64,673 | 0.7% |
| | Sapient Corp. | 4,512,947 | 59,390 | 0.7% |
| * | MICROS Systems Inc. | 1,297,555 | 58,896 | 0.7% |
| * | Rovi Corp. | 1,151,635 | 58,330 | 0.6% |
| *,^ | Alliance Data Systems Corp. | 918,861 | 55,793 | 0.6% |
| * | VeriFone Systems Inc. | 1,509,665 | 51,072 | 0.6% |
| * | Netlogic Microsystems Inc. | 1,650,518 | 49,615 | 0.6% |
| * | Microsemi Corp. | 2,435,885 | 48,718 | 0.5% |
| * | Ariba Inc. | 2,554,496 | 47,973 | 0.5% |
| * | Polycom Inc. | 1,414,180 | 47,771 | 0.5% |
| * | Teradyne Inc. | 4,175,583 | 46,934 | 0.5% |
| * | Informatica Corp. | 1,085,936 | 44,187 | 0.5% |
| * | Trimble Navigation Ltd. | 1,113,280 | 39,900 | 0.4% |
| * | NICE Systems Ltd. ADR | 1,180,946 | 39,550 | 0.4% |
| * | Atmel Corp. | 4,349,345 | 38,535 | 0.4% |
| * | Parametric Technology Corp. | 1,768,735 | 37,975 | 0.4% |
| * | Compellent Technologies Inc. | 1,455,220 | 36,773 | 0.4% |
| * | WebMD Health Corp. | 681,241 | 35,615 | 0.4% |
| | Information Technology—Other † | | 1,526,026 | 16.7% |
| | | | 2,387,726 | 26.1% |
| Materials | | | |
| | Sensient Technologies Corp. | 1,640,300 | 52,998 | 0.6% |
| | Albemarle Corp. | 866,370 | 43,431 | 0.5% |
| | Silgan Holdings Inc. | 1,059,800 | 35,768 | 0.4% |
| | Materials—Other † | | 241,073 | 2.6% |
| | | | 373,270 | 4.1% |
| |
| Telecommunication Services † | | 113,384 | 1.2% |
| |
| Utilities † | | 61,137 | 0.7% |
| Total Common Stocks (Cost $7,141,277) | | 8,854,304 | 96.7%3 |
16
Explorer Fund
| | | | |
| | | | Market | Percentage |
| | | | Value | of Net |
| | Coupon | Shares | ($000) | Assets |
| Temporary Cash Investments | | | | |
| Money Market Fund | | | | |
| 4,5 Vanguard Market Liquidity Fund | 0.237% | 393,493,446 | 393,493 | 4.3% |
| |
| Repurchase Agreement † | | | 9,700 | 0.1% |
| |
| 6 U.S. Government and Agency Obligations † | | | 32,972 | 0.4% |
| Total Temporary Cash Investments (Cost $436,155) | | | 436,165 | 4.8%3 |
| Total Investments (Cost $7,577,432) | | | 9,290,469 | 101.5% |
| Other Assets and Liabilities | | | | |
| Other Assets | | | 141,509 | 1.5% |
| Liabilities5 | | | (278,659) | (3.0%) |
| | | | (137,150) | (1.5%) |
| Net Assets | | | 9,153,319 | 100.0% |
17
Explorer Fund
| |
| At October 31, 2010, net assets consisted of: | |
| | Amount |
| | ($000) |
| Paid-in Capital | 9,008,516 |
| Overdistributed Net Investment Income | (1,300) |
| Accumulated Net Realized Losses | (1,571,963) |
| Unrealized Appreciation (Depreciation) | |
| Investment Securities | 1,713,037 |
| Futures Contracts | 5,029 |
| Net Assets | 9,153,319 |
| |
| Investor Shares—Net Assets | |
| Applicable to 95,267,571 outstanding $.001 par value shares of | |
| beneficial interest (unlimited authorization) | 6,289,699 |
| Net Asset Value Per Share—Investor Shares | $66.02 |
| |
| Admiral Shares—Net Assets | |
| Applicable to 46,563,354 outstanding $.001 par value shares of | |
| beneficial interest (unlimited authorization) | 2,863,620 |
| Net Asset Value Per Share—Admiral Shares | $61.50 |
See Note A in Notes to Financial Statements.
* Non-income-producing security.
^ Part of security position is on loan to broker-dealers. The total value of securities on loan is $115,387,000.
† Represents the aggregate value, by category, of securities that are not among the 50 largest holdings and, in total for any issuer, represent 1% or less of net assets.
1 Considered an affiliated company of the fund as the issuer is another member of The Vanguard Group.
2 Considered an affiliated company of the fund as the fund owns more than 5% of the outstanding voting securities of such company.
3 The fund invests a portion of its cash reserves in equity markets through the use of index futures contracts. After giving effect to futures investments, the fund’s effective common stock and temporary cash investment positions represent 97.8% and 3.7%, respectively, of net assets.
4 Affiliated money market fund available only to Vanguard funds and certain trusts and accounts managed by Vanguard. Rate shown is the 7-day yield.
5 Includes $118,966,000 of collateral received for securities on loan.
6 Securities with a value of $32,972,000 have been segregated as initial margin for open futures contracts.
ADR—American Depositary Receipt.
See accompanying Notes, which are an integral part of the Financial Statements.
18
Explorer Fund
| |
| Statement of Operations | |
| |
| | Year Ended |
| | October 31, 2010 |
| | ($000) |
| Investment Income | |
| Income | |
| Dividends1,2 | 55,617 |
| Interest2 | 772 |
| Security Lending | 3,663 |
| Total Income | 60,052 |
| Expenses | |
| Investment Advisory Fees—Note B | |
| Basic Fee | 17,577 |
| Performance Adjustment | (1,184) |
| The Vanguard Group—Note C | |
| Management and Administrative—Investor Shares | 17,104 |
| Management and Administrative—Admiral Shares | 2,567 |
| Marketing and Distribution—Investor Shares | 1,393 |
| Marketing and Distribution—Admiral Shares | 608 |
| Custodian Fees | 215 |
| Auditing Fees | 37 |
| Shareholders’ Reports—Investor Shares | 128 |
| Shareholders’ Reports—Admiral Shares | 53 |
| Trustees’ Fees and Expenses | 18 |
| Total Expenses | 38,516 |
| Expenses Paid Indirectly | (347) |
| Net Expenses | 38,169 |
| Net Investment Income | 21,883 |
| Realized Net Gain (Loss) | |
| Investment Securities Sold2 | 650,468 |
| Futures Contracts | 15,805 |
| Foreign Currencies | (185) |
| Realized Net Gain (Loss) | 666,088 |
| Change in Unrealized Appreciation (Depreciation) | |
| Investment Securities | 1,399,322 |
| Futures Contracts | 7,315 |
| Foreign Currencies | (5) |
| Change in Unrealized Appreciation (Depreciation) | 1,406,632 |
| Net Increase (Decrease) in Net Assets Resulting from Operations | 2,094,603 |
1 Dividends are net of foreign withholding taxes of $118,000.
2 Dividend income, interest income, and realized net gain (loss) from affiliated companies of the fund were $916,000, $687,000, and ($581,000), respectively.
See accompanying Notes, which are an integral part of the Financial Statements.
19
Explorer Fund
| | |
| Statement of Changes in Net Assets | | |
| |
| | Year Ended October 31, |
| | 2010 | 2009 |
| | ($000) | ($000) |
| Increase (Decrease) in Net Assets | | |
| Operations | | |
| Net Investment Income | 21,883 | 30,983 |
| Realized Net Gain (Loss) | 666,088 | (1,403,808) |
| Change in Unrealized Appreciation (Depreciation) | 1,406,632 | 2,384,574 |
| Net Increase (Decrease) in Net Assets Resulting from Operations | 2,094,603 | 1,011,749 |
| Distributions | | |
| Net Investment Income | | |
| Investor Shares | (10,678) | (31,118) |
| Admiral Shares | (7,955) | (17,117) |
| Realized Capital Gain | | |
| Investor Shares | — | — |
| Admiral Shares | — | — |
| Total Distributions | (18,633) | (48,235) |
| Capital Share Transactions | | |
| Investor Shares | (865,430) | (49,810) |
| Admiral Shares | 13,342 | (33,340) |
| Net Increase (Decrease) from Capital Share Transactions | (852,088) | (83,150) |
| Total Increase (Decrease) | 1,223,882 | 880,364 |
| Net Assets | | |
| Beginning of Period | 7,929,437 | 7,049,073 |
| End of Period1 | 9,153,319 | 7,929,437 |
| 1 Net Assets—End of Period includes undistributed (overdistributed) net investment income of ($1,300,000) and ($4,365,000). | |
See accompanying Notes, which are an integral part of the Financial Statements.
20
Explorer Fund
Financial Highlights
| | | | | |
| Investor Shares | | | | | |
| |
| For a Share Outstanding | | | Year Ended October 31, |
| Throughout Each Period | 2010 | 2009 | 2008 | 2007 | 2006 |
| Net Asset Value, Beginning of Period | $51.77 | $45.54 | $83.93 | $80.26 | $76.67 |
| Investment Operations | | | | | |
| Net Investment Income | .109 | .178 | .295 | .362 | .302 |
| Net Realized and Unrealized Gain (Loss) | | | | | |
| on Investments | 14.239 | 6.334 | (31.589) | 11.052 | 9.724 |
| Total from Investment Operations | 14.348 | 6.512 | (31.294) | 11.414 | 10.026 |
| Distributions | | | | | |
| Dividends from Net Investment Income | (.098) | (.282) | (.310) | (.320) | (.230) |
| Distributions from Realized Capital Gains | — | — | (6.786) | (7.424) | (6.206) |
| Total Distributions | (.098) | (.282) | (7.096) | (7.744) | (6.436) |
| Net Asset Value, End of Period | $66.02 | $51.77 | $45.54 | $83.93 | $80.26 |
| |
| Total Return1 | 27.74% | 14.46% | -40.17% | 15.31% | 13.59% |
| |
| Ratios/Supplemental Data | | | | | |
| Net Assets, End of Period (Millions) | $6,290 | $5,677 | $5,026 | $8,937 | $8,517 |
| Ratio of Total Expenses to | | | | | |
| Average Net Assets2 | 0.49% | 0.54% | 0.44% | 0.41% | 0.46% |
| Ratio of Net Investment Income to | | | | | |
| Average Net Assets | 0.19% | 0.38% | 0.40% | 0.44% | 0.36% |
| Portfolio Turnover Rate | 82% | 95% | 112% | 90% | 96% |
1 Total returns do not include account service fees that may have applied in the periods shown. Fund prospectuses provide information about any applicable account service fees.
2 Includes performance-based investment advisory fee increases (decreases) of (0.01%), (0.01%), (0.02%), (0.04%), and (0.03%).
See accompanying Notes, which are an integral part of the Financial Statements.
21
Explorer Fund
Financial Highlights
| | | | | |
| Admiral Shares | | | | | |
| |
| For a Share Outstanding | | | Year Ended October 31, |
| Throughout Each Period | 2010 | 2009 | 2008 | 2007 | 2006 |
| Net Asset Value, Beginning of Period | $48.21 | $42.45 | $78.25 | $74.82 | $71.47 |
| Investment Operations | | | | | |
| Net Investment Income | .206 | .246 | .385 | .478 | .422 |
| Net Realized and Unrealized Gain (Loss) | | | | | |
| on Investments | 13.259 | 5.881 | (29.442) | 10.299 | 9.050 |
| Total from Investment Operations | 13.465 | 6.127 | (29.057) | 10.777 | 9.472 |
| Distributions | | | | | |
| Dividends from Net Investment Income | (.175) | (.367) | (.427) | (.437) | (.346) |
| Distributions from Realized Capital Gains | — | — | (6.316) | (6.910) | (5.776) |
| Total Distributions | (.175) | (.367) | (6.743) | (7.347) | (6.122) |
| Net Asset Value, End of Period | $61.50 | $48.21 | $42.45 | $78.25 | $74.82 |
| |
| Total Return | 27.98% | 14.66% | -40.07% | 15.53% | 13.79% |
| |
| Ratios/Supplemental Data | | | | | |
| Net Assets, End of Period (Millions) | $2,864 | $2,252 | $2,023 | $3,652 | $3,264 |
| Ratio of Total Expenses to | | | | | |
| Average Net Assets1 | 0.32% | 0.34% | 0.26% | 0.23% | 0.28% |
| Ratio of Net Investment Income to | | | | | |
| Average Net Assets | 0.36% | 0.58% | 0.58% | 0.62% | 0.54% |
| Portfolio Turnover Rate | 82% | 95% | 112% | 90% | 96% |
| 1 Includes performance-based investment advisory fee increases (decreases) of (0.01%), (0.01%), (0.02%), (0.04%), and (0.03%). | |
See accompanying Notes, which are an integral part of the Financial Statements.
22
Explorer Fund
Notes to Financial Statements
Vanguard Explorer Fund is registered under the Investment Company Act of 1940 as an open-end investment company, or mutual fund. The fund offers two classes of shares: Investor Shares and Admiral Shares. Investor Shares are available to any investor who meets the fund’s minimum purchase requirements. Admiral Shares are designed for investors who meet certain administrative, service, and account-size criteria.
A. The following significant accounting policies conform to generally accepted accounting principles for U.S. mutual funds. The fund consistently follows such policies in preparing its financial statements.
1. Security Valuation: Securities are valued as of the close of trading on the New York Stock Exchange (generally 4 p.m., Eastern time) on the valuation date. Equity securities are valued at the latest quoted sales prices or official closing prices taken from the primary market in which each security trades; such securities not traded on the valuation date are valued at the mean of the latest quoted bid and asked prices. Securities for which market quotations are not readily available, or whose values have been affected by events occurring before the fund’s pricing time but after the close of the securities’ primary markets, are valued at their fair values calculated according to procedures adopted by the board of trustees. These procedures include obtaining quotations from an independent pricing service, monitoring news to identify significant market- or security-specific events, and evaluating changes in the va lues of foreign market proxies (for example, ADRs, futures contracts, or exchange-traded funds), between the time the foreign markets close and the fund’s pricing time. When fair-value pricing is employed, the prices of securities used by a fund to calculate its net asset value may differ from quoted or published prices for the same securities. Investments in Vanguard Market Liquidity Fund are valued at that fund’s net asset value. Temporary cash investments acquired over 60 days to maturity are valued using the latest bid prices or using valuations based on a matrix system (which considers such factors as security prices, yields, maturities, and ratings), both as furnished by independent pricing services. Other temporary cash investments are valued at amortized cost, which approximates market value.
2. Foreign Currency: Securities and other assets and liabilities denominated in foreign currencies are translated into U.S. dollars using exchange rates obtained from an independent third party as of the fund’s pricing time on the valuation date. Realized gains (losses) and unrealized appreciation (depreciation) on investment securities include the effects of changes in exchange rates since the securities were purchased, combined with the effects of changes in security prices. Fluctuations in the value of other assets and liabilities resulting from changes in exchange rates are recorded as unrealized foreign currency gains (losses) until the assets or liabilities are settled in cash, at which time they are recorded as realized foreign currency gains (losses).
3. Futures Contracts: The fund uses index futures contracts to a limited extent, with the objective of maintaining full exposure to the stock market while maintaining liquidity. The fund may purchase or sell futures contracts to achieve a desired level of investment, whether to accommodate portfolio turnover or cash flows from capital share transactions. The primary risks associated with the use of futures contracts are imperfect correlation between changes in market values of stocks held by the fund and the prices of futures contracts, and the possibility of an illiquid market.
Futures contracts are valued at their quoted daily settlement prices. The aggregate principal amounts of the contracts are not recorded in the Statement of Net Assets. Fluctuations in the value of the contracts are recorded in the Statement of Net Assets as an asset (liability) and in the Statement of Operations as unrealized appreciation (depreciation) until the contracts are closed, when they are recorded as realized futures gains (losses).
23
Explorer Fund
4. Repurchase Agreements: The fund invests in repurchase agreements. Securities pledged as collateral for repurchase agreements are held by a custodian bank until the agreements mature. Each agreement requires that the market value of the collateral be sufficient to cover payments of interest and principal; however, in the event of default or bankruptcy by the other party to the agreement, retention of the collateral may be subject to legal proceedings.
5. Federal Income Taxes: The fund intends to continue to qualify as a regulated investment company and distribute all of its taxable income. Management has analyzed the fund’s tax positions taken for all open federal income tax years (October 31, 2007–2010), and has concluded that no provision for federal income tax is required in the fund’s financial statements.
6. Distributions: Distributions to shareholders are recorded on the ex-dividend date.
7. Security Lending: The fund may lend its securities to qualified institutional borrowers to earn additional income. Security loans are required to be secured at all times by collateral at least equal to the market value of securities loaned. The fund invests cash collateral received in Vanguard Market Liquidity Fund, and records a liability for the return of the collateral, during the period the securities are on loan. Security lending income represents fees charged to borrowers plus income earned on investing cash collateral, less expenses associated with the loan.
8. Other: Dividend income is recorded on the ex-dividend date. Interest income includes income distributions received from Vanguard Market Liquidity Fund and is accrued daily. Security transactions are accounted for on the date securities are bought or sold. Costs used to determine realized gains (losses) on the sale of investment securities are those of the specific securities sold.
Each class of shares has equal rights as to assets and earnings, except that each class separately bears certain class-specific expenses related to maintenance of shareholder accounts (included in Management and Administrative expenses) and shareholder reporting. Marketing and distribution expenses are allocated to each class of shares based on a method approved by the board of trustees. Income, other non-class-specific expenses, and gains and losses on investments are allocated to each class of shares based on its relative net assets.
B. Granahan Investment Management, Inc., Wellington Management Company, LLP, Kalmar Investment Advisers, Chartwell Investment Partners, L.P., and Century Capital Management, LLC, each provide investment advisory services to a portion of the fund for a fee calculated at an annual percentage rate of average net assets managed by the advisor. The basic fees of Granahan Investment Management, Inc., Kalmar Investment Advisers, Wellington Management Company, LLP, and Chartwell Investment Partners, L.P., are subject to quarterly adjustments based on performance for the preceding three years re lative to the Russell 2500 Growth Index. The basic fee for Century Capital Management, LLC, is subject to quarterly adjustments based on performance since October 31, 2008, relative to a 50/50 blend of the Russell 2500 Index and Russell 2500 Growth Index. Until August 2010, a portion of the fund was managed by AXA Rosenberg Investment Management LLC. The basic fee paid to AXA Rosenberg Investment Management LLC was subject to quarterly adjustments based on performance since July 31, 2007, relative to the Russell 2500 Growth Index.
The Vanguard Group provides investment advisory services to a portion of the fund on an at-cost basis; the fund paid Vanguard advisory fees of $374,000 for the year ended October 31, 2010.
For the year ended October 31, 2010, the aggregate investment advisory fee represented an effective annual basic rate of 0.20% of the fund’s average net assets, before a decrease of $1,184,000 (0.01%) based on performance.
24
Explorer Fund
C. The Vanguard Group furnishes at cost corporate management, administrative, marketing, and distribution services. The costs of such services are allocated to the fund under methods approved by the board of trustees. The fund has committed to provide up to 0.40% of its net assets in capital contributions to Vanguard. At October 31, 2010, the fund had contributed capital of $1,592,000 to Vanguard (included in Other Assets), representing 0.02% of the fund’s net assets and 0.64% of Vanguard’s capitalization. The fund’s trustees and officers are also directors and officers of Vanguard.
D. The fund has asked its investment advisors to direct certain security trades, subject to obtaining the best price and execution, to brokers who have agreed to rebate to the fund part of the commissions generated. Such rebates are used solely to reduce the fund’s management and administrative expenses. For the year ended October 31, 2010, these arrangements reduced the fund’s expenses by $347,000 (an annual rate of 0.00% of average net assets).
E. Various inputs may be used to determine the value of the fund’s investments. These inputs are summarized in three broad levels for financial statement purposes. The inputs or methodologies used to value securities are not necessarily an indication of the risk associated with investing in those securities.
Level 1—Quoted prices in active markets for identical securities.
Level 2—Other significant observable inputs (including quoted prices for similar securities, interest rates, prepayment speeds, credit risk, etc.).
Level 3—Significant unobservable inputs (including the fund’s own assumptions used to determine the fair value of investments).
The following table summarizes the fund’s investments as of October 31, 2010, based on the inputs used to value them:
| | | |
| | Level 1 | Level 2 | Level 3 |
| Investments | ($000) | ($000) | ($000) |
| Common Stocks | 8,840,589 | 13,715 | — |
| Temporary Cash Investments | 393,493 | 42,672 | — |
| Futures Contracts—Assets1 | 593 | — | — |
| Total | 9,234,675 | 56,387 | — |
| 1 Represents variation margin on the last day of the reporting period. | | | |
F. At October 31, 2010, the aggregate settlement value of open futures contracts and the related unrealized appreciation (depreciation) were:
| | | | |
| | | | | ($000) |
| | | | Aggregate | |
| | | Number of | Settlement | Unrealized |
| | | Long (Short) | Value | Appreciation |
| Futures Contracts | Expiration | Contracts | Long (Short) | (Depreciation) |
| E-mini Russell 2000 Index | December 2010 | 921 | 64,673 | 2,854 |
| E-mini S&P MidCap 400 Index | December 2010 | 278 | 23,004 | 1,344 |
| S&P MidCap 400 Index | December 2010 | 31 | 12,826 | 831 |
Unrealized appreciation (depreciation) on open futures contracts is required to be treated as realized gain (loss) for tax purposes.
25
Explorer Fund
G. Distributions are determined on a tax basis and may differ from net investment income and realized capital gains for financial reporting purposes. Differences may be permanent or temporary. Permanent differences are reclassified among capital accounts in the financial statements to reflect their tax character. Temporary differences arise when certain items of income, expense, gain, or loss are recognized in different periods for financial statement and tax purposes; these differences will reverse at some time in the future. Differences in classification may also result from the treatment of short-term gains as ordinary income for tax purposes.
During the year ended October 31, 2010, the fund realized net foreign currency losses of $185,000, which decreased distributable net income for tax purposes; accordingly, such losses have been reclassified from accumulated net realized losses to overdistributed net investment income.
For tax purposes, at October 31, 2010, the fund had $14,875,000 of ordinary income available for distribution. The fund had available capital loss carryforwards totaling $1,533,525,000 to offset future net capital gains of $88,551,000 through October 31, 2016, and $1,444,974,000 through October 31, 2017.
At October 31, 2010, the cost of investment securities for tax purposes was $7,611,016,000. Net unrealized appreciation of investment securities for tax purposes was $1,679,453,000, consisting of unrealized gains of $1,974,631,000 on securities that had risen in value since their purchase and $295,178,000 in unrealized losses on securities that had fallen in value since their purchase.
H. During the year ended October 31, 2010, the fund purchased $6,824,114,000 of investment securities and sold $7,649,492,000 of investment securities, other than temporary cash investments.
I. Certain of the fund’s investments are in companies that are considered to be affiliated companies of the fund because the fund owns more than 5% of the outstanding voting securities of the company. Transactions during the period in securities of these companies were as follows:
| | | | | |
| | | | Current Period Transactions | |
| | Oct. 31, 2009 | | Proceeds from | | Oct. 31, 2010 |
| | Market | Purchases | Securities | Dividend | Market |
| | Value | at Cost | Sold | Income | Value |
| | ($000) | ($000) | ($000) | ($000) | ($000) |
| ABIOMED Inc. | NA1 | 18,923 | — | — | 20,101 |
| Beacon Roofing Supply Inc. | NA1 | 38,427 | 8,691 | — | 38,932 |
| Sourcefire Inc. | NA2 | 64,286 | 30,683 | — | NA2 |
| Verigy Ltd. | NA2 | 15,775 | 17,458 | — | NA2 |
| | — | | | — | 59,033 |
1 Not applicable—At October 31, 2009, the issuer was not an affiliated company of the fund.
2 Not applicable—At October 31, 2009, and October 31, 2010, the issuer was not an affiliated company of the fund, but it was affiliated during the period.
26
Explorer Fund
J. Capital share transactions for each class of shares were:
| | | | |
| | | | Year Ended October 31, |
| | | 2010 | | 2009 |
| | Amount | Shares | Amount | Shares |
| | ($000) | (000) | ($000) | (000) |
| Investor Shares | | | | |
| Issued | 836,502 | 13,941 | 834,745 | 18,954 |
| Issued in Lieu of Cash Distributions | 10,536 | 182 | 30,644 | 746 |
| Redeemed | (1,712,468) | (28,532) | (915,199) | (20,390) |
| Net Increase (Decrease)—Investor Shares | (865,430) | (14,409) | (49,810) | (690) |
| Admiral Shares | | | | |
| Issued | 578,617 | 10,179 | 411,846 | 10,050 |
| Issued in Lieu of Cash Distributions | 7,302 | 135 | 15,592 | 408 |
| Redeemed | (572,577) | (10,460) | (460,778) | (11,416) |
| Net Increase (Decrease)—Admiral Shares | 13,342 | (146) | (33,340) | (958) |
K. In preparing the financial statements as of October 31, 2010, management considered the impact of subsequent events for potential recognition or disclosure in these financial statements.
27
Report of Independent Registered Public Accounting Firm
To the Trustees and Shareholders of Vanguard Explorer Fund:
In our opinion, the accompanying statement of net assets--investments summary and the related statements of operations and of changes in net assets and the financial highlights present fairly, in all material respects, the financial position of Vanguard Explorer Fund (the “Fund”) at October 31, 2010, the results of its operations for the year then ended, the changes in its net assets for each of the two years in the period then ended and the financial highlights for each of the five years in the period then ended, in conformity with accounting principles generally accepted in the United States of America. These financial statements and financial highlights (hereafter referred to as “financial statements”) are the responsibility of the Fund’s management; our responsibility is to express an opinion on these financial statements based on our audits. We conducted our audits of these financial statement s in accordance with the standards of the Public Company Accounting Oversight Board (United States). Those standards require that we plan and perform the audit to obtain reasonable assurance about whether the financial statements are free of material misstatement. An audit includes examining, on a test basis, evidence supporting the amounts and disclosures in the financial statements, assessing the accounting principles used and significant estimates made by management, and evaluating the overall financial statement presentation. We believe that our audits, which included confirmation of securities at October 31, 2010 by correspondence with the custodians and brokers and by agreement to the underlying ownership records for Vanguard Market Liquidity Fund, provide a reasonable basis for our opinion.
PricewaterhouseCoopers LLP
Philadelphia, Pennsylvania
December 14, 2010
| Special 2010 tax information (unaudited) for Vanguard Explorer Fund |
This information for the fiscal year ended October 31, 2010, is included pursuant to provisions of the Internal Revenue Code.
The fund distributed $18,633,000 of qualified dividend income to shareholders during the fiscal year.
For corporate shareholders, 100.0% of investment income (dividend income plus short-term gains, if any) qualifies for the dividends-received deduction.
28
Your Fund’s After-Tax Returns
This table presents returns for your fund both before and after taxes. The after-tax returns are shown in two ways: (1) assuming that an investor owned the fund during the entire period and paid taxes on the fund’s distributions, and (2) assuming that an investor paid taxes on the fund’s distributions and sold all shares at the end of each period.
Calculations are based on the highest individual federal income tax and capital gains tax rates in effect at the times of the distributions and the hypothetical sales. State and local taxes were not considered. After-tax returns reflect any qualified dividend income , using actual prior-year figures and estimates for 2010. (In the example, returns after the sale of fund shares may be higher than those assuming no sale. This occurs when the sale would have produced a capital loss. The calculation assumes that the investor received a tax deduction for the loss.) The table shows returns for Investor Shares only; returns for other share classes will differ. Please note that your actual after-tax returns will depend on your tax situation and may differ from those shown. Also note that if you own the fund in a tax-deferred account, such as an individual retirement account or a 401(k) plan, this information does not apply to you. Such accounts are not subject to current taxes.
Finally, keep in mind that a fund’s performance—whether before or after taxes—does not guarantee future results.
| | | |
| Average Annual Total Returns: Explorer Fund Investor Shares | | | |
| Periods Ended October 31, 2010 | | | |
| | One | Five | Ten |
| | Year | Years | Years |
| Returns Before Taxes | 27.74% | 2.76% | 3.58% |
| Returns After Taxes on Distributions | 27.71 | 1.71 | 2.37 |
| Returns After Taxes on Distributions and Sale of Fund Shares | 18.07 | 2.16 | 2.55 |
29
About Your Fund’s Expenses
As a shareholder of the fund, you incur ongoing costs, which include costs for portfolio management, administrative services, and shareholder reports (like this one), among others. Operating expenses, which are deducted from a fund’s gross income, directly reduce the investment return of the fund.
A fund’s expenses are expressed as a percentage of its average net assets. This figure is known as the expense ratio. The following examples are intended to help you understand the ongoing costs (in dollars) of investing in your fund and to compare these costs with those of other mutual funds. The examples are based on an investment of $1,000 made at the beginning of the period shown and held for the entire period.
The accompanying table illustrates your fund’s costs in two ways:
• Based on actual fund return. This section helps you to estimate the actual expenses that you paid over the period. The ”Ending Account Value“ shown is derived from the fund‘s actual return, and the third column shows the dollar amount that would have been paid by an investor who started with $1,000 in the fund. You may use the information here, together with the amount you invested, to estimate the expenses that you paid over the period.
To do so, simply divide your account value by $1,000 (for example, an $8,600 account value divided by $1,000 = 8.6), then multiply the result by the number given for your fund under the heading ”Expenses Paid During Period.“
• Based on hypothetical 5% yearly return. This section is intended to help you compare your fund‘s costs with those of other mutual funds. It assumes that the fund had a yearly return of 5% before expenses, but that the expense ratio is unchanged. In this case—because the return used is not the fund’s actual return—the results do not apply to your investment. The example is useful in making comparisons because the Securities and Exchange Commission requires all mutual funds to calculate expenses based on a 5% return. You can assess your fund’s costs by comparing this hypothetical example with the hypothetical examples that appear in shareholder reports of other funds.
Note that the expenses shown in the table are meant to highlight and help you compare ongoing costs only and do not reflect transaction costs incurred by the fund for buying and selling securities. Further, the expenses do not include the account service fee described in the prospectus. If such a fee were applied to your account, your costs would be higher. Your fund does not charge transaction fees, such as purchase or redemption fees, nor does it carry a “sales load.” The calculations assume no shares were bought or sold during the period. Your actual costs may have been higher or lower, depending on the amount of your investment and the timing of any purchases or redemptions.
You can find more information about the fund’s expenses, including annual expense ratios, in the Financial Statements section of this report. For additional information on operating expenses and other shareholder costs, please refer to your fund’s current prospectus.
30
| | | |
| Six Months Ended October 31, 2010 | | | |
| | Beginning | Ending | Expenses |
| | Account Value | Account Value | Paid During |
| Explorer Fund | 4/30/2010 | 10/31/2010 | Period |
| Based on Actual Fund Return | | | |
| Investor Shares | $1,000.00 | $1,021.82 | $2.34 |
| Admiral Shares | 1,000.00 | 1,022.44 | 1.68 |
| Based on Hypothetical 5% Yearly Return | | | |
| Investor Shares | $1,000.00 | $1,022.89 | $2.35 |
| Admiral Shares | 1,000.00 | 1,023.54 | 1.68 |
The calculations are based on expenses incurred in the most recent six-month period. The fund’s annualized six-month expense ratios for that period are 0.46% for Investor Shares and 0.33% for Admiral Shares. The dollar amounts shown as “Expenses Paid” are equal to the annualized expense ratio multiplied by the average account value over the period, multiplied by the number of days in the most recent six-month period, then divided by the number of days in the most recent 12-month period.
31
Glossary
30-Day SEC Yield. A fund’s 30-day SEC yield is derived using a formula specified by the U.S. Securities and Exchange Commission. Under the formula, data related to the fund’s security holdings in the previous 30 days are used to calculate the fund’s hypothetical net income for that period, which is then annualized and divided by the fund’s estimated average net assets over the calculation period. For the purposes of this calculation, a security’s income is based on its current market yield to maturity (in the case of bonds) or its projected dividend yield (for stocks). Because the SEC yield represents hypothetical annualized income, it will differ—at times significantly—from the fund’s actual experience. As a result, the fund’s income distributions may be higher or lower than implied by the SEC yield.
Beta. A measure of the magnitude of a fund’s past share-price fluctuations in relation to the ups and downs of a given market index. The index is assigned a beta of 1.00. Compared with a given index, a fund with a beta of 1.20 typically would have seen its share price rise or fall by 12% when the index rose or fell by 10%. For this report, beta is based on returns over the past 36 months for both the fund and the index. Note that a fund’s beta should be reviewed in conjunction with its R-squared (see definition). The lower the R-squared, the less correlation there is between the fund and the index, and the less reliable beta is as an indicator of volatility.
Dividend Yield. Dividend income earned by stocks, expressed as a percentage of the aggregate market value (or of net asset value, for a fund). The yield is determined by dividing the amount of the annual dividends by the aggregate value (or net asset value) at the end of the period. For a fund, the dividend yield is based solely on stock holdings and does not include any income produced by other investments.
Earnings Growth Rate. The average annual rate of growth in earnings over the past five years for the stocks now in a fund.
Equity Exposure. A measure that reflects a fund’s investments in stocks and stock futures. Any holdings in short-term reserves are excluded.
Expense Ratio. The percentage of a fund’s average net assets used to pay its annual administrative and advisory expenses. These expenses directly reduce returns to investors.
Foreign Holdings. The percentage of a fund represented by stocks or depositary receipts of companies based outside the United States.
Inception Date. The date on which the assets of a fund (or one of its share classes) are first invested in accordance with the fund’s investment objective. For funds with a subscription period, the inception date is the day after that period ends. Investment performance is measured from the inception date.
Median Market Cap. An indicator of the size of companies in which a fund invests; the midpoint of market capitalization (market price x shares outstanding) of a fund’s stocks, weighted by the proportion of the fund’s assets invested in each stock. Stocks representing half of the fund’s assets have market capitalizations above the median, and the rest are below it.
Price/Book Ratio. The share price of a stock divided by its net worth, or book value, per share. For a fund, the weighted average price/book ratio of the stocks it holds.
32
Price/Earnings Ratio. The ratio of a stock’s current price to its per-share earnings over the past year. For a fund, the weighted average P/E of the stocks it holds. P/E is an indicator of market expectations about corporate prospects; the higher the P/E, the greater the expectations for a company’s future growth.
R-Squared. A measure of how much of a fund’s past returns can be explained by the returns from the market in general, as measured by a given index. If a fund’s total returns were precisely synchronized with an index’s returns, its R-squared would be 1.00. If the fund’s returns bore no relationship to the index’s returns, its R-squared would be 0. For this report, R-squared is based on returns over the past 36 months for both the fund and the index.
Return on Equity. The annual average rate of return generated by a company during the past five years for each dollar of shareholder’s equity (net income divided by shareholder’s equity). For a fund, the weighted average return on equity for the companies whose stocks it holds.
Short-Term Reserves. The percentage of a fund invested in highly liquid, short-term securities that can be readily converted to cash.
Turnover Rate. An indication of the fund’s trading activity. Funds with high turnover rates incur higher transaction costs and may be more likely to distribute capital gains (which may be taxable to investors). The turnover rate excludes in-kind transactions, which have minimal impact on costs.
33
This page intentionally left blank.
This page intentionally left blank.
The People Who Govern Your Fund
The trustees of your mutual fund are there to see that the fund is operated and managed in your best interests since, as a shareholder, you are a part owner of the fund. Your fund’s trustees also serve on the board of directors of The Vanguard Group, Inc., which is owned by the Vanguard funds and provides services to them on an at-cost basis.
A majority of Vanguard’s board members are independent, meaning that they have no affiliation with Vanguard or the funds they oversee, apart from the sizable personal investments they have made as private individuals. The independent board members have distinguished backgrounds in business, academia, and public service. Each of the trustees and executive officers oversees 178 Vanguard funds.
The following table provides information for each trustee and executive officer of the fund. More information about the trustees is in the Statement of Additional Information, which can be obtained, without charge, by contacting Vanguard at 800-662-7447, or online at vanguard.com.
| |
| Interested Trustee1 | Amy Gutmann |
| | Born 1949. Trustee Since June 2006. Principal |
| F. William McNabb III | Occupation(s) During the Past Five Years: President |
| Born 1957. Trustee Since July 2009. Chairman of the | of the University of Pennsylvania; Christopher H. |
| Board. Principal Occupation(s) During the Past Five | Browne Distinguished Professor of Political Science |
| Years: Chairman of the Board of The Vanguard Group, | in the School of Arts and Sciences with secondary |
| Inc., and of each of the investment companies served | appointments at the Annenberg School for Commu- |
| by The Vanguard Group, since January 2010; Director | nication and the Graduate School of Education |
| of The Vanguard Group since 2008; Chief Executive | of the University of Pennsylvania; Director of |
| Officer and President of The Vanguard Group and of | Carnegie Corporation of New York, Schuylkill River |
| each of the investment companies served by The | Development Corporation, and Greater Philadelphia |
| Vanguard Group since 2008; Director of Vanguard | Chamber of Commerce; Trustee of the National |
| Marketing Corporation; Managing Director of The | Constitution Center; Chair of the Presidential |
| Vanguard Group (1995–2008) . | Commission for the Study of Bioethical Issues. |
| |
| | JoAnn Heffernan Heisen |
| Independent Trustees | Born 1950. Trustee Since July 1998. Principal |
| | Occupation(s) During the Past Five Years: Corporate |
| Emerson U. Fullwood | Vice President and Chief Global Diversity Officer |
| Born 1948. Trustee Since January 2008. Principal | since 2006 (retired 2008) and Member of the |
| Occupation(s) During the Past Five Years: Executive | Executive Committee (retired 2008) of Johnson & |
| Chief Staff and Marketing Officer for North America | Johnson (pharmaceuticals/consumer products); Vice |
| and Corporate Vice President (retired 2008) of Xerox | President and Chief Information Officer of Johnson & |
| Corporation (document management products and | Johnson (1997–2005); Director of the University |
| services); Director of SPX Corporation (multi-industry | Medical Center at Princeton and Women’s Research |
| manufacturing), the United Way of Rochester, | and Education Institute; Member of the Advisory |
| Amerigroup Corporation (managed health care), | Board of the Maxwell School of Citizenship and Public |
| the University of Rochester Medical Center, and | Affairs at Syracuse University. |
| Monroe Community College Foundation. | |
| | F. Joseph Loughrey |
| Rajiv L. Gupta | Born 1949. Trustee Since October 2009. Principal |
| Born 1945. Trustee Since December 2001.2 | Occupation(s) During the Past Five Years: President |
| Principal Occupation(s) During the Past Five Years: | and Chief Operating Officer since 2005 (retired 2009) |
| Chairman and Chief Executive Officer (retired 2009) | and Vice Chairman of the Board (2008–2009) of |
| and President (2006–2008) of Rohm and Haas Co. | Cummins Inc. (industrial machinery); Director of |
| (chemicals); Director of Tyco International, Ltd. | SKF AB (industrial machinery), Hillenbrand, Inc. |
| (diversified manufacturing and services) and Hewlett- | (specialized consumer services), Sauer-Danfoss Inc. |
| Packard Co. (electronic computer manufacturing); | (machinery), the Lumina Foundation for Education, |
| Trustee of The Conference Board; Member of the | and Oxfam America; Chairman of the Advisory |
| Board of Managers of Delphi Automotive LLP | Council for the College of Arts and Letters at the |
| (automotive components) . | University of Notre Dame. |
| | |
| André F. Perold | Kathryn J. Hyatt | |
| Born 1952. Trustee Since December 2004. Principal | Born 1955. Treasurer Since November 2008. Principal |
| Occupation(s) During the Past Five Years: George | Occupation(s) During the Past Five Years: Principal |
| Gund Professor of Finance and Banking at the Harvard | of The Vanguard Group, Inc.; Treasurer of each of |
| Business School; Chair of the Investment Committee | the investment companies served by The Vanguard |
| of HighVista Strategies LLC (private investment firm) . | Group since 2008; Assistant Treasurer of each of the |
| | investment companies served by The Vanguard Group |
| Alfred M. Rankin, Jr. | (1988–2008) . | |
| Born 1941. Trustee Since January 1993. Principal | | |
| Occupation(s) During the Past Five Years: Chairman, | Heidi Stam | |
| President, and Chief Executive Officer of NACCO | Born 1956. Secretary Since July 2005. Principal |
| Industries, Inc. (forklift trucks/housewares/lignite); | Occupation(s) During the Past Five Years: Managing |
| Director of Goodrich Corporation (industrial products/ | Director of The Vanguard Group, Inc., since 2006; |
| aircraft systems and services); Chairman of the | General Counsel of The Vanguard Group since 2005; |
| Federal Reserve Bank of Cleveland; Trustee of The | Secretary of The Vanguard Group and of each of the |
| Cleveland Museum of Art. | investment companies served by The Vanguard Group |
| | since 2005; Director and Senior Vice President of |
| Peter F. Volanakis | Vanguard Marketing Corporation since 2005; |
| Born 1955. Trustee Since July 2009. Principal | Principal of The Vanguard Group (1997–2006). |
| Occupation(s) During the Past Five Years: President | | |
| since 2007 and Chief Operating Officer since 2005 | | |
| of Corning Incorporated (communications equipment); | Vanguard Senior Management Team |
| President of Corning Technologies (2001–2005); | | |
| Director of Corning Incorporated and Dow Corning; | R. Gregory Barton | Michael S. Miller |
| Trustee of the Corning Incorporated Foundation and | Mortimer J. Buckley | James M. Norris |
| the Corning Museum of Glass; Overseer of the | Kathleen C. Gubanich | Glenn W. Reed |
| Amos Tuck School of Business Administration at | Paul A. Heller | George U. Sauter |
| Dartmouth College. | | |
| |
| | Chairman Emeritus and Senior Advisor |
| Executive Officers | | |
| | John J. Brennan | |
| Glenn Booraem | Chairman, 1996–2009 | |
| Born 1967. Controller Since July 2010. Principal | Chief Executive Officer and President, 1996–2008 |
| Occupation(s) During the Past Five Years: Principal | | |
| of The Vanguard Group, Inc.; Controller of each of | | |
| the investment companies served by The Vanguard | Founder | |
| Group since 2010; Assistant Controller of each of | | |
| the investment companies served by The Vanguard | John C. Bogle | |
| Group (2001–2010) . | Chairman and Chief Executive Officer, 1974–1996 |
| |
| Thomas J. Higgins | | |
| Born 1957. Chief Financial Officer Since September | | |
| 2008. Principal Occupation(s) During the Past Five | | |
| Years: Principal of The Vanguard Group, Inc.; Chief | | |
| Financial Officer of each of the investment companies | | |
| served by The Vanguard Group since 2008; Treasurer | | |
| of each of the investment companies served by The | | |
| Vanguard Group (1998–2008) . | | |
1 Mr. McNabb is considered an “interested person,” as defined in the Investment Company Act of 1940, because he is an officer of the Vanguard funds.
2 December 2002 for Vanguard Equity Income Fund, Vanguard Growth Equity Fund, the Vanguard Municipal Bond Funds, and the Vanguard State Tax-Exempt Funds.
|  |
| P.O. Box 2600 |
| Valley Forge, PA 19482-2600 |
Connect with Vanguard® > vanguard.com
| |
| Fund Information > 800-662-7447 | CFA® is a trademark owned by CFA Institute. |
| Direct Investor Account Services > 800-662-2739 | |
| Institutional Investor Services > 800-523-1036 | |
| Text Telephone for People | |
| With Hearing Impairment > 800-749-7273 | |
| |
| This material may be used in conjunction | |
| with the offering of shares of any Vanguard | |
| fund only if preceded or accompanied by | |
| the fund’s current prospectus. | |
| |
| All comparative mutual fund data are from Lipper Inc. or | |
| Morningstar, Inc., unless otherwise noted. | |
| |
| You can obtain a free copy of Vanguard’s proxy voting | |
| guidelines by visiting vanguard.com/proxyreporting or by | |
| calling Vanguard at 800-662-2739. The guidelines are | |
| also available from the SEC’s website, sec.gov. In | |
| addition, you may obtain a free report on how your fund | |
| voted the proxies for securities it owned during the 12 | |
| months ended June 30. To get the report, visit either | |
| vanguard.com/proxyreporting or sec.gov. | |
| |
| You can review and copy information about your fund at | |
| the SEC’s Public Reference Room in Washington, D.C. To | |
| find out more about this public service, call the SEC at | |
| 202-551-8090. Information about your fund is also | |
| available on the SEC’s website, and you can receive | |
| copies of this information, for a fee, by sending a | |
| request in either of two ways: via e-mail addressed to | |
| publicinfo@sec.gov or via regular mail addressed to the | |
| Public Reference Section, Securities and Exchange | |
| Commission, Washington, DC 20549-1520. | |
| |
| | © 2010 The Vanguard Group, Inc. |
| | All rights reserved. |
| | Vanguard Marketing Corporation, Distributor. |
| |
| | Q240 122010 |
Vanguard® Explorer Fund
Schedule of Investments
October 31, 2010
| | | |
| | | | Market |
| | | | Value |
| | | Shares | ($000) |
| Common Stocks (96.7%)1 | | |
| Consumer Discretionary (14.5%) | | |
| * | O'Reilly Automotive Inc. | 1,044,657 | 61,112 |
| * | WMS Industries Inc. | 1,374,959 | 59,989 |
| * | LKQ Corp. | 2,220,820 | 48,281 |
| * | GameStop Corp. Class A | 2,114,815 | 41,577 |
| | Williams-Sonoma Inc. | 1,263,499 | 40,899 |
| * | DreamWorks Animation SKG Inc. Class A | 1,111,200 | 39,225 |
| | DeVry Inc. | 789,395 | 37,780 |
| * | Life Time Fitness Inc. | 1,034,865 | 37,390 |
| | Cinemark Holdings Inc. | 2,086,900 | 36,625 |
| * | CarMax Inc. | 1,142,970 | 35,421 |
| * | MGM Resorts International | 2,781,100 | 30,397 |
| | Aaron's Inc. | 1,462,450 | 27,582 |
| | Tractor Supply Co. | 694,805 | 27,514 |
| * | Warnaco Group Inc. | 507,711 | 26,965 |
| * | Steven Madden Ltd. | 625,782 | 26,471 |
| * | priceline.com Inc. | 65,435 | 24,657 |
| | Service Corp. International | 2,973,040 | 24,617 |
| | Gentex Corp. | 1,230,685 | 24,589 |
| * | Tenneco Inc. | 753,127 | 24,567 |
| * | Coinstar Inc. | 422,250 | 24,313 |
| | Darden Restaurants Inc. | 526,290 | 24,057 |
| * | Lumber Liquidators Holdings Inc. | 968,500 | 23,321 |
| * | Panera Bread Co. Class A | 256,000 | 22,915 |
| * | Bally Technologies Inc. | 533,000 | 19,231 |
| * | Childrens Place Retail Stores Inc. | 428,024 | 18,859 |
| * | Cheesecake Factory Inc. | 619,993 | 18,054 |
| * | Interpublic Group of Cos. Inc. | 1,742,316 | 18,033 |
| * | TRW Automotive Holdings Corp. | 392,489 | 17,933 |
| * | Fossil Inc. | 297,200 | 17,532 |
| * | Buffalo Wild Wings Inc. | 347,400 | 16,338 |
| * | Pacific Sunwear of California Inc. | 2,688,635 | 16,024 |
| * | DSW Inc. Class A | 478,749 | 15,928 |
| * | Pier 1 Imports Inc. | 1,794,252 | 15,574 |
| | Regis Corp. | 721,850 | 14,762 |
| * | Talbots Inc. | 1,462,090 | 14,299 |
| | Monro Muffler Brake Inc. | 299,350 | 14,291 |
| * | Select Comfort Corp. | 1,614,056 | 13,413 |
| | Foot Locker Inc. | 803,800 | 12,805 |
| | American Eagle Outfitters Inc. | 751,150 | 12,026 |
| * | Penske Automotive Group Inc. | 891,300 | 11,988 |
| * | Jo-Ann Stores Inc. | 273,888 | 11,846 |
| *,^ | Liz Claiborne Inc. | 1,895,000 | 11,597 |
| * | Gaylord Entertainment Co. | 323,523 | 10,786 |
| * | Royal Caribbean Cruises Ltd. | 257,496 | 10,181 |
| * | Urban Outfitters Inc. | 330,110 | 10,158 |
| * | Tempur-Pedic International Inc. | 289,382 | 9,984 |
| * | Ulta Salon Cosmetics & Fragrance Inc. | 311,606 | 9,563 |
| | Tiffany & Co. | 165,437 | 8,768 |
| * | K12 Inc. | 310,964 | 8,679 |
| * | Kohl's Corp. | 157,313 | 8,054 |
| * | Group 1 Automotive Inc. | 221,834 | 7,822 |
| | Sotheby's | 167,100 | 7,326 |
| * | ITT Educational Services Inc. | 111,200 | 7,176 |
| * | G-III Apparel Group Ltd. | 268,450 | 7,087 |
| | PF Chang's China Bistro Inc. | 141,934 | 6,518 |
| * | Texas Roadhouse Inc. Class A | 417,004 | 6,405 |
| | Bebe Stores Inc. | 913,750 | 5,994 |
| * | Big Lots Inc. | 190,801 | 5,985 |
| * | Rue21 Inc. | 221,100 | 5,886 |
| | Matthews International Corp. Class A | 177,500 | 5,861 |
| | PetSmart Inc. | 154,700 | 5,790 |
1
| | |
| Vanguard® Explorer Fund | | |
| Schedule of Investments | | |
| October 31, 2010 | | |
| |
| | | Market |
| | | Value |
| | Shares | ($000) |
| * Valassis Communications Inc. | 165,014 | 5,445 |
| Cracker Barrel Old Country Store Inc. | 100,800 | 5,432 |
| * HSN Inc. | 177,000 | 5,299 |
| Ross Stores Inc. | 81,298 | 4,796 |
| * Discovery Communications Inc. Class A | 105,850 | 4,722 |
| * BJ's Restaurants Inc. | 136,200 | 4,515 |
| Finish Line Inc. Class A | 288,863 | 4,420 |
| * JOS A Bank Clothiers Inc. | 100,500 | 4,382 |
| Jarden Corp. | 130,886 | 4,196 |
| Cooper Tire & Rubber Co. | 212,743 | 4,172 |
| * Hanesbrands Inc. | 163,350 | 4,051 |
| * Dress Barn Inc. | 165,000 | 3,785 |
| Polaris Industries Inc. | 52,100 | 3,704 |
| * CEC Entertainment Inc. | 109,200 | 3,625 |
| * True Religion Apparel Inc. | 171,010 | 3,497 |
| ^ Strayer Education Inc. | 24,800 | 3,468 |
| Cato Corp. Class A | 121,276 | 3,208 |
| * Domino's Pizza Inc. | 205,117 | 3,044 |
| * Pre-Paid Legal Services Inc. | 47,500 | 2,859 |
| * Wet Seal Inc. Class A | 782,000 | 2,737 |
| * Sinclair Broadcast Group Inc. Class A | 333,300 | 2,663 |
| * Sally Beauty Holdings Inc. | 201,958 | 2,458 |
| * Capella Education Co. | 42,000 | 2,303 |
| * Kirkland's Inc. | 160,035 | 2,152 |
| * Hibbett Sports Inc. | 78,875 | 2,126 |
| Autoliv Inc. | 29,200 | 2,082 |
| * Discovery Communications Inc. | 44,375 | 1,724 |
| * Perry Ellis International Inc. | 76,000 | 1,708 |
| * Belo Corp. Class A | 278,200 | 1,611 |
| * Carter's Inc. | 59,685 | 1,486 |
| * Chipotle Mexican Grill Inc. Class A | 6,800 | 1,429 |
| Brinker International Inc. | 77,057 | 1,429 |
| * Citi Trends Inc. | 66,972 | 1,405 |
| * 99 Cents Only Stores | 76,800 | 1,184 |
| John Wiley & Sons Inc. Class A | 25,488 | 1,100 |
| Hillenbrand Inc. | 48,400 | 1,040 |
| Meredith Corp. | 29,800 | 1,012 |
| * Madison Square Garden Inc. Class A | 45,600 | 948 |
| * Deckers Outdoor Corp. | 15,600 | 906 |
| * Lear Corp. | 5,500 | 486 |
| * Papa John's International Inc. | 17,100 | 442 |
| Weight Watchers International Inc. | 12,200 | 409 |
| Leggett & Platt Inc. | 15,600 | 318 |
| * CROCS Inc. | 22,300 | 311 |
| World Wrestling Entertainment Inc. Class A | 20,600 | 285 |
| * Dorman Products Inc. | 7,440 | 272 |
| * Ballantyne Strong Inc. | 29,100 | 245 |
| * Timberland Co. Class A | 10,115 | 212 |
| * Destination Maternity Corp. | 5,600 | 205 |
| National Presto Industries Inc. | 1,625 | 182 |
| * DineEquity Inc. | 3,900 | 173 |
| Winmark Corp. | 3,600 | 119 |
| * Caribou Coffee Co. Inc. | 9,278 | 98 |
| * Krispy Kreme Doughnuts Inc. Warrants Exp. 03/02/2012 | 8,183 | 1 |
| | | 1,324,701 |
| Consumer Staples (3.0%) | | |
| Ruddick Corp. | 1,338,260 | 46,705 |
| Herbalife Ltd. | 728,035 | 46,492 |
| Nu Skin Enterprises Inc. Class A | 1,013,100 | 31,001 |
| Pricesmart Inc. | 995,620 | 29,202 |
| * United Natural Foods Inc. | 796,959 | 28,499 |
| Alberto-Culver Co. Class B | 578,400 | 21,569 |
| * Constellation Brands Inc. Class A | 987,850 | 19,490 |
| * Cott Corp. | 1,901,400 | 15,591 |
2
| | | |
| Vanguard® Explorer Fund | | |
| Schedule of Investments | | |
| October 31, 2010 | | |
| |
| | | | Market |
| | | | Value |
| | | Shares | ($000) |
| * | BJ's Wholesale Club Inc. | 288,200 | 12,027 |
| | Diamond Foods Inc. | 181,101 | 8,005 |
| * | Boston Beer Co. Inc. Class A | 101,578 | 7,272 |
| * | Revlon Inc. Class A | 331,796 | 3,789 |
| | Spartan Stores Inc. | 199,620 | 2,984 |
| | Sanderson Farms Inc. | 60,700 | 2,548 |
| | Vector Group Ltd. | 119,070 | 2,227 |
| | Casey's General Stores Inc. | 13,610 | 564 |
| | B&G Foods Inc. Class A | 38,000 | 466 |
| | Coca-Cola Bottling Co. Consolidated | 6,166 | 329 |
| | Lancaster Colony Corp. | 5,202 | 259 |
| | | | 279,019 |
| Energy (4.3%) | | |
| | Core Laboratories NV | 452,875 | 35,220 |
| * | Atwood Oceanics Inc. | 957,645 | 31,133 |
| * | Ultra Petroleum Corp. | 596,960 | 24,565 |
| * | Brigham Exploration Co. | 1,097,580 | 23,148 |
| * | Global Industries Ltd. | 3,401,846 | 19,697 |
| * | Comstock Resources Inc. | 859,600 | 19,212 |
| | Niko Resources Ltd. | 200,700 | 19,131 |
| * | Atlas Energy Inc. | 648,300 | 18,878 |
| * | Alpha Natural Resources Inc. | 409,440 | 18,494 |
| * | Tesco Corp. | 1,439,447 | 18,223 |
| * | Whiting Petroleum Corp. | 155,623 | 15,631 |
| * | Petrohawk Energy Corp. | 827,620 | 14,078 |
| | EXCO Resources Inc. | 945,150 | 14,017 |
| * | Southwestern Energy Co. | 397,625 | 13,460 |
| | SM Energy Co. | 317,745 | 13,244 |
| * | Clean Energy Fuels Corp. | 876,020 | 12,720 |
| | CARBO Ceramics Inc. | 121,319 | 10,163 |
| | Frontier Oil Corp. | 755,100 | 10,005 |
| | Berry Petroleum Co. Class A | 287,500 | 9,835 |
| * | Oceaneering International Inc. | 146,270 | 9,050 |
| * | Rex Energy Corp. | 673,162 | 8,293 |
| * | Forest Oil Corp. | 201,200 | 6,183 |
| * | Venoco Inc. | 392,378 | 6,074 |
| * | Rowan Cos. Inc. | 110,800 | 3,645 |
| | Patterson-UTI Energy Inc. | 179,300 | 3,480 |
| * | McMoRan Exploration Co. | 198,000 | 3,334 |
| * | SandRidge Energy Inc. | 600,282 | 3,284 |
| ^ | Frontline Ltd. | 86,100 | 2,475 |
| | World Fuel Services Corp. | 73,846 | 2,085 |
| * | Clayton Williams Energy Inc. | 17,400 | 1,039 |
| * | Westmoreland Coal Co. | 30,319 | 322 |
| * | Cloud Peak Energy Inc. | 15,500 | 269 |
| * | Concho Resources Inc. | 3,200 | 220 |
| | | | 390,607 |
| Exchange-Traded Funds (2.0%) | | |
| ^,2 | Vanguard Small-Cap ETF | 1,165,083 | 76,930 |
| ^ | iShares Russell 2000 Index Fund | 864,155 | 60,759 |
| ^,2 | Vanguard Small-Cap Growth ETF | 713,200 | 49,860 |
| | | | 187,549 |
| Financials (6.4%) | | |
| * | Affiliated Managers Group Inc. | 380,320 | 32,559 |
| * | NASDAQ OMX Group Inc. | 1,483,100 | 31,175 |
| | Cash America International Inc. | 851,098 | 29,984 |
| | Discover Financial Services | 1,583,337 | 27,946 |
| | Comerica Inc. | 742,800 | 26,577 |
| | Waddell & Reed Financial Inc. Class A | 875,150 | 25,441 |
| | Och-Ziff Capital Management Group LLC Class A | 1,717,450 | 25,367 |
| | MFA Financial Inc. | 3,163,200 | 25,021 |
| | SEI Investments Co. | 1,088,416 | 24,108 |
| * | Signature Bank | 563,320 | 23,795 |
3
| | |
| Vanguard® Explorer Fund | | |
| Schedule of Investments | | |
| October 31, 2010 | | |
| |
| | | Market |
| | | Value |
| | Shares | ($000) |
| Jefferies Group Inc. | 971,563 | 23,249 |
| Synovus Financial Corp. | 10,055,100 | 21,719 |
| BR Malls Participacoes SA | 2,306,800 | 21,666 |
| Brown & Brown Inc. | 966,900 | 21,552 |
| Redwood Trust Inc. | 1,412,500 | 20,029 |
| Lazard Ltd. Class A | 525,380 | 19,386 |
| Umpqua Holdings Corp. | 1,512,700 | 16,640 |
| MB Financial Inc. | 1,097,175 | 16,337 |
| * Stifel Financial Corp. | 323,400 | 15,326 |
| PrivateBancorp Inc. Class A | 981,200 | 11,568 |
| * MGIC Investment Corp. | 1,267,300 | 11,178 |
| Evercore Partners Inc. Class A | 345,350 | 10,485 |
| Invesco Ltd. | 445,269 | 10,241 |
| * MSCI Inc. Class A | 236,841 | 8,491 |
| Assured Guaranty Ltd. | 390,827 | 7,445 |
| * Cardtronics Inc. | 367,893 | 6,236 |
| Federated Investors Inc. Class B | 235,800 | 5,874 |
| Greenhill & Co. Inc. | 68,105 | 5,290 |
| * IntercontinentalExchange Inc. | 45,500 | 5,227 |
| * World Acceptance Corp. | 114,444 | 4,938 |
| BOK Financial Corp. | 100,127 | 4,629 |
| * Arch Capital Group Ltd. | 53,200 | 4,596 |
| * Credit Acceptance Corp. | 75,483 | 4,439 |
| Nelnet Inc. Class A | 189,983 | 4,269 |
| * CB Richard Ellis Group Inc. Class A | 215,049 | 3,946 |
| Endurance Specialty Holdings Ltd. | 78,520 | 3,251 |
| Digital Realty Trust Inc. | 53,478 | 3,194 |
| * Strategic Hotels & Resorts Inc. | 581,500 | 2,646 |
| Mid-America Apartment Communities Inc. | 43,300 | 2,643 |
| QC Holdings Inc. | 675,485 | 2,547 |
| PennantPark Investment Corp. | 194,105 | 2,158 |
| Associated Estates Realty Corp. | 127,636 | 1,773 |
| * First Cash Financial Services Inc. | 58,300 | 1,695 |
| Equity Lifestyle Properties Inc. | 27,900 | 1,588 |
| Rayonier Inc. | 27,500 | 1,435 |
| Highwoods Properties Inc. | 41,500 | 1,375 |
| Westamerica Bancorporation | 26,905 | 1,346 |
| Erie Indemnity Co. Class A | 21,400 | 1,224 |
| Acadia Realty Trust | 60,500 | 1,154 |
| * National Financial Partners Corp. | 83,600 | 1,154 |
| * Ezcorp Inc. Class A | 47,100 | 1,012 |
| Universal Health Realty Income Trust | 11,300 | 420 |
| Potlatch Corp. | 11,500 | 391 |
| Getty Realty Corp. | 11,177 | 319 |
| Bank of the Ozarks Inc. | 5,300 | 201 |
| Jones Lang LaSalle Inc. | 1,900 | 148 |
| | | 588,403 |
| Health Care (17.5%) | | |
| * Bruker Corp. | 4,825,343 | 72,332 |
| Cooper Cos. Inc. | 1,265,010 | 62,416 |
| * Mettler-Toledo International Inc. | 395,504 | 51,637 |
| * ResMed Inc. | 1,440,450 | 45,907 |
| * Coventry Health Care Inc. | 1,939,501 | 45,423 |
| * Nektar Therapeutics | 3,095,206 | 45,097 |
| * Seattle Genetics Inc. | 2,688,254 | 44,060 |
| * Regeneron Pharmaceuticals Inc. | 1,491,700 | 38,904 |
| * Health Management Associates Inc. Class A | 4,459,300 | 35,719 |
| DENTSPLY International Inc. | 1,134,100 | 35,599 |
| * Varian Medical Systems Inc. | 556,857 | 35,205 |
| * Henry Schein Inc. | 569,800 | 31,994 |
| * Bio-Rad Laboratories Inc. Class A | 348,010 | 31,537 |
| * Volcano Corp. | 1,186,240 | 28,968 |
| * ICON plc ADR | 1,472,095 | 28,485 |
| * Cubist Pharmaceuticals Inc. | 1,220,400 | 28,411 |
4
| | | |
| Vanguard® Explorer Fund | | |
| Schedule of Investments | | |
| October 31, 2010 | | |
| |
| | | | Market |
| | | | Value |
| | | Shares | ($000) |
| * | QIAGEN NV | 1,492,500 | 28,074 |
| * | Parexel International Corp. | 1,239,700 | 26,654 |
| * | Alexion Pharmaceuticals Inc. | 382,887 | 26,151 |
| * | BioMarin Pharmaceutical Inc. | 994,800 | 26,024 |
| * | Alkermes Inc. | 2,054,300 | 23,768 |
| | Pharmaceutical Product Development Inc. | 916,850 | 23,664 |
| * | Edwards Lifesciences Corp. | 368,800 | 23,570 |
| | West Pharmaceutical Services Inc. | 631,063 | 22,523 |
| * | Watson Pharmaceuticals Inc. | 464,800 | 21,683 |
| * | Cephalon Inc. | 325,300 | 21,613 |
| * | Align Technology Inc. | 1,268,200 | 21,597 |
| * | Elan Corp. plc ADR | 3,860,300 | 21,039 |
| * | Martek Biosciences Corp. | 953,850 | 20,937 |
| * | SXC Health Solutions Corp. | 536,445 | 20,900 |
| * | Sun Healthcare Group Inc. | 2,155,300 | 20,497 |
| * | Par Pharmaceutical Cos. Inc. | 621,200 | 20,195 |
| * | Brookdale Senior Living Inc. | 1,074,900 | 20,187 |
| *,3 | ABIOMED Inc. | 1,949,700 | 20,101 |
| | PerkinElmer Inc. | 846,700 | 19,855 |
| * | Onyx Pharmaceuticals Inc. | 721,550 | 19,359 |
| * | Incyte Corp. Ltd. | 988,775 | 16,473 |
| * | Kindred Healthcare Inc. | 1,185,544 | 16,266 |
| | Lincare Holdings Inc. | 618,875 | 16,227 |
| * | MWI Veterinary Supply Inc. | 267,593 | 15,306 |
| * | IPC The Hospitalist Co. Inc. | 461,150 | 14,771 |
| * | Covance Inc. | 310,857 | 14,607 |
| * | Targacept Inc. | 572,958 | 14,186 |
| | Perrigo Co. | 213,350 | 14,055 |
| * | NxStage Medical Inc. | 683,850 | 13,786 |
| | Hikma Pharmaceuticals plc | 1,087,784 | 13,715 |
| * | Allscripts Healthcare Solutions Inc. | 707,030 | 13,497 |
| | Quality Systems Inc. | 203,750 | 13,093 |
| * | Luminex Corp. | 700,400 | 12,614 |
| * | Exelixis Inc. | 2,793,900 | 12,461 |
| | Warner Chilcott plc Class A | 498,400 | 11,982 |
| * | Amylin Pharmaceuticals Inc. | 914,100 | 11,911 |
| * | Salix Pharmaceuticals Ltd. | 312,395 | 11,818 |
| *,^ | Cadence Pharmaceuticals Inc. | 1,324,519 | 11,762 |
| * | Momenta Pharmaceuticals Inc. | 702,800 | 11,744 |
| * | Isis Pharmaceuticals Inc. | 1,261,549 | 11,531 |
| | Patterson Cos. Inc. | 415,800 | 11,497 |
| * | Healthspring Inc. | 388,600 | 11,343 |
| * | Sirona Dental Systems Inc. | 286,775 | 10,797 |
| * | Ardea Biosciences Inc. | 479,400 | 10,221 |
| * | United Therapeutics Corp. | 169,462 | 10,168 |
| * | XenoPort Inc. | 1,263,600 | 9,793 |
| * | Express Scripts Inc. | 178,173 | 8,645 |
| * | Orthovita Inc. | 3,608,803 | 7,867 |
| * | American Medical Systems Holdings Inc. | 381,237 | 7,701 |
| | Medicis Pharmaceutical Corp. Class A | 249,375 | 7,419 |
| * | Life Technologies Corp. | 145,855 | 7,319 |
| * | Cepheid Inc. | 345,800 | 7,276 |
| * | Mylan Inc. | 327,500 | 6,655 |
| * | Immunogen Inc. | 790,300 | 6,496 |
| | STERIS Corp. | 176,200 | 6,030 |
| * | Dionex Corp. | 67,000 | 5,978 |
| * | Catalyst Health Solutions Inc. | 151,521 | 5,735 |
| * | Community Health Systems Inc. | 180,100 | 5,417 |
| * | Impax Laboratories Inc. | 266,000 | 5,011 |
| * | Arthrocare Corp. | 174,400 | 4,758 |
| | Chemed Corp. | 79,300 | 4,674 |
| | Invacare Corp. | 172,300 | 4,652 |
| * | Healthsouth Corp. | 251,865 | 4,556 |
| * | Corvel Corp. | 101,059 | 4,527 |
5
| | | |
| Vanguard® Explorer Fund | | |
| Schedule of Investments | | |
| October 31, 2010 | | |
| |
| | | | Market |
| | | | Value |
| | | Shares | ($000) |
| | AmerisourceBergen Corp. Class A | 128,725 | 4,225 |
| * | Durect Corp. | 1,545,600 | 4,127 |
| *,^ | Arena Pharmaceuticals Inc. | 1,888,146 | 3,115 |
| * | Intuitive Surgical Inc. | 11,125 | 2,925 |
| * | Gentiva Health Services Inc. | 97,332 | 2,266 |
| * | Hi-Tech Pharmacal Co. Inc. | 101,300 | 2,191 |
| * | Neurocrine Biosciences Inc. | 269,100 | 2,190 |
| * | AMERIGROUP Corp. | 51,000 | 2,128 |
| * | Medicines Co. | 128,900 | 1,646 |
| * | Human Genome Sciences Inc. | 61,150 | 1,644 |
| * | Medidata Solutions Inc. | 85,475 | 1,592 |
| | Masimo Corp. | 52,525 | 1,585 |
| * | Nabi Biopharmaceuticals | 317,600 | 1,559 |
| * | Micromet Inc. | 201,583 | 1,510 |
| * | Questcor Pharmaceuticals Inc. | 117,909 | 1,447 |
| * | Savient Pharmaceuticals Inc. | 103,024 | 1,279 |
| | Hill-Rom Holdings Inc. | 32,100 | 1,244 |
| * | MedAssets Inc. | 51,603 | 957 |
| * | Furiex Pharmaceuticals Inc. | 76,404 | 879 |
| * | Array Biopharma Inc. | 250,350 | 811 |
| * | Continucare Corp. | 137,064 | 617 |
| * | ExamWorks Group Inc. | 35,475 | 603 |
| * | Ariad Pharmaceuticals Inc. | 157,300 | 579 |
| * | Bio-Reference Labs Inc. | 23,460 | 506 |
| | Atrion Corp. | 2,955 | 481 |
| * | Caliper Life Sciences Inc. | 102,300 | 460 |
| * | Genomic Health Inc. | 27,900 | 395 |
| * | Enzon Pharmaceuticals Inc. | 15,300 | 172 |
| * | Providence Service Corp. | 8,634 | 142 |
| | | | 1,599,700 |
| Industrials (16.9%) | | |
| | Kennametal Inc. | 2,424,655 | 82,778 |
| | MSC Industrial Direct Co. Class A | 832,805 | 47,420 |
| * | Genesee & Wyoming Inc. Class A | 960,130 | 44,387 |
| *,3 | Beacon Roofing Supply Inc. | 2,637,676 | 38,932 |
| * | Stericycle Inc. | 530,255 | 38,040 |
| | Watsco Inc. | 678,810 | 37,993 |
| | AMETEK Inc. | 655,565 | 35,433 |
| | Flowserve Corp. | 324,320 | 32,432 |
| * | IHS Inc. Class A | 439,055 | 31,717 |
| * | Kansas City Southern | 717,000 | 31,419 |
| * | ArvinMeritor Inc. | 1,874,650 | 31,082 |
| * | JetBlue Airways Corp. | 4,408,230 | 30,769 |
| | Knight Transportation Inc. | 1,701,625 | 30,408 |
| * | EnerSys | 1,132,140 | 29,843 |
| * | GeoEye Inc. | 653,320 | 28,922 |
| * | AerCap Holdings NV | 2,165,976 | 27,963 |
| * | Chicago Bridge & Iron Co. NV | 1,107,725 | 27,926 |
| * | DigitalGlobe Inc. | 814,390 | 26,590 |
| | Lennox International Inc. | 640,900 | 26,283 |
| * | Kforce Inc. | 1,693,477 | 25,419 |
| * | BE Aerospace Inc. | 660,955 | 24,297 |
| * | US Airways Group Inc. | 2,022,100 | 23,841 |
| * | Teledyne Technologies Inc. | 560,500 | 23,300 |
| | Applied Industrial Technologies Inc. | 765,750 | 23,286 |
| | Con-way Inc. | 688,700 | 22,734 |
| * | RBC Bearings Inc. | 680,494 | 22,674 |
| | UTi Worldwide Inc. | 1,152,235 | 22,146 |
| * | Atlas Air Worldwide Holdings Inc. | 416,655 | 21,774 |
| | Triumph Group Inc. | 257,800 | 21,549 |
| | Trinity Industries Inc. | 911,100 | 20,709 |
| * | Middleby Corp. | 276,045 | 20,610 |
| * | Corrections Corp. of America | 799,244 | 20,517 |
| * | Advisory Board Co. | 435,923 | 20,406 |
6
| | | |
| Vanguard® Explorer Fund | | |
| Schedule of Investments | | |
| October 31, 2010 | | |
| |
| | | | Market |
| | | | Value |
| | | Shares | ($000) |
| | Belden Inc. | 702,430 | 19,598 |
| | Gardner Denver Inc. | 330,500 | 19,109 |
| * | EnerNOC Inc. | 608,720 | 18,304 |
| * | II-VI Inc. | 428,600 | 16,861 |
| * | United Stationers Inc. | 289,800 | 16,287 |
| | Acuity Brands Inc. | 319,100 | 15,977 |
| | Woodward Governor Co. | 495,800 | 15,538 |
| | Landstar System Inc. | 396,530 | 14,917 |
| * | Ladish Co. Inc. | 458,500 | 14,667 |
| | Manpower Inc. | 257,000 | 14,066 |
| * | Huron Consulting Group Inc. | 696,500 | 13,867 |
| | Donaldson Co. Inc. | 283,473 | 13,811 |
| * | TrueBlue Inc. | 940,830 | 13,219 |
| * | Sensata Technologies Holding NV | 561,200 | 12,992 |
| | Robert Half International Inc. | 472,089 | 12,798 |
| * | AGCO Corp. | 289,400 | 12,291 |
| | Healthcare Services Group Inc. | 511,170 | 12,283 |
| *,^ | A123 Systems Inc. | 1,245,300 | 12,104 |
| * | United Continental Holdings Inc. | 412,300 | 11,973 |
| * | Polypore International Inc. | 343,750 | 11,437 |
| | McGrath Rentcorp | 374,593 | 9,481 |
| * | General Cable Corp. | 336,100 | 9,391 |
| | Equifax Inc. | 281,430 | 9,324 |
| | Goodrich Corp. | 110,921 | 9,103 |
| | Baldor Electric Co. | 204,325 | 8,586 |
| * | RailAmerica Inc. | 730,745 | 8,477 |
| * | American Superconductor Corp. | 251,850 | 8,475 |
| * | LaBarge Inc. | 619,822 | 7,866 |
| * | Chart Industries Inc. | 323,855 | 7,546 |
| * | Exponent Inc. | 229,572 | 7,328 |
| * | EMCOR Group Inc. | 275,000 | 7,109 |
| | Nordson Corp. | 87,500 | 6,827 |
| | Timken Co. | 163,800 | 6,785 |
| | CH Robinson Worldwide Inc. | 92,625 | 6,528 |
| | Waste Connections Inc. | 155,900 | 6,351 |
| | Ingersoll-Rand plc | 160,775 | 6,320 |
| * | Alliant Techsystems Inc. | 81,816 | 6,238 |
| | Toro Co. | 104,550 | 5,934 |
| | Hubbell Inc. Class B | 107,300 | 5,796 |
| | Deluxe Corp. | 276,700 | 5,656 |
| * | Owens Corning | 206,285 | 5,578 |
| * | Babcock & Wilcox Co. | 240,346 | 5,485 |
| * | Navistar International Corp. | 113,500 | 5,468 |
| * | Korn/Ferry International | 300,000 | 5,289 |
| | Cubic Corp. | 113,030 | 4,925 |
| * | Alaska Air Group Inc. | 92,180 | 4,867 |
| | WW Grainger Inc. | 37,600 | 4,664 |
| | KBR Inc. | 177,600 | 4,511 |
| * | Oshkosh Corp. | 152,200 | 4,491 |
| | Towers Watson & Co. Class A | 87,300 | 4,489 |
| * | Flow International Corp. | 1,680,618 | 4,437 |
| | Textainer Group Holdings Ltd. | 163,600 | 4,250 |
| * | HUB Group Inc. Class A | 130,225 | 4,228 |
| | Heartland Express Inc. | 274,570 | 4,094 |
| * | Consolidated Graphics Inc. | 80,600 | 3,752 |
| | TAL International Group Inc. | 132,500 | 3,713 |
| | Watts Water Technologies Inc. Class A | 82,500 | 2,902 |
| * | Sauer-Danfoss Inc. | 128,202 | 2,835 |
| | Allegiant Travel Co. Class A | 53,382 | 2,514 |
| | Rollins Inc. | 95,700 | 2,493 |
| * | Thomas & Betts Corp. | 50,699 | 2,208 |
| | Robbins & Myers Inc. | 75,725 | 2,198 |
| | Corporate Executive Board Co. | 69,475 | 2,170 |
| | Copa Holdings SA Class A | 41,697 | 2,115 |
7
| | | |
| Vanguard® Explorer Fund | | |
| Schedule of Investments | | |
| October 31, 2010 | | |
| |
| | | | Market |
| | | | Value |
| | | Shares | ($000) |
| * | M&F Worldwide Corp. | 75,700 | 2,035 |
| * | Trimas Corp. | 124,732 | 1,974 |
| * | WESCO International Inc. | 45,000 | 1,927 |
| | Standex International Corp. | 68,300 | 1,839 |
| * | Altra Holdings Inc. | 104,740 | 1,550 |
| | ABM Industries Inc. | 63,761 | 1,438 |
| | Resources Connection Inc. | 83,937 | 1,359 |
| * | Pacer International Inc. | 200,700 | 1,118 |
| * | DXP Enterprises Inc. | 57,700 | 1,099 |
| * | Blount International Inc. | 73,200 | 1,098 |
| * | KAR Auction Services Inc. | 62,000 | 799 |
| * | Thermadyne Holdings Corp. | 50,600 | 763 |
| * | GrafTech International Ltd. | 42,940 | 707 |
| | Regal-Beloit Corp. | 9,100 | 525 |
| * | WABCO Holdings Inc. | 9,740 | 452 |
| | Raven Industries Inc. | 10,430 | 429 |
| | Vicor Corp. | 16,000 | 285 |
| * | Hawk Corp. Class A | 5,000 | 249 |
| | Bowne & Co. Inc. | 17,200 | 195 |
| * | Colfax Corp. | 9,900 | 159 |
| | Great Lakes Dredge & Dock Corp. | 25,300 | 157 |
| * | Copart Inc. | 4,600 | 156 |
| | | | 1,548,808 |
| Information Technology (26.1%) | | |
| * | TiVo Inc. | 5,805,460 | 64,673 |
| | Sapient Corp. | 4,512,947 | 59,390 |
| * | MICROS Systems Inc. | 1,297,555 | 58,896 |
| * | Rovi Corp. | 1,151,635 | 58,330 |
| *,^ | Alliance Data Systems Corp. | 918,861 | 55,793 |
| * | VeriFone Systems Inc. | 1,509,665 | 51,072 |
| * | Netlogic Microsystems Inc. | 1,650,518 | 49,615 |
| * | Microsemi Corp. | 2,435,885 | 48,718 |
| * | Ariba Inc. | 2,554,496 | 47,973 |
| * | Polycom Inc. | 1,414,180 | 47,771 |
| * | Teradyne Inc. | 4,175,583 | 46,934 |
| * | Informatica Corp. | 1,085,936 | 44,187 |
| * | Trimble Navigation Ltd. | 1,113,280 | 39,900 |
| * | NICE Systems Ltd. ADR | 1,180,946 | 39,550 |
| * | Atmel Corp. | 4,349,345 | 38,535 |
| * | Parametric Technology Corp. | 1,768,735 | 37,975 |
| * | Compellent Technologies Inc. | 1,455,220 | 36,773 |
| * | WebMD Health Corp. | 681,241 | 35,615 |
| * | PMC - Sierra Inc. | 4,411,060 | 33,921 |
| | Factset Research Systems Inc. | 385,300 | 33,822 |
| * | Sourcefire Inc. | 1,398,388 | 32,988 |
| * | Acme Packet Inc. | 823,428 | 32,567 |
| * | ON Semiconductor Corp. | 4,178,960 | 32,053 |
| * | Acxiom Corp. | 1,791,858 | 31,447 |
| * | F5 Networks Inc. | 258,989 | 30,483 |
| * | IAC/InterActiveCorp | 934,800 | 26,081 |
| * | Ingram Micro Inc. | 1,472,753 | 26,009 |
| * | SuccessFactors Inc. | 955,168 | 25,904 |
| * | Quest Software Inc. | 930,100 | 24,341 |
| | Maxim Integrated Products Inc. | 1,110,800 | 24,060 |
| * | Concur Technologies Inc. | 462,710 | 23,885 |
| * | Gartner Inc. | 751,427 | 23,813 |
| * | Blue Coat Systems Inc. | 879,384 | 23,717 |
| * | Netezza Corp. | 875,070 | 23,592 |
| * | Cadence Design Systems Inc. | 2,731,750 | 23,138 |
| * | Littelfuse Inc. | 544,550 | 23,105 |
| * | MKS Instruments Inc. | 1,115,800 | 23,041 |
| | Jabil Circuit Inc. | 1,490,480 | 22,864 |
| * | Avago Technologies Ltd. | 895,100 | 22,091 |
| * | Euronet Worldwide Inc. | 1,220,530 | 22,043 |
8
| | | |
| Vanguard® Explorer Fund | | |
| Schedule of Investments | | |
| October 31, 2010 | | |
| |
| | | | Market |
| | | | Value |
| | | Shares | ($000) |
| * | j2 Global Communications Inc. | 835,850 | 22,025 |
| * | Verigy Ltd. | 2,396,020 | 21,948 |
| * | Progress Software Corp. | 586,900 | 21,932 |
| * | VeriSign Inc. | 627,300 | 21,799 |
| | ADTRAN Inc. | 665,635 | 21,480 |
| | Power Integrations Inc. | 628,260 | 21,461 |
| * | Cymer Inc. | 576,040 | 21,285 |
| * | FEI Co. | 969,095 | 21,088 |
| * | Celestica Inc. | 2,486,900 | 20,940 |
| * | Atheros Communications Inc. | 663,890 | 20,607 |
| * | Convergys Corp. | 1,796,100 | 20,332 |
| * | Salesforce.com Inc. | 174,840 | 20,294 |
| | Syntel Inc. | 415,257 | 20,289 |
| * | ValueClick Inc. | 1,463,600 | 20,139 |
| * | SunPower Corp. Class B | 1,445,236 | 19,077 |
| * | Nuance Communications Inc. | 1,163,280 | 18,275 |
| * | RF Micro Devices Inc. | 2,494,160 | 18,182 |
| * | QLogic Corp. | 982,300 | 17,259 |
| * | RightNow Technologies Inc. | 657,750 | 17,180 |
| * | Fortinet Inc. | 539,700 | 16,191 |
| * | Finisar Corp. | 951,200 | 16,180 |
| * | Varian Semiconductor Equipment Associates Inc. | 470,430 | 15,369 |
| * | Digital River Inc. | 393,430 | 14,659 |
| | Comtech Telecommunications Corp. | 472,900 | 14,575 |
| * | Hollysys Automation Technologies Ltd. | 1,151,700 | 14,558 |
| * | Hittite Microwave Corp. | 279,350 | 14,434 |
| * | CommVault Systems Inc. | 497,700 | 14,398 |
| *,^ | Ciena Corp. | 1,028,200 | 14,282 |
| | Black Box Corp. | 397,700 | 13,204 |
| * | S1 Corp. | 2,087,700 | 12,150 |
| * | Red Hat Inc. | 277,500 | 11,727 |
| | iGate Corp. | 567,639 | 11,603 |
| | Amphenol Corp. Class A | 230,750 | 11,568 |
| | Solera Holdings Inc. | 237,877 | 11,430 |
| * | Mellanox Technologies Ltd. | 488,800 | 11,252 |
| * | LoopNet Inc. | 1,024,350 | 10,807 |
| * | NetApp Inc. | 201,289 | 10,719 |
| * | FLIR Systems Inc. | 371,140 | 10,333 |
| * | Intuit Inc. | 202,425 | 9,716 |
| * | Cognizant Technology Solutions Corp. Class A | 149,014 | 9,714 |
| * | Advanced Energy Industries Inc. | 648,200 | 9,308 |
| * | Marvell Technology Group Ltd. | 458,046 | 8,845 |
| * | Aruba Networks Inc. | 396,914 | 8,696 |
| *,^ | Blackboard Inc. | 206,294 | 8,611 |
| * | Cypress Semiconductor Corp. | 599,584 | 8,454 |
| * | Advent Software Inc. | 152,364 | 8,185 |
| * | Silicon Laboratories Inc. | 204,320 | 8,152 |
| | Pegasystems Inc. | 299,650 | 8,106 |
| * | Plexus Corp. | 256,900 | 7,797 |
| * | LSI Corp. | 1,341,900 | 7,032 |
| * | VanceInfo Technologies Inc. ADR | 193,221 | 7,027 |
| *,^ | Rackspace Hosting Inc. | 280,375 | 6,998 |
| | National Semiconductor Corp. | 510,400 | 6,993 |
| * | Diodes Inc. | 317,775 | 6,985 |
| * | Skyworks Solutions Inc. | 297,950 | 6,826 |
| * | GSI Commerce Inc. | 233,443 | 5,701 |
| * | Radiant Systems Inc. | 286,636 | 5,592 |
| * | Isilon Systems Inc. | 194,500 | 5,537 |
| *,^ | Veeco Instruments Inc. | 132,000 | 5,524 |
| ^ | VirnetX Holding Corp. | 296,400 | 5,498 |
| * | Aviat Networks Inc. | 1,199,735 | 5,459 |
| * | SolarWinds Inc. | 292,400 | 5,307 |
| * | Coherent Inc. | 125,000 | 5,245 |
| | MAXIMUS Inc. | 82,500 | 5,002 |
9
| | | |
| Vanguard® Explorer Fund | | |
| Schedule of Investments | | |
| October 31, 2010 | | |
| |
| | | | Market |
| | | | Value |
| | | Shares | ($000) |
| * | Websense Inc. | 235,300 | 4,734 |
| | Anixter International Inc. | 86,600 | 4,650 |
| * | Oclaro Inc. | 531,678 | 4,471 |
| * | DealerTrack Holdings Inc. | 220,000 | 4,250 |
| * | Lattice Semiconductor Corp. | 850,400 | 4,133 |
| * | Riverbed Technology Inc. | 70,960 | 4,083 |
| * | PROS Holdings Inc. | 390,700 | 4,063 |
| * | Electronic Arts Inc. | 250,000 | 3,963 |
| * | Brightpoint Inc. | 511,944 | 3,834 |
| | Intersil Corp. Class A | 279,685 | 3,661 |
| *,^ | Constant Contact Inc. | 156,569 | 3,601 |
| * | OSI Systems Inc. | 96,200 | 3,463 |
| * | Manhattan Associates Inc. | 111,400 | 3,429 |
| * | Ancestry.com Inc. | 117,153 | 3,124 |
| | Plantronics Inc. | 83,200 | 2,985 |
| * | Novellus Systems Inc. | 102,000 | 2,979 |
| * | JDS Uniphase Corp. | 276,000 | 2,901 |
| * | Silicon Motion Technology Corp. ADR | 509,200 | 2,750 |
| * | Mantech International Corp. Class A | 66,711 | 2,616 |
| * | Insight Enterprises Inc. | 167,300 | 2,530 |
| | Opnet Technologies Inc. | 124,400 | 2,452 |
| * | Netgear Inc. | 72,900 | 2,246 |
| * | Netscout Systems Inc. | 95,615 | 2,244 |
| * | Mentor Graphics Corp. | 206,400 | 2,229 |
| * | Advanced Micro Devices Inc. | 288,661 | 2,116 |
| * | TIBCO Software Inc. | 108,800 | 2,091 |
| * | Xyratex Ltd. | 119,800 | 1,855 |
| | Global Payments Inc. | 43,400 | 1,691 |
| * | Sanmina-SCI Corp. | 120,100 | 1,583 |
| * | Monolithic Power Systems Inc. | 97,500 | 1,567 |
| *,^ | Power-One Inc. | 143,000 | 1,489 |
| * | Silicon Image Inc. | 241,400 | 1,485 |
| * | Nova Measuring Instruments Ltd. | 250,000 | 1,480 |
| * | InterDigital Inc. | 43,100 | 1,447 |
| | Lender Processing Services Inc. | 48,100 | 1,387 |
| * | Mercury Computer Systems Inc. | 80,500 | 1,275 |
| *,^ | Synaptics Inc. | 45,631 | 1,229 |
| * | DemandTec Inc. | 112,402 | 1,189 |
| * | Interactive Intelligence Inc. | 47,416 | 1,172 |
| * | Hypercom Corp. | 194,500 | 1,159 |
| * | Ulticom Inc. | 125,780 | 1,067 |
| * | Applied Micro Circuits Corp. | 95,545 | 962 |
| * | Kulicke & Soffa Industries Inc. | 142,130 | 884 |
| | Richardson Electronics Ltd. | 77,400 | 837 |
| * | Extreme Networks | 248,700 | 793 |
| * | ADC Telecommunications Inc. | 60,500 | 768 |
| * | Epicor Software Corp. | 77,900 | 732 |
| * | Cirrus Logic Inc. | 55,965 | 719 |
| * | Radisys Corp. | 73,100 | 714 |
| * | CSG Systems International Inc. | 36,000 | 700 |
| * | Saba Software Inc. | 106,576 | 635 |
| * | Ceragon Networks Ltd. | 50,000 | 553 |
| | Heartland Payment Systems Inc. | 36,300 | 518 |
| * | Itron Inc. | 8,400 | 510 |
| * | MIPS Technologies Inc. Class A | 33,920 | 499 |
| * | TriQuint Semiconductor Inc. | 47,700 | 491 |
| * | Zygo Corp. | 41,604 | 445 |
| | DST Systems Inc. | 9,200 | 398 |
| | Blackbaud Inc. | 15,300 | 388 |
| * | Magma Design Automation Inc. | 86,600 | 372 |
| * | Vocus Inc. | 15,050 | 333 |
| | Broadridge Financial Solutions Inc. | 14,200 | 312 |
| * | Unisys Corp. | 11,730 | 270 |
| * | Lionbridge Technologies Inc. | 42,800 | 214 |
10
| | | |
| Vanguard® Explorer Fund | | |
| Schedule of Investments | | |
| October 31, 2010 | | |
| |
| | | | Market |
| | | | Value |
| | | Shares | ($000) |
| | | | 2,387,726 |
| Materials (4.1%) | | |
| | Sensient Technologies Corp. | 1,640,300 | 52,998 |
| | Albemarle Corp. | 866,370 | 43,431 |
| | Silgan Holdings Inc. | 1,059,800 | 35,768 |
| * | Fronteer Gold Inc. | 3,222,895 | 25,590 |
| * | Titanium Metals Corp. | 1,220,123 | 23,988 |
| | Aptargroup Inc. | 504,720 | 22,652 |
| | Steel Dynamics Inc. | 1,365,300 | 19,824 |
| | Olin Corp. | 971,800 | 19,426 |
| | Arch Chemicals Inc. | 467,399 | 16,597 |
| * | OM Group Inc. | 320,150 | 10,652 |
| | Schnitzer Steel Industries Inc. | 199,450 | 10,310 |
| | Balchem Corp. | 291,500 | 8,908 |
| *,^ | STR Holdings Inc. | 358,300 | 8,904 |
| * | Solutia Inc. | 438,450 | 7,940 |
| | Greif Inc. Class A | 133,029 | 7,814 |
| | Walter Energy Inc. | 77,766 | 6,840 |
| | International Flavors & Fragrances Inc. | 131,600 | 6,601 |
| | Schweitzer-Mauduit International Inc. | 91,025 | 5,842 |
| | Ball Corp. | 87,400 | 5,625 |
| | NewMarket Corp. | 45,800 | 5,428 |
| | Ashland Inc. | 94,600 | 4,884 |
| * | Clearwater Paper Corp. | 60,249 | 4,865 |
| | Lubrizol Corp. | 41,600 | 4,264 |
| * | Crown Holdings Inc. | 102,633 | 3,304 |
| | Stepan Co. | 45,498 | 3,068 |
| * | Pactiv Corp. | 88,570 | 2,939 |
| * | PolyOne Corp. | 184,600 | 2,385 |
| | Valspar Corp. | 62,800 | 2,016 |
| | Airgas Inc. | 4,000 | 284 |
| | Neenah Paper Inc. | 8,000 | 123 |
| | | | 373,270 |
| Telecommunication Services (1.2%) | | |
| * | tw telecom inc Class A | 1,536,400 | 28,270 |
| * | SBA Communications Corp. Class A | 610,342 | 23,962 |
| * | MetroPCS Communications Inc. | 2,091,000 | 21,767 |
| * | Clearwire Corp. Class A | 2,537,410 | 17,990 |
| * | Vonage Holdings Corp. | 5,062,865 | 12,910 |
| | Consolidated Communications Holdings Inc. | 200,200 | 3,708 |
| | Frontier Communications Corp. | 319,100 | 2,802 |
| | USA Mobility Inc. | 117,366 | 1,975 |
| | | | 113,384 |
| Utilities (0.7%) | | |
| | ITC Holdings Corp. | 430,800 | 26,973 |
| | UGI Corp. | 809,100 | 24,346 |
| | Ormat Technologies Inc. | 291,580 | 8,313 |
| | Integrys Energy Group Inc. | 28,300 | 1,505 |
| | | | 61,137 |
| Total Common Stocks (Cost $7,141,277) | | 8,854,304 |
11
| | | | | |
| Vanguard® Explorer Fund | | | | |
| Schedule of Investments | | | | |
| October 31, 2010 | | | | |
| |
| | | | | | Market |
| | | | | | Value |
| | | Coupon | | Shares | ($000) |
| Temporary Cash Investments (4.8%)1 | | | | |
| Money Market Fund (4.3%) | | | | |
| 4,5 | Vanguard Market Liquidity Fund | 0.237% | | 393,493,446 | 393,493 |
| |
| |
| | | | | Face | |
| | | | Maturity | Amount | |
| | | | Date | ($000) | |
| Repurchase Agreement (0.1%) | | | | |
| | Deutsche Bank Securities, Inc. | | | | |
| | (Dated 10/29/10, Repurchase Value $9,700,000, | | | | |
| | collateralized by Federal National Mortgage Assn., | | | | |
| | 7.000%, 10/1/38) | 0.220% | 11/1/10 | 9,700 | 9,700 |
| |
| U.S. Government and Agency Obligations (0.4%) | | | | |
| 6,7 | Fannie Mae Discount Notes | 0.281% | 3/31/11 | 30,000 | 29,974 |
| 6,7 | Freddie Mac Discount Notes | 0.296% | 3/31/11 | 3,000 | 2,998 |
| |
| | | | | | 32,972 |
| Total Temporary Cash Investments (Cost $436,155) | | | | 436,165 |
| Total Investments (101.5%) (Cost $7,577,432) | | | | 9,290,469 |
| Other Assets and Liabilities—Net (-1.5%)5 | | | | (137,150) |
| Net Assets (100%) | | | | 9,153,319 |
* Non-income-producing security.
^ Part of security position is on loan to broker-dealers. The total value of securities on loan is $115,387,000.
1 The fund invests a portion of its cash reserves in equity markets through the use of index futures contracts. After giving effect to futures investments, the fund's effective common stock and temporary cash investment positions represent 97.8% and 3.7%, respectively, of net assets.
2 Considered an affiliated company of the fund as the issuer is another member of The Vanguard Group.
3 Considered an affiliated company of the fund as the fund owns more than 5% of the outstanding voting securities of such company.
4 Affiliated money market fund available only to Vanguard funds and certain trusts and accounts managed by Vanguard. Rate shown is the 7-day yield.
5 Includes $118,966,000 of collateral received for securities on loan.
6 The issuer operates under a congressional charter; its securities are not backed by the full faith and credit of the U.S. government.
7 Securities with a value of $32,972,000 have been segregated as initial margin for open futures contracts.
ADR—American Depositary Receipt.
12
Report of Independent Registered Public Accounting Firm
To the Trustees and Shareholders of Vanguard Explorer Fund:
We have audited, in accordance with the standards of the Public Company Accounting Oversight Board (United States), the financial statements (not presented herein) of Vanguard Explorer Fund (the "Fund") as of October 31, 2010 and for the year then ended and have issued our unqualified report thereon dated December 14, 2010. Our audit included audit of the Fund's schedule of investments as of October 31, 2010. This schedule of investments is the responsibility of the Fund's management. Our responsibility is to express an opinion on this schedule of investments based on our audits.
In our opinion, the accompanying schedule of investments referred to above, when read in conjunction with the financial statements of the Fund referred to above, present fairly, in all material respects, the information set forth therein.
PricewaterhouseCoopers LLP
Philadelphia, PA
December 14, 2010
13
|
| © 2010 The Vanguard Group. Inc. |
| All rights reserved. |
| Vanguard Marketing Corporation, Distributor. |
| |
| SNA 240_122010 |
Item 2: Code of Ethics. The Registrant has adopted a code of ethics that applies to the Registrant’s principal executive officer, principal financial officer, principal accounting officer or controller or persons performing similar functions. The Code of Ethics was amended during the reporting period covered by this report to make certain technical, non-material changes.
Item 3: Audit Committee Financial Expert. The following members of the Audit Committee have been determined by the Registrant’s Board of Trustees to be Audit Committee Financial Experts serving on its Audit Committee, and to be independent: Charles D. Ellis, Rajiv L. Gupta, JoAnn Heffernan Heisen, André F. Perold, and Alfred M. Rankin, Jr.
Item 4: Principal Accountant Fees and Services.
(a) Audit Fees.
Audit Fees of the Registrant
Fiscal Year Ended October 31, 2010: $37,000
Fiscal Year Ended October 31, 2009: $34,000
Aggregate Audit Fees of Registered Investment Companies in the Vanguard Group.
Fiscal Year Ended October 31, 2010: $3,607,060
Fiscal Year Ended October 31, 2009: $3,354,640
(b) Audit-Related Fees.
Fiscal Year Ended October 31, 2010: $791,350
Fiscal Year Ended October 31, 2009: $876,210
Includes fees billed in connection with assurance and related services provided to the Registrant, The Vanguard Group, Inc., Vanguard Marketing Corporation, and other registered investment companies in the Vanguard Group.
(c) Tax Fees.
Fiscal Year Ended October 31, 2010: $336,090
Fiscal Year Ended October 31, 2009: $423,070
Includes fees billed in connection with tax compliance, planning and advice services provided to the Registrant, The Vanguard Group, Inc., Vanguard Marketing Corporation, and other registered investment companies in the Vanguard Group and related to income and excise taxes.
(d) All Other Fees.
Fiscal Year Ended October 31, 2010: $16,000
Fiscal Year Ended October 31, 2009: $0
Includes fees billed for services related to risk management and privacy matters. Services were provided to the Registrant, The Vanguard Group, Inc., Vanguard Marketing Corporation, and other registered investment companies in the Vanguard Group.
(e) (1) Pre-Approval Policies. The policy of the Registrant’s Audit Committee is to consider and, if appropriate, approve before the principal accountant is engaged for such services, all specific audit and non-audit services provided to: (1) the Registrant; (2) The Vanguard Group, Inc.; (3) other entities controlled by The Vanguard Group, Inc. that provide ongoing services to the Registrant; and (4) other registered investment companies in the Vanguard Group. In making a determination, the Audit Committee considers whether the services are consistent with maintaining the principal accountant’s independence.
In the event of a contingency situation in which the principal accountant is needed to provide services in between scheduled Audit Committee meetings, the Chairman of the Audit Committee would be called on to consider and, if appropriate, pre-approve audit or permitted non-audit services in an amount sufficient to complete services through the next Audit Committee meeting, and to determine if such services would be consistent with maintaining the accountant’s independence. At the next scheduled Audit Committee meeting, services and fees would be presented to the Audit Committee for formal consideration, and, if appropriate, approval by the entire Audit Committee. The Audit Committee would again consider whether such services and fees are consistent with maintaining the principal accountant’s independence.
The Registrant’s Audit Committee is informed at least annually of all audit and non-audit services provided by the principal accountant to the Vanguard complex, whether such services are provided to: (1) the Registrant; (2) The Vanguard Group, Inc.; (3) other entities controlled by The Vanguard Group, Inc. that provide ongoing services to the Registrant; or (4) other registered investment companies in the Vanguard Group.
(2) No percentage of the principal accountant’s fees or services were approved pursuant to the waiver provision of paragraph (c)(7)(i)(C) of Rule 2-01 of Regulation S-X.
(f) For the most recent fiscal year, over 50% of the hours worked under the principal accountant’s engagement were not performed by persons other than full-time, permanent employees of the principal accountant.
(g) Aggregate Non-Audit Fees.
Fiscal Year Ended October 31, 2010: $352,090
Fiscal Year Ended October 31, 2009: $423,070
Includes fees billed for non-audit services provided to the Registrant, The Vanguard Group, Inc., Vanguard Marketing Corporation, and other registered investment companies in the Vanguard Group.
(h) For the most recent fiscal year, the Audit Committee has determined that the provision of all non-audit services was consistent with maintaining the principal accountant’s independence.
Item 5: Audit Committee of Listed Registrants.
Not Applicable.
Item 6: Investments.
Not Applicable.
Item 7: Disclosure of Proxy Voting Policies and Procedures for Closed-End Management Investment Companies.
Not Applicable.
Item 8: Portfolio Managers of Closed-End Management Investment Companies.
Not Applicable.
Item 9: Purchase of Equity Securities by Closed-End Management Investment Company and Affiliated Purchasers.
Not Applicable.
Item 10: Submission of Matters to a Vote of Security Holders.
Not Applicable.
Item 11: Controls and Procedures.
(a) Disclosure Controls and Procedures. The Principal Executive and Financial Officers concluded that the Registrant's Disclosure Controls and Procedures are effective based on their evaluation of the Disclosure Controls and Procedures as of a date within 90 days of the filing date of this report.
(b) Internal Control Over Financial Reporting. There were no significant changes in Registrant’s Internal Control Over Financial Reporting or in other factors that could significantly affect this control subsequent to the date of the evaluation, including any corrective actions with regard to significant deficiencies and material weaknesses.
Item 12: Exhibits.
(a) Code of Ethics.
(b) Certifications.
Pursuant to the requirements of the Securities Exchange Act of 1934 and the Investment Company Act of 1940, the registrant has duly caused this report to be signed on its behalf by the undersigned, thereunto duly authorized.
| |
| | VANGUARD EXPLORER FUND |
| |
| By: | /s/ F. WILLIAM MCNABB III* |
| | F. WILLIAM MCNABB III |
| | CHIEF EXECUTIVE OFFICER |
| |
| Date: December 20, 2010 |
Pursuant to the requirements of the Securities Exchange Act of 1934 and the Investment Company Act of 1940, this report has been signed below by the following persons on behalf of the registrant and in the capacities and on the dates indicated.
| |
| | VANGUARD EXPLORER FUND |
| |
| By: | /s/ F. WILLIAM MCNABB III* |
| | F. WILLIAM MCNABB III |
| | CHIEF EXECUTIVE OFFICER |
| |
| Date: December 20, 2010 |
| |
| | VANGUARD EXPLORER FUND |
| |
| By: | /s/ THOMAS J. HIGGINS* |
| | THOMAS J. HIGGINS |
| | CHIEF FINANCIAL OFFICER |
| |
| Date: December 20, 2010 |
*By: /s/ Heidi Stam
Heidi Stam, pursuant to a Power of Attorney filed on April 26, 2010, see file Number 33-53683,
Incorporated by Reference.