UNITED STATES
SECURITIES AND EXCHANGE COMMISSION
Washington, D.C. 20549
FORM N-CSR
CERTIFIED SHAREHOLDER REPORT
OF
REGISTERED MANAGEMENT INVESTMENT COMPANIES
| | |
| Investment Company Act file number: | 811-01530 |
Name of Registrant: | Vanguard Explorer Fund |
Address of Registrant: | P.O. Box 2600 |
| | Valley Forge, PA 19482 |
Name and address of agent for service: | Heidi Stam, Esquire |
| | P.O. Box 876 |
| | Valley Forge, PA 19482 |
Registrant’s telephone number, including area code: (610) 669-1000 |
Date of fiscal year end: October 31 | |
Date of reporting period: November 1, 2012 – October 31, 2013 |
Item 1: Reports to Shareholders | |

Annual Report | October 31, 2013
Vanguard Explorer™ Fund

Vanguard’s Principles for Investing Success
We want to give you the best chance of investment success. These principles, grounded in Vanguard’s research and experience, can put you on the right path.
Goals. Create clear, appropriate investment goals.
Balance. Develop a suitable asset allocation using broadly diversified funds. Cost. Minimize cost.
Discipline. Maintain perspective and long-term discipline.
A single theme unites these principles: Focus on the things you can control.
We believe there is no wiser course for any investor.
| |
| Contents | |
| Your Fund’s Total Returns. | 1 |
| Chairman’s Letter. | 2 |
| Advisors’ Report. | 7 |
| Fund Profile. | 12 |
| Performance Summary. | 13 |
| Financial Statements. | 15 |
| Your Fund’s After-Tax Returns. | 30 |
| About Your Fund’s Expenses. | 31 |
| Trustees Approve Advisory Arrangements. | 33 |
| Glossary. | 35 |
Please note: The opinions expressed in this report are just that—informed opinions. They should not be considered promises or advice.
Also, please keep in mind that the information and opinions cover the period through the date on the front of this report. Of course, the
risks of investing in your fund are spelled out in the prospectus.
See the Glossary for definitions of investment terms used in this report.
About the cover: The ship's wheel represents leadership and guidance, essential qualities in navigating difficult seas.
This one is a replica based on an 18th-century British vessel. The HMS Vanguard, another ship of that era, served as the
flagship for Admiral Horatio Nelson when he defeated a French fleet at the Battle of the Nile.
Your Fund’s Total Returns
| |
| Fiscal Year Ended October 31, 2013 | |
| |
| | Total |
| | Returns |
| Vanguard Explorer Fund | |
| Investor Shares | 42.89% |
| Admiral™ Shares | 43.13 |
| Russell 2500 Growth Index | 37.60 |
| Small-Cap Growth Funds Average | 37.16 |
| Small-Cap Growth Funds Average: Derived from data provided by Lipper, a Thomson Reuters Company. |
| Admiral Shares carry lower expenses and are available to investors who meet certain account-balance requirements. |
| | | | |
| Your Fund’s Performance at a Glance | | | | |
| October 31, 2012, Through October 31, 2013 | | | | |
| | | | Distributions Per Share |
| | Starting | Ending | | |
| | Share | Share | Income | Capital |
| | Price | Price | Dividends | Gains |
| Vanguard Explorer Fund | | | | |
| Investor Shares | $78.03 | $107.96 | $0.272 | $2.303 |
| Admiral Shares | 72.68 | 100.54 | 0.392 | 2.142 |
1

Chairman’s Letter
Dear Shareholder,
When markets are surging, small-capitalization stocks are often at the forefront as confident investors more willingly accept the risk that typically accompanies a commitment to smaller, less-established companies. For the fiscal year ended October 31, 2013, Vanguard Explorer Fund fully capitalized on just such an investment climate.
It returned about 43% for both Investor and Admiral Shares, surpassing both its benchmark, the Russell 2500 Growth Index, and the average return of its small-cap growth peers by more than 5 percentage points.
Please note that in August we added Stephens Investment Management Group, LLC, as an advisor to the Explorer Fund. Stephens uses a bottom-up investment approach that combines fundamental research with quantitative screening to identify companies that are poised for earnings growth. The Explorer Fund now relies on seven advisors. Later in this letter, I’ll outline what we see as the benefits of a multi-manager approach to active fund management.
Also, in December, John J. Granahan, co-founder and chairman of Granahan Investment Management, announced his retirement from portfolio management. We’re grateful to Jack for decades of distinguished service to the Explorer Fund. I’m confident that Jack’s colleagues at the firm, which has advised the fund since 1990, will continue to provide excellent stewardship of your assets.
2
If you hold shares in a taxable account, you may wish to review information about the fund’s after-tax returns later in this report. Please note that as of October 31, 2013, the fund had realized short-term capital gains of $1.76 per share and long-term gains of $8.76, together accounting for about 10% of fund assets. Gains are distributed in December.
Amid uncertainty, U.S. stocks found a path to strong returns
U.S. stocks faced several challenges en route to an impressive return of about 29% for the 12 months ended October 31. Investors’ growing appetite for risk drove the rise, as corporate profit growth, in general wasn’t particularly tantalizing.
Although the end of the fiscal year was notable for the budget impasse that resulted in October’s 16-day partial federal government shutdown, the period as a whole was marked by uncertainty about Federal Reserve monetary policy and concern about the economy’s patchy growth. Vanguard’s chief economist, Joe Davis, recently noted that “as was the case at the start of the year, the U.S. economy continues to expand at a modest and uneven pace.”
Outside the United States, stocks returned about 20%. The developed markets of Europe and the Pacific region delivered robust gains; emerging-market stocks failed to keep pace.
| | | |
| Market Barometer | | | |
| |
| | Average Annual Total Returns |
| | Periods Ended October 31, 2013 |
| | One | Three | Five |
| | Year | Years | Years |
| Stocks | | | |
| Russell 1000 Index (Large-caps) | 28.40% | 16.83% | 15.84% |
| Russell 2000 Index (Small-caps) | 36.28 | 17.69 | 17.04 |
| Russell 3000 Index (Broad U.S. market) | 28.99 | 16.89 | 15.94 |
| MSCI All Country World Index ex USA (International) | 20.29 | 6.04 | 12.48 |
| |
| Bonds | | | |
| Barclays U.S. Aggregate Bond Index (Broad taxable market) | -1.08% | 3.02% | 6.09% |
| Barclays Municipal Bond Index (Broad tax-exempt market) | -1.72 | 3.60 | 6.37 |
| Citigroup Three-Month U.S. Treasury Bill Index | 0.06 | 0.07 | 0.12 |
| |
| CPI | | | |
| Consumer Price Index | 0.96% | 2.21% | 1.52% |
3
Bond returns sagged as investors kept a close eye on the Fed
With investors fretting over the Fed’s next move in its stimulative bond-buying program, bonds recorded negative results for the 12 months. The broad U.S. taxable bond market returned –1.08%. The yield of the 10-year Treasury note closed at 2.54%, down from 2.63% at September’s close but up from 1.69% at the end of the previous fiscal year. (Bond yields and prices move in opposite directions.) Municipal bonds returned –1.72%.
Outside the United States, bond markets (as measured by the Barclays Global Aggregate Index ex USD) returned –1.95%.
The Fed’s target for short-term interest rates remained at 0%–0.25%, severely limiting returns of money market funds and savings accounts.
In a good year for small-caps, the Explorer Fund prospered
The stocks of small U.S. companies with strong growth potential—the focus of Vanguard Explorer Fund—were very much in favor during the 12 months, significantly outperforming their large-cap counterparts. The Russell 2500 Growth Index, which includes some mid-caps along with small-caps, returned 37.60%, about 9 percentage points more than the return of the Russell 1000 Growth Index, a gauge of large-cap growth stocks.
| | | |
| Expense Ratios | | | |
| Your Fund Compared With Its Peer Group | | | |
| | Investor | Admiral | Peer Group |
| | Shares | Shares | Average |
| Explorer Fund | 0.51% | 0.34% | 1.47% |
The fund expense ratios shown are from the prospectus dated October 11, 2013, and represent estimated costs for the current fiscal year. For
the fiscal year ended October 31, 2013, the fund’s expense ratios were 0.50% for Investor Shares and 0.34% for Admiral Shares. The
peer-group expense ratio is derived from data provided by Lipper, a Thomson Reuters Company, and captures information through year-end
2012.
Peer group: Small-Cap Growth Funds.
It’s worth remembering that small-cap stocks are generally more volatile than large-caps: Along with the opportunity for sizable gains, there’s a risk of substantial losses. The Explorer Fund’s use of multiple advisors with diverse strategies and its broad exposure to about 600 stocks can help reduce—but certainly not eliminate—that risk.
As I mentioned, favorable market conditions were a factor in the fund’s success during the 12 months, but the advisors deserve credit as well for their superior stock choices. The information technology sector is a good example. The fund’s IT stocks, which accounted for one-quarter of its assets, returned about 40%, 5 percentage points more than their benchmark counterparts.
Investments in software and technology services companies performed particularly well. Small tech firms with seemingly bright prospects for growth proved attractive to investors at a time when larger companies saw no big increases in sales or profits.
Your fund also fared well in health care, one of its larger sectors. Led by soaring biotechnology stocks, the sector returned more than 50%, compared with less than 40% for the benchmark. Biotech stocks were propelled by hopes for treatment breakthroughs. Historically, however, the industry has had its share of busts along with booms; investors’ optimism can fade quickly when companies encounter setbacks with experimental therapies.
| |
| Total Returns | |
| Ten Years Ended October 31, 2013 | |
| | Average |
| | Annual Return |
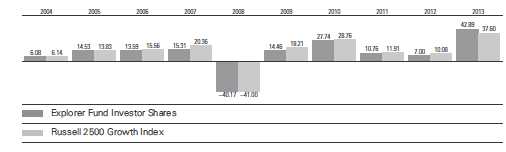
| Explorer Fund Investor Shares | 8.95% |
| Russell 2500 Growth Index | 9.85 |
| Small-Cap Growth Funds Average | 7.72 |
| Small-Cap Growth Funds Average: Derived from data provided by Lipper, a Thomson Reuters Company. |
The figures shown represent past performance, which is not a guarantee of future results. (Current performance may be
lower or higher than the performance data cited. For performance data current to the most recent month-end, visit our
website at vanguard.com/performance.) Note, too, that both investment returns and principal value can fluctuate widely, so
an investor’s shares, when sold, could be worth more or less than their original cost.
5
In energy, despite an impressive absolute return of 29%, the fund didn’t quite keep pace, trailing the benchmark’s 47%.
For more about the advisors’ strategies and the fund’s positioning during the 12 months, see the Advisors’ Report that follows this letter.
Your fund has delivered competitive long-term results
For the decade ended October 31, Vanguard Explorer Fund posted an average annual return of 8.95%. The fund trailed its index but outperformed its peer-group average by more than 1 percentage point.
The decade included periods of extreme volatility, including the trauma of the 2008–2009 financial crisis. It’s a credit to the advisors that the fund weathered these challenges to deliver solid results. We believe that the advisors’ stewardship, supplemented by the fund’s low costs, will keep it competitive over the long term.
Combining diversity of thought with low costs brings benefits
Investors sometimes ask why Vanguard uses a multi-advisor approach for many of its actively managed equity funds. Just as we recommend diversification within and across asset classes for an investor’s overall portfolio, we think significant benefits can accrue from using multiple advisory firms for a single fund: diversity of investment process and style, thought, and holdings.
These elements can lead to less risk and better results. Because not all investment managers invest the same way, their returns relative to the benchmark don’t move in lockstep.
As with many investment topics, however, there are some misconceptions about the benefits of a multi-manager approach. For example, it is often suggested that the best ideas of the advisors are diluted when combined in one portfolio. Recent Vanguard research has found otherwise.
Conventional wisdom also suggests that multi-manager funds tend to be expensive. At Vanguard, this is not the case: Low costs are a hallmark of all our offerings. And Vanguard research indicates that low costs can contribute greatly to investing success, helping investors keep more of a portfolio’s return. (You can read more in Analyzing Multi-Manager Funds: Does Management Structure Affect Performance?, available at vanguard.com/ research.)
As always, thank you for investing with Vanguard.
Sincerely,

F. William McNabb III
Chairman and Chief Executive Officer
November 18, 2013
6
Advisors’ Report
For the 12 months ended October 31, 2013, Vanguard Explorer Fund returned about 43% for both share classes. Your fund is managed by seven independent advisors, a strategy that enhances the fund’s diversification by providing exposure to distinct yet complementary investment approaches. It’s not uncommon for different advisors to have different views about individual securities or the broader investment environment.
As mentioned in the Chairman’s Letter, we have added Stephens Investment Management Group, LLC, as a seventh advisor to the Explorer Fund.
The advisors, the amount and percentage of fund assets each manages, and brief descriptions of their investment strategies are presented in the table on page 11. The advisors have provided the following assessment of the investment environment during the past 12 months and the notable successes and shortfalls in their portfolios. These comments were prepared on November 25, 2013.
Wellington Management Company, llp
Portfolio Manager:
Kenneth L. Abrams, Senior Vice President
and Equity Portfolio Manager
Smaller-capitalization stocks rallied during the fiscal year, and the fund’s benchmark, the Russell 2500 Growth Index, returned nearly 38%. All ten industry sectors in the index posted positive results, led by consumer staples, which returned 59%.
Successes: Our stock selection in the materials, financial, and consumer discretionary sectors significantly boosted the portfolio’s relative returns. GameStop was our top absolute and relative contributor. The retailer, which sells video game software in North America, Europe, and Australia, advanced based on solid operating performance, rising investor confidence about sales of new gaming consoles, and diminishing concern that digital downloads will crimp sales of physical discs. Although we reduced our shares as the stock rose, GameStop remained one of our largest holdings at the period’s close.
Shortfalls: VeriFone Systems was our biggest absolute detractor. When we invested in the electronic payment technologies company, we believed that its established customer base and expanding market would support long-term earnings growth. However, our view changed as weak macroeconomic conditions in Europe, lower revenue from VeriFone’s Brazilian business, decreased merger benefits, and delays in its customer projects depressed earnings estimates, which sent shares lower, and we eliminated our position.
7
Granahan Investment
Management, Inc.
Portfolio Managers:
John J. Granahan, CFA
Co-Founder and Chairman
Gary C. Hatton, CFA, Co-Founder
and Chief Investment Officer
Jane M. White, Co-Founder,
President and Chief Executive Officer
Since the lows of October 2012, the market has shrugged off a great deal of bad news and rallied to new highs. Interestingly, earnings growth in the portfolio has slowed, although it has stabilized.
Our investment approach puts companies into one of three life-cycle categories: pioneer, core growth, and special situation. Valuations of core growth (53% of the portfolio) and special situation (27%) stocks are reasonable, but those in the pioneer category (20%) are more stretched. We believe this reflects the current market’s greater focus on the pioneers’ open-ended potential.
Successes: The United States remains a comparatively attractive place to invest. The portfolio was particularly successful in health care, information technology, and materials.
Shortfalls: The consumer discretionary, energy, and industrials sectors lagged.
Kalmar Investment Advisers
Portfolio Manager:
Ford B. Draper, Jr., President
and Chief Investment Officer
Strong market returns for the 12 months were propelled more by rising valuations than by corporate earnings growth in the slow economy. The magnitude of these returns will be hard to match in the year ahead. Still, despite political dysfunction in Washington that continues to restrain business confidence, early signs of improving domestic and world growth raise the prospect that incremental earnings improvement will support market valuations and enable decent equity returns in 2014. Moreover, the risk of recession over the next several years appears low, which should also help bolster market opportunity.
Successes: Our overall returns were very good; our growth companies in materials, technology, and financials helped the most. The largest individual contributors were Alliance Data Systems and Belden, both in IT, and B/E Aerospace and Chicago Bridge & Iron in industrials.
Shortfalls: Although they did advance, our holdings in consumer discretionary and consumer staples contributed the least. Our biggest detractors were Volcano, in health care; ValueClick and Nuance Communications, both in IT; and SandRidge Energy.
8
Century Capital Management, LLC
Portfolio Manager:
Alexander L. Thorndike, Chief Investment
Officer and Managing Partner
Equity markets kept marching upward, buoyed by improving corporate profitability and rebounds in Europe and Asia. U.S. economic news tied to housing, employment, and consumer sentiment remained positive, and inflation stayed low. Although a pullback in stocks is expected at some point, we believe that valuations are reasonable both relatively and historically. We are also encouraged by strong corporate balance sheets and investment trends.
On the downside, the federal government shutdown and political disputes have raised unnecessary uncertainty for investors and businesses. Investor sentiment generally remains bullish, but the markets continue to be somewhat fragile, and government squabbling could create a negative shift that changes the broader market outlook. Some management teams have indicated that they are waiting to see how Washington resolves tax and spending initiatives before deciding on their 2014 capital spending and human resources budgets. So far, investors assume the parties will reach a short-term resolution that mutes any significant damage to the recovery. More clarity about the eventual tapering of the Federal Reserve’s bond-buying would also help. We will continue to focus on high-quality companies with solid fundamentals, competitive advantages, and pricing power.
Successes: Health care and telecommunication services were our best-performing sectors. Standouts were j2 Global in technology, WuXi PharmaTech in health care, and Whiting Petroleum in energy.
Shortfalls: Industrials and information technology were the weakest sectors. The biggest detractors were Tower Group International in consumer discretionary, Herbalife in consumer staples, and Atlas Air Worldwide Holdings in industrials.
Chartwell Investment Partners, L.P.
Portfolio Managers:
Edward N. Antoian, CFA, CPA,
Managing Partner
John A. Heffern, Managing Partner
and Senior Portfolio Manager
Financial markets rose impressively, underpinned by signs of recovery in employment and housing data, generally positive earnings reports, and supportive Federal Reserve actions, although the period was marked by political distractions in Washington. Against this backdrop, our portfolio decisions steadfastly reflected our bias toward quality, leadership, defensible profit margins, and a pattern of successful execution of growth-oriented business strategies.
Successes: Business process outsourcing provider WNS was our top performer. It reported a string of solid quarters, with accelerating organic revenue growth and market share gains. Commercial real estate and capital markets services firm HFF had
9
strong transaction volume, captured market share, and paid a large special dividend.
Shortfalls: The technology sector disappointed as software providers BroadSoft and Vocus significantly reduced their 2013 revenue and earnings guidance. BroadSoft’s Voice over Internet Protocol (VoIP) rollouts to service providers slowed, and business-model changes affecting profit margins hurt Vocus.
Vanguard Equity Investment Group
Portfolio Managers:
James D. Troyer, CFA, Principal
James P. Stetler, Principal
Michael R. Roach, CFA
Our diversified multi-factor model, which focuses on fundamental conditions and attributes that we believe give investors the best chance of long-term success, produced satisfying results. Specifically, our growth, quality, yields, and market sentiment indicators contributed to performance, although our management decisions indicator slightly detracted.
Successes: Performance was strong in eight of the ten sectors. Stock selection in industrials and IT contributed the most to our relative returns. Overweight positions in EnerSys, Alaska Air Group, and Hertz Global Holdings led in industrials. CalAmp and Ciena were the standouts in IT.
Shortfalls: Alon USA Energy and an underweight position in Cheniere Energy hurt our overall results, as did magicJack VocalTec in telecommunications.
Stephens Investment
Management Group, LLC
Portfolio Manager:
Ryan E. Crane, CFA,
Chief Investment Officer
As a new manager of the Explorer Fund, we took on responsibility for our portion in early August. Through the end of the period, we enjoyed strong absolute performance. We believe that the combination of accommodative monetary policy, a stable economy, and meager growth contributed to strong equity returns and our strategy’s success.
Successes: In our short time managing assets in the fund, health care, technology, and energy were areas of significant strength. Our health care holdings performed well across the board, led by our relative allocations to biotechnology and pharmaceutical stocks. An overweight position in energy, the period’s best-performing sector, drove results. Several holdings benefited from changes brought about by the Affordable Care Act.
Shortfalls: In such a short period, we had few meaningful shortfalls. Generally, our consumer staples stocks lagged the overall market.
10
| | | |
| Vanguard Explorer Fund Investment Advisors | |
| |
| | Fund Assets Managed | |
| Investment Advisor | % | $ Million | Investment Strategy |
| Wellington Management | 28 | 3,378 | Conducts research and analysis of individual |
| Company, LLP | | | companies to select stocks believed to have |
| | | | exceptional growth potential relative to their market |
| | | | valuations. Each stock is considered individually before |
| | | | purchase, and company developments are continually |
| | | | monitored for comparison with expectations for |
| | | | growth. |
| Kalmar Investment Advisers | 23 | 2,751 | Employs a “growth with value” strategy using creative, |
| | | | bottom-up research to uncover vigorously growing, |
| | | | high-quality businesses whose stocks can also be |
| | | | bought inefficiently valued. The strategy has a dual |
| | | | objective of strong returns with lower risk. |
| Granahan Investment | 21 | 2,593 | Bases its investment process on the beliefs that |
| Management, Inc. | | | earnings drive stock prices and that small, dynamic |
| | | | companies with exceptional growth prospects have the |
| | | | greatest long-term potential. A bottom-up, fundamental |
| | | | approach places companies in one of three life-cycle |
| | | | categories: pioneer, core growth, and special situation. |
| | | | In each, the process looks for companies with strong |
| | | | earnings growth potential and leadership in their |
| | | | markets. |
| Century Capital Management, | 9 | 1,062 | Employs a fundamental, bottom-up approach that |
| LLC | | | attempts to identify reasonably priced companies that |
| | | | will grow faster than the overall market. Companies |
| | | | also must have a superior return on equity, high |
| | | | recurring revenues, and improving margins. |
| Chartwell Investment Partners, | 9 | 1,057 | Uses a bottom-up, fundamental, research-driven |
| L.P. | | | stock-selection strategy focusing on companies with |
| | | | sustainable growth, strong management teams, |
| | | | competitive positions, and outstanding product and |
| | | | service offerings. These companies should continually |
| | | | demonstrate growth in earnings per share. |
| Vanguard Equity Investment | 4 | 483 | Employs a quantitative fundamental management |
| Group | | | approach, using models that assess valuation, growth |
| | | | prospects, management decisions, market sentiment, |
| | | | and earnings quality of companies as compared with |
| | | | their peers. |
| Stephens Investment | 2 | 277 | Employs a disciplined, bottom-up investment selection |
| Management Group, LLC | | | process that combines rigorous fundamental analysis |
| | | | with quantitative screening to identify companies with |
| | | | superior earnings growth potential. The approach |
| | | | screens for core growth stocks and for catalyst stocks. |
| | | | Core growth stocks have strong growth franchises, |
| | | | recurring revenue, and above-average growth rates; |
| | | | catalyst stocks are experiencing changes that could |
| | | | lead to accelerated earnings growth. |
| Cash Investments | 4 | 469 | These short-term reserves are invested by Vanguard in |
| | | | equity index products to simulate investment in stocks. |
| | | | Each advisor also may maintain a modest cash |
| | | | position. |
11
Explorer Fund
Fund Profile
As of October 31, 2013
| | |
| Share-Class Characteristics | |
| | Investor | Admiral |
| | Shares | Shares |
| Ticker Symbol | VEXPX | VEXRX |
| Expense Ratio1 | 0.51% | 0.34% |
| 30-Day SEC Yield | 0.06% | 0.22% |
| | | |
| Portfolio Characteristics | | |
| | | | DJ U.S. |
| | | Russell | Total |
| | | 2500 | Market |
| | | Growth | FA |
| | Fund | Index | Index |
| Number of Stocks | 639 | 1,440 | 3,612 |
| Median Market Cap | $3.2B | $3.7B | $41.6B |
| Price/Earnings Ratio | 29.4x | 33.4x | 19.8x |
| Price/Book Ratio | 3.1x | 4.4x | 2.5x |
| Return on Equity | 10.4% | 13.9% | 16.5% |
| Earnings Growth | | | |
| Rate | 12.7% | 14.1% | 10.6% |
| Dividend Yield | 0.6% | 0.8% | 1.9% |
| Foreign Holdings | 3.8% | 0.0% | 0.0% |
| Turnover Rate | 65% | — | — |
| Short-Term Reserves | 2.1% | — | — |
| | | |
| Sector Diversification (% of equity exposure) |
| | | Russell | DJ U.S. |
| | | 2500 | Total |
| | | Growth | Market |
| | Fund | Index | FA Index |
| Consumer | | | |
| Discretionary | 18.5% | 19.0% | 13.3% |
| Consumer Staples | 2.6 | 4.0 | 8.8 |
| Energy | 5.4 | 4.7 | 9.7 |
| Financials | 8.4 | 8.4 | 17.3 |
| Health Care | 15.5 | 16.0 | 12.5 |
| Industrials | 16.6 | 17.9 | 11.5 |
| Information | | | |
| Technology | 25.6 | 20.9 | 17.7 |
| Materials | 6.2 | 7.5 | 3.8 |
| Telecommunication | | | |
| Services | 1.0 | 1.0 | 2.2 |
| Utilities | 0.2 | 0.6 | 3.2 |
| | |
| Volatility Measures | | |
| | | DJ U.S. |
| | Russell 2500 | Total Market |
| | Growth Index | FA Index |
| R-Squared | 0.99 | 0.92 |
| Beta | 0.98 | 1.24 |
| These measures show the degree and timing of the fund’s fluctuations compared with the indexes over 36 months. |
| | |
| Ten Largest Holdings (% of total net assets) |
| Alliance Data Systems | Data Processing & | |
| Corp. | Outsourced Services | 1.3% |
| West Pharmaceutical | | |
| Services Inc. | Health Care Supplies | 1.0 |
| Ultimate Software Group | | |
| Inc. | Application Software | 0.8 |
| Alkermes plc | Biotechnology | 0.8 |
| DSW Inc. | Apparel Retail | 0.8 |
| TiVo Inc. | Application Software | 0.7 |
| Cooper Cos. Inc. | Health Care Supplies | 0.7 |
| PTC Inc. | Application Software | 0.7 |
| Urban Outfitters Inc. | Apparel Retail | 0.6 |
| Dick's Sporting Goods | | |
| Inc. | Specialty Stores | 0.6 |
| Top Ten | | 8.0% |
| The holdings listed exclude any temporary cash investments and equity index products. |
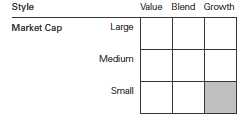
Investment Focus
1 The expense ratios shown are from the prospectus dated October 11, 2013, and represent estimated costs for the current fiscal year. For
the fiscal year ended October 31, 2013, the expense ratios were 0.50% for Investor Shares and 0.34% for Admiral Shares.
12
Explorer Fund
Performance Summary
All of the returns in this report represent past performance, which is not a guarantee of future results that may be achieved by the fund. (Current performance may be lower or higher than the performance data cited. For performance data current to the most recent month-end, visit our website at vanguard.com/performance.) Note, too, that both investment returns and principal value can fluctuate widely, so an investor’s shares, when sold, could be worth more or less than their original cost. The returns shown do not reflect taxes that a shareholder would pay on fund distributions or on the sale of fund shares.
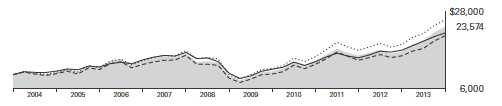
Cumulative Performance: October 31, 2003, Through October 31, 2013
Initial Investment of $10,000
| | | | | |
| | | Average Annual Total Returns | |
| | | Periods Ended October 31, 2013 | |
| |
| | | | | | Final Value |
| | | One | Five | Ten | of a $10,000 |
| | | Year | Years | Years | Investment |
| |
| | Explorer Fund*Investor Shares | 42.89% | 19.88% | 8.95% | $23,574 |
| •••••••• | Russell 2500 Growth Index | 37.60 | 20.87 | 9.85 | 25,578 |
| |
| |
| – – – – | Small-Cap Growth Funds Average | 37.16 | 18.52 | 7.72 | 21,046 |
| | Dow Jones U.S. Total Stock Market | | | | |
| | Float Adjusted Index | 28.86 | 16.01 | 8.13 | 21,850 |
| Small-Cap Growth Funds Average: Derived from data provided by Lipper, a Thomson Reuters Company. | | |
| | | | |
| | | | | Final Value |
| | One | Five | Ten | of a $50,000 |
| | Year | Years | Years | Investment |
| Explorer Fund Admiral Shares | 43.13% | 20.09% | 9.14% | $119,867 |
| Russell 2500 Growth Index | 37.60 | 20.87 | 9.85 | 127,892 |
| Dow Jones U.S. Total Stock Market Float | | | | |
| Adjusted Index | 28.86 | 16.01 | 8.13 | 109,248 |
See Financial Highlights for dividend and capital gains information.
13
Explorer Fund
Fiscal-Year Total Returns (%): October 31, 2003, Through October 31, 2013
Average Annual Total Returns: Periods Ended September 30, 2013
This table presents returns through the latest calendar quarter—rather than through the end of the fiscal period.
Securities and Exchange Commission rules require that we provide this information.
| | | | |
| | Inception | One | Five | Ten |
| | Date | Year | Years | Years |
| Investor Shares | 12/11/1967 | 35.54% | 13.77% | 9.56% |
| Admiral Shares | 11/12/2001 | 35.75 | 13.96 | 9.74 |
14
Explorer Fund
Financial Statements
Statement of Net Assets—Investments Summary
As of October 31, 2013
This Statement summarizes the fund’s holdings by asset type. Details are reported for each of the fund’s 50 largest individual holdings and for investments that, in total for any issuer, represent more than 1% of the fund’s net assets. The total value of smaller holdings is reported as a single amount within each category.
The fund reports a complete list of its holdings in regulatory filings four times in each fiscal year, at the quarter-ends. For the second and fourth fiscal quarters, the complete listing of the fund’s holdings is available electronically on vanguard.com and on the Securities and Exchange Commission’s website (sec.gov), or you can have it mailed to you without charge by calling 800-662-7447. For the first and third fiscal quarters, the fund files the lists with the SEC on Form N-Q. Shareholders can look up the fund’s Forms N-Q on the SEC’s website. Forms N-Q may also be reviewed and copied at the SEC’s Public Reference Room (see the back cover of this report for further information).
| | | | |
| | | | Market | Percentage |
| | | | Value | of Net |
| | | Shares | ($000) | Assets |
| Common Stocks | | | |
| Consumer Discretionary | | | |
| | DSW Inc. Class A | 1,050,926 | 92,135 | 0.8% |
| * | Urban Outfitters Inc. | 2,015,660 | 76,353 | 0.6% |
| | Dick’s Sporting Goods Inc. | 1,377,202 | 73,281 | 0.6% |
| * | Life Time Fitness Inc. | 1,346,145 | 61,142 | 0.5% |
| | Hanesbrands Inc. | 882,213 | 60,096 | 0.5% |
| *,^ | Imax Corp. | 1,971,171 | 57,460 | 0.5% |
| | GameStop Corp. Class A | 974,992 | 53,449 | 0.4% |
| * | DreamWorks Animation SKG Inc. Class A | 1,446,940 | 49,543 | 0.4% |
| * | Buffalo Wild Wings Inc. | 337,197 | 48,078 | 0.4% |
| * | Outerwall Inc. | 708,921 | 46,066 | 0.4% |
| | Consumer Discretionary—Other † | | 1,493,379 | 12.4% |
| | | | 2,110,982 | 17.5% |
| Consumer Staples | | | |
| ^ | Herbalife Ltd. | 759,623 | 49,239 | 0.4% |
| * | United Natural Foods Inc. | 659,294 | 47,107 | 0.4% |
| | Consumer Staples—Other † | | 188,099 | 1.6% |
| | | | 284,445 | 2.4% |
| Energy | | | |
| | Cabot Oil & Gas Corp. | 1,351,830 | 47,747 | 0.4% |
| | Energy—Other † | | 565,982 | 4.7% |
| | | | 613,729 | 5.1% |
| Financials | | | |
| * | Affiliated Managers Group Inc. | 333,335 | 65,814 | 0.6% |
| *,1 | eHealth Inc. | 1,489,965 | 63,502 | 0.5% |
| | NASDAQ OMX Group Inc. | 1,783,477 | 63,189 | 0.5% |
| | Financials—Other † | | 692,122 | 5.7% |
| | | | 884,627 | 7.3% |
15
| | | | |
| Explorer Fund | | | |
| |
| |
| |
| | | | Market | Percentage |
| | | | Value | of Net |
| | | Shares | ($000) | Assets |
| Health Care | | | |
| | West Pharmaceutical Services Inc. | 2,449,920 | 118,454 | 1.0% |
| * | Alkermes plc | 2,684,335 | 94,462 | 0.8% |
| | Cooper Cos. Inc. | 630,876 | 81,516 | 0.7% |
| * | Salix Pharmaceuticals Ltd. | 988,072 | 70,894 | 0.6% |
| * | ICON plc | 1,413,388 | 57,157 | 0.5% |
| | Universal Health Services Inc. Class B | 683,350 | 55,051 | 0.4% |
| * | Bruker Corp. | 2,505,542 | 51,238 | 0.4% |
| * | Cyberonics Inc. | 856,254 | 49,457 | 0.4% |
| 1 | Kindred Healthcare Inc. | 3,223,139 | 44,737 | 0.4% |
| | Health Care—Other † | | 1,149,025 | 9.5% |
| | | | 1,771,991 | 14.7% |
| Industrials | | | |
| | Kennametal Inc. | 1,470,985 | 67,665 | 0.6% |
| * | WESCO International Inc. | 766,800 | 65,531 | 0.5% |
| * | B/E Aerospace Inc. | 773,807 | 62,802 | 0.5% |
| | Pentair Ltd. | 865,650 | 58,076 | 0.5% |
| | Chicago Bridge & Iron Co. NV | 762,451 | 56,490 | 0.5% |
| * | Armstrong World Industries Inc. | 972,435 | 51,957 | 0.4% |
| | AO Smith Corp. | 991,730 | 51,223 | 0.4% |
| | MSC Industrial Direct Co. Inc. Class A | 631,005 | 48,190 | 0.4% |
| | EnerSys Inc. | 716,915 | 47,567 | 0.4% |
| | Industrials—Other † | | 1,383,961 | 11.5% |
| | | | 1,893,462 | 15.7% |
| Information Technology | | | |
| * | Alliance Data Systems Corp. | 652,833 | 154,761 | 1.3% |
| * | Ultimate Software Group Inc. | 658,699 | 101,756 | 0.8% |
| *,1 | TiVo Inc. | 6,144,960 | 81,667 | 0.7% |
| * | PTC Inc. | 2,904,791 | 80,521 | 0.7% |
| * | Cadence Design Systems Inc. | 5,425,360 | 70,367 | 0.6% |
| * | Finisar Corp. | 2,904,400 | 66,830 | 0.6% |
| * | First Solar Inc. | 1,234,268 | 62,047 | 0.5% |
| * | Euronet Worldwide Inc. | 1,394,029 | 60,501 | 0.5% |
| * | Sapient Corp. | 3,554,890 | 56,203 | 0.5% |
| * | WNS Holdings Ltd. ADR | 2,460,687 | 55,341 | 0.5% |
| * | Silicon Laboratories Inc. | 1,304,720 | 52,476 | 0.4% |
| * | Pandora Media Inc. | 2,087,380 | 52,456 | 0.4% |
| * | Acxiom Corp. | 1,571,000 | 52,204 | 0.4% |
| | Ubiquiti Networks Inc. | 1,343,290 | 51,824 | 0.4% |
| | Belden Inc. | 761,985 | 51,251 | 0.4% |
| * | Teradyne Inc. | 2,760,820 | 48,287 | 0.4% |
| * | Infoblox Inc. | 1,072,900 | 47,690 | 0.4% |
| | Information Technology—Other † | | 1,790,376 | 14.8% |
| | | | 2,936,558 | 24.3% |
| Materials | | | |
| | Smurfit Kappa Group plc | 1,960,019 | 47,691 | 0.4% |
| | PolyOne Corp. | 1,517,260 | 45,973 | 0.4% |
| | Materials—Other † | | 618,339 | 5.1% |
| | | | 712,003 | 5.9% |
16
| | | | |
| Explorer Fund | | | | |
| |
| |
| | | | Market | Percentage |
| | | | Value | of Net |
| | | Shares | ($000) | Assets |
| Other | | | | |
| ^,2 Vanguard Small-Cap ETF | | 865,083 | 91,483 | 0.7% |
| ^,2 Vanguard Small-Cap Growth ETF | | 713,200 | 83,701 | 0.7% |
| Other—Other † | | | 21,605 | 0.2% |
| | | | 196,789 | 1.6% |
| |
| Telecommunication Services † | | | 108,898 | 0.9% |
| |
| Utilities † | | | 14,045 | 0.1% |
| Total Common Stocks (Cost $7,826,778) | | | 11,527,529 | 95.5%3 |
| |
| | Coupon | | | |
| Temporary Cash Investments | | | | |
| Money Market Fund | | | | |
| 4,5 Vanguard Market Liquidity Fund | 0.120% | 644,213,000 | 644,213 | 5.3% |
| |
| Repurchase Agreement † | | | 40,900 | 0.4% |
| |
| 6U.S. Government and Agency Obligations † | | | 14,595 | 0.1% |
| Total Temporary Cash Investments (Cost $699,711) | | | 699,708 | 5.8%3 |
| Total Investments (Cost $8,526,489) | | | 12,227,237 | 101.3% |
| Other Assets and Liabilities | | | | |
| Other Assets | | | 119,357 | 1.0% |
| Liabilities5 | | | (276,978) | (2.3%) |
| | | | (157,621) | (1.3%) |
| Net Assets | | | 12,069,616 | 100.0% |
17
| |
| Explorer Fund | |
| |
| |
| |
| At October 31, 2013, net assets consisted of: | |
| | Amount |
| | ($000) |
| Paid-in Capital | 7,171,158 |
| Overdistributed Net Investment Income | (8,098) |
| Accumulated Net Realized Gains | 1,200,167 |
| Unrealized Appreciation (Depreciation) | |
| Investment Securities | 3,700,748 |
| Futures Contracts | 5,640 |
| Foreign Currencies | 1 |
| Net Assets | 12,069,616 |
| |
| |
| Investor Shares—Net Assets | |
| Applicable to 51,618,195 outstanding $.001 par value shares of | |
| beneficial interest (unlimited authorization) | 5,572,579 |
| Net Asset Value Per Share—Investor Shares | $107.96 |
| |
| |
| Admiral Shares—Net Assets | |
| Applicable to 64,623,455 outstanding $.001 par value shares of | |
| beneficial interest (unlimited authorization) | 6,497,037 |
| Net Asset Value Per Share—Admiral Shares | $100.54 |
See Note A in Notes to Financial Statements.
* Non-income-producing security.
^ Includes partial security positions on loan to broker-dealers. The total value of securities on loan is $146,646,000.
† Represents the aggregate value, by category, of securities that are not among the 50 largest holdings and, in total for any issuer,
represent 1% or less of net assets.
1 Considered an affiliated company of the fund as the fund owns more than 5% of the outstanding voting securities of such company.
2 Considered an affiliated company of the fund as the issuer is another member of The Vanguard Group.
3 The fund invests a portion of its cash reserves in equity markets through the use of index futures contracts. After giving effect to futures
investments, the fund’s effective common stock and temporary cash investment positions represent 97.9% and 3.4%, respectively, of net
assets.
4 Affiliated money market fund available only to Vanguard funds and certain trusts and accounts managed by Vanguard. Rate shown is the
7-day yield.
5 Includes $152,293,000 of collateral received for securities on loan.
6 Securities with a value of $11,896,000 have been segregated as initial margin for open futures contracts.
ADR—American Depositary Receipt.
See accompanying Notes, which are an integral part of the Financial Statements.
18
Explorer Fund
Statement of Operations
| |
| | Year Ended |
| | October 31, 2013 |
| | ($000) |
| Investment Income | |
| Income | |
| Dividends1,2 | 69,510 |
| Interest2 | 427 |
| Securities Lending | 8,387 |
| Total Income | 78,324 |
| Expenses | |
| Investment Advisory Fees—Note B | |
| Basic Fee | 21,212 |
| Performance Adjustment | (20) |
| The Vanguard Group—Note C | |
| Management and Administrative—Investor Shares | 14,892 |
| Management and Administrative—Admiral Shares | 5,594 |
| Marketing and Distribution—Investor Shares | 927 |
| Marketing and Distribution—Admiral Shares | 850 |
| Custodian Fees | 135 |
| Auditing Fees | 39 |
| Shareholders’ Reports—Investor Shares | 65 |
| Shareholders’ Reports—Admiral Shares | 68 |
| Trustees’ Fees and Expenses | 30 |
| Total Expenses | 43,792 |
| Expenses Paid Indirectly | (394) |
| Net Expenses | 43,398 |
| Net Investment Income | 34,926 |
| Realized Net Gain (Loss) | |
| Investment Securities Sold2 | 1,296,328 |
| Futures Contracts | 24,851 |
| Foreign Currencies | 3 |
| Realized Net Gain (Loss) | 1,321,182 |
| Change in Unrealized Appreciation (Depreciation) | |
| Investment Securities | 2,267,051 |
| Futures Contracts | 7,823 |
| Foreign Currencies | 1 |
| Change in Unrealized Appreciation (Depreciation) | 2,274,875 |
| Net Increase (Decrease) in Net Assets Resulting from Operations | 3,630,983 |
| 1 Dividends are net of foreign withholding taxes of $265,000. |
| 2 Dividend income, interest income, and realized net gain (loss) from affiliated companies of the fund were $5,784,000, $382,000, and $432,000, respectively. |
See accompanying Notes, which are an integral part of the Financial Statements.
19
Explorer Fund
Statement of Changes in Net Assets
| | |
| | Year Ended October 31, |
| | 2013 | 2012 |
| | ($000) | ($000) |
| Increase (Decrease) in Net Assets | | |
| Operations | | |
| Net Investment Income | 34,926 | 21,187 |
| Realized Net Gain (Loss) | 1,321,182 | 484,760 |
| Change in Unrealized Appreciation (Depreciation) | 2,274,875 | 125,178 |
| Net Increase (Decrease) in Net Assets Resulting from Operations | 3,630,983 | 631,125 |
| Distributions | | |
| Net Investment Income | | |
| Investor Shares | (16,823) | (7,529) |
| Admiral Shares | (20,358) | (10,619) |
| Realized Capital Gain | | |
| Investor Shares | (142,437) | — |
| Admiral Shares | (111,244) | — |
| Total Distributions | (290,862) | (18,148) |
| Capital Share Transactions | | |
| Investor Shares | (1,200,040) | (1,230,052) |
| Admiral Shares | 1,163,674 | 230,431 |
| Net Increase (Decrease) from Capital Share Transactions | (36,366) | (999,621) |
| Total Increase (Decrease) | 3,303,755 | (386,644) |
| Net Assets | | |
| Beginning of Period | 8,765,861 | 9,152,505 |
| End of Period1 | 12,069,616 | 8,765,861 |
| 1 Net Assets—End of Period includes undistributed (overdistributed) net investment income of ($8,098,000) and ($2,738,000). |
See accompanying Notes, which are an integral part of the Financial Statements.
20
Explorer Fund
Financial Highlights
| | | | | |
| Investor Shares | | | | | |
| |
| For a Share Outstanding | Year Ended October 31, |
| Throughout Each Period | 2013 | 2012 | 2011 | 2010 | 2009 |
| Net Asset Value, Beginning of Period | $78.03 | $73.02 | $66.02 | $51.77 | $45.54 |
| Investment Operations | | | | | |
| Net Investment Income | . 2191 | .108 | .077 | .109 | .178 |
| Net Realized and Unrealized Gain (Loss) | | | | | |
| on Investments | 32.286 | 4.998 | 7.029 | 14.239 | 6.334 |
| Total from Investment Operations | 32.505 | 5.106 | 7.106 | 14.348 | 6.512 |
| Distributions | | | | | |
| Dividends from Net Investment Income | (.272) | (. 096) | (.106) | (. 098) | (.282) |
| Distributions from Realized Capital Gains | (2.303) | — | — | — | — |
| Total Distributions | (2.575) | (. 096) | (.106) | (. 098) | (.282) |
| Net Asset Value, End of Period | $107.96 | $78.03 | $73.02 | $66.02 | $51.77 |
| |
| Total Return2 | 42.89% | 7.00% | 10.76% | 27.74% | 14.46% |
| |
| Ratios/Supplemental Data | | | | | |
| Net Assets, End of Period (Millions) | $5,573 | $5,008 | $5,864 | $6,290 | $5,677 |
| Ratio of Total Expenses to | | | | | |
| Average Net Assets3 | 0.50% | 0.49% | 0.50% | 0.49% | 0.54% |
| Ratio of Net Investment Income to | | | | | |
| Average Net Assets | 0.27%1 | 0.16% | 0.12% | 0.19% | 0.38% |
| Portfolio Turnover Rate | 65% | 59% | 89%4 | 82% | 95% |
1 Net investment income per share and the ratio of net investment income to average net assets include $.038 and 0.03%, respectively,
resulting from a special dividend from HFF Inc. in December 2012.
2 Total returns do not include account service fees that may have applied in the periods shown. Fund prospectuses provide information about
any applicable account service fees.
3 Includes performance-based investment advisory fee increases (decreases) of 0.00%, (0.03%), 0.00%, (0.01%), and (0.01%).
4 Excludes the value of portfolio securities received or delivered as a result of in-kind purchases or redemptions of the fund’s capital shares.
See accompanying Notes, which are an integral part of the Financial Statements.
21
Explorer Fund
Financial Highlights
| | | | | |
| Admiral Shares | | | | | |
| |
| For a Share Outstanding | Year Ended October 31, |
| Throughout Each Period | 2013 | 2012 | 2011 | 2010 | 2009 |
| Net Asset Value, Beginning of Period | $72.68 | $68.04 | $61.50 | $48.21 | $42.45 |
| Investment Operations | | | | | |
| Net Investment Income | . 3751 | .236 | .179 | .206 | .246 |
| Net Realized and Unrealized Gain (Loss) | | | | | |
| on Investments | 30.019 | 4.621 | 6.550 | 13.259 | 5.881 |
| Total from Investment Operations | 30.394 | 4.857 | 6.729 | 13.465 | 6.127 |
| Distributions | | | | | |
| Dividends from Net Investment Income | (.392) | (.217) | (.189) | (.175) | (. 367) |
| Distributions from Realized Capital Gains | (2.142) | — | — | — | — |
| Total Distributions | (2.534) | (.217) | (.189) | (.175) | (. 367) |
| Net Asset Value, End of Period | $100.54 | $72.68 | $68.04 | $61.50 | $48.21 |
| |
| Total Return | 43.13% | 7.16% | 10.94% | 27.98% | 14.66% |
| |
| Ratios/Supplemental Data | | | | | |
| Net Assets, End of Period (Millions) | $6,497 | $3,757 | $3,288 | $2,864 | $2,252 |
| Ratio of Total Expenses to | | | | | |
| Average Net Assets2 | 0.34% | 0.32% | 0.34% | 0.32% | 0.34% |
| Ratio of Net Investment Income to | | | | | |
| Average Net Assets | 0.43%1 | 0.33% | 0.28% | 0.36% | 0.58% |
| Portfolio Turnover Rate | 65% | 59% | 89%3 | 82% | 95% |
1 Net investment income per share and the ratio of net investment income to average net assets include $.019 and 0.03%, respectively,
resulting from a special dividend from HFF Inc. in December 2012.
2 Includes performance-based investment advisory fee increases (decreases) of 0.00%, (0.03%), 0.00%, (0.01%), and (0.01%).
3 Excludes the value of portfolio securities received or delivered as a result of in-kind purchases or redemptions of the fund’s capital shares.
See accompanying Notes, which are an integral part of the Financial Statements.
22
Explorer Fund
Notes to Financial Statements
Vanguard Explorer Fund is registered under the Investment Company Act of 1940 as an open-end investment company, or mutual fund. The fund offers two classes of shares: Investor Shares and Admiral Shares. Investor Shares are available to any investor who meets the fund’s minimum purchase requirements. Admiral Shares are designed for investors who meet certain administrative, service, and account-size criteria.
A. The following significant accounting policies conform to generally accepted accounting principles for U.S. mutual funds. The fund consistently follows such policies in preparing its financial statements.
1. Security Valuation: Securities are valued as of the close of trading on the New York Stock Exchange (generally 4 p.m., Eastern time) on the valuation date. Equity securities are valued at the latest quoted sales prices or official closing prices taken from the primary market in which each security trades; such securities not traded on the valuation date are valued at the mean of the latest quoted bid and asked prices. Securities for which market quotations are not readily available, or whose values have been affected by events occurring before the fund’s pricing time but after the close of the securities’ primary markets, are valued at their fair values calculated according to procedures adopted by the board of trustees. These procedures include obtaining quotations from an independent pricing service, monitoring news to identify significant market- or security-specific events, and evaluating changes in the values of foreign market proxies (for example, ADRs, futures contracts, or exchange-traded funds), between the time the foreign markets close and the fund’s pricing time. When fair-value pricing is employed, the prices of securities used by a fund to calculate its net asset value may differ from quoted or published prices for the same securities. Investments in Vanguard Market Liquidity Fund are valued at that fund’s net asset value. Temporary cash investments acquired over 60 days to maturity are valued using the latest bid prices or using valuations based on a matrix system (which considers such factors as security prices, yields, maturities, and ratings), both as furnished by independent pricing services. Other temporary cash investments are valued at amortized cost, which approximates market value.
2. Foreign Currency: Securities and other assets and liabilities denominated in foreign currencies are translated into U.S. dollars using exchange rates obtained from an independent third party as of the fund’s pricing time on the valuation date. Realized gains (losses) and unrealized appreciation (depreciation) on investment securities include the effects of changes in exchange rates since the securities were purchased, combined with the effects of changes in security prices. Fluctuations in the value of other assets and liabilities resulting from changes in exchange rates are recorded as unrealized foreign currency gains (losses) until the assets or liabilities are settled in cash, at which time they are recorded as realized foreign currency gains (losses).
3. Futures Contracts: The fund may use index futures contracts to a limited extent, with the objective of maintaining full exposure to the stock market while maintaining liquidity. The fund may purchase or sell futures contracts to achieve a desired level of investment, whether to accommodate portfolio turnover or cash flows from capital share transactions. The primary risks associated with the use of futures contracts are imperfect correlation between changes in market values of stocks held by the fund and the prices of futures contracts, and the possibility of an illiquid market. Counterparty risk involving futures is mitigated because a regulated clearinghouse is the counterparty instead of the clearing broker. To further mitigate counterparty risk, the fund trades futures contracts on an exchange, monitors the financial strength of its clearing brokers and clearinghouse, and has entered into clearing agreements with its clearing brokers. The clearinghouse imposes initial margin requirements to secure the fund’s performance and requires daily settlement of variation margin representing changes in the market value of each contract.
23
Explorer Fund
Futures contracts are valued at their quoted daily settlement prices. The aggregate notional amounts of the contracts are not recorded in the Statement of Net Assets. Fluctuations in the value of the contracts are recorded in the Statement of Net Assets as an asset (liability) and in the Statement of Operations as unrealized appreciation (depreciation) until the contracts are closed, when they are recorded as realized futures gains (losses).
During the year ended October 31, 2013, the fund’s average investments in long and short futures contracts represented 1% and 0% of net assets, respectively, based on quarterly average aggregate settlement values.
4. Repurchase Agreements: The fund may enter into repurchase agreements with institutional counterparties. Securities pledged as collateral to the fund under repurchase agreements are held by a custodian bank until the agreements mature. Each agreement requires that the market value of the collateral be sufficient to cover payments of interest and principal. The fund further mitigates its counterparty risk by entering into repurchase agreements only with a diverse group of prequalified counterparties, monitoring their financial strength, and entering into master repurchase agreements with its counterparties. The master repurchase agreements provide that, in the event of a counterparty’s default (including bankruptcy), the fund may terminate any repurchase agreements with that counterparty, determine the net amount owed, and sell or retain the collateral up to the net amount owed to the fund. Such action may be subject to legal proceedings, which may delay or limit the disposition of collateral.
5. Federal Income Taxes: The fund intends to continue to qualify as a regulated investment company and distribute all of its taxable income. Management has analyzed the fund’s tax positions taken for all open federal income tax years (October 31, 2010–2013), and has concluded that no provision for federal income tax is required in the fund’s financial statements.
6. Distributions: Distributions to shareholders are recorded on the ex-dividend date.
7. Securities Lending: To earn additional income, the fund may lend its securities to qualified institutional borrowers. Security loans are required to be secured at all times by collateral in an amount at least equal to the market value of securities loaned. Daily market fluctuations could cause the value of loaned securities to be more or less than the value of the collateral received. When this occurs, the collateral is adjusted and settled on the next business day. The fund further mitigates its counterparty risk by entering into securities lending transactions only with a diverse group of prequalified counterparties, monitoring their financial strength, and entering into master securities lending agreements with its counterparties. The master securities lending agreements provide that, in the event of a counterparty’s default (including bankruptcy), the fund may terminate any loans with that borrower, determine the net amount owed, and sell or retain the collateral up to the net amount owed to the fund; however, such actions may be subject to legal proceedings. While collateral mitigates counterparty risk, in the absence of a default the fund may experience delays and costs in recovering the securities loaned. The fund invests cash collateral received in Vanguard Market Liquidity Fund, and records a liability for the return of the collateral, during the period the securities are on loan. Securities lending income represents fees charged to borrowers plus income earned on invested cash collateral, less expenses associated with the loan.
24
Explorer Fund
8. Other: Dividend income is recorded on the ex-dividend date. Interest income includes income distributions received from Vanguard Market Liquidity Fund and is accrued daily. Premiums and discounts on debt securities purchased are amortized and accreted, respectively, to interest income over the lives of the respective securities. Security transactions are accounted for on the date securities are bought or sold. Costs used to determine realized gains (losses) on the sale of investment securities are those of the specific securities sold.
Each class of shares has equal rights as to assets and earnings, except that each class separately bears certain class-specific expenses related to maintenance of shareholder accounts (included in Management and Administrative expenses) and shareholder reporting. Marketing and distribution expenses are allocated to each class of shares based on a method approved by the board of trustees. Income, other non-class-specific expenses, and gains and losses on investments are allocated to each class of shares based on its relative net assets.
B. Wellington Management Company, llp, Kalmar Investment Advisers, Granahan Investment Management, Inc., Century Capital Management, LLC, Chartwell Investment Partners, L.P., and, beginning August 2013, Stephens Investment Management Group, LLC, each provide investment advisory services to a portion of the fund for a fee calculated at an annual percentage rate of average net assets managed by the advisor. The basic fees of Wellington Management Company, llp, Kalmar Investment Advisers, and Granahan Investment Management, Inc., are subject to quarterly adjustments based on performance for the preceding three years relative to the Russell 2500 Growth Index. The basic fee of Century Capital Management, LLC, is subject to quarterly adjustments based on performance for the preceding three years relative to a 50/50 blend of the Russell 2500 Index and Russell 2500 Growth Index. The basic fee of Chartwell Investment Partners, L.P., is subject to quarterly adjustments based on performance for the preceding three years relative to the Russell 2500 Growth Index for periods prior to February 1, 2012, and the current benchmark, Russell 2000 Growth Index, beginning February 1, 2012. The current benchmark willbe fully phased in by January 31, 2015. In accordance with the advisory contract entered into with Stephens Investment Management Group, LLC, beginning August 1, 2014, the investment advisory fee will be subject to quarterly adjustments based on performance since October 31, 2013, relative to the Russell 2500 Growth Index.
The Vanguard Group provides investment advisory services to a portion of the fund on an at-cost basis; the fund paid Vanguard advisory fees of $323,000 for the year ended October 31, 2013.
For the year ended October 31, 2013, the aggregate investment advisory fee represented an effective annual basic rate of 0.21% of the fund’s average net assets, before a decrease of $20,000 (0.00%) based on performance.
C. The Vanguard Group furnishes at cost corporate management, administrative, marketing, and distribution services. The costs of such services are allocated to the fund under methods approved by the board of trustees. The fund has committed to provide up to 0.40% of its net assets in capital contributions to Vanguard. At October 31, 2013, the fund had contributed capital of $1,374,000 to Vanguard (included in Other Assets), representing 0.01% of the fund’s net assets and 0.55% of Vanguard’s capitalization. The fund’s trustees and officers are also directors and officers of Vanguard.
25
Explorer Fund
D. The fund has asked its investment advisors to direct certain security trades, subject to obtaining the best price and execution, to brokers who have agreed to rebate to the fund part of the commissions generated. Such rebates are used solely to reduce the fund’s management and administrative expenses. For the year ended October 31, 2013, these arrangements reduced the fund’s expenses by $394,000 (an annual rate of 0.00% of average net assets).
E. Various inputs may be used to determine the value of the fund’s investments. These inputs are summarized in three broad levels for financial statement purposes. The inputs or methodologies used to value securities are not necessarily an indication of the risk associated with investing in those securities.
Level 1—Quoted prices in active markets for identical securities.
Level 2—Other significant observable inputs (including quoted prices for similar securities, interest rates, prepayment speeds, credit risk, etc.).
Level 3—Significant unobservable inputs (including the fund’s own assumptions used to determine the fair value of investments).
The following table summarizes the market value of the fund’s investments as of October 31, 2013, based on the inputs used to value them:
| | | |
| | Level 1 | Level 2 | Level 3 |
| Investments | ($000) | ($000) | ($000) |
| Common Stocks | 11,456,107 | 66,556 | 4,866 |
| Temporary Cash Investments | 644,213 | 55,495 | — |
| Futures Contracts—Liabilities1 | (2,050) | — | — |
| Total | 12,098,270 | 122,051 | 4,866 |
| 1 Represents variation margin on the last day of the reporting period. |
F. At October 31, 2013, the aggregate settlement value of open futures contracts and the related unrealized appreciation (depreciation) were:
| | | | |
| | | | ($000) |
| | | | Aggregate | |
| | | Number of | Settlement | Unrealized |
| | | Long (Short) | Value | Appreciation |
| Futures Contracts | Expiration | Contracts | Long (Short) | (Depreciation) |
| E-mini Russell 2000 Index | December 2013 | 2,182 | 239,540 | 4,377 |
| E-mini S&P MidCap 400 Index | December 2013 | 404 | 51,971 | 1,263 |
Unrealized appreciation (depreciation) on open futures contracts is required to be treated as realized gain (loss) for tax purposes.
26
Explorer Fund
G. Distributions are determined on a tax basis and may differ from net investment income and realized capital gains for financial reporting purposes. Differences may be permanent or temporary. Permanent differences are reclassified among capital accounts in the financial statements to reflect their tax character. Temporary differences arise when certain items of income, expense, gain, or loss are recognized in different periods for financial statement and tax purposes; these differences will reverse at some time in the future. Differences in classification may also result from the treatment of short-term gains as ordinary income for tax purposes.
The fund used a tax accounting practice to treat a portion of the price of capital shares redeemed during the year as distributions from net investment income and realized capital gains. Accordingly, the fund has reclassified $3,108,000 from overdistributed net investment income, and $116,489,000 from accumulated net realized gains, to paid-in capital.
For tax purposes, at October 31, 2013, the fund had $204,524,000 of ordinary income and $1,018,125,000 of long-term capital gains available for distribution.
At October 31, 2013, the cost of investment securities for tax purposes was $8,530,506,000. Net unrealized appreciation of investment securities for tax purposes was $3,696,731,000, consisting of unrealized gains of $3,877,304,000 on securities that had risen in value since their purchase and $180,573,000 in unrealized losses on securities that had fallen in value since their purchase.
H. During the year ended October 31, 2013, the fund purchased $6,480,432,000 of investment securities and sold $7,012,642,000 of investment securities, other than temporary cash investments.
I. Capital share transactions for each class of shares were:
| | | | |
| | Year Ended October 31, |
| | 2013 | 2012 |
| | Amount | Shares | Amount | Shares |
| | ($000) | (000) | ($000) | (000) |
| Investor Shares | | | | |
| Issued | 512,781 | 5,468 | 476,407 | 6,191 |
| Issued in Lieu of Cash Distributions | 157,299 | 2,003 | 7,422 | 103 |
| Redeemed | (1,870,120) | (20,041) | (1,713,881) | (22,411) |
| Net Increase (Decrease)—Investor Shares | (1,200,040) | (12,570) | (1,230,052) | (16,117) |
| Admiral Shares | | | | |
| Issued | 1,844,750 | 20,811 | 946,621 | 13,411 |
| Issued in Lieu of Cash Distributions | 123,108 | 1,686 | 9,801 | 146 |
| Redeemed | (804,184) | (9,572) | (725,991) | (10,188) |
| Net Increase (Decrease) —Admiral Shares | 1,163,674 | 12,925 | 230,431 | 3,369 |
27
Explorer Fund
J. Certain of the fund’s investments are in companies that are considered to be affiliated companies of the fund because the fund owns more than 5% of the outstanding voting securities of the company. Transactions during the period in securities of these companies were as follows:
| | | | | |
| | | Current Period Transactions | |
| | Oct. 31, 2012 | | Proceeds from | | Oct. 31, 2013 |
| | Market | Purchases | Securities | Dividend | Market |
| | Value | at Cost | Sold | Income | Value |
| | ($000) | ($000) | ($000) | ($000) | ($000) |
| eHealth Inc. | 32,368 | 2,059 | 2,639 | — | 63,502 |
| HFF Inc. Class A | 30,986 | 785 | 27,438 | 3,467 | NA1 |
| Kindred Healthcare Inc. | 27,981 | 6,155 | 1,353 | 355 | 44,737 |
| Optimer Pharmaceuticals Inc. | NA2 | 28,079 | 50,729 | — | NA2 |
| TiVo Inc. | 63,219 | 16,142 | 17,232 | — | 81,667 |
| | 154,554 | | | 3,822 | 189,906 |
| 1 Not applicable—At October 31, 2013, the security was still held, but the issuer was no longer an affiliated company of the fund. |
| 2 Not applicable—At October 31, 2012, and October 31, 2013, the issuer was not an affiliated company of the fund, but it was affiliated during the period. |
K. Management has determined that no material events or transactions occurred subsequent to October 31, 2013, that would require recognition or disclosure in these financial statements.
28
Report of Independent Registered
Public Accounting Firm
To the Trustees and Shareholders of Vanguard Explorer Fund:
In our opinion, the accompanying statement of net assets–investments summary and the related statements of operations and of changes in net assets and the financial highlights present fairly, in all material respects, the financial position of Vanguard Explorer Fund (the “Fund”) at October 31, 2013, the results of its operations for the year then ended, the changes in its net assets for each of the two years in the period then ended, and the financial highlights for each of the five years in the period then ended, in conformity with accounting principles generally accepted in the United States of America. These financial statements and financial highlights (hereafter referred to as “financial statements”) are the responsibility of the Fund’s management; our responsibility is to express an opinion on these financial statements based on our audits. We conducted our audits of these financial statements in accordance with the standards of the Public Company Accounting Oversight Board (United States). Those standards require that we plan and perform the audit to obtain reasonable assurance about whether the financial statements are free of material misstatement. An audit includes examining, on a test basis, evidence supporting the amounts and disclosures in the financial statements, assessing the accounting principles used and significant estimates made by management, and evaluating the overall financial statement presentation. We believe that our audits, which included confirmation of securities at October 31, 2013 by correspondence with the custodians and brokers and by agreement to the underlying ownership records of the transfer agent, provide a reasonable basis for our opinion.
/s/PricewaterhouseCoopers LLP
Philadelphia, Pennsylvania
December 16, 2013
Special 2013 tax information (unaudited) for Vanguard Explorer Fund
This information for the fiscal year ended October 31, 2013, is included pursuant to provisions of
the Internal Revenue Code.
The fund distributed $352,096,000 as capital gain dividends (from net long-term capital gains)
to shareholders during the current fiscal year and $29,161,000 as capital gain dividends (from net
long-term capital gains) to shareholders during the fiscal year ended October 31, 2012.
The fund distributed $37,181,000 of qualified dividend income to shareholders during the fiscal year.
For corporate shareholders, 21.9% of investment income (dividend income plus short-term gains,
if any) qualifies for the dividends-received deduction.
29
Your Fund’s After-Tax Returns
This table presents returns for your fund both before and after taxes. The after-tax returns are shown in two ways: (1) assuming that an investor owned the fund during the entire period and paid taxes on the fund’s distributions, and (2) assuming that an investor paid taxes on the fund’s distributions and sold all shares at the end of each period.
Calculations are based on the highest individual federal income tax and capital gains tax rates in effect at the times of the distributions and the hypothetical sales. State and local taxes were not considered. After-tax returns reflect any qualified dividend income, using actual prior-year figures and estimates for 2013. (In the example, returns after the sale of fund shares may be higher than those assuming no sale. This occurs when the sale would have produced a capital loss. The calculation assumes that the investor received a tax deduction for the loss.)
The table shows returns for one share class only; returns for other share classes will differ. Please note that your actual after-tax returns will depend on your tax situation and may differ from those shown. Also note that if you own the fund in a tax-deferred account, such as an individual retirement account or a 401(k) plan, this information does not apply to you. Such accounts are not subject to current taxes.
Finally, keep in mind that a fund’s performance—whether before or after taxes—does not guarantee future results.
| | | |
| Average Annual Total Returns: Explorer Fund Investor Shares | | | |
| Periods Ended October 31, 2013 | | | |
| |
| |
| | One | Five | Ten |
| | Year | Years | Years |
| Returns Before Taxes | 42.89% | 19.88% | 8.95% |
| Returns After Taxes on Distributions | 42.21 | 19.73 | 8.34 |
| Returns After Taxes on Distributions and Sale of Fund Shares | 25.11 | 16.25 | 7.26 |
30
About Your Fund’s Expenses
As a shareholder of the fund, you incur ongoing costs, which include costs for portfolio management, administrative services, and shareholder reports (like this one), among others. Operating expenses, which are deducted from a fund’s gross income, directly reduce the investment return of the fund.
A fund’s expenses are expressed as a percentage of its average net assets. This figure is known as the expense ratio. The following examples are intended to help you understand the ongoing costs (in dollars) of investing in your fund and to compare these costs with those of other mutual funds. The examples are based on an investment of $1,000 made at the beginning of the period shown and held for the entire period.
The accompanying table illustrates your fund’s costs in two ways:
• Based on actual fund return. This section helps you to estimate the actual expenses that you paid over the period. The ”Ending Account Value“ shown is derived from the fund‘s actual return, and the third column shows the dollar amount that would have been paid by an investor who started with $1,000 in the fund. You may use the information here, together with the amount you invested, to estimate the expenses that you paid over the period.
To do so, simply divide your account value by $1,000 (for example, an $8,600 account value divided by $1,000 = 8.6), then multiply the result by the number given for your fund under the heading ”Expenses Paid During Period.“
• Based on hypothetical 5% yearly return. This section is intended to help you compare your fund‘s costs with those of other mutual funds. It assumes that the fund had a yearly return of 5% before expenses, but that the expense ratio is unchanged. In this case—because the return used is not the fund’s actual return—the results do not apply to your investment. The example is useful in making comparisons because the Securities and Exchange Commission requires all mutual funds to calculate expenses based on a 5% return. You can assess your fund’s costs by comparing this hypothetical example with the hypothetical examples that appear in shareholder reports of other funds.
Note that the expenses shown in the table are meant to highlight and help you compare ongoing costs only and do not reflect transaction costs incurred by the fund for buying and selling securities. Further, the expenses do not include any purchase, redemption, or account service fees described in the fund prospectus. If such fees were applied to your account, your costs would be higher. Your fund does not carry a “sales load.”
The calculations assume no shares were bought or sold during the period. Your actual costs may have been higher or lower, depending on the amount of your investment and the timing of any purchases or redemptions.
You can find more information about the fund’s expenses, including annual expense ratios, in the Financial Statements section of this report. For additional information on operating expenses and other shareholder costs, please refer to your fund’s current prospectus.
31
| | | |
| Six Months Ended October 31, 2013 | | | |
| | Beginning | Ending | Expenses |
| | Account Value | Account Value | Paid During |
| Explorer Fund | 4/30/2013 | 10/31/2013 | Period |
| Based on Actual Fund Return | | | |
| Investor Shares | $1,000.00 | $1,199.96 | $2.83 |
| Admiral Shares | 1,000.00 | 1,200.91 | 1.94 |
| Based on Hypothetical 5% Yearly Return | | | |
| Investor Shares | $1,000.00 | $1,022.63 | $2.60 |
| Admiral Shares | 1,000.00 | 1,023.44 | 1.79 |
The calculations are based on expenses incurred in the most recent six-month period. The fund’s annualized six-month expense ratios for that
period are 0.51% for Investor Shares and 0.35% for Admiral Shares. The dollar amounts shown as “Expenses Paid” are equal to the
annualized expense ratio multiplied by the average account value over the period, multiplied by the number of days in the most recent
six-month period, then divided by the number of days in the most recent 12-month period.
32
Trustees Approve Advisory Arrangements
The board of trustees of Vanguard Explorer Fund added Stephens Investment Management Group, LLC (SIMG), to the fund’s investment advisory team in August 2013. The board also approved an amended advisory arrangement with Granahan Investment Management, Inc. (Granahan). The amended agreement contains a new fee schedule that increases the base fee paid to Granahan. The board had previously renewed the fund’s investment advisory arrangements with Century Capital Management, LLC (Century Capital); Chartwell Investment Partners, L.P. (Chartwell); Kalmar Investment Advisers (Kalmar); Wellington Management Company, llp (Wellington Management); and The Vanguard Group, Inc. (Vanguard) (through its Equity Investment Group). Please see the fund’s semiannual report dated April 30, 2013, for more information about the board’s approval of the arrangements with Century Capital, Kalmar, Wellington Management, and Vanguard.
The board decided to approve the arrangement with SIMG and amended arrangement with Granahan based upon an evaluation of each advisor’s investment staff, portfolio management process, and performance. The trustees considered the factors discussed below, among others. However, no single factor determined whether the board approved the arrangements. Rather, it was the totality of the circumstances that drove the board’s decision.
Nature, extent, and quality of services
The board considered the quality of the fund’s investment management services, and took into account the organizational depth and stability of each advisor. The board noted the following: Granahan. Founded in 1985, Granahan specializes in small-cap growth equity investing. The firm uses fundamental research to select a portfolio of 130–170 stocks with sustainable growth characteristics. Granahan achieves portfolio diversification through dedicated allocations to three categories of growth companies: core growth (35%–70%), represented by companies with strong market position, based on proprietary products or services; pioneers (10%–35%), companies with unique technology or innovations; and special situation (20%–50%), companies with growth potential overlooked by the market. The firm has managed a portion of the fund since 1990.
SIMG. SIMG, a subsidiary of Stephens Investments Holdings LLC, a privately held and family-owned company, is an investment advisory firm founded in 2005. SIMG employs a disciplined, bottom-up investment selection process that combines rigorous fundamental analysis with quantitative screening in an effort to identify companies that exhibit potential for superior earnings growth that is unrecognized by the markets.
The board concluded that each advisor’s experience, stability, depth, and performance, among other factors, warranted approval of the advisory arrangements.
Investment performance
The board analyzed the performance of SIMG’s small- and mid-cap growth portfolio. The board noted that this portfolio’s strategy is substantially similar to the strategy that SIMG will employ when managing fund assets. The board noted that, like some of the current advisors of the fund, SIMG underperformed the benchmark over the one-year period ended May 31, 2013. The board also noted, however, that its portfolio’s return since inception (in 2011) has beaten the Russell 2500 Growth Index. In addition, when comparing SIMG’s small-cap growth strategy’s annualized excess returns relative to the Russell 2000 Growth Index, SIMG has outperformed on a consistent basis.
33
The board also considered the short- and long-term performance of the fund and Granahan, including any periods of outperformance or underperformance relative to a benchmark index and peer group. The board concluded that the performance was such that the advisory arrangement should continue. Information about the fund’s most recent performance can be found in the Performance Summary section of this report.
Cost
The board considered the cost of services to be provided, including consideration of competitive fee rates. The board concluded that the addition of SIMG would result in a modest increase in the fund’s aggregate investment advisory fee but that the fund’s advisory fee and expense ratio would remain significantly below the fund’s peer averages. The board concluded that the fund’s expense ratio was well below the average expense ratio charged by funds in its peer group and that the fund’s advisory fee rate was also well below the peer-group average. Information about the fund’s expenses appears in the About Your Fund’s Expenses section of this report as well as in the Financial Statements section, which also includes information about the fund’s advisory fee rate.
The board did not consider profitability of SIMG or Granahan in determining whether to approve the advisory fees, because the firms are independent of Vanguard and the advisory fees are the result of arm’s-length negotiations. The board does not conduct a profitability analysis of Vanguard because of Vanguard’s unique “at-cost” structure. Unlike most other mutual fund management companies, Vanguard is owned by the funds it oversees, and produces “profits” only in the form of reduced expenses for fund shareholders.
The benefit of economies of scale
The board concluded that the fund’s shareholders benefit from economies of scale because of breakpoints in the advisory fee schedules for SIMG and Granahan. The breakpoints reduce the effective rate of the fees as the fund’s assets managed by each advisor increase.
34
Glossary
30-Day SEC Yield. A fund’s 30-day SEC yield is derived using a formula specified by the U.S. Securities and Exchange Commission. Under the formula, data related to the fund’s security holdings in the previous 30 days are used to calculate the fund’s hypothetical net income for that period, which is then annualized and divided by the fund’s estimated average net assets over the calculation period. For the purposes of this calculation, a security’s income is based on its current market yield to maturity (for bonds), its actual income (for asset-backed securities), or its projected dividend yield (for stocks). Because the SEC yield represents hypothetical annualized income, it will differ—at times significantly—from the fund’s actual experience. As a result, the fund’s income distributions may be higher or lower than implied by the SEC yield.
Beta. A measure of the magnitude of a fund’s past share-price fluctuations in relation to the ups and downs of a given market index. The index is assigned a beta of 1.00. Compared with a given index, a fund with a beta of 1.20 typically would have seen its share price rise or fall by 12% when the index rose or fell by 10%. For this report, beta is based on returns over the past 36 months for both the fund and the index. Note that a fund’s beta should be reviewed in conjunction with its R-squared (see definition). The lower the R-squared, the less correlation there is between the fund and the index, and the less reliable beta is as an indicator of volatility.
Dividend Yield. Dividend income earned by stocks, expressed as a percentage of the aggregate market value (or of net asset value, for a fund). The yield is determined by dividing the amount of the annual dividends by the aggregate value (or net asset value) at the end of the period. For a fund, the dividend yield is based solely on stock holdings and does not include any income produced by other investments.
Earnings Growth Rate. The average annual rate of growth in earnings over the past five years for the stocks now in a fund.
Equity Exposure. A measure that reflects a fund’s investments in stocks and stock futures. Any holdings in short-term reserves are excluded.
Expense Ratio. A fund’s total annual operating expenses expressed as a percentage of the fund’s average net assets. The expense ratio includes management and administrative expenses, but does not include the transaction costs of buying and selling portfolio securities.
Foreign Holdings. The percentage of a fund represented by securities or depositary receipts of companies based outside the United States.
Inception Date. The date on which the assets of a fund (or one of its share classes) are first invested in accordance with the fund’s investment objective. For funds with a subscription period, the inception date is the day after that period ends. Investment performance is measured from the inception date.
Median Market Cap. An indicator of the size of companies in which a fund invests; the midpoint of market capitalization (market price x shares outstanding) of a fund’s stocks, weighted by the proportion of the fund’s assets invested in each stock. Stocks representing half of the fund’s assets have market capitalizations above the median, and the rest are below it.
Price/Book Ratio. The share price of a stock divided by its net worth, or book value, per share. For a fund, the weighted average price/book ratio of the stocks it holds.
35
Price/Earnings Ratio. The ratio of a stock’s current price to its per-share earnings over the past year. For a fund, the weighted average P/E of the stocks it holds. P/E is an indicator of market expectations about corporate prospects; the higher the P/E, the greater the expectations for a company’s future growth.
R-Squared. A measure of how much of a fund’s past returns can be explained by the returns from the market in general, as measured by a given index. If a fund’s total returns were precisely synchronized with an index’s returns, its R-squared would be 1.00. If the fund’s returns bore no relationship to the index’s returns, its R-squared would be 0. For this report, R-squared is based on returns over the past 36 months for both the fund and the index.
Return on Equity. The annual average rate of return generated by a company during the past five years for each dollar of shareholder’s equity (net income divided by shareholder’s equity). For a fund, the weighted average return on equity for the companies whose stocks it holds.
Short-Term Reserves. The percentage of a fund invested in highly liquid, short-term securities that can be readily converted to cash.
Turnover Rate. An indication of the fund’s trading activity. Funds with high turnover rates incur higher transaction costs and may be more likely to distribute capital gains (which may be taxable to investors). The turnover rate excludes in-kind transactions, which have minimal impact on costs.
36
This page intentionally left blank.
This page intentionally left blank.
This page intentionally left blank.
The People Who Govern Your Fund
The trustees of your mutual fund are there to see that the fund is operated and managed in your best interests since, as a shareholder, you are a part owner of the fund. Your fund’s trustees also serve on the board of directors of The Vanguard Group, Inc., which is owned by the Vanguard funds and provides services to them on an at-cost basis.
A majority of Vanguard’s board members are independent, meaning that they have no affiliation with Vanguard or the funds they oversee, apart from the sizable personal investments they have made as private individuals. The independent board members have distinguished backgrounds in business, academia, and public service. Each of the trustees and executive officers oversees 181 Vanguard funds.
The following table provides information for each trustee and executive officer of the fund. More information about the trustees is in the Statement of Additional Information, which can be obtained, without charge, by contacting Vanguard at 800-662-7447, or online at vanguard.com.
| |
| InterestedTrustee1 | and Delphi Automotive LLP (automotive components); |
| | Senior Advisor at New Mountain Capital; Trustee of |
| F. William McNabb III | The Conference Board. |
| Born 1957. Trustee Since July 2009. Chairman of the | |
| Board. Principal Occupation(s) During the Past Five | Amy Gutmann |
| Years: Chairman of the Board of The Vanguard Group, | Born 1949. Trustee Since June 2006. Principal |
| Inc., and of each of the investment companies served | Occupation(s) During the Past Five Years: President |
| by The Vanguard Group, since January 2010; Director | of the University of Pennsylvania; Christopher H. |
| of The Vanguard Group since 2008; Chief Executive | Browne Distinguished Professor of Political Science |
| Officer and President of The Vanguard Group and of | in the School of Arts and Sciences with secondary |
| each of the investment companies served by The | appointments at the Annenberg School for |
| Vanguard Group since 2008; Director of Vanguard | Communication and the Graduate School of Education |
| Marketing Corporation; Managing Director of The | of the University of Pennsylvania; Member of the |
| Vanguard Group (1995–2008). | National Commission on the Humanities and Social |
| | Sciences; Trustee of Carnegie Corporation of New |
| IndependentTrustees | York and of the National Constitution Center; Chair |
| | of the U.S. Presidential Commission for the Study |
| Emerson U. Fullwood | of Bioethical Issues. |
| Born 1948. Trustee Since January 2008. Principal | |
| Occupation(s) During the Past Five Years: Executive | JoAnn Heffernan Heisen |
| Chief Staff and Marketing Officer for North America | Born 1950. Trustee Since July 1998. Principal |
| and Corporate Vice President (retired 2008) of Xerox | Occupation(s) During the Past Five Years: Corporate |
| Corporation (document management products and | Vice President and Chief Global Diversity Officer |
| services); Executive in Residence and 2010 | (retired 2008) and Member of the Executive |
| Distinguished Minett Professor at the Rochester | Committee (1997–2008) of Johnson & Johnson |
| Institute of Technology; Director of SPX Corporation | (pharmaceuticals/medical devices/consumer |
| (multi-industry manufacturing), the United Way of | products); Director of Skytop Lodge Corporation |
| Rochester, Amerigroup Corporation (managed health | (hotels), the University Medical Center at Princeton, |
| care), the University of Rochester Medical Center, | the Robert Wood Johnson Foundation, and the Center |
| Monroe Community College Foundation, and North | for Talent Innovation; Member of the Advisory Board |
| Carolina A&T University. | of the Maxwell School of Citizenship and Public Affairs |
| | at Syracuse University. |
| Rajiv L. Gupta | |
| Born 1945. Trustee Since December 2001.2 | F. Joseph Loughrey |
| Principal Occupation(s) During the Past Five Years: | Born 1949. Trustee Since October 2009. Principal |
| Chairman and Chief Executive Officer (retired 2009) | Occupation(s) During the Past Five Years: President |
| and President (2006–2008) of Rohm and Haas Co. | and Chief Operating Officer (retired 2009) of Cummins |
| (chemicals); Director of Tyco International, Ltd. | Inc. (industrial machinery); Chairman of the Board of |
| (diversified manufacturing and services), Hewlett- | Hillenbrand, Inc. (specialized consumer services) and |
| Packard Co. (electronic computer manufacturing), | of Oxfam America; Director of SKF AB (industrial |
| | |
| machinery), Hyster-Yale Materials Handling, Inc. | Executive Officers | |
| (forklift trucks), and the Lumina Foundation for | | |
| Education; Member of the Advisory Council for the | Glenn Booraem | |
| College of Arts and Letters and of the Advisory Board | Born 1967. Controller Since July 2010. Principal |
| to the Kellogg Institute for International Studies, both | Occupation(s) During the Past Five Years: Principal |
| at the University of Notre Dame. | of The Vanguard Group, Inc.; Controller of each of |
| | the investment companies served by The Vanguard |
| Mark Loughridge | Group; Assistant Controller of each of the investment |
| Born 1953. Trustee Since March 2012. Principal | companies served by The Vanguard Group (2001–2010). |
| Occupation(s) During the Past Five Years: Senior Vice | | |
| President and Chief Financial Officer at IBM (information | Thomas J. Higgins | |
| technology services); Fiduciary Member of IBM’s | Born 1957. Chief Financial Officer Since September |
| Retirement Plan Committee. | 2008. Principal Occupation(s) During the Past Five |
| | Years: Principal of The Vanguard Group, Inc.; Chief |
| Scott C. Malpass | Financial Officer of each of the investment companies |
| Born 1962. Trustee Since March 2012. Principal | served by The Vanguard Group; Treasurer of each of |
| Occupation(s) During the Past Five Years: Chief | the investment companies served by The Vanguard |
| Investment Officer and Vice President at the University | Group (1998–2008). | |
| of Notre Dame; Assistant Professor of Finance at the | | |
| Mendoza College of Business at Notre Dame; Member | Kathryn J. Hyatt | |
| of the Notre Dame 403(b) Investment Committee; | Born 1955. Treasurer Since November 2008. Principal |
| Director of TIFF Advisory Services, Inc. (investment | Occupation(s) During the Past Five Years: Principal of |
| advisor); Member of the Investment Advisory | The Vanguard Group, Inc.; Treasurer of each of the |
| Committees of the Financial Industry Regulatory | investment companies served by The Vanguard |
| Authority (FINRA) and of Major League Baseball. | Group; Assistant Treasurer of each of the investment |
| | companies served by The Vanguard Group (1988–2008). |
| André F. Perold | | |
| Born 1952. Trustee Since December 2004. Principal | Heidi Stam | |
| Occupation(s) During the Past Five Years: George | Born 1956. Secretary Since July 2005. Principal |
| Gund Professor of Finance and Banking at the Harvard | Occupation(s) During the Past Five Years: Managing |
| Business School (retired 2011); Chief Investment | Director of The Vanguard Group, Inc.; General Counsel |
| Officer and Managing Partner of HighVista Strategies | of The Vanguard Group; Secretary of The Vanguard |
| LLC (private investment firm); Director of Rand | Group and of each of the investment companies |
| Merchant Bank; Overseer of the Museum of Fine | served by The Vanguard Group; Director and Senior |
| Arts Boston. | Vice President of Vanguard Marketing Corporation. |
| |
| Alfred M. Rankin, Jr. | | |
| | Vanguard Senior ManagementTeam |
| Born 1941. Trustee Since January 1993. Principal | | |
| Occupation(s) During the Past Five Years: Chairman, | Mortimer J. Buckley | Chris D. McIsaac |
| President, and Chief Executive Officer of NACCO | Kathleen C. Gubanich | Michael S. Miller |
| Industries, Inc. (housewares/lignite) and of Hyster-Yale | Paul A. Heller | James M. Norris |
| Materials Handling, Inc. (forklift trucks); Director of | Martha G. King | Glenn W. Reed |
| the National Association of Manufacturers; Chairman | John T. Marcante | |
| of the Board of University Hospitals of Cleveland; | | |
| Advisory Chairman of the Board of The Cleveland | | |
| Museum of Art. | Chairman Emeritus and Senior Advisor |
| | |
| John J. Brennan | |
| Peter F. Volanakis | Chairman, 1996–2009 | |
| Born 1955. Trustee Since July 2009. Principal | Chief Executive Officer and President, 1996–2008 |
| Occupation(s) During the Past Five Years: President | | |
| and Chief Operating Officer (retired 2010) of Corning | | |
| Incorporated (communications equipment); Director | Founder | |
| of SPX Corporation (multi-industry manufacturing); | | |
| Overseer of the Amos Tuck School of Business | John C. Bogle | |
| Administration at Dartmouth College; Advisor to the | Chairman and Chief Executive Officer, 1974–1996 |
| Norris Cotton Cancer Center. | | |
1 Mr. McNabb is considered an “interested person,” as defined in the Investment Company Act of 1940, because he is an officer of the
Vanguard funds.
2 December 2002 for Vanguard Equity Income Fund, Vanguard Growth Equity Fund, the Vanguard Municipal Bond Funds, and the Vanguard
State Tax-Exempt Funds.
|  |
| | P.O. Box 2600 |
| | Valley Forge, PA 19482-2600 |
| |
| |
| |
| Connect with Vanguard® > vanguard.com | |
| |
| |
| |
| Fund Information > 800-662-7447 | CFA® is a trademark owned by CFA Institute. |
| Direct Investor Account Services > 800-662-2739 | |
| Institutional Investor Services > 800-523-1036 | |
| Text Telephone for People | |
| With Hearing Impairment > 800-749-7273 | |
| |
| This material may be used in conjunction | |
| with the offering of shares of any Vanguard | |
| fund only if preceded or accompanied by | |
| the fund’s current prospectus. | |
| |
| All comparative mutual fund data are from Lipper, a | |
| Thomson Reuters Company, or Morningstar, Inc., unless | |
| otherwise noted. | |
| |
| You can obtain a free copy of Vanguard’s proxy voting | |
| guidelines by visiting vanguard.com/proxyreporting or by | |
| calling Vanguard at 800-662-2739. The guidelines are | |
| also available from the SEC’s website, sec.gov. In | |
| addition, you may obtain a free report on how your fund | |
| voted the proxies for securities it owned during the 12 | |
| months ended June 30. To get the report, visit either | |
| vanguard.com/proxyreporting or sec.gov. | |
| |
| You can review and copy information about your fund at | |
| the SEC’s Public Reference Room in Washington, D.C. To | |
| find out more about this public service, call the SEC at | |
| 202-551-8090. Information about your fund is also | |
| available on the SEC’s website, and you can receive | |
| copies of this information, for a fee, by sending a | |
| request in either of two ways: via e-mail addressed to | |
| publicinfo@sec.gov or via regular mail addressed to the | |
| Public Reference Section, Securities and Exchange | |
| Commission, Washington, DC 20549-1520. | |
| |
| | © 2013 The Vanguard Group, Inc. |
| | All rights reserved. |
| | Vanguard Marketing Corporation, Distributor. |
| |
| | Q240 122013 |
Item 2: Code of Ethics. The Registrant has adopted a code of ethics that applies to the Registrant’s principal executive officer, principal financial officer, principal accounting officer or controller or persons performing similar functions. The Code of Ethics was amended during the reporting period covered by this report to make certain technical, non-material changes.
Item 3: Audit Committee Financial Expert. The following members of the Audit Committee have been determined by the Registrant’s Board of Trustees to be Audit Committee Financial Experts serving on its Audit Committee, and to be independent: Rajiv L. Gupta, Amy Gutmann, JoAnn Heffernan Heisen, F. Joseph Loughrey, Mark Loughridge, Scott C. Malpass, André F. Perold, and Alfred M. Rankin, Jr.
Item 4: Principal Accountant Fees and Services.
(a) Audit Fees.
Audit Fees of the Registrant
Fiscal Year Ended October 31, 2013: $39,000
Fiscal Year Ended October 31, 2012: $38,000
Aggregate Audit Fees of Registered Investment Companies in the Vanguard Group.
Fiscal Year Ended October 31, 2013: $5,714,113
Fiscal Year Ended October 31, 2012: $4,809,780
Includes fees billed in connection with audits of the Registrant and other registered investment companies in the Vanguard complex. Also includes fees billed in connection with audits of The Vanguard Group, Inc. and Vanguard Marketing Corporation for Fiscal Year Ended October 31, 2013.
(b) Audit-Related Fees.
Fiscal Year Ended October 31, 2013: $1,552,950
Fiscal Year Ended October 31, 2012: $1,812,565
Includes fees billed in connection with assurance and related services provided to the Registrant, other registered investment companies in the Vanguard complex, The Vanguard Group, Inc., and Vanguard Marketing Corporation.
(c) Tax Fees.
Fiscal Year Ended October 31, 2013: $110,000
Fiscal Year Ended October 31, 2012: $490,518
Includes fees billed in connection with tax compliance, planning, and advice services provided to the Registrant, other registered investment companies in the Vanguard complex, The Vanguard Group, Inc., and Vanguard Marketing Corporation. Also includes fees billed in connection with certain tax services related to audits of the Registrant and other registered investment companies in the Vanguard complex for Fiscal Year Ended October 31, 2012.
(d) All Other Fees.
Fiscal Year Ended October 31, 2013: $132,000
Fiscal Year Ended October 31, 2012: $16,000
Includes fees billed in connection with tax compliance, planning, and advice services provided to the Registrant, other registered investment companies in the Vanguard complex, The Vanguard Group, Inc., and Vanguard Marketing Corporation.
(e) (1) Pre-Approval Policies. The policy of the Registrant’s Audit Committee is to consider and, if appropriate, approve before the principal accountant is engaged for such services, all specific audit and non-audit services provided to: the Registrant, other registered investment companies in the Vanguard complex, The Vanguard Group, Inc., and entities controlled by The Vanguard Group, Inc. that provide ongoing services to the Registrant. In making a determination, the Audit Committee considers whether the services are consistent with maintaining the principal accountant’s independence.
In the event of a contingency situation in which the principal accountant is needed to provide services in between scheduled Audit Committee meetings, the Chairman of the Audit Committee would be called on to consider and, if appropriate, pre-approve audit or permitted non-audit services in an amount sufficient to complete services through the next Audit Committee meeting, and to determine if such services would be consistent with maintaining the accountant’s independence. At the next scheduled Audit Committee meeting, services and fees would be presented to the Audit Committee for formal consideration, and, if appropriate, approval by the entire Audit Committee. The Audit Committee would again consider whether such services and fees are consistent with maintaining the principal accountant’s independence.
The Registrant’s Audit Committee is informed at least annually of all audit and non-audit services provided by the principal accountant to the Vanguard complex, whether such services are provided to: the Registrant, other registered investment companies in the Vanguard complex, The Vanguard Group, Inc., or other entities controlled by The Vanguard Group, Inc. that provide ongoing services to the Registrant.
(2) No percentage of the principal accountant’s fees or services were approved pursuant to the waiver provision of paragraph (c)(7)(i)(C) of Rule 2-01 of Regulation S-X.
(f) For the most recent fiscal year, over 50% of the hours worked under the principal accountant’s engagement were not performed by persons other than full-time, permanent employees of the principal accountant.
(g) Aggregate Non-Audit Fees.
Fiscal Year Ended October 31, 2013: $242,000
Fiscal Year Ended October 31, 2012: $506,518
Includes fees billed for non-audit services provided to the Registrant, other registered investment companies in the Vanguard complex, The Vanguard Group, Inc., and Vanguard Marketing Corporation.
(h) For the most recent fiscal year, the Audit Committee has determined that the provision of all non-audit services was consistent with maintaining the principal accountant’s independence.
Item 5: Audit Committee of Listed Registrants.
Not Applicable.
Item 6: Investments.
Vanguard® Explorer™ Fund
Schedule of Investments
October 31, 2013
| | | |
| | | | Market |
| | | | Value |
| | | Shares | ($000) |
| |
| Common Stocks (95.5%)1 | | |
| Consumer Discretionary (17.5%) | | |
| | DSW Inc. Class A | 1,050,926 | 92,135 |
| * | Urban Outfitters Inc. | 2,015,660 | 76,353 |
| | Dick's Sporting Goods Inc. | 1,377,202 | 73,281 |
| * | Life Time Fitness Inc. | 1,346,145 | 61,142 |
| | Hanesbrands Inc. | 882,213 | 60,096 |
| *,^ | Imax Corp. | 1,971,171 | 57,460 |
| | GameStop Corp. Class A | 974,992 | 53,449 |
| * | DreamWorks Animation SKG Inc. Class A | 1,446,940 | 49,543 |
| * | Buffalo Wild Wings Inc. | 337,197 | 48,078 |
| * | Outerwall Inc. | 708,921 | 46,066 |
| | Brunswick Corp. | 914,335 | 41,264 |
| | Texas Roadhouse Inc. Class A | 1,482,060 | 40,638 |
| | Dana Holding Corp. | 2,061,900 | 40,413 |
| | Interpublic Group of Cos. Inc. | 2,342,700 | 39,357 |
| * | LKQ Corp. | 1,167,015 | 38,546 |
| | Cheesecake Factory Inc. | 801,698 | 37,880 |
| * | CarMax Inc. | 799,370 | 37,562 |
| | Service Corp. International | 2,015,830 | 36,305 |
| * | Tenneco Inc. | 679,177 | 36,044 |
| | Tractor Supply Co. | 490,100 | 34,969 |
| * | Crocs Inc. | 2,801,300 | 34,120 |
| * | Ulta Salon Cosmetics & Fragrance Inc. | 259,625 | 33,453 |
| | Churchill Downs Inc. | 387,750 | 33,312 |
| * | TRW Automotive Holdings Corp. | 428,565 | 32,189 |
| | HSN Inc. | 598,100 | 31,340 |
| * | Standard Pacific Corp. | 3,950,800 | 31,330 |
| | Ryland Group Inc. | 777,603 | 31,260 |
| | Pier 1 Imports Inc. | 1,490,391 | 31,119 |
| * | Live Nation Entertainment Inc. | 1,535,605 | 29,852 |
| * | Conn's Inc. | 491,912 | 29,731 |
| | Sotheby's | 562,000 | 29,168 |
| | New York Times Co. Class A | 2,032,600 | 28,111 |
| * | Denny's Corp. | 4,193,981 | 26,632 |
| | Six Flags Entertainment Corp. | 676,757 | 25,453 |
| * | Under Armour Inc. Class A | 312,900 | 25,392 |
| | Cinemark Holdings Inc. | 768,700 | 25,221 |
| | Guess? Inc. | 780,365 | 24,386 |
| | Stage Stores Inc. | 1,168,286 | 24,125 |
| | Movado Group Inc. | 517,265 | 24,120 |
| * | MGM Resorts International | 1,219,530 | 23,220 |
| * | Tumi Holdings Inc. | 1,069,220 | 22,828 |
| * | Shutterfly Inc. | 460,998 | 22,653 |
| * | Cabela's Inc. | 348,600 | 20,679 |
| | Shoe Carnival Inc. | 746,300 | 19,396 |
| * | Deckers Outdoor Corp. | 267,500 | 18,412 |
| * | Grand Canyon Education Inc. | 385,330 | 18,215 |
| * | Express Inc. | 781,925 | 18,148 |
| * | Steven Madden Ltd. | 489,217 | 17,944 |
| | Group 1 Automotive Inc. | 269,276 | 17,234 |
| * | Lululemon Athletica Inc. | 247,200 | 17,069 |
| * | Fifth & Pacific Cos. Inc. | 639,130 | 16,931 |
| * | Genesco Inc. | 240,200 | 16,360 |
| | PetSmart Inc. | 223,479 | 16,260 |
| * | Marriott Vacations Worldwide Corp. | 309,886 | 15,519 |
| * | Bally Technologies Inc. | 206,190 | 15,081 |
| * | iRobot Corp. | 428,984 | 14,530 |
| | Oxford Industries Inc. | 186,155 | 13,360 |
| * | Del Frisco's Restaurant Group Inc. | 732,710 | 13,262 |
| | Abercrombie & Fitch Co. | 337,000 | 12,631 |
| * | HomeAway Inc. | 411,210 | 12,192 |
| | Tiffany & Co. | 148,900 | 11,788 |
1
| | | |
| Vanguard® Explorer Fund | | |
| Schedule of Investments | | |
| October 31, 2013 | | |
| |
| | | | Market |
| | | | Value |
| | | Shares | ($000) |
| * | Gentherm Inc. | 468,388 | 10,937 |
| * | Francesca's Holdings Corp. | 594,500 | 10,695 |
| | Brinker International Inc. | 211,274 | 9,385 |
| * | BJ's Restaurants Inc. | 338,610 | 9,163 |
| | Vail Resorts Inc. | 127,517 | 8,984 |
| * | Krispy Kreme Doughnuts Inc. | 350,875 | 8,512 |
| * | Hibbett Sports Inc. | 138,400 | 8,073 |
| * | Meritage Homes Corp. | 128,400 | 5,828 |
| * | Helen of Troy Ltd. | 123,006 | 5,747 |
| * | LifeLock Inc. | 323,175 | 5,200 |
| | KB Home | 303,800 | 5,155 |
| * | Tesla Motors Inc. | 29,590 | 4,733 |
| * | Steiner Leisure Ltd. | 82,017 | 4,595 |
| * | Discovery Communications Inc. | 48,100 | 3,978 |
| | Goodyear Tire & Rubber Co. | 178,500 | 3,745 |
| * | Wet Seal Inc. Class A | 1,123,025 | 3,717 |
| * | Starz | 121,100 | 3,651 |
| | Ross Stores Inc. | 47,100 | 3,643 |
| | Domino's Pizza Inc. | 53,342 | 3,577 |
| * | AMC Networks Inc. Class A | 49,700 | 3,483 |
| | Cracker Barrel Old Country Store Inc. | 30,000 | 3,296 |
| * | Chuy's Holdings Inc. | 87,104 | 3,275 |
| | National CineMedia Inc. | 174,500 | 3,057 |
| ^ | Sturm Ruger & Co. Inc. | 45,150 | 2,953 |
| * | Lions Gate Entertainment Corp. | 84,287 | 2,915 |
| * | Jarden Corp. | 52,100 | 2,884 |
| * | Red Robin Gourmet Burgers Inc. | 36,600 | 2,788 |
| | Papa John's International Inc. | 36,300 | 2,747 |
| * | Asbury Automotive Group Inc. | 54,600 | 2,624 |
| | Aaron's Inc. | 91,100 | 2,584 |
| * | Bloomin' Brands Inc. | 102,800 | 2,573 |
| | Regal Entertainment Group Class A | 132,700 | 2,523 |
| | Buckle Inc. | 49,400 | 2,418 |
| * | Orbitz Worldwide Inc. | 254,100 | 2,348 |
| *,^ | Smith & Wesson Holding Corp. | 216,300 | 2,332 |
| | American Eagle Outfitters Inc. | 138,900 | 2,152 |
| | Brown Shoe Co. Inc. | 94,500 | 2,121 |
| * | Madison Square Garden Co. Class A | 33,700 | 2,040 |
| | GNC Holdings Inc. Class A | 34,400 | 2,023 |
| * | Overstock.com Inc. | 80,750 | 1,892 |
| | Tupperware Brands Corp. | 21,000 | 1,883 |
| * | Multimedia Games Holding Co. Inc. | 48,600 | 1,580 |
| * | Jack in the Box Inc. | 35,900 | 1,460 |
| | DineEquity Inc. | 15,600 | 1,280 |
| | Haverty Furniture Cos. Inc. | 41,500 | 1,154 |
| * | Lumber Liquidators Holdings Inc. | 9,600 | 1,096 |
| | Dillard's Inc. Class A | 12,000 | 984 |
| | Arctic Cat Inc. | 18,600 | 975 |
| | Big 5 Sporting Goods Corp. | 29,700 | 562 |
| | PetMed Express Inc. | 29,500 | 438 |
| * | Libbey Inc. | 14,200 | 303 |
| | Core-Mark Holding Co. Inc. | 2,800 | 198 |
| * | ANN Inc. | 3,271 | 116 |
| | | | 2,110,982 |
| Consumer Staples (2.4%) | | |
| ^ | Herbalife Ltd. | 759,623 | 49,239 |
| * | United Natural Foods Inc. | 659,294 | 47,107 |
| | PriceSmart Inc. | 379,752 | 43,212 |
| | Hillshire Brands Co. | 1,020,100 | 33,490 |
| | Sanderson Farms Inc. | 465,900 | 29,450 |
| | Casey's General Stores Inc. | 319,000 | 23,249 |
| | Glanbia plc | 1,347,697 | 18,865 |
| * | Fresh Market Inc. | 249,430 | 12,698 |
| | Nu Skin Enterprises Inc. Class A | 40,027 | 4,680 |
2
| | | |
| Vanguard® Explorer Fund | | |
| Schedule of Investments | | |
| October 31, 2013 | | |
| |
| | | | Market |
| | | | Value |
| | | Shares | ($000) |
| * | Rite Aid Corp. | 631,000 | 3,363 |
| * | Fairway Group Holdings Corp. | 117,900 | 2,880 |
| | Whole Foods Market Inc. | 44,700 | 2,822 |
| * | TreeHouse Foods Inc. | 37,800 | 2,769 |
| * | Annie's Inc. | 56,600 | 2,674 |
| * | Pilgrim's Pride Corp. | 161,486 | 2,288 |
| | Ingredion Inc. | 34,400 | 2,262 |
| * | Green Mountain Coffee Roasters Inc. | 29,500 | 1,853 |
| * | Prestige Brands Holdings Inc. | 33,900 | 1,059 |
| * | SUPERVALU Inc. | 69,000 | 485 |
| | | | 284,445 |
| Energy (5.1%) | | |
| | Cabot Oil & Gas Corp. | 1,351,830 | 47,747 |
| | Core Laboratories NV | 233,675 | 43,749 |
| * | Rosetta Resources Inc. | 652,900 | 39,135 |
| * | Superior Energy Services Inc. | 1,436,752 | 38,548 |
| | Patterson-UTI Energy Inc. | 1,441,800 | 34,978 |
| * | Atwood Oceanics Inc. | 595,025 | 31,614 |
| * | Whiting Petroleum Corp. | 472,585 | 31,611 |
| * | Gulfport Energy Corp. | 492,575 | 28,909 |
| | Western Refining Inc. | 868,100 | 28,014 |
| * | Southwestern Energy Co. | 689,230 | 25,653 |
| * | TETRA Technologies Inc. | 1,514,916 | 19,648 |
| �� | Alon USA Energy Inc. | 1,620,900 | 19,580 |
| | Trican Well Service Ltd. | 1,361,900 | 19,136 |
| | RPC Inc. | 969,250 | 17,776 |
| * | Basic Energy Services Inc. | 1,187,808 | 17,425 |
| * | Kodiak Oil & Gas Corp. | 1,321,748 | 17,143 |
| * | Carrizo Oil & Gas Inc. | 382,127 | 16,752 |
| * | Bonanza Creek Energy Inc. | 328,885 | 16,622 |
| | SemGroup Corp. Class A | 268,440 | 16,211 |
| *,^ | Clean Energy Fuels Corp. | 1,228,620 | 13,994 |
| * | Approach Resources Inc. | 449,300 | 12,648 |
| * | Rex Energy Corp. | 523,215 | 11,249 |
| * | ION Geophysical Corp. | 2,155,947 | 10,004 |
| | Oceaneering International Inc. | 113,300 | 9,730 |
| * | Pioneer Energy Services Corp. | 1,110,098 | 9,325 |
| * | Key Energy Services Inc. | 1,099,800 | 8,600 |
| * | Dril-Quip Inc. | 31,400 | 3,687 |
| * | Alpha Natural Resources Inc. | 526,200 | 3,683 |
| | CVR Energy Inc. | 58,700 | 2,332 |
| | Range Resources Corp. | 27,400 | 2,074 |
| | Delek US Holdings Inc. | 74,100 | 1,893 |
| * | Hercules Offshore Inc. | 272,700 | 1,854 |
| | HollyFrontier Corp. | 37,746 | 1,739 |
| * | Forum Energy Technologies Inc. | 58,700 | 1,718 |
| | SEACOR Holdings Inc. | 17,500 | 1,712 |
| * | Oil States International Inc. | 14,500 | 1,575 |
| *,^ | Halcon Resources Corp. | 293,400 | 1,520 |
| * | Frank's International NV | 49,000 | 1,499 |
| | EXCO Resources Inc. | 221,900 | 1,200 |
| * | Oasis Petroleum Inc. | 17,700 | 943 |
| * | Newpark Resources Inc. | 30,800 | 393 |
| | SM Energy Co. | 1,200 | 106 |
| | | | 613,729 |
| Financials (7.3%) | | |
| * | Affiliated Managers Group Inc. | 333,335 | 65,814 |
| *,2 | eHealth Inc. | 1,489,965 | 63,502 |
| | NASDAQ OMX Group Inc. | 1,783,477 | 63,189 |
| | East West Bancorp Inc. | 1,160,110 | 39,084 |
| | CapitalSource Inc. | 2,894,700 | 37,863 |
| | Brown & Brown Inc. | 1,126,865 | 35,981 |
| | Zions Bancorporation | 1,240,490 | 35,193 |
| | Och-Ziff Capital Management Group LLC Class A | 2,669,149 | 33,338 |
3
| | |
| Vanguard® Explorer Fund | | |
| Schedule of Investments | | |
| October 31, 2013 | | |
| |
| | | Market |
| | | Value |
| | Shares | ($000) |
| * WisdomTree Investments Inc. | 2,346,574 | 32,617 |
| Solar Capital Ltd. | 1,390,000 | 31,900 |
| MFA Financial Inc. | 4,271,125 | 31,649 |
| Radian Group Inc. | 2,152,649 | 31,364 |
| Financial Engines Inc. | 532,800 | 29,768 |
| International Bancshares Corp. | 1,231,796 | 28,147 |
| Protective Life Corp. | 579,747 | 26,715 |
| Primerica Inc. | 613,800 | 26,363 |
| Synovus Financial Corp. | 7,727,915 | 25,116 |
| HFF Inc. Class A | 873,378 | 21,441 |
| Redwood Trust Inc. | 1,209,000 | 21,182 |
| * Stifel Financial Corp. | 515,107 | 21,094 |
| * Signature Bank | 203,830 | 20,754 |
| ^ Cohen & Steers Inc. | 453,124 | 17,382 |
| First Industrial Realty Trust Inc. | 902,155 | 16,302 |
| Evercore Partners Inc. Class A | 296,980 | 14,989 |
| PacWest Bancorp | 378,662 | 14,408 |
| Cathay General Bancorp | 491,638 | 12,109 |
| Cardinal Financial Corp. | 570,569 | 9,414 |
| STAG Industrial Inc. | 405,900 | 8,487 |
| Lexington Realty Trust | 721,680 | 8,444 |
| * Portfolio Recovery Associates Inc. | 131,200 | 7,800 |
| * Encore Capital Group Inc. | 102,200 | 4,992 |
| * IntercontinentalExchange Inc. | 17,900 | 3,450 |
| * First Cash Financial Services Inc. | 50,200 | 3,037 |
| * World Acceptance Corp. | 28,076 | 2,923 |
| * Credit Acceptance Corp. | 23,335 | 2,760 |
| * SVB Financial Group | 27,700 | 2,653 |
| American Financial Group Inc. | 45,600 | 2,565 |
| Omega Healthcare Investors Inc. | 65,600 | 2,181 |
| Nelnet Inc. Class A | 49,676 | 2,118 |
| * Arch Capital Group Ltd. | 34,600 | 2,005 |
| Federated Investors Inc. Class B | 73,700 | 1,999 |
| ProAssurance Corp. | 42,700 | 1,935 |
| Corrections Corp. of America | 51,300 | 1,898 |
| Axis Capital Holdings Ltd. | 39,000 | 1,849 |
| Regency Centers Corp. | 33,100 | 1,710 |
| Apartment Investment & Management Co. Class A | 60,300 | 1,687 |
| * Realogy Holdings Corp. | 34,500 | 1,419 |
| Extra Space Storage Inc. | 30,000 | 1,380 |
| Inland Real Estate Corp. | 107,800 | 1,152 |
| Ryman Hospitality Properties Inc. | 29,800 | 1,100 |
| CoreSite Realty Corp. | 30,800 | 999 |
| * FelCor Lodging Trust Inc. | 134,900 | 906 |
| Montpelier Re Holdings Ltd. | 32,300 | 892 |
| Sovran Self Storage Inc. | 9,600 | 734 |
| Oritani Financial Corp. | 42,400 | 688 |
| Spirit Realty Capital Inc. | 61,100 | 639 |
| Rayonier Inc. | 12,627 | 594 |
| Geo Group Inc. | 14,000 | 494 |
| GAMCO Investors Inc. | 6,800 | 486 |
| MarketAxess Holdings Inc. | 6,400 | 417 |
| Universal Health Realty Income Trust | 9,200 | 404 |
| QC Holdings Inc. | 165,033 | 388 |
| * Nationstar Mortgage Holdings Inc. | 5,900 | 303 |
| * Ambac Financial Group Inc. | 12,600 | 254 |
| Federal Realty Investment Trust | 1,000 | 104 |
| Tree.com Inc. | 3,500 | 103 |
| | | 884,627 |
| Health Care (14.7%) | | |
| West Pharmaceutical Services Inc. | 2,449,920 | 118,454 |
| * Alkermes plc | 2,684,335 | 94,462 |
| Cooper Cos. Inc. | 630,876 | 81,516 |
| * Salix Pharmaceuticals Ltd. | 988,072 | 70,894 |
4
| | | |
| Vanguard® Explorer Fund | | |
| Schedule of Investments | | |
| October 31, 2013 | | |
| |
| | | | Market |
| | | | Value |
| | | Shares | ($000) |
| * | ICON plc | 1,413,388 | 57,157 |
| | Universal Health Services Inc. Class B | 683,350 | 55,051 |
| * | Bruker Corp. | 2,505,542 | 51,238 |
| * | Cyberonics Inc. | 856,254 | 49,457 |
| 2 | Kindred Healthcare Inc. | 3,223,139 | 44,737 |
| ^ | ResMed Inc. | 854,489 | 44,211 |
| * | WellCare Health Plans Inc. | 655,800 | 43,729 |
| * | Globus Medical Inc. | 2,162,194 | 41,514 |
| * | Covance Inc. | 445,645 | 39,778 |
| * | Henry Schein Inc. | 338,350 | 38,041 |
| | Community Health Systems Inc. | 827,700 | 36,113 |
| * | Regeneron Pharmaceuticals Inc. | 124,800 | 35,893 |
| * | Insulet Corp. | 907,115 | 35,396 |
| * | Catamaran Corp. | 684,347 | 32,137 |
| * | Mettler-Toledo International Inc. | 128,259 | 31,739 |
| * | Actavis plc | 194,930 | 30,132 |
| * | Vertex Pharmaceuticals Inc. | 388,100 | 27,687 |
| * | BioMarin Pharmaceutical Inc. | 429,800 | 27,000 |
| | DENTSPLY International Inc. | 560,350 | 26,393 |
| * | MedAssets Inc. | 1,129,385 | 26,010 |
| * | Bio-Rad Laboratories Inc. Class A | 209,240 | 25,845 |
| * | WuXi PharmaTech Cayman Inc. ADR | 839,734 | 24,562 |
| * | Haemonetics Corp. | 567,315 | 23,010 |
| * | Tornier NV | 1,032,704 | 22,213 |
| * | Luminex Corp. | 1,132,501 | 22,084 |
| * | Brookdale Senior Living Inc. Class A | 783,362 | 21,213 |
| * | Jazz Pharmaceuticals plc | 233,152 | 21,156 |
| * | Santarus Inc. | 872,740 | 20,361 |
| * | Allscripts Healthcare Solutions Inc. | 1,395,400 | 19,298 |
| * | Molina Healthcare Inc. | 605,854 | 19,169 |
| * | QIAGEN NV | 827,000 | 19,153 |
| * | Elan Corp. plc ADR | 1,113,373 | 18,549 |
| * | ABIOMED Inc. | 749,300 | 17,968 |
| * | Alexion Pharmaceuticals Inc. | 142,703 | 17,545 |
| * | NPS Pharmaceuticals Inc. | 600,527 | 17,283 |
| * | Nektar Therapeutics | 1,808,000 | 17,194 |
| * | Align Technology Inc. | 298,300 | 17,021 |
| * | Portola Pharmaceuticals Inc. | 763,248 | 16,906 |
| | Air Methods Corp. | 357,002 | 15,608 |
| *,^ | Exelixis Inc. | 2,801,947 | 13,814 |
| * | Isis Pharmaceuticals Inc. | 398,439 | 13,256 |
| * | Akorn Inc. | 622,122 | 12,716 |
| * | Hyperion Therapeutics Inc. | 600,440 | 12,027 |
| * | Volcano Corp. | 568,389 | 10,896 |
| * | Incyte Corp. Ltd. | 277,415 | 10,819 |
| * | Seattle Genetics Inc. | 278,200 | 10,747 |
| * | ImmunoGen Inc. | 640,000 | 10,534 |
| * | Pacira Pharmaceuticals Inc. | 205,186 | 10,364 |
| * | Sarepta Therapeutics Inc. | 217,660 | 8,476 |
| | Masimo Corp. | 330,136 | 8,458 |
| * | Cepheid Inc. | 203,550 | 8,289 |
| * | Wright Medical Group Inc. | 289,485 | 7,865 |
| * | Exact Sciences Corp. | 633,058 | 6,976 |
| | Invacare Corp. | 313,350 | 6,728 |
| | Trinity Biotech plc ADR | 262,863 | 6,572 |
| * | MWI Veterinary Supply Inc. | 40,818 | 6,475 |
| * | Aegerion Pharmaceuticals Inc. | 62,142 | 5,147 |
| * | ViroPharma Inc. | 126,425 | 4,908 |
| * | Neogen Corp. | 93,750 | 4,333 |
| * | Medidata Solutions Inc. | 39,000 | 4,302 |
| * | ICU Medical Inc. | 69,300 | 4,283 |
| * | Illumina Inc. | 42,300 | 3,955 |
| * | United Therapeutics Corp. | 43,300 | 3,833 |
| * | Endo Health Solutions Inc. | 81,000 | 3,542 |
5
| | | |
| Vanguard® Explorer Fund | | |
| Schedule of Investments | | |
| October 31, 2013 | | |
| |
| | | | Market |
| | | | Value |
| | | Shares | ($000) |
| * | athenahealth Inc. | 26,500 | 3,538 |
| * | Cerner Corp. | 62,800 | 3,519 |
| | HealthSouth Corp. | 90,102 | 3,164 |
| | Questcor Pharmaceuticals Inc. | 49,724 | 3,052 |
| * | Centene Corp. | 52,900 | 2,971 |
| * | PAREXEL International Corp. | 63,400 | 2,898 |
| * | Charles River Laboratories International Inc. | 57,500 | 2,830 |
| * | IDEXX Laboratories Inc. | 25,100 | 2,707 |
| * | IPC The Hospitalist Co. Inc. | 48,400 | 2,652 |
| * | HMS Holdings Corp. | 114,700 | 2,424 |
| * | Sirona Dental Systems Inc. | 31,500 | 2,276 |
| | Chemed Corp. | 33,106 | 2,245 |
| * | Quintiles Transnational Holdings Inc. | 52,600 | 2,209 |
| * | NuVasive Inc. | 68,900 | 2,190 |
| * | Cambrex Corp. | 121,958 | 2,051 |
| * | Acadia Healthcare Co. Inc. | 46,300 | 2,008 |
| * | AMN Healthcare Services Inc. | 145,200 | 1,800 |
| | PDL BioPharma Inc. | 214,300 | 1,734 |
| * | Hologic Inc. | 75,900 | 1,699 |
| * | Providence Service Corp. | 50,200 | 1,500 |
| * | Addus HomeCare Corp. | 42,000 | 1,086 |
| * | Surgical Care Affiliates Inc. | 35,500 | 932 |
| * | Ligand Pharmaceuticals Inc. Class B | 17,800 | 921 |
| * | Alliance HealthCare Services Inc. | 35,600 | 897 |
| * | Prothena Corp. plc | 33,894 | 815 |
| * | Sagent Pharmaceuticals Inc. | 36,700 | 796 |
| | Abaxis Inc. | 18,900 | 675 |
| | Meridian Bioscience Inc. | 25,700 | 635 |
| * | Thoratec Corp. | 12,900 | 557 |
| * | Team Health Holdings Inc. | 8,000 | 348 |
| * | Endocyte Inc. | 29,150 | 304 |
| * | Medical Action Industries Inc. | 42,100 | 255 |
| | Utah Medical Products Inc. | 2,000 | 111 |
| | | | 1,771,991 |
| Industrials (15.7%) | | |
| | Kennametal Inc. | 1,470,985 | 67,665 |
| * | WESCO International Inc. | 766,800 | 65,531 |
| * | B/E Aerospace Inc. | 773,807 | 62,802 |
| | Pentair Ltd. | 865,650 | 58,076 |
| | Chicago Bridge & Iron Co. NV | 762,451 | 56,490 |
| * | Armstrong World Industries Inc. | 972,435 | 51,957 |
| | AO Smith Corp. | 991,730 | 51,223 |
| | MSC Industrial Direct Co. Inc. Class A | 631,005 | 48,190 |
| | EnerSys Inc. | 716,915 | 47,567 |
| * | Moog Inc. Class A | 748,408 | 44,702 |
| * | DXP Enterprises Inc. | 472,105 | 43,386 |
| * | AerCap Holdings NV | 2,135,016 | 43,319 |
| | AMETEK Inc. | 854,020 | 40,848 |
| * | Old Dominion Freight Line Inc. | 852,538 | 39,984 |
| * | JetBlue Airways Corp. | 5,560,800 | 39,426 |
| * | Middleby Corp. | 170,602 | 38,838 |
| | Flowserve Corp. | 553,425 | 38,446 |
| * | Genesee & Wyoming Inc. Class A | 384,688 | 38,407 |
| * | Huron Consulting Group Inc. | 591,465 | 34,642 |
| * | IHS Inc. Class A | 313,560 | 34,194 |
| * | Teledyne Technologies Inc. | 379,903 | 33,743 |
| * | Clean Harbors Inc. | 531,075 | 32,794 |
| * | RBC Bearings Inc. | 455,194 | 31,313 |
| | Con-way Inc. | 748,840 | 30,852 |
| | Waste Connections Inc. | 719,500 | 30,751 |
| | Acuity Brands Inc. | 298,960 | 30,048 |
| * | MRC Global Inc. | 1,016,600 | 28,414 |
| *,^ | Swift Transportation Co. | 1,280,500 | 27,902 |
| * | Mobile Mini Inc. | 729,700 | 26,357 |
6
| | | |
| Vanguard® Explorer Fund | | |
| Schedule of Investments | | |
| October 31, 2013 | | |
| |
| | | | Market |
| | | | Value |
| | | Shares | ($000) |
| * | Esterline Technologies Corp. | 323,600 | 25,940 |
| *,^ | Polypore International Inc. | 564,955 | 25,536 |
| | Manpowergroup Inc. | 323,590 | 25,272 |
| * | Terex Corp. | 713,500 | 24,937 |
| | KAR Auction Services Inc. | 818,200 | 24,317 |
| | Herman Miller Inc. | 787,697 | 23,899 |
| * | United Rentals Inc. | 356,026 | 22,996 |
| * | Stericycle Inc. | 194,815 | 22,637 |
| | Lennox International Inc. | 274,161 | 21,401 |
| | Corporate Executive Board Co. | 293,409 | 21,390 |
| * | Hexcel Corp. | 503,925 | 21,321 |
| * | American Woodmark Corp. | 597,559 | 20,269 |
| | Graco Inc. | 249,521 | 19,278 |
| * | Quanta Services Inc. | 605,505 | 18,292 |
| * | Rush Enterprises Inc. Class A | 632,371 | 18,098 |
| | UTi Worldwide Inc. | 1,152,235 | 17,514 |
| * | Trimas Corp. | 459,857 | 17,410 |
| * | Avis Budget Group Inc. | 468,379 | 14,674 |
| | Mine Safety Appliances Co. | 303,523 | 14,618 |
| | TAL International Group Inc. | 295,682 | 14,284 |
| * | Advisory Board Co. | 204,396 | 14,022 |
| * | H&E Equipment Services Inc. | 538,054 | 13,467 |
| * | Saia Inc. | 403,883 | 13,138 |
| | Kaman Corp. | 350,827 | 13,044 |
| | Robert Half International Inc. | 323,302 | 12,457 |
| * | Hub Group Inc. Class A | 331,433 | 12,174 |
| | Knight Transportation Inc. | 713,480 | 12,108 |
| * | CAI International Inc. | 542,519 | 11,876 |
| | John Bean Technologies Corp. | 435,530 | 11,838 |
| | Exponent Inc. | 137,522 | 10,398 |
| * | Copart Inc. | 320,364 | 10,325 |
| | Actuant Corp. Class A | 268,695 | 10,092 |
| * | 51job Inc. ADR | 131,700 | 10,088 |
| * | Rexnord Corp. | 341,731 | 8,038 |
| | Universal Forest Products Inc. | 138,943 | 7,353 |
| * | WageWorks Inc. | 91,200 | 4,670 |
| * | Proto Labs Inc. | 53,900 | 4,520 |
| * | MasTec Inc. | 136,528 | 4,365 |
| | Lincoln Electric Holdings Inc. | 61,100 | 4,231 |
| | Alaska Air Group Inc. | 54,624 | 3,860 |
| * | Verisk Analytics Inc. Class A | 53,800 | 3,686 |
| | Dun & Bradstreet Corp. | 32,600 | 3,547 |
| | Generac Holdings Inc. | 69,500 | 3,430 |
| | Fortune Brands Home & Security Inc. | 77,900 | 3,356 |
| | ITT Corp. | 81,100 | 3,222 |
| | RR Donnelley & Sons Co. | 172,900 | 3,211 |
| | Deluxe Corp. | 67,609 | 3,184 |
| | Mueller Water Products Inc. Class A | 367,200 | 3,147 |
| * | US Airways Group Inc. | 142,900 | 3,140 |
| | Cintas Corp. | 58,100 | 3,124 |
| * | Taser International Inc. | 168,200 | 2,989 |
| * | DigitalGlobe Inc. | 87,800 | 2,794 |
| | Steelcase Inc. Class A | 147,179 | 2,412 |
| * | AECOM Technology Corp. | 70,000 | 2,225 |
| * | II-VI Inc. | 128,266 | 2,188 |
| * | Hertz Global Holdings Inc. | 94,000 | 2,158 |
| * | USG Corp. | 78,900 | 2,155 |
| | Comfort Systems USA Inc. | 114,800 | 2,139 |
| | Manitowoc Co. Inc. | 109,100 | 2,123 |
| | Crane Co. | 31,400 | 1,994 |
| | Altra Holdings Inc. | 61,500 | 1,868 |
| | Copa Holdings SA Class A | 11,900 | 1,780 |
| * | PGT Inc. | 150,200 | 1,570 |
| * | Chart Industries Inc. | 14,500 | 1,558 |
7
| | | |
| Vanguard® Explorer Fund | | |
| Schedule of Investments | | |
| October 31, 2013 | | |
| |
| | | | Market |
| | | | Value |
| | | Shares | ($000) |
| | Acacia Research Corp. | 68,800 | 1,038 |
| | Mueller Industries Inc. | 13,700 | 826 |
| | Hyster-Yale Materials Handling Inc. | 10,300 | 808 |
| | Aircastle Ltd. | 42,200 | 796 |
| * | Republic Airways Holdings Inc. | 54,100 | 637 |
| | Barrett Business Services Inc. | 5,600 | 466 |
| | Huntington Ingalls Industries Inc. | 6,500 | 465 |
| | Toro Co. | 7,600 | 448 |
| | IDEX Corp. | 6,250 | 432 |
| | Albany International Corp. | 9,400 | 346 |
| * | Spirit Airlines Inc. | 4,300 | 186 |
| | | | 1,893,462 |
| Information Technology (24.3%) | | |
| * | Alliance Data Systems Corp. | 652,833 | 154,761 |
| * | Ultimate Software Group Inc. | 658,699 | 101,756 |
| *,2 | TiVo Inc. | 6,144,960 | 81,667 |
| * | PTC Inc. | 2,904,791 | 80,521 |
| * | Cadence Design Systems Inc. | 5,425,360 | 70,367 |
| * | Finisar Corp. | 2,904,400 | 66,830 |
| * | First Solar Inc. | 1,234,268 | 62,047 |
| * | Euronet Worldwide Inc. | 1,394,029 | 60,501 |
| * | Sapient Corp. | 3,554,890 | 56,203 |
| * | WNS Holdings Ltd. ADR | 2,460,687 | 55,341 |
| * | Silicon Laboratories Inc. | 1,304,720 | 52,476 |
| * | Pandora Media Inc. | 2,087,380 | 52,456 |
| * | Acxiom Corp. | 1,571,000 | 52,204 |
| | Ubiquiti Networks Inc. | 1,343,290 | 51,824 |
| | Belden Inc. | 761,985 | 51,251 |
| * | Teradyne Inc. | 2,760,820 | 48,287 |
| * | Infoblox Inc. | 1,072,900 | 47,690 |
| * | Bankrate Inc. | 2,570,967 | 43,295 |
| * | Informatica Corp. | 1,107,545 | 42,751 |
| | IAC/InterActiveCorp | 763,535 | 40,765 |
| * | Genpact Ltd. | 2,055,400 | 40,759 |
| * | Microsemi Corp. | 1,613,790 | 40,555 |
| * | Trimble Navigation Ltd. | 1,385,040 | 39,571 |
| * | NCR Corp. | 1,057,540 | 38,653 |
| * | Ruckus Wireless Inc. | 2,639,964 | 38,280 |
| * | Qlik Technologies Inc. | 1,501,300 | 38,043 |
| * | Concur Technologies Inc. | 337,485 | 35,301 |
| | Convergys Corp. | 1,736,381 | 34,276 |
| * | Aruba Networks Inc. | 1,762,660 | 33,068 |
| * | CoStar Group Inc. | 180,130 | 31,881 |
| * | LinkedIn Corp. Class A | 139,200 | 31,135 |
| * | Tyler Technologies Inc. | 317,692 | 30,724 |
| * | Fairchild Semiconductor International Inc. Class A | 2,336,400 | 29,602 |
| * | MICROS Systems Inc. | 537,085 | 29,137 |
| | MercadoLibre Inc. | 208,438 | 28,063 |
| * | Red Hat Inc. | 645,100 | 27,913 |
| * | Aspen Technology Inc. | 723,980 | 27,678 |
| * | Imperva Inc. | 718,865 | 27,561 |
| * | Cardtronics Inc. | 686,033 | 26,927 |
| *,^ | InvenSense Inc. | 1,580,934 | 26,702 |
| * | WEX Inc. | 281,300 | 26,259 |
| | NICE Systems Ltd. ADR | 631,945 | 24,760 |
| * | F5 Networks Inc. | 302,495 | 24,656 |
| | Heartland Payment Systems Inc. | 609,219 | 24,643 |
| * | Proofpoint Inc. | 718,172 | 22,723 |
| * | Atmel Corp. | 3,088,985 | 22,488 |
| * | ON Semiconductor Corp. | 3,142,740 | 22,188 |
| | j2 Global Inc. | 401,390 | 22,068 |
| * | Ciena Corp. | 936,420 | 21,791 |
| | FactSet Research Systems Inc. | 199,650 | 21,750 |
| * | Salesforce.com Inc. | 406,560 | 21,694 |
8
| | | |
| Vanguard® Explorer Fund | | |
| Schedule of Investments | | |
| October 31, 2013 | | |
| |
| | | | Market |
| | | | Value |
| | | Shares | ($000) |
| | Syntel Inc. | 244,262 | 20,967 |
| * | Web.com Group Inc. | 776,377 | 20,923 |
| | FEI Co. | 227,820 | 20,294 |
| * | RADWARE Ltd. | 1,317,700 | 19,726 |
| * | Rovi Corp. | 1,148,500 | 19,249 |
| *,^ | Fusion-io Inc. | 1,768,800 | 19,015 |
| * | Riverbed Technology Inc. | 1,192,600 | 17,674 |
| * | Diodes Inc. | 696,426 | 16,867 |
| * | Dealertrack Technologies Inc. | 450,827 | 16,816 |
| * | Super Micro Computer Inc. | 1,180,802 | 16,437 |
| * | Demandware Inc. | 327,341 | 16,187 |
| * | SS&C Technologies Holdings Inc. | 396,247 | 15,573 |
| * | Nanometrics Inc. | 826,028 | 15,348 |
| * | E2open Inc. | 660,197 | 14,854 |
| | Power Integrations Inc. | 256,660 | 14,743 |
| * | SPS Commerce Inc. | 214,900 | 14,645 |
| * | CalAmp Corp. | 612,322 | 14,408 |
| * | Liquidity Services Inc. | 550,900 | 14,384 |
| * | Zillow Inc. Class A | 178,605 | 14,222 |
| | EVERTEC Inc. | 589,675 | 13,834 |
| * | Semtech Corp. | 416,725 | 12,964 |
| * | Brocade Communications Systems Inc. | 1,615,700 | 12,958 |
| * | Constant Contact Inc. | 499,882 | 12,952 |
| * | ValueClick Inc. | 664,068 | 12,757 |
| * | Stratasys Ltd. | 111,140 | 12,584 |
| * | Responsys Inc. | 760,545 | 12,427 |
| * | FleetCor Technologies Inc. | 106,837 | 12,324 |
| | Mentor Graphics Corp. | 551,830 | 12,184 |
| | MKS Instruments Inc. | 410,827 | 12,177 |
| | Avago Technologies Ltd. Class A | 258,280 | 11,734 |
| * | Skyworks Solutions Inc. | 424,395 | 10,941 |
| * | EPAM Systems Inc. | 288,800 | 10,821 |
| * | PROS Holdings Inc. | 299,600 | 10,591 |
| * | ATMI Inc. | 386,886 | 10,577 |
| * | Manhattan Associates Inc. | 98,983 | 10,543 |
| * | VeriFone Systems Inc. | 461,840 | 10,465 |
| | MAXIMUS Inc. | 214,164 | 10,376 |
| ^ | IPG Photonics Corp. | 153,000 | 10,139 |
| | Intersil Corp. Class A | 899,995 | 10,044 |
| * | Entropic Communications Inc. | 2,283,830 | 9,775 |
| | Littelfuse Inc. | 110,000 | 9,353 |
| * | Tangoe Inc. | 478,383 | 9,137 |
| * | Spansion Inc. Class A | 744,285 | 8,909 |
| * | Tremor Video Inc. | 910,730 | 8,779 |
| * | Progress Software Corp. | 322,500 | 8,372 |
| * | MaxLinear Inc. | 828,059 | 7,171 |
| | Monolithic Power Systems Inc. | 224,500 | 7,148 |
| * | Gigamon Inc. | 219,600 | 6,759 |
| * | Synchronoss Technologies Inc. | 171,329 | 5,931 |
| * | Interactive Intelligence Group Inc. | 96,479 | 5,929 |
| * | Virtusa Corp. | 178,000 | 5,532 |
| *,^ | Millennial Media Inc. | 775,247 | 5,450 |
| * | Information Services Group Inc. | 1,207,014 | 5,142 |
| * | Palo Alto Networks Inc. | 98,987 | 4,173 |
| | Broadridge Financial Solutions Inc. | 113,000 | 3,973 |
| * | Angie's List Inc. | 279,970 | 3,945 |
| * | Gartner Inc. | 66,238 | 3,905 |
| | Jack Henry & Associates Inc. | 70,700 | 3,861 |
| * | OSI Systems Inc. | 49,300 | 3,591 |
| | Cognex Corp. | 108,600 | 3,394 |
| * | CommVault Systems Inc. | 41,500 | 3,240 |
| * | Fortinet Inc. | 159,600 | 3,210 |
| | LSI Corp. | 336,600 | 2,854 |
| *,^ | SunPower Corp. Class A | 94,200 | 2,844 |
9
| | | |
| Vanguard® Explorer Fund | | |
| Schedule of Investments | | |
| October 31, 2013 | | |
| |
| | | | Market |
| | | | Value |
| | | Shares | ($000) |
| * | Anixter International Inc. | 32,931 | 2,815 |
| * | Vantiv Inc. Class A | 102,000 | 2,805 |
| | DST Systems Inc. | 32,896 | 2,789 |
| | Microchip Technology Inc. | 62,800 | 2,698 |
| * | Unisys Corp. | 95,340 | 2,512 |
| * | Plexus Corp. | 65,500 | 2,507 |
| * | Freescale Semiconductor Ltd. | 149,200 | 2,304 |
| *,^ | Advanced Micro Devices Inc. | 678,200 | 2,265 |
| | Blackbaud Inc. | 61,500 | 2,214 |
| * | Zebra Technologies Corp. | 45,800 | 2,213 |
| * | ARRIS Group Inc. | 122,900 | 2,195 |
| | Booz Allen Hamilton Holding Corp. | 103,141 | 2,042 |
| * | Cavium Inc. | 45,100 | 1,818 |
| * | VeriSign Inc. | 31,900 | 1,732 |
| * | RF Micro Devices Inc. | 318,130 | 1,670 |
| * | RealD Inc. | 234,535 | 1,623 |
| * | Hittite Microwave Corp. | 25,300 | 1,616 |
| | National Instruments Corp. | 51,500 | 1,496 |
| * | Electronics For Imaging Inc. | 41,600 | 1,427 |
| * | Cree Inc. | 23,400 | 1,422 |
| * | AVG Technologies NV | 70,500 | 1,417 |
| * | ANSYS Inc. | 15,700 | 1,373 |
| * | Silicon Graphics International Corp. | 89,100 | 1,138 |
| * | comScore Inc. | 40,300 | 1,077 |
| | CSG Systems International Inc. | 38,200 | 1,064 |
| | Pegasystems Inc. | 27,300 | 1,039 |
| * | Applied Micro Circuits Corp. | 71,500 | 834 |
| * | 58.Com Inc. ADR | 34,000 | 820 |
| * | Calix Inc. | 64,900 | 660 |
| * | Extreme Networks Inc. | 120,400 | 645 |
| | Lender Processing Services Inc. | 17,000 | 587 |
| * | Silicon Image Inc. | 99,100 | 520 |
| * | Synaptics Inc. | 9,900 | 460 |
| * | Comverse Inc. | 13,100 | 414 |
| * | NeuStar Inc. Class A | 8,800 | 404 |
| | | | 2,936,558 |
| Materials (5.9%) | | |
| | Smurfit Kappa Group plc | 1,960,019 | 47,691 |
| | PolyOne Corp. | 1,517,260 | 45,973 |
| | KapStone Paper and Packaging Corp. | 872,657 | 45,343 |
| * | Graphic Packaging Holding Co. | 5,180,564 | 43,517 |
| * | Ferro Corp. | 3,328,755 | 42,708 |
| * | WR Grace & Co. | 460,835 | 42,240 |
| | Ashland Inc. | 437,590 | 40,499 |
| | Ball Corp. | 816,195 | 39,904 |
| | Minerals Technologies Inc. | 702,160 | 39,763 |
| | Methanex Corp. | 662,590 | 38,536 |
| | Allegheny Technologies Inc. | 1,100,000 | 36,410 |
| | Steel Dynamics Inc. | 1,903,200 | 34,201 |
| | Albemarle Corp. | 503,935 | 33,355 |
| | Schweitzer-Mauduit International Inc. | 531,414 | 32,884 |
| | FMC Corp. | 423,170 | 30,790 |
| | Carpenter Technology Corp. | 413,430 | 24,529 |
| | American Vanguard Corp. | 868,994 | 22,681 |
| | Koppers Holdings Inc. | 444,785 | 19,797 |
| * | OM Group Inc. | 483,300 | 16,432 |
| | Packaging Corp. of America | 68,800 | 4,285 |
| | Valspar Corp. | 57,200 | 4,002 |
| | Rock Tenn Co. Class A | 36,000 | 3,852 |
| * | Owens-Illinois Inc. | 110,100 | 3,500 |
| | NewMarket Corp. | 10,473 | 3,261 |
| | Westlake Chemical Corp. | 26,500 | 2,847 |
| | Avery Dennison Corp. | 57,200 | 2,695 |
| * | Louisiana-Pacific Corp. | 155,600 | 2,647 |
10
| | | | | |
| Vanguard® Explorer Fund | | | | |
| Schedule of Investments | | | | |
| October 31, 2013 | | | | |
| |
| | | | | | Market |
| | | | | | Value |
| | | | | Shares | ($000) |
| | Airgas Inc. | | | 21,500 | 2,345 |
| * | Berry Plastics Group Inc. | | | 72,500 | 1,456 |
| | International Flavors & Fragrances Inc. | | | 17,600 | 1,455 |
| | Balchem Corp. | | | 23,800 | 1,363 |
| * | American Pacific Corp. | | | 22,900 | 1,042 |
| | | | | | 712,003 |
| Other (1.6%) | | | | |
| ^,3 | Vanguard Small-Cap ETF | | | 865,083 | 91,483 |
| ^,3 | Vanguard Small-Cap Growth ETF | | | 713,200 | 83,701 |
| | iShares Russell 2000 ETF | | | 153,250 | 16,739 |
| *,4 | Dropbox Private Placement | | | 425,730 | 4,866 |
| | | | | | 196,789 |
| Telecommunication Services (0.9%) | | | | |
| * | SBA Communications Corp. Class A | | | 437,745 | 38,290 |
| * | Vonage Holdings Corp. | | | 9,656,390 | 36,018 |
| * | tw telecom inc Class A | | | 1,009,725 | 31,826 |
| | Atlantic Tele-Network Inc. | | | 24,500 | 1,358 |
| | IDT Corp. Class B | | | 38,000 | 832 |
| | NTELOS Holdings Corp. | | | 20,000 | 381 |
| * | Fairpoint Communications Inc. | | | 20,700 | 193 |
| | | | | | 108,898 |
| Utilities (0.1%) | | | | |
| * | NRG Yield Inc. Class A | | | 310,292 | 10,990 |
| | American States Water Co. | | | 79,800 | 2,273 |
| | Otter Tail Corp. | | | 26,200 | 782 |
| |
| | | | | | 14,045 |
| |
| Total Common Stocks (Cost $7,826,778) | | | | 11,527,529 |
| |
| |
| | | Coupon | | | |
| |
| Temporary Cash Investments (5.8%)1 | | | | |
| Money Market Fund (5.3%) | | | | |
| 5,6 | Vanguard Market Liquidity Fund | 0.120% | | 644,213,000 | 644,213 |
| |
| |
| | | | | Face | |
| | | | Maturity | Amount | |
| | | | Date | ($000) | |
| Repurchase Agreement (0.4%) | | | | |
| | Deutsche Bank Securities, Inc. (Dated 10/31/13, | | | | |
| | Repurchase Value $40,900,000, collateralized by | | | | |
| | Federal Home Loan Mortgage Corp. 3.000%-7.000%, | | | | |
| | 9/1/19-2/1/48, Government National Mortgage Assn. | | | | |
| | 3.000%-5.000%, 8/20/40-10/20/43, and U.S. Treasury | | | | |
| | Note/Bond 1.500%, 3/31/19, with a value of | | | | |
| | $41,718,000) | 0.120% | 11/1/13 | 40,900 | 40,900 |
| |
| U.S. Government and Agency Obligations (0.1%) | | | | |
| 7,8 | Federal Home Loan Bank Discount Notes | 0.100% | 11/13/13 | 2,000 | 2,000 |
| 7,8 | Federal Home Loan Bank Discount Notes | 0.100% | 12/6/13 | 400 | 400 |
| 7,8 | Federal Home Loan Bank Discount Notes | 0.090%-0.100% | 1/15/14 | 5,000 | 4,998 |
| 7,8 | Federal Home Loan Bank Discount Notes | 0.070% | 3/12/14 | 4,700 | 4,697 |
| 9 | Freddie Mac Discount Notes | 0.120% | 12/30/13 | 2,500 | 2,500 |
| |
| | | | | | 14,595 |
| |
| Total Temporary Cash Investments (Cost $699,711) | | | | 699,708 |
| |
| Total Investments (101.3%) (Cost $8,526,489) | | | | 12,227,237 |
| Other Assets and Liabilities—Net (-1.3%)6 | | | | (157,621) |
| Net Assets (100%) | | | | 12,069,616 |
11
Vanguard® Explorer Fund
Schedule of Investments
October 31, 2013
* Non-income-producing security.
^ Includes partial security positions on loan to broker-dealers. The total value of securities on loan is $146,646,000.
1 The fund invests a portion of its cash reserves in equity markets through the use of index futures contracts. After giving effect to futures
investments, the fund's effective common stock and temporary cash investment positions represent 97.9% and 3.4%, respectively, of net
assets.
2 Considered an affiliated company of the fund as the fund owns more than 5% of the outstanding voting securities of such company.
3 Considered an affiliated company of the fund as the issuer is another member of The Vanguard Group.
4 Restricted security represents 0.0% of net assets.
5 Affiliated money market fund available only to Vanguard funds and certain trusts and accounts managed by Vanguard. Rate shown is the 7-day
yield.
6 Includes $152,293,000 of collateral received for securities on loan.
7 The issuer operates under a congressional charter; its securities are generally neither guaranteed by the U.S. Treasury nor backed by the full
faith and credit of the U.S. government.
8 Securities with a value of $11,896,000 have been segregated as initial margin for open futures contracts.
9 The issuer was placed under federal conservatorship in September 2008; since that time, its daily operations have been managed by the Federal
Housing Finance Agency and it receives capital from the U.S. Treasury, as needed to maintain a positive net worth, in exchange for senior
preferred stock.
ADR—American Depositary Receipt.
12
This page intentionally left blank.
© 2013 The Vanguard Group, Inc.
All rights reserved.
Vanguard Marketing Corporation, Distributor.
SNA240_122013
Item 7: Disclosure of Proxy Voting Policies and Procedures for Closed-End Management
Investment Companies.
Not Applicable.
Item 8: Portfolio Managers of Closed-End Management Investment Companies.
Not Applicable.
Item 9: Purchase of Equity Securities by Closed-End Management Investment Company and
Affiliated Purchasers.
Not Applicable.
Item 10: Submission of Matters to a Vote of Security Holders.
Not Applicable.
Item 11: Controls and Procedures.
(a) Disclosure Controls and Procedures. The Principal Executive and Financial Officers concluded that the Registrant’s Disclosure Controls and Procedures are effective based on their evaluation of the Disclosure Controls and Procedures as of a date within 90 days of the filing date of this report.
(b) Internal Control Over Financial Reporting. There were no significant changes in Registrant’s Internal Control Over Financial Reporting or in other factors that could significantly affect this control subsequent to the date of the evaluation, including any corrective actions with regard to significant deficiencies and material weaknesses.
Item 12: Exhibits.
(a) Code of Ethics.
(b) Certifications.
Pursuant to the requirements of the Securities Exchange Act of 1934 and the Investment Company Act of 1940, the registrant has duly caused this report to be signed on its behalf by the undersigned, thereunto duly authorized.
| |
| | VANGUARD EXPLORER FUND |
| |
| |
| BY: | /s/ F. WILLIAM MCNABB III* |
| | F. WILLIAM MCNABB III |
| | CHIEF EXECUTIVE OFFICER |
| |
| Date: December 19, 2013 |
Pursuant to the requirements of the Securities Exchange Act of 1934 and the Investment Company Act of 1940, this report has been signed below by the following persons on behalf of the registrant and in the capacities and on the dates indicated.
| |
| | VANGUARD EXPLORER FUND |
BY: | /s/ F. WILLIAM MCNABB III* |
| | F. WILLIAM MCNABB III |
| | CHIEF EXECUTIVE OFFICER |
Date: December 19, 2013 |
| | VANGUARD EXPLORER FUND |
BY: | /s/ THOMAS J. HIGGINS* |
| | THOMAS J. HIGGINS |
| | CHIEF FINANCIAL OFFICER |
Date: December 19, 2013 |
* By: /s/ Heidi Stam
Heidi Stam, pursuant to a Power of Attorney filed on March 27, 2012 see file Number
2-11444, Incorporated by Reference.