Table of Contents
UNITED STATES
SECURITIES AND EXCHANGE COMMISSION
Washington, D.C. 20549
FORM 20-F
| ¨ | Registration Statement pursuant to Section 12(b) or (g) of the Securities Exchange Act of 1934. |
| x | Annual Report pursuant to Section 13 or 15(d) of the Securities Exchange Act of 1934. |
for the fiscal year ended December 31, 2005
| ¨ | Transition report pursuant to Section 13 or 15(d) of the Securities Exchange Act of 1934. |
| ¨ | Shell company report pursuant to Section 13 or 15(d) of the Securities Exchange Act of 1934. |
Date of event requiring this shell company report
for the transition period from to
Commission File Number: 0-13355
ASM INTERNATIONAL N.V.
(Exact name of Registrant as specified in its charter)
The Netherlands
(jurisdiction of incorporation or organization)
Jan van Eycklaan 10, 3723 BC Bilthoven, the Netherlands
(Address of principal executive offices)
Securities registered or to be registered pursuant to
Section 12(b) of the Act: None
Securities registered or to be registered pursuant to
Section 12(g) of the Act: Common Shares, par value€ 0.04
Securities for which there is a reporting obligation pursuant to
Section 15(d) of the Act: None
Indicate the number of outstanding shares of each of the issuer’s classes of capital or common stock as of the close of the period covered by the annual report: 52,678,952 common shares; no preferred shares.
Indicate by check mark if the registrant is a well-known seasoned issuer, as defined in Rule 405 of the Securities Act. Yes x No ¨
If this annual report is an annual or transition report, indicate by check mark if the registrant is not required to file reports pursuant to Section 13 or 15(d) of the Securities Exchange Act of 1934. Yes ¨ No x
Indicate by check mark whether the registrant (1) has filed all reports required to be filed by Sections 13 or 15(d) of the Securities Exchange Act of 1934 during the preceding 12 months (or for such shorter period that the registrant was required to file such reports), and (2) has been subject to such filing requirements for the past 90 days. Yes x No ¨
Indicate by check mark whether the registrant is a large accelerated filer, an accelerated filer, or a non-accelerated filer. See definition of “accelerated filer and large accelerated filer” in Rule 12b-2 of the Exchange Act. (Check one):
Large accelerated filer ¨ Accelerated filer x Non-accelerated filer ¨
Indicate by check mark which financial statement item the registrant has elected to follow:
| Item 17 ¨ Item 18 x |
If this is an annual report, indicate by check mark whether the registrant is a shell company (as defined in Rule 12b-2 of the Exchange Act): Yes ¨ No x
Table of Contents
EX-8.1
EX-12.1
EX-12.2
EX-13.1
EX-15.1
Table of Contents
As used in this report, the terms “we,” “us,” “our,” “ASMI,” and “ASM International” mean ASM International N.V. and its subsidiaries, unless the context indicates another meaning, and the term “common shares” means our common shares, par value€ 0.04 per share. Since we are a Netherlands company, the par value of our common shares is expressed in euros (“€”). The terms “United States” and “U.S.” refer to the United States of America.
Item 1.Identity of Directors, Senior Management and Advisors
Not applicable.
Item 2.Offer Statistics and Expected Timetable
Not applicable.
A. Selected consolidated financial data.
You should read the following selected financial data in conjunction with Item 5 “Operating and Financial Review and Prospects” and Item 18 “Financial Statements.” The selected consolidated financial data presented below as of and for the years ended December 31, 2004 and 2005 have been derived from our audited Consolidated Financial Statements included in Item 18. The selected consolidated financial data presented below as of and for the years ended December 31, 2001, 2002 and 2003 have been derived from our audited Consolidated Financial Statements which are not included in this report.
| 2001 | 20021 | 20031 | 2004 | 2005 | ||||||||||||||||
| (€ in thousands, except per share data) | ||||||||||||||||||||
Consolidated Statements of Operations Data: | ||||||||||||||||||||
Net sales | € | 561,064 | € | 518,802 | € | 581,868 | € | 754,245 | € | 726,418 | ||||||||||
Cost of sales | (337,743 | ) | (328,077 | ) | (380,597 | ) | (472,501 | ) | (473,411 | ) | ||||||||||
Gross profit | 223,321 | 190,725 | 201,271 | 281,744 | 253,007 | |||||||||||||||
Operating expenses: | ||||||||||||||||||||
Selling, general and administrative | (111,851 | ) | (108,393 | ) | (108,019 | ) | (107,040 | ) | (101,185 | ) | ||||||||||
Research and development, net | (79,661 | ) | (88,334 | ) | (79,053 | ) | (84,874 | ) | (100,668 | ) | ||||||||||
Amortization of goodwill | (7,558 | ) | — | — | — | — | ||||||||||||||
Amortization of purchased technology and other intangible assets | — | — | — | (1,389 | ) | (1,748 | ) | |||||||||||||
Impairment of goodwill | — | — | — | — | (30,994 | ) | ||||||||||||||
Total operating expenses | (199,070 | ) | (196,727 | ) | (187,072 | ) | (193,303 | ) | (234,595 | ) | ||||||||||
Earnings (loss) from operations | 24,251 | (6,002 | ) | 14,199 | 88,441 | 18,412 | ||||||||||||||
Loss on equity investments | — | (2,372 | ) | (2,770 | ) | (417 | ) | — | ||||||||||||
Interest income | 3,690 | 1,336 | 1,393 | 2,223 | 5,746 | |||||||||||||||
Interest expense | (5,031 | ) | (9,627 | ) | (11,692 | ) | (12,570 | ) | (16,163 | ) | ||||||||||
Foreign currency transaction gains (losses) | 357 | (2,125 | ) | (2,479 | ) | (111 | ) | (128 | ) | |||||||||||
Income tax benefit (expense) | (4,711 | ) | 1,165 | (7,112 | ) | (10,575 | ) | (7,307 | ) | |||||||||||
Minority interest | (13,373 | ) | (15,890 | ) | (24,570 | ) | (45,608 | ) | (43,558 | ) | ||||||||||
Gain on dilution of investment in subsidiary | 915 | 1,281 | 941 | 2,656 | 2,781 | |||||||||||||||
Net earnings (loss) | € | 6,098 | € | (32,234 | ) | € | (32,090 | ) | € | 24,039 | € | (40,217 | ) | |||||||
Basic net earnings (loss) per share from operations | € | 0.50 | € | (0.12 | ) | € | 0.29 | € | 1.72 | € | 0.35 | |||||||||
Diluted net earnings (loss) per share from operations | € | 0.49 | € | (0.12 | ) | € | 0.29 | € | 1.71 | € | 0.35 | |||||||||
Basic net earnings (loss) per share: | € | 0.12 | € | (0.66 | ) | € | (0.65 | ) | € | 0.47 | € | (0,76 | ) | |||||||
Diluted net earnings (loss) per share: | € | 0.12 | € | (0.66 | ) | € | (0.65 | ) | € | 0.46 | € | (0,76 | ) | |||||||
Basic weighted average number of shares | 48,944 | 49,170 | 49,642 | 51,540 | 52,638 | |||||||||||||||
Diluted weighted average number of shares | 49,958 | 49,170 | 49,642 | 51,858 | 52,638 | |||||||||||||||
| 2001 | 20021 | 20031 | 2004 | 2005 | ||||||||||||||||
Ratios and other data: | ||||||||||||||||||||
Ratio of earnings to fixed charges 2 | 5.6x | —3 | —3 | 7.8x | 1.5x | |||||||||||||||
Number of common shares outstanding (in thousands) | 49,070 | 49,370 | 50,062 | 52,618 | 52,679 | |||||||||||||||
Dividends declared | — | — | — | — | — | |||||||||||||||
3
Table of Contents
| December 31, | |||||||||||||||
| 2001 | 20021 | 20031 | 2004 | 2005 | |||||||||||
| (€ in thousands) | |||||||||||||||
Consolidated Balance Sheet Data: | |||||||||||||||
Cash and cash equivalents | € | 107,577 | € | 70,991 | € | 154,857 | € | 218,614 | € | 134,996 | |||||
Total assets | 757,065 | 648,695 | 661,978 | 823,834 | 812,308 | ||||||||||
Total debt | 160,858 | 147,057 | 207,623 | 297,253 | 257,400 | ||||||||||
Total shareholders’ equity | 320,910 | 260,396 | 204,609 | 256,716 | 238,594 | ||||||||||
| (1) | As previously reflected in the December 31, 2004 Consolidated Financial Statements, we retroactively amended our Consolidated Financial Statements, as required under US GAAP, to account for NuTool, Inc. (“NuTool”) using the equity method of accounting as a result of our acquisition of the remaining interest in NuTool on June 2, 2004. |
| (2) | The ratio of earnings to fixed charges is computed by dividing: |
| • | earnings (loss) before income taxes and minority interest plus fixed charges; by |
| • | fixed charges. |
Fixed charges consist of interest expense, not including interest expense related to operational leases. Also not included in fixed charges are the losses for the early extinguishment of convertible subordinated notes of€ 1.2 million and€ 0.3 million which have been recorded as interest expense in the Consolidated Statements of Operations for the years 2004 and 2005 respectively.
| (3) | Earnings, as calculated for purposes of the ratios, were not sufficient to cover fixed charges. The coverage deficiency was€ 18.8 million for the year 2002 and€ 1.3 million for the year 2003. |
4
Table of Contents
Exchange Rate Information
The following table sets forth, for each period indicated, specified information regarding the United States dollar per euro exchange rates based on the noon buying rate in New York City for cable transfers payable in euros as certified for customs purposes by the Federal Reserve Bank of New York, which is often referred to as the “noon buying rate.” On March 10 , 2006, the noon buying rate was 1.1886 United States dollars per euro.
U.S. Dollar per Euro Exchange Rate
| September 2005 | October 2005 | November 2005 | December 2005 | January 2006 | February 2006 | March 2006 1 | ||||||||
High | 1.2538 | 1.2148 | 1.2067 | 1.2041 | 1.2287 | 1.2100 | 1.2028 | |||||||
Low | 1.2011 | 1.1914 | 1.1667 | 1.1699 | 1.1980 | 1.1860 | 1.1886 |
| Years Ended December 31, | ||||||||||
| 2001 | 2002 | 2003 | 2004 | 2005 | ||||||
Average exchange rate 2 | 0.8909 | 0.9453 | 1.1411 | 1.2464 | 1.2400 | |||||
| (1) | Through March 10, 2006. |
| (2) | Average of the exchange rate on the last day of each month during the period presented. |
B. Capitalization and indebtedness.
Not applicable.
C. Reasons for the offer and use of proceeds.
Not applicable.
D. Risk factors.
Some of the information in this report constitutes forward-looking statements within the meaning of the United States federal securities laws, including the safe harbor provisions of the Private Securities Litigation Reform Act of 1995. These statements include, among others, statements regarding future expenditures, sufficiency of cash generated from operations, maintenance of majority interest in ASM Pacific Technology Ltd. (“ASM Pacific Technology” or “ASMPT”), business strategy, product development, product acceptance, market penetration, market demand, return on investment in new products, product shipment dates and outlooks. These statements may be found under Item 5 “Operating and Financial Review and Prospects,” and elsewhere in this report. Forward-looking statements typically are identified by use of terms such as “may,” “will,” “could,” “should,” “project,” “believe,” “anticipate,” “expect,” “plan,” “estimate,” “forecast,” “potential,” “intend,” “continue” and similar words, although some forward-looking statements are expressed differently. You should be aware that these statements involve risks and uncertainties and our actual results could differ materially from those contained in the forward-looking statements due to a number of factors, including the matters discussed in Item 4 “Information on the Company” and the following discussion of risks. The risks described are not the only ones facing ASMI. Some risks are not yet known and some that we do not currently believe to be material could later become material. Each of these risks could materially affect our business, revenues, income, assets and liquidity and capital resources. All statements are made as of the date of this report and we assume no obligation nor intend to update or revise any forward-looking statements to reflect future developments or circumstances.
RISKS RELATED TO OUR INDUSTRY
Our business could be adversely affected by the cyclical nature of the semiconductor industry.
We sell our products to the semiconductor industry, which is subject to sudden, extreme, cyclical variations in product supply and demand. The timing, length and severity of these cycles are difficult to predict. In the period 2001—2003, the semiconductor industry experienced a cyclical downturn characterized by reduced demand for products, lower average selling prices, reduced investment in semiconductor capital equipment and other factors all of which resulted in lower sales and earnings for our business. This downturn lasted longer than past cycles and, although conditions in the semiconductor equipment market improved, the market remains volatile and hard to predict. Semiconductor manufacturers may contribute to the severity of these cycles by misinterpreting the conditions in the industry and over-investing or under-investing in semiconductor manufacturing capacity and equipment. In any event, the lag
5
Table of Contents
between changes in demand for semiconductor devices and changes in demand for our products by semiconductor manufacturers accentuates the intensity of these cycles in both expansion and contraction phases. We may not be able to respond effectively to these industry cycles.
Downturns in the semiconductor industry often occur in connection with, or anticipation of, maturing product cycles and declines in general economic conditions. Industry downturns have been characterized by reduced demand for semiconductor devices and equipment, production over-capacity and a decline in average selling prices. During a period of declining demand, we must be able to quickly and effectively reduce expenses and motivate and retain key employees. Our ability to reduce expenses in response to any downturn in the semiconductor industry is limited by our need for continued investment in engineering and research and development and extensive ongoing customer service and support requirements. In addition, the long lead time for production and delivery of some of our products creates a risk that we may incur expenditures or purchase inventories for products that we cannot sell. During periods of extended downturn, a portion of our inventory may have to be written down if it is not sold in a timely manner.
Industry upturns have been characterized by fairly abrupt increases in demand for semiconductor devices and equipment and insufficient production capacity. During a period of increasing demand and rapid growth, we must be able to quickly increase manufacturing capacity to meet customer demand and hire and assimilate a sufficient number of additional qualified personnel. Our inability to quickly respond in times of increased demand could harm our reputation and cause some of our existing or potential customers to place orders with our competitors rather than us.
Our industry is subject to rapid technological change and we may not be able to forecast or respond to commercial and technological trends in time to avoid competitive harm.
Our growth strategy and future success depend upon commercial acceptance of products incorporating technologies we are developing, such as plasma enhanced atomic layer deposition processes, rapid thermal processing, low-k dielectrics, copper deposition and silicon or silicon-germanium epitaxy. The semiconductor industry and the semiconductor equipment industry are subject to rapid technological change and frequent introductions of enhancements to existing products as well as significant write-downs and impairment charges and costs that can result from such changes. Technological changes have had and will continue to have a significant impact on our business. Our operating results and our ability to remain competitive are affected by our ability to accurately anticipate customer and market requirements and develop technologies and products to meet these requirements. Our success in developing, introducing and selling new and enhanced products depends upon a variety of factors, including, without limitation:
| • | successful innovation of processes and equipment; |
| • | accurate technology and product selection; |
| • | timely and efficient completion of product design, development and qualification; |
| • | timely and efficient implementation of manufacturing and assembly processes; |
| • | successful product performance in the field; |
| • | effective and timely product support and service; and |
| • | effective product sales and marketing. |
We may not be able to accurately forecast or respond to commercial and technical trends in the semiconductor industry or to the development of new technologies and products by our competitors. Our competitors may develop technologies and products that are more effective than ours or that may be more widely accepted. In addition, we may incur substantial unanticipated costs to ensure the functionality and reliability of our current and future products. If our products are unreliable or do not meet our customers’ expectations, then we may experience reduced orders, higher manufacturing costs, delays in collecting accounts receivable, and/or additional service and warranty expense. We have experienced delays from time to time in the introduction of, and some technical and manufacturing difficulties with, some of our systems and enhancements. We may also experience delays and technical and manufacturing difficulties in future introductions or volume production of new systems or enhancements. Significant delays can occur between a product’s introduction and the commencement of volume production of that product. Any of these events could negatively impact our ability to generate the return we intend to achieve on our investments in new products.
If we fail to adequately invest in research and development, we may be unable to compete effectively.
We have limited resources to allocate to research and development, and must allocate our resources among a wide variety of projects in our front-end and back-end businesses. In 2005, we invested€ 100.7 million in research and development, or 13.9% of our net sales. Because of intense competition in our industry, the cost of failing to invest in strategic developments is high. In order to enhance the benefits
6
Table of Contents
obtained from our research and development expenditures, we have contractual and other relationships with independent research institutes. If we fail to adequately invest in research and development or lose our ability to collaborate with these independent research entities, we may be unable to compete effectively in the front-end and back-end markets in which we operate.
We face intense competition from companies which have greater resources than we do, and potential competition from new companies entering the market in which we compete. If we are unable to compete effectively with these companies, our market share may decline and our business could be harmed.
We face intense competition in both the front-end and back-end segments of the semiconductor equipment industry from other established companies. Our primary competitors in the front-end business include Applied Materials, Novellus Systems, Tokyo Electron, Kokusai, and Aviza. Our primary competitors in the back-end business include Kulicke & Soffa, ESEC, Shinkawa, Apic Yamada, BE Semiconductor Industries, Towa, Shinko and Mitsui. A number of our competitors have significantly greater financial, technological, engineering, manufacturing, marketing and distribution resources than we do. Their greater capabilities in these areas may enable them to:
| • | better withstand periodic downturns in the semiconductor industry; |
| • | compete more effectively on the basis of price, technology, service and support; |
| • | more quickly develop enhancements to, and new generations of products; and |
| • | more effectively retain existing customers and attract new customers. |
In addition, new companies may enter the markets in which we compete, further increasing competition in the semiconductor equipment industry.
We believe that our ability to compete successfully depends on a number of factors, including, without limitation:
| • | our success in developing new products and enhancements; |
| • | performance of our products; |
| • | quality of our products; |
| • | ease of use of our products; |
| • | reliability of our products; |
| • | cost of ownership of our products; |
| • | our ability to ship products in a timely manner; |
| • | quality of the technical service we provide; |
| • | timeliness of the services we provide; |
| • | responses to changing market and economic conditions; and |
| • | price of our products and our competitors’ products. |
Some of these factors are outside our control. We may not be able to compete successfully in the future, and increased competition may result in price reductions, reduced profit margins, loss of market share, and inability to generate cash flows that are sufficient to maintain or expand our development of new products.
RISKS RELATED TO OUR BUSINESS
Our quarterly revenues and operating results fluctuate due to a variety of factors, which may result in volatility or a decrease in the price of our common shares.
Our quarterly revenues and operating results have varied significantly in the past and may vary in the future due to a number of factors, including, without limitation:
| • | cyclicality and other economic conditions in the semiconductor industry; |
| • | production capacity constraints; |
| • | the timing of customer orders, cancellations and shipments; |
| • | the length and variability of the sales cycle for our products; |
7
Table of Contents
| • | the introduction of new products and enhancements by us and our competitors; |
| • | the emergence of new industry standards; |
| • | product obsolescence; |
| • | disruptions in sources of supply; |
| • | our ability to time our expenditures in anticipation of future orders; |
| • | our ability to fund our capital requirements; |
| • | changes in our pricing and pricing by our suppliers and competitors; |
| • | our product and revenue mix; |
| • | seasonal fluctuations in demand for our products; |
| • | exchange rate fluctuations; e.g. appreciation of the euro versus the U.S. dollar, which would negatively affect the competitiveness of our manufacturing activities that are domiciled in countries whose currency is the euro; and |
| • | economic conditions generally or in various geographic areas where we or our customers do business. |
In addition, we derive a substantial portion of our net sales from products that have a high average selling price and significant lead times between the initial order and delivery of the product. The timing and recognition of net sales from customer orders can cause significant fluctuations in our operating results from quarter to quarter. Gross margins realized on product sales vary depending upon a variety of factors, including the mix of products sold during a particular period, negotiated selling prices, the timing of new product introductions and enhancements and manufacturing costs. A delay in a shipment near the end of a fiscal quarter or year, due, for example, to rescheduling or cancellations by customers or to unexpected manufacturing difficulties experienced by us, may cause sales in a particular period to fall significantly below our expectations and may materially adversely affect our operating results for that period. Further, our need to continue expenditures for research and development and engineering make it difficult for us to reduce expenses in a particular quarter even if our sales goals for that quarter are not met. Our inability to adjust spending quickly enough to compensate for any sales shortfall would magnify the adverse impact of a sales shortfall on our operating results. In addition, announcements by us or our competitors of new products and technologies could cause customers to defer purchases of our existing systems, which could negatively impact our earnings and our financial position.
As a result of these factors, our operating results may vary significantly from quarter to quarter. Any shortfall in revenues or net income from levels expected by securities analysts and investors could cause a decrease in the trading price of our common shares.
Our products generally have long sales cycles and implementation periods, which increase our costs in obtaining orders and reduce the predictability of our earnings.
Our products are technologically complex. Prospective customers generally must commit significant resources to test and evaluate our products and to install and integrate them into larger systems. In addition, customers often require a significant number of product presentations and demonstrations, in some instances evaluating equipment on site, before reaching a sufficient level of confidence in the product’s performance and compatibility with the customer’s requirements to place an order. As a result, our sales process is often subject to delays associated with lengthy approval processes that typically accompany the design and testing of new products. The sales cycles of our products often last for many months or even years. Longer sales cycles require us to invest significant resources in attempting to make sales and delay the generation of revenue.
Long sales cycles also subject us to other risks, including customer’s budgetary constraints, internal acceptance reviews and cancellations. In addition, orders expected in one quarter could shift to another because of the timing of customer’s purchase decisions. The time required for our customers to incorporate our products into their systems can vary significantly with the needs of our customers and generally exceeds several months, which further complicates our planning processes and reduces the predictability of our operating results.
Our recent acquisitions and any acquisitions or investments we may make in the future could disrupt our business and harm our financial condition.
In June 2004 we acquired the remaining 84.3% interest in NuTool, Inc. (“NuTool”) that we did not already own and in August 2004 we acquired Genitech, Inc. (“Genitech”). For additional information regarding this matter, see Notes 2 and 9 to our Consolidated Financial Statements. In addition, we intend to
8
Table of Contents
consider additional investments in complementary businesses, products or technologies. We may not be able to successfully integrate these businesses and any businesses, products, technologies or personnel that we might acquire in the future, and we may not realize the anticipated benefits from such acquisitions. In particular, our operation of acquired businesses involves numerous risks, including, without limitation:
| • | problems integrating the purchased operations, technologies or products; |
| • | unanticipated costs and liabilities for which we are not able to obtain indemnification from the sellers; |
| • | diversion of management’s attention from our core business; |
| • | adverse effects on existing business relationships with customers; |
| • | risks associated with entering markets in which we have no, or limited, prior experience; |
| • | risks associated with installation, service and maintenance of equipment of which we have limited or no prior experience; |
| • | limited technical documentation of the equipment developed in the acquired company; and |
| • | potential loss of key employees, particularly those of the acquired organizations. |
In addition, in the event of any future acquisitions of such businesses, products or technologies, we could:
| • | issue shares that would dilute our current shareholders’ percentage ownership; |
| • | incur debt; |
| • | assume liabilities; |
| • | incur impairment expenses related to goodwill and other intangible assets; or |
| • | incur large and immediate accounting write-offs. |
Substantially all of our equipment orders are subject to operating, performance, safety, economic specifications and other contractual obligations. We occasionally experience unforeseen difficulties in compliance with these criteria, which can result in increased design, installation and other costs and expenses.
Substantially all of our equipment sales have specific commercial terms and are conditioned on our demonstration, and our customer’s acceptance, that the equipment meets specified operating and performance criteria, either before shipment or after installation in a customer’s facility. We occasionally experience difficulties in adhering to and demonstrating compliance with these terms and criteria, which can lead to unanticipated expenses for the performance of the contract or the redesign, modification and testing of the equipment and related software. To the extent this occurs in the future, our cost of goods sold and operating income will be adversely affected. If we are not able to demonstrate compliance with the particular contract or the performance and operating specifications in respect of specific equipment, we may have to pay penalties to the customer, issue credit notes to the customer and/or take other remedial action, including payment of damages, any one of which could negatively affect our operating income.
We derive a significant percentage of our revenue from sales to a small number of large customers, and if we are not able to retain these customers, or they reschedule, reduce or cancel orders, our revenues would be reduced and our financial results would suffer.
Our largest customers account for a significant percentage of our revenues. Our largest customer accounted for 17.2% and our ten largest customers accounted for 43.7% of our net sales in 2005. Sales to and the relative importance of these large customers have varied significantly from year to year and will continue to fluctuate in the future. These sales also may fluctuate significantly from quarter to quarter. We may not be able to retain our key customers or they may cancel purchase orders or reschedule or decrease their level of purchases from us, which would reduce our revenues and negatively affect our financial results. In addition, any difficulty in collecting amounts due from one or more key customers could harm our financial results.
We may need additional funds to finance our future growth and ongoing research and development activities. If we are unable to obtain such funds, we may not be able to expand our business as planned.
In the past, we have experienced severe capital constraints that adversely affected our operations and ability to compete. We may require additional capital to finance our future growth and fund our ongoing research and development activities beyond 2006. Our capital requirements depend on many factors, including acceptance of and demand for our products, and the extent to which we invest in new technology and research and development projects.
9
Table of Contents
If we raise additional funds through the issuance of equity securities, the percentage ownership of our existing shareholders would be diluted. If we finance our capital requirements with debt, we may incur significant interest costs. Additional financing may not be available to us when needed or, if available, may not be available on terms acceptable to us.
If we are unable to raise needed additional funds, we may have to reduce the amount we spend on research and development, slow down our introduction of new products, reduce capital expenditures necessary to support future growth and/or take other measures to reduce expenses which could limit our growth and ability to compete.
We could be harmed by the loss of key management.
The success of our operations depends in significant part upon the experience of our management team, particularly our founder and CEO. We do not have employment agreements with some members of our management team and we do not maintain “key man” life insurance policies. The loss of services from our key executives and the transition process with new management could harm or cause difficulties in our business, prospects, financial condition and results of operations.
We may not be able to recruit or retain qualified personnel or integrate qualified personnel into our organization. Consequently, we could experience reduced sales, delayed product development and diversion of management resources.
Our business and future operating results depend in part upon our ability to attract and retain qualified management, technical, sales and support personnel for our operations on a worldwide basis. Competition for qualified personnel is intense, and we cannot guarantee that we will be able to continue to attract and retain qualified personnel particularly during sustained economic upturns in the industry. Availability of qualified technical personnel varies from country to country, and may affect the operations of our subsidiaries in some parts of the world. Our operations could be negatively affected if we lose key executives or employees or are unable to attract and retain skilled executives and employees as needed. In particular, if our growth strategies are successful, we may not have sufficient personnel to manage that growth and may not be able to attract the personnel needed. Although we have agreements with some, but not all, employees restricting their ability to compete with us after their employment terminates, we do not maintain insurance to protect against the loss of key executives or employees. Our future growth and operating results will depend on:
| • | our ability to continue to broaden our senior management group; |
| • | our ability to attract, hire and retain skilled employees; and |
| • | the ability of our officers and key employees to continue to expand, train and manage our employee base. |
We have in the past experienced intense competition for skilled personnel during market expansions and believe competition will again be intense if the semiconductor market experiences a sustained expansion. Consequently, we generally attempt to minimize reductions in skilled personnel in reaction to industry downturns, which reduces our ability to lower costs by payroll reduction.
Although we currently are a majority shareholder of ASM Pacific Technology, we may not be able to maintain our majority interest, which, if other circumstances are such that we do not control ASM Pacific Technology, would prevent us from consolidating its results of operations with ours. This event would have a significant negative effect on our consolidated net earnings from operations.
We derive a significant portion of our net sales, earnings from operations and net earnings from the consolidation of the results of operations of ASM Pacific Technology with our results. If we do not maintain our majority interest in ASM Pacific Technology, and if other circumstances are such that we do not control it through other means, we would no longer be able to consolidate its results of operations with ours. Any such determination of whether we could continue to consolidate would be based on whether we still have a “controlling financial interest” within the meaning of United States generally accepted accounting principles. If we were to become unable to consolidate the results of operations of ASM Pacific Technology with our results, the results of operations of ASM Pacific Technology would no longer be included in our earnings from operations. Instead, our proportionate share of ASM Pacific Technology’s earnings would be reflected as a separate line-item called “share of results from investments” in our Consolidated Statements of Operations. We would no longer be able to consolidate the assets and liabilities of ASM Pacific Technology and would have to reflect the net investment in ASM Pacific Technology in the line-item “investments” in our Consolidated Balance Sheet. This event would have a significant negative effect on our consolidated earnings from operations, although our net earnings would be reduced only to the extent of the reduction of our ownership interest in ASM Pacific Technology.
10
Table of Contents
ASM Pacific Technology has an employee share incentive program pursuant to which it can issue up to an aggregate of 5.0% of its total issued shares, excluding shares subscribed for or purchased under the program, to directors and employees. When ASM Pacific Technology issues shares pursuant to this program, our ownership interest is diluted. If the current maximum amount of shares is issued under this program, our ownership interest would continue to be above 50.0%. However, our interest could further be diluted if ASM Pacific Technology issues additional equity. Any such decision by ASM Pacific Technology to issue additional shares requires the approval of a majority of shareholders, which means that, at present, our approval would be required. Although we could purchase shares of ASM Pacific Technology if necessary to maintain our majority interest, we may be unable to do so if we do not have sufficient financial resources at that time.
Although we are a majority shareholder, ASM Pacific Technology is not obligated to pay dividends to us and may take actions or enter into transactions that are detrimental to us.
ASM Pacific Technology is a Cayman Islands limited liability company that is based in Hong Kong and listed on the Hong Kong Stock Exchange. As of December 31, 2005, we owned 53.59% of ASM Pacific Technology through our wholly-owned subsidiary, Advanced Semiconductor Materials (Netherlands Antilles) N.V., a Netherlands Antilles company, and the remaining 46.41% was owned by the public.
Two of the six directors of ASM Pacific Technology are affiliates of ASM International. However, they are under no obligation to take any actions that are beneficial to us. Issues and conflicts of interest therefore may arise which might not be resolved in our best interests.
In addition, the directors of ASM Pacific Technology are under no obligation to declare a payment of dividends to shareholders. As a shareholder of ASM Pacific Technology, we cannot compel the payment or amount of dividends. With respect to the payment of dividends, the directors must consider the financial position of ASM Pacific Technology after the dividend. Since a portion of our cash flows available for our front-end segment is derived from the dividends we receive from ASM Pacific Technology, its failure to declare dividends in any year would negatively impact the cash position of our front-end segment for that year and reduce cash available to service our indebtedness. Cash dividends received from ASM Pacific Technology totaled€ 24.1 million,€ 40.4 million and€ 37.0 million, in 2003, 2004 and 2005, respectively.
The directors of ASM Pacific Technology owe their fiduciary duties to ASM Pacific Technology, and may approve transactions to which we are a party only if the transactions are commercially beneficial to ASM Pacific Technology. Further, under the listing rules of the Hong Kong Stock Exchange, directors who are on the boards of both ASM Pacific Technology and ASM International are not permitted to vote on a transaction involving both entities. This would disqualify both of the two affiliates of ASM International who currently serve on the board of ASM Pacific Technology from voting on any such transaction.
As a shareholder of ASM Pacific Technology, we can vote our shares in accordance with our own interests. However, we may not be entitled to vote on transactions involving both us and ASM Pacific Technology under the listing rules of the Hong Kong Stock Exchange and the Hong Kong Takeover Code. In particular, under the Hong Kong Takeover Code we would be excluded from voting if we were directly involved in a takeover of ASM Pacific Technology in a transaction requiring a shareholder vote.
Our reliance on a limited number of suppliers could result in disruption of our operations.
We outsource a substantial portion of the manufacturing of our front-end business to a limited number of suppliers. We are in the process of developing additional internal and external sources of supply for these manufacturing processes in the future, including an additional front-end supply source in Singapore. If our suppliers were unable or unwilling to deliver products to us in the quantities we require for any reason, including natural disaster, labor unrest, capacity constraints, supply chain management problems or contractual disputes, we may be unable to fill customer orders on a timely basis, which could negatively affect our financial performance and customer relationships.
Because the costs to semiconductor manufacturers of switching from one semiconductor equipment supplier to another can be high, it may be more difficult to sell our products to customers having a competing installed base, which could limit our growth in sales and market share.
We believe that once a semiconductor manufacturer has selected a supplier’s equipment for a particular product line, that manufacturer generally continues to rely on that supplier for future equipment requirements, including new generations of similar products. Changing from one equipment supplier to another is expensive and requires a substantial investment of resources by the customer. Accordingly, it is difficult to achieve significant sales to a customer using another supplier’s equipment. Our inability to sell our products to potential customers who use another supplier’s equipment could adversely affect our ability to increase revenue and market share.
11
Table of Contents
Our ability to compete could be jeopardized if we are unable to protect our intellectual property rights from challenges by third parties; claims or litigation regarding intellectual property rights could require us to incur significant costs.
Our success and ability to compete depend in large part upon protecting our proprietary technology. We rely on a combination of patent, trade secret, copyright and trademark laws, nondisclosure and other contractual agreements and technical measures to protect our proprietary rights. These agreements and measures may not be sufficient to protect our technology from third party infringements, or to protect us from the claims of others. In addition, patents issued to us may be challenged, invalidated or circumvented, rights granted to us under patents may not provide competitive advantages to us, and third parties may assert that our products infringe their patents, copyrights or trade secrets. Third parties could also independently develop similar products or duplicate our products.
In addition, monitoring unauthorized use of our products is difficult and we cannot be certain that the steps we have taken will prevent unauthorized use of our technology. The laws of some countries in which our products are or may be developed, manufactured or sold, including various countries in Asia, may not protect our products or intellectual property rights to the same extent as do the laws of the Netherlands and the United States and thus make the possibility of piracy of our technology and products more likely in these countries. If competitors are able to use our technology as their own, our ability to compete effectively could be harmed.
In recent years, there has been substantial litigation regarding patent and other intellectual property rights in semiconductor-related industries. Unrelated to our 1997 settlement with Applied Materials, discussed below, we entered into a settlement agreement with Applied Materials in August 2004 dismissing all claims and counter-claims over certain patent infringement proceedings in the United States without prejudice and without payment of any kind by any party and without licensing any patents. In addition, in April 2003, we and our subsidiary, ASM America entered into a binding memorandum of understanding regarding the settlement of mutual patent infringement claims between ASM America and Genus. In the future, additional litigation may be necessary to enforce patents issued to us, to protect trade secrets or know-how owned by us or to defend us against claimed infringement of the rights of others and to determine the scope and validity of the proprietary rights of others.
Claims that our products infringe the proprietary rights of others would force us to defend ourselves and possibly our customers or suppliers against the alleged infringement. Such claims, if successful, could subject us to significant liability for damages and invalidate our proprietary rights. Regardless of the outcome, patent infringement litigation is time-consuming and expensive to resolve and diverts management time and attention.
Intellectual property litigation could force us to do one or more of the following, any one of which could severely harm our business:
| • | forfeit our proprietary rights; |
| • | stop manufacturing or selling our products that incorporate the challenged intellectual property; |
| • | obtain from the owner of the infringed intellectual property right a license to sell, produce, use, have produced, have sold or have used the relevant technology, which license may not be available on reasonable terms or at all or may involve significant royalty payments; |
| • | pay damages, including treble damages and attorney’s fees in some circumstances; or |
| • | redesign those products that use the challenged intellectual property. |
We license the use of some patents from a competitor pursuant to a settlement agreement; if the agreement is terminated, our business could be adversely affected.
In October 1997, we entered into an agreement to settle mutual patent infringement litigation with Applied Materials, which was amended and restated in 1998, pursuant to which Applied Materials agreed to grant us a worldwide, non-exclusive and royalty-bearing license to use all of the litigated patents and certain additional patents that were not part of the litigation. In return we agreed to pay Applied Materials a settlement fee and to grant it a worldwide, non-exclusive and royalty-free license to use a number of our patents including but not limited to those patents which we were enforcing in the litigation. All licenses expire at the end of the life of the underlying patents. Our obligation to pay certain royalties to Applied Materials continues until the expiration of the corresponding underlying patent. In addition, the settlement agreement included covenants for limited periods during which the parties would not litigate the issue of whether certain of our products infringe any of Applied Materials’ patents that were not licensed to us under the settlement agreement. The covenants, which lasted for different periods of time for different products, have expired. Upon the occurrence of an event of default or other specified events, including, among other things, our failure to pay royalties, a change of control of ASM International, and improper use of the licenses, Applied Materials may terminate the settlement agreement, including the licenses included in the agreement.
12
Table of Contents
Additional litigation with Applied Materials regarding other matters or the operation of the settlement agreement itself could occur. Litigation with Applied Materials, which has greater financial resources than we do, could negatively impact our earnings and financial position.
We must offer a possible change of control transaction to Applied Materials first.
Pursuant to our 1997 settlement agreement with Applied Materials, one of our competitors, as amended and restated in 1998, if we desire to effect a change of control transaction, as defined in the settlement agreement, with a competitor of Applied Materials, we must first offer the change of control transaction to Applied Materials on the same terms as we would be willing to accept from that competitor pursuant to a bona fide arm’s-length offer made by that competitor.
We operate worldwide; economic, political, military or other events in a country where we make significant sales or have significant operations could interfere with our success or operations there and harm our business.
We market and sell our products and services throughout the world. A substantial portion of our manufacturing employees and operations are in the People’s Republic of China and the success of our business depends on our operations there. In addition, we have facilities in the Netherlands, the United States, Japan, Hong Kong, Singapore, Malaysia and South Korea. Our operations are subject to risks inherent in doing business internationally, including, without limitation:
| • | unexpected changes in regulatory or legal requirements or changes in one country in which we do business which are inconsistent with regulations in another country in which we do business; |
| • | fluctuations in exchange rates and currency controls; |
| • | political conditions and instability, particularly in the countries in which our manufacturing facilities are located; |
| • | economic conditions and instability; |
| • | terrorist activities; |
| • | human health emergencies, such as the outbreak of infectious diseases or viruses, particularly in the countries in which our manufacturing facilities are located; |
| • | tariffs and other trade barriers, including current and future import and export restrictions, and freight rates; |
| • | difficulty in staffing, coordinating and managing international operations; |
| • | burden of complying with a wide variety of foreign laws and licensing requirements; |
| • | difficulty in protecting intellectual property rights in some foreign countries; |
| • | limited ability to enforce agreements and other rights in some foreign countries; |
| • | longer accounts receivable payment cycles in some countries; and |
| • | business interruption and damage from natural disasters. |
To the extent that such disruptions slow the global economy or, more particularly, result in delays or cancellations of purchase orders, our business and results of operations could be materially and adversely affected.
Our operational results could be negatively impacted by currency fluctuations.
Our assets, liabilities and operating expenses and those of our subsidiaries are to a large extent denominated in the currency of the country where each entity is established. Our financial statements, including our Consolidated Financial Statements, are expressed in euros. The translation exposures that result from the inclusion of financial statements of our subsidiaries that are expressed in the currencies of the countries where the subsidiaries are located are not hedged. As a result, our operational results are exposed to fluctuations of various exchange rates. These net translation exposures are taken into account in determining Shareholders’ Equity.
In addition, foreign currency fluctuations may affect the prices of our products. Prices for our products for sales to our customers throughout the world are currently denominated in various foreign currencies including, but not limited to, United States dollars, euros, Japanese yen and Chinese yuan. If there is a significant devaluation of the currency in a specific country, the prices of our products will increase relative to that country’s currency and our products may be less competitive in that country. Also, we cannot be sure that our international customers will continue to be willing to place orders denominated in these currencies. If they do not, our revenue and operating results will be subject to additional foreign exchange rate fluctuations.
13
Table of Contents
Although we monitor our exposure to currency fluctuations, these fluctuations could negatively impact our earnings, cash flow and financial position.
If our products are found to be defective, we may be required to recall and/or replace them, which could be costly and result in a material adverse effect on our business, financial condition and results of operations.
One or more of our products may be found to be defective after we have already shipped the products in volume, requiring a product replacement or recall. We may also be subject to product returns and product liability claims that could impose substantial costs and have a material and adverse effect on our business, financial condition and results of operations.
Environmental laws and regulations may expose us to liability and increase our costs.
Our operations are subject to many environmental laws and regulations wherever we operate governing, among other things, air emissions, wastewater discharges, the use and handling of hazardous substances, waste disposal and the investigation and remediation of soil and groundwater contamination. In February 2003, the European Commission published a directive on waste electrical and electronic equipment (“WEEE”) (Directive 2002/96/EC, which was amended in December 2003 by Directive 2003/108/EC), and which has been implemented in the Netherlands. In principle, the rules result in “take-back” obligations of manufacturers and/or the responsibility of manufacturers for the financing of the collection, recovery and disposal of electrical and electronic equipment by requiring that European Union Member States adopt appropriate measures to minimize WEEE disposal and achieve high levels of collection and separation of WEEE. As of August 13, 2005 producers of WEEE will have to provide for the financing of the collection, treatment, recovery and environmentally sound disposal of WEEE. Another directive of the European Commission (Directive 2002/95/EC) provides for a ban on the use of lead and some flame retardants in manufacturing electronic components. To the extent these and other regulations apply to our business in Europe and elsewhere throughout the world, these measures could adversely affect our manufacturing costs or product sales by forcing us or our suppliers to change production processes or use more costly materials.
As with other companies engaged in similar activities, we face inherent risks of environmental liability in our current and historical manufacturing activities. Costs associated with future environmental compliance or remediation obligations could adversely affect our business.
Members of our Supervisory Board and Management Board and our executive officers control approximately 23.2% of our voting power which gives them significant influence over matters voted on by our shareholders, including the election of members of our Supervisory Board and Management Board and makes it substantially more difficult for a shareholder group to remove or elect such members without the support of management.
Our Chairman and Chief Executive Officer controlled approximately 21.8% of the voting power of our outstanding common shares as of December 31, 2005, and the members of our Supervisory Board and Management Board and all our executive officers as a group controlled approximately 23.2% of the voting power of our outstanding common shares as of that date. Accordingly, these persons have significant influence on the outcome of matters submitted to a shareholder vote, such as the election of the members of our Supervisory Board and Management Board. Persons nominated in a non-binding nomination by the Supervisory Board for appointment by the shareholders to the Supervisory Board or Management Board at the annual general meeting of shareholders will be elected if the number of affirmative votes exceeds the number of negative votes cast by holders of the outstanding shares present or represented at the meeting and entitled to vote. Persons nominated in a binding nomination by the Supervisory Board for appointment by shareholders to the Supervisory Board and Management Board at the annual general meeting of shareholders are so appointed unless shareholders reject such nomination by a vote of at least two-thirds of the votes cast, provided that the votes to reject represent at least 50% of all issued and outstanding shares eligible to vote. This makes it difficult for a group of shareholders to remove or elect members of our Supervisory Board or Management Board without the support of management.
Our anti-takeover provisions may prevent a beneficial change of control.
Our shareholders have granted to Stichting Continuïteit ASM International, or Stichting, a non-membership organization with a board composed of our President and Chief Executive Officer, the Chairman of our Supervisory Board and three independent members, the right to acquire and vote our preferred shares to maintain the continuity of our company. Toward that objective, Stichting will evaluate, when called for, whether a takeover offer is in our best interest, and may, if it determines that such action is
14
Table of Contents
appropriate, acquire preferred shares with voting power equal to 50.0% of the voting power of the outstanding common shares. This is likely to be sufficient to enable it to prevent a change of control from occurring. For additional information regarding Stichting, see Item 7. “Major Shareholders and Related Party Transactions.”
These provisions may prevent us from entering into a change of control transaction that may otherwise offer our shareholders an opportunity to sell shares at a premium over the market price.
Our stock price has fluctuated and may continue to fluctuate widely.
The market price of our common shares has fluctuated substantially in the past. Between January 1, 2005 and December 31, 2005, the sales price of our common shares, as reported on the NASDAQ Stock Market, ranged from a low of US$ 12.83 to a high of US$ 19.15. The market price of our common shares will continue to be subject to significant fluctuations in the future in response to a variety of factors, including the risk factors discussed in this report and the following, without limitation:
| • | future announcements concerning our business or that of our competitors or customers; |
| • | the introduction of new products or changes in product pricing policies by us or our competitors; |
| • | litigation regarding proprietary rights or other matters; |
| • | changes in analysts’ earnings estimates; |
| • | developments in the financial markets; |
| • | quarterly fluctuations in operating results; |
| • | general economic, political and market conditions, such as recessions or international currency fluctuations; or |
| • | general conditions in the semiconductor and semiconductor equipment industries. |
In addition, public stock markets frequently experience substantial price and trading volume volatility, particularly in the high technology sectors of the market. This volatility has significantly affected the market prices of securities of many technology companies for reasons frequently unrelated to or disproportionately impacted by the operating performance of these companies. These broad market fluctuations may adversely affect the market price of our common shares.
Compliance with Internal Controls Evaluations and Attestation Requirements.
We are subject to United States securities laws, including the Sarbanes-Oxley Act of 2002 and the rules and regulations adopted by the U.S. Securities and Exchange Commission pursuant to the Act. Under section 404 of the Sarbanes-Oxley Act and the related regulations, we are required to perform an evaluation of our internal controls over financial reporting and have our independent auditor publicly attest to this evaluation beginning with the year ended December 31, 2006. We have commenced the evaluation and expect to complete it in the course of 2006. Internal control evaluations and attestation requirements are time-consuming and expensive. If we would fail to complete the evaluation of our internal controls over financial reporting in time, if we would identify material weaknesses in these internal controls, or if our independent accountant could not timely attest to our evaluation, we could be subject to regulatory scrutiny and decreased public confidence in our internal controls, which may adversely affect the market price of our common shares.
Item 4. Information on the Company
The information in this Item 4 should be read in conjunction with the risks discussed under Item 3.D “Risk Factors.”
A. History and development of the Company.
ASM International N.V. was incorporated on March 4, 1968 as a Netherlandsnaamloze vennootschap, or public limited liability company, and was previously known as Advanced Semiconductor Materials International N.V. Our principal executive offices are located at Jan van Eycklaan 10, 3723 BC Bilthoven, the Netherlands. Our telephone number at that location is +31 30 229 84 11. Our authorized agent in the United States is our subsidiary, ASM America Inc,, a Delaware corporation, located at 3440 East University Drive, Phoenix, Arizona 85034, United States of America.
15
Table of Contents
B. Business overview.
Introduction
Our Business
As a semiconductor capital equipment supplier, we design, manufacture and sell production systems and services to our customers for the production of semiconductor devices, or integrated circuits. The semiconductor capital equipment market is composed of three major market segments: wafer processing equipment, assembly and packaging equipment, and test equipment. ASMI is mainly active in the wafer processing and assembly and packaging market segments. The wafer processing segment is referred to as “front-end.” Assembly and packaging is referred to as “back-end.”
Front-end production systems perform processes on round slices of silicon, called a wafer. During these processes, thin films, or layers, of various materials are grown or deposited onto the wafer, or an existing thin film on a wafer undergoes modification, such as a temperature treatment, or local etching. These films form numerous individual and separable circuits on the wafer, called “dies” or “chips.” After probing and selecting these individual circuits for correct performance, the dies on the processed wafer are separated, with each die of the same wafer containing the same circuitry. Back-end production systems then assemble and connect one or more of these known good dies—or sometimes several different known good dies from different wafers, each supplying a different functionality—in a single package, to form a complex semiconductor device that will perform calculations, store data and interface with its environment.
Our front-end operations are conducted through wholly-owned subsidiaries, the three most significant being ASM Europe B.V. (“ASM Europe”), located in the Netherlands, ASM America, Inc. (“ASM America”), located in the United States, and ASM Japan K.K. (“ASM Japan”), located in Japan.
Our back-end operations are conducted through our majority-owned subsidiary, ASM Pacific Technology Ltd. (“ASM Pacific Technology” or “ASMPT”), with principal operations in Hong Kong, the People’s Republic of China, Singapore, and Malaysia. At December 31, 2005, we owned 53.59% of the outstanding equity of ASM Pacific Technology.
The location of our front-end facilities allows us to interact closely with customers in the world’s major front-end geographic market segments: Europe, North America, and Asia. We address a part of the “deposition and related tools” market segment, defined by VLSI Research1. Our front-end segment accounted for 47.1% of our net sales in 2004 and 49.5% of our net sales in 2005.
Our back-end facilities are in close proximity to where most customer assembly and packaging operations are located. We address parts of the “bonding equipment” and “packaging equipment” segments, defined by VLSI Research2. We also manufacture and sell lead-frames. Our back-end segment accounted for 52.9% of our net sales in 2004 and 50.5% of our net sales in 2005.
Through our majority-owned subsidiary, NanoPhotonics AG (“NanoPhotonics”), located in Germany, we participate in the “process diagnostic equipment” market segment, defined by VLSI Research3, which is part of the test equipment market. The metrology subassemblies produced by NanoPhotonics are also sold as an integrated subassembly on our wafer processing systems for “integrated metrology” purposes. At December 31, 2005, we owned 69.1% of the outstanding equity of NanoPhotonics.
Industry Background and Major Business Trends
Semiconductor devices are the key enablers of the electronic age. Each semiconductor device can hold many individual components, most of which are transistors. For over 30 years now, the average number of components per integrated semiconductor device, at the optimum cost-per-component, has been increased by a factor of two, every 18 to 24 months. This trend is generally referred to as Moore’s law, after Gordon Moore, one of the founders of Intel. Increases in complexity, along with simultaneous reductions in the cost-per-component, have mainly been achieved by reducing the size of individual transistors, so that a larger number of transistors fit within a given size die. Today, transistors less than 100nm (one billionth of a meter) long are manufactured in high volume, while over several billion transistors can be manufactured on a single die.
| 1 | www.vlsiresearch.com, VIC code 460.00000, accessed December 2004. |
| 2 | www.vlsiresearch.com, VIC codes 540.00000 and 550.00000, accessed December 2004. |
| 3 | www.vlsiresearch.com, VIC code 350.00000, accessed December 2004. |
16
Table of Contents
A second development decreases the cost per device by increasing the size of the wafer (the silicon substrate upon which semiconductors are built), so that more devices can be produced within one production cycle. Today, most of the newly installed semiconductor device fabrication capacity employs 300mm wafers, with each wafer typically holding between a few dozen to several thousand individual circuits. The simultaneous increase in the complexity of devices, and the substantial decrease in cost-per-component has supported an approximately US$ 1.1 trillion electronics industry, and behind that, a semiconductor industry of approximately US$ 235 billion (Gartner, Dec 9, 2005 4). The semiconductor industry in turn, is supported by the US$ 34 billion (Gartner, Oct 6, 2005 5) semiconductor capital equipment industry which supplies the needed production systems and services needed.
The yield, or the fraction of chips (known good dies) on a wafer that operate according to specifications, is usually one of the most important variables that influences the performance of the integrated device manufacturers. Large initial investments are needed to build an automated production line in an ultra-clean environment in order to achieve high yield. The capital equipment in this production line is increasingly becoming an important determinant for the yield of the factory.
Parallel to the above-mentioned trends of transistor scaling and larger wafer size, another trend is beginning to emerge on the die level: heterogeneous integration. While the components on a chip that perform calculation and storage can undergo scaling, other components, such as inductors, capacitors, sensors, micromechanical, photonic, or micro-fluidic devices, do not scale as easily as do transistors and some capacitors. Yet, in order to make devices with these components small and cost-effective enough, they will eventually also have to be integrated into the same semiconductor device. Although several functions can be integrated on a single die, as in a system on a chip (“SoC”), for economical reasons this is usually limited to the components that scale with Moore’s law (“more Moore”), and use the same base material (silicon). For components that do not scale, or components that use a different base material (GaAs, for example) it is not always practical or economically feasible to place them on the same die. In that case, integration of several dies, sometimes coming from different supply lines, in a single package to form a system in a package (“SiP”) is the alternative solution that provides the desired functionality. This trend is sometimes referred to as “more than Moore.”
The trends outlined above are the drivers of the broad semiconductor roadmap which semiconductor equipment companies track in developing new production systems and process technologies. These new systems and technologies must be developed well ahead of volume demand for the semiconductor devices they make. As a result, there is a large lead time between the investment in a new technology, and its commercial success. With the combination of a long lead time and the short product life-cycles comes the inherent difficulty of matching supply and demand, which results in the high volatility associated with the semiconductor industry. In this highly cyclical industry, the front-end and back-end market segments have historically reacted differently to market forces. We believe, therefore, that operating in both segments works in our favor to reduce the impact of business cycles on our operations.
Our Strategy
Our strategic objective is to realize profitable, sustainable growth by capitalizing on our technological innovations, manufacturing infrastructure and sales and support offices located close to our global customers. We intend to enhance our market position by providing customers with the advanced, cost-effective, and reliable products they need, along with excellence in customer service and support. The key elements of our strategy include:
| 1. | Realizing profitable growth for our front-end segment, by systematically increasing our operating efficiency and reducing manufacturing costs through vertical integration of our supply chain, and the location of significant parts of our manufacturing capability in lower labor rate countries, building upon experiences gained in our back-end segment. |
| 2. | Maintaining our global reach through our operating, sales and customer service facilities in key parts of the world in order to establish and maintain long-term customer relationships. |
| 3. | Strengthening our relationships with independent research institutes, universities, customers and suppliers and entering into strategic alliances to enhance the scope and depth of our research and development activities. |
| 4. | Advancing our existing technology base by developing new materials and processes which can increase performance of semiconductor devices and reduce customer cost of ownership. |
| 4 | http://www.gartner.com/press_releases/pr2005.html, accessed January 2006. |
| 5 | http://www.gartner.com/press_releases/pr2005.html, accessed January 2006. |
17
Table of Contents
| 5. | Leveraging our strong technology and manufacturing capabilities to capture market share early in the lifecycle of significant technology advancements, such as the shift to 300mm wafers, the move to copper-low k, or to transistor engineering. |
| 6. | Capitalizing on our technology leadership in both back-end and front-end major market segments to become a leader in the coming revolution that takes us beyond the confines of “Moore’s law” to the heterogeneous integration environment of “more than Moore” technology. |
| 7. | Expanding our intellectual property portfolio, by filing patent applications for key developments in equipment, software, materials and processes, and simultaneously increasing our royalty related revenue by exploiting our intellectual property portfolio through licensing programs. |
Background of Semiconductor Manufacturing Processes
Overview
The process of manufacturing an integrated semiconductor, from raw material to finished device, includes two major segments: the front-end and back-end manufacturing processes. We participate in both segments.
Front-end Manufacturing Process
The front-end manufacturing process, or wafer processing, can be divided in three distinct manufacturing processes: wafer manufacturing, transistor formation, known as front-end of the line (“FEOL”) processing, and interconnect formation, known as back-end of the line (“BEOL”). We develop and sell technology, develop and manufacture equipment, and provide services used by semiconductor device manufacturers in each of these sections of front-end manufacturing.
In the wafer manufacturing process a large single crystal of very pure silicon is grown from molten silicon. The crystal is then sliced into a large number of thin slices, or wafers, of single crystalline silicon. These slices are polished to an atomic level flatness before the next steps are executed. For advanced applications, some layers are deposited on the wafer for later use, by either epitaxy or diffusion/oxidation (described below). Epitaxial wafers are even flatter and contain fewer defects at the surface than polished wafers. Some wafers are made with an embedded electrically insulating layer, such as silicon oxide, just below a very thin top layer of pure silicon. These special wafers are called Silicon-on Insulator or SOI wafers and are used for some of the most advanced microprocessors. The finished wafers, still without pattern on them, are shipped to the integrated device manufacturers and foundries for further processing.
During FEOL and BEOL wafer processing, multiple thin films of either electrically insulating material, also called dielectrics, or conductive material are modified, grown, or deposited on a silicon wafer. First, several material processing cycles are used in the FEOL to build the basic transistor and other components such as capacitors and resistors. Second, several processing cycles are used in the BEOL to build additional components such as capacitors, inductors and resistors, and to electrically connect the large amount of transistors and components. Patterning of deposited layers with lithography and etching (described below) creates the transistors, other components and connecting wires, which together make up the integrated circuit. Each integrated circuit is on a single “chip” or a “die” on the wafer. A finished wafer may contain a few dozen to several thousand individual dies. Front-end processes are performed either one wafer at a time in single wafer processing systems or many wafers at a time in batch processing systems. Multiple processes are repeated on each layer as the wafer is processed.
The number and precise order of the process steps vary depending upon the complexity and design of the integrated circuit. The performance of the circuit is determined in part by the various electrical characteristics of the materials used in the layers of the circuit and the wafer. Simple circuits may have as few as ten layers, while complex circuits may have more than one hundred layers. The front-end manufacturing process is capital intensive, requiring multiple units of several different production systems. Many different but complementary methods are used to modify, grow, or deposit materials on the wafers. ASMI is most active in developing and manufacturing the equipment used by semiconductor device manufacturers in the deposition processes, i.e., those steps that involve the creation of insulating, conducting and semi-conducting layers on the wafer surface.
The front-end manufacturing process is complete when all of the layers have been deposited and patterned on the wafer. As a last step, the correct electrical functioning of the integrated circuits on each die is confirmed by probing. Non-functioning circuits are marked so they can be eliminated before the back-end processing. The introduction of even trace levels of foreign particles or material can make a circuit, or even an entire wafer, unusable. To reduce the level of foreign particles or material, front-end processing is performed in clean rooms with ultra low particle and contamination levels. Once the front-end processing is complete, the entire wafer with multiple, functioning, integrated circuits is shipped to the back-end facility
18
Table of Contents
where it is separated into dies, which are then bonded, packaged, and tested before final shipment of the semiconductor device to the end customer. Back-end processes do not require the same level of contaminant control. These processes are performed in facilities that differ from facilities in which front-end processes are performed.
The following is an alphabetical list of the principal front-end process technologies used by semiconductor device manufacturers:
| • | Atomic Layer Deposition (“ALD”) is an advanced technology that deposits single atomic layers on wafers one at a time, and at low temperatures. This process is used to create ultra-thin films of exceptional quality and flatness. Plasma is sometimes used to enhance the process further (Plasma Enhanced ALD, PEALD) |
| • | Chemical Mechanical Polishing (“CMP”) is a technology that planarizes, or levels, layers deposited on wafers by polishing them with a chemical solution called slurry. Planarization reduces the vertical height differences of the various layers. This increases the number of layers that can be processed without introducing reliability problems. Electrochemical Mechanical Polishing (“ECMP”) is comparable to CMP aided with an electric current. |
| • | Chemical Vapor Deposition (“CVD”) is a technique in which one or more gaseous reactants are used to form a solid insulating or conducting layer on the surface of a wafer. Low pressure (Low Pressure CVD, LPCVD) or plasma is sometimes used to enhance the process further (Plasma Enhanced CVD, PECVD). |
| • | Clean removes undesirable contaminants from the wafer’s surface. |
| • | Diffusion and Oxidation are high-temperature processes that change the electrical characteristics of layers.Diffusion is used to move impurities and make impurities introduced by ion implantation electrically active.Anneal is used as a synonym to diffusion.Oxidation forms a silicon oxide layer on the wafer’s surface, which acts as an insulating or protective layer over the wafers surface. |
| • | Electroplating orElectrochemical Deposition (“ECD”)deposits a layer of metal from a complex liquid solution, containing metal salts, and certain additives, by passing an electrical current through that solution and towards the surface of the wafer.Electrochemical Mechanical Deposition (“ECMD”) is ECD with concurrent mechanical planarization. |
| • | Epitaxy involves the deposition of silicon or silicon compounds on the wafer, continuing and perfecting the crystal structure of the bare wafer underneath. Epitaxy improves the electrical characteristics of the wafer surface, making it suitable for highly complex microprocessors and memory devices. |
| • | Etch reproduces the pattern imprinted by lithography by removing excess material from the uppermost layer(s) of the wafer. |
| • | Ion Implantation is a process in which wafers are bombarded with ions to introduce dopant atoms, or impurities, into the wafer to improve its electrical characteristics. Silicon conducts little or no electricity. In order to have electrical current within a layer, it is necessary to place small amounts of impurities into the layer. |
| • | Lithography is used to print the various layer patterns of the semiconductor device on the uppermost layer of the wafer. These patterns determine the functions of the semiconductor device. The lithography determines the smallest pitch with which components can be placed in the circuit. |
| • | Metrology is used to measure the width of lines on semiconductor devices, the thickness of layers, the surface profiles of layers, and certain electrical properties of layers. |
| • | Probing is a process in which electrical and functional tests are performed on each die and defective ones are marked on the wafer so that they can be discarded prior to the back-end processing. |
| • | Rapid Thermal Processing (“RTP”) is similar to diffusion/oxidation, except that it exposes a single wafer to heat over a short period of time.Rapid Thermal Anneal (“RTA”) is a subset of RTP that is restricted to heat treatments in a non-reactive ambient. |
Back-end Manufacturing Process
When the wafer with confirmed working integrated circuits is received in the back-end facility, wafers are first cut (“diced”) into individual dies or chips by a dicing saw or sometimes a laser. The dies are then separated and a single die is (or for an advanced device several different dies are) picked and attached to a leadframe or other substrate by a bonding process. The leadframe or substrate provides the interface between the electrical circuit on the die and the system in which the die is incorporated. Leadframes are produced by stamping a pattern through a strip of copper or iron-nickel alloy. For high precision (and fast turnaround purposes) leadframes are produced by an etching process to achieve a shorter time to market. Stamped frames are typically used for very high volumes on mature designs. The leadframes are plated with
19
Table of Contents
a thin layer of silver or a stacked layer of nickel, palladium, and gold on appropriate places, in order to allow a wire to be easily attached to its surface. The electrical connection of the electrical circuit to the leadframe is made by wire bonding. As few as one or as many a thousand or more separate wires are each connected between a terminal connection point on the die and a lead on the leadframe, through which the device is able to communicate with the printed circuit board. Leadframes and wire bonding are by far the most common technology in use today.
After this assembly and wire bonding interconnection process, the dies are encapsulated to protect them from environmental influences. The encapsulation process employs high-grade epoxy molding compounds (“EMC”), automated molding systems, and tooling to enclose the die and wires. The molding compound forms a hard casing around the die and wires after it is cured. For production efficiency during assembly most leadframes consist of many parts arranged in rows and columns. Each individual part is moved through the multiple assembly process steps connected to other identical parts. After the molding process is completed, the parts are separated from this array in a series of processes referred to as trim, form, and singulation. Here too, high precision tooling and automation are employed to precisely cut away portions of the substrate or leadframe so that the packaged unit is freed from the rest. These singulated units will then move through inspection, electrical test, marking and packing to prepare the tested and finished devices for shipment to the customer.
Another method used for chips with high pin count and speed is flip chip. The flip chip process eliminates the need for die and wire bonding. Instead, it involves populating the electrical interconnect points on a chip with small solder balls made of low melting point materials, a process called bumping. The substrate is designed such that it has an identical pattern to that of the device. The device is then flipped onto the substrate with precise alignment and the bonding process is completed by the application of heat, force, ultrasonic vibration, or a combination of the three. Wafer level packaging (“WLP”) is another emerging technique that places all the protective layers, interconnections and interconnection points directly on the surface of the wafer, such that completely packaged devices are made at wafer level. After probing and dicing, the die can be separated and may be directly attached to printed circuit boards.
The following is a sequential list of the principal back-end processes used by semiconductor manufacturers:
| • | Die Separation separates the dies on the wafer into individual units using dicing saws. |
| • | Die Sortingsegregates tested dies into different performance levels. |
| • | Die Bonding mounts the die onto carriers such as lead-frames using a die bonder. |
| • | Wire Bonding attaches extremely thin gold, copper, or aluminum wires between the terminals on the die and the leadframe creating electrical connections using a wire bonder. Wedge bonding employs only ultrasonic energy, while thermosonic wire bonding employs both heat and ultrasonic energy. |
| • | Encapsulation or Molding encases the die in a protective housing, often epoxy, using dispensing systems or transfer molds. |
| • | Trim and Form cuts away the excess portion of the leadframe and bends the leads into the desired shape, resulting in the completed semiconductor device. |
| • | Marking puts product identification information on the semiconductor package using stencil printing or laser inscription techniques. |
| • | Singulation is the separation of the many individual devices attached to a leadframe. |
| • | Product Testing tests the performance of the completed, encapsulated, and singulated semiconductor device. |
| • | Binningassigns tested, packaged devices to defined performance categories. |
Important Technology Trends for our Business
Technology Trends
The continuous demand for smaller, faster and cheaper semiconductor components drives the technology advances in the semiconductor manufacturing process. As the transistors in an integrated circuit become smaller, the cost-per-component decreases. At the same time the operating speed of the transistor increases. Thus the minimum size of a single transistor in an integrated circuit is an extremely important parameter. This minimum size can be characterized by the so-called half-pitch, which is about equal to the smallest line width in the device. Today, we support our high volume production systems for leading-edge semiconductor devices with a half-pitch as small as 90 nanometers (one nanometer is one billionth of a meter). At ASMI, and in close cooperation with our customers, we are qualifying and testing new critical process equipment for line widths at or below 65nm. Simultaneously, we are developing new 45 and 32nm
20
Table of Contents
technologies in our laboratories. Today, most of the newly installed semiconductor device fabrication capacity employs 300mm wafers. Accordingly, our system and process development and sales effort is concentrated in 300mm equipment.
In developing faster and smaller devices, our front-end customers’ major technology requirements are
| • | lithography of ever smaller feature sizes, now much smaller than the wavelength of light; |
| • | new thin film materials and device designs that can reduce the amount of power consumed in the device, increase the speed and reliability of the circuit, and increase the amount of charge that can be stored; |
| • | new manufacturing processes that reduce device variability and increase yield; and |
| • | reliable manufacturing of taller three-dimensional structures in devices. |
Technological developments in the front-end process have resulted in new requirements for the back-end manufacturing process. The ability to place millions of transistors onto a thumbnail-size device with vastly increased functionality has created the first major trend: the need for more input/output terminals in the same or smaller space. The challenge for back-end equipment suppliers is to connect this increasing number of terminals in a package that sometimes is barely larger than the chip. Wire bonding has been at the forefront of this transition, but for integrated circuits with very high terminal count, the industry has developed ball grid array (“BGA”) and flip chip packaging that use the entire surface of a die, and not just the perimeter.
A second major trend in the back-end market segment is driven by the strong growth in demand for hand held devices. There is an ongoing need to build ever smaller and more complex packages at lower cost for this market. Individual dies must be packaged in areas that are just slightly larger than the individual dies they contain. These chip scale packages minimize the amount of space occupied on the end product circuit board.
A third major trend relates to the industry demand for a much higher level of integration, but still at lower cost and optimized yield. This has resulted in a requirement to place multiple dies into the same package. The assembly of a combination of “known good dies” in a package can lead to higher yield than the combination of the same functionality blocks on a single chip. Such a System-in-Package (“SiP”) is more than a simple collection of multiple dies: SiP products are fully functional systems or sub-systems. Moreover, devices from different supply chains, with sometimes entirely different feature sizes or technologies can be integrated this way. Dies can be placed next to and/or on top of each other, using stacked die bonding techniques and sometimes mixing flip chip and wire bonding techniques in the same package.
ASMI’s Response to Technology Trends
ASMI develops and manufactures wafer processing systems and new thin film materials that enable our customers to produce devices that consume less power, are faster, show less variability, are more reliable and are able to store more electrical charge. In order to meet our customers’ needs, we have developed, and are still developing many new materials. For example, in the FEOL, high-k dielectrics and novel metal electrodes can reduce the power consumption of a device, thereby enhancing battery life. This same class of materials can also lead to larger charge storage in a smaller capacitor, critical for memories and RF circuits. Another example of new materials in the FEOL is our silicon germanium (“SiGe”) epitaxial material that can increase the switching speed of the transistors and the circuit in which they are embedded by engineering the strain, and resulting amplification of the transistor. This can be done without negatively affecting the power these transistors consume. This same class of epitaxial material is also used in wafer manufacturing, where low defect density silicon on insulator (“SOI”), and strained SOI substrates are being developed for use in very advanced microprocessors. SOI decreases power consumption, and strained SOI, like strained silicon, enhances the switching speed of transistors.
In the BEOL or interconnect process, a continued demand to improve the speed at which signals travel through thin copper wires has lead to the development of a full suite of low-k materials. These low-k materials can decrease the amount of delay in signal propagation, resulting in, for example, faster microprocessors. Another example is the development of a flat thin copper layer that decreases line resistance while increasing speed. ASMI has been one of the leaders in successfully introducing all these new materials in the market.
We have also developed and sold new processes and wafer processing equipment to reduce the variability of the devices our customers make. ASMI’s proprietary RTA process, based on conduction rather than radiation heating, can decrease variability in individual transistors in a circuit, and also on a wafer, thereby significantly enhancing top-speed bin yield of microprocessors. In addition, in order to aid repeatable lithography and etch of very narrow lines and small, but tall capacitors, we have developed plasma-polymerization processes and thin film materials that can both reduce line roughness and increase
21
Table of Contents
the yield of dynamic random access memories (DRAM). We also believe that correct and intensive use of integrated metrology can improve device variability, which we are exploring with our majority-owned subsidiary NanoPhotonics. Our flat thin copper not only reduces the average resistance of narrow wires in complex interconnect structures, but also reduces resistance variability. The direct result is higher yield in the highest speed bin for microprocessors.
For our back-end customers, leadframe and wire bond technology continues to offer the most flexible method of connecting the die to the printed circuit board. Increasing pressure on the number of input/output terminals per unit area of silicon continues to drive down the distance between two adjacent interconnect points or pads, reducing the bond pad pitch and allowable wire diameter. The increasing I/O requirement has also resulted in the use of several rows of these pads on a single die. Production is now ongoing with a bond pad pitch of 37 microns. Wire bonding must not only address decreasing wire diameters and pitch, but also address the throughput to reduce the overall cost of the device. Future wire bonding platforms will be able to operate in an environment that requires the bond pad pitch to be at 25 microns. The increasing row count will require better control of the wire shapes to maintain signal integrity at high communication speeds. All of this must be achieved with the highest possible speed and reliability. In addition, semiconductor manufacturers are looking to automation and integration of back-end equipment as ways to reduce costs and increase productivity. We expect bond pad pitches smaller than about 20 micron to lead to performance issue with respect to the amount of current that can be pushed through a wire at the low voltages used today.
Increasing pressure on the level of integration and reduction in size of handheld or mobile devices has given rise to several alternative assembly and bonding techniques and materials, such as ceramic packages, flip chips and several chip-scale packaging methods. Stacked die packages, in which more than one die is stacked on top of another, to form a single device will play a major role in heterogeneous integration. These dies will, however, still be connected to the substrate or leadframe by conventional methods such as wire bonding. We are responding to the need of stacked die packages by developing better wire bonding techniques, for example, by controlling the shape of the wire loop. We are currently developing methods of working with insulated wires, which will allow for more crossed connections in a device.
Products
Market Coverage
The table below indicates the major market segments of the semiconductor equipment industry. The principal markets in which we participate are underlined.
| Market Segment1 |
| Major Market Segment1 | ||||
| Test and related Systems | Wafer Processing Equipment or Front-end | Assembly and Packaging Equipment or Back-end | ||
| Automated Test Systems | Lithography Equipment | Inspection | ||
| Material Handling Systems | CMP Equipment | Dicing | ||
| Process Diagnostic Equipment2 | Ion Implanters | Bonding | ||
| Production Management Systems | Deposition and Related Tools3 | Packaging | ||
| Etching and Clean | Integrated Assembly Systems | |||
| Leadframes4 | ||||
| (1) | Based on VLSI Research Industry Code6. |
| (2) | ASMI’s participation, through NanoPhotonics, is relatively minor. |
| (3) | This segment also includes diffusion and oxidation furnaces and RTP tools. |
| (4) | While the materials segment is not included by VLSI Research in this market segment, leadframes are a significant materials component of our revenues, necessary for back-end production. |
| 6 | www.vlsiresearch.com, VLSI Industry Code.doc, accessed Jan 2006. |
22
Table of Contents
Front-end Segment Products
ASMI’s front-end segment products come from a number of product platforms, with each platform designed to host and enable specified process technologies. The products in each product platform are linked through common technology elements of the platform, for example a common in-system software framework, common critical components, similar logistics (batch or single wafer processing), or a similar wafer processing environment (wet or dry). The following table lists our principal product platforms for the front-end market, the main process technology that they enable, and the semiconductor device manufacturing application for which the products from that platform are used.
Product Platform 1 | ASMI Process Technology 1 | Products | Currently participates in the Manufacturing Solution for 2 : | |||||||||||||
Si Starting | FEOL- Logic 3 | FEOL- Memory 4 | FEOL- RF/ AMS 5 | BEOL- Interconnect | BEOL- SoC 6 | |||||||||||
Advance 400 Series | ALD, CVD, diffusion/ oxidation, LPCVD | Vertical Furnace Systems | ü | ü | ü | ü | ü | ü | ||||||||
Levitor | RTA | Single Wafer Rapid Thermal Processing Systems | ü | ü | ||||||||||||
Epsilon | Epitaxy, LPCVD | Single Wafer Epitaxy Systems | ü | ü | ü | ü | ||||||||||
Polygon | ALD, PEALD | Single Wafer Atomic Layer Deposition Systems | ü | ü | ü | |||||||||||
Eagle and Dragon7 | PECVD | Single Wafer Plasma Processing Systems | ü | ü | ||||||||||||
| (1) | Advance, Levitor, Epsilon, Polygon, PEALD, Eagle, Dragon are used, registered or pending ASMI trademarks. |
| (2) | A checkmark in the boxes under the manufacturing application indicates one or more systems sold to a customer. |
| (3) | This includes CMOS transistor formation. |
| (4) | Includes the formation of the capacitor structure in a DRAM or Flash memory cell. |
| (5) | Radio Frequency/Analog Mixed Signal, including bipolar transistor formations in a BiCMOS chip. |
| (6) | Includes integrated passives, such as capacitors on a chip, used in single chip radio devices (“radio on a chip”). |
| (7) | Despite different configurations and capabilities, the Eagle and Dragon are considered to be one product platform because they share the same software framework, many critical components, and product structure. |
Description of our Front-end Segment’s Product Platforms
Advance 400
The Advance 400 is ASMI’s vertical furnace, batch processing platform. Products built on this product platform are used for diffusion, oxidation, (LP)CVD and ALD. The product platform is used in many manufacturing steps, from the production of silicon wafers to the final anneal in interconnect. The A400 is a system for 150 and 200mm wafers, while the A412 is a 300mm vertical furnace. The A412 can also be used as a bridge tool for 200mm wafers. The A412 systems feature two reactors above a rotating carousel, a dual-boat concept, and a wide range of process applications with load sizes up to 150 wafers in a single run. In this series, ASMI also offers the A412 SmartBatch, featuring a flexible load size of 1 to 50 wafers, and the A4ALD, for atomic layer deposition of dielectrics, targeted mainly for DRAM capacitor applications.
Levitor
The Levitor is our single-wafer RTP platform. The Levitor’s conductive heating technology is radically different from competing radiative heating systems with lamps. In the Levitor, the wafer floats on a very thin cushion of gas between two massive blocks maintained at the desired process temperature. The result is very precise wafer heating, which is independent from the emissivity, or color, of the wafer. The Levitor 4300
23
Table of Contents
is configurable for rapid thermal anneal of either 200 or 300mm wafers in high-volume semiconductor manufacturing. Two reactors can be integrated into one system for optimum cost and production efficiency. The Levitor can perform most RTA processes, including low temperature nickel-silicide and cobalt-silicide anneals and high temperature, ultra-short “spike” activation anneals. Low temperature copper anneal for BEOL interconnect application is currently in development. The Levitor is designed to participate in all manufacturing applications, and is installed in FEOL logic and memory manufacturing.
Epsilon
The Epsilon is our platform for single wafer epitaxy. The Epsilon product platform offers a wide range of epitaxy products and materials for many applications, ranging from high temperature silicon used in silicon starting material manufacturing, to low temperature SiGe and silicon germanium carbon (“SiGeC”) used in bipolar devices. More recently, low temperature selective SiGe, SiC and Si processes for recessed and raised source-drain applications have been developed on this platform. The Epsilon 2000 is a single wafer, single reactor system for 150mm and 200mm wafers. The Epsilon 3000 was the first epitaxy system that was used for 300mm production of recessed source/drains with selective silicon-germanium. Our newest systems, the Epsilon 3200 and Epsilon 3220, for a single and a dual reactor system respectively, feature several productivity enhancements. We expect that the continued demands from our customers to increase device speed and reduce power consumption will drive an increased use of advanced epitaxial layers in the device, particularly when deviations from planar CMOS occur.
Polygon
The Polygon is our single wafer atomic layer deposition platform. It features a six-sided central vacuum handler, capable of hosting up to four reactors. One or more Pulsar 3000 modules, the latest generation of the industry’s first ALD reactor, or Emerald modules with PEALD technology, can also be integrated into the system platform. Products built on this product platform are currently being used in ALD high-k gate dielectrics for FEOL logic, (embedded) DRAM capacitor dielectrics, barrier layers for non-volatile memories, magnetic head gap fill, and MIM capacitor applications for SoC. Products can be configured for either 200mm or 300mm wafer processing.
Eagle and Dragon
The Eagle is our single-wafer plasma processing platform. The basic Eagle 10 systems for 200mm, and the Eagle 12 systems for 300mm systems each have two reactors, and are utilized in high volume manufacturing for PECVD of insulators (such as silicon oxide, silicon nitride, silicon oxi-nitride) mainly for interconnect applications. Plasma polymerization processes released on the Eagle and Dragon product platform include a full series of Aurora low-k dielectrics for interconnect applications, and Nano Carbon Polymer (“NCP”), a hard mask layer for deep UV lithography to improve formation of deep and small structures for FEOL memory. The Eagle 10 TRIDENT (200mm) and Eagle 12 Rapidfire (300mm) systems feature three reactors for larger productivity. The Dragon 2300 is a dual reactor system that is configured for high wafer throughput. The Dragon has what we consider to be the smallest footprint of any high volume, 300mm PECVD production tool.
Description of our Front-end Segment’s Process Technology Platforms
Depending on application, a process technology can be used in more than one product platform. ALD, for example, is enabled on both ASMI’s single wafer and batch product platforms. This gives us the ability to provide a single wafer tool for a certain application when short development cycle times are needed initially, then switch to a batch tool for efficiencies in high volume production. Process technologies that are intended for use across multiple product platforms are called a process technology platform. The technologies in a process technology platform share a common knowledge base and patent portfolio.
ALCVD: Atomic Layer Deposition and Plasma Enhanced Atomic Layer Deposition
ALCVD is one of the newest technologies to deposit ultra-thin films of exceptional flatness and uniformity. This technology was brought into ASMI in 1999 with the acquisition of ASM Microchemistry, who first developed ALD. PEALD is an extension of this original ALD technology that uses plasma. It was brought into ASMI in 2001 through a partnership with Genitech and the subsequent acquisition of Genitech in 2004. The current process development effort is focused mainly on providing new, higher quality, dielectric materials. Several dielectric processes are released on our Polygon and Advance 400 product platforms. A relatively smaller effort is directed towards the process development for conductors. A TiN (a special high temperature resistant conductor) process is released on our Advance 400 product platform. We have approximately 280 issued patents that relate to this process technology platform. In addition, ALCVD, Atomic Layer CVD, and PEALD are our trademarks. We expect that the trends of continued scaling, and evolution towards three dimensional device structures plays into the strength of our ALCVD technology.
24
Table of Contents
CVD and LPCVD: novel chemistries and New Technology
On our CVD process technology platform we have developed processes with new chemistries (under the trademark Silcore) that enable the deposition of silicon and silicon containing materials at low temperatures. Collectively the necessary system hardware and software is called New Technology (“NT”). Processes are released on our Epsilon product platform for non-selective epitaxy and single wafer LPCVD, and on our Advance 400 product platform for silicon nitride spacer applications. We are continuing to develop potential applications of NT with our supplier partner Voltaix, and our research partner IMEC. Our strategy for the CVD process technology platform as a whole is to continue to qualify new chemistries developed by, and with, our chemical suppliers for all of our product platforms, in advance of the development of our customers’ needs. We currently have about 7 issued patents related to special LPCVD process chemistries, including NT.
Back-end Segment Products
The following table lists our principal products for back-end market, the main technologies that they enable, and the semiconductor device manufacturing application for which the products are used.
| Product Platform1 | ASMI Process Technology | Products1 | Currently participates in the Manufacturing Solution for2 : | |||||||||||||||||||
| High Speed Logic | Memory | Discretes (LED, Power) | SIP | Image Sensors | COB | Smart Card | RFID Tags | RF/ AMS | ||||||||||||||
| Die Bonding Products | Die Bonding | AD8xxx epoxy/eutectic, SD8xx soft solder, ISxxx glass attach Systems | ü | ü | ü | ü | ü | ü | ü | ü | ü | |||||||||||
| Eagle60 Series | Thermosonic Wire Bonding | Eagle60xx TS and TwinEagle and Harrier dual head Wirebonders Hummingbird stud bumping Systems | ü | ü | ü | ü | ü | ü | ü | ü | ü | |||||||||||
| Encapsulation Products | Encapsulation | IDEALmold and Osprey transfer molding Systems, DS898, DS500 dike-and-fill Systems | ü | ü | ü | ü | ü | ü | ||||||||||||||
| AD9xxx Series | Flip Chip Bonding | AD900, AD900TS AD9012, AD9012TS flip chip bonding Systems | ü | ü | ü | |||||||||||||||||
| AB5xx Series | Ultrasonic Wedge Bonding | AB520, AB530, AB59A | ü | ü | ||||||||||||||||||
| Die Sorting Products | Die Sorting | WP808A WLP sorting Systems, WS896, AS896A, MS899 die sorting Systems | ü | ü | ||||||||||||||||||
| Post Encapsula-lation Products | Ball Placement, Testing and Marking, Trim and Form, Singulation, Binning | MPxxx, BGxxx, FTxxxx, CSxxxx, BP2000 | ü | ü | ü | ü | ü | ü | ü | ü | ||||||||||||
| (1) | Eagle60, Harrier, Hummingbird, IDEALmold, Osprey, and TwinEagle are used, registered, or pending ASM Pacific Technology trademarks. |
| (2) | A checkmark in the boxes under the manufacturing application indicates one or more systems sold to a customer. |
25
Table of Contents
Die Bonding and Die Sorting Products
We manufacture several die bonding models as well as die sorting equipment to address various markets including semiconductor and optoelectronic devices. The latest epoxy die bonder platform for 300mm wafers continues the path undertaken by ASMI to provide customers with the highest quality and best cost/performance systems on the market. With its capability of handling up to 300mm wafers, fully automatic operation, epoxy writer, pre and post bond inspection and wafer mapping, this platform is able to provide customers with exceptional operational results. Variations on this platform have been developed to address the requirements of the growing stacked die market. The ability to handle silicon devices down to 50 microns in thickness is a key feature for the future.
Packaged device performance is continually pushed to higher levels. In critical applications, devices are increasingly utilizing flip chip interconnect methods to provide higher levels of electrical performance. Our flip chip platform provides high speed flip chip die bonding for IC applications. Variations of this platform have evolved to provide for the use of ultrasonics, heat force or the combination of these to affect the process. There continues to be a very large market in which the die and wafer sizes are relatively small, under 30 mils square. A mil is 1/1000 of an inch. Many of these devices are attached directly to printed circuit boards (Chip on Board, “COB”) or very large arrays. Therefore, many different handling methods are required. We have several platforms addressing the various form factors represented in the market.
Optoelectronics represent a separate but very large category of the small die business. This segment requires both high speed and high precision manipulation of very small devices. While there is a need for the die attach process many of these devices are assembled in arrays where their brightness and color must match. We have developed several platforms for sorting these devices and segregating them according to the customers’ requirements. The power device market continues to grow. These devices have unique thermal and electrical requirements that must be met by the die attach process. We have a new platform that addresses the use of soft solder in a special atmosphere that facilitates this special process. Machines may be configured to operate stand-alone or connected to epoxy curing ovens and wire bonders.
Wire Bonding Products
The Eagle60 gold wire bonder was introduced in 2002. This was the successor to our award-winning AB339 Eagle generation bonder. Platform evolution continued with the deployment of the Eagle60 and Eagle60AP gold wire bonders. Both of these platforms continued to extend the productivity of the process as well as exceed the industry roadmaps for required bond pad pitch. Additional features on the AP allow it to deal with the complex wire geometries and extreme height variations that are prevalent in the stacked die packages being built today. The productivity envelope was enlarged with the introduction of our latest dual head platform, the TwinEagle. This tool provides all the capabilities of our standard Eagle60 but with a much smaller footprint. We also extended our product portfolio in the wedge bonder area with newer, faster, more flexible systems to address the consumer products market that focuses on cost effective solutions. The expansion of the flip chip process has also provided us with opportunities to expand on our wire bonder technology to provide platforms capable of applying gold or copper stud bumps on wafers up to 300mm in diameter.
Encapsulation Products
Our auto molding product line continues to build on the success of our earlier automated multi-plunger molding systems. The IDEALmold serves the industry segment that requires very high throughput with production flexibility. The recent shift in lot sizes and package variability also required a new platform. We have met this requirement with our Osprey single strip-fed partial molding system. With this platform, the emphasis is on quick material and package conversions for low volume. We have incorporated many of the proven features from our wire bonding platforms into this new system. It either operates as a single process tool or links to our award winning wire bonders.
Post Encapsulation Products
Ball placement systems have seen a very strong growth as the ball grid array (“BGA”) package types continue to expand. These are the mainstream packages for microprocessors and other high performance chips found in computer systems today. Our early work in this area has allowed us to offer ball placement systems and integrated process solutions to the major providers of such components. As the number of package variants continues to increase along with the leadframe unit density our post encapsulation products (“PEP”) have also evolved. The variation requires systems that are more flexible and faster to convert. The increased density has reduced the need for press speed but increased the emphasis on precision. The decrease in package thickness has dictated a change in the tooling methodology to provide more support throughout the trim, form, and singulation processes. Significant changes have been made in
26
Table of Contents
design to migrate to turret handling and offloading for small packages. These changes allow the incorporation of faster handling across more processes in a smaller footprint than the conventional linear approach. Significant inroads have been made in the incorporation of test heads into these lines so that units emerge ready to ship.
Automated Systems
The IDEALine integrates back-end assembly, packaging, and test handling equipment. Such lines can be fully controlled by computers minimizing operator intervention and providing better quality through more stringent process recipe control. We believe we are the only manufacturer of back-end equipment capable of offering such an extensive integrated line using our own equipment. These lines integrate serial process steps with mechanical and software linkages. Offered in a modular format, customers may integrate some or all of the following processes that we supply: die bonding and inspection, epoxy curing, wire bonding and inspection, encapsulation, post mold curing and trimming and forming. In addition, we work with third party suppliers to offer various additional processes.
Intellectual Property and Trademarks
Intellectual Property
Because of the rapid technological advances in the microelectronics field, we believe that our products will be subject to continuing change and enhancement. Accordingly, we believe that our success will depend upon the technical competence and creative ability of our personnel and the ownership of, and the ability to enforce our intellectual property rights.
We own and license patents that cover some of the key technologies, features and operations of our major front-end products and are registered in the principal countries where semiconductor devices or equipment are manufactured. The acquisitions of NuTool and Genitech in 2004 resulted in an expansion of our patent portfolio in the areas of ECD, ECMD, ECMP, ALD, PEALD and metal organic CVD. The following table shows the number of patents for which we made an initial filing during the indicated year and the number of patents in force by us at the end of the indicated year.
Business | For year | 2001 | 2002 | 2003 | 2004 | 2005 | ||||||
Front-end | Initial patent filings | 49 | 96 | 93 | 112 | 107 | ||||||
| Issued patents at year end | 277 | 367 | 453 | 638 | 768 | |||||||
Back-end | Initial patent filings | 26 | 12 | 31 | 25 | 18 | ||||||
| Issued patents at year end | 8 | 16 | 33 | 77 | 112 | |||||||
We have entered into worldwide, non-exclusive, non-transferable and non-assignable licenses with Applied Materials for patents related to epitaxy and some chemicals used to deposit insulating layers for PECVD. We pay Applied Materials a royalty on sales of equipment that use the patented technology. A number of the licensed patents have already expired. The remaining patents expire at various times through 2010. Upon expiration of the patents, the technology may be used royalty-free by the public, including us.
In 2005, we started to actively license out intellectual property in our ALCVD process technology platform in non-competing markets. Non-exclusive, restricted field of use license agreements were entered into with Veeco Instruments and Oxford Instrument Plasma Technology. In addition to generating revenue, licensing is expected to accelerate market acceptance of our ALCVD technology. Although the licensing revenue is still modest today, we expect this revenue to increase once the market addressed by these licensees comes to further development and maturity. We will continue to seek other licensees for this important process technology platform in complementary markets. In addition, we intend to actively seek licensing opportunities for ASM NuTool’s patent portfolio.
In the back-end market, companies generally compete based on their cumulative expertise in applying well known technologies to improve productivity and cost-efficiency. As a result, we have historically filed fewer patents related to our back-end operations. Due to increasing pressure on new technology development in the back-end market, we expect the patent intensity to increase over the following years. Wherever deemed necessary, ASM Pacific Technology will file for protection of its innovations.
Trademarks
ASM, the ASM International logo, A600 UHV, Advance, Aurora, Carbonspeed, Coppermine, Dragon, ECMP, Eagle, Epsilon, Levitor, LuminaCu, NuTool, Polygon, Pulsar, Rapidfire, and Silcore are our registered trademarks. A400, A412, A4ALD, ALCVD, Atomic Layer CVD, Better Logic, Eagle TRIDENT, ECMD, EmerALD, New Technology, PEALD, RL-CMP, SmartBatch, and Superfill CVD are our trademarks, and The Process of Innovation is our service mark.
27
Table of Contents
AB500B, DRYLUB, EQUIPMANAGER, IDEALine, IDEALsystem, IDEALab, IDEALNet, PGS, SMARTWALK, and SOFTEC are registered trademarks of ASM Pacific Technology Ltd. Eagle60, Harrier, Hummingbird, IDEALmold, Osprey, and TwinEagle are trademarks of ASM Pacific Technology.
Litigation
There has been substantial litigation regarding patent and other intellectual property rights in semiconductor-related industries. At present, we are not involved in any litigation which we believe is likely to have a material adverse effect on our financial position. In the future, additional litigation may be necessary to enforce patents issued to us, to protect trade secrets or know-how owned by us or to defend ASMI against claimed infringement of the rights of others and to determine the scope and validity of the proprietary rights of others. Any such litigation could result in substantial cost and diversion of effort by us, which could have a material adverse effect on our business, financial condition, and operating results. Adverse determinations in such litigation could result in our loss of proprietary rights, subject us to significant liabilities to third parties, require us to seek licenses from third parties or prevent us from manufacturing or selling our products, any of which could have a material adverse effect on our business, financial condition and operating results.
Research and Development
We believe that our future success depends to a large extent upon our ability to develop new products and add improved features to existing products. Accordingly, our global product development policies and local activities are for the most part directed toward expanding and improving present product lines to incorporate technology advances and reduce product cost, while simultaneously developing new products that can penetrate new markets. These activities require the application of physics, chemistry, materials science, electrical engineering, precision mechanical engineering, software engineering, and system engineering.
Our net research and development expenses were€ 79.1 million,€ 84.9 million and€ 100.7 million in 2003, 2004 and 2005, respectively. We expect to continue investing significant resources in research and development in order to enhance our product offerings. Our research and development activities are chiefly conducted in the principal semiconductor markets of the world, which enables us to draw on innovative and technical capabilities on an international basis. Each geographic center provides expertise for specific products and/or technologies. This approach, combined with the interactions between the individual centers, permits efficient allocation of technical resources and customer interaction during development.
BUSINESS SEGMENT | LOCATION | NUMBER OF R & D EMPLOYEES AS OF DECEMBER 31, 2005 | ||
| Almere and Bilthoven, the Netherlands | 68 | |||
| Leuven, Belgium | 20 | |||
| Espoo, Finland | 10 | |||
Front-end | Phoenix, Arizona, United States | 113 | ||
| Fremont, California, United States | 34 | |||
| Daedeoggu Daejon, South Korea | 21 | |||
| Tama, Japan | 79 | |||
| Mainz, Germany | 16 | |||
Back-end | Hong Kong, the People’s Republic of China | 321 | ||
| Singapore | 250 | |||
Total | 932 |
As part of our research and development activities, we are engaged in various formal and informal arrangements with customers and institutes. We currently are engaged in joint development programs with customers for 300mm applications of our Eagle, Polygon, Epsilon, Levitor and Advance A412 products. As part of these efforts, we may sell new products to customers at a significantly reduced margin, and invest significant resources in the joint development and subsequent product qualification. We sometimes also cooperate with other semiconductor capital equipment suppliers in complementary fields, in order to gain knowledge on the performance of our own processes, in cooperation with other processes. In addition to cooperating with customers and other capital equipment suppliers, we also enter into research projects with technical universities, particularly in the Netherlands, Japan, and Finland.
We participate also in publicly funded programs, mainly in Europe, to develop the production technology for semiconductor devices with line widths of 45 and 32nm and below. Among our current cooperative efforts are a number of projects awarded under the Information Society Technologies (IST) sixth framework
28
Table of Contents
program. We participate in several roadmap discussions for the follow-on seventh framework program. We are a partner in several developmental programs in the Eureka initiative by MEDEA+, Micro Electronics Development for European Applications. At the end of 2005, we have completed work for a MEDEA+ program with the Crolles alliance, an R&D alliance between STMicroelectronics, Freescale and Philips, targeting a multitude of process solutions for the 65nm generation. In 2006, we will participate in the 45nm generation follow-up program. We are also involved with our strategic partner, Soitec, in a MEDEA program for the development of strained SOI, a next generation advanced starting material. Mr. Arthur H. del Prado, our President and Chief Executive Officer, is a member of the board of MEDEA+.
As part of these projects, we may sell our equipment to customers who will use grants or research loans to acquire these products or we may receive grants or research loans directly. We have received such loans in the past from the government of the Netherlands, of which€ 3.2 million was outstanding at December 31, 2005, including accrued interest. These loans have to be repaid only from the sales proceeds, during an agreed upon time period, of the products developed with this assistance at repayment rates of up to 100% of the amounts of the loans. In addition, loans of€ 9.9 million were outstanding at December 31, 2005, including accrued interest, for which the agreed upon time periods for repayment have expired at December 31, 2004. For these loans the Company has not received a remission from the government of the Netherlands yet.
In October 2004, we commenced a strategic partnership with the Interuniversity MicroElectronics Center (IMEC) in Belgium for their 300mm, 45nm and 32nm FEOL technology development program. ASMI’s Epsilon, Advance 400 Series, Levitor and Polygon based products are involved in this partnership. In September 2005 we complemented this FEOL partnership with a partnership in BEOL for advanced on-chip interconnect which will utilize ASMI’s Eagle based products. IMEC has attracted eight out of the top ten integrated device manufacturers to participate in their development programs, usually with on-site personnel. This gives ASMI the opportunity to work in these programs together with multiple customers and IMEC on a single site. In addition, we can investigate, both jointly and independently, the integration of individual process steps in process modules and electrically active devices. These partnerships are scheduled to extend to the end of 2008.
Manufacturing and Suppliers
Our manufacturing operations consist of the fabrication and assembly of various critical components, product assembly, quality control and testing.
In the second half of 2004, in order to reduce manufacturing costs in our front-end operations we established a manufacturing facility in Singapore to manufacture certain generic subsystems and subassemblies for our vertical furnaces that we previously outsourced. We also work closely with our suppliers to achieve mutual cost reduction through joint design efforts.
Our back-end operations are vertically integrated to insure quality production of component parts where the quality of subassemblers does not otherwise meet our standards. The manufacturing activities in Hong Kong and Singapore consist primarily of assembling and testing components and subassemblies manufactured at our main manufacturing facilities in the People’s Republic of China and Malaysia.
Marketing and Sales
We market and sell our products with the objective of developing and maintaining an ongoing, highly interactive service and support relationship with our customers. Our marketing strategy includes advertising and participating in various industry trade shows. We provide prospective customers with extensive process and product data, provide opportunities for tests on demonstration equipment and, if required, install evaluation equipment at the customer’s site. Once equipment has been installed, we support our customers with, among other things, extensive training, on-site service, spare parts and process support. All of this is further supported by in-house development to enhance the productive life of existing equipment. We make hardware improvements available in the form of retrofit kits as well as joint development of new applications with our customers. We encourage our engineers to submit technical papers to relevant magazines and to give lectures in symposia.
Because of the significant investment required to purchase our systems and their highly technical nature, the sales process is complex, requiring interaction with several levels of a customer’s organization and extensive technical exchanges, product demonstrations and commercial negotiations. As a result, the full sales cycle can be as long as 12 to 18 months for sales of front-end equipment and three to six months for sales of back-end equipment. Purchase decisions are generally made at a high level within a customer’s organization, and the sales process involves broad participation across our organization, from senior executive management to the engineers who designed the product.
29
Table of Contents
Our sales process usually starts with high-level introduction meetings. Early in the process we also meet with operational personnel to discuss the intended uses of our equipment, technical requirements, solutions, and the overall production process of the customer. Demonstrations and evaluation of test results take time. Once we agree upon the technology elements of the sale, the process continues with price and delivery negotiations and, when completed successfully, with the issuance by the customer of a letter of intent to secure a slot in the manufacturing and assembly planning schedule, followed by a purchase order.
To market our products, we operate demonstration and training centers where customers can examine our equipment in operation and can, if desired, process their wafers or individual dies for further in-house evaluation. Customers are also trained to properly use purchased equipment.
Each of our major product lines has a dedicated product manager, responsible for positioning the product in the market, developing it over time and evaluating its relative performance compared to the competition. Each product manager sets priorities in terms of technical development and sales support.
To execute the sales and service functions, we have established a direct, integrated sales force for front-end products reporting on a geographical basis to the managers in charge of Europe, North America, South Korea, Taiwan, People’s Republic of China, Southeast Asia and Japan. At the end of 2005, our front-end segment had 163 employees fully dedicated to sales and marketing, representing 9.6% of total front-end segment staff. Dedicated support and sales forces are maintained for our various geographic units, enabling us to serve our global customers with an equally global organization. Each of our geographic front-end units is responsible for sales of all of our front-end products in its region. We believe the integration of our sales force promotes cross selling of front-end products.
In addition to the sales activities undertaken at the principal offices of our various manufacturing units, we have sales offices located in Europe (in the United Kingdom, France, Ireland, Italy and Germany), in the United States (in California, Texas and Pennsylvania), and in Japan (in Tokyo and Osaka).
We use independent sales agents in Malaysia and Taiwan for front-end products.
Sales of back-end equipment and materials are provided by our principal offices in Hong Kong and Singapore, through direct sales offices in the People’s Republic of China, Taiwan, the Philippines, Malaysia, Thailand, Japan, Europe and North America, and through sales representatives in South Korea and some parts of the United States. At the end of 2005, there were 227 staff members employed in sales and marketing of back-end products, representing 2.9% of total back-end staff.
30
Table of Contents
Customers
We sell our products predominantly to manufacturers of semiconductor devices and manufacturers of silicon wafers. Our customers include most of the leading semiconductor and wafer manufacturers. Our customers vary from independent semiconductor manufacturers that design, manufacture, and sell their products on the open market, to large electronic systems companies that design and manufacture semiconductor devices for their own use, to semiconductor manufacturers, known as foundries, that manufacture devices on assignment of other companies, including “fabless” companies that design chips but do not have wafer processing factories.
The following table lists a sample of our customers:
| CUSTOMERS | ||||
AMD
Amkor/Anam Group
Altus Technology Inc
AUK Corp
ASE
ASMC
Carsem
CEA Grenoble
Chippac
CYPRESS
EEMS
Elpida Memory Corp
Fairchild Semiconductors
Flextronics
Frauenhofer
Freescale
Fujitsu | Grinm
Hana
Hitachi
HP
IBM
InfineonTechnologies
Intel
LG Group
Lingsen Precision Ind. Ltd.
Maxim
Micron
NEC
NS Electronics Bangkok
Oki Electronics
Philips
Powerchip Semiconductor Promos Technologies | Renesas
Robert Bosch
Samsung
Siliconware Precision Ind.
Soitec
Sony
Shinetsu Handotai
STMicroelectronics
Taiwan IC Packaging Corp.
Texas Instruments
Toshiba
Toyota/Denso
TSMC
UMC
Vishay
Winbond | ||
Our largest customer accounted for approximately 18.5%, 10.9% and 17.2% of our net sales in 2003, 2004 and 2005, respectively. Our ten largest customers accounted for approximately 46.5%, 36.5% and 43.7% of our net sales in 2003, 2004 and 2005, respectively. Historically, a significant percentage of our net sales in each year has been attributable to a limited number of customers; however, the largest customers for our products may vary from year to year depending upon, among other things, a customer’s budget for capital expenditures, timing of new fabrication facilities and new product introductions.
31
Table of Contents
The following table shows the distribution of net sales, by segment and geographic destination of the product:
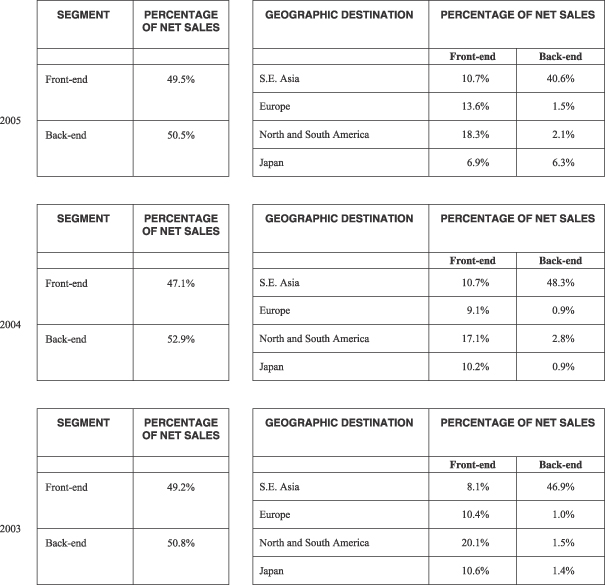
Customer Service
We provide responsive customer technical assistance to support our marketing and sales. Technical assistance is becoming an increasingly important factor in our business as most of our equipment is used in critical phases of semiconductor manufacturing. Field engineers install the systems, perform preventive maintenance and repair services, and are available for assistance in solving customer problems. Our global presence permits us to provide these functions in proximity to our customers. We also maintain local spare part supply centers to facilitate quick support.
We provide maintenance during the product warranty period, usually one to two years, and thereafter perform maintenance pursuant to individual orders issued by the customer. In addition to providing ongoing service, our customer service operations are responsible for customer training programs, spare parts sales and technical publications. In appropriate circumstances, we will send technical personnel to customer locations to support the customer for extended periods of time in order to optimize the use of the equipment for the customer’s specific processes. For our front-end operations, where the availability of field support is particularly important for a sale, there are approximately 557 support staff employees, or 32.9% of total front-end segment staff at December 31, 2005.
32
Table of Contents
Competition
The semiconductor equipment industry is intensely competitive, and is fragmented among companies of varying size, each with a limited number of products serving a particular segment of the semiconductor process. Technical specifications of the individual products are an important competitive factor, especially concerning capabilities for manufacturing of new generations of semiconductor devices. As each product category encompasses a specific blend of different technologies, our competitive position from a technology standpoint may vary within each category. Customers are evaluating manufacturing equipment based on a mixture of technical performance and cost of ownership over the life of the product. Main competitive factors include overall product performance, yield, reliability, maintainability, service, support and price. We believe that we are competitive with respect to each of these factors, and that our products are cost effective.
As the variety and complexity of available machinery increases, some semiconductor manufacturers are attempting to limit their suppliers. In addition, semiconductor manufacturers are located throughout the world, and expect their equipment suppliers to have offices worldwide to meet their supply and service needs. Semiconductor equipment manufacturers with a more limited local presence are finding it increasingly difficult to compete in an increasingly global industry.
Our primary competitors in the front-end market are from the United States and Japan. Our primary competitors in the back-end market are from the United States, Europe and Japan. In each of our product lines, we compete primarily with two or three companies which vary from small to large firms in terms of the size of their net sales and range of products. Our primary competitors in the front-end market include Applied Materials, Novellus Systems, Tokyo Electron, Kokusai, and Aviza. Our primary competitors in the back-end market include Kulicke & Soffa, ESEC, Shinkawa, Apic Yamada, BE Semiconductor Industries, Towa, Shinko and Mitsui.
C. Organizational structure.
The following chart presents the jurisdiction of incorporation of our significant subsidiaries and our percentage of ownership interest in those subsidiaries as of March 10, 2006:
| SUBSIDIARY NAME AND LOCATION | COUNTRY OF INCORPORATION | PERCENTAGE OWNED BY ASM INTERNATIONAL N.V. | ||
ASM Europe B.V. Almere, the Netherlands | The Netherlands | 100% | ||
ASM America, Inc. Phoenix, Arizona, United States | United States | 100% | ||
ASM Japan K.K. Tama, Japan | Japan | 100% | ||
ASM Pacific Technology Ltd. Hong Kong, the People’s Republic of China | Cayman Islands | 53.59% | ||
33
Table of Contents
D. Property, plant and equipment.
To develop and manufacture products to local specifications and to market and service products more effectively in the worldwide semiconductor market, our front-end facilities are located in the Netherlands, the United States, Japan and Singapore and our back-end facilities are located in Hong Kong, the People’s Republic of China, Singapore and Malaysia. Our principal facilities are summarized below:
BUSINESS SEGMENT | LOCATION | PRIMARY USES | APPROXIMATE AGGREGATE SQUARE FOOTAGE | |||
Front-end | Bilthoven, the Netherlands1 | Executive offices of ASMI | 11,000 | |||
| Tama and Nagaoka, Japan | Wafer processing equipment manufacturing, marketing, research and offices | 341,000 | ||||
| Phoenix, Arizona, United States | Wafer processing equipment manufacturing, marketing, research and offices | 177,000 | ||||
| Almere, the Netherlands | Wafer processing equipment manufacturing, marketing, research and offices | 152,000 | ||||
| Fremont, California, United States2 | Wafer processing equipment manufacturing, marketing, research and offices | 34,000 | ||||
| Singapore | Wafer processing equipment manufacturing and offices | 169,000 | ||||
| Daedeoggu Daejon, South Korea | Wafer processing equipment manufacturing, marketing, research and offices | 25,000 | ||||
| Espoo, Finland | Wafer processing equipment research and offices | 5,300 | ||||
Back-end | Hong Kong, People’s Republic of China | Semiconductor assembly and encapsulation equipment manufacturing, marketing, research and offices | 193,000 | |||
| Shenzhen, People’s Republic of China | Semiconductor assembly equipment parts and modules manufacturing, leadframe manufacturing and offices | 1,014,000 | ||||
| Singapore | Semiconductor assembly equipment and etched leadframe manufacturing, marketing, research and offices | 333,000 | ||||
| Johor Bahru, Malaysia | Semiconductor assembly equipment parts and modules manufacturing and offices | 303,000 |
| (1) | There is approximately 170,000 square feet of vacant space being held for sale after the relocation of manufacturing, marketing and research activities to our Almere facility in early 2004. |
| (2) | This facility was discontinued in January 2006. |
Our principal facilities in the Netherlands, the United States, Finland, Hong Kong, the People’s Republic of China, Singapore and Malaysia are subject to leases expiring at various times from 2006 to 2029. Some facilities we own are subject to mortgages. In 2003 we consolidated our front-end manufacturing operations located at our Bilthoven facility with and into our Almere facility, which consolidation was completed in early 2004. Our executive offices remain in Bilthoven. We believe that our facilities are maintained in good operating condition and are adequate for our present level of operations.
Item 4A. Unresolved Staff Comments
Not applicable
Item 5. Operating and Financial Review and Prospects
Management’s Discussion and Analysis of Financial Condition and Results of Operations
Overview
We design, manufacture and sell equipment and systems used to produce semiconductor devices, or integrated circuits. Our production equipment and systems are used by both the front-end and back-end segments of the semiconductor market. Front-end equipment performs various fabrication processes in
34
Table of Contents
which multiple thin films of electrically insulating or conductive material are grown or deposited onto a round slice of silicon, called a wafer. Back-end equipment separates these processed wafers into numerous individual dies, each containing the circuitry of a single semiconductor device, and assembles packages and tests the dies in order to create semiconductor devices. We conduct our front-end business, which accounted for 49.5% of our net sales in 2005, through our principal facilities in the Netherlands, the United States, Japan and Singapore. We conduct our back-end business, which accounted for 50.5% of our net sales in 2005, through our principal facilities in Hong Kong, the People’s Republic of China, Singapore and Malaysia. Our back-end operations are conducted through our 53.59% majority-owned subsidiary, ASM Pacific Technology Ltd. (“ASMPT”).
We sell our products worldwide to the semiconductor industry, which is subject to sudden and extreme cyclical variations in product supply and demand. In the period 2001—2003, the semiconductor industry experienced a severe cyclical downturn characterized by overcapacity and reduced demand for products, lower average selling prices across certain product lines, reduced investments in semiconductor capital equipment and other factors, all of which led to lower sales and earnings for our business, in particular for capacity-driven purchases. In 2003 we have seen a recovery in our industry. This recovery resulted in an improvement in sales, operating results and net earnings in 2004. Sales decreased slightly to€ 726.4 million in 2005, a decrease of 3.7% when compared to€ 754.2 million in 2004.
The backlog of€ 221.9 million as of December 31, 2005 is 18.8% higher than the backlog of€ 186.8 million as of December 31, 2004.
To improve our margins in our front-end segment, we established a manufacturing facility in Singapore to manufacture certain generic subsystems and subassemblies for our vertical furnaces that we previously outsourced. This facility was launched in the third quarter of 2004 and is expected to improve cost-effectiveness, strengthen our gross profit margin and mitigate the impact of foreign currency transaction results. At the end of 2005, most generic subassemblies for 300mm vertical furnaces and the first generic subassemblies for the 200mm vertical furnaces and 200mm Epitaxy systems were manufactured in this facility. We intend to gradually manufacture generic systems and parts for all of our front-end products in our manufacturing base in Singapore.
In our back-end segment we continued to benefit from our cost advantage due to the location of our manufacturing facilities and our high vertical integration allowing us to adjust labor costs quickly in volatile market conditions. We have further streamlined our leadframe manufacturing and subassembly operations cost structure with the construction of a new plant in Johor Bahru, Malaysia, where production commenced the first quarter of 2005.
We believe that our cash on hand of€ 135.0 million at the end of 2005 is adequate to fund our operations, our investments in capital expenditures and to fulfill our existing contractual obligations for the next 12 months.
The transitions in the industry to new processes and materials requires equipment providers to develop sometimes entirely new sets of tools and processes and continue to present us with an opportunity to displace existing suppliers to major semiconductor manufacturers. We believe that we are well positioned and that our firm commitment to research and development, our readiness in new technologies and design-in wins at top-tier customers provide us with a broad basis for substantial long-term market share gains. We have participated fully in the transition to 300mm wafers, as evidenced by the large portion of sales volume of 300mm products.
35
Table of Contents
Sales
Our front-end sales are concentrated in the United States, Europe, Japan and Southeast Asia and our back-end sales are concentrated in Southeast Asia.
The following table shows the geographic distribution of our front-end and back-end sales for the years 2003, 2004 and 2005:
| Year ended December 31, | ||||||||||||||||||
(euro millions) | 2003 | 2004 | 2005 | |||||||||||||||
Front-end: | ||||||||||||||||||
United States | € | 117.2 | 40.9 | % | € | 128.6 | 36.2 | % | € | 133.1 | 37.0 | % | ||||||
Europe | 60.4 | 21.1 | 68.4 | 19.3 | 98.4 | 27.4 | ||||||||||||
Southeast Asia | 47.3 | 16.5 | 80.7 | 22.6 | 77.9 | 21.6 | ||||||||||||
Japan | 61.6 | 21.5 | 77.8 | 21.9 | 50.2 | 14.0 | ||||||||||||
| € | 286.5 | 100.0 | % | € | 355.5 | 100.0 | % | € | 359.6 | 100.0 | % | |||||||
Back-end: | ||||||||||||||||||
People’s Republic of China | € | 47.0 | 15.9 | % | € | 77.3 | 19.4 | % | € | 80.4 | 21.9 | % | ||||||
Taiwan | 58.6 | 19.8 | 88.6 | 22.2 | 77.0 | 21.0 | ||||||||||||
Malaysia | 33.2 | 11.3 | 56.2 | 14.1 | 46.2 | 12.6 | ||||||||||||
South Korea | 39.2 | 13.3 | 23.2 | 5.8 | 33.5 | 9.1 | ||||||||||||
Hong Kong | 19.8 | 6.7 | 29.3 | 7.3 | 26.6 | 7.3 | ||||||||||||
Philippines | 24.2 | 8.2 | 34.9 | 8.8 | 26.5 | 7.2 | ||||||||||||
Thailand | 19.9 | 6.8 | 29.2 | 7.3 | 25.6 | 7.0 | ||||||||||||
Singapore | 25.2 | 8.5 | 20.6 | 5.3 | 15.6 | 4.2 | ||||||||||||
Other | 28.3 | 9.5 | 39.4 | 9.8 | 35.4 | 9.7 | ||||||||||||
| € | 295.4 | 100.0 | % | € | 398.7 | 100.0 | % | € | 366.8 | 100.0 | % | |||||||
The sales cycle from quotation to shipment for our front-end equipment generally takes several months, depending on capacity utilization and the urgency of the order. The acceptance period after installation may be as short as four to five weeks. However, if customers are unfamiliar with our equipment or are receiving new product models, the acceptance period may take as long as several months. The sales cycle is longer for equipment which is installed at the customer’s site for evaluation prior to sale. The typical trial period ranges from six months to one year after installation.
The sales cycle for back-end products is typically shorter than for front-end products. Generally, the majority of our back-end equipment is built in standard configurations. We build back-end products that are approximately 85% complete in anticipation of customer orders. Upon receipt of a customer’s order and specifications, the remaining 15% of the manufacturing is completed. This allows us to complete the assembly of our equipment in a short period of time. We therefore require between two to six weeks for final manufacturing, testing, crating, and shipment of our back-end equipment. Our back-end customers’ acceptance periods generally are shorter than those for front-end equipment. We provide installation, training and technical support to our customers with local staff in all of our major markets.
A substantial portion of our front-end sales is for equipping new or upgraded fabrication plants where device manufacturers are installing complete fabrication equipment. As a result our front-end sales tend to be uneven across customers and financial periods. Sales to our ten largest front-end customers accounted for 65.3%, 57.3% and 67.6% of front-end net sales in 2003, 2004 and 2005, respectively. The composition of our ten largest front-end customers changes from year to year. The largest front-end customer accounted for 37.5%, 23.0% and 32.9% of front-end net sales in 2003, 2004 and 2005, respectively.
Back-end sales per customer tend to be more level over time than front-end sales, because back-end operations can be scaled up in smaller increments at existing facilities. Sales to our ten largest back-end customers accounted for 50.1%, 39.5% and 40.0% of back-end net sales in 2003, 2004 and 2005, respectively. Because our back-end customers’ needs are more level over time, the composition of our ten largest customers is more stable from year to year than in the front-end. Our largest back-end customer accounted for 16.9%, 10.3% and 7.9% of back-end net sales in 2003, 2004 and 2005, respectively.
Research and Development
We continue to invest in research and development at a high level. As part of our research and development activities, we are engaged in various development programs with customers and research institutes that allow us to develop products that meet customer requirements and to obtain access to new technology and expertise. Research and development costs are expensed. We charge to cost of sales the costs relating to prototype and experimental models, which we may subsequently sell to customers.
36
Table of Contents
For a further discussion of research and development expenses see Item 4.B “Business Overview—Research and Development” and “Results of Operations,” below.
Our research and development operations in the Netherlands, Germany and the United States receive research and development grants and credits from various sources. Some of the research and development grants received from governmental sources in the Netherlands are contingently repayable to the extent we recognize sales of products to which the credit is related within the agreed upon time period. We do not recognize a liability on our Consolidated Balance Sheet in respect of these credits until we recognize sales of products to which the credit relates within the agreed upon time period. These repayments vary per product and range from 1.0% to 4.0% of the realized sales of these products. Our contingent repayments accrue at interest rates ranging from 5.0% to 8.0% per annum. The contingent repayments, including accrued interest, were€ 3.3 million at December 31, 2004 and€ 3.2 million at December 31, 2005. These amounts have not been recognized as a liability on our Consolidated Balance Sheet since we have not recognized sales of products to which the credits are related. In addition, with respect to contingent repayments of€ 9.9 million at December 31, 2004 and December 31, 2005, including accrued interest, the agreed upon time periods for repayment have expired at December 31, 2004. For these contingent repayments we have not received a remission from the government of the Netherlands yet. In 2003, 2004 and 2005 we accounted for repayments with respect to these credits of€ 0.1 million,€ 0.3 million and€ 0.2 million respectively.
Acquisitions and Strategic Investments
In October 2001, we entered into a strategic alliance with and made an equity investment of US$ 18.0 million (€ 20.3 million at the then prevailing exchange rate) in NuTool, a privately held semiconductor technology company located in California, United States of America. In April 2003 an additional equity investment was made of US$ 1.4 million (€ 1.2 million at the then prevailing exchange rate), resulting in an equity interest of 15.7% at the end of December 31, 2003. On June 2, 2004, we acquired the remaining 84.3% interest in NuTool in exchange for 1,962,282 of our common shares, replacement employee stock options to acquire 57,720 of our common shares and the possible future issuance of up to 806,376 additional common shares if certain performance targets are satisfied at various times during the period ending December 31, 2006. The total consideration for the 84.3% interest, including expenses, amounted to€ 35.1 million, excluding the value of the 806,376 common shares that may be issued in the future based on certain financial performance targets. As a result of the acquisition, we own 100% of the outstanding capital stock of NuTool. We included NuTool in our Consolidated Financial Statements as from June 2, 2004. Subsequent to the acquisition NuTool’s name was changed to ASM NuTool, Inc.
On August 5, 2004, we acquired 100% of the common shares in Genitech, a privately-held semiconductor equipment supplier based in South Korea, for a combination of cash, 247,638 of our common shares and up to US$ 9.2 million of additional variable cash payments over the next five years depending upon the achievement of certain financial performance targets. The total consideration at the date of the acquisition, including expenses, amounted to€ 7.9 million (excluding the US$ 9.2 million in variable cash payments that may be payable in the future), of which€ 4.6 million was paid in cash and€ 3.3 million was paid in our common shares. We included Genitech in our Consolidated Financial Statements as from August 5, 2004. Genitech develops and manufactures next generation semiconductor processing equipment for thin film deposition and copper metallization. Genitech’s Plasma Enhanced Atomic Layer Deposition (PEALD) provides complementary solutions to our Atomic Layer Deposition (ALD). The use of a plasma allows higher quality films to be deposited at lower temperatures, and is attractive for certain applications. Genitech’s Superfill CVD addresses the need for superconformal copper deposition in very small gaps, which will be critical for the smaller device geometries at 32nm and beyond.
Impairment and Restructuring
We will significantly reduce ASM NuTool to a small operation, focusing on process and intellectual property development with the intention of licensing these technologies in the future. In connection with this restructuring, we have recorded impairment charges for goodwill and property, plant and equipment, the write-down of inventories and other current assets and the recognition of contractual purchase commitments as of December 31, 2005 in the amount of€ 36.8 million, after taxes. Of these charges€ 36.2 million is non cash and€ 0.6 million is accrued for as of December 31, 2005 and expected to be paid in cash in 2006. In the first quarter of 2006 we expect to recognize additional charges for, amongst others, one-time employee termination costs, the termination of operational lease obligations and settlement charges with former NuTool shareholders in the amount of approximately€ 5.5 million. Approximately€ 3.1 million will be paid in our common shares, and the remainder of approximately€ 2.4 million will be paid in cash.
We have also implemented initiatives in our front-end segment in the fourth quarter of 2005 to consolidate platforms used in our Capacitor Product group. We recorded charges of€ 7.0 million related to
37
Table of Contents
the impairment of property, plant and equipment, the write-down of inventory and other current assets and the recognition of contractual purchase commitments as of December 31, 2005. Of these charges€ 6.3 million is non cash and€ 0.7 million is accrued for as of December 31, 2005 and expected to be paid in cash in 2006.
Repayment of Convertible Subordinated Notes
At maturity on November 15, 2005, we repaid the remaining outstanding balance of the US$ 115.0 million 5% convertible subordinated notes. See Note 14 to our Consolidated Financial Statements, which is incorporated herein by reference.
Critical Accounting Policies
Our discussion and analysis of our financial condition and results of operations are based upon our Consolidated Financial Statements, which have been prepared in accordance with accounting principles generally accepted in the United States of America (“US GAAP”). The preparation of these Consolidated Financial Statements requires us to make certain estimates, judgments and assumptions that we believe are reasonable based upon the information available. These estimates and assumptions affect the reported amounts of assets and liabilities at the date of the Consolidated Financial Statements and the reported amounts of revenues and expenses during the periods presented. The significant accounting policies which we believe are the most critical to aid in fully understanding and evaluating our reported financial results include the following:
Revenue Recognition.We follow very specific and detailed guidelines in recognizing revenue following principles of revenue recognition described in United States Securities and Exchange Commission (“SEC”) Staff Topic 13, which includes interpretive guidance issued in Staff Accounting Bulletin No. 101 “Revenue Recognition in Financial Statements,” issued by the staff of the SEC in December 1999, and Staff Accounting Bulletin No. 104 “Revenue Recognition,” issued by the staff of the SEC in December 2003, as well as guidance set forth in Emerging Issues Task Force Issue No. 00-21 “Revenue Arrangements with Multiple Deliverables.” However, certain judgments affect the application of our revenue policy. Our transactions frequently involve the sale of complex equipment, which may include customer-specific criteria, transactions to new customers or transactions with new technology, as well as payment terms, linked to achieving certain milestones. Management must make the determination whether such a transaction is recognized as revenue based on the merits of the contractual agreements with a customer, the experience with a particular customer, the technology and the number of similarly configured products previously delivered.
We recognize revenue from equipment sales upon shipment of our products when it is proven prior to shipment that the equipment has met all of the customer’s criteria and specifications. The installation process is not believed to be essential to the functionality of our products. However, since under most of our sales contracts the timing of payment of a portion of the sales price is coincident with installation, such installation is not considered to be inconsequential or perfunctory. Therefore, at the time of shipment, we defer that portion of the sales price related to the fair value of installation. We believe we have an enforceable claim for the portion of the sales price not related to the fair value of the installation should we not fulfill our installation obligation. If this belief were changed by industry developments in the future, this portion would be deferred in future periods until final acceptance by the customer or until contractual conditions lapse. At December 31, 2005 we have deferred revenues related to the fair value of installations and equipment deliveries in the amount of€ 9.9 million. Revenue results are difficult to predict, and any shortfall in revenue or delay in recognizing revenue could cause our operating results to vary significantly from quarter to quarter and could result in future operating losses.
Valuation of Goodwill.We perform an annual impairment test at December 31 of each year or if events or changes in circumstances indicate that the carrying amount of goodwill exceeds its fair value. Our impairment test and the determination of the fair value is based on a discounted future cash flow approach that uses our estimates of future revenues, driven by assumed market growth and estimated costs as well as appropriate discount rates. These estimates are consistent with the plans and estimated costs we use to manage the underlying business. For the years ended December 31, 2003 and December 31, 2004 we did not record an impairment charge as a result of our tests performed. For the year ended December 31, 2005, we recorded an impairment charge of€ 31.0 million with respect to goodwill resulting from the acquisition of ASM NuTool. The calculation of the fair value involves certain management judgments and was based on our best estimates and projections at the time of our review, and the value may be different if other assumptions are used. In future periods we may be required to record an impairment loss based on the impairment test performed, which may significantly affect our result of operations at that time. At December 31, 2005, we have estimated the remaining fair value of the goodwill of ASM NuTool at€ 12.7 million. A decrease in the estimated discounted cash flows from our investment in ASM NuTool will result in
38
Table of Contents
an equal lower fair value of goodwill and consequently would result in an impairment loss of the same amount. Our analysis as of December 31, 2005 of the carrying amount of goodwill that is not allocated to ASM NuTool indicated that a 10% decrease in the estimated discounted future cash flows would not have resulted in an impairment loss.
Valuation of Long-Lived Assets.Long-lived assets and certain recognized intangible assets (except those not being amortized) are reviewed by us for impairment whenever events or changes in circumstances indicate that the carrying amount of an asset may not be recoverable. In performing the review for recoverability, we estimate the future undiscounted cash flows expected to result from the use of the asset and its eventual disposition. In 2003 we recorded an impairment charge of€ 3.2 million related to the consolidation of manufacturing facilities in the Netherlands and the restructuring of our research and development activities in Finland. In 2004 we did not record an impairment charge. In 2005 we recorded an impairment charge of€ 5.4 million related to the restructuring of ASM NuTool and the consolidation of platforms used in our Capacitor Product group. Our cash flow estimates used include certain management judgments and were based on our best estimates and projections at the time of our review, and may be different if other assumptions are used. In future periods, however, we may be required to record impairment losses, which may significantly affect our results of operations at that time.
Valuation of Inventory.Inventories are valued at the lower of cost or market value. We regularly evaluate the value of our inventory of components and raw materials, work in progress and finished goods, based on a combination of factors including the following: forecasted sales, historical usage, product end of life cycle, estimated current and future market values, service inventory requirements and new product introductions, as well as other factors. Purchasing requirements and alternative uses for the inventory are explored within these processes to mitigate inventory exposure. We record write downs for inventory based on the above factors and take into account worldwide quantities and demand into our analysis. In the year ended December 31, 2005 we have charged€ 6.8 million to cost of sales as a result of our analysis of the value of inventory, including write-downs as a result of the restructuring of ASM NuTool and the consolidation of platforms used in our Capacitor Product group. At December 31, 2005 our valuation allowance for inventory obsolescence and lower market value amounted to€ 27.9 million, which is 12.8% of our total inventory. If circumstances related to our inventories change, our estimate of the values of inventories could materially change. At December 31, 2005, an increase of our overall estimate for obsolescence and lower market value by 10% of our total inventory balance would result in an additional charge to cost of sales of€ 21.7 million.
Accounting for Income Taxes. We currently have significant deferred tax assets, which resulted primarily from operating losses incurred in prior years as well as other temporary differences. We have established a valuation allowance to reflect the likelihood of the realization of deferred tax assets. Based on available evidence, we regularly evaluate whether it is more likely than not that the deferred tax assets will be realized. This evaluation includes our judgment on the future profitability and our ability to generate taxable income, changes in market conditions and other factors. At December 31, 2005, we believe that there is insufficient evidence to substantiate recognition of substantially all net deferred tax assets with respect to net operating loss carry forwards, and we have established a valuation allowance in the amount of€ 115.1 million. Future changes in facts and circumstances, if any, may result in a change of the valuation allowance to these deferred tax asset balances which may significantly influence our results of operations at that time. If our evaluation of the realization of deferred tax assets would indicate that an additional 10% of the net deferred tax assets as of December 31, 2005 is not realizable, this would result in an additional valuation allowance and an income tax expense of€ 0.9 million.
39
Table of Contents
Results of Operations
The following table shows certain Consolidated Statement of Operations data as a percentage of net sales for our front-end and back-end segments for the years 2003, 2004 and 2005:
| Year ended December 31, | |||||||||||||||||||||||||||
| Front-end | Back-end | Total | |||||||||||||||||||||||||
| 2003 | 2004 | 2005 | 2003 | 2004 | 2005 | 2003 | 2004 | 2005 | |||||||||||||||||||
Net sales | 100.0 | % | 100.0 | % | 100.0 | % | 100.0 | % | 100.0 | % | 100.0 | % | 100.0 | % | 100.0 | % | 100.0 | % | |||||||||
Cost of sales | (74.6 | ) | (70.8 | ) | (75.7 | ) | (56.5 | ) | (55.4 | ) | (54.9 | ) | (65.4 | ) | (62.6 | ) | (65.2 | ) | |||||||||
Gross profit | 25.4 | 29.2 | 24.3 | 43.5 | 44.6 | 45.1 | 34.6 | 37.4 | 34.8 | ||||||||||||||||||
Selling, general and administrative expenses | (22.3 | ) | (17.1 | ) | (16.8 | ) | (15.0 | ) | (11.6 | ) | (11.2 | ) | (18.6 | ) | (14.2 | ) | (13.9 | ) | |||||||||
Research and development expenses | (18.9 | ) | (16.2 | ) | (20.8 | ) | (8.4 | ) | (6.8 | ) | (7.0 | ) | (13.6 | ) | (11.3 | ) | (13.9 | ) | |||||||||
Amortization of purchased technology and other intangible assets | — | (0.4 | ) | (0.5 | ) | — | — | — | — | (0.2 | ) | (0.2 | ) | ||||||||||||||
Impairment of goodwill | — | — | (8.6 | ) | — | — | — | — | — | (4.3 | ) | ||||||||||||||||
Earnings (loss) from operations | (15.8 | ) | (4.5 | ) | (22.4 | ) | 20.1 | 26.2 | 26.9 | 2.4 | 11.7 | 2.5 | |||||||||||||||
Loss on equity investments | (0.9 | ) | (0.1 | ) | — | — | — | — | (0.4 | ) | (0.1 | ) | — | ||||||||||||||
Net interest expense | (3.8 | ) | (3.1 | ) | (3.3 | ) | 0.1 | 0.2 | 0.4 | (1.8 | ) | (1.4 | ) | (1.4 | ) | ||||||||||||
Foreign currency transaction losses | (0.6 | ) | — | — | (0.2 | ) | — | (0.1 | ) | (0.4 | ) | — | — | ||||||||||||||
Income tax benefit (expense) | (0.5 | ) | (1.2 | ) | (0.5 | ) | (1.9 | ) | (1.6 | ) | (1.6 | ) | (1.2 | ) | (1.4 | ) | (1.0 | ) | |||||||||
Minority interest | — | — | — | (8.3 | ) | (11.4 | ) | (11.8 | ) | (4.2 | ) | (6.0 | ) | (6.0 | ) | ||||||||||||
Gain on dilution of investment in subsidiary | 0.3 | 0.6 | 0.8 | — | — | — | 0.1 | 0.4 | 0.4 | ||||||||||||||||||
Net earnings (loss) | (21.3 | )% | (8.3 | )% | (25.4 | )% | 9.8 | % | 13.4 | % | 13.8 | % | (5.5 | )% | 3.2 | % | (5.5 | )% | |||||||||
Year Ended December 31, 2005 Compared to Year Ended December 31, 2004
Net Sales.The following table shows our net sales for our front-end and back-end segments and the percentage change between the years 2004 and 2005:
| Year ended December 31, | |||||||
(euro millions) | 2004 | 2005 | % Change | ||||
Front-end | 355.6 | 359.6 | 1.1 | % | |||
Back-end | 398.6 | 366.8 | (8.0 | )% | |||
Total net sales | 754.2 | 726.4 | (3.7 | )% | |||
In 2005, net sales of wafer processing equipment (front-end segment) represented 49.5% of total net sales. Net sales of assembly and packaging equipment and materials (back-end segment) represented 50.5% of total net sales in 2005.
Due to strong sales from our front-end segment in the fourth quarter of 2005, the sales level of 2005 ended 1.1% above the sales level of our front-end segment of 2004.
In the back-end segment sales levels increased quarter over quarter in 2005 after a weak second half of 2004.
In the second half of 2005, net sales in the front-end segment increased by 7.4% compared to the first half of 2005, while net sales in the back-end segment for the second half of 2005 increased 53.7% compared to the first half of 2005.
Consolidated sales levels expressed in euro were slightly negatively impacted by the strengthened euro against the US dollar and US dollar related currencies. The decline in exchange rates impacted our full year sales negatively by 0.3%.
Front-end net sales of spare parts and installation and other services increased 3.3% and 21.7 % respectively, as compared to 2004. These increases were partly offset by a decrease in net sales of equipment by 2%, as compared to 2004. Sales of spare parts and installation and other services represent 26.5% of front-end sales in 2005 and are expected to increase as our installed base further increases.
40
Table of Contents
Back-end net sales of equipment decreased 12.3% as compared to 2004. These sales represent 81.0% of back-end sales in 2005. Revenues from leadframe production increased in 2005 by 16% as compared to 2004.
Gross Profit.The following table shows our gross profit margin for our front-end and back-end segments and the percentage increase or decrease for the year 2004 to 2005:
| Year ended December 31, | |||||||||
| 2004 | 2005 | Percentage point change | |||||||
Front-end | 29.2 | % | 24.3 | % | (4.9 | ) | |||
Back-end | 44.6 | % | 45.1 | % | 0.5 | ||||
Total gross profit | 37.4 | % | 34.8 | % | (2.6 | ) | |||
The gross profit margin of our front-end segment in 2005 decreased as a result of changes in the product mix and impairment and restructuring charges. Increased sales of 300mm systems have negatively impacted the gross profit margin. Impairment and restructuring charges recorded in our front-end segment in 2005 had a negative impact on the gross profit margin of 1.3 percentage points.
ASM Front-End Manufacturing Singapore (“FEMS”) focuses on manufacturing generic subassemblies and components for front-end systems at lower costs. At the end of 2005, most generic subassemblies for 300mm Vertical Furnaces and the first generic subassemblies for the 200mm Vertical Furnaces and 200mm Epitaxy systems were manufactured by FEMS. FEMS is expected to lower our manufacturing costs and mitigate the impact of foreign currency transaction results on our margins.
Although sales from our back-end segment in 2005 decreased as compared to 2004, the gross profit margin increased slightly. One-time charges related to the consolidation of manufacturing activities in Malaysia and additional provisions on slow moving inventories related to new product introductions contributed negatively to the gross profit margin for our back-end segment in 2004.
Selling, General and Administrative Expenses. The following table shows our selling, general and administrative expenses for our front-end and back-end segments and the percentage change for the year 2004 to 2005:
| Year ended December 31, | |||||||
(euro millions) | 2004 | 2005 | % Change | ||||
Front-end | 61.1 | 60.2 | (1.6 | )% | |||
Back-end | 45.9 | 41.0 | (10.6 | )% | |||
Total selling, general and administrative expenses | 107.0 | 101.2 | (5.5 | )% | |||
Selling, general and administrative expenses in our front-end segment continue to be stable as a result of the Company’s focus on cost control.
The decrease in selling, general and administrative expenses in the back-end segment is mainly the result of lower sales volumes.
As a percentage of net sales, selling, general and administrative expenses decreased from 14.2% for the year 2004 to 13.9% in 2005.
Research and Development Expenses.The following table shows our research and development expenses for our front-end and back-end segments and the percentage change for the year 2004 to 2005:
| Year ended December 31, | |||||||
(euro millions) | 2004 | 2005 | % Change | ||||
Front-end | 57.6 | 74.8 | 29.8 | % | |||
Back-end | 27.3 | 25.9 | (5.0 | )% | |||
Total research and development expenses | 84.9 | 100.7 | 18.6 | % | |||
The increase of research and development expenses in our front-end segment is the result of impairment and restructuring charges, increased research and development activities, the inclusion of the
41
Table of Contents
operations of the Company’s subsidiaries ASM NuTool and ASM Genitech, which were acquired in June 2004 and August 2004 respectively, and the full consolidation of the operations of the Company’s subsidiary NanoPhotonics as of January 1, 2005. Impairment and restructuring charges of€ 7.6 million have been recorded in research and development expenses of our front-end segment in 2005.
As a percentage of net sales, research and development expenses increased from 11.3% for the year 2004 to 13.9% in 2005.
Amortization of Purchased Technology and Other Intangible Assets.Amortization of Purchased Technology and Other Intangible Assets was€ 1.7 million in 2005, compared to€ 1.4 million in 2004. The amortization mainly relates to the amortization of purchased technology and other intangible assets from the acquisition of NuTool and Genitech. The amortization expense for 2004 includes€ 0.5 million for purchased in-process research and development, which amount has been expensed in full.
Impairment of Goodwill.Impairment of Goodwill results from the restructuring of ASM NuTool.
Net Interest Expense.Net Interest Expense amounted to€ 10.4 million in 2005 compared to€ 10.3 million in 2004. Net interest expenses for the year 2005 included a€ 0.3 million loss related to the partial early extinguishment of 2005 convertible notes compared to a€ 1.2 million loss related to the partial early extinguishment of 2005 convertible notes in 2004.
Income Tax Expense. We recorded a€ 7.3 million tax expense in 2005, compared to a tax expense of€ 10.6 million in 2004. The decrease in tax expense is primarily the result of decreased earnings. As of December 31, 2005, we had a€ 396.0 million net operating loss carry forward, which we can apply primarily against future earnings reported in the United States and the Netherlands. At December 31, 2005, the related deferred tax asset for the net operating loss carry forward amounted to€ 122.0 million, for which we provided a valuation allowance of€ 115.1 million.
Net Earnings (Loss). We realized a net loss of€ 40.2 million in 2005 compared to a net profit of€ 24.0 million in 2004. Our front-end segment reported a net loss of€ 91.0 million in 2005 compared to a net loss of€ 29.4 million in 2004, primarily due to€ 43.8 million in impairment and restructuring expenses recorded in 2005. Our portion of our back-end segment’s net earnings was€ 50.8 million in 2005 compared to€ 53.4 million in 2004.
Year Ended December 31, 2004 Compared to Year Ended December 31, 2003
Net Sales.The following table shows our net sales for our front-end and back-end segments and the percentage change between the years 2003 and 2004:
| Year ended December 31, | |||||||
(euro millions) | 2003 | 2004 | % Change | ||||
Front-end | 286.5 | 355.6 | 24.1 | % | |||
Back-end | 295.4 | 398.6 | 35.0 | % | |||
Total net sales | 581.9 | 754.2 | 29.6 | % | |||
In 2004, net sales of wafer processing equipment (front-end segment) represented 47.1% of total net sales. Net sales of assembly and packaging equipment and materials (back-end segment) represented 52.9% of total net sales.
In 2004, sales levels in our front-end segment continued to increase quarter over quarter as a result of the strong order intake, which started in the fourth quarter of 2003. In 2004 the order intake in front-end continued to be strong with more orders than sales in the first three quarters of 2004. The order intake in the fourth quarter for the front-end segment weakened somewhat as a result of the reduced demand industry wide. In the back-end segment the strong order intake in the fourth quarter of 2003 and the first half of 2004 resulted in record sales levels in the first half of 2004. The abrupt decrease in demand for the back-end products in the second half of 2004 resulted in a sharp decrease of sales levels. In the second half of 2004, net sales in the front-end segment increased by 10.0% compared to the first half of 2004, while net sales in the back-end segment for the second half of 2004 decreased 32.8% compared to the first half of 2004.
Consolidated sales levels expressed in euro were negatively impacted by the strengthened euro against the U.S. dollar and currencies whose exchange rate is fixed to the U.S. dollar. The decline in exchange rates impacted our sales negatively by 7.1%.
42
Table of Contents
Front-end net sales increased in particular in equipment and spare parts and to a lesser extent in installation and other services. Sales of front-end equipment and spare parts increased by 23% when compared to 2003 which is mainly due to increased volume. These sales represent approximately 90% of front-end sales. Sales of installation and other services increased in 2004 by 32% compared to 2003. These sales represent approximately 8.5% of front-end sales and increase as our installed base grows.
Back-end net sales, in terms of revenue, increased in particular in equipment. These sales increased in 2004 by 38% when compared to 2003 and represent approximately 85% of back-end sales. Revenues from leadframe production increased in 2004 by 20% compared to 2003.
Gross Profit.The following table shows our gross profit margin for our front-end and back-end segments and the percentage increase or decrease for the year 2003 to 2004:
| Year ended December 31, | ||||||||
| 2003 | 2004 | Percentage point change | ||||||
Front-end | 25.4 | % | 29.2 | % | 3.8 | |||
Back-end | 43.5 | % | 44.6 | % | 1.1 | |||
Total gross profit | 34.6 | % | 37.4 | % | 2.8 | |||
The increase in gross profit margin for our front-end segment is the result of the overall growth in sales volumes and the related increased utilization of our manufacturing capacity and to a lesser extent changes in the product mix. Increased sales of 200mm systems have positively impacted the gross profit margin. In addition, we have realized an improvement of the gross profit margin of our installation and other service activities. Service activities are a substantial part of our revenue streams and these revenues increase as our installed base grows.
The increase in gross profit margin for our back-end segment is the result of the higher sales volume of equipment and leadframes in 2004 when compared to 2003. One-time charges related to the consolidation of manufacturing activities in Malaysia and additional provisions on slow moving inventories related to new product introductions contributed negatively to the gross profit margin for our back-end segment in the first half of 2004.
Selling, General and Administrative Expenses. The following table shows our selling, general and administrative expenses for our front-end and back-end segments and the percentage change for the year 2003 to 2004:
| Year ended December 31, | |||||||
(euro millions) | 2003 | 2004 | % Change | ||||
Front-end | 63.9 | 61.1 | (4.4 | )% | |||
Back-end | 44.1 | 45.9 | 4.1 | % | |||
Total selling, general and administrative expenses | 108.0 | 107.0 | (0.9 | )% | |||
The decrease in selling, general and administrative expenses in our front-end segment is mainly due to the strengthened euro against the U.S. dollar and U.S. dollar related currencies, despite higher expenses resulting from growing activities and the need to further invest in the hiring and training of service engineers in our front-end segment. In addition, restructuring charges included in selling, general and administrative expenses for front-end operations amounted to€ 4.6 million in 2003.
The increase in selling, general and administrative expenses in the back-end segment is mainly the result of increased sales volumes, partially offset by positive translation differences from the strong euro against the U.S. dollar and U.S. dollar related currencies.
As a percentage of net sales, selling, general and administrative expenses decreased from 18.6% for the year 2003 to 14.2% in 2004.
43
Table of Contents
Research and Development Expenses.The following table shows our research and development expenses for our front-end and back-end segments and the percentage change for the year 2003 to 2004:
| Year ended December 31, | |||||||
(euro millions) | 2003 | 2004 | % Change | ||||
Front-end | 54.2 | 57.6 | 6.3 | % | |||
Back-end | 24.9 | 27.3 | 9.6 | % | |||
Total research and development expenses | 79.1 | 84.9 | 7.3 | % | |||
Research and development expenses have increased mainly as a result of the inclusion of the operations of our subsidiaries NuTool and Genitech in 2004. In addition, research and development credits received against research and development expenses decreased from€ 3.0 million in 2003 to€ 1.4 million in 2004. The increase in research and development expenses in our front-end segment is partially compensated by the impact of the strengthened euro against the U.S. dollar and U.S. dollar related currencies. Restructuring expenses included in research and development expenses for our front-end segment amounted to€ 1.9 million in 2003. The increase in research and development expenses in our back-end segment is mainly due to the introduction of new products and related increased spending for the procurement of components used in various engineering prototypes in 2004.
As a percentage of net sales, research and development expenses decreased from 13.6% for the year 2003 to 11.3% in 2004.
Amortization of Purchased Technology and Other Intangible Assets. Amortization of purchased technology and other intangible assets was€ 1.4 million in 2004. The amortization mainly relates to the amortization of purchased technology and other intangible assets from the acquisition of NuTool and Genitech. The amortization expense for 2004 includes€ 0.5 million for purchased in-process research and development, which amount has been expensed in full.
Net Interest Expense.The net expense of€ 10.3 million in 2004 was similar to the expense in 2003, although the composition has changed significantly. The translation effect of our convertible notes denominated in U.S. dollars had a positive impact on interest expenses, which was offset by a full year charge of interest expenses on the US$ 90.0 million convertible notes issued in May 2003 and the US$ 150.0 million convertible notes issued in December 2004. Increased interest rates on our cash deposits also contributed positively. Net interest expenses for the fourth quarter of 2004 and the year 2004 also include a€ 1.2 million loss related to the early extinguishment of US$ 16.1 million of the 2005 convertible notes.
Income Tax Expense. We recorded a€ 10.6 million tax expense in 2004, compared to a tax expense of€ 7.1 million in 2003. The increase in tax expense is primarily the result of improved earnings. As of December 31, 2004, we had a€ 334.5 million net operating loss carry forward, which we can apply primarily against future earnings reported in the United States and the Netherlands. At December 31, 2004, the related deferred tax asset for the net operating loss carry forward amounted to€ 102.7 million, for which we provided a valuation allowance of€ 97.9 million.
Net Earnings (Loss). We realized a net profit of€ 24.0 million in 2004 compared to a net loss of€ 32.1 million in 2003. Our front-end segment reported a net loss of€ 29.4 million in 2004 compared to a net loss of€ 61.1 million in 2003, primarily due to increased sales and gross margins in our front-end segment and€ 6.5 million in restructuring expenses recorded in 2003. Our portion of our back-end segment’s net earnings was€ 53.4 million in 2004 compared to€ 29.0 million in 2003, primarily due to increased sales.
Backlog
Our backlog consists of purchase orders or letters of intent for future periods, typically for up to one year. In some markets, such as Japan, it is common practice for letters of intent to be used instead of firm purchase orders. Under specific circumstances, customers can cancel or reschedule deliveries. In addition, purchase orders are subject to price negotiations and changes in quantities of products ordered as a result of changes in customers’ requirements. Depending on the complexity of an order, we generally ship our products within one to six months after receipt of an order. We include in the backlog only orders for which a delivery schedule has been specified and to which the customer has assigned an order number. Rescheduled deliveries are included in backlog if they have a firm delivery date.
44
Table of Contents
The following table shows our level of new orders during the year and our backlog at the end of the year for our front-end and back-end segments and the percentage change for the year 2004 to 2005:
(euro millions) | 2004 | 2005 | % Change | ||||
Front-end: | |||||||
New orders for the year | 391.7 | 354.1 | (9.6 | )% | |||
Backlog at the end of the year | 140.9 | 135.4 | (3.9 | )% | |||
Back-end: | |||||||
New orders for the year | 350.3 | 407.4 | 16.3 | % | |||
Backlog at the end of the year | 45.9 | 86.5 | 88.5 | % | |||
Total | |||||||
New orders for the year | 742.0 | 761.5 | 2.6 | % | |||
Backlog at the end of the year | 186.8 | 221.9 | 18.8 | % |
For the full year 2005, the ratio of new orders divided by net sales (book-to-bill ratio) was 1.05, compared to 0.98 for the full year 2004.
In the second half of 2005 the consolidated order intake improved slightly, showing a book-to-bill ratio of 1.06 compared to 1.03 in the first half of 2005. This improvement was attributable to the front-end segment where the ratio increased from 0.93 in the first half of 2005 to 1.04 in the second half of 2005. Although bookings in our back-end segment increased three consecutive quarters in 2005, the book-to-bill ratio decreased from 1.16 in the first half of 2005 to 1.08 in the second half of 2005.
The backlog of€ 221.9 million as of December 31, 2005 is 18.8% higher than the backlog of€ 186.8 million as of December 31, 2004.
Liquidity and Capital Resources
Our liquidity is affected by many factors, some of which are related to our ongoing operations and others of which are related to the semiconductor and semiconductor equipment industries and to the economies of the countries in which we operate. Although our cash requirements fluctuate based on the timing and extent of these factors, we believe that cash generated by operations, together with the liquidity provided by our existing cash resources and our financing arrangements, will be sufficient to fund working capital, capital expenditures and other ongoing business requirements for at least the next twelve months. The cyclicality of the industry could result in lower customer demand and continued fixed costs and as a result, cash generated by operations may be lower than forecasted. In such a situation we might need to further utilize our short-term credit facilities or investigate additional financing.
At December 31, 2005, our principal sources of liquidity consisted of€ 135.0 million in cash and cash equivalents and€ 75.5 million in undrawn bank lines. Approximately€ 79.7 million of the cash and cash equivalents and€ 37.1 million of the undrawn bank lines are restricted to use in our back-end operations and€ 38.0 million in undrawn bank lines are restricted to use in our front-end operations in Japan.
In December 2004 we strengthened our balance sheet through a private placement of US$ 150.0 million of 4.25% convertible subordinated notes, which are due December 2011. We have used proceeds to repurchase and fully repay the US$ 115.0 million of our 5% convertible subordinated notes which were due November 2005.
During 2005, we generated net cash flows from operating activities of€ 50.7 million, compared to generated net cash flows from operating activities of€ 74.9 million for 2004. The decrease results from decreased net earnings, partially offset by decreased changes in working capital.
Net working capital, consisting of accounts receivable, inventories, other current assets, accounts payable, accrued expenses, advance payments from customers and deferred revenue, increased from€ 189.2 million at December 31, 2004 to€ 234.6 million at December 31, 2005. The increase is primarily the result of increased sales and manufacturing levels. As of December 31, 2005 we have entered into purchase commitments with suppliers for delivery in 2006 in the amount of€ 83.6 million and for delivery in 2007 in the amount of€ 0.7 million.
Our capital expenditures decreased from€ 58.1 million in 2004 to€ 44.6 million in 2005. During 2005 we further expanded our manufacturing facilities in Singapore for our front-end operations and in Malaysia for our back-end operations. We expect capital expenditures to be between€ 40 million and€ 50 million in 2006. Our capital expenditure commitments at December 31, 2005 were€ 3.8 million.
45
Table of Contents
Net cash used in financing activities for 2005 was€ 109.7 million. During that period, we repaid the remaining balance of US$ 94.3 million of our 5% convertible subordinated notes due on November 15, 2005, repaid€ 2.3 million in short term bank facilities, repaid€ 7.8 million of long-term debt, received proceeds of€ 13.3 million in new long-term debt and received€ 0.7 million from the issuance of common shares. In 2005, ASMPT paid€ 31.7 million in dividends to its minority shareholders. In 2004 net cash provided by financing activities was€ 63.2 million. During that period, we repaid€ 0.5 million in short term bank facilities,€ 17.2 million of long-term debt and received proceeds of€ 112.5 million in new long-term and subordinated debt and received€ 2.8 million from the issuance of common shares. In 2004, ASMPT paid€ 34.4 million in dividends to its minority shareholders.
We finance the operations of our front-end segment from operating cash flows, from dividends received from ASMPT, and from borrowings. We support borrowings of our front-end subsidiaries with guarantees.
We rely on dividends from ASMPT for a portion of our cash flow for use in our front-end operations. Cash dividends received from ASMPT during 2003, 2004 and 2005 were€ 24.1 million,€ 40.4 million and€ 37.0 million, respectively.
Our back-end segment, which is conducted through ASMPT, our 53.59%-owned subsidiary, is entirely self-financed by ASMPT. However, the earnings, cash resources and borrowing capacity of ASMPT are not available to our front-end segment due to restrictions imposed by the Hong Kong Stock Exchange, on which the ASMPT common shares are listed.
Although two of the six directors of ASMPT are affiliates of ASM International, ASMPT is under no obligation to declare dividends to shareholders or enter into transactions that are beneficial to us. As a majority shareholder, we can approve the payment of dividends, but cannot compel their payment or size.
The market value of our investment in ASMPT at the end of 2005 was approximately€ 991.9 million, which is higher than the market value at the end of 2004, which was approximately€ 547.3 million.
Contractual Obligations, Contingent Liabilities and Commitments
The following table summarizes our contractual obligations as at December 31, 2005 aggregated by type of contractual obligation:
| December 31, 2005 | ||||||||||
Contractual obligations (in millions of euro) | Total | Less than 1 year | 1-3 years | 3-5 years | More than 5 years | |||||
Notes payable to banks1 | 21.1 | 21.1 | — | — | — | |||||
Long-term debt1, 2, 3 | 32.9 | 7.2 | 21.0 | 4.4 | 0.3 | |||||
Convertible subordinated debt1 | 203.4 | — | — | 76.3 | 127.1 | |||||
Operating leases | 33.9 | 7.6 | 11.2 | 6.5 | 8.6 | |||||
Purchase obligations: | ||||||||||
Purchase commitments to suppliers | 84.3 | 83.6 | 0.7 | — | — | |||||
Capital expenditure commitments | 3.8 | 3.8 | — | — | — | |||||
Total contractual obligations | 379.4 | 123.3 | 32.9 | 87.2 | 136.0 | |||||
| (1) | Excluding interest expense. |
| (2) | Excluding long-term deferred tax liabilities of€ 0.3 million. |
| (3) | Capital lease obligations of€ 2.0 million are included in long-term debt. |
For a further discussion of our contractual obligations for notes payable to banks, long-term debt, convertible subordinated debt and commitments and contingencies see Notes 11, 13, 14, and 17 to our Consolidated Financial Statements, which are incorporated herein by reference.
We outsource a substantial portion of the manufacturing of our front-end operations to certain suppliers. As our products are technologically complex, the leadtimes for purchases from our suppliers can vary and can be as long as nine months. Generally contractual commitments are made for multiple modules or systems in order to reduce our purchase prices per module or system. For the majority of our purchase commitments, we have flexible delivery schedules depending on the market conditions, which allow us, to a certain extent, to delay delivery beyond originally planned delivery schedules.
At December 31, 2005 we had contingent payables of€ 3.2 million, including accrued interest, related to research and development grants received. The grants received are repayable only to the extent we recognize sales of products to which the grants related within an agreed upon time period. In addition, with
46
Table of Contents
respect to contingent repayments of€ 9.9 million at December 31, 2004 and December 31, 2005, including accrued interest, the agreed upon time periods for repayment have expired at December 31, 2004. For these contingent repayments we have not received a remission from the government of the Netherlands yet.
New Accounting Pronouncements
For information regarding new accounting pronouncements, see Note 1 to our Consolidated Financial Statements, which is incorporated herein by reference.
Item 6. Directors, Senior Management and Employees
A. Directors and senior management.
The names of the current members of our Supervisory Board and Management Board and the years of their birth are as follows:
Name | Year of Birth | Position | ||
Paul C. van den Hoek2 | 1939 | Chairman of the Supervisory Board (Expiring 2009) | ||
Eric A. van Amerongen1, 2 | 1953 | Member of the Supervisory Board (Expiring 2006) | ||
Leon P.E.M. van den Boom1 | 1952 | Member of the Supervisory Board (Expiring 2009) | ||
Johan M.R. Danneels2 | 1949 | Member of the Supervisory Board (Expiring 2008) | ||
Jean den Hoed1 | 1937 | Member of the Supervisory Board (Expiring 2007) | ||
Arthur H. del Prado | 1931 | Chairman of the Management Board, President and Chief Executive Officer | ||
Patrick Lam See Pong | 1948 | Member of the Management Board, | ||
Arnold J.M. van der Ven | 1959 | Member of the Management Board and Chief Financial Officer |
| (1) | Member of Audit Committee |
| (2) | Member of Nomination, Selection and Remuneration Committee |
Paul. C. van den Hoek became a member of the Supervisory Board in March 1981 and is currently Chairman of the Supervisory Board. Mr. van den Hoek is a partner in the European law firm of Stibbe, which is our general legal counsel and has been with Stibbe since 1965. Mr. van den Hoek also serves on the board of directors of various European companies. At December 31, 2005, Mr. van den Hoek owned 300,000 of our common shares. Mr. van den Hoek holds a Master’s Degree in law from the University of Amsterdam, the Netherlands.
Eric A. van Amerongen was elected member of the Supervisory Board in May 2002 and is currently Vice-Chairman of the Supervisory Board. Mr. van Amerongen is a member of the Supervisory Board and previously served as Chief Executive Officer of Koninklijke Swets & Zeitlinger. Prior to that, he was active for over 10 years in the position of Group Director of Thomson-CSF (France), Chief Executive Officer of Hollandse Signaal Apparaten B.V. and President and Chief Executive Officer Europe, Middle East and Africa for Lucent Technologies. Mr. van Amerongen also serves on the board of directors of various European companies.
Leon P.E.M. van den Boomwas elected member of the Supervisory Board in May 2005. Mr. van den Boom is a managing partner of Park Corporate Finance B.V., and before that he worked for, among others, Catalyst Advisors B.V., as a senior partner from 2004 to 2005, NIB Capital Bank N.V., as a member of the executive committee from 2000 to 2002 and as the Managing Director at the Van den Boom Groep from 1989 to 2000. Mr. van den Boom serves on the board of directors of various companies. Mr. van den Boom holds a degree in Business Administration from Rijksuniversiteit Groningen, the Netherlands and a degree in Accountancy from the Vrije Universiteit, Amsterdam, the Netherlands.
Johan M.R. Danneelswas elected member of the Supervisory Board in May 2000. Mr. Danneels served most recently as Groups Vice President of STMicroelectronics. Prior to that, he was Director of Industrial Coordination and Chief Executive Officer of Alcatel Microelectronics, where he spent most of his career. Mr. Danneels serves since January 2005 as Chief Executive Officer of Essensium N.V., a spin- off from IMEC. Mr. Danneels holds a Ph.D. from the University of Leuven, Belgium and a MBA degree from Boston University, Brussels, Belgium.
Jean den Hoedbecame a member of the Supervisory Board in June 1999. Mr. den Hoed is a Dutch certified accountant (RA) and received his degree at the Dutch Institute of Certified Accountants (NIvRA).
47
Table of Contents
He joined AKZO Nobel N.V., a global chemical company in 1969, and served in various financial management positions, most recently as Vice President and Chief Financial Officer from 1996 to 1998 when he retired. Mr. den Hoed serves on the board of directors of various European companies.
Arthur H. del Prado, our founder, has served as a member of the Management Board, President and Chief Executive Officer since our formation in 1968. Mr. del Prado is also a founder of ASM Lithography N.V. through a joint venture with Philips Electronics N.V. He serves as a Director of MEDEA+, and previously served for many years as a Director of its predecessor, JESSI. Mr. del Prado also serves on the board of directors of various European companies. Mr. Arthur del Prado is the parent of Chuck D. del Prado.
Patrick Lam See Pong became Vice President of our Asian Operations in March 1981 and a member of the Management Board in June 1995. Mr. Lam has been employed in various capacities with us since 1975. He holds a B.Sc. degree in Electrical Engineering from the University of Manitoba in Canada and a MBA degree from the Chinese University of Hong Kong.
Arnold J.M. van der Ven became Chief Financial Officer and a member of the Management Board in June 2005. Prior to his joining ASM International, Mr. van der Ven was Chief Financial Officer and Member of the Executive Board of Novamedia Holding B.V. from 2001 to 2004 and of Vedior N.V. from 1997 to 2000. He was Chief Financial Officer of Axxicon Group N.V. from 1991 to 1997 and started his career at McKinsey & Company in 1985. Mr. van der Ven holds a MBA degree from the University of Chicago, United States, and a law degree from the University of Leiden, the Netherlands.
B. Compensation.
Compensation of members of the Management Board is determined by the Supervisory Board. Currently, members of our Management Board are Arthur H. del Prado, Patrick Lam See-Pong and Arnold J.M. van der Ven.
The following table sets forth as to all current and former members of our Supervisory Board and Management Board information concerning all remuneration from us (including our subsidiaries) for services in all capacities during the year ended December 31, 2005:
Annual Compensation For The Year Ended December 31, 2005
Name and Principal Position | Annual Compensation1 | Long-Term Compensation | All Other Compensation 1 | |||||||
Base Compensation | Bonus | Other 2 | Number of Securities Underlying Options/ SARS Granted | |||||||
Paul C. van den Hoek | 38 | — | — | — | — | |||||
Eric A. van Amerongen | 26 | — | — | — | — | |||||
Leon P.E.M. van den Boom | 11 | — | — | — | — | |||||
Johan M.R. Danneels | 21 | — | — | — | 38 3 | |||||
Jean den Hoed RA | 22 | — | — | — | — | |||||
Adri Baan | 11 | — | — | — | — | |||||
Arthur H. del Prado | 583 | — | — | — | — | |||||
Patrick Lam See-Pong | 613 | 307 | 74 | 180,000 4 | — | |||||
Arnold J.M. van der Ven5 | 174 | — | 12 | 30,000 | — | |||||
Robert L. de Bakker6 | 85 | — | 18 | — | — | |||||
Haijo D.J. Pietersma7 | 177 | — | 519 8 | — | — | |||||
| (1) | In thousands of euros. |
| (2) | Other annual compensation includes pension expenses. |
| (3) | The remuneration for Mr. J.M.R. Danneels includes the compensation he received for additional business review consultancy. |
| (4) | In his capacity of Director of the Board of ASMPT, Mr. P. Lam See Pong was granted 180,000 shares in the share capital of ASMPT under the Employee Share Incentive Scheme of ASMPT. |
| (5) | For the period May 15, 2005 through December 31, 2005. |
48
Table of Contents
| (6) | For the period January 1, 2005 through May 31, 2005. |
| (7) | For the period January 1, 2005 through May 10, 2005. |
| (8) | The amount includes€498 following an agreement with Mr. Pietersma with respect to his retirement from the Management Board. |
We have granted stock options to certain key employees. For information regarding such options see Note 16 to our Consolidated Financial Statements, which is incorporated herein by reference.
Options to purchase an aggregate of 380,000 common shares are held by members of our Management Board at December 31, 2005. As of February 21, 2006, options to acquire 380,000 common shares were held by members of our Management Board at exercise prices ranging from US$ 15.44 – US$ 19.32 and€ 11.18, with expiration dates from April 4, 2006 to March 29, 2013.
For further information regarding remuneration of members of our Management Board, see our Remuneration Policy, which is posted on our website.
C. Board practices.
Under Netherlands law, Supervisory Board members have the duty to supervise and advise the Management Board members. The Supervisory Board may nominate two candidates for each vacant seat on the Supervisory Board, one of which the Supervisory Board will recommend to the shareholders for appointment. The nomination of the recommended candidate is binding, and therefore the recommended candidate will be elected by the shareholders unless rejected by a qualified majority vote of at least two-thirds of the votes cast, representing more than half of the issued and outstanding shares eligible to vote. If the recommended candidate is rejected, the second nominee will be appointed unless similarly rejected. The Supervisory Board members serve a four year term. The Supervisory Board members may be re-elected twice, but under our Articles of Association a Supervisory Board member must resign upon the close of the Annual General Meeting of Shareholders held in the financial year in which he reaches the age of 72.
The Management Board is entrusted with our management under the supervision of the Supervisory Board and has the general authority to enter into binding agreements with third parties. The Supervisory Board may nominate two candidates for each vacant seat on the Management Board, one of which the Supervisory Board recommends to the shareholders for appointment. The nomination of the recommended candidate is binding, and therefore the recommended candidate will be elected by the shareholders unless rejected by a qualified majority vote of at least two-thirds of the number of shares properly voted at the meeting, provided that the shares voted to reject such binding nomination represent at least half of all issued and outstanding shares eligible to vote. If the recommended candidate is rejected, the second nominee will be appointed unless similarly rejected. The shareholders may at any time suspend and dismiss Management Board and Supervisory Board members by a qualified majority vote of two-thirds of the votes cast, representing more than half of the issued and outstanding shares eligible to vote. A Management Board member can be suspended or dismissed at any time by the Supervisory Board. There is no statutory term of office for Management Board members.
We have not entered into any service contracts providing for benefits upon termination of employment with members of our Supervisory Board and Management Board.
The Audit Committee has a supervisory task with regard to monitoring the integrity of our financial reports and risk management. The Audit Committee consists of Mr. den Hoed (Chairman), Mr. van den Boom and Mr. van Amerongen. The Audit Committee supervises the activities of the Management Board with respect to:
| • | the operation of the internal risk management and control systems, including supervision of the enforcement of the relevant legislation and regulations, and supervising the operation of codes of conduct; |
| • | our release of financial information; |
| • | compliance with recommendations and observations of external auditors; |
| • | our policy on tax planning; |
| • | relations with the external auditor, including, in particular, its independence, remuneration and any non-audit services performed for us; |
| • | our financing; and |
| • | the applications of information and communication technology (ICT). |
49
Table of Contents
The Audit Committee meets periodically to nominate a firm to be appointed as independent auditors to audit the financial statements and to perform services related to the audit, review the scope and results of the audit with the independent auditors, review with management and the independent auditors our annual operating results and consider the adequacy of the internal accounting procedures and the effect of the procedures relating to the auditor’s independence.
The nomination, selection and remuneration committee advises the Supervisory Board on matters relating to the selection and nomination of the members of the Management Board and Supervisory Board. The committee further monitors and evaluates the remuneration policy for the Management Board and some of our other senior executives. This committee consists of Mr. van Amerongen (Chairman), Mr. Danneels and Mr. van den Hoek.
We have entered into indemnity agreements with each of our Supervisory Board and Management Board members in which we agree to hold each of them harmless, to the extent permitted by law, from damage resulting from a failure to perform or a breach of duties by our board members, and to indemnify each of them for serving in any capacity for the benefit of the Company, except in the case of willful misconduct or gross negligence in certain circumstances.
D. Employees.
As of December 31, 2005, we had 9,451 employees, including 932 employees primarily involved in research and development activities, 390 in marketing and sales, 982 in customer service, 467 in finance and administration, and 6,680 in manufacturing.
The following table lists the total number of our employees and the number of our employees in our front-end and back-end business at the dates indicated:
Geographic Location | December 31, 2003 | December 31, 2004 | December 31, 2005 | |||||||||||||||
| Front-end | Back-end | Total | Front-end | Back-end | Total | Front-end | Back-end | Total | ||||||||||
Europe | ||||||||||||||||||
The Netherlands | 330 | 11 | 341 | 313 | 12 | 325 | 327 | 12 | 339 | |||||||||
Other European countries | 121 | 9 | 130 | 157 | 4 | 161 | 166 | 4 | 170 | |||||||||
United States of America | 394 | 9 | 403 | 584 | 9 | 593 | 617 | 12 | 629 | |||||||||
Japan | 254 | 19 | 273 | 266 | 20 | 286 | 279 | 18 | 297 | |||||||||
Southeast Asia | 80 | 6,206 | 6,286 | 172 | 6,717 | 6,889 | 302 | 7,708 | 8,010 | |||||||||
Other | — | — | — | — | 6 | 6 | — | 6 | 6 | |||||||||
Total | 1,179 | 6,254 | 7,433 | 1,492 | 6,768 | 8,260 | 1,691 | 7,760 | 9,451 | |||||||||
Our Netherlands operation, which employs 339 persons, is subject to standardized industry bargaining under Netherlands law, and is required to pay wages and meet conditions established as a result of negotiations between all Netherlands employers in their industry and unions representing employees of those employers. Additionally, management personnel in the Netherlands facilities meet as required by Netherlands law with a works council consisting of elected representatives of the employees to discuss working conditions and personnel policies as well as to explain major corporate decisions and to solicit their advice on major issues.
Many of our employees are highly skilled, and our continued success will depend in part upon our ability to continue to attract and retain these employees, who are in great demand. We believe that our employee relations are good.
E. Share ownership.
Information with respect to shares and options held by members of our Supervisory Board and Management Board is included in Item 7, “Major Shareholders and Related Party Transactions” and Notes 25 and 26 to our Consolidated Financial Statements, which are incorporated herein by reference. With the exception of Arthur del Prado, as of February 21, 2006, none of the members of our Supervisory Board or Management Board owned beneficially more than 1% of our outstanding common shares.
We maintain various stock option plans for the benefit of our employees. For information about our stock option plans, see Note 16 to our Consolidated Financial Statements, which is incorporated herein by reference.
50
Table of Contents
Item 7. Major Shareholders and Related Party Transactions
A. Major shareholders.
The following table sets forth information with respect to the ownership of our common shares as of February 21, 2006 by each beneficial owner of more than 5% of our common shares and by all of the members of our Supervisory Board and Management Board as a group:
| Number of Shares | Percent of Outstanding Shares | |||
Arthur H. del Prado1 | 11,476,878 | 21.7 | ||
FMR Corp.2, 3, 4 | 6,903,843 | 12.9 | ||
Fidelity Management & Research Company2, 4 | 5,796,031 | 10.9 | ||
Hermes European Focus Fund I5 | 2,784,236 | 5.3 | ||
All members of Supervisory Board and Management Board as a group | 12,172,178 | 23.0 | ||
| (1) | Includes 7,692,039 common shares owned by Stichting Administratiekantoor ASM International, a trust controlled by Mr. del Prado. |
| (2) | Derived from Schedule 13G filed February 10, 2006 with the SEC. |
| (3) | Includes the 5,796,031 shares of common stock beneficially owned by Fidelity Management & Research Company, a wholly owned subsidiary of FMR Corp. |
| (4) | FMR Corp. and Fidelity Management & Research Company own convertible subordinated notes due December 2011, which are convertible into an aggregate of 527,377 and 446,685 respectively of our common shares. These numbers are included in the numbers of shares beneficially owned. |
| (5) | Derived from Disclosure of Major Holdings in Listed Companies Act 1996 filed January 30, 2006 with the Netherlands Authority for the Financial Markets. |
A “beneficial owner” of a security includes any person who, directly or indirectly, through any contract, arrangement, understanding, relationship, or otherwise has or shares (i) voting power which includes the power to vote, or to direct the voting of, such security and/or (ii) investment power which includes the power to dispose, or to direct the disposition, of such security. In addition, a person shall be deemed to be the beneficial owner of a security if that person has the right to acquire beneficial ownership of such security, as defined above, within 60 days, including but not limited to any right to acquire: (i) through the exercise of any option, warrant or right; (ii) through the conversion of a security; or (iii) pursuant to the power to revoke, or pursuant to the automatic termination of, a trust, discretionary account, or similar arrangement.
According to SEC filings, Amaranth reduced its ownership of convertible subordinated notes due November 2005, which were convertible into an aggregate of 4,391,035 of our common shares at February 2, 2005, to nil at December 31, 2005 as a result of repayment by us of the notes owned by Amaranth.
According to SEC filings, Capital Group International, Inc. and Capital Research and Management Co. together with SMALL CAP World Fund, Inc. reduced their shareholdings of respectively 2,604,350 and 3,325,600 of our common shares at February 13, 2004 to respectively 1,267,530 and nil at December 31, 2004.
On May 28, 1997, we entered into an agreement with Stichting Continuïteit ASM International, or Stichting, pursuant to which Stichting was granted an option to acquire up to that number of our preferred shares that has a total par value equal to 50% of the par value of our common shares issued and outstanding at the date of the exercise. Stichting is a non-membership organization organized under Netherlands law. The objective of Stichting is, amongst others, to acquire, to own and vote our preferred shares in order to maintain our independence and/or continuity and/or identity in case of a takeover attempt. Toward that objective, Stichting will evaluate, when called for, whether a takeover offer is in our best interests. Euronext Amsterdam requires that a majority of the board members of Stichting be unrelated to us. As of December 31, 2005, the members of the board of Stichting are:
Arthur H. del Prado | President and Chief Executive Officer, ASM International N.V. | |
Paul C. van den Hoek | Chairman of the Supervisory Board, ASM International N.V. | |
Michiel J.C. van Galen | Former Managing Director, Breevast N.V. | |
Rinze Veenenga Kingma | President Archeus Consulting B.V. | |
Laurus Traas | Emeritus Professor, Vrije Universiteit Amsterdam | |
51
Table of Contents
We are unaware of any arrangement which we anticipate will result in a change in control of ASM International. All shares of our common stock entitle the holder to the same voting rights.
Of our 52,920,979 outstanding common Shares at February 21, 2006, 9,064,039 are registered with us in the Netherlands, 28,419,517 shares are registered with a transfer agent in the Netherlands, ABN AMROBANK N.V., and 15,437,423 are registered with a transfer agent in the United States, Citibank, N.A., New York. Our common shares registered with Citibank, N.A., New York are quoted on the NASDAQ Stock Market under the symbol “ASMI.” As of February 21, 2006 there were approximately 224 record holders in the United States. The common shares registered with ABN AMRO Bank, Breda, the Netherlands, are in bearer form and are traded on Euronext Amsterdam under the symbol “ASM.”
B. Related party transactions.
For information regarding related party transactions, see Note 26 to our Consolidated Financial Statements, which is incorporated herein by reference.
A. Consolidated statements and other financial information
Consolidated financial statements
See Item 18. “Financial Statements”.
Legal proceedings
See Item 4.B. “Business Overview” and Note 18 to our Consolidated Financial Statements, which is incorporated herein by reference.
Dividend policy
In its history, the Company has not paid any dividends. In the future the Company will investigate whether paying dividends would be feasible. The Company will take into account realized and expected profitability, solvability and cash flows and distributable retained earnings of the Company. As of December 31, 2005, the Company had no distributable net earnings.
Our 53.59% owned subsidiary, ASMPT, typically pays substantial cash dividends to its shareholders, including us.
B. Significant changes
No significant changes have occurred since the date of our Consolidated Financial Statements.
52
Table of Contents
A. Offer and listing details.
The following table sets forth, for the periods indicated, the high and low closing prices of our common shares as reported on the NASDAQ Stock Market and the high and low closing price as reported on Euronext Amsterdam:
Price Range of Common Shares
| NASDAQ Closing Prices | Euronext Closing Prices | |||||||||||
| High | Low | High | Low | |||||||||
Annual Information | ||||||||||||
2001 | $ | 26.84 | $ | 9.63 | € | 31.45 | € | 10.10 | ||||
2002 | 28.34 | 6.50 | 31.90 | 7.00 | ||||||||
2003 | 20.40 | 9.71 | 17.05 | 8.78 | ||||||||
2004 | 27.61 | 12.80 | 22.10 | 10.47 | ||||||||
2005 | 19.15 | 12.83 | 14.50 | 10.37 | ||||||||
Quarterly Information | ||||||||||||
2004: | ||||||||||||
First Quarter | $ | 27.61 | $ | 20.25 | € | 22.10 | € | 16.62 | ||||
Second Quarter | 23.92 | 18.40 | 19.80 | 15.44 | ||||||||
Third Quarter | 20.15 | 12.80 | 16.78 | 10.47 | ||||||||
Fourth Quarter | 16.74 | 13.04 | 12.47 | 10.56 | ||||||||
2005: | ||||||||||||
First Quarter | $ | 19.15 | $ | 15.09 | € | 14.50 | € | 11.63 | ||||
Second Quarter | 16.59 | 13.34 | 13.67 | 10.37 | ||||||||
Third Quarter | 17.58 | 13.80 | 14.21 | 11.44 | ||||||||
Fourth Quarter | 16.91 | 12.83 | 14.21 | 10.57 | ||||||||
Monthly Information | ||||||||||||
September 2005 | $ | 15.65 | $ | 13.80 | € | 12.59 | € | 11.44 | ||||
October 2005 | 14.44 | 13.17 | 12.10 | 10.81 | ||||||||
November 2005 | 14.39 | 12.83 | 12.24 | 10.64 | ||||||||
December 2005 | 16.91 | 14.26 | 14.21 | 11.99 | ||||||||
January 2006 | 18.05 | 16.48 | 15.02 | 13.46 | ||||||||
February 2006 | 18.91 | 17.82 | 16.02 | 14.91 | ||||||||
March 20061 | 19.25 | 18.20 | 15.96 | 15.36 | ||||||||
| (1) | Through March 10 , 2006 |
B. Plan of distribution.
Not applicable.
C. Markets.
Our common shares are quoted on the NASDAQ Stock Market under the symbol “ASMI” and listed on Euronext Amsterdam under the symbol “ASM.”
D. Selling shareholders.
Not applicable.
E. Dilution.
Not applicable.
F. Expenses of the issue.
Not applicable.
Item 10. Additional Information
A. Share capital.
Not applicable.
B. Memorandum and articles of association.
The information required by Item 10.B. is incorporated by reference to our Form 6-K filed with the United States Securities and Exchange Commission on March 31, 2005.
53
Table of Contents
C. Material contracts.
We entered into an agreement and plan of merger dated February 29, 2004 with NuTool and Walnut Merger Corporation, a Delaware corporation and our wholly-owned subsidiary formed for the purpose of merging with and into NuTool, pursuant to which we acquired the remaining 84.3% interest in NuTool which we did not already own. A description of the consideration we paid for the remaining 84.3% interest in NuTool is summarized in Item 5 “Operation and Financial Review and Prospects—Management’s Discussion and Analysis of Financial Condition and Results of Operations—Acquisitions and Strategic Investments” in this report. A copy of this agreement and plan of merger was filed as Exhibit 99.1 of our report on Form 6-K filed on September 10, 2004.
We entered into an indenture agreement on December 6, 2004 between us and Citibank, N.A., as trustee, under which we issued US$ 150 million aggregate principal amount of 4.25% Convertible Subordinated Notes due 2011. The terms of the notes issued under the indenture are summarized in Item 5 “Operation and Financial Review and Prospects—Management’s Discussion and Analysis of Financial Condition and Results of Operations—Issuance of Convertible Subordinated Notes” in this report. A copy of the indenture was filed as Exhibit 99.1 to our report on Form 6-K filed on December 9, 2004.
D. Exchange controls.
There are no foreign exchange controls or other governmental laws, decrees or regulations in the Netherlands restricting the import or export of capital or affecting the remittance of dividends, interest or other payments to non-resident shareholders. Neither the laws of the Netherlands nor the Articles of Association of ASM International restrict remittances to non-resident shareholders or the right to hold or vote such securities.
E. Taxation.
Summary of Dutch Tax Provisions Applicable to Nonresident Shareholders with a particular focus on U.S. Shareholders
The statements below briefly summarize the current Dutch tax laws, based on the laws as in force at January 1, 2005. The description is limited to the tax implications for shareholders who neither are nor are deemed to be a resident of the Netherlands for purposes of the relevant tax codes. The description does not address special rules that may apply to holders of special classes of shares and should not be interpreted as extending by implication to matters not specifically referred to in this document. As to individual tax consequences, shareholders are advised to consult their own tax advisors.
Withholding Tax
Dividends distributed by us generally are subject to a withholding tax imposed by the Netherlands at a rate of 25%. The expression “dividends distributed” includes, among other things:
| • | distributions in cash or in kind, deemed and constructive distributions and repayments of paid-in capital which is not recognized as such for Dutch dividend withholding tax purposes; |
| • | liquidation proceeds, proceeds of redemption of ordinary shares or consideration for the repurchase of ordinary shares by us, or one of our subsidiaries, to the extent that such consideration exceeds the average paid-in capital which is recognized as such for Dutch dividend withholding tax purposes; |
| • | the par value of ordinary shares issued to a holder of ordinary shares or an increase in the par value of ordinary shares, as the case may be, to the extent that it does not appear that a contribution, which is recognized as such for Dutch dividend withholding tax purposes, has been made or will be made; and |
| • | partial repayments of paid-in capital, which is recognized as such for Dutch dividend withholding tax purposes, if and insofar as there are net profits (zuivere winst) unless the general meeting of our shareholders has resolved in advance to make such repayment and provided that the par value of the ordinary shares concerned has been reduced by an equal amount by way of an amendment to the articles of association. |
If a holder of ordinary shares resides in a country that signed a double taxation convention with the Netherlands and such convention is in effect, such holder of ordinary shares may, depending on the terms of that double taxation convention, be eligible for a full or partial exemption from, reduction or refund of Dutch dividend withholding tax. The Netherlands has concluded such a convention with the United States, among other countries.
Under the Convention between the United States of America and the Kingdom of the Netherlands for the Avoidance of Double Taxation and the Prevention of Fiscal Evasion with Respect to Taxes on Income
54
Table of Contents
(the “US Tax Treaty”) currently in effect, dividends we pay to a holder of our common shares who is not, or is not deemed to be, a resident of the Netherlands for Dutch tax purposes but who is a resident of the United States as defined in the U.S. Tax Treaty are generally eligible for a reduction of the 25% Dutch withholding tax to 15% or, in the case of certain U.S. corporate shareholders owning at least 10% of ASM International voting power, to 5%, provided that such shareholder does not have an enterprise or an interest in an enterprise that is, in whole or in part, carried on through a permanent establishment or permanent representative in the Netherlands to which the dividends are attributable. As per February 1, 2005 a full exemption of Netherlands withholding tax is applicable for a U.S. corporate shareholder owning at least 80% of voting power in the Company for a period of at least twelve months prior to the distribution, provided that this shareholder meets specific tests of the limitation of benefits clause of the U.S. Tax Treaty. The U.S. Tax Treaty provides for complete exemption from tax on dividends received by exempt pension trusts and exempt organizations, as defined therein. Except in the case of exempt organizations, the reduced dividend withholding rate can be applied at the source upon payment of the dividends, provided that the proper forms have been filed prior to the payment. Exempt organizations remain subject to the statutory withholding rate of 25% and are required to file an application for a refund of such withholding.
A holder who is not, or is not deemed to be, a resident of the Netherlands may not claim the benefits of the U.S. Tax Treaty unless:
| • | the holder is a resident of the United States as defined therein; and |
| • | the holder’s entitlement to such benefits is not limited by the provisions of Article 26 (“limitation on benefits”) of the U.S. Tax Treaty. |
Under current Dutch law, we may be permitted under limited circumstances to deduct and retain from the withholding a portion of the amount that otherwise would be required to be remitted to the Dutch Tax Authorities. That portion generally may not exceed 3% of the total dividend distributed by us. If we retain a portion of the amount withheld from the dividends paid, the portion (which is not remitted to the tax authorities) might not be creditable against your domestic income tax or corporate income tax liability. We will endeavor to provide you with information concerning the extent to which we have applied the reduction described above to dividends paid to you and advise you to check the consequences thereof with your local tax advisor.
A refund, reduction, exemption or credit of Dutch dividend withholding tax on the basis of Dutch tax law or on the basis of a tax treaty between the Netherlands and another state, will be granted only if the dividends are paid to the beneficial owner of the dividends. A receiver of a dividend isnot considered to be the beneficial owner of a dividend in an event of “dividend stripping” in which he has paid a consideration related to the receipt of such dividend. In general terms, “dividend stripping” can be described as the situation in which a foreign or domestic person (usually, but not necessarily, the original shareholder) has transferred his shares or his entitlement to the dividend distributions to a party that has a more favorable right to a refund or reduction of Dutch dividend withholding tax than the foreign or domestic person. In these situations, the foreign or domestic person (usually the original shareholder), by transferring his shares or his entitlement to the dividend distributions, avoids Dutch dividend withholding tax while retaining his “beneficial” interest in the shares and the dividend distributions. This regime may also apply to the transfer of shares or the entitlement to dividend distributions as described above, if the avoidance of dividend withholding tax is not the main purpose of the transfer.
Income Tax and Corporate Income Tax on Dividends
A nonresident individual or corporate shareholder will not be subject to Dutch income tax with respect to dividends distributed by us or with respect to capital gains derived from the sale, disposal or deemed disposal of our common shares, provided that:
| • | such holder is neither resident nor deemed to be resident in the Netherlands nor has made an election for the application of the rules of the Dutch 2001 Income Tax Act as they apply to residents of the Netherlands; and |
| • | such holder does not have, and is not deemed to have, an enterprise or an interest in an enterprise which is, in whole or in part, carried on through a permanent establishment, a deemed permanent establishment, or a permanent representative in the Netherlands and to which enterprise or part of an enterprise the shares are attributable, nor does such holder carry out any other activities in the Netherlands that exceed regular asset management; |
| • | such holder does not have a profit share in, or any other entitlement to the assets or income of an enterprise, other than by way of securities, which enterprise is effectively managed in the Netherlands and to which enterprise the shares are attributable; |
| • | such holder does not carry out and has not carried out employment activities with which the holding of the shares is connected directly or indirectly; and |
55
Table of Contents
| • | such holder, individuals relating to such holder and some of their relations by blood or marriage in the direct line (including foster children) do not have a substantial interest or deemed substantial interest in us, or, if such holder has a substantial interest or a deemed substantial interest in us, it forms part of the assets of an enterprise. |
Generally, a nonresident holder will have a substantial interest if he, his partner, certain other relatives (including foster children) or certain persons sharing his household, alone or together, directly or indirectly:
| • | hold shares representing 5% or more of our total issued and outstanding capital (or the issued and outstanding capital of any class of our shares); |
| • | hold or have rights to acquire shares (including the right to convert notes or stock options into shares), whether or not already issued, that at any time (and from time to time) represent 5% or more of our total issued and outstanding capital (or the issued and outstanding capital of any class of our shares); or |
| • | hold or own certain profit-participating rights that relate to 5% or more of our annual profit and/or to 5% or more of our liquidation proceeds. |
The same criteria apply to a nonresident entity, save for the extension to partners, certain other relatives, and certain persons sharing the holder’s household.
Gift and Inheritance Tax
In principle, liability for Dutch gift tax or inheritance tax arises in respect of any gifts of common shares by or inheritance of common shares from any person who resides in the Netherlands at the time of the gift or death.
A gift or inheritance of common shares from a nonresident shareholder will not be subject to Dutch gift and inheritance tax, provided that:
| • | the nonresident shareholder does not have an enterprise or an interest in an enterprise that is, in whole or in part, carried on through a permanent establishment or a permanent representative in the Netherlands to which or to whom the common shares are attributable; |
| • | the nonresident shareholder is not entitled to a share in the profits of an enterprise that is effectively managed in the Netherlands other than by way of securities or through an employment contract, the common shares being attributable to that enterprise; and |
| • | the nonresident shareholder makes a gift of shares and dies within 180 days after the date of the gift, while being resident or deemed to be resident in the Netherlands at the time of his death. |
For the purposes of Dutch gift and inheritance tax, a Dutch national is deemed to be a resident of the Netherlands if he resided in that country at any time during a period of ten years preceding the date of the gift or death, as the case may be. In addition, for the purposes of Dutch gift tax, a person not possessing Dutch nationality is also deemed to be a Dutch resident, irrespective of his nationality, if he was a Dutch resident at any time during a period of twelve months preceding the time at which the gift was made. The Netherlands has concluded a treaty with the United States, based on which double taxation on inheritances may be avoided if the inheritance is subject to Netherlands and/or U.S. inheritance tax and the deceased was a resident of either the Netherlands or the United States.
Summary of U.S. Federal Tax Provisions Applicable to United States Security Holders
The following is a general description of the material U.S. federal income tax consequences of the ownership and disposition of our common shares. This summary only applies to “U.S. Holders” (as defined below) that hold their shares as capital assets. This discussion does not purport to deal with all aspects of U.S. federal income taxation that may be relevant to holders of shares in view of their particular circumstances (for example, persons subject to the alternative minimum tax provisions of the Internal Revenue Code of 1986 (“Internal Revenue Code”)), and does not deal with holders subject to special rules, such as, but not limited to dealers in securities or foreign currencies, traders in securities that elect to use a mark-to-market method of accounting, certain financial institutions, tax-exempt organizations, tax-qualified employer plans and other tax-qualified accounts, insurance companies, persons that actually or constructively own 10% or more of our voting stock, persons holding common shares as part of a straddle, hedging, conversion or constructive sale transaction or holders of common shares whose “functional currency” is not the U.S. dollar.
This discussion is based on the Internal Revenue Code, as amended to the date hereof, final, temporary and proposed U.S. Treasury Department regulations promulgated thereunder, and administrative and judicial interpretations thereof, changes to any of which subsequent to the date of this summary, possibly with retroactive effect may affect the tax consequences described in this summary. We will not
56
Table of Contents
update this summary for any law changes after the date of this annual report. In addition, there can be no assurance that the Internal Revenue Service will not challenge one or more of the tax consequences described in this summary, and we have not obtained, nor do we intend to obtain, a ruling from the Internal Revenue Service or an opinion of counsel with respect to the U.S. federal income tax consequences of acquiring or holding shares. Prospective holders of shares should consult their own tax advisors as to the application of the U.S. federal income tax laws to their particular situation as well as any tax consequences that may arise under the U.S. federal estate or gift tax and any state, local and foreign tax laws from the ownership and disposition of our shares.
The following discussion is a summary of the tax rules applicable to U.S. Holders of shares and does not consider any U.S. federal income tax consequences to non-U.S. Holders. As used in this summary, “U.S. Holder” means a beneficial owner of shares that is (i) an individual who is a citizen or resident of the United States (as defined for U.S. federal income tax purposes), (ii) a corporation (or any other entity taxable as a corporation for U.S. federal income tax purposes) created or organized in or under the laws of the United States or any of its political subdivision, (iii) an estate the income of which is subject to U.S. federal income taxation regardless of its source, (iv) a trust if a court within the United States is able to exercise primary supervision over the administration of the trust and one or more U.S. persons have the authority to control all substantial decisions of the trust, or a trust if a valid election is in place to treat the trust as a U.S. person, or (v) any other person or entity that would be subject to U.S. federal income tax on a net income basis in respect of the shares. A “non-U.S. Holder” is a beneficial owner of shares that is not a U.S. Holder as so defined herein.
Taxation of Dispositions
A U.S. Holder will recognize gain or loss for U.S. federal income tax purposes upon the sale or other disposition of shares in an amount equal to the difference between the amount realized and the U.S. Holder’s adjusted tax basis in the shares. For these purposes, a U.S. Holder’s adjusted tax basis in the shares generally will equal the U.S. dollar cost of the shares to the U.S. Holder. Subject to the passive foreign investment company rules described below, gain or loss realized by a U.S. Holder on a sale or other disposition generally will be treated as capital gain or loss, and will be long-term capital gain or loss if the shares were held for more than one year. Any such gain generally will be treated as U.S. source income for U.S. foreign tax credit purposes. Net long-term capital gain recognized by a U.S. Holder who is an individual generally is subject to reduced rates of taxation. The deduction of capital losses is subject to certain limitations. Prospective investors should consult their own tax advisors in this regard.
If we repurchase shares, the repurchase generally will be treated as a sale or exchange of the shares subject to the rules discussed above. However, under certain circumstances as provided in Section 302 of the Internal Revenue Code, the repurchase may be treated fully or partially as a dividend taxable as described below under “Taxation of Distributions.” U.S. Holders should consult their own tax advisors concerning the U.S. federal income tax consequences of our repurchase of their shares.
Taxation of Distributions
Subject to the anti-deferral tax rules described below, the gross amount of any distribution (actually or constructively) paid (before reduction for Netherlands withholding taxes) with respect to shares, will be included in the gross income of a U.S. Holder as foreign source dividend income to the extent the distributions are paid out of our current or accumulated earnings and profits, as determined under U.S. federal income tax principles. The amount of any distribution of property other than cash will be the fair market value of such property on the date of distribution. To the extent that the amount of any distribution exceeds our current and accumulated earnings and profits for a taxable year, the distribution will first be treated as a tax-free return of capital to the extent of the U.S. Holder’s adjusted tax basis in the shares (thereby increasing the amount of gain and decreasing the amount of loss to be recognized on the subsequent disposition of the shares), and to the extent that such distribution exceeds the U.S. Holder’s adjusted tax basis in the shares such excess will be taxed as capital gain. We do not maintain calculations of our earnings and profits under U.S. federal income tax principles, and therefore it may not be possible to determine that a distribution should not be treated as a dividend.
Distributions treated as dividends generally will not be eligible for the dividends received deduction allowed to corporations under the Internal Revenue Code. The availability of this deduction is subject to several complex limitations which are beyond the scope of this summary.
If a U.S. Holder receives a dividend in euros, the amount of the dividend for U.S. federal income tax purposes will be the U.S. dollar value of the dividend, determined at the spot rate in effect on the date of such payment, regardless of whether the payment is later converted into U.S. dollars. In the case of such
57
Table of Contents
later conversion, the U.S. Holder may recognize U.S. source ordinary income or loss as a result of currency fluctuations between the date on which the dividend is paid and the date the dividend amount is converted to U.S. dollars.
Recently enacted U.S. tax legislation reduced to 15% the maximum tax rate for certain dividends received by individuals through taxable years beginning on or before December 31, 2008, so long as certain holding period requirements are met. Dividends received from “qualified foreign corporations” generally qualify for the reduced rate. A non-U.S. corporation (other than a passive foreign investment company) generally will be considered to be a “qualified foreign corporation” if (I) the shares of the non-U.S. corporation are readily tradable on an established securities market in the United States or (II) the non-U.S. corporation is eligible with respect to substantially all of its income for the benefits of a comprehensive income tax treaty with the United States which contains an exchange of information program. We believe that we are, and will continue to be, a “qualified foreign corporation.” Individual U.S. Holders should consult their tax advisors regarding the impact of distributions paid with respect to their shares of our common stock in light of their particular situations.
Foreign Tax Credit
Dividends distributed by us generally are subject to a withholding tax imposed by the Netherlands at a rate of 25% (see “Summary of Dutch Tax Provisions Applicable to Nonresident Shareholders with a particular focus on U.S. Shareholders—Withholding Tax”). Subject to certain conditions and limitations set forth in Sections 901 and 904 of the Internal Revenue Code, including certain holding period requirements, foreign tax withheld or paid with respect to dividends on common shares generally will be eligible for credit against a U.S. Holder’s U.S. federal income tax liability. Alternatively, a U.S. Holder may claim a deduction for the amount of withheld foreign taxes, but only for a year for which the U.S. Holder elects to do so with respect to all foreign income taxes. Under current Dutch law, we may be permitted, under limited circumstances, to retain a portion of Netherlands taxes we withhold from dividends paid to our shareholders, rather than pay that portion of the withheld taxes to the taxing authorities in the Netherlands (see “Summary of Dutch Tax Provisions Applicable to Nonresident Shareholders with a particular focus on U.S. Shareholders—Withholding Tax”). This amount generally may not exceed 3% of the total dividend distributed by us. If we retain a portion of the Netherlands withholding taxes, the retained amount in all likelihood will not qualify as a creditable tax for U.S. federal income tax purposes. We will endeavor to provide U.S. Holders with information concerning the extent to which we retain any Netherlands taxes on dividends paid to U.S. Holders.
The overall limitation on foreign taxes eligible for credit is calculated separately with respect to specific classes of income. For this purpose, dividends distributed by us generally will be “passive income,” or, in the case of certain U.S. Holders, “financial services income.” To the extent such dividends on common shares are treated as capital gains, such gain would be U.S. source. Accordingly, a U.S. Holder would not be able to use the foreign tax credit arising from any Netherlands withholding taxes imposed on such distribution unless such credit can be applied (subject to applicable limitations) against U.S. tax due on other foreign source income in the appropriate category for foreign tax credit purposes.
The rules relating to the determination of the U.S. foreign tax credit are complex. U.S. Holders should consult their own tax advisors with respect to the availability of a foreign tax credit or deduction for foreign, including Netherlands, taxes withheld.
Anti-Deferral Tax Rules
The Internal Revenue Code contains various provisions that impose current U.S. federal income tax on certain foreign corporations or their U.S. shareholders if such corporations derive certain types of passive income and fail to make adequate distribution of profits to their U.S. shareholders. These provisions include the passive foreign investment company and controlled foreign corporation rules. While we do not believe that any of these rules should apply to us, we are not certain that we can avoid these tax rules because we cannot predict with any degree of certainty the amount and character of our future income or the amount of our shares any particular U.S. Holder will own. Accordingly, we will only briefly summarize those provisions and then only the rules that we believe would have the greatest likelihood of applying to us in the future.
Passive Foreign Investment Company. As a foreign corporation with U.S. Holders, we could potentially be treated as a “passive foreign investment company” (“PFIC”) as defined in the Internal Revenue Code. The PFIC provisions of the Internal Revenue Code can have significant tax effects on U.S. Holders. In general, a foreign corporation will be a PFIC in a particular tax year and for all succeeding tax years if:
| • | 75% or more of its gross income (including the foreign corporation’s pro rata share of the gross income of any U.S. or foreign company in which the corporation owns or is considered to own 25% or more of the shares by value) in a taxable year is passive income (which generally includes interest, dividend and certain rents and royalties); or |
58
Table of Contents
| • | at least 50% of the average value of the corporation’s gross assets in a taxable year (average determined as of the end of each quarter of the corporation’s taxable year and ordinarily determined based on gross fair market value, including the proportionate share of the assets of any U.S. or foreign company in which the corporation owns or is considered to own 25% or more of the shares by value) produce, or are held for the production of, passive income. |
If we were a PFIC for a taxable year during which a U.S. Holder owned our shares, then a U.S. Holder would likely incur increased tax liabilities (possibly including an interest charge) upon the sale or other disposition of our shares of our common stock or upon receipt of “excess distributions.” In other words, gain recognized by a U.S. Holder on a sale or other disposition of our shares would be allocated ratably over the U.S. Holder’s holding period for the shares. The amounts allocated to the taxable year of the sale or other disposition and to any year before we became a PFIC would be taxed as ordinary income. The amount allocated to each other taxable year would be subject to tax at the highest rate in effect for individuals or corporations, as appropriate, and an interest charge would be imposed on the amount allocated to that taxable year. Further, any distribution in excess of 125 percent of the average of the annual distributions on shares received by the U.S. Holder during the preceding three years or the U.S. Holder’s holding period, whichever is shorter, would be subject to taxation as described above.
Certain elections may be available (including a qualified electing fund election and a mark to market election) to U.S. Holders that may mitigate the adverse consequences resulting from PFIC status. In addition, if we were a PFIC in a taxable year in which we pay a dividend or the prior year, the 15% dividend rate discussed above with respect to dividends paid to certain U.S. Holders would not apply.
We believe that we are not a PFIC, and we do not expect to become a PFIC. However, we cannot assure that we will not qualify as a PFIC in the future. The PFIC rules are very complex and U.S. Holders should consult their own tax advisors on this issue.
Controlled Foreign Corporation Rules. If more than 50% of the voting power or total value of all classes of our shares is owned, directly or indirectly, by U.S. Holders, each of which owns 10% or more of the total combined voting power of all classes of our shares, we could be treated as a controlled foreign corporation (“CFC”) under Subpart F of the Internal Revenue Code. This classification would result in many complex consequences, including the required inclusion into income by such 10% or greater shareholders of their pro rata shares of our “Subpart F Income,” as defined in the Internal Revenue Code. In addition, under Section 1248 of the Internal Revenue Code, gain from the sale or exchange of shares by any U.S. Holder who is or was a 10% or greater shareholder at any time during the five-year period ending with the sale or exchange will be dividend income to the extent of our earnings and profits attributable to the shares sold or exchanged and accumulated during the periods that we were a CFC. Under certain circumstances, a U.S. Holder that directly owns 10% or more of our voting shares and is a corporation may be entitled to an indirect foreign tax credit for amounts characterized as dividends under Section 1248 of the Internal Revenue Code. We believe that we are not a CFC and we will not become a CFC, however, we can not assure you that we will not become a CFC in the future.
United States Backup Withholding Tax and Information Reporting
Under certain circumstances, a U.S. Holder may be subject to information reporting and backup withholding with respect to certain payments made in respect of the shares and the proceeds received on the disposition of the shares paid within the U.S. (and in certain cases, outside the U.S.). Such amounts may be subject to a 28% U.S. backup withholding tax unless the U.S. Holder otherwise establishes an exemption. For example, backup withholding will not apply to a U.S. Holder who (1) is a corporation or comes within certain other exempt categories and, when required, demonstrates that fact, or (2) furnishes a correct taxpayer identification number and makes certain other required certifications as provided by the backup withholding rules.
Backup withholding is not an additional tax. The amount of any backup withholding from a payment to a U.S. Holder will be allowed as a credit against the U.S. Holder’s U.S. federal income tax liability and may entitle a U.S. Holder to a refund, provided that the required information is furnished to the Internal Revenue Service.
* * *
The discussion set forth above is included for general information only and may not be applicable depending upon a holder’s particular situation. Holders should consult their tax advisors with respect to the tax consequences to them of the purchase, ownership and disposition of shares including the tax consequences under state, local and other tax laws and the possible effects of changes in U.S. federal and other tax laws.
59
Table of Contents
F. Dividends and paying agents.
Not Applicable.
G. Statement by experts.
Not Applicable.
H. Documents on display.
Whenever a reference is made in this Form 20-F to any contract, agreement or other document, the reference may not be complete and you should refer to the copy of that contract, agreement or other document filed as an exhibit to one of our previous SEC filings.
We file annual and special reports and other information with the SEC. You may read and copy any document we file with the SEC at the SEC’s public reference room at 100 F Street N.E., Room 1580, Washington, D.C. 20549. Please call the SEC at 1-800-SEC-0330 for further information about the public reference room. The SEC maintains an Internet site at http://www.sec.gov that contains reports, registration statements and other information regarding issuers that file electronically with the SEC, including ASM International.
I. Subsidiary information.
Not Applicable.
Variation in Practices Required by NASDAQ Marketplace Rules.
Because we are a Netherlands public limited liability company, with principal executive offices outside of the U.S., some of our corporate practices vary from those required by the NASDAQ Marketplace Rules, as follows:
(i) Marketplace Rule 4350(f): Quorum
Pursuant to Dutch corporate law (section 2:120 sub 2 Dutch Civil Code) the validity of a resolution by the general meeting of shareholders does not depend on the proportion of the capital or shareholders represented at the meeting (i.e. quorum), unless the law or articles of association of a company otherwise provide. It is the generally accepted business practice for Dutch companies not to provide for a quorum requirement in their articles, and there is no contrary requirement in the Dutch securities laws or under the rules of Euronext Amsterdam. Accordingly, our Articles of Association do not provide for a quorum, and provide that a resolution of the general or any extraordinary meeting of shareholders will be adopted upon the favorable vote of a majority of the votes cast at the meeting. To this extent, our practice varies from the requirement of Marketplace Rule 4350(f), which requires an issuer to provide in its bylaws for a quorum, and that such quorum may not be less that one-third of the outstanding voting stock.
(ii) Marketplace Rule 4350(g): Proxies
The solicitation of proxies and the distribution of proxy statements for meetings of shareholders are not required under European law, the Dutch Civil Code, the Dutch securities laws or by the rules of Euronext Amsterdam. Currently, it is the generally accepted business practice for Dutch companies not to solicit proxies or distribute proxy statements in respect of European shareholders. In part this is because a substantial portion of shares held by these shareholders are held in bearer form. This is the case for our common shares traded on Euronext Amsterdam and, accordingly, it is impractical to solicit proxies as to these shares. As a result, our practice in respect of the holders of shares other than our common shares listed on the NASDAQ Stock Market varies from that required by Marketplace Rule 4350(g), which provides that issuers shall solicit proxies and provide proxy statements for all meetings of shareholders.
As to our common shares listed on the NASDAQ Stock Market, which we refer to as New York registry shares, we prepare a proxy statement and solicit proxies from the holders of such shares since there are procedures in place under the Securities Exchange Act of 1934, as amended, for soliciting proxies from beneficial owners. Our practice in this regard, however, differs from the typical practice of U.S. corporate issuers in that the advance record date for determining the holders of record entitled to attend and vote at our shareholder meetings may not be more than seven days prior to the meeting under applicable Dutch corporate law (section 2:119 sub 2 of Dutch Civil Code) As an administrative necessity, we establish a mailing record date in advance of each meeting of shareholders for purposes of determining the shareholders to which the proxy statement and form of proxy will be sent. However, only shareholders of record on the specified record date are entitled to attend and vote, directly or by proxy, at the meeting.
60
Table of Contents
(iii) Marketplace Rule 4350(b)(1): Distribution of Annual Reports
The distribution of annual reports to shareholders is not required under Dutch corporate law, Dutch securities laws, or by Euronext Amsterdam. Furthermore, it is the generally accepted business practice for Dutch companies not to distribute annual reports. In part, this is because the Dutch system of bearer shares has made it impractical to keep a current list of holders of the bearer shares in order to distribute the annual reports.
Similar to our approach with respect to the solicitation of proxies and distribution of proxy statements, we deliver our annual report to each shareholder that holds our New York registry shares along with our proxy statement. We do not, however, distribute our annual report to holders of our bearer shares, which are traded on Euronext Amsterdam. In accordance with our Articles of Association and Dutch corporate law, we make our annual report available at our corporate head office in the Netherlands (and at the offices of our Netherlands listing agent as stated in the convening notice for the meeting) as from the day of convocation of the annual general meeting of shareholders. In addition, we post a copy of our annual report on our website (www.asm.com) prior to the annual general meeting of shareholders.
Our practice in respect of the distribution of our annual report to holders of shares other than New York registry shares varies from that required by Marketplace Rule 4350(b)(1), which provides that issuers must distribute copies of their annual report to all shareholders a reasonable amount of time prior to the annual general meeting of shareholders.
Item 11. Quantitative and Qualitative Disclosures about Market Risk
We are exposed to market risk from changes in interest rates and foreign currency exchange rates, most notably fluctuations of the United States dollar, the Hong Kong dollar and the Japanese yen against the euro. We report our operating results and financial position in euros, while foreign affiliates report their operating results and financial position in their respective functional currencies. To the extent that foreign currency fluctuations affect the value of our investments in our foreign affiliates, they are not hedged. The cumulative effect of these fluctuations is separately reported in Consolidated Shareholders’ Equity. For the year ended December 31, 2004, we recorded an unfavorable movement of€ 14.2 million. For the year ended December 31, 2005, we recorded a favorable movement of€ 23.6 million.
Foreign exchange risk management
Our operations are exposed to foreign exchange risk arising from cash flows and financial instruments that are denominated in currencies other than the functional currency of ASM International or the respective subsidiary conducting the business. The purpose of our foreign currency management is to manage the effect of exchange rate fluctuations on certain foreign currency denominated revenues, costs and eventual cash flows and on foreign currency denominated assets and liabilities.
The terms of currency instruments used for hedging purposes are consistent with the timing of the transactions being hedged. We do not use derivative financial instruments for trading or speculative purposes. We use derivative financial instruments, such as forward exchange contracts, to hedge certain forecasted foreign currency denominated transactions expected to occur within the next 12 months. As a policy we only hedge anticipated foreign currency sales and purchase transactions for which we have a firm commitment to a customer or supplier. All hedges related to anticipated transactions are designated and documented at the inception of the hedge as cash flow hedges, and are evaluated for effectiveness quarterly. The effective portion of the gain or loss on these hedges is reported as a component of other comprehensive income in Shareholders’ Equity, and is reclassified into earnings when the hedged transaction affects earnings. An amount of approximately€ 0.4 million included in other comprehensive income at December 31, 2005 will be reclassified to earnings within 12 months upon completion of the underlying transaction. If the underlying transaction being hedged fails to occur, or if a portion of any derivative is ineffective, the gain or loss is immediately recognized in earnings under foreign currency transaction gains (losses) on the Statement of Operations.
Furthermore, we continue to manage the currency exposure of certain receivables and payables using derivative instruments, such as forward exchange contracts and currency swaps, and non-derivative instruments, such as debt borrowings in foreign currencies. The gains or losses on these instruments provide an offset to the gains or losses recorded on the foreign currency receivables and payables. The derivative instruments are recorded at fair value and changes in fair value are recorded in earnings under net interest and other financial income (expenses) on the Statement of Operations. Foreign currency receivables and payables are recorded at the exchange rate on the balance sheet date and gains and losses as a result of changes in exchange rates are recorded in earnings under net interest and other financial income (expenses) on the Statement of Operations. The operations of our subsidiaries are generally financed with debt issued in the currency of the country in which each subsidiary is located in an effort to limit our foreign currency exposure.
61
Table of Contents
The following table summarizes our financial instruments as of December 31, 2005 and analyzes the sensitivity of the fair value of our financial instruments to an immediate change in foreign currency rates. Fair values represent the present value of forecasted future cash flows at market exchange rates. The sensitivity analysis assumes an immediate 10% favorable or unfavorable change in all foreign currency exchange rates against the euro from their levels as of December 31 with all other variables kept constant. A favorable 10% change indicates a strengthening of the currency in which our financial instruments are denominated, primarily the U.S. dollar, against the euro and an unfavorable change indicates a weakening of the currency in which our financial instruments are denominated, primarily the U.S. dollar, against the euro. The selection of 10% favorable or unfavorable change in exchange rates should not be construed as a prediction by us of future market events, but rather, to illustrate the potential impact of such an event. The modeling technique used to calculate the exposure does not take into account correlation among foreign currency exchange rates, or correlation among various markets (i.e., the foreign exchange, equity and fixed-income markets). Even though we believe it to be possible that all of the foreign currency exchange rates to which we are exposed would simultaneously change by more than 10%, we find it meaningful to “stress test” our exposure under this 10% fluctuation scenario and other hypothetical adverse market scenarios. Our actual experience may differ from the results in the table below due to the correlation assumptions utilized, or if events occur that were not included in the methodology, such as significant liquidity or market events.
| Sensitivity analysis | ||||||||||||
| Currency and notional amount | Carrying amount | Fair value | Favorable change of 10% | Unfavorable change of 10% | ||||||||
| (in millions) | (in millions of euro) | |||||||||||
As of December 31, 2005: | ||||||||||||
Notes payable to banks, due within twelve months | yen | 2,780,0 | 20.0 | 20.0 | 18.0 | 22.0 | ||||||
| SG$ HK$ | 2.0 0.5 | 1.0 0.1 | 1.0 0.1 | 0.9 0.1 | 1.1 0.1 | |||||||
Long-term debt with maturities: | ||||||||||||
due from 2006 – 2010 due from 2006 – 2010 due from 2008 – 2011 due from 2006 – 2008 due from 2006 – 2007 | yen euro SG$ KRW US$ | 3,111.9 3.7 10.0 1,270.0 0.7 | 22.4 3.7 5.1 1.1 0.6 | 22.4 3.7 5.1 1.1 0.6 | 20.2 3.7 4.6 1.0 0.6 | 24.6 3.7 5.6 1.2 0.7 | ||||||
Convertible subordinated debt: | ||||||||||||
due May 15, 2010 due December 6, 2011 | US$ US$ | 90.0 150.0 | 76.3 127.1 | 82.7 122.4 | 68.7 114.4 | 83.9 139.8 | ||||||
Foreign exchange contracts: | ||||||||||||
purchase of currency contracts to be settled within twelve months: | US$ | 16.7 | 14.1 | 14.1 | 12.6 | 15.5 | ||||||
sale of currency contracts to be settled within twelve months: | US$ | 45.9 | 37.2 | 38.7 | 33.5 | 40.9 | ||||||
For long-term debt, the estimated fair values of our long-term debt are based on current interest rates available to us for debt instruments with similar terms and remaining maturities.
The fair values of our convertible subordinated debt borrowings are based on our estimates.
For forward exchange contracts market values based on external quotes from banks have been used to determine the fair value.
As our borrowings are primarily in currencies other than the euro, a change in foreign currency exchange rates will have an impact on our net earnings. A hypothetical increase or decrease of 10% in foreign currencies against the euro would result in a€ 1.3 million increase or decrease respectively in interest expenses at December 31, 2004 borrowing levels and a€ 1.1 million increase or decrease respectively in interest expenses at December 31, 2005 borrowing levels.
Interest risk
Our long-term and convertible subordinated debt borrowings outstanding have fixed interest rates. At December 31, 2004 and 2005 we had€ 23.4 million and€ 21.1 million, respectively, in other borrowings with variable short-term interest rates outstanding. We are exposed to interest rate risk primarily through our borrowing activities. We do not enter into financial instrument transactions for trading or speculative purposes or to manage interest rate exposure. A hypothetical change in the average interest rate by 10% on the portion of our debt bearing interest at variable rates would not result in a material change in interest expense at December 31, 2004 and December 31, 2005 borrowing levels.
62
Table of Contents
Credit risk
Credit risk represents the accounting loss that would be recognized at the reporting date if counterparties failed completely to perform as contracted and from movements in interest rates and foreign exchange rates. We do not anticipate nonperformance by counterparties. We generally do not require collateral or other security to support financial instruments with credit risk. Concentrations of credit risk (whether on or off-balance sheet) that arise from financial instruments exist for groups of customers or counterparties when they have similar economic characteristics that would cause their ability to meet contractual obligations to be similarly affected by changes in economic or other conditions. Financial instruments on the balance sheet that potentially subject us to concentrations of credit risk consist primarily of cash and cash equivalents and accounts receivable. We maintain a policy providing for the diversification of cash and cash equivalent investments and placement of investments in high quality financial institutions to limit the amount of credit risk exposure. A significant percentage of our revenue is derived from a limited number of large customers. Our largest customer accounted for approximately 17.2% of our net sales in 2005 and our ten largest customers accounted for approximately 43.7% of our net sales in 2005. Sales to these large customers also may fluctuate significantly from time to time depending on the timing and level of purchases from us. Significant orders from such customers may expose us to a concentration of credit risk and difficulties in collecting amounts due, which might harm our financial results and financial condition. At December 31, 2005, one customer accounted for 12.4% of the outstanding balance in accounts receivable.
Item 12. Description of Securities Other Than Equity Securities
Not applicable.
Item 13. Defaults, Dividend Arrearages and Delinquencies
None.
Item 14. Material Modification to the Rights of Security Holders and Use of Proceeds
None.
Item 15. Controls and Procedures
Evaluation of disclosure controls and procedures.
We have disclosure controls and procedures in place, which are designed to ensure that material information related to ASM International, including our consolidated subsidiaries, is recorded, processed, summarized and reported within the time periods specified in the SEC’s rules and forms and made known to our management, including our Chief Executive Officer (“CEO”) and Chief Financial Officer (“CFO”). We review our disclosure controls and procedures regularly and when necessary and make changes to ensure they are effective.
Our management, with the participation of our CEO and the CFO, evaluated the effectiveness of our disclosure controls and procedures as of December 31, 2005. Based upon that evaluation, the CEO and CFO have concluded that our disclosure controls and procedures are effective to provide reasonable assurance that material information about ASM International and its consolidated subsidiaries required to be included in reports filed with the SEC is made known on a timely basis to management, including our CEO and CFO.
The Disclosure Committee assists our management in overseeing ASMI’s disclosure activities and to ensure compliance with applicable disclosure requirements under U.S. and Netherlands law. The Disclosure Committee obtains information for its recommendations from the operational and financial reviews, letters of representation which include a risk and internal control self assessment, input from the documentation and assessment of our internal controls over financial reporting and input from risk management activities during the year. The Disclosure Committee comprises various members of senior management.
Changes in internal controls.
During the year ended December 31, 2005 there have not been any changes in our internal controls over financial reporting that have materially affected, or are reasonably likely to materially affect, our internal controls over financial reporting.
Item 16A. Audit Committee Financial Expert
As recommended by the Sarbanes-Oxley Act and the Dutch Corporate Governance Code, we intend for the Audit Committee to include at least one Financial Expert, who must have in-depth experience and knowledge of financial statements, international accounting principles and internal controls and procedures for financial reporting. The Supervisory Board has concluded that Mr. den Hoed meets these requirements.
63
Table of Contents
Our Supervisory Board has determined that Mr. den Hoed is independent under the standards set forth in NASDAQ Marketplace Rules 4200 and 4350(d). For Mr. den Hoed’s experience see Item 6. “Directors, Senior Management and Employees”.
We have a code of ethics applicable to all of our employees. The code of ethics, which is also applicable to our CEO, CFO and controllers, is designed to promote honest and ethical conduct and timely and accurate disclosure in our periodic financial reports.
Our whistleblower policy provides for the reporting of alleged violations of the code of ethics and alleged irregularities of a financial nature by Company employees or other stakeholders to the Management Board and/or the Supervisory Board without any fear of reprisal against the individual that reports the violation or irregularity.
For further information, see the code of ethics and whistleblower policy, which are posted on our website at www.asm.com.
Item 16C. Principal Accountant Fees and Services
Audit fees.
Deloitte Accountants B.V. and its member firms billed us an aggregate€ 857,652 and€ 1,187,761 for the audit of our Consolidated Financial Statements for the years ended December 31, 2004 and 2005, respectively, and limited reviews of our quarterly financial results. These amounts accounted for 55% and 74% of the total fees billed to us by Deloitte Accountants B.V. and its member firms in 2004 and 2005, respectively.
Audit-related fees.
Deloitte Accountants B.V. and its member firms billed us an aggregate of€ 383,392 and€ 199,748 for fees for audit related services for the years ended December 31, 2004 and 2005, respectively. The services for the year ended December 31, 2004 consisted of due diligence related to business acquisitions, due diligence related to our December 2004 offering of US$ 150 million convertible subordinated notes and consultations related to Section 404 of the Sarbanes-Oxley Act. The services for the year ended December 31, 2005 consisted mainly of consultations related to Section 404 of the Sarbanes-Oxley Act. These amounts accounted for 25% and 12% of the total fees billed to us by Deloitte Accountants B.V. and its member firms in 2004 and 2005, respectively.
Tax fees.
Deloitte Accountants B.V. and its member firms billed us an aggregate of€ 296,082 and€ 213,065 in 2004 and 2005, respectively, for tax services relating to tax compliance, tax planning and advice. These amounts accounted for 19% and 13% of the total fees billed to us by Deloitte Accountants B.V. and its member firms in 2004 and 2005, respectively.
All other fees.
Deloitte Accountants B.V. and its member firms billed us an aggregate of€ 23,529 and€ 21,078 in 2004 and 2005, respectively, for all other services. These amounts accounted for 1% and 1% of the total fees billed to us by Deloitte Accountants B.V. and its member firms in 2004 and 2005, respectively.
Audit Committee pre-approval policies.
The Audit Committee has determined that the provision of services by Deloitte Accountants B.V. and its member firms described in the preceding paragraphs is compatible with maintaining Deloitte’s independence. All audit and permitted non-audit services provided by Deloitte Accountants B.V. and its member firms during 2005 were pre-approved by the Audit Committee.
The Audit Committee has adopted the following policies and procedures for pre-approval of all audit and permitted non-audit services provided by our independent registered public accounting firm:
Audit Services. Management submits to the Audit Committee for pre-approval the scope and estimated fees for specific services directly related to performing the independent audit of our Consolidated Financial Statements for the current year.
64
Table of Contents
Audit-Related Services.The Audit Committee may pre-approve expenditures up to a specified amount for services included in identified service categories that are related extensions of audit services and are logically performed by the auditors. Additional services exceeding the specified pre-approved limits require specific Audit Committee approval.
Tax Services. The Audit Committee may pre-approve expenditures up to a specified amount per engagement and in total for identified services related to tax matters. Additional services exceeding the specified pre-approved limits, or involving service types not included in the pre-approved list, requires specific Audit Committee approval.
Other Services. In the case of specified services for which utilizing our independent registered public accounting firm creates efficiencies, minimizes disruption, or preserves confidentiality, or for which management has determined that our independent registered public accounting firm possesses unique or superior qualifications to provide such services, the Audit Committee may pre-approve expenditures up to a specified amount per engagement and in total. Additional services exceeding the specified pre-approved limits, or involving service types not included in the pre-approved list, requires specific Audit Committee approval.
Item 16D. Exemptions from the Listing Standards for Audit Committees
Not applicable.
Item 16E. Purchases of Equity Securities by the Issuer and Affiliated Purchasers
As of December 31, 2004 we used US$ 17.5 million of the proceeds of our December 2004 issuance of US$ 150.0 million principal amount of 4.25% convertible subordinated share due December 2011 to repurchase US$ 16.1 million of the US$ 115 million outstanding principal amount of our 5% convertible subordinated notes due November 2005. Between January 1, 2005 and March 23, 2005, we used an additional US$ 5.0 million of the proceeds to repurchase US$ 4.6 million principal amount of our 5% convertible subordinated notes due November 2005. The remaining balance of US$ 94.3 million of our 5% convertible subordinated notes due November 2005 was repaid by us at maturity date.
Not Applicable.
See pages F-1 through F-36, which are incorporated herein by reference.
65
Table of Contents
| Exhibit Number | Description | Incorporated by Reference to: | Included Herein: | |||
| 1.1 | English translation of ASM International N.V.’s Compiled Articles of Association, as amended | Exhibit 3.1 to Registrant’s 6-K filed on November 6, 2001 | ||||
| 4.1 | 1994 Stock Option Plan | Exhibit 99.1 to the Registrant’s S-8 filed October 25, 1999 | ||||
| 4.9 | Indenture Agreement dated November 19, 2001 between ASMI International N.V. and Citibank, N.A. | Exhibit 4.17 to the Registrant’s Form 20-F/A filed on May 10, 2002 | ||||
| 4.10 | 2001 Stock Option Plan | Exhibit 99.1 to the Registrant’s Form S-8 filed on April 30, 2002 | ||||
| 4.14 | Trust Deed and Rules of The ASM Pacific Technology Employee Share Incentive Scheme, dated March 23, 1990 | Exhibit 4.14 to the Registrant’s Form 20-F filed on April 17, 2003 | ||||
| 4.15 | Deed of Adherence Relating to Participation in the Employee Share Incentive Scheme of ASM Pacific Technology Limited, dated April 22, 1999 | Exhibit 4.15 to the Registrant’s Form 20-F filed on April 17, 2003 | ||||
| 4.16 | Supplemental Deed Relating to the Employee Share Incentive Scheme of ASM Pacific Technology Limited | Exhibit 4.16 to the Registrant’s Form 20-F filed on April 17, 2003 | ||||
| 4.18 | Indenture Agreement dated May 6, 2003 between ASM International N.V. and Citibank N.A. | Exhibit 4.18 to the Registrant’s Form F-3 filed on July 25, 2003 | ||||
| 4.19 | Registration Rights Agreement dated May 6, 2003 | Exhibit 4.19 to the Registrant’s Form F-3 filed on July 25, 2003 | ||||
| 4.20 | Indenture Agreement dated December 6, 2004 for the 4.25 % Convertible Subordinated Notes. | Exhibit 99.1 to the Registrant’s Form 6-K filed on December 9, 2004 | ||||
| 4.21 | Registration Rights Agreement dated December 6, 2004 for the 4.25 % Convertible Subordinated Notes. | Exhibit 99.2 to the Registrant’s Form 6-K filed on December 9, 2004 | ||||
| 4.22 | English translation of Arnold J.M. van der Ven’s Employment Agreement | Exhibit 99.1 to the Registrant’s Form 6-K filed on September 29, 2005 | ||||
| 8.1 | Subsidiaries | X | ||||
| 12.1 | Certification of CEO pursuant to Rule 13a-14(a) | X | ||||
| 12.2 | Certification of CFO pursuant to Rule 13a-14(a) | X | ||||
| 13.1 | Certification of CEO and CFO pursuant to Rule 13a-14(b) and 18 U.S.C. 1350 | X | ||||
| 15.1 | Consent of Independent Registered Public Accounting Firm | X | ||||
| * | Pursuant to Instruction 2(b)(ii), the Registrant has omitted certain agreements with respect to long-term debt not exceeding 10% of consolidated total assets. The Registrant agrees to furnish a copy of any such agreements to the Securities Exchange Commission upon request. |
66
Table of Contents
INDEX TO CONSOLIDATED FINANCIAL STATEMENTS
F-1
Table of Contents
Report of Independent Registered Public Accounting Firm
To the Board of Directors and Shareholders of
ASM International N.V.
Bilthoven, the Netherlands
We have audited the accompanying consolidated balance sheets of ASM International N.V. and subsidiaries (collectively, the “Company”) as of December 31, 2005 and 2004, and the related consolidated statements of operations, comprehensive income, shareholders’ equity, and cash flows for each of the three years in the period ended December 31, 2005. These financial statements are the responsibility of the Company’s management. Our responsibility is to express an opinion on these financial statements based on our audits.
We conducted our audits in accordance with the standards of the Public Company Accounting Oversight Board (United States). Those standards require that we plan and perform the audit to obtain reasonable assurance about whether the financial statements are free of material misstatement. The Company is not required to have, nor were we engaged to perform, an audit of its internal control over financial reporting. An audit includes consideration of internal control over financial reporting as a basis for designing audit procedures that are appropriate in the circumstances, but not for the purpose of expressing an opinion on the effectiveness of the Company’s internal control over financial reporting. Accordingly, we express no such opinion. An audit also includes examining, on a test basis, evidence supporting the amounts and disclosures in the financial statements, assessing the accounting principles used and significant estimates made by management, as well as evaluating the overall financial statement presentation. We believe that our audits provide a reasonable basis for our opinion.
In our opinion, such consolidated financial statements present fairly, in all material respects, the financial position of the Company as of December 31, 2005 and 2004, and the results of its operations and cash flows for each of the three years in the period ended December 31, 2005, in conformity with accounting principles generally accepted in the United States of America.
Amsterdam, the Netherlands, February 21, 2006
Deloitte Accountants B.V.
J.G.C.M. Buné
F-2
Table of Contents
(thousands except share data) | Note | EUR | ||||||
| December 31, | ||||||||
| 2004 | 2005 | |||||||
Assets | ||||||||
Cash and cash equivalents | 4 | 218,614 | 134,996 | |||||
Marketable securities | 4 | 5 | 4 | |||||
Accounts receivable (less allowance for doubtful accounts | 5 | 171,996 | 209,314 | |||||
Inventories, net | 6 | 156,959 | 189,404 | |||||
Income taxes receivable | 26 | 22 | ||||||
Deferred tax assets | 21 | 3,624 | 2,841 | |||||
Other current assets | 24,646 | 24,232 | ||||||
Total current assets | 575,870 | 560,813 | ||||||
Debt issuance costs | 14 | 6,346 | 5,430 | |||||
Deferred tax assets | 21 | 780 | 536 | |||||
Investments and loan advances | 7 | — | — | |||||
Purchased technology and other intangible assets, net | 8 | 8,833 | 9,177 | |||||
Goodwill, net | 9 | 89,309 | 73,009 | |||||
Property, plant and equipment, net | 10 | 142,696 | 163,343 | |||||
Total assets | 823,834 | 812,308 | ||||||
Liabilities and Shareholders’ Equity | ||||||||
Notes payable to banks | 11 | 23,379 | 21,061 | |||||
Accounts payable | 76,026 | 93,669 | ||||||
Accrued expenses and other | 12 | 88,342 | 94,704 | |||||
Income taxes payable | 13,636 | 7,965 | ||||||
Current portion of long-term debt | 13 | 7,883 | 7,150 | |||||
Current portion of convertible subordinated debt | 14 | 72,646 | — | |||||
Total current liabilities | 281,912 | 224,549 | ||||||
Deferred tax liabilities | 21 | 914 | 311 | |||||
Long-term debt | 13 | 17,137 | 25,741 | |||||
Convertible subordinated debt | 14 | 176,208 | 203,448 | |||||
Total liabilities | 476,171 | 454,049 | ||||||
Commitments and contingencies | 17, 18 | |||||||
Minority interest in subsidiary | 90,947 | 119,665 | ||||||
Common shares | ||||||||
Authorized 110,000,000 shares, par value€ 0.04, issued | 2,105 | 2,107 | ||||||
Financing preferred shares | ||||||||
Authorized 8,000 shares, par value€ 40, none issued | — | — | ||||||
Preferred shares | ||||||||
Authorized 118,000 shares, par value€ 40, none issued | — | — | ||||||
Capital in excess of par value | 299,761 | 300,479 | ||||||
Retained earnings (accumulated deficit) | 24,631 | (15,586 | ) | |||||
Accumulated other comprehensive loss | (69,781 | ) | (48,406 | ) | ||||
Total shareholders’ equity | 15 | 256,716 | 238,594 | |||||
Total liabilities and shareholders’ equity | 823,834 | 812,308 | ||||||
See Notes to Consolidated Financial Statements.
F-3
Table of Contents
Consolidated Statements of Operations
(thousands, except per share data) | Note | EUR | |||||||||
| Year ended December 31, | |||||||||||
| 2003 | 2004 | 2005 | |||||||||
Net sales | 22 | 581,868 | 754,245 | 726,418 | |||||||
Cost of sales | (380,597 | ) | (472,501 | ) | (473,411 | ) | |||||
Gross profit | 22 | 201,271 | 281,744 | 253,007 | |||||||
Operating expenses: | |||||||||||
Selling, general and administrative | (108,019 | ) | (107,040 | ) | (101,185 | ) | |||||
Research and development, net | 20 | (79,053 | ) | (84,874 | ) | (100,668 | ) | ||||
Amortization of purchased technology and other intangible assets | 8 | — | (1,389 | ) | (1,748 | ) | |||||
Impairment of goodwill | 2, 9 | — | — | (30,994 | ) | ||||||
Total operating expenses | (187,072 | ) | (193,303 | ) | (234,595 | ) | |||||
Earnings (loss) from operations | 22 | 14,199 | 88,441 | 18,412 | |||||||
Loss on equity investments | 7 | (2,770 | ) | (417 | ) | — | |||||
Interest income | 1,393 | 2,223 | 5,746 | ||||||||
Interest expense | (11,692 | ) | (12,570 | ) | (16,163 | ) | |||||
Foreign currency transaction losses, net | (2,479 | ) | (111 | ) | (128 | ) | |||||
Earnings (loss) before income taxes and minority interest | (1,349 | ) | 77,566 | 7,867 | |||||||
Income tax benefit (expense) | 21 | (7,112 | ) | (10,575 | ) | (7,307 | ) | ||||
Earnings (loss) before minority interest | (8,461 | ) | 66,991 | 560 | |||||||
Minority interest | (24,570 | ) | (45,608 | ) | (43,558 | ) | |||||
Gain on dilution of investment in subsidiary | 16 | 941 | 2,656 | 2,781 | |||||||
Net earnings (loss) | (32,090 | ) | 24,039 | (40,217 | ) | ||||||
Net earnings (loss) per share: | |||||||||||
Basic | 24 | (0.65 | ) | 0.47 | (0.76 | ) | |||||
Diluted | 24 | (0.65 | ) | 0.46 | (0.76 | ) | |||||
Weighted average number of shares used in computing per | |||||||||||
Basic | 24 | 49,642 | 51,540 | 52,638 | |||||||
Diluted | 24 | 49,642 | 51,858 | 52,638 | |||||||
See Notes to Consolidated Financial Statements.
F-4
Table of Contents
Consolidated Statements of Comprehensive Income
(thousands) | Note | EUR | |||||||||
| Year ended December 31, | |||||||||||
| 2003 | 2004 | 2005 | |||||||||
Net earnings (loss) | (32,090 | ) | 24,039 | (40,217 | ) | ||||||
Other comprehensive income (loss): | |||||||||||
Foreign currency translation effect for the year | 15 | (26,862 | ) | (14,217 | ) | 23,638 | |||||
Unrealized gains (losses) on derivative instruments | 15 | (985 | ) | 1,543 | (2,263 | ) | |||||
Total other comprehensive income (loss) | (27,847 | ) | (12,674 | ) | 21,375 | ||||||
Comprehensive income (loss) | (59,937 | ) | 11,365 | (18,842 | ) | ||||||
See Notes to Consolidated Financial Statements.
F-5
Table of Contents
Consolidated Statements of Shareholders’ Equity
(thousands, except for number of common shares) | Note | EUR | |||||||||||||||
Number of common shares | Common shares | Capital in excess of par value | Retained earnings (accumulated deficit) | Accumulated other com- prehensive income (loss) | Total Share- holders’ Equity | ||||||||||||
Balance January 1, 2003 | 49,370,308 | 1,975 | 254,999 | 32,682 | (29,260 | ) | 260,396 | ||||||||||
Issuance of common shares: | |||||||||||||||||
For stock options | 16 | 691,339 | 27 | 4,123 | — | — | 4,150 | ||||||||||
Net loss | — | — | — | (32,090 | ) | — | (32,090 | ) | |||||||||
Other comprehensive loss | 15 | — | — | — | — | (27,847 | ) | (27,847 | ) | ||||||||
Balance December 31, 2003 | 50,061,647 | 2,002 | 259,122 | 592 | (57,107 | ) | 204,609 | ||||||||||
Issuance of common shares: | |||||||||||||||||
For stock options | 16 | 146,385 | 7 | 1,215 | — | — | 1,222 | ||||||||||
Exercise of warrants | 15 | 200,000 | 8 | 1,557 | — | — | 1,565 | ||||||||||
Acquisition of businesses | 2 | 2,209,920 | 88 | 37,726 | — | — | 37,814 | ||||||||||
Compensation expense employee stock option plan | 16 | — | — | 141 | — | — | 141 | ||||||||||
Net earnings | — | — | — | 24,039 | — | 24,039 | |||||||||||
Other comprehensive loss | 15 | — | — | — | — | (12,674 | ) | (12,674 | ) | ||||||||
Balance December 31, 2004 | 52,617,952 | 2,105 | 299,761 | 24,631 | (69,781 | ) | 256,716 | ||||||||||
Issuance of common shares: | |||||||||||||||||
For stock options | 16 | 61,000 | 2 | 718 | — | — | 720 | ||||||||||
Net earnings | — | — | — | (40,217 | ) | — | (40,217 | ) | |||||||||
Other comprehensive income | 15 | — | — | — | — | 21,375 | 21,375 | ||||||||||
Balance December 31, 2005 | 52,678,952 | 2,107 | 300,479 | (15,586 | ) | (48,406 | ) | 238,594 | |||||||||
See Notes to Consolidated Financial Statements.
F-6
Table of Contents
Consolidated Statements of Cash Flows
(thousands) | EUR | ||||||||
| Year ended December 31, | |||||||||
| 2003 | 2004 | 2005 | |||||||
Cash flows from operating activities: | |||||||||
Net earnings (loss) | (32,090 | ) | 24,039 | (40,217 | ) | ||||
Adjustments to reconcile net earnings (loss) to net cash from | |||||||||
Depreciation | 34,415 | 35,309 | 36,006 | ||||||
Amortization of purchased technology and other intangible assets | — | 1,389 | 1,748 | ||||||
Impairment of property, plant and equipment | 3,242 | — | 5,442 | ||||||
Impairment of goodwill | — | — | 30,994 | ||||||
Amortization of debt issuance costs | 1,509 | 1,684 | 1,781 | ||||||
Compensation expense employee share incentive scheme ASMPT | 6,391 | 4,851 | 6,242 | ||||||
Compensation expense employee stock option plan | — | 141 | 66 | ||||||
Deferred income taxes | 924 | (275 | ) | 550 | |||||
Loss on equity investments | 2,770 | 417 | — | ||||||
Minority interest | 24,570 | 45,608 | 43,558 | ||||||
Gain on dilution of investment in subsidiary | (941 | ) | (2,656 | ) | (2,781 | ) | |||
Increase in allowance for doubtful receivables | 831 | 427 | 345 | ||||||
Changes in other assets and liabilities: | |||||||||
Accounts receivable | (30,546 | ) | (36,024 | ) | (22,611 | ) | |||
Inventories | 18,449 | (17,200 | ) | (14,537 | ) | ||||
Other current assets | 274 | (8,047 | ) | 1,918 | |||||
Accounts payable and accrued expenses | 21,162 | 15,641 | 14,373 | ||||||
Advance payments from customers | 4,908 | (2,234 | ) | (497 | ) | ||||
Deferred revenue | 1,620 | 3,773 | (4,328 | ) | |||||
Income taxes | 4,119 | 8,046 | (7,335 | ) | |||||
Net cash provided by operating activities | 61,607 | 74,889 | 50,717 | ||||||
Cash flows from investing activities: | |||||||||
Capital expenditures | (30,078 | ) | (58,142 | ) | (44,637 | ) | |||
Purchase of intangible assets | — | (776 | ) | (732 | ) | ||||
Investments and loan advances | (3,774 | ) | (4,568 | ) | — | ||||
Acquisition of shares from minority shareholders ASMPT | — | (4,465 | ) | — | |||||
Acquisition of business, net of common shares issued and cash acquired | �� | — | (4,452 | ) | (1,101 | ) | |||
Proceeds from sale of property, plant and equipment | 2,945 | 4,744 | 913 | ||||||
Sale of marketable securities | — | 3 | 1 | ||||||
Net cash used in investing activities | (30,907 | ) | (67,656 | ) | (45,556 | ) | |||
Cash flows from financing activities: | |||||||||
Notes payable to banks, net | (1,311 | ) | (499 | ) | (2,379 | ) | |||
Proceeds from long-term debt and subordinated debt | 91,191 | 112,475 | 13,347 | ||||||
Repayments of long-term debt and subordinated debt | (3,643 | ) | (17,167 | ) | (89,620 | ) | |||
Proceeds from issuance of common shares | 4,150 | 2,787 | 654 | ||||||
Dividends to minority shareholders | (20,397 | ) | (34,412 | ) | (31,713 | ) | |||
Net cash provided by (used in) financing activities | 69,990 | 63,184 | (109,711 | ) | |||||
Foreign currency translation effect | (16,824 | ) | (6,660 | ) | 20,932 | ||||
Net increase (decrease) in cash and cash equivalents | 83,866 | 63,757 | (83,618 | ) | |||||
Cash and cash equivalents at beginning of year | 70,991 | 154,857 | 218,614 | ||||||
Cash and cash equivalents at end of year | 154,857 | 218,614 | 134,996 | ||||||
Supplemental disclosures of cash flow information | |||||||||
Cash paid during the year for: | |||||||||
Interest | 9,693 | 9,080 | 10,295 | ||||||
Income taxes | 2,069 | 3,623 | 14,093 | ||||||
Non cash investing and financing activities: | |||||||||
Common shares issued for acquisition of business | — | 37,814 | — | ||||||
Capital lease expenditures | — | — | 1,414 | ||||||
See Notes to Consolidated Financial Statements.
F-7
Table of Contents
Notes to Consolidated Financial Statements
(€ in thousands, except per share data and unless otherwise stated)
NOTE 1Summary of Significant Accounting Policies
Basis of Presentation—ASM International N.V. (‘ASMI’ or ‘the Company’) is a Netherlands public liability company domiciled in the Netherlands with its principal operations in Europe, the United States, Southeast Asia and Japan. The Company dedicates its resources to the research, development, manufacturing, marketing and servicing of equipment and materials used to produce semiconductor devices. The Company provides production solutions for the main areas of semiconductor production: wafer processing (front-end), assembly and packaging (back-end). The Company follows accounting principles generally accepted in the United States of America.
Reclassifications—Certain reclassifications have been made to the prior year Consolidated Financial Statements to conform to the current year presentation.
Principles of Consolidation—The Consolidated Financial Statements include the accounts of ASMI, its subsidiaries and its variable interest entities (‘the Company’), where ASMI holds a controlling interest respectively where ASMI is the primary beneficiary. The minority interest of third parties is disclosed separately in the Consolidated Financial Statements. All intercompany profits, transactions and balances have been eliminated in consolidation
Consolidation of NanoPhotonics—At December 31, 2004 the Company held a 23.61% interest in NanoPhotonics AG (“NanoPhotonics”). During 2004, the Company determined that it is the primary beneficiary of NanoPhotonics since the Company funds the operations of NanoPhotonics and is subject to a majority of the risk of loss from the activities of NanoPhotonics. Consequently, the Company has consolidated NanoPhotonics as of December 31, 2004 on a prospective basis. The Company previously accounted for NanoPhotonics under the equity method. The impact of consolidating NanoPhotonics in 2004 was not material to the Company’s financial position or results of operations. At December 31, 2005 the Company holds a 69.10 % interest in NanoPhotonics. Reference is made to Note 9.
Retroactive Application of Equity Method of NuTool, Inc.—On June 2, 2004, the Company acquired the remaining 84.3% interest in NuTool, Inc. (“NuTool”), a privately-held semiconductor equipment company based in California, United States of America. As a result of the acquisition, the Company owns 100% of the outstanding capital stock of NuTool. Subsequent to the acquisition NuTool’s name was changed to ASM NuTool, Inc (“ASM NuTool”).
The 15.7% interest in NuTool, which the Company acquired in two transactions in December 2001 and April 2003, had historically been accounted for based on the cost method of accounting. As a result of the acquisition of the remaining interest in NuTool on June 2, 2004, the Company began exerting significant influence over the operations of NuTool. This change in influence required the Company to retroactively amend prior period results to reflect the change from the cost method of accounting to the equity method of accounting for its investment in NuTool as if it had been accounted for under the equity method of accounting since the Company’s first investment. At December 31, 2003, this amendment reduced the investment balance in NuTool by€ 10,323, retained earnings by€ 5,142 and accumulated other comprehensive income by€ 5,181. The accompanying Consolidated Statements of Operations, the Consolidated Statements of Shareholders’ Equity and the Consolidated Statements of Cash Flows for the year ended December 31, 2003 have been adjusted to reflect the amendment. The retroactive amendment, as previously reflected in the December 31, 2004 Consolidated Financial Statements, resulted in the following impact for the year ended December 31, 2003:
| Year ended December 31, | |||
| 2003 | |||
Net loss—as originally reported | (29,320 | ) | |
Adjustment for change from the cost method of accounting to the equity method of accounting of the Company’s investment in NuTool | (2,770 | ) | |
Net loss—as amended | (32,090 | ) | |
Basic loss per share—as originally reported | (0.59 | ) | |
Basic loss per share—as amended | (0.65 | ) | |
Diluted loss per share—as originally reported | (0.59 | ) | |
Diluted loss per share—as amended | (0.65 | ) | |
F-8
Table of Contents
Foreign Currency Translation—The financial information for subsidiaries outside the Netherlands is measured using local currencies as the functional currency of that subsidiary. Assets and liabilities of foreign subsidiaries, of which the functional currency is not the euro, are translated into euros at exchange rates prevailing at the end of the year. Revenues and costs relating to the operation of such subsidiaries are translated at average exchange rates during the year. Resulting translation adjustments are directly recorded in Shareholders’ Equity. Exchange rate differences on translations of other transactions in foreign currencies are reflected in the Consolidated Statement of Operations.
Derivative Financial Instruments—The Company uses derivative instruments to manage certain exposures to foreign currency risks. The Company’s objectives for holding derivatives are to minimize these risks using the most effective methods to eliminate or reduce the impact of such exposure.
The Company recognizes all derivatives, including foreign currency exchange contracts, on the balance sheet at fair value. Changes in the fair value of derivatives that do not qualify for hedge treatment, as well as the ineffective portion of any hedges, are recognized in earnings. All of the Company’s derivative financial instruments are recorded at their fair value in other current assets or accrued expenses.
ASMI and its subsidiaries conduct business in a number of foreign countries, with certain transactions denominated in currencies other than the functional currency of the Company or one of its subsidiaries conducting the business. The purpose of the Company’s foreign currency management is to manage the effect of exchange rate fluctuations on certain foreign currency denominated revenues, costs and eventual cash flows. The terms of currency instruments used for hedging purposes are generally consistent with the timing of the transactions being hedged. The Company does not use derivative financial instruments for trading or speculative purposes. The Company uses derivative financial instruments, such as forward exchange contracts, to hedge foreign currency denominated sales and purchase transactions. As a policy the Company only hedges forecasted foreign currency transactions for which the Company has a firm commitment from a customer or to a supplier. The hedges related to forecasted transactions are designated and documented at the inception of the hedge as cash flow hedges, and are evaluated for effectiveness quarterly. The effective portion of the gain or loss on these hedges is reported as a component of other comprehensive income in Shareholders’ Equity, and is reclassified into earnings when the hedged transaction affects earnings. Substantially all amounts included in other comprehensive income at December 31, 2005 will be reclassified to earnings within twelve months upon completion of the underlying transaction. If the underlying transaction being hedged fails to occur, or if a portion of any derivative is ineffective, the gain or loss is immediately recognized in earnings under foreign currency transaction gains (losses) in the Consolidated Statement of Operations.
Furthermore, the Company continues to manage the currency exposure of cash and cash equivalents, certain receivables and payables using derivative instruments, such as forward exchange contracts and currency swaps, and non-derivative instruments, such as debt borrowings in foreign currencies. The gains or losses on these instruments provide an offset to the gains or losses recorded on the foreign currency receivables and payables. The derivative instruments are recorded at fair value and changes in fair value are recorded in earnings under foreign currency transaction gains (losses) in the Consolidated Statement of Operations. Foreign currency receivables and payables are recorded at the exchange rate at the balance sheet date and gains and losses as a result of changes in exchange rates are recorded in earnings under foreign currency transaction gains (losses) in the Consolidated Statement of Operations.
Gains or losses recognized resulting from the ineffectiveness of cash flow and fair value hedges were not material for the years ended December 31, 2004 and 2005.
Cash and Cash Equivalents—Cash and cash equivalents include cash on hand, current accounts with banks, and short-term deposits with a maturity of three months or less at the date of purchase.
Marketable Securities—All investments in marketable securities are classified as available for sale which requires reporting these investments at fair market value and recording the unrealized gains and losses, after tax, as a component of Shareholders’ Equity. Realized gains and losses on securities sold are included in net earnings. There were no material unrealized gains and losses in the years presented.
Inventories—Inventories are stated at the lower of cost (first-in, first-out method) or market value. Costs include net prices paid for materials purchased, charges for freight and custom duties, direct wages of employees and charges for material handling.
Property, Plant and Equipment—Property, plant and equipment are carried at cost, less accumulated depreciation. Capital leased assets are recorded at the present value of future lease obligations. Depreciation is calculated using the straight-line method over the estimated useful lives. Leasehold improvements are depreciated over the lesser of the estimated useful life of the underlying property or the term of the underlying lease.
F-9
Table of Contents
Goodwill, Purchased Technology and Other Intangible Assets—Business combinations are accounted for under the purchase method. As from January 1, 2002, goodwill and other intangibles assets with indefinite lives are no longer amortized. Instead, the Company tests its recorded goodwill and other intangible assets with indefinite lives for impairment each year on December 31 or if events or changes in circumstances indicate that the carrying amount exceeds the fair value of the goodwill and other intangible assets with indefinite lives. Purchased technology and other intangibles assets with finite lives are amortized over the estimated useful lives using the straight-line method.
Investments—Investments with a capital investment of 20% or more of the voting stock of an investee are accounted for under the equity method, absent evidence to the contrary that the Company has the ability to exercise significant influence over the investee. Conversely, an investment of less than 20% of the voting stock of an investee is accounted for under the cost method, unless significant influence can be demonstrated. Losses in value of investments that are other than temporary are recognized in the Consolidated Statement of Operations as an operating expense.
As discussed in more detail under “Retroactive Application of Equity Method of NuTool, Inc.” the investment in NuTool is accounted for under the equity method for all periods presented.
Recoverability of Long-Lived Assets—Long-lived assets and certain recognized intangible assets (except those not being amortized) to be held and used by the Company, and long-lived assets and certain recognized intangible assets (including those not being amortized) to be disposed of, are reviewed by the Company for impairment whenever events or changes in circumstances indicate that the carrying amount of an asset may not be recoverable. In performing the review for recoverability, the Company estimates the future undiscounted cash flows expected to result from the use of the asset and its eventual disposition. If the undiscounted future cash flow is less than the carrying amount of the asset, the asset is deemed impaired. The amount of the impairment is measured as the difference between the carrying value and the fair value of the asset. Generally, long-lived assets and certain identifiable intangibles to be disposed of are reported at the lower of carrying amount or fair value less cost to sell.
Revenue Recognition—Net revenues include product revenues derived primarily from sales of front-end and back-end equipment used by both segments of the semiconductor equipment market. The Company recognizes revenue from equipment sales upon shipment of its products when it is proven prior to shipment that the equipment has met all of the customers’ criteria and specifications. The installation process is not believed to be essential to the functionality of the products. However, since under most of the sales contracts, the timing of payment of a portion of the sales price is coincident with installation, such installation is not considered to be inconsequential or perfunctory. Therefore, at the time of shipment, the Company defers that portion of the sales price related to the fair value of installation at the time of shipment. The Company believes it has an enforceable claim for that portion of the sales price not related to the fair value of the installation should it not fulfill its installation obligation. The fair value of the installation process is measured based upon the per-hour amounts charged by third parties for similar installation services. When the Company can only satisfy the customer acceptance criteria or specifications at the customer’s location, revenue is deferred until final acceptance by the customer or until contractual conditions lapse. The Company provides training and technical support to customers. Revenue related to such services is recognized when the service is completed. Revenue from the sale of spare parts and materials is recognized when the goods are shipped.
Cost of Sales—Cost of sales includes direct costs such as materials, labor and related overhead. Cost of sales also include cost of warranty, third party commission and royalty payments and costs relating to prototype and experimental products, which the Company may subsequently sell to customers. The estimated costs of warranty on product shipments include the cost of labor, material and related overhead necessary to repair a product under the warranty period. The estimated costs are accrued for in a warranty reserve and are estimated based on actual historical expenses incurred and on estimated probable future expenses related to current sales. Actual warranty costs are charged against the warranty reserve. The warranty reserve is included under accrued expenses and other in the Consolidated Balance Sheet.
Restructuring—Restructuring charges are recognized for exit or disposal activities when the liability arising from restructuring plans is incurred.
Research and Development Expenses—Research and development costs are expensed as incurred. Costs, which relate to prototype and experimental models, which are sold to customers, are charged to cost of sales. Subsidies and other governmental credits to cover research and development costs relating to approved projects are recorded as research and development credits in the period when such project costs occur. The research and development expenses are presented net of the development credits. Technical development credits received from the government of the Netherlands, to offset the cost of certain research and development projects, are contingently repayable to the extent sales of products developed in such
F-10
Table of Contents
projects occur within the agreed upon time period. Such repayments are calculated as a percentage of sales and are charged to cost of sales. No such repayments are required if such sales do not occur within the agreed upon time period. Reference is made to Note 20.
Income Taxes—The Company recognizes deferred tax assets and liabilities for the estimated future tax consequences of events attributable to differences between the financial statement carrying amounts of existing assets and liabilities and their respective tax bases and operating loss and tax credit carry forwards. Deferred tax assets and liabilities are measured using currently enacted tax rates. The effect on deferred tax assets and liabilities of changes in tax rates is recognized in the Consolidated Statement of Operations in the period in which the enacted rate changes. Deferred tax assets, net of appropriate deferred tax liabilities, are reduced through a valuation allowance at such time as, based on available evidence, it is more likely than not that the deferred tax assets will not be realized.
Stock-Based Compensation—ASMI accounts for its stock option and stock-based compensation plans using the intrinsic-value method prescribed in Accounting Principles Board Opinion (“APB”) No. 25, “Accounting for Stock Issued to Employees.” Statement of Financial Accounting Standard (“SFAS”) No. 123, “Accounting for Stock-Based Compensation,” amended by SFAS No. 148. “Accounting for Stock-Based Compensation—Transition and Disclosure” allows companies to elect to recognize the fair value of stock options granted as an expense, or to account for stock options using the intrinsic value under APB No. 25 and provide pro forma disclosure of the impact of the fair value on net earnings (loss) and net earnings (loss) per share. As ASMI elected to follow APB No. 25, compensation expense is computed for each employee stock option granted as the amount by which the quoted market price of the ASMI common shares on the date of the grant exceeds the exercise price that the employee must pay to acquire the shares. All options granted to key management under ASMI’s stock option plans had an exercise price equal to the market value of the underlying common shares on the date of grant and accordingly for these plans no stock-based compensation expense is reflected in net earnings (loss). The following table illustrates the effect on net earnings (loss) if the Company had applied the fair value recognition provisions of SFAS No. 123, amended by SFAS No. 148:
| Year ended December 31, | |||||||||
| 2003 | 2004 | 2005 | |||||||
Net earnings (loss): | |||||||||
As reported | (32,090 | ) | 24,039 | (40,217 | ) | ||||
Total stock-based compensation expense determined under fair value based method, net of related tax effect | (3,151 | ) | (3,152 | ) | (2,483 | ) | |||
Pro forma | (35,241 | ) | 20,887 | (42,700 | ) | ||||
Basic earnings (loss) per share: | |||||||||
As reported | (0.65 | ) | 0.47 | (0.76 | ) | ||||
Pro forma | (0.71 | ) | 0.41 | (0.81 | ) | ||||
Diluted earnings (loss) per share: | |||||||||
As reported | (0.65 | ) | 0.46 | (0.76 | ) | ||||
Pro forma | (0.71 | ) | 0.40 | (0.81 | ) | ||||
The total estimated stock-based compensation expense, determined under the fair value based method, net of related tax effect, is amortized ratably over the option vesting periods and computed using the Black-Scholes option pricing model with the following weighted average assumptions:
| Year ended December 31, | |||||||||
| 2003 | 2004 | 2005 | |||||||
Expected life (years) | 3 – 10 | 3 – 10 | 3 – 10 | ||||||
Risk free interest rate | 4.5 | % | 4.5 | % | 5.0 | % | |||
Dividend yield | — | — | — | ||||||
Expected volatility | 79.3 | % | 72.4 | % | 61.9 | % | |||
Assumed forfeitures | — | — | — | ||||||
Expected volatility was derived from the historical volatility of ASMI’s stock price over the last 5 years.
Based on the Black-Scholes option pricing model, the weighted average estimated fair value of employee stock options granted in U.S. dollars were US$ 10.33 in 2003, US$ 13.58 in 2004 and US$ 11.02 in 2005. The weighted average estimated fair value of employee stock option granted in euros were€ 8.48 in 2003,€ 8.28 in 2004 and€ 7.95 in 2005. For further information on ASMI’s stock option plans reference is made to Note 16.
F-11
Table of Contents
Sales of Shares by a Subsidiary—As further described in the Notes to Consolidated Financial Statements herein, from time to time, the consolidated subsidiary ASM Pacific Technology Ltd. (“ASMPT”) will issue common shares pursuant to their Employee Share Incentive Scheme. The effect of these issuances is a dilution of the ownership in ASMPT. The Company recognizes the impact of these issuances in the Consolidated Statement of Operations as a gain (loss) on dilution of investment in subsidiary.
Net Earnings (Loss) per Share—Basic earnings (loss) per share is computed by dividing net earnings (loss) per share by the weighted average common shares outstanding for the year. Diluted earnings (loss) per share reflects the potential dilution that could occur if options issued under the Company’s stock option plan were exercised, outstanding warrants were exercised, and if the Company’s convertible subordinated debt borrowings were converted, unless the conversion would have an anti-dilutive effect.
Comprehensive Income (Loss)—Comprehensive income (loss) consists of net earnings (loss) and other comprehensive income (loss). Other comprehensive income (loss) includes gains and losses that are not included in net earnings (loss), but are recorded directly in Shareholders’ Equity. For the years 2003, 2004 and 2005 other comprehensive income (loss) included foreign currency translation adjustments and unrealized gains and losses on derivative financial instruments.
Use of Estimates—The preparation of the Company’s Consolidated Financial Statements in conformity with generally accepted accounting principles requires management to make estimates and assumptions that affect the reported amounts of assets and liabilities and disclosure of contingent assets and liabilities at the balance sheet dates and the reported amounts of revenue and expense during the reported periods. Actual results could differ from those estimates.
New Accounting Pronouncements—In December 2004, the Financial Accounting Standards Board (“FASB”) issued SFAS No. 123R “Share-Based Payment,” which addresses the accounting for employee stock options. This statement is a revision of SFAS No. 123 “Accounting for Stock-Based Compensation” and supersedes APB Opinion No. 25, “Accounting for Stock Issued to Employees.” SFAS No. 123R is effective at the beginning of the first annual period beginning after June 15, 2005. The approach to account for share-based payments in SFAS No. 123R is in general similar to the approach described in SFAS No. 123. However, SFAS No. 123R requires that the cost of all employee stock options, as well as other equity-based compensation arrangements, be reflected in the financial statements based on the estimated fair value of the awards. Pro forma disclosure is no longer an alternative. In January 2005, the SEC issued Staff Accounting Bulletin No. 107, which provides supplemental implementation guidance for SFAS No. 123R. The Company will adopt SFAS No. 123R and related interpretation effective January 1, 2006, and will apply the provisions of SFAS No. 123R to all share-based payments, including employee stock options granted, vested, modified or settled subsequent to the date of adoption. The cost relating to these payments will be measured at fair value on the grant date and will be recognized in the financial statements over the requisite service period. The Company estimates that the adoption of SFAS No. 123R in 2006 will have an impact on the Company’s financial position or result of operations in a range of€ 1,500 to€ 2,000.
In June 2005, the FASB issued a FASB Staff Position (“FSP”) interpreting SFAS No. 143, “Accounting for Asset Retirement Obligations,” specifically FSP 143-1, “Accounting for Electronic Equipment Waste Obligations” (“FSP 143-1”). FSP 143-1 addresses the accounting for obligations associated with Directive 2002/96/EC, Waste Electrical and Electronic Equipment, which was adopted by the European Union (EU). The FSP provides guidance on how to account for the effects of the Directive but only with respect to historical waste associated with products placed on the market on or before August 13, 2005. FSP 143-1 is effective the later of the first reporting period ending after June 8, 2005, or the date of the adoption of the law by the applicable EU-member country. The adoption of FSP 143-1 did not have a material impact on the Company’s financial position or results of operations.
NOTE 2Impairment and Restructuring
Impairment and Restructuring ASM NuTool, Inc.—Due to continued negative cash flows and the expected future returns on the invested capital employed, the Company decided to restructure its 100% subsidiary ASM NuTool. The Company will significantly reduce ASM NuTool to a small operation, focusing on process and intellectual property development with the intention of licensing these technologies in the future.
In connection with the restructuring of ASM NuTool, the Company has recorded impairment charges for goodwill and property, plant and equipment, the write-down of inventories and other current assets and the recognition of contractual purchase commitments as of December 31, 2005 in the amount of€ 36,834, net of taxes. Of these charges€ 36,228 is non cash and€ 606 is accrued for as of December 31, 2005 and expected to be paid in cash in 2006.
F-12
Table of Contents
The impairment charges for goodwill are the result of a comparison between the fair value of the goodwill with respect to ASM NuTool and the carrying amount of the goodwill. The fair value is estimated by management using a discounted cash flow technique of expected future returns of the licensing of intellectual property to third parties.
Upon completion of the restructuring in 2006 the Company expects to recognize additional charges for, amongst others, one-time employee termination benefits, the termination of operational lease obligations and settlement charges with former NuTool shareholders in the amount of approximately€ 5,500. The settlement charges are the outcome of a preliminary agreement with the former NuTool shareholders in connection with the potential satisfaction of financial performance targets and will be paid in common shares of the Company in the amount of approximately€ 3,100. The remainder of approximately€ 2,400 will be paid in cash.
The details of the charges for the year ended December 31, 2005 and the accrual at December 31, 2005 are as follows:
Cost of sales | Selling, general and administrative expenses | Research and | Impairment of goodwill | Income taxes | Total charges | Charges with no cash outflow | Accrual December 31, 2005 | ||||||||||
Impairment of goodwill | — | — | — | 30,994 | 30,994 | (30,994 | ) | — | |||||||||
Impairment of property, plant and equipment | — | — | 2,134 | — | 2,134 | (2,134 | ) | — | |||||||||
Write-down of inventories and other current assets | 1,326 | 127 | 1,006 | — | 641 | 3,100 | (3,100 | ) | — | ||||||||
Recognition of contractual purchase commitments | 606 | — | — | — | — | 606 | — | 606 | |||||||||
| 1,932 | 127 | 3,140 | 30,994 | 641 | 36,834 | (36,228 | ) | 606 | |||||||||
Reference is made to Note 9 and Note 10.
Consolidation of Platforms—In the fourth quarter of 2005 the Company implemented initiatives in its front-end segment to consolidate platforms the Company uses in its Capacitor Product group. The Company has recorded charges of€ 7,017 related to the impairment of property, plant and equipment, write-down of inventory and other current assets and the recognition of contractual purchase commitments. Of these charges€ 6,337 is non cash and€ 680 is accrued for as of December 31, 2005 and expected to be paid in cash in 2006.
The details of the charges for the year ended December 31, 2005 and the provision at December 31, 2005 are as follows:
Cost of sales | Research and | Total charges | Charges with no cash outflow | Accrual December 31, 2005 | |||||||
Impairment of property, plant and equipment | — | 3,308 | 3,308 | (3,308 | ) | — | |||||
Write-down of inventories and other current assets | 1,890 | 1,139 | 3,029 | (3,029 | ) | — | |||||
Recognition of contractual purchase commitments | 680 | — | 680 | — | 680 | ||||||
| 2,570 | 4,447 | 7,017 | (6,337 | ) | 680 | ||||||
Reference is made to Note 10.
Restructuring Plan 2003—In the second half of 2003 the Company implemented restructuring plans including work force reduction in its front-end segment. As part of these plans the Company restructured its research and development activities at ASM Microchemistry in Finland, consolidated production facilities of its operations at ASM Europe in the Netherlands and reduced work forces at other front-end segment subsidiaries. The restructuring has resulted in a reduction of the workforce in the second half of 2003. Total restructuring charges in 2003 were€ 6,478 covering employee termination benefits, termination of operational lease obligations and impairment of property, plant and equipment.
F-13
Table of Contents
The details of the restructuring charges for the year ended December 31, 2003 are as follows:
| Selling, general and administrative expenses | Research and | Total charges | Charges with no cash outflow | Charges paid in 2003 and 2004 | Released to selling, general and administrative expenses in 2004 | Accrual December | |||||||||||
Impairment of property, plant and equipment | 1,626 | 1,616 | 3,242 | (3,242 | ) | — | — | — | |||||||||
Employee termination benefits | 1,318 | 285 | 1,603 | — | (1,475 | ) | (128 | ) | — | ||||||||
Termination costs of operational lease obligations | 1,405 | — | 1,405 | — | (1,405 | ) | — | — | |||||||||
Other | 228 | — | 228 | — | (228 | ) | — | — | |||||||||
| 4,577 | 1,901 | 6,478 | (3,242 | ) | (3,108 | ) | (128 | ) | — | ||||||||
NOTE 3List of Significant Subsidiaries and Variable Interest Entities
Name | Location | % Ownership December 31, | ||||||
| 2004 | 2005 | |||||||
ASM Europe B.V.1 | Bilthoven, the Netherlands | 100.00 | % | 100.00 | % | |||
ASM United Kingdom Sales B.V.1 | Bilthoven, the Netherlands | 100.00 | % | 100.00 | % | |||
ASM Germany Sales B.V.1 | Bilthoven, the Netherlands | 100.00 | % | 100.00 | % | |||
Advanced Semiconductor Materials (Netherlands Antilles) N.V. |
Willemstad, Curacao, Netherlands Antilles | 100.00 | % | 100.00 | % | |||
ASM France S.A.R.L. | Montpellier, France | 100.00 | % | 100.00 | % | |||
ASM Belgium N.V. | Leuven, Belgium | 100.00 | % | 100.00 | % | |||
ASM Italia S.r.l. | Agrate, Italy | 100.00 | % | 100.00 | % | |||
ASM Microchemistry Oy | Helsinki, Finland | 100.00 | % | 100.00 | % | |||
ASM Support and Services Ireland Ltd. | Dublin, Ireland | 100.00 | % | 100.00 | % | |||
ASM America, Inc. | Phoenix, Arizona, United States | 100.00 | % | 100.00 | % | |||
ASM Japan K.K. | Tokyo, Japan | 100.00 | % | 100.00 | % | |||
ASM Wafer Process Equipment Ltd. | Quarry Bay, Hong Kong, People’s Republic of China | 100.00 | % | 100.00 | % | |||
ASM China Ltd. | Shanghai, People’s Republic of China | 100.00 | % | 100.00 | % | |||
ASM Wafer Process Equipment Singapore Pte Ltd. | Singapore | 100.00 | % | 100.00 | % | |||
ASM Far East Marketing Ltd. | Hsin-Chu, Taiwan | 100.00 | % | 100.00 | % | |||
ASM Front-End Sales & Services Taiwan Co., Ltd. | Hsin-Chu, Taiwan | — | 100.00 | % | ||||
ASM Korea Ltd. | SungNam-City, South Korea | 100.00 | % | 100.00 | % | |||
ASM Front-End Manufacturing Singapore Pte Ltd. | Singapore | 100.00 | % | 100.00 | % | |||
ASM NuTool, Inc. | Fremont, California, United States | 100.00 | % | 100.00 | % | |||
ASM Genitech, Inc. | Daedeoggu Daejon, South Korea | 100.00 | % | 100.00 | % | |||
NanoPhotonics AG | Mainz, Germany | 23.61 | % | 69.10 | % | |||
ASM Pacific Technology Ltd. | Kwai Chung, Hong Kong, People’s Republic of China | 53.84 | % | 53.59 | % | |||
ASM Assembly Automation Ltd.2 | Kwai Chung, Hong Kong, People’s Republic of China | 53.84 | % | 53.59 | % | |||
ASM Assembly Materials Ltd.2 | Kwai Chung, Hong Kong, People’s Republic of China | 53.84 | % | 53.59 | % | |||
ASM Technology Singapore Pte Ltd.2 | Singapore | 53.84 | % | 53.59 | % | |||
ASM Technology (M) Sdn. Bhd.2 | Johor Bahru, Malaysia | 53.84 | % | 53.59 | % | |||
ASM Semiconductor Materials (Shenzhen) Co. Ltd.2 | Shenzhen, People’s Republic of China | 53.84 | % | 53.59 | % | |||
Shenzhen ASM Micro Electronic Technology Co. Ltd.2 | Shenzhen, People’s Republic of China | 53.84 | % | 53.59 | % | |||
| (1) | For its subsidiaries ASM International N.V. has filed statements at the Dutch Chamber of Commerce assuming joint and several liability in accordance with Article 403 of Book 2, Part 9 of the Netherlands Civil Code. |
| (2) | 100% subsidiaries of ASM Pacific Technology Ltd. |
F-14
Table of Contents
The accounts of the above mentioned entities and of certain relative insignificant subsidiaries not mentioned above have been consolidated in the Consolidated Financial Statements.
NOTE 4Cash and Cash Equivalents, Marketable Securities
At December 31, 2005, cash and cash equivalents and marketable securities of the Company’s subsidiary ASMPT amounted to€ 79,671 and are restricted to use in the operations of ASMPT.
NOTE 5Accounts receivable
The changes in the allowance for doubtful accounts receivable are as follows:
Balance January 1, 2003 | (5,464 | ) | |
Charged to selling, general and administrative expenses | (1,651 | ) | |
Deductions | 820 | ||
Foreign currency translation effect | 708 | ||
Balance December 31, 2003 | (5,587 | ) | |
Charged to selling, general and administrative expenses | (1,433 | ) | |
Deductions | 1,006 | ||
Foreign currency translation effect | 305 | ||
Balance December 31, 2004 | (5,709 | ) | |
Charged to selling, general and administrative expenses | (999 | ) | |
Deductions | 654 | ||
Foreign currency translation effect | (639 | ) | |
Balance December 31, 2005 | (6,693 | ) | |
NOTE 6Inventories
Inventories consist of the following:
| December 31, | ||||||
| 2004 | 2005 | |||||
Components and raw materials | 73,907 | 93,611 | ||||
Work in process | 82,276 | 94,137 | ||||
Finished goods | 25,364 | 29,578 | ||||
Total inventories, gross | 181,547 | 217,326 | ||||
Allowance for obsolescence and lower market value | (24,588 | ) | (27,922 | ) | ||
Total inventories, net | 156,959 | 189,404 | ||||
NOTE 7Investments and Loan Advances
Investments and loan advances consist of the following:
| Investments | Loan advances | Total | |||||||
Balance January 1, 2004 | 11,184 | 2,375 | 13,559 | ||||||
Additions, net | — | 4,568 | 4,568 | ||||||
Loss on equity investments | (417 | ) | — | (417 | ) | ||||
Foreign currency translation effect | 328 | — | 328 | ||||||
Consolidation of acquired business and subsidiary | (11,095 | ) | (6,943 | ) | (18,038 | ) | |||
Balance December 31, 2004 | — | — | — | ||||||
On June 2, 2004 the Company acquired the remaining 84.3% interest in NuTool and as from June 2, 2004 the Company owns 100% of the outstanding capital stock of NuTool. As of June 2, 2004 NuTool has been consolidated in the Consolidated Financial Statements of the Company.
The investment in NanoPhotonics, which the Company acquired in 1999, is accounted for under the equity method through 2003. The total equity interest in NanoPhotonics as of December 31, 2003 was 23.61%. As of December 31, 2003, the Company has provided loan advances to NanoPhotonics totaling€ 4,443. Due to the negative equity balances of NanoPhotonics, the investment and loan advances to NanoPhotonics are valued at zero as of December 31 2003. As of December 31, 2004, the accounts of NanoPhotonics have been included in the Consolidated Financial Statements of the Company.
F-15
Table of Contents
NOTE 8Purchased Technology and Other Intangible Assets
The changes in the amount of purchased technology and other intangible assets are as follows:
At cost: | |||
Balance January 1, 2004 | — | ||
Acquisition of businesses | 10,231 | ||
Other additions | 776 | ||
Foreign currency translation effect | (892 | ) | |
Balance December 31, 2004 | 10,115 | ||
Additions | 732 | ||
Foreign currency translation effect | 1,676 | ||
Balance December 31, 2005 | 12,523 | ||
Accumulated amortization: | |||
Balance January 1, 2004 | — | ||
Amortization for the year | 1,389 | ||
Foreign currency translation effect | (107 | ) | |
Balance December 31, 2004 | 1,282 | ||
Amortization for the year | 1,748 | ||
Foreign currency translation effect | 316 | ||
Balance December 31, 2005 | 3,346 | ||
Purchased technology and other intangible assets, net: | |||
December 31, 2004 | 8,833 | ||
December 31, 2005 | 9,177 | ||
The acquisition of businesses relates to purchased technology and other intangible assets, including trademarks, tradenames, in-process research and development and non-compete agreements resulting from the acquisitions of NuTool and Genitech. The in-process research and development intangibles acquired in 2004 in the amount of€ 520 have been amortized in full in 2004 subsequent to the acquisitions. Other additions relate to purchased technology from third parties and computer software developed or purchased for internal use.
Purchased technology and other intangible assets are amortized over useful lives of 3 to 7 years.
Estimated amortization expenses relating to purchased technology and other intangible assets are as follows:
2006 | 1,860 | |
2007 | 1,788 | |
2008 | 1,725 | |
2009 | 1,613 | |
2010 | 1,522 | |
2011 | 669 | |
| 9,177 | ||
NOTE 9Goodwill
The changes in the carrying amount of goodwill are as follows:
Balance January 1, 2004 | 45,937 | ||
Additions: | |||
ASM NuTool, Inc. | 42,022 | ||
Genitech, Inc. | 6,917 | ||
ASM Pacific Technology Ltd. | 1,922 | ||
Foreign currency translation effect | (7,489 | ) | |
Balance December 31, 2004 | 89,309 | ||
Addition: | |||
NanoPhotonics AG | 1,101 | ||
Impairment charge: | |||
ASM NuTool, Inc. | (30,994 | ) | |
Foreign currency translation effect | 13,593 | ||
Balance December 31, 2005 | 73,009 | ||
F-16
Table of Contents
The allocation of the carrying amount of goodwill is as follows:
| December 31, | ||||
| 2004 | 2005 | |||
Front-end segment: | ||||
ASM Microchemistry Oy | 3,560 | 3,560 | ||
NanoPhotonics AG | 328 | 1,429 | ||
ASM NuTool, Inc. | 37,793 | 12,715 | ||
Genitech Inc. | 6,917 | 8,300 | ||
Back-end segment: | ||||
ASM Pacific Technology Ltd. | 40,711 | 47,005 | ||
Total | 89,309 | 73,009 | ||
NanoPhotonics AG—In 1999, the Company acquired a 24.0% interest in NanoPhotonics AG, a German supplier of precision thin film metrology equipment, for€ 407. In 1999, the Company’s Chief Executive Officer also purchased a 44.5% interest in NanoPhotonics. Due to the issuance of new shares by NanoPhotonics to third parties in 2003, the Company’s interest diluted to 23.61% and the Chief Executive Officer’s interest diluted to 43.77%. In 2004 the Chief Executive Officer purchased an additional 1.72% interest in NanoPhotonics from another shareholder. For all the shares purchased by the Chief Executive Officer, the Company and the Chief Executive Officer agreed that the Company could purchase such shares at the same price the officer paid to acquire the shares. The Company exercised this option in December 2005 for a total consideration of€ 1,101. The acquisition was accounted for using the purchase method. Of the purchase price the Company estimated that no amounts could be allocated to identifiable net assets and the entire consideration has been recorded as goodwill. At December 31, 2005 the Company holds a 69.10 % interest in NanoPhotonics.
ASM NuTool, Inc.—On June 2, 2004 the Company acquired the remaining 84.3% interest in NuTool and as from June 2, 2004 the Company owns 100% of the outstanding capital stock of NuTool. The Company purchased the 84.3% interest in exchange for 1,962,282 common shares of the Company, replacement employee stock options to acquire 57,720 common shares of the Company and the possible future issuance of up to 806,376 additional common shares if certain financial performance targets are satisfied at various times during the period ending December 31, 2006. The Company’s Chief Executive Officer owned 127,879 shares of NuTool’s Series D Preferred Stock prior to the acquisition of the remaining 84.3% interest. In consideration for his ownership of NuTool stock, the Company’s Chief Executive Officer received 22,586 common shares of the Company. The total consideration for the 84.3% interest, including expenses, amounted to€ 35,063, excluding the value of common shares that may be issued in the future based on certain financial performance targets. The other 15.7% interest in NuTool was acquired by the Company in two transactions in December 2001 and April 2003 for a total consideration of€ 21,507 at the time of the purchase.
As of June 2, 2004 the assets and liabilities of NuTool have been consolidated in the Consolidated Financial Statements of the Company using the purchase method of accounting. The excess of the purchase price of the 84.3% interest in NuTool and the carrying value of the 15.7% interest in NuTool on June 2, 2004 over the fair market value of the identifiable net assets has been recorded as goodwill and can be specified as follows:
Purchase price 84.3% interest | 35,063 | ||
Carrying value 15.7% interest | 11,095 | ||
| 46,158 | |||
Fair value of identifiable net assets: | |||
Tangible fixed assets | 2,005 | ||
Purchased technology and other intangible assets | 8,023 | ||
Other assets and liabilities | (6,546 | ) | |
Cash and cash equivalents | 654 | ||
| 4,136 | |||
Goodwill acquired | 42,022 | ||
In 2005 the Company recorded an impairment charge for goodwill of€ 30,994 with respect to ASM NuTool. Reference is made to Note 2.
F-17
Table of Contents
In January 2006, the Company reached a settlement in its dispute with former NuTool shareholders regarding the number of additional common shares of the Company to be issued in connection with the potential satisfaction of financial performance targets following the 2004 acquisition of NuTool. Subject to the execution of final agreements, it is expected that approximately 250,000 common shares of the Company will be issued in 2006 and 2007, of which 56,259 will be issued only upon achievement of certain specified milestones for the licensing of ASM NuTool technology to third parties prior to September 2, 2007.
Genitech Inc.—On August 5, 2004, the Company acquired 100% of the common shares in Genitech in exchange for 247,638 common shares of the Company,€ 4,640 in cash and the possible future variable cash payments of up to US$ 9,200 if certain financial performance targets are satisfied at various times during the period ending December 31, 2009. The total consideration at the date of the acquisition, including expenses, amounted to€ 7,939, excluding variable cash payments that may be payable in the future based on certain financial performance targets.
As of August 5, 2004, the assets and liabilities of Genitech have been consolidated in the Consolidated Financial Statements of the Company using the purchase method of accounting. The excess of the purchase price over the fair market value of the identifiable net assets has been recorded as goodwill and can be specified as follows:
Purchase price | 7,939 | ||
Fair value of identifiable net assets: | |||
Tangible fixed assets | 642 | ||
Purchased technology and other intangible assets | 2,208 | ||
Other assets and liabilities | 1,079 | ||
Notes payable to banks and long-term debt | (2,989 | ) | |
Cash and cash equivalents | 82 | ||
| 1,022 | |||
Goodwill acquired | 6,917 | ||
ASM Pacific Technology Ltd.—In the second quarter of 2004 the Company’s subsidiary ASMPT repurchased 0.40% of its outstanding common shares in the open market for€ 4,465 (HK$ 42.5 million). The acquisition of these common shares was accounted for using the purchase method and the excess of the purchase price over the fair market value of the identifiable net assets acquired has been recorded as goodwill.
F-18
Table of Contents
NOTE 10Property, Plant and Equipment
The changes in the amount of property, plant and equipment are as follows:
| Land, buildings and leasehold improvements | Machinery, equipment, furniture and fixtures | Total | |||||||
At cost: | |||||||||
Balance January 1, 2004 | 77,325 | 239,080 | 316,405 | ||||||
Capital expenditures | 18,823 | 39,328 | 58,151 | ||||||
Acquisition of businesses | 483 | 2,164 | 2,647 | ||||||
Consolidation of subsidiary | — | 542 | 542 | ||||||
Retirements and sales | (806 | ) | (16,075 | ) | (16,881 | ) | |||
Foreign currency translation effect | (4,184 | ) | (16,804 | ) | (20,988 | ) | |||
Balance December 31, 2004 | 91,641 | 248,235 | 339,876 | ||||||
Capital expenditures | 6,495 | 39,556 | 46,051 | ||||||
Impairment charges | (117 | ) | (5,325 | ) | (5,442 | ) | |||
Retirements and sales | (228 | ) | (9,301 | ) | (9,529 | ) | |||
Foreign currency translation effect | 9,435 | 29,875 | 39,310 | ||||||
Balance December 31, 2005 | 107,226 | 303,040 | 410,266 | ||||||
Accumulated depreciation: | |||||||||
Balance January 1, 2004 | 42,120 | 144,050 | 186,170 | ||||||
Depreciation for the year | 4,162 | 31,147 | 35,309 | ||||||
Retirements and sales | (477 | ) | (11,660 | ) | (12,137 | ) | |||
Foreign currency translation effect | (2,244 | ) | (9,918 | ) | (12,162 | ) | |||
Balance December 31, 2004 | 43,561 | 153,619 | 197,180 | ||||||
Depreciation for the year | 6,096 | 29,910 | 36,006 | ||||||
Retirements and sales | (221 | ) | (8,395 | ) | (8,616 | ) | |||
Foreign currency translation effect | 4,167 | 18,186 | 22,353 | ||||||
Balance December 31, 2005 | 53,603 | 193,320 | 246,923 | ||||||
Property, plant and equipment, net: | |||||||||
December 31, 2004 | 48,080 | 94,616 | 142,696 | ||||||
December 31, 2005 | 53,623 | 109,720 | 163,343 | ||||||
Useful lives in years: | - Buildings and leasehold improvements | 10-25 | ||||
| - Machinery and equipment | 2-10 | |||||
| - Furniture and fixtures | 2-10 |
With respect to impairment charges, reference is made to Note 2.
Subsidiaries of ASMI in Japan, Singapore and South Korea have pledged real estate and other assets with a carrying value of€ 33,834 to secure loan facilities outstanding in Japan, Singapore and South Korea.
NOTE 11Notes Payable to Banks
Information on notes payable to banks is as follows:
Short-term debt outstanding in: | December 31, | |||
| 2004 | 2005 | |||
Germany | 33 | — | ||
Japan | 22,896 | 20,016 | ||
Singapore | 450 | 995 | ||
Hong Kong | — | 50 | ||
| 23,379 | 21,061 | |||
F-19
Table of Contents
Short-term debt outstanding in local currencies is as follows (in thousands):
| December 31, | ||||
| 2004 | 2005 | |||
Euro | 33 | — | ||
Japanese yen | 3,180,000 | 2,780,000 | ||
Singapore dollar | 1,000 | 1,950 | ||
Hong Kong dollar | — | 462 | ||
Short-term debt outstanding in Japan in the amount of€ 20,016 is collateralized by real estate of the subsidiary of ASMI in Japan.
ASMI and its individual subsidiaries borrow under separate short-term lines of credit with banks in the countries where they are located. The lines contain general provisions concerning renewal and continuance at the option of the banks. The weighted average interest rate of the outstanding notes payable was 1.57% at December 31, 2005.
Total short-term lines of credit amounted to€ 96,541 at December 31, 2005. The amount outstanding at December 31, 2005 was€ 21,061 and the undrawn portion totaled€ 75,480. The undrawn portion includes€ 37,147 relating to ASMPT, in which the Company holds a 53.59% interest, and such amount is limited solely for use in the operations of ASMPT. ASM Japan had€ 38,016 available for borrowings under its bank lines, which are restricted for use in the ASM Japan operations.
ASMI is guarantor with respect to short-term debt outstanding in Japan and Singapore. ASMI does not provide guarantees for borrowings of ASMPT and there are no guarantees from ASMPT to secure indebtedness of ASMI. Under the rules of the Stock Exchange of Hong Kong, ASMPT is precluded from providing loans and advances other than trade receivables in the normal course of business, to ASMI or its non ASMPT subsidiaries.
NOTE 12Accrued Expenses and Other
Accrued expenses and other consists of the following:
| December 31, | ||||
| 2004 | 2005 | |||
Advance payments from customers | 7,189 | 7,943 | ||
Deferred revenue | 13,397 | 9,862 | ||
Warranty reserves | 17,139 | 19,389 | ||
Personnel related items | 29,179 | 25,859 | ||
Other | 21,438 | 31,651 | ||
| 88,342 | 94,704 | |||
The changes in the amount of warranty reserves are as follows:
Balance January 1, 2004 | 13,465 | ||
Additions | 9,511 | ||
Consolidation of acquired business | 191 | ||
Usage | (5,501 | ) | |
Foreign currency translation effect | (527 | ) | |
Balance December 31, 2004 | 17,139 | ||
Additions | 8,289 | ||
Usage | �� | (6,926 | ) |
Foreign currency translation effect | 887 | ||
Balance December 31, 2005 | 19,389 | ||
F-20
Table of Contents
NOTE 13Long-term Debt
Long-term debt consists of the following:
| December 31, | ||||||
| 2004 | 2005 | |||||
Term loans: | ||||||
Japan, 0.5-3.3%, due 2006 – 2010 | 13,205 | 20,952 | ||||
Finland, 1.0-3.0%, due 2006 – 2010 | 2,580 | 1,964 | ||||
Singapore, 4.6-4.7%, due 2008 – 2011 | 4,094 | 5,085 | ||||
South Korea, 2.8-6.0%, due 2006 – 2008 | 1,881 | 1,067 | ||||
Germany, 5.0-7.5%, due 2007 – 2010 | 1,748 | 1,748 | ||||
Mortgage loans: | ||||||
Japan, 2.6%, due 2006 | 467 | 112 | ||||
Capital lease commitments: | ||||||
United States, 7.9-8.0%, due 2006 – 2007 | 888 | 621 | ||||
Japan, 1.8%, due 2007 – 2010 | 157 | 1,342 | ||||
| 25,020 | 32,891 | |||||
Current portion | (7,883 | ) | (7,150 | ) | ||
| 17,137 | 25,741 | |||||
Long-term debt, including the current portion, in local currencies is as follows (in thousands):
| December 31, | ||||
| 2004 | 2005 | |||
Euro | 4,328 | 3,712 | ||
United States dollars | 1,209 | 734 | ||
Japanese yen | 1,920,715 | 3,111,911 | ||
Singapore dollars | 9,100 | 9,970 | ||
Korean won | 2,686,900 | 1,270,000 | ||
Aggregate annual principal repayments for years subsequent to December 31, 2005 are:
2006 | 7,150 | |
2007 | 6,792 | |
2008 | 14,220 | |
2009 | 1,910 | |
2010 | 2,524 | |
Years thereafter | 295 | |
| 32,891 | ||
Long-term debt outstanding in Japan, Singapore and South Korea in the amount of€ 26,535 is collateralized by real estate and other assets of the respective subsidiaries of ASMI in Japan, Singapore and South Korea. ASMI is guarantor with respect to long-term debt outstanding in Japan and Singapore.
Capital lease commitments relate to commitments for equipment and machines.
NOTE 14Convertible Subordinated Debt
Convertible subordinated debt consists of the following:
| December 31, | |||||
| 2004 | 2005 | ||||
5.00% convertible subordinated notes, due 2005, US$ 98.9 million | 72,646 | — | |||
5.25% convertible subordinated notes, due 2010, US$ 90.0 million | 66,078 | 76,293 | |||
4.25% convertible subordinated notes, due 2011, US$ 150.0 million | 110,130 | 127,155 | |||
| 248,854 | 203,448 | ||||
Current portion | (72,646 | ) | — | ||
| 176,208 | 203,448 | ||||
F-21
Table of Contents
In November and December 2001, ASMI issued US$ 115.0 million in principal amount of 5.0% convertible subordinated notes due November 15, 2005 in a private offering. In December 2004, US$ 16.1 million of the US$ 115.0 million convertible subordinated notes has been repurchased and as a result US$ 98.9 million remains outstanding at December 31, 2004. The US$ 16.1 million has been repurchased for a market value of US$ 17.5 million. The loss for the early extinguishment of the notes of€ 1,206, which includes the premium paid above par and the write-off of unamortized issuance costs, has been recorded as interest expense in the Consolidated Statement of Operations for the year 2004. In January 2005, US$ 4.6 million has been repurchased for a market value of US$ 5.0 million. The loss for the early extinguishment of the notes of€ 319, which includes the premium paid above par and the write-off of unamortized issuance costs, has been recorded as interest expense in the Consolidated Statement of Operations for the year 2005. In November 2005, the remaining outstanding balance was repaid by the Company, at nominal value.
In May 2003, ASMI issued US$ 90.0 million in principal amount of 5.25% convertible subordinated notes due in May 2010 in a private offering. Interest on the notes is payable on May 15 and November 15 of each year. The notes are subordinated in right of payment to all of the Company’s existing and future senior indebtedness. The notes are convertible, at the option of the holder, into shares of the Company’s common stock initially at a conversion rate of 52.0237 shares of common stock for each US$ 1,000 principal amount of notes, subject to adjustment in certain circumstances. This is equivalent to an initial conversion price of US$ 19.22 per share. On or after May 20, 2006, the Company may redeem any of the notes at a redemption price equal to 100% of the principal amount of the notes being redeemed, plus accrued and unpaid interest, if the closing price of the Company’s common shares has exceeded 150% of the conversion price for at least 20 trading days in any period of 30 consecutive trading days and if certain other conditions are satisfied. In the event of a change in control, the Company may be required to repurchase the notes. At December 31, 2005, none of the US$ 90.0 million convertible subordinated notes have been converted or repurchased.
In December 2004, ASMI issued US$ 150.0 million in principal amount of 4.25% convertible subordinated notes due in December 2011 in a private offering. Interest on the notes is payable on June 6 and December 6 of each year. The notes are subordinated in right of payment to all of the Company’s existing and future senior indebtedness. The notes are convertible, at the option of the holder, into shares of the Company’s common stock initially at a conversion rate of 48.0307 shares of common stock for each US$ 1,000 principal amount of notes, subject to adjustment in certain circumstances. This is equivalent to an initial conversion price of US$ 20.82 per share. On or after December 6, 2007, the Company may redeem any of the notes at a redemption price equal to 100% of the principal amount of the notes being redeemed, plus accrued and unpaid interest, if the closing price of the Company’s common shares has exceeded 130% of the conversion price for at least 20 trading days in any period of 30 consecutive trading days. In the event of a change in control, the Company may be required to repurchase the notes. At December 31, 2005, none of the US$ 150.0 million convertible subordinated notes have been converted or repurchased.
The US$ 150.0 million 4.25% convertible subordinated notes rank pari passu with the US$ 90.0 million convertible subordinated notes.
Except for repurchasing US$ 4.6 million of the US$ 115.0 million convertible subordinated notes and repayment of the remaining US$ 94.3 million of the US$ 115.0 million convertible subordinated notes, movements in the balance of the outstanding subordinated debt in the year ended December 31, 2005 relate to the translation of the outstanding amounts in U.S. dollars to euros.
The fees incurred for the issuance of the convertible subordinated notes are included as debt issuance costs in the Consolidated Balance Sheet and amortized by the interest method as interest cost during the life of the debts. Debt issuance costs of€ 960 are expected to be amortized in 2006.
NOTE 15Shareholders’ Equity
Common shares
The authorized capital of the Company amounts to 110,000,000 shares of€ 0.04 par value common shares, 118,000 shares of€ 40 par value preferred shares and 8,000 shares of€ 40 par value financing preferred shares, of which 52,678,952 common shares and no preferred or financing preferred shares were outstanding as at December 31, 2005. There are currently no preferred or financing preferred shares issued. All shares have one vote per€ 0.04 par value, except for shares the Company and its subsidiaries own, which have no voting rights.
Financing preferred shares
Financing preferred shares are designed to allow ASMI to finance equity with an instrument paying a preferred dividend, linked to EURIBOR loans and government loans, without the dilutive effects of issuing
F-22
Table of Contents
additional common shares. Preferred and financing preferred shares are issued in registered form only and are subject to transfer restrictions. Essentially, a preferred or financing preferred shareholder must obtain the approval of the Company’s Supervisory Board to transfer shares. If the approval is denied, the Supervisory Board will provide a list of acceptable prospective buyers who are willing to purchase the shares at a cash price to be fixed by consent of the Supervisory Board and seller within two months after the approval is denied. If the transfer is approved, the shareholder must complete the transfer within three months, at which time the approval expires.
Financing preferred shares are entitled to a cumulative dividend based on the par value and share premium paid on such shares.
Preferred shares
Preferred shares carry the right to a cumulative preferred dividend.
Warrants
In conjunction with US$ 20.0 million five-year zero-bond debentures issued on October 1, 1999, the Company issued 200,000 warrants on common shares of the Company at a price of US$ 9.81 per share, a premium to market at the date of issuance of 20.0%. These 200,000 warrants were exercised in 2004.
Retained earnings
Dividends distributable to common shareholders are limited to retained earnings of ASMI decreased by legal reserves of€ 119,132, which must be maintained. At December 31, 2005, ASMI had no distributable retained earnings.
The changes in the amount of legal reserves are as follows:
Balance January 1, 2004 | 85,375 | ||
Increase retained earnings subsidiaries | 13,040 | ||
Foreign currency translation effect | (6,228 | ) | |
Balance December 31, 2004 | 92,187 | ||
Increase retained earnings subsidiaries | 12,830 | ||
Foreign currency translation effect | 14,115 | ||
Balance December 31, 2005 | 119,132 | ||
Accumulated other comprehensive loss
The changes in the amount of accumulated other comprehensive loss are as follows:
| Foreign currency translation effects | Unrealized gains (losses) on derivative instruments, net | Total | |||||||
Balance January 1, 2004 | (57,459 | ) | 352 | (57,107 | ) | ||||
Foreign currency translation effect on translation of foreign operations | (14,217 | ) | (14,217 | ) | |||||
Increase in fair value of derivative instruments | — | 2,219 | 2,219 | ||||||
Transfer to Consolidated Statement of Operations of derivative instruments | — | (676 | ) | (676 | ) | ||||
Balance December 31, 2004 | (71,676 | ) | 1,895 | (69,781 | ) | ||||
Foreign currency translation effect on translation of foreign operations | 23,638 | — | 23,638 | ||||||
Decrease in fair value of derivative instruments | — | (3,328 | ) | (3,328 | ) | ||||
Transfer to Consolidated Statement of Operations of derivative instruments | — | 1,065 | 1,065 | ||||||
Balance December 31, 2005 | (48,038 | ) | (368 | ) | (48,406 | ) | |||
F-23
Table of Contents
NOTE 16Employee Benefits
Pension plans
The Company has retirement plans covering substantially all employees. The principal plans are defined contribution plans, except for the plans of the Company’s operations in the Netherlands and Japan. The plan in the Netherlands is a multi-employer plan. The plan in Japan is a defined benefit plan. The Company has no major continuing obligations other than the payment of annual contributions.
Retirement plan contributions consist of the following:
| Year ended December 31, | ||||||
| 2003 | 2004 | 2005 | ||||
Defined contribution plans | 5,615 | 5,531 | 6,191 | |||
Multi-employer plans | 1,752 | 1,770 | 2,076 | |||
Defined benefit plans | 378 | 510 | 287 | |||
Total retirement plan contributions | 7,745 | 7,811 | 8,554 | |||
The Company does not provide for any post retirement benefits other than pensions.
Employee Stock Option Plan
The Company has adopted various stock option plans and has entered into stock option agreements with various key management personnel. Under these plans, key employees may purchase a specific number of shares of the Company’s common stock. Options are priced at market value in euros or U.S. dollars on the date of grant, are generally vesting in equal parts over a period of five years and generally expire after five or ten years. Under the 2001 Stock Option Plan the Company is authorized to issue 4,000,000 shares. At December 31, 2005, options to purchase 1,772,920 shares have been issued under the 2001 Stock Option Plan. Under previous plans no more options to purchase shares can be issued. Under the various stock option plans a total of 1,874,612 options to purchase common stock were outstanding at December 31, 2005, expiring at various dates through 2015.
The following is a summary of changes in options outstanding:
| Number of options | Weighted average exercise | Number of options | Weighted average exercise | |||||||
Balance January 1, 2003 | 1,530,620 | 12.61 | 605,649 | 12.53 | ||||||
Options granted | 197,500 | 7.99 | 10,000 | 14.35 | ||||||
Options forfeited | (17,116 | ) | 21.32 | (9,667 | ) | 15.39 | ||||
Options exercised | (569,439 | ) | 6.30 | (121,900 | ) | 7.67 | ||||
Balance December 31, 2003 | 1,141,565 | 14.84 | 484,082 | 13.69 | ||||||
Options granted | 275,700 | 20.21 | 71,000 | 14.36 | ||||||
Replacement options granted for acquired business | 57,720 | 5.45 | — | — | ||||||
Options forfeited | (17,110 | ) | 14.60 | (27,916 | ) | 18.28 | ||||
Options exercised | (95,935 | ) | 10.88 | (50,450 | ) | 8.24 | ||||
Balance December 31, 2004 | 1,361,940 | 15.81 | 476,716 | 14.13 | ||||||
Options granted | 63,000 | 15.91 | 165,000 | 13.02 | ||||||
Options forfeited | (44,794 | ) | 20.78 | (86,250 | ) | 12.77 | ||||
Options exercised | (11,000 | ) | 10.10 | (50,000 | ) | 11.41 | ||||
Balance December 31, 2005 | 1,369,146 | 15.70 | 505,466 | 14.26 | ||||||
F-24
Table of Contents
The weighted average remaining contractual life of the outstanding options granted in 2005 is 6.19 years at December 31, 2005. The number of options exercisable at December 31, 2003 and 2004 were 854,518 and 1,046,059 respectively. At December 31, 2005 options outstanding and options exercisable classified by range of exercise price were:
| Options outstanding | Options exercisable | |||||||||
Range of exercise prices | Number outstanding | Weighted average remaining | Weighted average exercise price | Number exercisable | Weighted average exercise price | |||||
| In US$ | In years | In US$ | In US$ | |||||||
1.00-10.00 | 128,871 | 2.29 | 6.26 | 128,871 | 6.26 | |||||
10.00-15.00 | 256,222 | 6.49 | 12.14 | 153,296 | 11.31 | |||||
15.00-20.00 | 820,313 | 1.66 | 16.98 | 666,417 | 16.72 | |||||
20.00-30.00 | 163,740 | 4.31 | 22.25 | 53,948 | 23.33 | |||||
1.00-30.00 | 1,369,146 | 2.95 | 15.70 | 1,002,532 | 14.91 | |||||
| In€ | In years | In€ | In€ | |||||||
6.00-10.00 | 4,000 | 3.67 | 6.90 | 4.000 | 6.90 | |||||
10.00-15.00 | 296,000 | 4.24 | 12.52 | 93.200 | 11.73 | |||||
15.00-20.00 | 200,466 | 1.56 | 16.84 | 134.783 | 16.77 | |||||
20.00-30.00 | 5,000 | 1.20 | 20.00 | 4.000 | 20.00 | |||||
6.00-30.00 | 505,466 | 3.17 | 14.26 | 235,983 | 14.67 | |||||
In 2004 the Company granted stock options to acquire 8,000 common shares of the Company to an individual who did not meet the definition of an employee. Accordingly, the Company has recognized compensation expenses of€ 70, based on the fair value of the options granted.
The Company purchased the remaining 84.3% interest in NuTool in 2004. Included in the consideration were replacement employee stock options to acquire 57,720 common shares of the Company. The Company has recognized compensation expenses of€ 71 and€ 66 in 2004 and 2005 respectively, based on the fair value of the replacement employee stock options that vested subsequent to the acquisition.
Employee Share Incentive Scheme ASMPT
In 1989, the shareholders of ASMPT approved a plan to issue up to 5.0 percent of the total issued shares of ASMPT to directors and employees. This plan has been extended in 1999 for a term up to March 23, 2012. The directors annually may approve an amount of supplemental compensation to the designated directors and officers, which will be used to issue or purchase ASMPT’s common shares for the designees at current market value. In December 2005, 1,791,000 common shares of ASMPT were issued, for cash at par value of HK$ 0.10 per share, pursuant to the Employee Share Incentive Scheme of ASMPT. In 2004 and 2003, respectively 1,798,500 and 1,686,500 ASMPT shares were issued to certain directors and employees under the plan. The effect of this transaction on ASMI was a dilution of its ownership interest in ASMPT of 0.25% in 2005, 0.25% in 2004, and 0.24% in 2003. The shares issued under the plan in 2005 have diluted ASMI’s ownership in ASMPT to 53.59% as of December 31, 2005. In 2005 ASMI revised its assessment of the compensation expense related to the Employee Share Incentive Scheme which impacted ASMI’s Consolidated Statement of Operations for the year ended December 31, 2005 positively by€ 2,588. Total compensation expenses related to the Employee Share Incentive Scheme of respectively€ 6,391 in 2003,€ 4,851 in 2004, and€ 6,242 in 2005 were charged to the Consolidated Statement of Operations.
The dilution in ownership has resulted in a gain on the investment in ASMPT of€ 941 in 2003,€ 2,656 in 2004, and€ 2,781 in 2005, which gain has been separately included in the Consolidated Statement of Operations. Due to the participation exemption in the Netherlands no deferred income taxes have been provided for these gains.
NOTE 17Commitments and Contingencies
Capital leases included in property, plant and equipment are as follows:
| December 31, | ||||||
| 2004 | 2005 | |||||
Machinery and equipment | 3,053 | 3,619 | ||||
Furniture and fixtures | 19 | 38 | ||||
| 3,072 | 3,657 | |||||
Less accumulated depreciation | (2,668 | ) | (1,662 | ) | ||
| 404 | 1,995 | |||||
F-25
Table of Contents
The Company leases certain office and plant facilities and equipment under various operating lease arrangements. Original non-cancelable lease terms typically are between 1 and 15 years.
At December 31, 2005 minimum rental commitments under capital leases and operating leases having initial or remaining non-cancelable terms in excess of one year are as follows:
| Capital leases | Operating leases | ||||
2006 | 973 | 7,614 | |||
2007 | 645 | 6,402 | |||
2008 | 348 | 4,797 | |||
2009 | 138 | 4,242 | |||
2010 | 4 | 2,225 | |||
Years thereafter | — | 8,630 | |||
Total | 2,108 | 33,910 | |||
Less amount representing interest | (145 | ) | |||
Present value of net minimum lease payments | 1,963 | ||||
Aggregate rental expense for operating leases was€ 10,151 in 2003,€ 8,868 in 2004 and€ 8,692 in 2005. At December 31, 2005 the Company had entered into purchase commitments with suppliers in the amount of€ 84,315 for purchases, of which€ 83,639 for purchases within the next 12 months. Commitments for capital expenditures at December 31, 2005 were€ 3,764.
Change of Control Transaction
If the Company desires to effect a change of control transaction with a competitor of Applied Materials, Inc., (“Applied Materials”) the Company must, pursuant to a litigation settlement agreement in 1997, first offer the change of control transaction to Applied Materials on the same terms as the Company would be willing to accept from that competitor pursuant to a bona fide arm’s-length offer by that competitor.
NOTE 18Litigation and Environmental Matters
The Company is party to various legal proceedings generally incidental to its business and is subject to a variety of environmental and pollution control laws and regulations. As is the case with other companies in similar industries, the Company faces exposure from actual or potential claims and legal proceedings. Although the ultimate disposition of legal proceedings cannot be predicted with certainty, it is the opinion of the Company’s management that the outcome of any claim which is pending or threatened, either individually or on a combined basis, will not have a materially adverse effect on the financial position of the Company, but could materially affect the Company’s results of operations in a given year.
NOTE 19Financial Instruments and Risk Management
Derivatives
The Company uses forward exchange contracts to hedge certain operational cash flow exposures resulting from changes in foreign currency exchange rates to occur within the next twelve months. The Company enters into these foreign exchange contracts to hedge anticipated sales or purchase transactions in the normal course of business for which the Company has a firm commitment from a customer or to a supplier. The terms of these contracts are consistent with the timing of the transactions being hedged. The Company does not use such instruments for trading or speculative purposes.
Furthermore, the Company continues to manage the currency exposure of certain receivables and payables using derivative instruments, such as forward exchange contracts and currency swaps, and non-derivative instruments, such as debt borrowings in foreign currencies. The gains or losses on these instruments provide an offset to the gains or losses recorded on the foreign currency receivables and payables. The derivative instruments are recorded at fair value and changes in fair value are recorded in earnings under foreign currency transaction gains (losses) on the Consolidated Statement of Operations.
The Company expects that substantially all of the€ 368 unrealized losses included in accumulated other comprehensive income as of December 31, 2005 will be reclassified to net earnings within the next 12 months upon completion of the underlying transaction. Unrealized gains included in other comprehensive income as of December 31, 2004 of€ 1,895 were reclassified to earnings in 2005. Hedge ineffectiveness was insignificant for the years ended December 31, 2004 and December 31, 2005.
F-26
Table of Contents
The outstanding currency forward exchange contracts are as follows:
| Currency | Notional amount | Forward contract value | Fair value | Difference between forward value and fair value | Included in accumulated other comprehensive income (loss) | ||||||||||||
| Euro | Euro | Euro | Euro | ||||||||||||||
December 31, 2004: | |||||||||||||||||
Assets: | |||||||||||||||||
Cash flow hedges: | |||||||||||||||||
Short position | US$ | (41,729 | ) | (32,981 | ) | (30,637 | ) | 2,344 | 2,344 | ||||||||
Other foreign currency contracts: | |||||||||||||||||
Long position | Euro | 1,592 | 1,580 | 1,592 | 12 | — | |||||||||||
Short position | US$ | (22,368 | ) | (18,345 | ) | (16,425 | ) | 1,920 | — | ||||||||
Liabilities: | |||||||||||||||||
Cash flow hedges: | |||||||||||||||||
Long position | US$ | 6,851 | 5,479 | 5,030 | (449 | ) | (449 | ) | |||||||||
Other foreign currency contracts: | |||||||||||||||||
Long position | US$ | 8,575 | 6,430 | 6,295 | (135 | ) | — | ||||||||||
Short position | Euro | (1,990 | ) | (1,919 | ) | (1,990 | ) | (71 | ) | — | |||||||
December 31, 2005: | |||||||||||||||||
Assets: | |||||||||||||||||
Cash flow hedges: | |||||||||||||||||
Short position | US$ | (18,675 | ) | (15,271 | ) | (15,676 | ) | (405 | ) | (368 | ) | ||||||
Other foreign currency contracts: | |||||||||||||||||
Short position | US$ | (27,199 | ) | (21,839 | ) | (23,011 | ) | (1,172 | ) | — | |||||||
Liabilities: | |||||||||||||||||
Cash flow hedges: | |||||||||||||||||
Long position | US$ | 130 | 109 | 109 | — | — | |||||||||||
Other foreign currency contracts: | |||||||||||||||||
Long position | US$ | 16,551 | 13,944 | 14,029 | 85 | — | |||||||||||
Long-term Debt and Subordinated Debt
At December 31, 2005 the Company had convertible subordinated debt borrowings outstanding of€ 76,293 at a fixed interest rate, maturing in May 2010 and€ 127,155 at a fixed interest rate, maturing in December 2011 and€ 25,741 in long-term debt at fixed interest rates and€ 21,061 in other borrowings with variable short-term interest rates. The Company is exposed to interest rate risk primarily through its borrowing activities. The Company does not enter into financial instrument transactions for trading or speculative purposes or to manage interest rate exposure.
The fair value amounts of long-term debt and convertible subordinated debt are as follows:
| 2004 | 2005 | |||||||
| Carrying amount | Fair value | Carrying amount | Fair Value | |||||
Long-term debt, including current portion | 25,020 | 25,020 | 32,891 | 32,891 | ||||
Convertible subordinated debt | 248,854 | 272,060 | 203,448 | 205,089 | ||||
Methods and Assumptions Used in Estimating Fair Value Disclosure for Financial Instruments
For cash and cash equivalents, marketable securities, accounts receivable, notes payable to banks, accounts payable and accrued expenses, the carrying amounts approximate fair value due to their short maturities.
For long-term debt, the estimated fair values of the Company’s long-term debt are based on current interest rates available to the Company for debt instruments with similar terms and remaining maturities. The fair values of the Company’s convertible subordinated debt borrowings are based on the Company’s estimates.
For forward exchange contracts market values based on external quotes from banks have been used to determine the fair value.
F-27
Table of Contents
Credit Risk
Credit risk represents the accounting loss that would be recognized at the reporting date if counterparties failed completely to perform as contracted and from movements in interest rates and foreign exchange rates. The Company does not anticipate nonperformance by counterparties. The Company generally does not require collateral or other security to support financial instruments with credit risk. Concentrations of credit risk (whether on or off-balance sheet) that arise from financial instruments exist for groups of customers or counterparties when they have similar economic characteristics that would cause their ability to meet contractual obligations to be similarly affected by changes in economic or other conditions. Financial instruments on the Consolidated Balance Sheet that potentially subject the Company to concentrations of credit risk consist primarily of cash and cash equivalents and accounts receivable. The Company maintains a policy providing for the diversification of cash and cash equivalent investments and places its investments in high quality financial institutions to limit the amount of credit risk exposure. The Company derives a significant percentage of its revenue from a small number of large customers. The Company’s largest customer accounted for approximately 17.2% of net sales in 2005 and the ten largest customers accounted for approximately 43.7% of net sales in 2005. Sales to these large customers also may fluctuate significantly from time to time depending on the timing and level of purchases from the Company. Significant orders from such customers may expose the Company to a concentration of credit risk and difficulties in collecting amounts due, which could harm the Company’s financial results. At December 31, 2005 one customer accounted for 12.4% of the outstanding balance in accounts receivable.
NOTE 20Research and Development
Research and Development consists of the following:
| Year ended December 31, | |||||||||
| 2003 | 2004 | 2005 | |||||||
Research and development expenses | 82,027 | 85,987 | 102,403 | ||||||
Research and development grants and credits | (2,974 | ) | (1,113 | ) | (1,735 | ) | |||
Total research and development | 79,053 | 84,874 | 100,668 | ||||||
The Company’s Netherlands, German and American operations receive research and development grants and credits from various sources. Some of the research and development grants received from governmental sources in the Netherlands are contingently repayable to the extent the Company recognizes sales of products to which the credit is related within an agreed upon time period. The Company does not recognize a liability on the Consolidated Balance Sheet in respect of these credits until it recognizes sales of products to which the credit is related, within the agreed upon time period and is then charged to cost of sales when such sales are recorded. These repayments vary per product and range from 1.0% to 4.0% of the realized sales of these products. The contingent repayments accrue at interest rates ranging from 5.0% to 8.0% per annum. The contingent repayments, including accrued interest, were€ 3,395 at December 31, 2004 and€ 3,236 at December 31, 2005. These amounts have not been recognized as a liability in the Consolidated Balance Sheet since the Company has not recognized sales of products to which the credits are related. In addition, with respect to contingent repayments of€ 9,901 at December 31, 2004 and December 31, 2005, including accrued interest, the agreed upon time periods for repayment have expired at December 31, 2004. For these contingent repayments the Company has not received a remission from the government of the Netherlands yet. In 2003, 2004 and 2005 the Company accounted for repayments with respect to these credits of€ 48,€ 296 and€ 162 respectively.
NOTE 21Income Taxes
The components of earnings (loss) before income taxes and minority interest consist of:
| Year ended December 31, | |||||||||
| 2003 | 2004 | 2005 | |||||||
The Netherlands | (44,864 | ) | (12,871 | ) | (15,129 | ) | |||
Other countries | 43,515 | 90,437 | 22,996 | ||||||
| (1,349 | ) | 77,566 | 7,867 | ||||||
F-28
Table of Contents
The income tax benefit (expense) consists of:
| Year ended December 31, | |||||||||
| 2003 | 2004 | 2005 | |||||||
Current: | |||||||||
The Netherlands | — | — | — | ||||||
Other countries | (6,188 | ) | (10,850 | ) | (6,757 | ) | |||
| (6,188 | ) | (10,850 | ) | (6,757 | ) | ||||
Deferred: | |||||||||
The Netherlands | — | — | — | ||||||
Other countries | (924 | ) | 275 | (550 | ) | ||||
| (924 | ) | 275 | (550 | ) | |||||
Income tax benefit (expense) | (7,112 | ) | (10,575 | ) | (7,307 | ) | |||
The provisions for income taxes as shown in the Consolidated Statements of Operations differ from the amounts computed by applying the Netherlands statutory income tax rates to earnings before taxes. A reconciliation of the provisions for income taxes and the amounts that would be computed using the Netherlands statutory income tax rates is set forth as follows:
| Year ended December 31, | |||||||||
| 2003 | 2004 | 2005 | |||||||
Earnings before income taxes and minority interest | (1,349 | ) | 77,566 | 7,867 | |||||
Netherlands statutory income tax rate | 34.5 | % | 34.5 | % | 31.5 | % | |||
Income tax provision at statutory rate | 465 | (26,760 | ) | (2,478 | ) | ||||
Non-deductible expenses | (1,193 | ) | (1,328 | ) | (11,124 | ) | |||
Foreign taxes at a rate other than the Netherlands statutory rate | 11,173 | 19,709 | 20,010 | ||||||
Valuation allowance | (23,518 | ) | (13,729 | ) | (19,750 | ) | |||
Non-taxable income | 6,704 | 12,859 | 8,871 | ||||||
Other | (743 | ) | (1,326 | ) | (2,836 | ) | |||
Income tax benefit (expense) | (7,112 | ) | (10,575 | ) | (7,307 | ) | |||
Included in non-taxable income is€ 8,143 regarding the Company’s manufacturing operation in Singapore where income covering certain products is non-taxable under a tax incentive scheme granted by the Singapore tax authority. The tax exemption scheme has a term ending December 31, 2010.
The government of the Netherlands has enacted an income tax rate reduction at the end of 2004. Future Netherlands statutory income tax rates are as follow:
2006 | 29.6 | % | |
2007 | 29.1 | % |
The Company’s deferred tax assets and liabilities have been determined in accordance with these statutory income tax rates. Deferred income taxes consist of the following:
| December 31, | ||||||
| 2004 | 2005 | |||||
Deferred tax assets: | ||||||
Reserves and allowances | 2,169 | 2,261 | ||||
Net operating loss carry forwards | 102,746 | 122,026 | ||||
Other | 952 | 215 | ||||
Gross deferred tax assets | 105,867 | 124,502 | ||||
Less: valuation allowance | (97,870 | ) | (115,106 | ) | ||
Net deferred tax assets | 7,997 | 9,396 | ||||
Deferred tax liabilities: | ||||||
Depreciation | (370 | ) | (1,919 | ) | ||
Research and development credits | (4,137 | ) | (4,061 | ) | ||
Other | — | (350 | ) | |||
Deferred tax liabilities | (4,507 | ) | (6,330 | ) | ||
Net deferred income taxes | 3,490 | 3,066 | ||||
F-29
Table of Contents
Deferred tax assets and liabilities are classified in the balance sheet as follows:
| December 31, | ||||||
| 2004 | 2005 | |||||
Deferred tax assets—current | 3,624 | 2,841 | ||||
Deferred tax assets—non-current | 780 | 536 | ||||
Deferred tax liabilities—non-current | (914 | ) | (311 | ) | ||
| 3,490 | 3,066 | |||||
Based on tax filings, ASMI and its individual subsidiaries have net operating losses available at December 31, 2005 of€ 396,014 for tax return purposes to reduce future income taxes, mainly in Europe and the United States. The Company believes that realization of its net deferred tax assets is dependent on the ability of the Company to generate taxable income in the future. Given the volatile nature of the semiconductor equipment industry, past experience, and the tax jurisdictions where the Company has net operating loss carry forwards, the Company believes that there is currently insufficient evidence to substantiate recognition of substantially all net deferred tax assets with respect to net operating loss carry forwards. Accordingly, a valuation allowance of€ 97,870 in 2004 and€ 115,106 in 2005 has been recorded.
The amounts and expiration dates of net operating loss carry forwards for tax purposes are as follows:
Expiration year | ||
2006 | 482 | |
2007 | 1,521 | |
2008 | 802 | |
2009 | 3,498 | |
2010 | 1,255 | |
2011 | 1,228 | |
2012 | 5,690 | |
2017 | 62,688 | |
2018 | 6,268 | |
2019 | 1,185 | |
2021 | 1,709 | |
2022 | 11,784 | |
2023 | 8,685 | |
2024 | 6,386 | |
2025 | 27,237 | |
Unlimited | 255,596 | |
Net operating loss carry forwards | 396,014 | |
The Company has not provided for deferred foreign withholding taxes, if any, on undistributed earnings of its foreign subsidiaries. At December 31, 2005 undistributed earnings of subsidiaries, subject to withholding taxes, were approximately€ 23,219. These earnings could become subject to foreign withholding taxes if they were remitted as dividends or if the Company should sell its interest in the subsidiaries. However, the Company believes that Netherlands tax credits would largely eliminate any foreign withholding tax that might otherwise be due.
NOTE 22Disclosures about Segments and Related Information
The Company organizes its activities in two operating segments, front-end and back-end.
The front-end segment manufactures and sells equipment used in wafer processing, encompassing the fabrication steps in which silicon wafers are layered with semiconductor devices. The segment is a product driven organizational unit comprised of manufacturing, service, and sales operations in Europe, the United States, Japan and Southeast Asia.
F-30
Table of Contents
The back-end segment manufactures and sells equipment and materials used in assembly and packaging, encompassing the processes in which silicon wafers are separated into individual circuits and subsequently assembled, packaged and tested. The segment is organized in ASM Pacific Technology Ltd., in which the Company holds a majority of 53.59% interest, whilst the remaining shares are listed on the Stock Exchange of Hong Kong. The segment’s main operations are located in Hong Kong, the People’s Republic of China, Singapore and Malaysia.
| Front-end | Back-end | Total | |||||||
Year ended December 31, 2003 | |||||||||
Net sales to unaffiliated customers | 286,492 | 295,376 | 581,868 | ||||||
Gross profit | 72,850 | 128,421 | 201,271 | ||||||
Earnings (loss) from operations | (45,275 | ) | 59,474 | 14,199 | |||||
Loss on equity investments | (2,770 | ) | — | (2,770 | ) | ||||
Net interest income (expense) | (10,744 | ) | 445 | (10,299 | ) | ||||
Foreign currency transaction losses | (1,816 | ) | (663 | ) | (2,479 | ) | |||
Income tax expense | (1,400 | ) | (5,712 | ) | (7,112 | ) | |||
Gain on dilution of investment in subsidiary | 941 | — | 941 | ||||||
Minority interest | — | (24,570 | ) | (24,570 | ) | ||||
Net earnings (loss) | (61,064 | ) | 28,974 | (32,090 | ) | ||||
Capital expenditures | 11,934 | 18,144 | 30,078 | ||||||
Depreciation | 16,864 | 17,551 | 34,415 | ||||||
Impairment charges | 3,242 | — | 3,242 | ||||||
Cash and cash equivalents | 102,308 | 52,549 | 154,857 | ||||||
Capitalized goodwill | 3,888 | 42,049 | 45,937 | ||||||
Other identifiable assets | 260,690 | 200,494 | 461,184 | ||||||
Total assets | 366,886 | 295,092 | 661,978 | ||||||
Total debt | 207,623 | — | 207,623 | ||||||
Headcount in full-time equivalents1 | 1,179 | 6,254 | 7,433 | ||||||
| Front-end | Back-end | Total | |||||||
Year ended December 31, 2004 | |||||||||
Net sales to unaffiliated customers | 355,565 | 398,680 | 754,245 | ||||||
Gross profit | 103,966 | 177,778 | 281,744 | ||||||
Earnings (loss) from operations | (16,140 | ) | 104,581 | 88,441 | |||||
Loss on equity investments | (417 | ) | — | (417 | ) | ||||
Net interest income (expense) | (11,163 | ) | 816 | (10,347 | ) | ||||
Foreign currency transaction losses | (72 | ) | (39 | ) | (111 | ) | |||
Income tax expense | (4,254 | ) | (6,321 | ) | (10,575 | ) | |||
Gain on dilution of investment in subsidiary | 2,656 | — | 2,656 | ||||||
Minority interest | — | (45,608 | ) | (45,608 | ) | ||||
Net earnings (loss) | (29,390 | ) | 53,429 | 24,039 | |||||
Capital expenditures | 27,011 | 31,131 | 58,142 | ||||||
Depreciation | 16,353 | 18,956 | 35,309 | ||||||
Amortization of intangible assets | 1,389 | — | 1,389 | ||||||
Cash and cash equivalents | 146,558 | 72,056 | 218,614 | ||||||
Capitalized goodwill | 48,598 | 40,711 | 89,309 | ||||||
Purchased technology and other intangible assets | 8,833 | — | 8,833 | ||||||
Other identifiable assets | 320,267 | 186,811 | 507,078 | ||||||
Total assets | 524,256 | 299,578 | 823,834 | ||||||
Total debt | 297,253 | — | 297,253 | ||||||
Headcount in full-time equivalents1 | 1,492 | 6,768 | 8,260 | ||||||
F-31
Table of Contents
| Front-end | Back-end | Total | |||||||
Year ended December 31, 2005 | |||||||||
Net sales to unaffiliated customers | 359,633 | 366,785 | 726,418 | ||||||
Gross profit | 87,372 | 165,635 | 253,007 | ||||||
Earnings (loss) from operations | (80,282 | ) | 98,694 | 18,412 | |||||
Net interest income (expense) | (11,958 | ) | 1,541 | (10,417 | ) | ||||
Foreign currency transaction losses | 174 | (302 | ) | (128 | ) | ||||
Income tax expense | (1,736 | ) | (5,571 | ) | (7,307 | ) | |||
Gain on dilution of investment in subsidiary | 2,781 | — | 2,781 | ||||||
Minority interest | — | (43,558 | ) | (43,558 | ) | ||||
Net earnings (loss) | (91,021 | ) | 50,804 | (40,217 | ) | ||||
Capital expenditures | 26,036 | 20,015 | 46,051 | ||||||
Depreciation | 20,046 | 15,960 | 36,006 | ||||||
Amortization of intangible assets | 1,748 | — | 1,748 | ||||||
Impairment of property, plant and equipment | 5,442 | — | 5,442 | ||||||
Impairment of goodwill | 30,994 | — | 30,994 | ||||||
Cash and cash equivalents | 55,329 | 79,667 | 134,996 | ||||||
Capitalized goodwill | 26,005 | 47,004 | 73,009 | ||||||
Purchased technology and other intangible assets | 9,177 | — | 9,177 | ||||||
Other identifiable assets | 341,652 | 253,474 | 595,126 | ||||||
Total assets | 432,163 | 380,145 | 812,308 | ||||||
Total debt | 257,350 | 50 | 257,400 | ||||||
Headcount in full-time equivalents1 | 1,691 | 7,760 | 9,451 | ||||||
| (1) | Headcount includes those employees with a fixed contract, and is exclusive of temporary workers. |
There are no inter-segment transactions, other than charges for management services, which are based on actual cost. The accounting policies used to measure the net earnings and total assets in each segment are identical to those used in the Consolidated Financial Statements. The measurement methods used to determine reported segment earnings are consistently applied for all periods presented. There were no asymmetrical allocations to segments.
Geographical information is summarized as follows:
| Europe | United States | Japan | Southeast Asia | Corporate | Consolidated | |||||||
Year ended December 31, 2003 | ||||||||||||
Net sales to unaffiliated customers | 66,428 | 126,092 | 69,708 | 319,640 | — | 581,868 | ||||||
Long-lived assets | 12,845 | 33,464 | 22,421 | 71,209 | 1,480 | 141,419 | ||||||
Total assets | 77,721 | 67,829 | 111,487 | 256,353 | 148,588 | 661,978 | ||||||
Capital expenditures | 1,536 | 6,983 | 3,374 | 18,185 | — | 30,078 | ||||||
Additions to intangible assets | — | — | — | — | — | — | ||||||
Year ended December 31, 2004 | ||||||||||||
Net sales to unaffiliated customers | 75,352 | 149,939 | 83,567 | 445,387 | — | 754,245 | ||||||
Long-lived assets | 15,222 | 23,584 | 20,405 | 82,100 | 1,385 | 142,696 | ||||||
Total assets | 81,528 | 158,385 | 113,377 | 283,091 | 187,453 | 823,834 | ||||||
Capital expenditures | 5,760 | 9,211 | 3,771 | 39,342 | 58 | 58,142 | ||||||
Additions to intangible assets | — | 51,033 | — | 8,913 | 1,922 | 61,868 | ||||||
Year ended December 31, 2005 | ||||||||||||
Net sales to unaffiliated customers | 109,555 | 148,124 | 54,993 | 413,746 | — | 726,418 | ||||||
Long-lived assets | 12,902 | 24,172 | 24,024 | 100,933 | 1,312 | 163,343 | ||||||
Total assets | 99,651 | 139,153 | 106,141 | 379,492 | 87,871 | 812,308 | ||||||
Capital expenditures | 2,402 | 11,033 | 9,622 | 22,952 | 42 | 46,051 | ||||||
Additions to intangible assets | 137 | 208 | — | 387 | — | 732 | ||||||
Long-lived assets for the year ended December 31, 2003 include the Company’s assets in property, plant and equipment and the Company’s investment in NuTool. Long-lived assets for the years ended December 31, 2004 and 2005 include the Company’s assets in property, plant and equipment.
F-32
Table of Contents
NOTE 23Selected Operating Expenses and Additional Information
Personnel expenses for employees were as follows:
| Year ended December 31, | ||||||
| 2003 | 2004 | 2005 | ||||
Wages and salaries | 136,852 | 156,754 | 163,065 | |||
Social security | 14,672 | 15,905 | 16,755 | |||
Pensions | 7,745 | 7,811 | 8,530 | |||
| 159,269 | 180,470 | 188,350 | ||||
The average number of employees, exclusive of temporary workers, by geographic area during the year was as follows:
| Year ended December 31, | ||||||
| 2003 | 2004 | 2005 | ||||
The Netherlands | 343 | 327 | 339 | |||
Other European countries | 127 | 154 | 173 | |||
United States of America | 433 | 530 | 606 | |||
Far East | 5,844 | 6,889 | 7,505 | |||
Japan | 251 | 260 | 273 | |||
| 6,998 | 8,160 | 8,896 | ||||
NOTE 24Earnings (Loss) per Share
The following represents a reconciliation of net earnings (loss) and weighted average number of shares outstanding (in thousands) for purposes of calculating basic and diluted net earnings (loss) per share:
| Year ended December 31, | ||||||||
| 2003 | 2004 | 2005 | ||||||
Net earnings (loss) used for purpose of computing basic earnings per share | (32,090 | ) | 24,039 | (40,217 | ) | |||
After-tax equivalent of interest expense on convertible subordinated notes | — | — | — | |||||
Net earnings (loss) used for purposes of computing diluted net earnings (loss) per share | (32,090 | ) | 24,039 | (40,217 | ) | |||
Basic weighted average number of shares outstanding at the end of period used for purpose of computing basic earnings per share | 49,642 | 51,540 | 52,638 | |||||
Dilutive effect of stock options | — | 318 | — | |||||
Dilutive effect of exercisable warrants | — | — | — | |||||
Dilutive effect of convertible subordinated notes | — | — | — | |||||
Dilutive weighted average number of shares outstanding | 49,642 | 51,858 | 52,638 | |||||
Net earnings (loss) per share: | ||||||||
Basic | (0.65 | ) | 0.47 | (0.76 | ) | |||
Diluted | (0.65 | ) | 0.46 | (0.76 | ) | |||
As a result of the losses incurred by the Company there is no difference between the basic and diluted loss per share for the years 2003 and 2005, as the effects of the exercise of stock options and warrants and the conversion of the convertible subordinated debt borrowings would be anti-dilutive. For the year ended December 31, 2003, the effect of 335 stock options, 8,639 conversion rights, and 60 exercisable warrants to acquire common stock was anti-dilutive. For the year ended December 31, 2004, the effect of 11,217 conversion rights to acquire common stock was anti-dilutive. For the year ended December 31, 2005, the effect of 152 stock options and 11,887 conversion rights to acquire common stock was anti-dilutive.
F-33
Table of Contents
NOTE 25 Board Remuneration
The following table sets forth as to all current and former members of the Management Board and Supervisory Board of the Company information concerning all remuneration from the Company (including its subsidiaries) for services in all capacities:
| Year ended December 31, | ||||||||||||
| Base compensation | Bonuses | Pensions | Retirement agreement | 2005 | 2004 | |||||||
| Total | Total | |||||||||||
Management Board: | ||||||||||||
A. H. del Prado | 583 | — | — | — | 583 | 583 | ||||||
A. J. M. van der Ven1 | 174 | — | 12 | — | 186 | — | ||||||
P. Lam See Pong | 613 | 307 | 74 | — | 994 | 957 | ||||||
R. L. de Bakker2 | 85 | — | 18 | — | 103 | 221 | ||||||
H. D. J. Pietersma3 | 177 | — | 21 | 498 | 696 | 454 | ||||||
| 1,632 | 307 | 125 | 498 | 2,562 | 2,215 | |||||||
Supervisory Board: | ||||||||||||
P. C. van den Hoek4 | 38 | — | — | — | 38 | 69 | ||||||
E. A. van Amerongen | 26 | — | — | — | 26 | 26 | ||||||
L. P. E. M. van den Boom5 | 11 | — | — | — | 11 | — | ||||||
J. M. R. Danneels6 | 59 | — | — | — | 59 | 21 | ||||||
J. den Hoed | 22 | — | — | — | 22 | 22 | ||||||
A. Baan7 | 11 | — | — | — | 11 | 21 | ||||||
| 167 | — | — | — | 167 | 159 | |||||||
| (1) | From May 15, 2005 through December 31, 2005. |
| (2) | From January 1, 2005 through May 31, 2005. |
| (3) | From January 1, 2005 through May 10, 2005. The amounts follow an agreement with Mr. H.D.J. Pietersma with respect to his retirement from the Management Board. |
| (4) | The remuneration of 2004 for Mr. P.C. van den Hoek includes the compensation he received as member of the Supervisory Board and the compensation he received in his capacity of non-executive director and member of the Audit Committee of ASMPT. Mr. P.C. van den Hoek retired from his positions with ASMPT as per December 23, 2004. |
| (5) | From May 19, 2005 through December 31, 2005. |
| (6) | The remuneration of 2005 for Mr. J.M.R. Danneels includes the compensation of€ 38 he received for additional business review consultancy. |
| (7) | From January 1, 2005 through May 19, 2005. |
All remuneration for Mr. P. Lam See Pong relates to the compensation he receives in his capacity as Managing Director of ASMPT.
No stock options have been issued to members of the Supervisory Board. The following table shows the outstanding options to purchase ASM International N.V. common shares held by current and former members of the Management Board, and changes in such holdings during 2005:
| Year of grant | Outstanding January 1, 2005 | Granted in 2005 | Forfeited in 2005 | Outstanding December 31, 2005 | Exercise price | Remaining term, in years | |||||||||
A. H. del Prado | 2001 | 250,000 | — | — | 250,000 | US$ | 19.32 | 1 | |||||||
A. J.M. van der Ven | 2005 | — | 30,000 | — | 30,000 | € | 11.18 | 8 | |||||||
P. Lam See Pong | 2001 | 100,000 | — | — | 100,000 | US$ | 15.44 | — | |||||||
R. L. de Bakker1 | 2000 | 35,000 | — | — | 35,000 | € | 11.60 | 5 | |||||||
H. D.J. Pietersma2 | 2002 | 100,000 | — | 60,000 | 40,000 | € | 11.20 | 2 | |||||||
| 485,000 | 30,000 | 60,000 | 455,000 | ||||||||||||
| (1) | Mr. R.L. de Bakker retired from his position with the Company as per May 31, 2005. |
| (2) | Mr. H.D.J. Pietersma retired from his position with the Company as per May 10, 2005. |
F-34
Table of Contents
The remuneration and stock option grants for the Management Board have been determined by the Supervisory Board. The options are granted for a term of five or eight years, and become exercisable in equal parts over a five year period. For the exercise of options new shares are issued. The remuneration for the Supervisory Board has been determined by the General Meeting of Shareholders.
In February 2005, Mr. P. Lam See Pong in his capacity of Director of the Board of ASMPT was granted 180,000 shares in the share capital of ASMPT under the Employee Share Incentive Scheme of ASMPT. The shares were issued in December 2005. The fair value of the shares granted amounted to€ 624. In February 2004 Mr. P. Lam See Pong was granted 180,000 shares in the share capital of ASMPT, which were issued in December 2004. The fair value of the shares granted amounted to€ 520.
NOTE 26 Share Ownership and Related Party Transactions
The ownership or controlling interest of outstanding common shares of ASM International N.V. by members of the Management Board and Supervisory Board or members of their immediate family are as follows:
| December 31, 2004 | December 31, 2005 | |||||||||
| Shares owned | Percentage of shares outstanding | Shares owned | Percentage of shares outstanding | |||||||
Management Board: | ||||||||||
A. H. del Prado | 3,784,839 | 7.19 | % | 3,784,839 | 7.18 | % | ||||
R. L. de Bakker1 | 35,000 | 0.07 | % | — | — | |||||
P. Lam See Pong | 395,300 | 0.75 | % | 395,300 | 0.75 | % | ||||
Supervisory Board: | ||||||||||
P. C. van den Hoek | 300,000 | 0.57 | % | 300,000 | 0.57 | % | ||||
Stichting Administratiekantoor ASMI | 7,692,039 | 14.61 | % | 7,692,039 | 14.60 | % | ||||
| (1) | Mr. R.L. de Bakker retired from his position with the Company as per May 31, 2005. |
Stichting Administratiekantoor ASMI is a trust controlled by Mr. A.H. del Prado.
At December 31, 2005 Mr. P. Lam See Pong was owner of 970,000 shares in the share capital of ASMPT and Mr. P.C. van den Hoek was owner of 450,000 shares in the share capital of ASMPT. This represents 0.25% and 0.12% of the total outstanding shares of ASMPT, respectively.
In 2005, Mr. P. Lam See Pong sold 2,180,000 shares in the share capital of ASMPT at market prices. The market value of these shares at the date of sale amounted to€ 8,901. In 2005, Mr. P.C. van den Hoek sold 920,000 shares in the share capital of ASMPT at market prices. The market value of these shares at the date of sale amounted to€ 4,022.
NanoPhotonics AG—In 1999, the Company acquired a 24.0% interest in NanoPhotonics AG, a German supplier of precision thin film metrology equipment, for€ 407. In 1999, the Company’s Chief Executive Officer also purchased a 44.5% interest in NanoPhotonics. Due to the issuance of new shares by NanoPhotonics to third parties in 2003, the Company’s interest diluted to 23.61% and the Chief Executive Officer’s interest diluted to 43.77%. In 2004 the Chief Executive Officer purchased an additional 1.72% interest in NanoPhotonics from another shareholder. For all the shares purchased by the Chief Executive Officer, the Company and the Chief Executive Officer agreed that the Company could purchase such shares at the same price the officer paid to acquire the shares. The Company exercised this option in December 2005, for a total consideration of€ 1,101. At December 31, 2005 the Company holds a 69.10 % interest in NanoPhotonics. At December 31, 2004 and December 31, 2005, the Company has provided NanoPhotonics with intercompany loans of€ 6,443 and€ 8,909, respectively. In 2003, 2004 and 2005 the Company purchased equipment from NanoPhotonics in the amount of€ 245,€ 271 and€ 427, respectively.
In March 2000, the Company made an interest-bearing loan to its Chief Executive Officer in connection with the exercise of stock options at an average interest rate for 2005 of 4.49%. The outstanding amount of the loan is€ 596 at December 31, 2005 and is secured by the shares received in the stock option exercise. The Company has custody of the shares until the loan is repaid. The loan has been included under other assets in the Consolidated Balance Sheet.
On June 2, 2004, the Company acquired the remaining 84.3% interest in NuTool, a privately held semiconductor equipment company based in California, United States of America. As a result of the acquisition, the Company owns 100% of the outstanding stock of NuTool. The Company’s Chief Executive
F-35
Table of Contents
Officer owned 127,878 shares of NuTool’s Series D Preferred Stock prior to acquisition of the remaining 84.3% interest. In consideration for his ownership of NuTool stock, he received 22,586 of the Company’s common shares valued at US$ 481,759.
The Chairman of the Supervisory Board, Mr. P.C. van den Hoek, is a partner in the European law firm of Stibbe. Another partner at Stibbe serves as the Company’s general outside legal counsel. Mr. van den Hoek has been with Stibbe since 1965. Mr. P.C. van den Hoek also serves on the boards of directors of various European companies. Fees for services to Stibbe amounted to€ 349 and€ 226 in 2004 and 2005, respectively.
F-36
Table of Contents
The registrant hereby certifies that it meets all of the requirements for filing on Form 20-F and that it has duly caused and authorized the undersigned to sign this annual report on its behalf.
| ASM INTERNATIONAL N.V. | ||
| Date: March 17, 2006 | /s/ ARTHUR H.DEL PRADO | |
Arthur H. del Prado Chief Executive Officer | ||
S-1