UNITED STATES
SECURITES AND EXCHANGE COMMISSION
Washington, DC 20549
FORM N-CSR
CERTIFIED SHAREHOLDER REPORT OF
REGISTERED MANAGEMENT INVESTMENT COMPANIES
Investment Company Act file number: 811-3150
BMC FUND, INC.
(Exact name of registrant as specified in charter)
800 GOLFVIEW PARK (P. O. BOX 500)
LENOIR, NC 28645
(Address of principal executive offices) (Zip code)
CAROL FRYE
BMC FUND, INC.
P. O. BOX 500
LENOIR, NC 28645
(Name and address of agent for service)
Registrant's telephone number including area code: 828-758-6100
Date of fiscal year end: October 31, 2007
Date of reporting period: October 31, 2007
Item 1. Report to Stockholders.
BMC FUND, INC.
FINANCIAL STATEMENTS AND
SUPPLEMENTARY INFORMATION
Year Ended October 31, 2007
BMC FUND, INC.
TABLE OF CONTENTS
| | Page No. |
| | |
| Directors and Officers | 1 |
| | |
| Letter to Shareholders - Management’s Discussion of Fund Performance | 2 |
| | |
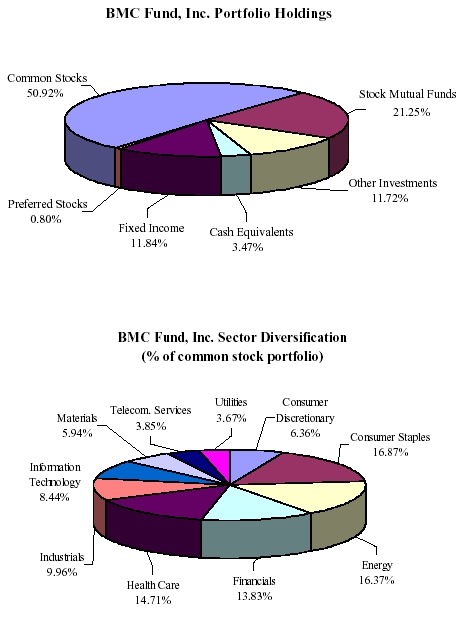
| Graphic Presentation of Portfolio Holdings and Sector Diversification | 4 |
| | |
| Federal Income Tax Information | 5 |
| | |
| Supplemental Information | 5 |
| | |
| Supplemental Proxy Information | 6 |
| | |
| Report of Independent Registered Public Accounting Firm | 7 |
| | |
| Statement of Assets and Liabilities | 8 |
| | |
| Statement of Operations | 9 |
| | |
| Statements of Changes In Net Assets | 10 |
| | |
| Notes to Financial Statements | 11 |
| | |
| Financial Highlights | 14 |
| | |
| Schedules of Investments: | |
| 15 |
| II. - Investments in Affiliates | 27 |
BMC FUND, INC.
DIRECTORS AND OFFICERS
DIRECTORS
| James T. Broyhill | Winston-Salem, North Carolina |
| Paul H. Broyhill | Lenoir, North Carolina |
| William E. Cooper | Dallas, Texas |
| Jan E. Gordon | Palm Harbor, Florida |
| Allene B. Heilman | Clearwater, Florida |
| Gene A. Hoots | Charlotte, North Carolina |
| Brent B. Kincaid | Lenoir, North Carolina |
| Michael G. Landry | Fort Lauderdale, Florida |
| John S. Little | Naples, Florida |
| L. Glenn Orr, Jr. | Winston-Salem, North Carolina |
OFFICERS
| Paul H. Broyhill | Chairman and Chief Executive Officer |
| M. Hunt Broyhill | President |
| Boyd C. Wilson, Jr. | Vice President and Chief Financial Officer |
| Michael G. Landry | Vice President and Chief Investment Officer |
| Gene Hendricks | Vice President and Chief Compliance Officer |
| Carol Frye | Secretary and Treasurer |
TO OUR SHAREHOLDERS: MANAGEMENT’S DISCUSSION OF FUND PERFORMANCE
We are happy to present to you our report for the year ended October 31, 2007, which we believe contains complete and pertinent financial information.
Over the course of the fiscal year ending October 31, 2007, the combined BMC Fund, Inc. (“The Fund”) portfolio appreciated 15.0% compared to a 10.6% return for the previous fiscal year. For the latest fiscal year, earnings including unrealized gains were $24,821,422.
Over the past year the US economy was challenged by the home-building collapse, falling housing prices and rising credit problems. As was the case in the previous fiscal year the Fund’s relatively high exposure to a diversified global common stock portfolio resulted in exceptionally high absolute and relative returns for overall holdings.
During fiscal year 2007 over half of the mutual fund component was invested in foreign markets with significant exposure to emerging markets and appreciating currencies. As well, the domestic equity portfolios were over weighted in stocks of US based transnational companies that are experiencing above average earnings increases from operations in the higher growth areas of the world. Earnings of these companies are valued in currencies that have risen versus the US dollar.
As mentioned above, the Fund’s portfolio managers focused on higher quality and larger capitalization multinational companies. As was the case in the last fiscal year, this concentration resulted in excellent returns among our positions in transnational companies such as Coca Cola, Avon Products and AFLAC. Also the Fund’s substantial over weight position in energy stocks was another reason for the equity portfolio’s strong relative performance. Rising oil prices drove up the share price of companies in the portfolio such as Royal Dutch, Exxon and Chevron.
Our biggest losses over the past year came in the financial sector as falling housing values led to a sharp rise in foreclosures. This caused the stock prices of some of the largest mortgage lenders to collapse. Making matters worse, subprime loans were packaged and sold. Unfortunately the default rate assumptions of these pooled investments were considerably understated. As the number of defaults grew, holders of these packages were forced to take large write offs, thereby putting further pressure on their stock prices. As a result, the value of the Fund’s holdings in diversified financials and insurance fell. Apart from the financials, consumer discretionary stocks that include autos, producers of consumer durables and retailers fell as consumer confidence seemed to be fading. That being said, an underweight allocation to both the financial and consumer discretionary sector diminished the brunt of the damage to the aggregate portfolio.
Looking forward, the global economy will likely continue to be driven by emerging markets led by China and India. Annual growth rates throughout the developing world have surged to around 7%. They now contribute half of the world’s GDP growth which is over three times as much as the US. It is true that a US economic slowdown would have an effect on the export sectors of emerging economies; however, America is no longer the only engine of growth in the global economy.
The US economy will probably slow as the credit crunch and housing related issues further take their toll. Stocks of companies closely tied to the American economy are less attractive than those of enterprises taking in profits from their businesses in high growth economies or those of exporters taking advantage of the weak US dollar.
Domestic bond market prospects remain unclear as interest rates should eventually spike from historically low levels as inflation prospects become increasingly likely. Bonds of developed countries are also worrisome given the potential for higher interest rates and a change in direction of the value of the dollar against currencies such as the Euro or Canadian dollar. Emerging market bonds provide an alternative fixed income investment considering the high probability that their currencies should appreciate against the dollar. In addition to emerging market bonds the Fund will be looking to alternative investments for preservation of capital, such as cash, lower duration US bonds and bond proxies such as hedge funds.
The Fund’s portfolio managers intend to stay vigilant and ensure that the portfolio continues to be well diversified across asset classes, sectors and world markets.
During the year ended October 31, 2007, the Fund paid the following dividends per share:
| December 9, 2006 to shareholders of record November 25, 2006 | | $ | 1.55 | |
| March 10, 2007 to shareholders of record February 25, 2007 | | | .25 | |
| June 10, 2007 to shareholders of record May 25, 2007 | | | .25 | |
| September 10, 2007 to shareholders of record August 25, 2007 | | | .25 | |
| | | | | |
| Total | | $ | 2.30 | |
The Fund paid a dividend of $1.71 per share on December 10, 2007 to shareholders of record November 25, 2007.
Schedule I is a listing of the entire Fund’s diversified securities at October 31, 2007 with a total market value of $161,646,866.
Paul H. Broyhill, Chairman and
Chief Executive Officer
M. Hunt Broyhill, President
Michael G. Landry, Vice President
FEDERAL INCOME TAX INFORMATION
We are required by the Internal Revenue Code to advise you within 60 days of the Fund’s fiscal year end (October 31, 2007) as to the federal tax status of dividends paid by the Fund during such fiscal year. Accordingly, we are advising you that during the year ended October 31, 2007, the Fund paid distributions to its shareholders totaling $2.30 per share, comprised of $0.60 per share ordinary income and short term capital gains which are taxable as ordinary income, and $1.70 per share long term capital gains which are taxable as such. The shareholders are furnished a Form 1099 in January of each year, which details the federal tax status of dividends paid by the Fund during the calendar year. There were no undistributed capital gains during the fiscal year.
SUPPLEMENTAL INFORMATION
Paul H. Broyhill, Chairman and Chief Executive Officer, Michael G. Landry, Vice President and Chief Investment Officer, M. Hunt Broyhill, President, Christopher R. Pavese, CFA, Managing Director, and Dan J. Wakin, Managing Director - Alternative Investments, are primarily responsible for the day-to-day management of the Company’s portfolio. Mr. Paul Broyhill has had such responsibility since the inception of the Fund. Messrs. Landry and Hunt Broyhill have had such responsibility since 2001. Messrs. Landry and Hunt Broyhill have been engaged in asset management for various institutions and high net worth individuals for more than five years. Prior to joining the Company on March 1, 2005, Mr. Pavese was a Vice President and Portfolio Manager at JPMorgan Private Bank from January 1999 until February 2005. At JPMorgan, Mr. Pavese was engaged in asset management, portfolio strategy, and asset allocation for high net worth individuals, personal trusts, endowments and foundations. Mr. Wakin has had such responsibility since February 2006, and has served the Fund in other capacities since 1995.
SUPPLEMENTAL PROXY INFORMATION
2007 ANNUAL MEETING OF SHAREHOLDERS
The Annual Meeting of Shareholders of BMC Fund, Inc. was held on February 24, 2007 at The Hyatt Hotel, Sarasota, Florida. The meeting was held for the following purposes:
| 1. | To elect the following 10 directors to serve as follows: |
Director | | Term | | Expiring |
| James T. Broyhill | | 1 year | | 2008 |
| Paul H. Broyhill | | 1 year | | 2008 |
| William E. Cooper | | 1 year | | 2008 |
| Jan E. Gordon | | 1 year | | 2008 |
| Allene B. Heilman | | 1 year | | 2008 |
| Gene A. Hoots | | 1 year | | 2008 |
| Brent B. Kincaid | | 1 year | | 2008 |
| Michael G. Landry | | 1 year | | 2008 |
| | 1 year | | 2008 |
| L. Glenn Orr, Jr. | | 1 year | | 2008 |
| 2. | To vote upon such other business as may come before the meeting. |
The results of the proxy solicitation on the above matters were as follows:
| | Director | | Votes For | | Votes Against | | Votes Withheld | | Abstentions |
| | | | | | | | | | |
| James T. Broyhill | | 4,895,439 | | - | | 37,842 | | - |
| | Paul H. Broyhill | | 4,895,439 | | - | | 37,842 | | - |
| | William E. Cooper | | 4,895,439 | | - | | 37,842 | | - |
| | Jan E. Gordon | | 4,726,380 | | 169,059 | | 37,842 | | - |
| | Allene B. Heilman | | 4,895,439 | | - | | 37,842 | | - |
| | Gene A. Hoots | | 4,895,439 | | - | | 37,842 | | - |
| | Brent B. Kincaid | | 4,895,439 | | - | | 37,842 | | - |
| | Michael G. Landry | | 4,895,439 | | - | | 37,842 | | - |
| | John S. Little | | 4,895,439 | | - | | 37,842 | | - |
| | L. Glenn Orr, Jr. | | 4,895,439 | | - | | 37,842 | | - |
| 2. | There was no other business voted upon at the Annual Meeting of Shareholders. |
REPORT OF INDEPENDENT REGISTERED PUBLIC ACCOUNTING FIRM
To the Board of Directors and
Shareholders of BMC Fund, Inc.
We have audited the accompanying statement of assets and liabilities of the BMC Fund, Inc. (the “Company”), including the schedules of investments, as of October 31, 2007 and the related statement of operations for the year then ended, the statements of changes in net assets for each of the two years in the period then ended, and the financial highlights for the years ended October 31, 2007, 2006, 2005, 2004, and 2003, and the seven months ended October 31, 2002 and the years ended March 31, 2002 and 2001. These financial statements and financial highlights are the responsibility of the Company’s management. Our responsibility is to express an opinion on these financial statements and financial highlights based on our audits. The financial highlights for each of the three years in the period ended March 31, 2000 were audited by other auditors whose report dated May 19, 2000 expressed an unqualified opinion on the financial highlights for those three years.
We conducted our audits in accordance with the standards of the Public Company Accounting Oversight Board (United States). Those standards require that we plan and perform the audit to obtain reasonable assurance about whether the financial statements and financial highlights are free of material misstatement. The Company is not required to have, nor were we engaged to perform, an audit of its internal control over financial reporting. Our audits included consideration of internal control over financial reporting as a basis for designing audit procedures that are appropriate in the circumstances, but not for the purpose of expressing an opinion on the effectiveness of the Company's internal control over financial reporting. Accordingly, we express no such opinion. An audit also includes examining, on a test basis, evidence supporting the amounts and disclosures in the financial statements. Our procedures included confirmation of securities owned as of October 31, 2007 by correspondence with the custodian and brokers or by other appropriate auditing procedures where replies from brokers were not received. An audit also includes assessing the accounting principles used and significant estimates made by management, as well as evaluating the overall financial statement presentation. We believe that our audits provide a reasonable basis for our opinion.
As explained in note 1, the financial statements include investments valued at $18,944,765 (10.58 percent of net assets), whose fair values have been estimated by management in the absence of readily determinable fair values. Management’s estimates are based upon information provided by the funds managers or the general partners.
In our opinion, the financial statements referred to above present fairly, in all material respects, the financial position of BMC Fund, Inc. as of October 31, 2007, the results of its operations for the year then ended, the changes in its net assets for the each of the two years in the period then ended, and the financial highlights for the years ended October 31, 2007, 2006, 2005, 2004, 2003, and the seven months ended October 31, 2002 and two years ended March 31, 2002 and 2001, in conformity with accounting principles generally accepted in the United States of America.
Charlotte, North Carolina
December 21, 2007
BMC FUND, INC.
STATEMENT OF ASSETS AND LIABILITIES
October 31, 2007
| ASSETS AT MARKET VALUE: | | | |
| Investment securities (cost - $121,114,387) | | $ | 161,646,866 | |
| Investments in affiliates - wholly owned subsidiaries (equity value $19,361,952) | | | 18,508,741 | |
| Cash and short-term investments | | | 71,039 | |
| Receivables, accrued interest and dividends | | | 210,311 | |
| Receivable from broker | | | 3,599,240 | |
| Other assets | | | 28,534 | |
| | | | | |
| Total assets | | | 184,064,731 | |
| | | | | |
| LIABILITIES: | | | | |
| Accounts payable and accrued expenses | | | 89,917 | |
| Note payable - bank | | | 5,000,000 | |
| | | | | |
| Total liabilities | | | 5,089,917 | |
| | | | | |
| NET ASSETS AT OCTOBER 31, 2007 - EQUIVALENT TO $36.28 PER | | | | |
| SHARE ON 4,933,281 SHARES OF COMMON STOCK OUTSTANDING | | $ | 178,974,814 | |
| | | | | |
| SUMMARY OF SHAREHOLDERS' EQUITY: | | | | |
| Common stock, par value $5.00 per share - authorized 70,000,000 shares; | | | | |
| outstanding, 4,933,281 shares | | $ | 24,666,405 | |
| Retained earnings prior to becoming investment company | | | 92,939,370 | |
| Undistributed net investment income | | | 9,476,728 | |
| Realized gains on investments | | | 7,018,329 | |
| Undistributed nontaxable gain | | | 5,194,714 | |
| Unrealized appreciation of investments | | | 39,679,268 | |
| | | | | |
| NET ASSETS APPLICABLE TO COMMON STOCK OUTSTANDING | | $ | 178,974,814 | |
See accompanying notes to financial statements.
BMC FUND, INC.
STATEMENT OF OPERATIONS
Year Ended October 31, 2007
| INVESTMENT INCOME: | | | |
| Income: | | | |
| Interest - taxable bonds | | $ | 324,657 | |
| Other interest and dividends | | | 3,956,918 | |
| Equity in earnings of wholly-owned subsidiaries | | | 840,806 | |
| | | | | |
| Total income | | | 5,122,381 | |
| | | | | |
| Expenses: | | | | |
| Legal and professional fees | | | 79,450 | |
| Directors' fees (Note 3) | | | 50,172 | |
| Interest expense | | | 46,679 | |
| Investment expense | | | 105,756 | |
| Salaries | | | 658,444 | |
| Property and liability insurance | | | 66,872 | |
| Depreciation expense | | | 2,747 | |
| Taxes and licenses | | | 110,067 | |
| Rent | | | 30,377 | |
| Office supplies and expense | | | 27,509 | |
| Dues and subscriptions | | | 40,494 | |
| Travel and entertainment | | | 61,502 | |
| | | | | |
| Total expenses | | | 1,280,069 | |
| | | | | |
| Investment income, net | | | 3,842,312 | |
| | | | | |
| REALIZED AND UNREALIZED GAINS ON INVESTMENTS: | | | | |
| Realized gains from investment securities sold | | | 7,018,329 | |
| Change in unrealized appreciation of investments for the period | | | 13,960,781 | |
| | | | | |
| Net gains on investments | | | 20,979,110 | |
| | | | | |
| NET INCREASE IN NET ASSETS RESULTING | | | | |
| FROM OPERATIONS | | $ | 24,821,422 | |
See accompanying notes to financial statements.
BMC FUND, INC.
STATEMENTS OF CHANGES IN NET ASSETS
Years Ended October 31, 2007 and 2006
| | | 2007 | | 2006 | |
| | | | | | |
| INCREASE IN NET ASSETS FROM OPERATIONS: | | | | | |
| Investment income, net | | $ | 3,842,312 | | $ | 5,228,707 | |
| Realized gains from investment securities sold | | | 7,018,329 | | | 10,022,572 | |
| Change in unrealized appreciation of investments | | | | | | | |
| for the year | | | 13,960,781 | | | 1,936,082 | |
| | | | | | | | |
| | | | | | | | |
| Net increase in net assets resulting from operations | | | 24,821,422 | | | 17,187,361 | |
| | | | | | | | |
| Distributions to shareholders from: | | | | | | | |
| Net realized gains on investment securities | | | (10,022,572 | ) | | (11,669,860 | ) |
| Net investment income | | | (1,323,974 | ) | | (2,044,661 | ) |
| | | | | | | | |
| TOTAL INCREASE IN NET ASSETS | | | 13,474,876 | | | 3,472,840 | |
| | | | | | | | |
| NET ASSETS AT BEGINNING OF YEAR | | | 165,499,938 | | | 162,027,098 | |
| | | | | | | | |
| NET ASSETS AT END OF YEAR (Including | | | | | | | |
| undistributed net investment income: | | | | | | | |
| 10/31/07 - $9,476,729; 10/31/06 - $16,980,963) | | $ | 178,974,814 | | $ | 165,499,938 | |
See accompanying notes to financial statements.
BMC FUND, INC.
NOTES TO FINANCIAL STATEMENTS
Year Ended October 31, 2007
| 1. | SIGNIFICANT ACCOUNTING POLICIES |
BMC Fund, Inc. (the “Company”) is a closed-end, diversified investment company registered under the Investment Company Act of 1940, as amended. Prior to becoming a regulated investment company on April 1, 1981, BMC Fund, Inc. operated as a regular corporation. The following is a summary of significant accounting policies followed by the Company in the preparation of its financial statements. The policies are in conformity with generally accepted accounting principles for investment companies.
| | A. | Investment Valuations - The investment securities are stated at market value as determined by closing prices on national securities exchanges. Investment securities include corporate bonds, mutual funds, and common and preferred stocks. |
The investments in limited partnerships, other investments and venture capital are stated at estimated fair value as determined by the management of these investments and are approved by the Company’s Valuation Committee after giving consideration to historical and projected financial results, economic conditions, financial condition of investee and other factors and events subject to change. Because of the inherent uncertainty of those valuations, the estimated values may differ significantly from the values that would have been used had a ready market value for the investments. The fair value of these investment types is included in the accompanying schedule I; “Investments in Securities of Unaffiliated Issuers”.
The carrying value of the investments in wholly owned subsidiaries is based on independent appraisals and internal assessments of the fair market values of the subsidiaries’ underlying investments. Equity in earnings of the wholly owned subsidiaries in the statement of operations represents the current year earnings of the subsidiaries accounted for using the equity method.
The carrying value of the investment in real estate is based on an independent appraisal of the fair market value of the real estate.
| | B. | Investment Transactions - Investment transactions are accounted for on the date the order to buy or sell is executed. Realized gains and losses on investments are determined on the basis of specific identification of issues sold or matured. The aggregate dollar amount of purchases and sales of investment securities, other than government securities and short-term debt securities having maturities of one year or less, for the year ended October 31, 2007, was $162,090,066. |
BMC FUND, INC.
NOTES TO FINANCIAL STATEMENTS
Year Ended October 31, 2007
| 1. | SIGNIFICANT ACCOUNTING POLICIES (Continued) |
| | C. | Income Taxes - No federal tax provision is required as it is the Company’s policy to comply with the provisions of Subchapter M of the Internal Revenue Code of 1954, as amended, including the distribution to its shareholders of substantially all of its income and any capital gains not offset by capital losses. Also, no state income tax provision has been provided because the states in which the Company has income recognize the tax exempt status of a regulated investment company. |
| | D. | Dividend Policy - It is the Company’s policy to pay dividends during the year in sufficient amounts to meet the requirements to maintain its status as a regulated investment company. |
| | E. | Cash and Short-Term Investments - For purposes of financial reporting, the Company considers all investments at financial institutions with original maturities of three months or less to be equivalent to cash. Short-term money market investments managed by third party investors are included in investment securities. |
| | F. | Use of Estimates - The preparation of financial statements in conformity with accounting principles generally accepted in the United States of America requires management to make estimates and assumptions that affect the reported amounts of assets and liabilities and disclosure of contingent assets and liabilities at the date of the financial statements and the reported amounts of revenues and expenses during the reporting period. Actual results could differ from those estimates. |
On September 25, 2000 (modified October 20, 2000 and renewed July 21, 2006), the Company entered into an agreement with a bank for an unsecured line of credit in the amount of $5,000,000 to provide the Company more flexibility in its payment of dividends and management of its investments. The interest rate on any borrowings was at the LIBOR market index rate plus 125 basis points. No commitment fee was charged on any unused balance. This line of credit expired on July 31, 2007.
On October 12, 2007, the Company entered into an agreement with a bank for an unsecured line of credit in the amount of $7,500,000 to provide the Company more flexibility in its payment of dividends and management of its investments. The interest rate on any borrowings is at the LIBOR market index rate plus 100 basis points. No commitment fee is charged on any unused balance. As of October 31, 2007, the Company had borrowings of $5,000,000 from this line of credit, which expires on April 30, 2008.
BMC FUND, INC.
NOTES TO FINANCIAL STATEMENTS
Year Ended October 31, 2007
| 3. | ADVISORY BOARD AND REMUNERATION OF DIRECTORS |
The Company does not have an advisory board. The independent directors are paid an annual fee of $3,000 plus $1,000 for each meeting attended in person or $500 cash for each meeting attended by telephone. Each such independent director is paid an additional $1,000 for each day attending a committee meeting in person or $500 by telephone other than on the date of a board meeting. In addition, all directors are reimbursed for their reasonable expenses incurred in attending meetings.
The Company owns two wholly-owned subsidiaries, P. B. Realty, Inc. and Broyhill Industries, Inc. During the year, the Company contributed an additional $50,000 of capital to Broyhill Industries, Inc.
The Company leases office space from Broyhill Investments, Inc. which is controlled by Paul H. Broyhill and M. Hunt Broyhill, both officers of BMC Fund, Inc. The expense associated with this related party lease for each of the years ended October 31, 2007 and 2006 amounted to $30,377 and $14,100, respectively. Broyhill Investments, Inc. also acts as a common paymaster for payroll and other shared services. This service is provided at no cost to the Company. All amounts paid by Broyhill Investments, Inc. on behalf of the Company are reimbursed by the Company. The outstanding payable related to these transactions at October 31, 2007 was $88,434.
BMC FUND, INC.
FINANCIAL HIGHLIGHTS
Years Ended October 31, 2007, 2006, 2005, 2004, and 2003, Seven Month Period Ended October 31, 2002, and Each of the Five Years in the Period Ended March 31, 2002
The following table presents financial information divided into three parts: per share operating performance, total investment return and ratios and supplemental data for the years ended October 31, 2007, 2006, 2005, 2004, and 2003, the seven month period ended October 31, 2002, and each of the five years in the period ended March 31, 2002. The first part, per share operating performance, details the changes on a per share basis of the Company's beginning net asset value to its ending net asset value. The second part, total investment return, is based on the market price of the Company's shares of stock. Part three, ratios and supplemental data, provides additional financial information related to the Company's performance.
| | | | | | | | | | | | | Seven Months | | | | | | | | | | | | | |
| | | | | | | | | | | | | Ended | | | | | | | | | | | | | |
PER SHARE OPERATING | | | | | | | | | | | | October 31, | | | | | | | | | | | | | |
PERFORMANCE | | 2007 | | 2006 | | 2005 | | 2004 | | 2003 | | 2002 | | 2002 | | 2001 | | 2000 | | 1999 | | 1998 | | 1997 | |
| | | | | | | | | | | | | | | | | | | | | | | | | | |
| Net asset value, beginning of period | | $ | 33.55 | | $ | 32.84 | | $ | 30.94 | | $ | 29.17 | | $ | 25.46 | | $ | 28.95 | | $ | 29.44 | | $ | 31.84 | | $ | 29.01 | | $ | 30.55 | | $ | 29.33 | | $ | 29.40 | |
| Net investment income | | | 0.78 | | | 1.06 | | | 0.88 | | | 0.82 | | | 0.95 | | | 0.59 | | | 1.13 | | | 1.31 | | | 2.11 | | | 1.04 | | | 1.26 | | | 1.29 | |
| Net gains (losses) on investments | | | 4.25 | | | 2.43 | | | 2.48 | | | 2.08 | | | 3.76 | | | (3.45 | ) | | (0.30 | ) | | (2.13 | ) | | 2.11 | | | (0.16 | ) | | 1.95 | | | 0.54 | |
| Total from investment operations | | | 5.03 | | | 3.49 | | | 3.36 | | | 2.90 | | | 4.71 | | | (2.86 | ) | | 0.83 | | | (0.82 | ) | | 4.22 | | | 0.88 | | | 3.21 | | | 1.83 | |
| Less distributions: | | | | | | | | | | | | | | | | | | | | | | | | | | | | | | | | | | | | | |
| Dividends from net investment income | | | 2.03 | | | 2.37 | | | - | | | 0.65 | | | 0.45 | | | 0.56 | | | 0.84 | | | 1.58 | | | 1.10 | | | 1.49 | | | 1.14 | | | 1.16 | |
| Distributions from capital gains | | | 0.27 | | | 0.41 | | | 1.46 | | | 0.48 | | | 0.55 | | | 0.07 | | | 0.48 | | | - | | | 0.29 | | | 0.93 | | | 0.85 | | | 0.74 | |
| Total distributions | | | 2.30 | | | 2.78 | | | 1.46 | | | 1.13 | | | 1.00 | | | 0.63 | | | 1.32 | | | 1.58 | | | 1.39 | | | 2.42 | | | 1.99 | | | 1.90 | |
| Net asset value, end of period | | $ | 36.28 | | $ | 33.55 | | $ | 32.84 | | $ | 30.94 | | $ | 29.17 | | $ | 25.46 | | $ | 28.95 | | $ | 29.44 | | $ | 31.84 | | $ | 29.01 | | $ | 30.55 | | $ | 29.33 | |
| | | | | | | | | | | | | | | | | | | | | | | | | | | | | | | | | | | | | | |
Per share market value, end of period1 | | $ | 26.00 | | $ | 26.00 | | $ | 26.00 | | $ | 26.00 | | $ | 26.00 | | $ | 26.00 | | $ | 26.00 | | $ | 26.00 | | $ | 26.00 | | $ | 26.00 | | $ | 26.00 | | | N/a | |
| | | | | | | | | | | | | | | | | | | | | | | | | | | | | | | | | | | | | | |
TOTAL INVESTMENT RETURN2 | | | 19.35 | % | | 13.40 | % | | 12.95 | % | | 11.14 | % | | 18.12 | % | | (18.85 | )% | | *3.20 | % | | (3.15 | )% | | 16.23 | % | | 3.38 | % | | 12.33 | % | | 7.05 | |
| | | | | | | | | | | | | | | | | | | | | | | | | | | | | | | | | | | | | | |
RATIOS/SUPPLEMENTAL DATA | | | | | | | | | | | | | | | | | | | | | | | | | | | | | | | | | | | | | |
| | | | | | | | | | | | | | | | | | | | | | | | | | | | | | | | | | | | | | |
| Net assets, end of period (in thousands) | | $ | 178,975 | | $ | 165,500 | | $ | 162,027 | | $ | 152,623 | | $ | 143,910 | | $ | 125,596 | | $ | 142,811 | | $ | 145,221 | | $ | 157,057 | | $ | 143,092 | | $ | 150,705 | | $ | 144,702 | |
Ratio of expenses to average net assets3 | | | 0.75 | % | | 0.73 | % | | 0.60 | % | | 0.73 | % | | 0.73 | % | | 0.71 | % | | *0.62 | % | | 0.49 | % | | 0.40 | % | | 0.32 | % | | 0.27 | % | | 0.27 | |
| Ratio of net investment income to | | | | | | | | | | | | | | | | | | | | | | | | | | | | | | | | | | | | | |
average net assets3 | | | 2.26 | % | | 3.20 | % | | 2.77 | % | | 2.70 | % | | 3.52 | % | | 3.78 | % | | *3.91 | % | | 4.23 | % | | 6.99 | % | | 3.50 | % | | 4.18 | % | | 4.39 | |
| Portfolio turnover rate | | | 51.23 | % | | 48.22 | % | | 57.54 | % | | 40.10 | % | | 52.51 | % | | 31.95 | % | | 67.18 | % | | 33.65 | % | | 94.21 | % | | 80.17 | % | | 26.98 | % | | 31.23 | |
1Unaudited - Based on stock trades, which are very limited, during that year.
2Unaudited - Computed as follows: income from investment operations divided by per share market value.
3Average is computed on a quarterly basis.
BMC FUND, INC. | | | | SCHEDULE I |
INVESTMENTS IN SECURITIES OF UNAFFILIATED ISSUERS | | |
October 31, 2007 | | | | |
| | | Coupon | | | | | | | | Percent | |
| | | Interest | | Maturity | | Face | | Market | | of Net | |
Debt Issuer | | Rate | | Date | | Amount | | Value | | Assets | |
| | | | | | | | | | | | |
FIXED INCOME: | | | | | | | | | | | |
OAKWOOD HOMES CORP1 | | | 7.875 | % | | 3/1/2004 | | $ | 1,000,000 | | $ | 480,000 | | | | |
ENRON CORP1 | | | 6.750 | % | | 7/1/2005 | | | 300,000 | | | - | | | | |
| GENERAL MOTORS ACCEPTANCE CORP | | | 6.125 | % | | 1/22/2008 | | | 250,000 | | | 249,322 | | | | |
| JPMORGAN CHASE & CO NIKKEI | | | 0.000 | % | | 1/30/2008 | | | 3,000,000 | | | 3,583,509 | | | | |
| UK TREASURY BDS | | | 5.000 | % | | 3/7/2008 | | | 3,925,377 | | | 4,146,345 | | | | |
| LEHMAN BROTHERS HLDGS INC NIKKEI | | | 0.000 | % | | 9/29/2008 | | | 3,000,000 | | | 4,114,500 | | | | |
| LEHMAN BROTHERS HLDGS INC INTL BASKET | | | 0.000 | % | | 11/15/2008 | | | 1,000,000 | | | 1,327,800 | | | | |
| AUSTRALIA GOVT BOND | | | 7.500 | % | | 9/15/2009 | | | 984,960 | | | 1,127,004 | | | | |
| LEHMAN BROTHERS HLDGS INC MEDIUM TERM | | | 0.000 | % | | 3/15/2011 | | | 3,000,000 | | | 3,866,400 | | | | |
| GENERAL MOTORS CORP | | | 9.400 | % | | 7/15/2021 | | | 250,000 | | | 245,000 | | | | |
| | | | | | | | | | | | | | | | | |
| TOTAL INVESTMENTS IN TAXABLE BONDS | | | | | | | | $ | 16,710,337 | | $ | 19,139,880 | | | 10.69 | % |
BMC FUND, INC. | | SCHEDULE I |
INVESTMENTS IN SECURITIES OF UNAFFILIATED ISSUERS (CONTINUED) |
October 31, 2007 | | | | |
| | | | | | | | | Percent | |
| | | Shares | | | | Market | | of Net | |
Company Name | | Held | | Cost | | Value | | Assets | |
| | | | | | | | | | |
MUTUAL FUNDS: | | | | | | | | | |
| U.S. LARGE CAP EQUITIES | | | | | | | | | |
| Large Cap Blend | | | | | | | | | |
| SELECTED AMERN SHS INC COM | | | 5,108.99 | | | 150,000 | | | 258,208 | | | | |
| SPDR TR UNIT SER 1 | | | 5,000.00 | | | 548,765 | | | 773,250 | | | | |
| Total Large Cap Blend | | | | | | 698,765 | | | 1,031,458 | | | 0.57 | % |
| | | | | | | | | | | | | | |
| Large Cap Growth | | | | | | | | | | | | | |
| SECTOR SPDR TR SBI INT-TEC | | | 15,000.00 | | | 406,520 | | | 426,000 | | | 0.24 | % |
| | | | | | | | | | | | | | |
| Large Cap Value | | | | | | | | | | | | | |
| DODGE & COX STK FD COM | | | 4,146.57 | | | 489,147 | | | 659,761 | | | | |
| EATON VANCE TAX ADVT COM | | | 13,100.00 | | | 292,238 | | | 385,140 | | | | |
| GABELLI DIVD & INCM TR COM | | | 17,000.00 | | | 333,790 | | | 371,280 | | | | |
| GMO TR VALUE III | | | 33,419.15 | | | 254,197 | | | 350,567 | | | | |
| Total Large Cap Value | | | | | | 1,369,372 | | | 1,766,748 | | | 0.99 | % |
| | | | | | | | | | | | | | |
| TOTAL U.S. LARGE CAP EQUITIES | | | | | | 2,474,657 | | | 3,224,206 | | | 1.80 | % |
| | | | | | | | | | | | | | |
| U.S. SMALL/MID CAP EQUITIES | | | | | | | | | | | | | |
| Mid Cap Blend | | | | | | | | | | | | | |
| VANGUARD STRATEGIC EQUITY | | | 16,920.62 | | | 306,714 | | | 423,523 | | | 0.24 | % |
| | | | | | | | | | | | | | |
| Mid Cap Growth | | | | | | | | | | | | | |
| BRANDYWINE FD INC COM | | | 10,053.62 | | | 225,000 | | | 384,752 | | | | |
| VANGUARD CAPITAL OPPOR FUND | | | 4,472.38 | | | 100,058 | | | 195,532 | | | | |
| Total Mid Cap Growth | | | | | | 325,058 | | | 580,284 | | | 0.32 | % |
| | | | | | | | | | | | | | |
| Small Cap Value | | | | | | | | | | | | | |
| CORNERCAP GROUP FDS CONTRARIAN | | | 9,354.54 | | | 100,000 | | | 119,832 | | | | |
| VANGUARD SMALL-CAP VALUE I | | | 10,224.95 | | | 100,000 | | | 176,074 | | | | |
| Total Small Cap Value | | | | | | 200,000 | | | 295,906 | | | 0.17 | % |
| | | | | | | | | | | | | | |
| TOTAL U.S. SMALL/MID CAP EQUITIES | | | | | | 831,772 | | | 1,299,713 | | | 0.73 | % |
| | | | | | | | | | | | | | |
| INTERNATIONAL EQUITIES | | | | | | | | | | | | | |
| World Stock | | | | | | | | | | | | | |
| POLARIS GLOBAL VALUE FUND | | | 4,938.85 | | | 105,000 | | | 105,445 | | | | |
| SPDR SER TR DJ GLOBAL TITA | | | 3,500.00 | | | 272,066 | | | 289,695 | | | | |
| Total World Stock | | | | | | 377,066 | | | 395,140 | | | 0.22 | % |
BMC FUND, INC. | | SCHEDULE I |
INVESTMENTS IN SECURITIES OF UNAFFILIATED ISSUERS (CONTINUED) |
October 31, 2007 | | | | |
| | | | | | | | | Percent | |
| | | Shares | | | | Market | | of Net | |
Company Name | | Held | | Cost | | Value | | Assets | |
| | | | | | | | | | |
MUTUAL FUNDS: | | | | | | | | | |
| Foreign Large Blend | | | | | | | | | |
| ISHARES TR MSCI EAFE IDX | | | 12,600.00 | | | 520,186 | | | 1,084,860 | | | | |
| UMB SCOUT INTERNATIONAL FUND | | | 5,625.88 | | | 200,000 | | | 221,603 | | | | |
| VANGUARD INTL GROWTH FUND | | | 10,944.15 | | | 553,811 | | | 1,018,791 | | | | |
| Total Foreign Large Blend | | | | | | 1,273,997 | | | 2,325,254 | | | 1.30 | % |
| | | | | | | | | | | | | | |
| Foreign Large Value | | | | | | | | | | | | | |
| GMO TR FOREIGN II | | | 63,902.32 | | | 661,348 | | | 1,322,778 | | | | |
| GMO TR INTL INTRINSIC VL I | | | 19,384.40 | | | 362,936 | | | 764,133 | | | | |
| ISHARES INC MSCI CDA INDEX | | | 25,500.00 | | | 466,086 | | | 920,040 | | | | |
| VANGUARD INTERNATIONAL VALUE | | | 2,449.54 | | | 108,000 | | | 118,533 | | | | |
| Total Foreign Large Value | | | | | | 1,598,370 | | | 3,125,484 | | | 1.75 | % |
| | | | | | | | | | | | | | |
| Foreign Small/Mid Value | | | | | | | | | | | | | |
| TWEEDY BROWNE FD INC GLOBA | | | 19,958.23 | | | 453,541 | | | 693,748 | | | 0.39 | % |
| | | | | | | | | | | | | | |
| Diversified Emerging Markets | | | | | | | | | | | | | |
| ISHARES TR MSCI EMERG MKT | | | 9,000.00 | | | 393,810 | | | 1,504,710 | | | 0.84 | % |
| | | | | | | | | | | | | | |
| Diversified Asia Pacific | | | | | | | | | | | | | |
| MORGAN S D WITTR ASIA COM | | | 56,000.00 | | | 582,115 | | | 1,358,560 | | | 0.76 | % |
| | | | | | | | | | | | | | |
| European Stock | | | | | | | | | | | | | |
| ISHARES INC MSCI GERMAN | | | 4,000.00 | | | 138,260 | | | 145,120 | | | | |
| ISHARES INC MSCI UTD KINGDOM | | | 13,700.00 | | | 248,982 | | | 372,914 | | | | |
| NEW IRELAND FUND INC | | | 16,379.00 | | | 188,388 | | | 474,336 | | | | |
| Total European Stock | | | | | | 575,630 | | | 992,370 | | | 0.55 | % |
| | | | | | | | | | | | | | |
| Japan Stock | | | | | | | | | | | | | |
| VANGUARD PACIFIC STOCK IND | | | 23,909.15 | | | 520,000 | | | 771,787 | | | | |
| VANGUARD PACIFIC VIPERS | | | 10,100.00 | | | 506,327 | | | 759,722 | | | | |
| Total Japan Stock | | | | | | 1,026,327 | | | 1,531,509 | | | 0.86 | % |
| | | | | | | | | | | | | | |
| Asia Ex-Japan Stock | | | | | | | | | | | | | |
| ISHARES INC MSCI AUSTRALIA | | | 41,500.00 | | | 663,914 | | | 1,440,465 | | | | |
| ISHARES INC MSCI S KOREA | | | 5,000.00 | | | 324,600 | | | 362,400 | | | | |
| ISHARES INC MSCI SINGAPORE | | | 151,500.00 | | | 1,063,650 | | | 2,384,610 | | | | |
| MATTHEWS INTL FDS ASIAN GR | | | 75,615.05 | | | 1,125,000 | | | 1,680,166 | | | | |
| TAIWAN FD INC COM | | | 5,000.00 | | | 105,444 | | | 122,500 | | | | |
| Total Asia Ex-Japan Stock | | | | | | 3,282,608 | | | 5,990,141 | | | 3.35 | % |
BMC FUND, INC. | | SCHEDULE I |
INVESTMENTS IN SECURITIES OF UNAFFILIATED ISSUERS (CONTINUED) |
October 31, 2007 | | | | |
| | | | | | | | | Percent | |
| | | Shares | | | | Market | | of Net | |
Company Name | | Held | | Cost | | Value | | Assets | |
| | | | | | | | | | |
MUTUAL FUNDS: | | | | | | | | | |
| Latin America Stock | | | | | | | | | |
| ISHARES INC MSCI BRAZIL | | | 4,000.00 | | | 240,237 | | | 342,400 | | | | |
| ISHARES INC MSCI MEXICO | | | 4,000.00 | | | 157,040 | | | 247,520 | | | | |
| Total Latin America Stock | | | | | | 397,277 | | | 589,920 | | | 0.33 | % |
| | | | | | | | | | | | | | |
| TOTAL INTERNATIONAL EQUITIES | | | | | | 9,960,741 | | | 18,506,836 | | | 10.34 | % |
| | | | | | | | | | | | | | |
| SPECIALTY FUNDS | | | | | | | | | | | | | |
| Utilities | | | | | | | | | | | | | |
| JOHN HANCOCK PATRIOT PREM | | | 11,974.00 | | | 152,045 | | | 126,805 | | | 0.07 | % |
| | | | | | | | | | | | | | |
| Health | | | | | | | | | | | | | |
| ISHARES DJ US PHRM | | | 3,000.00 | | | 158,105 | | | 165,870 | | | 0.09 | % |
| | | | | | | | | | | | | | |
| Natural Resources | | | | | | | | | | | | | |
| ENERPLUS RES FD UNIT TR G | | | 5,000.00 | | | 218,766 | | | 241,900 | | | | |
| ISHARES DJ US OIL & GAS EX | | | 7,500.00 | | | 448,713 | | | 496,050 | | | | |
| ISHARES DJ US OIL EQUIPMENT | | | 7,500.00 | | | 449,902 | | | 473,325 | | | | |
| OIL SVC HOLDRS TR DEPOSTRY | | | 4,000.00 | | | 535,335 | | | 760,400 | | | | |
| POWERSHARES ETF TRUST WATE | | | 15,000.00 | | | 268,469 | | | 331,500 | | | | |
| POWERSHS DB MULTI SECT DB | | | 10,000.00 | | | 283,175 | | | 292,700 | | | | |
| PROVIDENT ENERGY TR TR UNI | | | 20,000.00 | | | 228,129 | | | 263,400 | | | | |
| VANGUARD MATERIALS | | | 6,500.00 | | | 555,221 | | | 597,155 | | | | |
| Total Natural Resources | | | | | | 2,987,710 | | | 3,456,430 | | | 1.93 | % |
| | | | | | | | | | | | | | |
| Precious Metals | | | | | | | | | | | | | |
| ISHARES COMEX GOLD TR | | | 30,000.00 | | | 1,762,368 | | | 2,358,000 | | | | |
| MARKET VECTORS ETF TR GOLD | | | 10,000.00 | | | 373,966 | | | 506,000 | | | | |
| Total Precious Metals | | | | | | 2,136,334 | | | 2,864,000 | | | 1.60 | % |
| | | | | | | | | | | | | | |
| Technology | | | | | | | | | | | | | |
| ULTRA SEMICONDUCTORS PROSHARES | | | 2,500.00 | | | 209,168 | | | 209,775 | | | 0.12 | % |
| | | | | | | | | | | | | | |
| Long-Short | | | | | | | | | | | | | |
| HUSSMAN STRATEGIC GROWTH FUND | | | 278,211.27 | | | 4,500,000 | | | 4,493,112 | | | 2.51 | % |
| | | | | | | | | | | | | | |
| TOTAL SPECIALTY FUNDS | | | | | | 10,143,362 | | | 11,315,992 | | | 6.32 | % |
| | | | | | | | | | | | | | |
| TOTAL INVESTMENTS IN MUTUAL FUNDS | | | | | $ | 23,410,532 | | $ | 34,346,747 | | | 19.19 | % |
BMC FUND, INC. | | | SCHEDULE I |
INVESTMENTS IN SECURITIES OF UNAFFILIATED ISSUERS (CONTINUED) | |
October 31, 2007 | | | |
| | | | | Market | | Percent of | |
Company Name | | Cost | | Value | | Net Assets | |
| | | | | | | | |
OTHER INVESTMENTS: | | | | | | | |
| | | | | | | | |
LIMITED PARTNERSHIPS: | | | | | | | |
| INSTITUTIONAL BENCHMARKS SERIES LLC: | | | | | | | |
| -CONVERTIBLE ARBITRAGE SERIES | | $ | 1,475,886 | | $ | 1,870,301 | | | | |
| -EVENT DRIVEN SERIES | | | 2,298,592 | | | 3,513,127 | | | | |
| -MERGER ARBITRAGE SERIES | | | 1,600,000 | | | 2,329,770 | | | | |
| JMG CAPITAL PARTNERS LP | | | 609,767 | | | 1,872,789 | | | | |
| LMC COMPASS FUND, LP | | | 1,500,000 | | | 2,136,925 | | | | |
| MARINER PARTNERS, LP | | | 750,000 | | | 1,703,833 | | | | |
| RYE SELECT BROAD MARKET FUND LP | | | 1,000,000 | | | 1,080,504 | | | | |
| STARK INVESTMENTS LP | | | 1,000,000 | | | 3,038,523 | | | | |
| STARK STRUCTURED FINANCE ONSHORE FUND, LP | | | 1,000,000 | | | 1,185,603 | | | | |
| WALNUT INVESTMENT PARTNERS LP | | | 235,567 | | | 69,140 | | | | |
| TOTAL LIMITED PARTNERSHIPS | | | 11,469,812 | | | 18,800,515 | | | 10.50 | % |
| | | | | | | | | | | |
CALL OPTIONS: | | | | | | | | | | |
| CAL-MAINE FOODS INC CALL OPTION $30 EXP 2/16/08 | | | 15,063 | | | 9,250 | | | | |
| CAL-MAINE FOODS INC CALL OPTION $35 EXP 5/17/08 | | | 16,062 | | | 10,000 | | | | |
| CBOE JUMBO VOLATILITY INDEX CALL OPTION $25 EXP 11/17/07 | | | 106,250 | | | 60,000 | | | | |
| CBOE JUMBO VOLATILITY INDEX CALL OPTION $30 EXP 11/17/07 | | | 96,250 | | | 65,000 | | | | |
| TOTAL CALL OPTIONS | | | 233,625 | | | 144,250 | | | 0.08 | % |
| | | | | | | | | | | |
| TOTAL OTHER INVESTMENTS | | $ | 11,703,437 | | $ | 18,944,765 | | | 10.58 | % |
BMC FUND, INC. | | SCHEDULE I |
INVESTMENTS IN SECURITIES OF UNAFFILIATED ISSUERS (CONTINUED) | | |
October 31, 2007 |
| | | | | | | | | | | Percent | |
Sectors and | | Shares | | | | | | Market | | of Net | |
Industries | | Held | | Company Name | | Cost | | Value | | Assets | |
| | | | | | | | | | | | |
COMMON STOCKS: | | | | | | | | | | | | | | | | |
| CONSUMER DISCRETIONARY | | | | | | | | | | | | | | | | |
| Consumer Durables & Apparel | | | 170,600.00 | | | HEAD N V NY REGISTRY SH | | $ | 343,660 | | $ | 636,338 | | | 0.36 | % |
| | | | | | | | | | | | | | | | | |
| Consumer Services | | | 21,300.00 | | | MCDONALDS CORP COM | | | 439,383 | | | 1,272,675 | | | 0.71 | % |
| | | | | | | | | | | | | | | | | |
| Media | | | 30,000.00 | | | DISNEY WALT CO COM | | | 691,627 | | | 1,038,900 | | | | |
| | | | 500.00 | | | GRUPO TELEVISA SA DE SP AD | | | 14,532 | | | 12,425 | | | | |
| | | | 55,000.00 | | | NEWS CORP CL B | | | 958,567 | | | 1,261,150 | | | | |
| | | | | | | | | | 1,664,726 | | | 2,312,475 | | | 1.29 | % |
| | | | | | | | | | | | | | | | | |
| Retailing | | | 3,000.00 | | | AARON RENTS INC COM | | | 61,227 | | | 63,540 | | | | |
| | | | 30,000.00 | | | HOME DEPOT INC COM | | | 1,027,660 | | | 945,300 | | | | |
| | | | | | | | | | 1,088,887 | | | 1,008,840 | | | 0.56 | % |
| | | | | | | | | | | | | | | | | |
| TOTAL CONSUMER DISCRETIONARY | | | | | | | | | 3,536,656 | | | 5,230,328 | | | 2.92 | % |
| | | | | | | | | | | | | | | | | |
| CONSUMER STAPLES | | | | | | | | | | | | | | | | |
| Food & Staples Retailing | | | 3,000.00 | | | COSTCO COMPANIES INC COM | | | 192,688 | | | 195,855 | | | | |
| | | | 56,000.00 | | | KROGER CO COM | | | 979,120 | | | 1,645,840 | | | | |
| | | | 32,000.00 | | | SAFEWAY INC COM NEW | | | 598,650 | | | 1,088,000 | | | | |
| | | | 3,000.00 | | | SYSCO CORP COM | | | 87,749 | | | 102,045 | | | | |
| | | | | | | | | | 1,858,207 | | | 3,031,740 | | | 1.69 | % |
| | | | | | | | | | | | | | | | | |
| Food, Beverage & Tobacco | | | 10,000.00 | | | ANHEUSER BUSCH COS INC COM | | | 444,333 | | | 512,800 | | | | |
| | | | 10,000.00 | | | CADBURY SCHWEPPES PLC ADR | | | 320,147 | | | 532,400 | | | | |
| | | | 1,000.00 | | | CAMPBELL SOUP CO COM | | | 34,245 | | | 36,980 | | | | |
| | | | 22,000.00 | | | COCA COLA CO COM | | | 910,468 | | | 1,358,720 | | | | |
| | | | 10,000.00 | | | DIAGEO P L C SPON ADR NEW | | | 584,722 | | | 917,500 | | | | |
| | | | 12,500.00 | | | GENERAL MLS INC COM | | | 615,776 | | | 721,625 | | | | |
| | | | 11,900.00 | | | HEINZ H J CO COM | | | 399,291 | | | 556,682 | | | | |
| | | | 22,800.00 | | | NESTLE S A SPONSORED ADR | | | 1,194,924 | | | 2,628,576 | | | | |
| | | | 4,000.00 | | | PEPSICO INC COM | | | 286,163 | | | 294,880 | | | | |
| | | | 3,500.00 | | | SADIA | | | 126,325 | | | 238,840 | | | | |
| | | | 10,000.00 | | | SMITHFIELD FOODS INC COM | | | 295,713 | | | 286,700 | | | | |
| | | | | | | | | | 5,212,107 | | | 8,085,703 | | | 4.52 | % |
| | | | | | | | | | | | | | | | | |
| Household & Personal Products | | | 35,000.00 | | | AVON PRODS INC COM | | | 940,373 | | | 1,434,300 | | | | |
| | | | 18,000.00 | | | PROCTER & GAMBLE CO COM | | | 1,130,321 | | | 1,251,360 | | | | |
| | | | 2,000.00 | | | USANA HEALTH SCIENCES COM | | | 75,958 | | | 81,620 | | | | |
| | | | | | | | | | 2,146,652 | | | 2,767,280 | | | 1.55 | % |
| | | | | | | | | | | | | | | | | |
| TOTAL CONSUMER STAPLES | | | | | | | | | 9,216,966 | | | 13,884,723 | | | 7.76 | % |
| | | | | | | | | | | | | | | | | |
| ENERGY | | | 15,000.00 | | | ADVANTAGE ENERGY INCOM TR | | | 166,993 | | | 189,900 | | | | |
| | | | 18,000.00 | | | BP PLC SPONSORED ADR | | | 1,115,427 | | | 1,403,820 | | | | |
| | | | 7,500.00 | | | CHEVRON CORP | | | 338,776 | | | 686,325 | | | | |
| | | | 23,036.00 | | | CONOCOPHILLIPS COM | | | 746,332 | | | 1,957,138 | | | | |
| | | | 2,000.00 | | | CROSSTEX ENERGY, LP | | | 71,001 | | | 68,480 | | | | |
| | | | 4,500.00 | | | DEVON ENERGY CORP NEW COM | | | 370,758 | | | 409,900 | | | | |
| | | | 6,500.00 | | | DIAMOND OFFSHORE DRILL COM | | | 692,441 | | | 724,295 | | | | |
| | | | 5,000.00 | | | DOUBLE HULL TANKERS COM | | | 73,837 | | | 77,275 | | | | |
| | | | 25,340.00 | | | ENTERPRISE PRODS PARTN COM | | | 470,956 | | | 810,627 | | | | |
| | | | 9,504.00 | | | EXXON MOBIL CORP COM | | | 520,472 | | | 874,273 | | | | |
BMC FUND, INC. | | SCHEDULE I |
INVESTMENTS IN SECURITIES OF UNAFFILIATED ISSUERS (CONTINUED) | | |
October 31, 2007 |
| | | | | | | | | | | | | | | | Percent | |
Sectors and | | | Shares | | | | | | | | | Market | | | of Net | |
Industries | | | Held | | | Company Name | | | Cost | | | Value | | | Assets | |
| | | | | | | | | | | | | | | | | |
| | | | 2,000.00 | | | FRONTIER OIL CORP COM | | | 74,085 | | | 91,580 | | | | |
| | | | 2,000.00 | | | GENERAL MARITIME CORP SHS | | | 60,875 | | | 54,060 | | | | |
| | | | 5,000.00 | | | INERGY L P UNIT LTD PTNR | | | 178,794 | | | 174,400 | | | | |
| | | | 5,057.00 | | | KINDER MORGAN MANAGEMENT L | | | 255,919 | | | 256,896 | | | | |
| | | | 15,850.00 | | | KINDER MORGAN MGMT FRACTIONAL SH | | | 8 | | | 8 | | | | |
| | | | 3,000.00 | | | KNIGHTSBRIDGE TANKERS ORD | | | 78,032 | | | 76,440 | | | | |
| | | | 500.00 | | | MARATHON OIL CORP COM | | | 23,527 | | | 29,565 | | | | |
| | | | 10,000.00 | | | MARKWEST ENERGY PARTNERS L | | | 349,048 | | | 327,700 | | | | |
| | | | 1,000.00 | | | NABORS INDUSTRIES LTD SHS | | | 27,841 | | | 27,830 | | | | |
| | | | 9,000.00 | | | NATIONAL OILWELL VARCO COM | | | 604,600 | | | 628,960 | | | | |
| | | | 7,000.00 | | | NOBLE CORPORATION SHS | | | 335,816 | | | 370,650 | | | | |
| | | | 3,000.00 | | | NORDIC AMERICAN TANKER COM | | | 114,402 | | | 115,370 | | | | |
| | | | 2,000.00 | | | ONEOK PARTNERS LP | | | 139,118 | | | 126,020 | | | | |
| | | | 20,000.00 | | | PENGROWTH ENERGY TR TR UNI | | | 351,250 | | | 378,580 | | | | |
| | | | 10,000.00 | | | PENN VIRGINIA HOLDINGS LP | | | 318,222 | | | 330,000 | | | | |
| | | | 7,500.00 | | | PENN WEST ENERGY TR TR UNI | | | 213,258 | | | 239,250 | | | | |
| | | | 3,500.00 | | | ROYAL DUTCH SHELL ADR A | | | 187,274 | | | 306,285 | | | | |
| | | | 8,792.00 | | | ROYAL DUTCH SHELL ADR B | | | 431,360 | | | 767,102 | | | | |
| | | | 3,000.00 | | | SAN JUAN BASIN ROYALTY TRU | | | 91,906 | | | 111,150 | | | | |
| | | | 1,000.00 | | | SASOL | | | 45,490 | | | 50,860 | | | | |
| | | | 2,050.00 | | | SUNCOR ENERGY INC COM | | | 190,444 | | | 217,721 | | | | |
| | | | 3,500.00 | | | SUNOCO LOGISTICS PT LP COM | | | 202,326 | | | 205,450 | | | | |
| | | | 2,000.00 | | | SUPERIOR ENERGY SERVICES | | | 78,688 | | | 67,960 | | | | |
| | | | 4,500.00 | | | TENARIS S A SPONSORED ADR | | | 218,977 | | | 242,100 | | | | |
| | | | 10,000.00 | | | TEPPCO PARTNERS L P UT LTD | | | 323,635 | | | 402,600 | | | | |
| | | | 1,000.00 | | | TIDEWATER INC COM | | | 72,402 | | | 54,670 | | | | |
| | | | 2,000.00 | | | VALERO ENERGY CORP NEW COM | | | 128,093 | | | 136,660 | | | | |
| | | | 5,088.00 | | | WEATHERFORD INTL LTD COM | | | 305,834 | | | 317,162 | | | | |
| | | | 2,500.00 | | | XTO ENERGY INC COM | | | 145,323 | | | 165,950 | | | | |
| TOTAL ENERGY | | | | | | | | | 10,113,540 | | | 13,475,012 | | | 7.53 | % |
| | | | | | | | | | | | | | | | | |
| FINANCIALS | | | | | | | | | | | | | | | | |
| Banks | | | 4,000.00 | | | BANCO BILBAO VIZCAYA ARGEN | | | 101,491 | | | 100,960 | | | | |
| | �� | | 16,000.00 | | | BANK OF AMERICA CORP COM | | | 779,164 | | | 772,130 | | | | |
| | | | 12,000.00 | | | FIRST CHARTER CORP. | | | 268,562 | | | 363,600 | | | | |
| | | | 1,000.00 | | | ICICI BANK | | | 41,857 | | | 69,440 | | | | |
| | | | 13,700.00 | | | US BANCORP DEL COM NEW | | | 229,609 | | | 454,292 | | | | |
| | | | | | | | | | 1,420,683 | | | 1,760,422 | | | 0.99 | % |
| | | | | | | | | | | | | | | | | |
| Diversified Financials | | | 20,800.00 | | | ALLIANCE BERNSTEIN HLDG UN | | | 905,410 | | | 1,773,844 | | | | |
| | | | 14,000.00 | | | ALLIED CAP CORP COM | | | 435,017 | | | 412,470 | | | | |
| | | | 9,750.00 | | | BROOKFIELD ASSET MANAGEMEN | | | 351,327 | | | 397,702 | | | | |
| | | | 8,133.00 | | | CITIGROUP INC COM | | | 295,171 | | | 340,773 | | | | |
| | | | 1,000.00 | | | CME GROUP | | | 554,723 | | | 576,750 | | | | |
| | | | 6,582.00 | | | HSBC HLDGS PLC SPON ADR NE | | | 505,109 | | | 655,041 | | | | |
| | | | 5,000.00 | | | INVESTOOLS INC | | | 49,936 | | | 65,950 | | | | |
| | | | 5,000.00 | | | LLOYDS TSB GROUP PLC SPONS | | | 205,944 | | | 228,600 | | | | |
| | | | 50.00 | | | MOODYS CORP COM | | | 3,274 | | | 2,186 | | | | |
| | | | 7,500.00 | | | MORGAN STANLEY COM NEW | | | 328,301 | | | 504,450 | | | | |
| | | | 4,000.00 | | | OPTIONS EXPRESS HOLDINGS | | | 92,497 | | | 113,440 | | | | |
| | | | | | | | | | 3,726,709 | | | 5,071,206 | | | 2.83 | % |
| | | | | | | | | | | | | | | | | |
| Insurance | | | 19,000.00 | | | AFLAC INC COM | | | 992,199 | | | 1,192,820 | | | | |
| | | | 12,000.00 | | | AMERICAN INTL GROUP COM | | | 832,372 | | | 756,940 | | | | |
BMC FUND, INC. | | SCHEDULE I |
INVESTMENTS IN SECURITIES OF UNAFFILIATED ISSUERS (CONTINUED) | | |
October 31, 2007 |
| | | | | | | | | | | | | | | | Percent | |
Sectors and | | | Shares | | | | | | | | | Market | | | of Net | |
Industries | | | Held | | | Company Name | | | Cost | | | Value | | | Assets | |
| | | | | | | | | | | | | | | | | |
| | | | 2.00 | | | BERKSHIRE HATHAWAY A | | | 218,700 | | | 265,000 | | | | |
| | | | 8,000.00 | | | MANULIFE FINL CORP COM | | | 247,078 | | | 371,120 | | | | |
| | | | 40,000.00 | | | MARSH & MCLENNAN COS COM | | | 1,154,788 | | | 1,035,600 | | | | |
| | | | 2,500.00 | | | PRUDENTIAL FINL INC COM | | | 247,370 | | | 241,800 | | | | |
| | | | | | | | | | 3,692,507 | | | 3,863,280 | | | 2.16 | % |
| | | | | | | | | | | | | | | | | |
| Real Estate | | | 20,000.00 | | | CAPITALSOURCE INC COM | | | 483,546 | | | 357,525 | | | | |
| | | | 8,000.00 | | | VENTAS INC | | | 274,004 | | | 327,620 | | | | |
| | | | | | | | | | 757,550 | | | 685,145 | | | 0.38 | % |
| | | | | | | | | | | | | | | | | |
| TOTAL FINANCIALS | | | | | | | | | 9,597,449 | | | 11,380,053 | | | 6.36 | % |
| | | | | | | | | | | | | | | | | |
| HEALTH CARE | | | | | | | | | | | | | | | | |
| Health Care Equipment & Services | | | 166.00 | | | AMEDISYS INC COM | | | 5,176 | | | 7,047 | | | | |
| | | | 5,000.00 | | | BARD C R INC COM | | | 206,257 | | | 418,050 | | | | |
| | | | 2,000.00 | | | BAXTER INTL INC COM | | | 101,072 | | | 109,640 | | | | |
| | | | 27,500.00 | | | CIGNA CORP COM | | | 653,587 | | | 1,439,725 | | | | |
| | | | 500.00 | | | COVENTRY HEALTH CARE COM | | | 28,213 | | | 30,155 | | | | |
| | | | 7,000.00 | | | LABORATORY CORP AMER HLDGS | | | 321,525 | | | 481,250 | | | | |
| | | | 2,000.00 | | | MEDCO HEALTH SOLUTIONS COM | | | 170,002 | | | 188,760 | | | | |
| | | | 22,000.00 | | | MEDTRONIC INC COM | | | 1,186,791 | | | 1,043,680 | | | | |
| | | | 2,500.00 | | | PEDIATRIX MED GROUP COM | | | 116,869 | | | 163,750 | | | | |
| | | | 4,000.00 | | | QUEST DIAGNOSTICS INC COM | | | 198,789 | | | 210,720 | | | | |
| | | | 550.00 | | | UNITEDHEALTH GROUP INC COM | | | 27,866 | | | 27,032 | | | | |
| | | | | | | | | | 3,016,147 | | | 4,119,809 | | | 2.30 | % |
| | | | | | | | | | | | | | | | | |
| Pharmaceuticals & Biotechnology | | | 200.00 | | | AMGEN INC COM | | | 11,330 | | | 11,622 | | | | |
| | | | 12,500.00 | | | BIOVAIL CORP. | | | 241,549 | | | 250,125 | | | | |
| | | | 40,000.00 | | | BRISTOL MYERS SQUIBB COM | | | 965,578 | | | 1,199,600 | | | | |
| | | | 100.00 | | | GILEAD SCIENCES INC COM | | | 4,127 | | | 4,619 | | | | |
| | | | 10,000.00 | | | GLAXOSMITHKLINE PLC SPONSO | | | 523,306 | | | 512,500 | | | | |
| | | | 12,500.00 | | | JOHNSON & JOHNSON COM | | | 764,836 | | | 814,625 | | | | |
| | | | 500.00 | | | MATRIXX INITIATIVES COM | | | 12,376 | | | 8,655 | | | | |
| | | | 30,000.00 | | | MERCK & CO INC COM | | | 827,577 | | | 1,747,800 | | | | |
| | | | 250.00 | | | PDL BIOPHARMA INC COM | | | 7,829 | | | 5,300 | | | | |
| | | | 42,500.00 | | | PFIZER INC COM | | | 1,088,257 | | | 1,045,675 | | | | |
| | | | 45,000.00 | | | SCHERING PLOUGH CORP COM | | | 935,416 | | | 1,373,400 | | | | |
| | | | 11,500.00 | | | SCIELE PHARMA INC COM | | | 260,885 | | | 286,960 | | | | |
| | | | 15,000.00 | | | WYETH COM | | | 679,752 | | | 729,450 | | | | |
| | | | | | | | | | 6,322,818 | | | 7,990,331 | | | 4.46 | % |
| | | | | | | | | | | | | | | | | |
| TOTAL HEALTH CARE | | | | | | | | | 9,338,965 | | | 12,110,140 | | | 6.76 | % |
| | | | | | | | | | | | | | | | | |
| INDUSTRIALS | | | | | | | | | | | | | | | | |
| Capital Goods | | | 12,000.00 | | | 3M COMPANY | | | 1,044,512 | | | 1,036,320 | | | | |
| | | | 7,500.00 | | | CATERPILLAR INC DEL COM | | | 580,837 | | | 559,575 | | | | |
| | | | 10,000.00 | | | COOPER INDUSTRIES | | | 500,421 | | | 523,900 | | | | |
| | | | 7,500.00 | | | DRS TECHNOLOGIES INC COM | | | 215,334 | | | 430,800 | | | | |
| | | | 7,000.00 | | | GENERAL DYNAMICS CORP COM | | | 335,505 | | | 636,720 | | | | |
| | | | 38,000.00 | | | GENERAL ELEC CO COM | | | 1,272,352 | | | 1,564,080 | | | | |
| | | | 3,000.00 | | | II-VI INC. | | | 86,995 | | | 96,120 | | | | |
| | | | 2,000.00 | | | KENNAMETAL | | | 157,759 | | | 182,420 | | | | |
| | | | 12,200.00 | | | L-3 COMMUNICATNS HLDGS COM | | | 1,076,286 | | | 1,333,868 | | | | |
| | | | 2,000.00 | | | MANITOWOC INC COM | | | 92,240 | | | 98,520 | | | | |
BMC FUND, INC. | | SCHEDULE I |
INVESTMENTS IN SECURITIES OF UNAFFILIATED ISSUERS (CONTINUED) | | |
October 31, 2007 |
| | | | | | | | | | | | | | | | Percent | |
Sectors and | | | Shares | | | | | | | | | Market | | | of Net | |
Industries | | | Held | | | Company Name | | | Cost | | | Value | | | Assets | |
| | | | | | | | | | | | | | | | | |
| | | | 3,000.00 | | | PARKER HANNIFIN CORP COM | | | 202,034 | | | 228,710 | | | | |
| | | | 3,000.00 | | | PRECISION CASTPARTS CORP | | | 396,822 | | | 432,930 | | | | |
| | | | 5,000.00 | | | WOODWARD GOVERNOR CO. | | | 321,962 | | | 335,000 | | | | |
| | | | | | | | | | 6,283,059 | | | 7,458,963 | | | 4.17 | % |
| | | | | | | | | | | | | | | | | |
| Commercial Services & Supplies | | | 3,000.00 | | | CINTAS | | | 109,870 | | | 109,670 | | | | |
| | | | 11,000.00 | | | STERICYCLE INC COM | | | 445,435 | | | 627,630 | | | | |
| | | | | | | | | | 555,305 | | | 737,300 | | | 0.41 | % |
| | | | | | | | | | | | | | | | | |
| TOTAL INDUSTRIALS | | | | | | | | | 6,838,364 | | | 8,196,263 | | | 4.58 | % |
| | | | | | | | | | | | | | | | | |
| INFORMATION TECHNOLOGY | | | | | | | | | | | | | | | | |
| Software & Services | | | 10,000.00 | | | BMC SOFTWARE | | | 339,147 | | | 338,400 | | | | |
| | | | 200.00 | | | CACI INTL INC CL A | | | 9,943 | | | 10,770 | | | | |
| | | | 200.00 | | | COGNIZANT TECHNOLOGY SOLUT | | | 7,825 | | | 8,292 | | | | |
| | | | 2,950.00 | | | GLOBAL SOURCES | | | 48,941 | | | 95,610 | | | | |
| | | | 53,000.00 | | | MICROSOFT CORP COM | | | 1,410,540 | | | 1,950,930 | | | | |
| | | | 8,000.00 | | | ORACLE CORP COM | | | 141,566 | | | 175,110 | | | | |
| | | | 10,000.00 | | | UNITED ONLINE INC COM | | | 114,228 | | | 176,000 | | | | |
| | | | | | | | | | 2,072,190 | | | 2,755,112 | | | 1.54 | % |
| | | | | | | | | | | | | | | | | |
| Technology Hardware & Equipment | | | 4,500.00 | | | CISCO SYS INC COM | | | 123,066 | | | 144,535 | | | | |
| | | | 25,000.00 | | | E M C CORP MASS COM | | | 521,525 | | | 634,750 | | | | |
| | | | 15,000.00 | | | HEWLETT PACKARD CO COM | | | 365,950 | | | 775,200 | | | | |
| | | | 10,000.00 | | | INTERNATIONAL BUS MACH COM | | | 728,412 | | | 1,161,200 | | | | |
| | | | 3,000.00 | | | NOKIA CORP SPONSORED ADR | | | 110,685 | | | 119,160 | | | | |
| | | | 10,500.00 | | | SEAGATE TECHNOLOGY SHS | | | 291,381 | | | 292,320 | | | | |
| | | | 10,000.00 | | | TYCO ELECTRONICS | | | 212,529 | | | 356,700 | | | | |
| | | | 14,500.00 | | | WESTERN DIGITAL CORP COM | | | 332,820 | | | 360,490 | | | | |
| | | | | | | | | | 2,686,368 | | | 3,844,355 | | | 2.15 | % |
| | | | | | | | | | | | | | | | | |
| Semiconductors & Semiconductor Equipment | | | 4,000.00 | | | INTEL CORP COM | | | 98,880 | | | 107,600 | | | | |
| | | | 2,500.00 | | | MEMC ELECTRONIC MATERIALS | | | 154,049 | | | 183,050 | | | | |
| | | | 1,500.00 | | | NVIDIA CORP COM | | | 56,947 | | | 53,070 | | | | |
| | | | | | | | | | 309,876 | | | 343,720 | | | 0.19 | % |
| | | | | | | | | | | | | | | | | |
| TOTAL INFORMATION TECHNOLOGY | | | | | | | | | 5,068,434 | | | 6,943,187 | | | 3.88 | % |
| | | | | | | | | | | | | | | | | |
| MATERIALS | | | 12,000.00 | | | ALLIANCE RES PARTNR LP UT | | | 207,160 | | | 461,280 | | | | |
| | | | 5,820.00 | | | ANGLO AMERN PLC ADR | | | 159,651 | | | 203,409 | | | | |
| | | | 10,000.00 | | | ARCHER DANIELS MIDLAND COM | | | 330,233 | | | 357,800 | | | | |
| | | | 1,000.00 | | | B A S F A G SPONSORED ADR | | | 123,271 | | | 138,556 | | | | |
| | | | 10,000.00 | | | BHP BILLITON LTD SPONSORED | | | 594,539 | | | 743,000 | | | | |
| | | | 2,500.00 | | | CAMECO CORP COM | | | 117,508 | | | 122,625 | | | | |
| | | | 1,012.00 | | | CEMEX S A SPON ADR 5 ORD | | | 34,346 | | | 31,038 | | | | |
| | | | 2,000.00 | | | CLEVELAND CLIFFS | | | 135,702 | | | 160,100 | | | | |
| | | | 6,500.00 | | | FREEPORT MCMORAN COPPER & | | | 653,890 | | | 764,920 | | | | |
| | | | 7,000.00 | | | MECHEL OAO | | | 420,329 | | | 498,850 | | | | |
| | | | 2,500.00 | | | METAL MANAGEMENT | | | 132,925 | | | 128,425 | | | | |
| | | | 1,500.00 | | | NUCOR CORP COM | | | 100,114 | | | 93,030 | | | | |
| | | | 2,000.00 | | | POTASH CORPORATION | | | 158,058 | | | 185,640 | | | | |
| | | | 500.00 | | | RIO TINTO | | | 129,747 | | | 187,500 | | | | |
| | | | 5,000.00 | | | SOUTHERN COPPER CORP | | | 559,134 | | | 676,700 | | | | |
| | | | 4,000.00 | | | TITANIUM METALS CORP | | | 135,151 | | | 139,600 | | | | |
| TOTAL MATERIALS | | | | | | | | | 3,991,758 | | | 4,892,473 | | | 2.73 | % |
BMC FUND, INC. | | SCHEDULE I |
INVESTMENTS IN SECURITIES OF UNAFFILIATED ISSUERS (CONTINUED) | | |
October 31, 2007 |
| | | | | | | | | | | | | | | | Percent | |
Sectors and | | | Shares | | | | | | | | | Market | | | of Net | |
Industries | | | Held | | | Company Name | | | Cost | | | Value | | | Assets | |
| | | | | | | | | | | | | | | | | |
| TELECOMMUNICATION SERVICES | | | 6,000.00 | | | AMERICA MOVIL SA DE CV SPO | | | 316,261 | | | 389,790 | | | | |
| | | | 10,000.00 | | | AT&T CORP COM | | | 335,778 | | | 417,900 | | | | |
| | | | 1,300.00 | | | CHINA MOBILE HONG KONG SPO | | | 60,105 | | | 134,784 | | | | |
| | | | 8,250.00 | | | CHUNGHWA TELECOM CO SPONSO | | | 136,617 | | | 158,400 | | | | |
| | | | 1,000.00 | | | MILLICOM INTL CELLULAR | | | 95,590 | | | 117,480 | | | | |
| | | | 6,000.00 | | | MOBILE TELESYS OJSC SPONSO | | | 411,482 | | | 475,500 | | | | |
| | | | 17,500.00 | | | PARTNER COMMUNICATIONS | | | 269,948 | | | 333,325 | | | | |
| | | | 500.00 | | | SK TELECOM LTD SPONSORED A | | | 9,648 | | | 15,405 | | | | |
| | | | 14,221.00 | | | TELECOM CP NEW ZEALAND SPO | | | 208,204 | | | 238,770 | | | | |
| | | | 12,500.00 | | | TELECOMUNCA DE SAO PAU SPO | | | 264,168 | | | 427,750 | | | | |
| | | | 10,000.00 | | | VERIZON COMMUNICATIONS COM | | | 296,520 | | | 460,700 | | | | |
| TOTAL TELECOMMUNICATION SERVICES | | | | | | | | | 2,404,321 | | | 3,169,804 | | | 1.77 | % |
| | | | | | | | | | | | | | | | | |
| UTILITIES | | | 7,000.00 | | | AMERIGAS PARTNERS L P UNIT | | | 251,267 | | | 265,300 | | | | |
| | | | 1,000.00 | | | CENTERPOINT ENERGY | | | 18,505 | | | 16,760 | | | | |
| | | | 5,000.00 | | | COMPANHIA DE SANEAMENTO SP | | | 100,589 | | | 260,100 | | | | |
| | | | 5,000.00 | | | COMPANHIA PARANAENSE de EN | | | 69,495 | | | 82,500 | | | | |
| | | | 7,500.00 | | | ENDESA NACIONAL ELEC SPONS | | | 312,708 | | | 388,200 | | | | |
| | | | 5,000.00 | | | EXELON CORP COM | | | 131,176 | | | 413,900 | | | | |
| | | | 5,500.00 | | | ONEOK INC NEW COM | | | 113,272 | | | 274,670 | | | | |
| | | | 65,000.00 | | | TECO ENERGY INC COM | | | 931,803 | | | 1,093,950 | | | | |
| | | | 2,500.00 | | | VEOLIA ENVIRONMENT ADS | | | 189,873 | | | 224,325 | | | | |
| TOTAL UTILITIES | | | | | | | | | 2,118,688 | | | 3,019,705 | | | 1.69 | % |
| | | | | | | | | | | | | | | | | |
| TOTAL INVESTMENTS IN COMMON STOCKS | | | | | | | | $ | 62,225,141 | | $ | 82,301,688 | | | 45.98 | % |
BMC FUND, INC. | SCHEDULE I |
INVESTMENTS IN SECURITIES OF UNAFFILIATED ISSUERS (CONTINUED) |
October 31, 2007 | |
| | | | | | | | | Percent | |
| | | Shares | | | | Market | | of Net | |
Company Name | | Held | | Cost | | Value | | Assets | |
| | | | | | | | | | |
PREFERRED STOCKS: | | | | | | | | | |
| BLUE WATER TR I | | | 10 | | $ | 1,001,109 | | $ | 1,000,000 | | | | |
| LEARNINGSTATION.COM | | | 1,224,661 | | | 500,000 | | | 300,000 | | | | |
| | | | | | | | | | | | | | |
| TOTAL INVESTMENTS IN PREFERRED STOCKS | | | | | $ | 1,501,109 | | $ | 1,300,000 | | | 0.73 | % |
BMC FUND, INC. | SCHEDULE I |
INVESTMENTS IN SECURITIES OF UNAFFILIATED ISSUERS (CONTINUED) |
October 31, 2007 | |
| | | | | | | Market | | Percent of | |
Industries | | Company Name | | Cost | | Value | | Net Assets | |
| | | | | | | | | | |
| Short-term Investments | | Evergreen Institutional | | | | | | | |
| | | Money Market Fund | | $ | 5,613,786 | | $ | 5,613,786 | | | | |
| | | | | | | | | | | | | | |
| Total Short-term Investments | $ | 5,613,786 | | | 5,613,786 | | | 3.14 | % |
| | | | | | | | | | | | | | |
| TOTAL INVESTMENTS - MARKET VALUE | | | | $ | 161,646,866 | | | 90.32 | % |
| | | | | | | | | | | | | | |
| Aggregate gross unrealized appreciation of security values | | | | $ | 42,625,146 | | | | |
| Aggregate gross unrealized depreciation of security values | | | | | (2,092,667 | ) | | | |
| Net appreciation of security values | | | | | 40,532,479 | | | | |
| Tax cost of securities | | | | | | | | | 121,114,387 | | | | |
| | | | | | | | | | | | | | |
| Total market value of securities | | | | $ | 161,646,866 | | | | |
| |
INVESTMENTS IN AFFILIATES |
October 31, 2007 |
| | | | | Amount of Equity | | | | | |
| | | Number of | | In Net Profit | | | | | |
| | | Shares Held At | | And Loss | | Amount of | | Value at | |
| | | October 31, | | for the | | Dividends | | October 31, | |
Issuer | | 2007 | | Period | | (1) | | 2007 | |
| | | | | | | | | | |
| Broyhill Industries, Inc. - wholly owned | | | | | | | | | |
| subsidiary | | | 1,000 | | $ | (40,301 | ) | $ | - | | $ | 648,927 | |
| | | | | | | | | | | | | | |
| P. B. Realty, Inc. - wholly owned | | | | | | | | | | | | | |
| subsidiary | | | 1,000 | | | 881,107 | | | - | | | 17,859,814 | |
| | | | | | | | | | | | | | |
| TOTAL | | | | | $ | 840,806 | | $ | - | | $ | 18,508,741 | |
| (1) | All of the dividends received by BMC Fund, Inc. from its wholly owned subsidiaries have been credited to the investment account since BMC Fund, Inc. is accounting for its investment in the subsidiary companies on the equity method. |
Item. 2. Code of Ethics.
On July 26, 2003, the Board of Directors of the Registrant adopted a Code of Ethics for the principal executive officer and principal financial and accounting officer. The Code was amended by the Board of Directors on February 24, 2007, to update wording in reference to the Registrant’s independent registered public accounting firm.
(c)-(e) N/A
(f) A copy of the Code of Ethics is attached as an exhibit.
Item 3. Audit Committee Financial Expert.
The Board of Directors of the Registrant has determined that Brent B. Kincaid, a member of its Audit Committee, is an audit committee financial expert. Mr. Kincaid is an independent director of the Registrant.
Item 4. Principal Accountant Fees and Services.
(a) Audit Fees: $29,000.00 for the fiscal year ended October 31, 2006; $45,117.00 for the fiscal year ended October 31, 2007.
(b) Audit-Related Fees: $1,817.00 for the fiscal year ended October 31, 2006 and $2,033.00 for the fiscal year ended October 31, 2007.
(c) Tax Fees: $1,025.00 for the fiscal year ended October 31, 2006; $0.00 for the fiscal year ended October 31, 2007. These fees were incurred for review of the tax returns.
(d) All Other Fees: $2,370.00 for the fiscal year ended October 31, 2006; $899.00 for the fiscal year ended October 31, 2007. The fee was incurred for report production and printing.
(e)(1) A copy of the Audit Committee's pre-approval policies and procedures is attached as an exhibit.
(e)(2) One hundred percent of the services described in Items 4(b) through 4(d) were approved in accordance with the Audit Committee Pre-Approval Policy. As a result, none of such services was approved pursuant to paragraph (c)(7)(i)(C) of Rule 2-01 of Regulation S-X.
(f) None of the hours expended on the principal accountant's engagement to audit the Registrant's financial statements for the fiscal year ended October 31, 2007 was attributed to work performed by persons other than the principal accountant's full-time, permanent employees.
(g) N/A
(h) N/A
Item 5. Audit Committee of Listed Registrants.
N/A
Item 6. Schedule of Investments.
Included as a part of the report to shareholders filed under Item 1.
Item 7. Disclosure of Proxy Voting Policies and Procedures for Closed-End Management Investment Companies.
The Board of Directors of the Registrant adopted Proxy Voting Policies and Procedures on July 26, 2003 and amended them October 30, 2003, April 5, 2004 and May 26, 2005.
A copy as amended is attached as an exhibit.
Item 8. Portfolio Managers of Closed-End Investment Companies.
(a)(1) As of the date of filing of this report, Paul H. Broyhill, Chairman and Chief Executive Officer, Michael G. Landry, Vice President and Chief Investment Officer, M. Hunt Broyhill, President, Christopher R. Pavese, CFA, Managing Director, and Dan J. Wakin, Managing Director - Alternative Investments, are primarily responsible for the day-to-day management of the Registrant’s portfolio. Mr. Paul Broyhill has served in such capacity since the inception of the Registrant in 1982. Messrs. Landry and Hunt Broyhill have served in such capacity since 2001. Messrs. Landry and Hunt Broyhill have been engaged in asset management for various institutions and high net worth individuals for more than five years. Prior to joining the Registrant on March 1, 2005, Mr. Pavese was a Vice President and Portfolio Manager at JP Morgan Private Bank from January 1999 until February 2005. At JP Morgan, Mr. Pavese was engaged in asset management, portfolio strategy, and asset allocation for high net worth individuals, personal trusts, endowments and foundations. Mr. Wakin has served as a portfolio manager since February 2006. He has been employed by the Registrant since 1995, researching and advising management about hedge funds and other alternative investments.
(a)(2) The following tables provide information regarding registered investment companies other than the Registrant, other pooled investment vehicles, and other accounts over which the Registrant’s portfolio managers also have day-to-day management responsibilities. The tables provide the numbers of such accounts, the total assets in such accounts and the number of accounts and the total assets in the accounts with respect to which the fees are based on performance. The information is provided as of the Registrant’s fiscal year ended October 31, 2007.
Paul H. Broyhill
| | Other Registered Investment Companies | Other Pooled Investment Vehicles | Other Accounts |
Number of Accounts Managed | None | None | 4 |
Number of Accounts Managed with Performance-Based Advisory Fees | None | None | None |
| Assets Managed | $0 | $0 | $56,989,256 |
Assets Managed with Performance-Based Advisory Fees | $0 | $0 | $0 |
Michael G. Landry
| | Other Registered Investment Companies | Other Pooled Investment Vehicles | Other Accounts |
Number of Accounts Managed | None | None | 1 |
Number of Accounts Managed with Performance-Based Advisory Fees | None | None | 1 |
| Assets Managed | $0 | $0 | $25,000,000 |
Assets Managed with Performance-Based Advisory Fees | $0 | $0 | $25,000,000 |
M. Hunt Broyhill
| | Other Registered Investment Companies | Other Pooled Investment Vehicles | Other Accounts |
Number of Accounts Managed | None | 2 | 2 |
Number of Accounts Managed with Performance-Based Advisory Fees | None | None | None |
| Assets Managed | $0 | $15,901,327 | $46,510,657 |
Assets Managed with Performance-Based Advisory Fees | $0 | $0 | $0 |
Christopher R. Pavese
| | Other Registered Investment Companies | Other Pooled Investment Vehicles | Other Accounts |
Number of Accounts Managed | None | None | 17 |
Number of Accounts Managed with Performance-Based Advisory Fees | None | None | None |
| Assets Managed | $0 | $0 | $1,800,000 |
Assets Managed with Performance-Based Advisory Fees | $0 | $0 | $0 |
Dan J. Wakin
| | Other Registered Investment Companies | Other Pooled Investment Vehicles | Other Accounts |
Number of Accounts Managed | None | 2 | 28 |
Number of Accounts Managed with Performance-Based Advisory Fees | None | 0 | None |
| Assets Managed | $0 | $15,901,327 | $6,926,428 |
Assets Managed with Performance-Based Advisory Fees | $0 | $0 | $0 |
Material Conflicts of Interest
The Fund recognizes that actual or potential conflicts of interest are inherent in our business. These actual or potential conflicts may arise when a portfolio manager has day-to-day portfolio management responsibilities with respect to more than one fund or account. Certain investments may be appropriate for the Fund and also for other clients advised by the portfolio manager. Investment decisions for the Fund and other clients are made with a view to achieving their respective investment objectives and after consideration of such factors as their current holdings, availability of cash for investment and the size of their investments generally. Therein lies the possibility that a particular security could be bought or sold for the Fund and also for other clients, along with the possibility that a particular security could be bought or sold for the Fund while the opposite transaction could be occurring for other clients due to their investment strategy.
To the extent that a portfolio manager has responsibilities for managing accounts in addition to the Fund, the portfolio manager will need to divide his time and attention among relevant accounts.
The Fund also recognizes that in some cases, an actual or potential conflict may arise where a portfolio manager may have an incentive, such as a performance-based fee.
The Fund is in the process of developing written policies and procedures designed to address conflicts of interest its portfolio managers may face.
(a)(3)
Compensation Structure of Portfolio Managers
The compensation structure for each portfolio manager is based upon a fixed salary as well as a discretionary bonus determined by the senior management of the Fund. Salaries are determined by the senior management and are based upon an individual’s position and overall value to the Fund. Bonuses are also determined by management and are based upon an individual’s overall contribution to the success of the Fund and the profitability of the Fund. Salaries and bonuses for portfolio managers are not based upon criteria such as performance of the Fund or the value of assets of the Fund. Portfolio managers also have the opportunity to participate in other employee benefits available to all of the employees of the Fund.
(a)(4) The dollar range of the Registrant’s equity securities owned beneficially by the Registrant’s portfolio managers as of the Registrant’s fiscal year ended October 31, 2007 is set forth below:
| Name of Portfolio Manager | Dollar ($) Range of Registrant’s Shares Beneficially Owned |
| Paul H. Broyhill | Over $1,000,000 |
| Michael G. Landry | $1-$10,000 |
| M. Hunt Broyhill | Over $1,000,000 |
| Christopher R. Pavese | None |
| Dan J. Wakin | None |
(b) N/A
Item 9. Purchases of Equity Securities by Closed-End Management Investment Company and Affiliated Purchasers.
None
Item 10. Submission of Matters to a Vote of Security Holders.
N/A
Item 11. Controls and Procedures.
Within the 90 days prior to the date of this report, the Registrant's management carried out an evaluation, under the supervision and with the participation of Registrant's Chief Executive Officer and Chief Financial Officer, of the effectiveness of the Registrant's disclosure controls and procedures pursuant to Rule 30a-3(b) of the Investment Company Act of 1940. Based upon the evaluation, the Chief Executive Officer and Chief Financial Officer concluded as of a date within 90 days of the filing of this report that the Registrant's disclosure
controls and procedures are effective in timely alerting them to material information relating to the Registrant required to be included in the Registrant's periodic SEC filings.
There were no significant changes in the Registrant's internal control over financial reporting (as defined in Rule 30a-3(d) under the Investment Company Act of 1940) that occurred during the second fiscal quarter of the period covered by the report that have materially affected, or are reasonably likely to materially affect, the Registrant's internal control over financial reporting.
Item 12. Exhibits.
(a)(1) The Registrant's Code of Ethics is attached as Exhibit 12(a)(1).
(a)(2) Certifications.
SIGNATURES
Pursuant to the requirements of the Securities Exchange Act of 1934 and the Investment Company Act of 1940, the Registrant has duly caused this report to be signed on its behalf by the undersigned, thereunto duly authorized.
BMC Fund, Inc.
By
/s/ Boyd C. Wilson, Jr.
Boyd C. Wilson, Jr.
Vice President and
Chief Financial Officer
Date: December 21, 2007
Pursuant to the requirements of the Securities Exchange Act of 1934 and the Investment Company Act of 1940, this report has been signed below by the following persons on behalf of the registrant and in the capacities and on the dates indicated.
By
/s/ Paul H. Broyhill
Paul H. Broyhill
President and Chief Executive Officer
Date: December 21, 2007
By
/s/ Boyd C. Wilson, Jr.
Boyd C. Wilson, Jr.
Vice President and
Chief Financial Officer
Date: December 21, 2007