UNITED STATES
SECURITES AND EXCHANGE COMMISSION
Washington, DC 20549
FORM N-CSR
CERTIFIED SHAREHOLDER REPORT OF
REGISTERED MANAGEMENT INVESTMENT COMPANIES
Investment Company Act file number: 811-3150
BMC FUND, INC.
(Exact name of registrant as specified in charter)
800 GOLFVIEW PARK (P. O. BOX 500)
LENOIR, NC 28645
(Address of principal executive offices) (Zip code)
CAROL FRYE
BMC FUND, INC.
P. O. BOX 500
LENOIR, NC 28645
(Name and address of agent for service)
Registrant's telephone number including area code: 828-758-6100
Date of fiscal year end: October 31, 2008
Date of reporting period: October 31, 2008
Item 1. Report to Stockholders.
BMC FUND, INC.
FINANCIAL STATEMENTS AND
SUPPLEMENTARY INFORMATION
Year Ended October 31, 2008
TABLE OF CONTENTS
Page No.
| Directors and Officers | 1 |
| | | |
| Letter to Shareholders – Management’s Discussion of Fund Performance | 2 |
| | | |
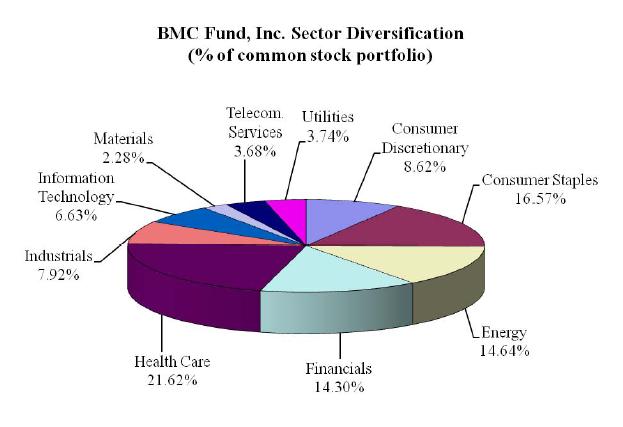
| Graphic Presentation of Portfolio Holdings and Sector Diversification | 4 |
| | | |
| Federal Income Tax Information | 5 |
| | | |
| Supplemental Information | 5 |
| | | |
| Supplemental Proxy Information | 6 |
| | | |
| Report of Independent Registered Public Accounting Firm | 7 |
| | | |
| Statement of Assets and Liabilities | 8 |
| | | |
| Statement of Operations | 9 |
| | | |
| Statements of Changes In Net Assets | 10 |
| | | |
| Notes to Financial Statements | 11 |
| | | |
| Financial Highlights | 14 |
| | | |
| Schedules of Investments: | |
| | I. - Investments in Securities of Unaffiliated Issuers | 15 |
| | II. - Investments in Affiliates | 24 |
BMC FUND, INC.
DIRECTORS AND OFFICERS
DIRECTORS
| James T. Broyhill | Winston-Salem, North Carolina |
| M. Hunt Broyhill | Hickory, North Carolina |
| Paul H. Broyhill | Lenoir, North Carolina |
| R. Donald Farmer | Taylorsville, North Carolina |
| Robert G. Fox, Jr. | Charlotte, North Carolina |
| Jan E. Gordon | Palm Harbor, Florida |
| Gene A. Hoots | Charlotte, North Carolina |
| Brent B. Kincaid | Lenoir, North Carolina |
| Michael G. Landry | Fort Lauderdale, Florida |
| John S. Little | Naples, Florida |
| L. Glenn Orr, Jr. | Winston-Salem, North Carolina |
| Allene B. Stevens | Lenoir, North Carolina |
OFFICERS
| Paul H. Broyhill | Chairman and |
| | Chief Executive Officer |
| M. Hunt Broyhill | President |
| Boyd C. Wilson, Jr. | Vice President and |
| | Chief Financial Officer |
| Michael G. Landry | Vice President and |
| | Chief Investment Officer |
| Gene Hendricks | Vice President and |
| | Chief Compliance Officer |
| Carol Frye | Secretary and Treasurer |
TO OUR SHAREHOLDERS: MANAGEMENT’S DISCUSSION OF FUND PERFORMANCE
This shareholder letter will be a difficult one to read, but we hope it provides both insight and confidence as to how we are managing your investment through this chaotic period in market and economic history. It was also a very challenging letter for us to write. Our report for the year ended October 31, 2008, which we believe contains complete and pertinent financial information, follows.
To say this has been a difficult market would be an understatement. In a word, the stock market's performance has been terrible, and got progressively worse as the year progressed. This has been the only year BMC Fund, Inc. (the “Fund”) has encountered, in the 27-year history of the Fund, a significant loss in our capital. It has been the worst financial market we have ever experienced and certainly the worst since the Great Depression years of the 1930s.
Very few mutual funds made any money this year (those that did were likely playing the short side), and many of the best managers, whose returns we have envied in the past, did considerably worse during this difficult period. Declines in equity markets ranged from 37.5% at home (as measured by the S&P 500 Index) to 53.8% abroad (as experienced by investors in the MSCI Emerging Markets Index). By contrast, our Fund was down approximately 32.8% for the twelve months ending October 31, 2008.
We started the year with approx 55% invested in global equities and 45% in bonds, real estate, limited partnerships and other investments, including a 10% cash position. During the course of the year, we actively reduced our exposure to stocks while raising cash. In addition, at the end of the fiscal year we spun off P. B. Realty, Inc. to be owned directly by the shareholders. The Fund’s present allocation is conservatively positioned with the portfolio equally balanced across four major asset classes: global equities, fixed income, alternative investments, and cash equivalents.
While we remain focused on long-term growth, we must balance this goal with safety of principal and our need for immediate income to pay consistent dividends. Although we have increased our allocation to what have been traditional safe havens (i.e., fixed income), we cannot responsibly ignore the growing risk in these assets as well. We fully anticipate that corporate bond markets will experience greater than normal default risk. Also, the threat of increasing inflation (more on this below) implies that longer duration issues (particularly overbought long term U.S. Treasuries) will be negatively impacted in a rising rate environment.
We have enhanced our income by a strategy of selling covered calls and puts. By selling puts, we are holding ourselves out as willing buyers of equities at prices well below today's levels, where we believe valuations would offer the potential for extremely attractive long term returns. (Keep an eye out for Warren Buffet’s letter to shareholders this year, where he promises to expand on Berkshire Hathaway’s use of the same strategy.) We are also willing to reduce our equity holdings through the sale of calls at prices we feel are rich for the given macro environment. At present this strategy is paying well and is an addition to the normal dividends and interest income that we receive.
Looking forward, we anticipate an increasingly severe economic contraction ahead, and we expect this recession to last far longer than the average. The devastation that has taken place in consumer net worth is unprecedented, outside of the Great Depression. In light of this, the only way for the consumer to begin to climb out of the financial hole that has been created is through actual saving. This means a lower level of consumption for a prolonged period of time.
In light of this negative outlook, we will be very measured and disciplined in our capital deployment. Right now we think cash is king, but we are looking to slowly reinvest our assets in response to collapsing prices, as opportunities arise and conditions indicate. We will continue to carefully invest in securities with very strong balance sheets and those that are market leaders. We are already beginning to see opportunities in many businesses with exceptional franchises that are long term survivors and thus, likely to improve their competitive positions throughout this down cycle.
We are encouraged that the Federal Reserve and the Treasury are finally beginning to understand the severity of the problem and address the core issue of the crisis, which we have always believed is capital deficiency and not liquidity. Both the Treasury and the Fed have now moved to secure areas of the financial system, and the array of actions taken has been nothing short of stunning. All of these programs require the U. S. government to either issue substantially more Treasury debt or print money. Treasury borrowings will likely increase $2 trillion above what would have been borrowed. This is an addition to an escalating budget deficit likely to exceed $1 trillion and the Federal Reserve's balance sheet which we could witness rising to $3 trillion. A large portion of this increase will be funded by the printing of money.
To say that we are concerned about these trends is a gross understatement. In the short run, one to two years, we anticipate worsening deflation. But the greater concern on the horizon is the period that covers three to ten years from now. We believe that inflation will be a much more significant issue than is currently anticipated by the consensus and thus, poses a serious risk to real, long term purchasing power. The government's concern is always, "How do we get the economy out of this mess, and don't worry about what will take place beyond the near term." During the last thirty years, it has been exactly this type of short-term thinking that has led to this predicament. As fiduciaries and stewards of your capital, we continue to balance the important and urgent (deflationary considerations) with the important but not urgent (inflationary risks).
During the year ended October 31, 2008, the Fund paid the following dividends per share:
| December 10, 2007 to shareholders of record November 25, 2007 | | $ | 1.71 | |
| March 10, 2008 to shareholders of record February 25, 2008 | | | .25 | |
| June 10, 2008 to shareholders of record May 25, 2008 | | | .25 | |
| September 10, 2008 to shareholders of record August 25, 2008 | | | .25 | |
| | | | | |
| Total | | $ | 2.46 | |
The Fund paid a dividend of $1.12 per share on December 10, 2008 to shareholders of record November 25, 2008.
Schedule I is a listing of the entire Fund’s diversified securities at October 31, 2008 with a total market value of $100,250,816.
Paul H. Broyhill, Chairman and
Chief Executive Officer
M. Hunt Broyhill, President
FEDERAL INCOME TAX INFORMATION
We are required by the Internal Revenue Code to advise you within 60 days of the Fund’s fiscal year end (October 31, 2008) as to the federal tax status of dividends paid by the Fund during such fiscal year. Accordingly, we are advising you that during the year ended October 31, 2008, the Fund paid distributions to its shareholders totaling $2.46 per share, comprised of $1.04 per share ordinary income and short term capital gains which are taxable as ordinary income, and $1.42 per share long term capital gains which are taxable as such. In addition, each shareholder in the Fund received one unit of membership interest in P. B. Realty, LLC for each share of stock held in the Fund on the record date of October 31, 2008, with a value of $3.81 per unit due to the spin off of P. B. Realty, Inc. This distribution will be taxable as ordinary income. The shareholders are furnished a Form 1099 in January of each year, which details the federal tax status of dividends paid by the Fund during the calendar year. There were no undistributed capital gains during the fiscal year.
SUPPLEMENTAL INFORMATION
Paul H. Broyhill, Chairman and Chief Executive Officer, Michael G. Landry, Vice President and Chief Investment Officer, M. Hunt Broyhill, President, Christopher R. Pavese, CFA, Managing Director, and Dan J. Wakin, Managing Director – Alternative Investments, are primarily responsible for the day-to-day management of the Fund’s portfolio. Mr. Paul Broyhill has had such responsibility since the inception of the Fund. Messrs. Landry and Hunt Broyhill have had such responsibility since 2001. Messrs. Landry and Hunt Broyhill have been engaged in asset management for various institutions and high net worth individuals for more than five years. Prior to joining the Fund on March 1, 2005, Mr. Pavese was a Vice President and Portfolio Manager at JPMorgan Private Bank from January 1999 until February 2005. At JPMorgan, Mr. Pavese was engaged in asset management, portfolio strategy, and asset allocation for high net worth individuals, personal trusts, endowments and foundations. Mr. Wakin has had such responsibility since February 2006, and has served the Fund in other capacities since 1995.
SUPPLEMENTAL PROXY INFORMATION
2008 ANNUAL MEETING OF SHAREHOLDERS
The Annual Meeting of Shareholders of BMC Fund, Inc. was held on February 23, 2008 at Naples Grande Resort & Club, Naples, Florida. The meeting was held for the following purposes:
| 1. | To elect the following 12 directors to serve as follows: |
| Director | Term | Expiring |
| James T. Broyhill | 1 year | 2009 |
| M. Hunt Broyhill | 1 year | 2009 |
| Paul H. Broyhill | 1 year | 2009 |
| R. Donald Farmer | 1 year | 2009 |
| Robert G. Fox, Jr. | 1 year | 2009 |
| Jan E. Gordon | 1 year | 2009 |
| Gene A. Hoots | 1 year | 2009 |
| Brent B. Kincaid | 1 year | 2009 |
| Michael G. Landry | 1 year | 2009 |
| John S. Little | 1 year | 2009 |
| L. Glenn Orr, Jr. | 1 year | 2009 |
| Allene B. Stevens | 1 year | 2009 |
| 2. | To vote upon such other business as may come before the meeting. |
The results of the proxy solicitation on the above matters were as follows:
| Director | Votes For | Votes Against | Votes Withheld | Abstentions |
| 1. James T. Broyhill | 4,902,969 | - | 30,312 | - |
| M. Hunt Broyhill | 4,902,969 | - | 30,312 | - |
| Paul H. Broyhill | 4,902,969 | - | 30,312 | - |
| R. Donald Farmer | 4,902,969 | - | 30,312 | - |
| Robert G. Fox, Jr. | 4,902,969 | - | 30,312 | - |
| Jan E. Gordon | 4,733,910 | 169,059 | 30,312 | - |
| Gene A. Hoots | 4,902,969 | - | 30,312 | - |
| Brent B. Kincaid | 4,902,969 | - | 30,312 | - |
| Michael G. Landry | 4,902,969 | - | 30,312 | - |
| John S. Little | 4,902,969 | - | 30,312 | - |
| L. Glenn Orr, Jr. | 4,902,969 | - | 30,312 | - |
| Allene B. Stevens | 4,902,969 | - | 30,312 | - |
| 2. | There was no other business voted upon at the Annual Meeting of Shareholders. |
REPORT OF INDEPENDENT REGISTERED PUBLIC ACCOUNTING FIRM
To the Board of Directors and
Shareholders of BMC Fund, Inc.
We have audited the accompanying statement of assets and liabilities of the BMC Fund, Inc. (the “Company”), including the schedules of investments, as of October 31, 2008 and the related statement of operations for the year then ended, the statements of changes in net assets for each of the two years in the period then ended, and the financial highlights for the years ended October 31, 2008, 2007, 2006, 2005, 2004, and 2003, and the seven months ended October 31, 2002 and the years ended March 31, 2002 and 2001. These financial statements and financial highlights are the responsibility of the Company’s management. Our responsibility is to express an opinion on these financial statements and financial highlights based on our audits. The financial highlights for each of the two years in the period ended March 31, 2000 were audited by other auditors whose report dated May 19, 2000 expressed an unqualified opinion on the financial highlights for those two years.
We conducted our audits in accordance with the standards of the Public Company Accounting Oversight Board (United States). Those standards require that we plan and perform the audit to obtain reasonable assurance about whether the financial statements and financial highlights are free of material misstatement. The Company is not required to have, nor were we engaged to perform, an audit of its internal control over financial reporting. Our audits included consideration of internal control over financial reporting as a basis for designing audit procedures that are appropriate in the circumstances, but not for the purpose of expressing an opinion on the effectiveness of the Company's internal control over financial reporting. Accordingly, we express no such opinion. An audit also includes examining, on a test basis, evidence supporting the amounts and disclosures in the financial statements. Our procedures included confirmation of securities owned as of October 31, 2008 by correspondence with the custodian and brokers or by other appropriate auditing procedures where replies from brokers were not received. An audit also includes assessing the accounting principles used and significant estimates made by management, as well as evaluating the overall financial statement presentation. We believe that our audits provide a reasonable basis for our opinion.
As explained in note 1, the financial statements include investments valued at $11,508,312 (11.2 percent of net assets), whose fair values have been estimated by management in the absence of readily determinable fair values. Management’s estimates are based upon information provided by the funds managers or the general partners.
In our opinion, the financial statements referred to above present fairly, in all material respects, the financial position of BMC Fund, Inc. as of October 31, 2008, the results of its operations for the year then ended, the changes in its net assets for the each of the two years in the period then ended, and the financial highlights for the years ended October 31, 2008, 2007, 2006, 2005, 2004, 2003, and the seven months ended October 31, 2002 and two years ended March 31, 2002 and 2001, in conformity with accounting principles generally accepted in the United States of America.
Charlotte, North Carolina
December 23, 2008
| | | |
| STATEMENT OF ASSETS AND LIABILITIES | | | |
| October 31, 2008 | | | |
| | | | |
| ASSETS AT MARKET VALUE: | | | |
| Investment securities (cost - $113,278,961) | | $ | 100,250,816 | |
| Investments in affiliate - wholly owned subsidiary (equity value $565,968) | | | 636,595 | |
| Cash and short-term investments | | | 571,894 | |
| Receivables, accrued interest and dividends | | | 95,857 | |
| Receivable from broker | | | 958,594 | |
| Receivable from hedge fund liquidation | | | 136,442 | |
| Other assets | | | 43,078 | |
| | | | | |
| Total assets | | | 102,693,276 | |
| | | | | |
| LIABILITIES: | | | | |
| Accounts payable and accrued expenses | | | 119,112 | |
| | | | | |
| NET ASSETS AT OCTOBER 31, 2008 - EQUIVALENT TO $20.79 PER | | | | |
| SHARE ON 4,933,281 SHARES OF COMMON STOCK OUTSTANDING | | $ | 102,574,164 | |
| | | | | |
| SUMMARY OF SHAREHOLDERS' EQUITY: | | | | |
| Common stock, par value $5.00 per share - authorized 70,000,000 shares; | | | | |
| outstanding, 4,933,281 shares | | $ | 24,666,405 | |
| Retained earnings prior to becoming investment company | | | 84,068,970 | |
| Undistributed net investment income | | | 2,537,462 | |
| Realized loss on investments | | | (935,869 | ) |
| Undistributed nontaxable gain | | | 5,194,714 | |
| Unrealized depreciation of investments | | | (12,957,518 | ) |
| | | | | |
| NET ASSETS APPLICABLE TO COMMON STOCK OUTSTANDING | | $ | 102,574,164 | |
| | | | | |
| | | | | |
See accompanying notes to financial statements.
| | | |
| STATEMENT OF OPERATIONS | | | |
| Year Ended October 31, 2008 | | | |
| | | | |
| INVESTMENT INCOME: | | | |
| Income: | | | |
| Interest - taxable bonds | | $ | 201,698 | |
| Other interest and dividends | | | 4,177,690 | |
| Equity in earnings of wholly-owned subsidiaries | | | 736,298 | |
| | | | | |
| Total income | | | 5,115,686 | |
| | | | | |
| Expenses: | | | | |
| Legal and professional fees | | | 116,004 | |
| Directors' fees (Note 3) | | | 58,000 | |
| Interest expense | | | 91,873 | |
| Investment expense | | | 118,999 | |
| Salaries and benefits | | | 753,953 | |
| Property and liability insurance | | | 52,361 | |
| Depreciation expense | | | 3,528 | |
| Taxes and licenses | | | 123,103 | |
| Rent | | | 33,028 | |
| Office supplies and expense | | | 44,628 | |
| Dues and subscriptions | | | 51,607 | |
| Travel and entertainment | | | 90,490 | |
| | | | | |
| Total expenses | | | 1,537,574 | |
| | | | | |
| Investment income, net | | | 3,578,112 | |
| | | | | |
| REALIZED AND UNREALIZED LOSS ON INVESTMENTS: | | | | |
| Realized losses from investment securities sold | | | (935,869 | ) |
| Change in unrealized depreciation of investments for the period | | | (53,225,219 | ) |
| | | | | |
| Net loss on investments | | | (54,161,088 | ) |
| | | | | |
| NET DECREASE IN NET ASSETS RESULTING | | | | |
| FROM OPERATIONS | | $ | (50,582,976 | ) |
| | | | | |
| | | | | | |
| STATEMENTS OF CHANGES IN NET ASSETS | | | | | | |
| Years Ended October 31, 2008 and 2007 | | | | | | |
| | | | | | | |
| | | 2008 | | | 2007 | |
| | | | | | | |
| INCREASE (DECREASE) IN NET ASSETS FROM OPERATIONS: | | | | | | |
| Investment income, net | | $ | 3,578,112 | | | $ | 3,842,312 | |
| Realized gains (losses) from investment securities sold | | | (935,869 | ) | | | 7,018,329 | |
| Change in unrealized appreciation (depreciation) of | | | | | | | | |
| investments for the year | | | (53,225,219 | ) | | | 13,960,781 | |
| | | | | | | | | |
| Net increase(decrease) in net assets resulting from operations | | | (50,582,976 | ) | | | 24,821,422 | |
| | | | | | | | | |
| Distributions to shareholders from: | | | | | | | | |
| Net realized gain on investment securities | | | (7,018,329 | ) | | | (10,022,572 | ) |
| Net investment income | | | (5,117,542 | ) | | | (1,323,974 | ) |
| P. B. Realty, Inc. Spin Off | | | (13,681,803 | ) | | | - | |
| | | | | | | | | |
| TOTAL INCREASE (DECREASE) IN NET ASSETS | | | (76,400,650 | ) | | | 13,474,876 | |
| | | | | | | | | |
| NET ASSETS AT BEGINNING OF YEAR | | | 178,974,814 | | | | 165,499,938 | |
| | | | | | | | | |
| NET ASSETS AT END OF YEAR (Including | | | | | | | | |
| undistributed net investment income: | | | | | | | | |
| 10/31/08 - $2,537,462; 10/31/07 - $9,476,729) | | $ | 102,574,164 | | | $ | 178,974,814 | |
| | | | | | | | | |
See accompanying notes to financial statements.
BMC FUND, INC.
NOTES TO FINANCIAL STATEMENTS
Year Ended October 31, 2008
1. SIGNIFICANT ACCOUNTING POLICIES
BMC Fund, Inc. (the “Fund”) is a closed-end, diversified investment company registered under the Investment Company Act of 1940, as amended. Prior to becoming a regulated investment company on April 1, 1981, BMC Fund, Inc. operated as a regular corporation. The following is a summary of significant accounting policies followed by the Fund in the preparation of its financial statements. The policies are in conformity with generally accepted accounting principles for investment companies.
| | A. | Investment Valuations – The investment securities are stated at market value as determined by closing prices on national securities exchanges. Investment securities include corporate bonds, mutual funds, and common and preferred stocks. |
The investments in limited partnerships, other investments and venture capital are stated at estimated fair value as determined by the management of these investments and are approved by the Fund’s Valuation Committee after giving consideration to historical and projected financial results, economic conditions, financial condition of investee and other factors and events subject to change. Because of the inherent uncertainty of those valuations, the estimated values may differ significantly from the values that would have been used had a ready market value for the investments existed, and these differences could be material.
The carrying value of the investment in the wholly owned subsidiary is based on independent appraisals and internal assessments of the fair market values of the subsidiaries’ underlying investments. Equity in earnings of the wholly owned subsidiaries in the statement of operations represents the current year earnings of the subsidiaries accounted for using the equity method.
The carrying value of the investment in real estate is based on an independent appraisal of the fair market value of the real estate.
| | B. | Investment Transactions – Investment transactions are accounted for on the date the order to buy or sell is executed. Realized gains and losses on investments are determined on the basis of specific identification of issues sold or matured. The aggregate dollar amount of purchases and sales of investment securities, other than government securities and short-term debt securities having maturities of one year or less, for the year ended October 31, 2008, was $233,853,135. |
| | C. | Income Taxes – No federal tax provision is required as it is the Fund’s policy to comply with the provisions of Subchapter M of the Internal Revenue Code of 1954, as amended, including the distribution to its shareholders of substantially all of its income and any capital gains not offset by capital losses. Also, no state income tax provision has been provided because the states in which the Fund has income recognize the tax exempt status of a regulated investment Fund. |
BMC FUND, INC.
NOTES TO FINANCIAL STATEMENTS
Year Ended October 31, 2008
1. SIGNIFICANT ACCOUNTING POLICIES (Continued)
| | D. | Dividend Policy – It is the Fund’s policy to pay dividends during the year in sufficient amounts to meet the requirements to maintain its status as a regulated investment Fund. |
| | E. | Cash and Short-Term Investments – For purposes of financial reporting, the Fund considers all investments at financial institutions with original maturities of three months or less to be equivalent to cash. Short-term money market investments managed by third party investors are included in investment securities. |
| | F. | Use of Estimates – The preparation of financial statements in conformity with accounting principles generally accepted in the United States of America requires management to make estimates and assumptions that affect the reported amounts of assets and liabilities and disclosure of contingent assets and liabilities at the date of the financial statements and the reported amounts of revenues and expenses during the reporting period. Actual results could differ from those estimates. |
2. LINE OF CREDIT
On October 12, 2007 (renewed on September 26, 2008), the Fund entered into an agreement with a bank for an unsecured line of credit in the amount of $7,500,000 to provide the Fund more flexibility in its payment of dividends and management of its investments. The interest rate on any borrowings will be at the LIBOR market index rate plus 100 basis points. No commitment fee is charged on any unused balance. As of October 31, 2008, the Fund had no borrowings from this line of credit, which expires on March 31, 2009.
3. ADVISORY BOARD AND REMUNERATION OF DIRECTORS
The Fund does not have an advisory board. In accordance with Fund policy, the disinterested directors and a certain interested director are paid an annual fee of $3,000 plus $1,000 for each meeting attended in person or $500 cash for each meeting attended by telephone. Each aforementioned director is paid an additional $1,000 for each day attending a committee meeting in person or $500 by telephone other than on the date of a board meeting. In addition, all directors are reimbursed for their reasonable expenses incurred in attending meetings.
BMC FUND, INC.
NOTES TO FINANCIAL STATEMENTS
Year Ended October 31, 2008
4. RELATED PARTIES
The Fund owned two wholly-owned subsidiaries, P. B. Realty, Inc. and Broyhill Industries, Inc. During the year, the Fund contributed an additional $50,000 of capital to Broyhill Industries, Inc.
The Fund conducted a spin off of P. B. Realty, Inc. effective October 31, 2008. The new company is P. B. Realty, LLC. Each shareholder in the Fund received one unit of membership interest in the new company for each share of stock held in the Fund on the record date of October 31, 2008. The statements reflect a distribution to the shareholders of $13,681,803 which represents the Fund’s internal fair market valuation. The actual tax value of the deemed sale dividend amounted to $18,771,477.
The Fund leases office space from Broyhill Investments, Inc. which is controlled by Paul H. Broyhill and M. Hunt Broyhill, both officers of BMC Fund, Inc. The expense associated with this related party lease for each of the years ended October 31, 2008 amounted to $33,028. Broyhill Investments, Inc. also acts as a common paymaster for payroll and other shared services. This service is provided at no cost to the Fund. All amounts paid by Broyhill Investments, Inc. on behalf of the Fund are reimbursed by the Fund. The outstanding payable related to these transactions at October 31, 2008 was $88,823.
5. IMPAIRED SECURITIES
Selected securities at the end of the year have significant investment impairment issues. These selected securities, which have an aggregate cost basis of $8,500,000, have been assigned no value at October 31, 2008. In December 2008, the Fund made an additional $1,000,000 investment in one of the securities mentioned above, which the Fund believes to have no value at the current time.
|
| FINANCIAL HIGHLIGHTS |
| Years Ended October 31, 2008, 2007, 2006, 2005, 2004, and 2003, Seven Month Period Ended October 31, 2002, and Each of the Four Years in the Period Ended March 31, 2002 |
The following table presents financial information divided into three parts: per share operating performance, total investment return and ratios and supplemental data for the years ended October 31, 2008, 2007, 2006, 2005, 2004, and 2003, the seven month period ended October 31, 2002, and each of the four years in the period ended March 31, 2002. The first part, per share operating performance, details the changes on a per share basis of the Company's beginning net asset value to its ending net asset value. The second part, total investment return, is based on the market price of the Company's shares of stock. Part three, ratios and supplemental data, provides additional financial information related to the Company's performance.
| | | | | | | | | | | | | | | | | | | | | | | | | | | | | | | | | | |
| | | | | | | | | | | | | | | | | | | | | Seven Months | | | | | | | | | | | | | |
| | | | | | | | | | | | | | | | | | | | | Ended | | | | | | | | | | | | | |
| PER SHARE OPERATING | | | | | | | | | | | | | | | | | | | | October 31, | | | | | | | | | | | | | |
| PERFORMANCE | | 2008 | | | 2007 | | | 2006 | | | 2005 | | | 2004 | | | 2003 | | | 2002 | | | 2002 | | | 2001 | | | 2000 | | | 1999 | |
| | | | | | | | | | | | | | | | | | | | | | | | | | | | | | | | | | |
| Net asset value, beginning of period | | $ | 36.28 | | | $ | 33.55 | | | $ | 32.84 | | | $ | 30.94 | | | $ | 29.17 | | | $ | 25.46 | | | $ | 28.95 | | | $ | 29.44 | | | $ | 31.84 | | | $ | 29.01 | | | $ | 30.55 | |
| Net investment income | | | 0.73 | | | | 0.78 | | | | 1.06 | | | | 0.88 | | | | 0.82 | | | | 0.95 | | | | 0.59 | | | | 1.13 | | | | 1.31 | | | | 2.11 | | | | 1.04 | |
| Net gains (losses) on investments | | | (10.98 | ) | | | 4.25 | | | | 2.43 | | | | 2.48 | | | | 2.08 | | | | 3.76 | | | | (3.45 | ) | | | (0.30 | ) | | | (2.13 | ) | | | 2.11 | | | | (0.16 | ) |
| Total from investment operations | | | (10.25 | ) | | | 5.03 | | | | 3.49 | | | | 3.36 | | | | 2.90 | | | | 4.71 | | | | (2.86 | ) | | | 0.83 | | | | (0.82 | ) | | | 4.22 | | | | 0.88 | |
| Less distributions: | | | | | | | | | | | | | | | | | | | | | | | | | | | | | | | | | | | | | | | | | | | | |
| Dividends from net investment income | | | 1.04 | | | | 2.03 | | | | 2.37 | | | | - | | | | 0.65 | | | | 0.45 | | | | 0.56 | | | | 0.84 | | | | 1.58 | | | | 1.10 | | | | 1.49 | |
| Distributions from capital gains | | | 1.42 | | | | 0.27 | | | | 0.41 | | | | 1.46 | | | | 0.48 | | | | 0.55 | | | | 0.07 | | | | 0.48 | | | | - | | | | 0.29 | | | | 0.93 | |
| P. B. Realty, Inc. Spin-off | | | 2.78 | | | | - | | | | - | | | | - | | | | - | | | | - | | | | - | | | | - | | | | - | | | | - | | | | - | |
| Total distributions | | | 5.24 | | | | 2.30 | | | | 2.78 | | | | 1.46 | | | | 1.13 | | | | 1.00 | | | | 0.63 | | | | 1.32 | | | | 1.58 | | | | 1.39 | | | | 2.42 | |
| Net asset value, end of period | | $ | 20.79 | | | $ | 36.28 | | | $ | 33.55 | | | $ | 32.84 | | | $ | 30.94 | | | $ | 29.17 | | | $ | 25.46 | | | $ | 28.95 | | | $ | 29.44 | | | $ | 31.84 | | | $ | 29.01 | |
| | | | | | | | | | | | | | | | | | | | | | | | | | | | | | | | | | | | | | | | | | | | | |
Per share market value, end of period1 | | $ | 26.00 | | | $ | 26.00 | | | $ | 26.00 | | | $ | 26.00 | | | $ | 26.00 | | | $ | 26.00 | | | $ | 26.00 | | | $ | 26.00 | | | $ | 26.00 | | | $ | 26.00 | | | $ | 26.00 | |
| | | | | | | | | | | | | | | | | | | | | | | | | | | | | | | | | | | | | | | | | | | | | |
TOTAL INVESTMENT RETURN2 | | | (39.42 | ) % | | | 19.35 | % | | | 13.40 | % | | | 12.95 | % | | | 11.14 | % | | | 18.12 | % | | | (18.85 | ) % | * | | 3.20 | % | | | (3.15 | ) % | | | 16.23 | % | | | 3.38 | % |
| | | | | | | | | | | | | | | | | | | | | | | | | | | | | | | | | | | | | | | | | | | | | |
| RATIOS/SUPPLEMENTAL DATA | | | | | | | | | | | | | | | | | | | | | | | | | | | | | | | | | | | | | | | | | | | | |
| | | | | | | | | | | | | | | | | | | | | | | | | | | | | | | | | | | | | | | | | | | | | |
| Net assets, end of period (in thousands) | | $ | 102,574 | | | $ | 178,975 | | | $ | 165,500 | | | $ | 162,027 | | | $ | 152,623 | | | $ | 143,910 | | | $ | 125,596 | | | $ | 142,811 | | | $ | 145,221 | | | $ | 157,057 | | | $ | 143,092 | |
Ratio of expenses to average net assets3 | | | 1.02 | % | | | 0.75 | % | | | 0.73 | % | | | 0.60 | % | | | 0.73 | % | | | 0.73 | % | | | 0.71 | % | * | | 0.62 | % | | | 0.49 | % | | | 0.40 | % | | | 0.32 | % |
| Ratio of net investment income to | | | | | | | | | | | | | | | | | | | | | | | | | | | | | | | | | | | | | | | | | | | | |
average net assets3 | | | 2.37 | % | | | 2.26 | % | | | 3.20 | % | | | 2.77 | % | | | 2.70 | % | | | 3.52 | % | | | 3.78 | % | * | | 3.91 | % | | | 4.23 | % | | | 6.99 | % | | | 3.50 | % |
| Portfolio turnover rate | | | 67.44 | % | | | 51.23 | % | | | 48.22 | % | | | 57.54 | % | | | 40.10 | % | | | 52.51 | % | | | 31.95 | % | | | 67.18 | % | | | 33.65 | % | | | 94.21 | % | | | 80.17 | % |
| | | | | | | | | | | | | | | | | | | | | | | | | | | | | | | | | | | | | | | | | | | | | |
1Unaudited - - Based on stock trades, which are very limited, during that year.
2Unaudited - - Computed as follows: income from investment operations divided by per share market value.
3Average is computed on a quarterly basis.
*Annualized
| BMC FUND, INC. | | | | | | | | | | | | SCHEDULE I | |
| INVESTMENTS IN SECURITIES OF UNAFFILIATED ISSUERS | | | | | | | | | |
| October 31, 2008 | | | | | | | | | | | | | |
| | | | | | | | | | | | | | |
| Debt Issuer | | Coupon Interest Rate | | Maturity Date | | Face Amount | | | Market Value | | | Percent of Net Assets | |
| | | | | | | | | | | | | | |
| FIXED INCOME: | | | | | | | | | | | | | |
OAKWOOD HOMES CORP1 | | | 7.875 | % | 3/1/2004 | | $ | 1,000,000 | | | $ | 480,000 | | | | |
| LEHMAN BROTHERS HLDGS INC NIKKEI | | | 0.000 | % | 9/29/2008 | | | 3,000,000 | | | | - | | | | |
| LEHMAN BROTHERS HLDGS INC INTL BASKET | | | 0.000 | % | 11/15/2008 | | | 1,000,000 | | | | - | | | | |
| AUSTRALIA GOVT BOND | | | 7.500 | % | 9/15/2009 | | | 984,960 | | | | 814,078 | | | | |
| LEHMAN BROTHERS HLDGS INC MEDIUM TERM | | | 0.000 | % | 3/15/2011 | | | 2,500,000 | | | | - | | | | |
| | | | | | | | | | | | | | | | | |
| TOTAL INVESTMENTS IN TAXABLE BONDS | | | | | | | $ | 8,484,960 | | | $ | 1,294,078 | | | | 1.26 | % |
| | | | | | | | | | | | | | | | | | |
| | | | | | | | | | | | | | | | | | |
1 In default | | | | | | | | | | | | | | | | | |
| | | | | | | | | | | SCHEDULE I | |
| INVESTMENTS IN SECURITIES OF UNAFFILIATED ISSUERS (CONTINUED) | |
| October 31, 2008 | | | | | | | | | | | | |
| | | | | | | | | | | | | |
| Company Name | | Shares Held | | | Cost | | | Market Value | | | Percent of Net Assets | |
| | | | | | | | | | | | | |
| MUTUAL FUNDS: | | | | | | | | | | | | |
| BOND MUTUAL FUNDS | | | | | | | | | | | | |
| CURRENCY SHARES JAPANESE Y | | | 5,000.00 | | | $ | 471,775 | | | $ | 504,850 | | | | |
| FLAHERTY & CRUMRINE PREFER | | | 6,000.00 | | | | 72,548 | | | | 34,200 | | | | |
| GABELLI CONVERTIBLE & INCO | | | 32,600.00 | | | | 203,772 | | | | 195,274 | | | | |
| ISHARES LEHMAN 7-10 YEAR T | | | 5,000.00 | | | | 443,948 | | | | 439,450 | | | | |
| PIMCO FDS DEV LOCAL MK D | | | 28,473.80 | | | | 250,000 | | | | 250,000 | | | | |
| SPDR LEHMAN INTL. TREASURY | | | 10,000.00 | | | | 525,850 | | | | 491,500 | | | | |
| VANGUARD FXD INC SECS INTR | | | 23,668.64 | | | | 200,000 | | | | 193,373 | | | | |
| WISDOMTREE DREYFUS CHINESE | | | 10,000.00 | | | | 251,651 | | | | 251,200 | | | | |
| TOTAL BOND MUTUAL FUNDS | | | | | | | 2,419,544 | | | | 2,359,847 | | | | 2.30 | % |
| | | | | | | | | | | | | | | | | |
| STOCK MUTUAL FUNDS | | | | | | | | | | | | | | | | |
| INTERNATIONAL EQUITIES | | | | | | | | | | | | | | | | |
| ISHARES INC MSCI BRAZIL | | | 3,000.00 | | | | 218,411 | | | | 112,980 | | | | 0.11 | % |
| | | | | | | | | | | | | | | | | |
| SPECIALTY FUNDS | | | | | | | | | | | | | | | | |
| CALAMOS CONV OPP INC SH BE | | | 30,000.00 | | | | 272,656 | | | | 273,000 | | | | | |
| HUSSMAN STRATEGIC GROWTH FUND | | | 311,478.07 | | | | 5,000,000 | | | | 4,793,648 | | | | | |
| ISHARES COMEX GOLD TR ISHARES | | | 20,000.00 | | | | 1,529,956 | | | | 1,431,600 | | | | | |
| ISHARES DJ US PHRM | | | 3,000.00 | | | | 158,105 | | | | 127,950 | | | | | |
| IVY ASSET STRATEGY FUND CL | | | 72,445.42 | | | | 1,979,197 | | | | 1,480,060 | | | | | |
| POWERSHARES FINANCIAL PREF | | | 10,000.00 | | | | 216,190 | | | | 139,000 | | | | | |
| SPDR GOLD TRUST | | | 2,000.00 | | | | 179,230 | | | | 142,680 | | | | | |
| SPDR HOMEBUILDERS ETF | | | 20,000.00 | | | | 350,816 | | | | 280,800 | | | | | |
| ULTRASHORT DOW 30 PROSHARE | | | 4,000.00 | | | | 373,660 | | | | 281,280 | | | | | |
| ULTRASHORT RUSSELL 2000 PR | | | 5,000.00 | | | | 654,325 | | | | 478,750 | | | | | |
| VANGUARD HEALTHCARE ETF | | | 2,500.00 | | | | 144,466 | | | | 117,150 | | | | | |
| TOTAL SPECIALTY FUNDS | | | | | | | 10,858,601 | | | | 9,545,918 | | | | 9.30 | % |
| | | | | | | | | | | | | | | | | |
| TOTAL STOCK MUTUAL FUNDS | | | | | | | 11,077,012 | | | | 9,658,898 | | | | 9.41 | % |
| | | | | | | | | | | | | | | | | |
| TOTAL INVESTMENTS IN MUTUAL FUNDS | | | | | | $ | 13,496,556 | | | $ | 12,018,745 | | | | 11.71 | % |
| BMC FUND, INC. | | | | | | | | SCHEDULE I | |
| INVESTMENTS IN SECURITIES OF UNAFFILIATED ISSUERS (CONTINUED) | |
| October 31, 2008 | | | | | | | | | |
| | | | | | | | | | |
| Company Name | | Cost | | | Market Value | | | Percent of Net Assets | |
| | | | | | | | | | |
| OTHER INVESTMENTS: | | | | | | | | | |
| | | | | | | | | | |
| LIMITED PARTNERSHIPS: | | | | | | | | | |
| INSTITUTIONAL BENCHMARKS SERIES LLC: | | | | | | | | | |
| -CONVERTIBLE ARBITRAGE SERIES | | $ | 1,475,886 | | | $ | 1,187,351 | | | | |
| -EVENT DRIVEN SERIES | | | 2,298,592 | | | | 2,718,627 | | | | |
| JMG CAPITAL PARTNERS LP | | | 609,767 | | | | 1,359,785 | | | | |
| LMC COMPASS FUND, LP | | | 1,500,000 | | | | 1,806,568 | | | | |
| RD LEGAL FUNDING PARTNERS LP | | | 1,000,000 | | | | 1,021,331 | | | | |
| RYE SELECT BROAD MARKET FUND LP | | | 1,500,000 | | | | - | | | | |
| STARK INVESTMENTS LP | | | 1,000,000 | | | | 2,432,044 | | | | |
| STARK STRUCTURED FINANCE ONSHORE FUND, LP | | | 1,000,000 | | | | 838,367 | | | | |
| WALNUT INVESTMENT PARTNERS LP | | | 235,567 | | | | 125,639 | | | | |
| TOTAL LIMITED PARTNERSHIPS | | | 10,619,812 | | | | 11,489,712 | | | | 11.20 | % |
| | | | | | | | | | | | | |
| WARRANTS: | | | | | | | | | | | | |
| CREDIT SUISSE 24-MONTH COMMODITY CURRENCY BASKET | | | 58,400 | | | | 10,400 | | | | | |
| CREDIT SUISSE 24-MONTH GULF CURRENCY BASKET | | | 152,400 | | | | 8,200 | | | | | |
| TOTAL CALL OPTIONS | | | 210,800 | | | | 18,600 | | | | 0.02 | % |
| | | | | | | | | | | | | |
| TOTAL OTHER INVESTMENTS | | $ | 10,830,612 | | | $ | 11,508,312 | | | | 11.22 | % |
| | | | SCHEDULE I |
| INVESTMENTS IN SECURITIES OF UNAFFILIATED ISSUERS (CONTINUED) | | | |
| October 31, 2008 | | | | | | |
| | | | | | | |
Sectors and Industries | | Shares Held | | Company Name | | Cost | | | Market Value | | | Percent of Net Assets | |
| | | | | | | | | | | | | | |
| COMMON STOCKS: | | | | | | | | | | | | | |
| CONSUMER DISCRETIONARY | | | | | | | | | | | | | |
| Consumer Durables and Apparel | | | 172,000.00 | | HEAD N V NY REGISTRY SH | | $ | 345,561 | | | $ | 51,600 | | | | 0.05 | % |
| | | | | | | | | | | | | | | | | | |
| Consumer Services | | | 12,000.00 | | CARNIVAL CORP COM | | | 464,310 | | | | 304,800 | | | | | |
| | | | 6,300.00 | | MCDONALDS CORP COM | | | 212,123 | | | | 364,959 | | | | | |
| | | | 16,000.00 | | NEWELL RUBBERMAID | | | 211,055 | | | | 220,000 | | | | | |
| | | | 20,000.00 | | SERVICE CORP INTERNATIONAL | | | 190,582 | | | | 138,000 | | | | | |
| | | | | | | | | 1,078,070 | | | | 1,027,759 | | | | 1.00 | % |
| | | | | | | | | | | | | | | | | | |
| Media | | | 18,000.00 | | DISNEY WALT CO COM | | | 430,398 | | | | 466,380 | | | | | |
| | | | 30,000.00 | | NEWS CORP CL B | | | 458,225 | | | | 318,600 | | | | | |
| | | | | | | | | 888,623 | | | | 784,980 | | | | 0.77 | % |
| | | | | | | | | | | | | | | | | | |
| Retailing | | | 9,000.00 | | AARON RENTS INC COM | | | 208,208 | | | | 223,110 | | | | | |
| | | | 17,000.00 | | HOME DEPOT INC COM | | | 527,536 | | | | 401,030 | | | | | |
| | | | | | | | | 735,744 | | | | 624,140 | | | | 0.61 | % |
| | | | | | | | | | | | | | | | | | |
| TOTAL CONSUMER DISCRETIONARY | | | | | | | | 3,047,998 | | | | 2,488,479 | | | | 2.43 | % |
| | | | | | | | | | | | | | | | | | |
| CONSUMER STAPLES | | | | | | | | | | | | | | | | | |
| Food & Staples Retailing | | | 750.00 | | COSTCO COMPANIES INC COM | | | 49,794 | | | | 42,757 | | | | | |
| | | | 27,000.00 | | SAFEWAY INC COM NEW | | | 505,111 | | | | 574,290 | | | | | |
| | | | 5,000.00 | | WAL MART STORES INC COM | | | 253,174 | | | | 279,050 | | | | | |
| | | | | | | | | 808,079 | | | | 896,097 | | | | 0.87 | % |
| | | | | | | | | | | | | | | | | | |
| Food, Beverage & Tobacco | | | 5,000.00 | | ANHEUSER BUSCH COS INC COM | | | 291,725 | | | | 310,150 | | | | | |
| | | | 10,000.00 | | COCA COLA CO COM | | | 468,331 | | | | 440,600 | | | | | |
| | | | 6,000.00 | | DIAGEO P L C SPON ADR NEW | | | 418,515 | | | | 373,140 | | | | | |
| | | | 5,000.00 | | DR. PEPPER SNAPPLE | | | 119,217 | | | | 114,500 | | | | | |
| | | | 36,250.00 | | NESTLE S A SPONSORED ADR | | | 587,036 | | | | 1,396,557 | | | | | |
| | | | 4,000.00 | | PEPSICO INC COM | | | 286,163 | | | | 228,040 | | | | | |
| | | | | | | | | 2,170,987 | | | | 2,862,987 | | | | 2.79 | % |
| | | | | | | | | | | | | | | | | | |
| Household & Personal Products | | | 18,000.00 | | AVON PRODS INC COM | | | 464,052 | | | | 446,940 | | | | | |
| | | | 9,000.00 | | PROCTER & GAMBLE CO COM | | | 557,148 | | | | 580,860 | | | | | |
| | | | | | | | | 1,021,200 | | | | 1,027,800 | | | | 1.00 | % |
| | | | | | | | | | | | | | | | | | |
| TOTAL CONSUMER STAPLES | | | | | | | | 4,000,266 | | | | 4,786,884 | | | | 4.67 | % |
| | | | | | | | | | | | | | | | | | |
| ENERGY | | | 1,000.00 | | APACHE CORP COM | | | 112,790 | | | | 82,330 | | | | | |
| | | | 4,000.00 | | BP PLC SPONSORED ADR | | | 246,544 | | | | 198,800 | | | | | |
| | | | 2,500.00 | | BP PRUDHOE BAY ROYALTY TRU | | | 225,804 | | | | 206,225 | | | | | |
| | | | 5,000.00 | | CHEVRON CORP | | | 251,881 | | | | 373,000 | | | | | |
| | | | 7,500.00 | | CONOCOPHILLIPS COM | | | 300,264 | | | | 390,075 | | | | | |
| | | | 6,000.00 | | CPFL ENERGIA | | | 363,873 | | | | 262,680 | | | | | |
| | | | 1,000.00 | | DEVON ENERGY CORP NEW COM | | | 105,231 | | | | 80,860 | | | | | |
| | | | 700.00 | | DIAMOND OFFSHORE DRILL COM | | | 100,459 | | | | 62,160 | | | | | |
| | | | 4,000.00 | | ENBRIDGE ENERGY PARTNERS | | | 145,031 | | | | 154,880 | | | | | |
| | | | 12,000.00 | | ENTERPRISE PRODS PARTN COM | | | 302,232 | | | | 292,800 | | | | | |
| | | | 5,004.00 | | EXXON MOBIL CORP COM | | | 302,200 | | | | 370,897 | | | | | |
| | | | 7,425.00 | | KINDER MORGAN MANAGEMENT L | 357,214 | | | | 370,879 | | | | | |
| BMC FUND, INC. | | | | SCHEDULE I |
| INVESTMENTS IN SECURITIES OF UNAFFILIATED ISSUERS (CONTINUED) | | | |
| October 31, 2008 | | | | | | |
| | | | | | | |
Sectors and Industries | | Shares Held | | Company Name | | Cost | | | Market Value | | | Percent of Net Assets | |
| | | | 2,574.00 | | KINDER MORGAN MGMT FRACTIO | | | 1 | | | | 1 | | | | |
| | | | 10,000.00 | | MARKWEST ENERGY PARTNERS L | | | 349,048 | | | | 181,500 | | | | |
| | | | 200.00 | | NOBLE CORPORATION SHS | | | 12,623 | | | | 6,442 | | | | |
| | | | 3,000.00 | | ONEOK PARTNERS LP | | | 161,530 | | | | 165,210 | | | | |
| | | | 6,000.00 | | PENGROWTH ENERGY TR TR UNI | | | 96,129 | | | | 67,260 | | | | |
| | | | 6,000.00 | | PENN WEST ENERGY TR TR UNI | | | 136,126 | | | | 107,160 | | | | |
| | | | 3,000.00 | | SAN JUAN BASIN ROYALTY TRU | | | 91,906 | | | | 111,690 | | | | |
| | | | 250.00 | | SASOL | | | 11,373 | | | | 7,233 | | | | |
| | | | 10,000.00 | | SUNCOR ENERGY INC COM | | | 406,092 | | | | 239,200 | | | | |
| | | | 6,000.00 | | TEPPCO PARTNERS L P UT LTD | | | 164,015 | | | | 170,820 | | | | |
| | | | 1,000.00 | | TRANSOCEAN INC NEW SHS | | | 141,070 | | | | 82,330 | | | | |
| | | | 8,409.00 | | UNITED UTILITIES GROUP SPO | | | 270,707 | | | | 190,080 | | | | |
| | | | 3,176.00 | | WEATHERFORD INTL LTD COM | | | 111,989 | | | | 53,611 | | | | |
| TOTAL ENERGY | | | | | | | | 4,766,132 | | | | 4,228,123 | | | | 4.12 | % |
| | | | | | | | | | | | | | | | | | |
| FINANCIALS | | | | | | | | | | | | | | | | | |
| Banks | | | 20,000.00 | | BANK OF AMERICA CORP COM | | | 822,516 | | | | 483,400 | | | | 0.47 | % |
| | | | | | | | | | | | | | | | | | |
| Diversified Financials | | | 18,300.00 | | ALLIANCE BERNSTEIN HLDG UN | | | 700,828 | | | | 428,952 | | | | | |
| | | | 25,000.00 | | AMERICAN CAPITAL LTD | | | 704,268 | | | | 351,250 | | | | | |
| | | | 28,000.00 | | CITIGROUP INC COM | | | 561,821 | | | | 382,200 | | | | | |
| | | | 6,500.00 | | FRANKLIN RESOURCES INC | | | 607,018 | | | | 442,000 | | | | | |
| | | | 582.00 | | HSBC HLDGS PLC SPON ADR NE | | | 53,498 | | | | 34,338 | | | | | |
| | | | | | | | | 2,627,433 | | | | 1,638,740 | | | | 1.60 | % |
| | | | | | | | | | | | | | | | | | |
| Insurance | | | 10,500.00 | | AFLAC INC COM | | | 548,321 | | | | 464,940 | | | | | |
| | | | 2.00 | | BERKSHIRE HATHAWAY A | | | 218,700 | | | | 230,980 | | | | | |
| | | | 8,500.00 | | MARSH & MCLENNAN COS COM | | | 257,865 | | | | 248,880 | | | | | |
| | | | 22,000.00 | | PROGRESSIVE CORP OHIO | | | 353,800 | | | | 313,940 | | | | | |
| | | | | | | | | 1,378,686 | | | | 1,258,740 | | | | 1.23 | % |
| | | | | | | | | | | | | | | | | | |
| Real Estate | | | 35,000.00 | | MEDICAL PPTYS TR INC COM | | | 370,003 | | | | 258,300 | | | | | |
| | | | 3,000.00 | | W P CAREY & CO LLC COM | | | 92,549 | | | | 69,000 | | | | | |
| | | | | | | | | 462,552 | | | | 327,300 | | | | 0.32 | % |
| | | | | | | | | | | | | | | | | | |
| Financial | | | 19,000.00 | | LEGG MASON | | | 771,807 | | | | 421,610 | | | | 0.41 | % |
| | | | | | | | | | | | | | | | | | |
| TOTAL FINANCIALS | | | | | | | | 6,062,994 | | | | 4,129,790 | | | | 4.03 | % |
| | | | | | | | | | | | | | | | | | |
| HEALTH CARE | | | | | | | | | | | | | | | | | |
| Health Care Equipment & Services | | | 3,666.00 | | AMEDISYS INC COM | | | 197,252 | | | | 206,799 | | | | | |
| | | | 5,000.00 | | BARD C R INC COM | | | 206,257 | | | | 441,250 | | | | | |
| | | | 15,500.00 | | CIGNA CORP COM | | | 341,708 | | | | 252,650 | | | | | |
| | | | 2,000.00 | | COVIDIEN LTD | | | 109,285 | | | | 88,580 | | | | | |
| | | | 1,000.00 | | CRYOLIFE INC. | | | 15,192 | | | | 13,400 | | | | | |
| | | | 250.00 | | LABORATORY CORP AMER HLDGS | | | 17,105 | | | | 15,372 | | | | | |
| | | | 4,000.00 | | MEDTRONIC INC COM | | | 215,780 | | | | 161,320 | | | | | |
| | | | 1,000.00 | | PEDIATRIX MED GROUP COM | | | 46,748 | | | | 38,650 | | | | | |
| | | | 4,000.00 | | QUEST DIAGNOSTICS INC COM | | | 204,139 | | | | 187,200 | | | | | |
| | | | | | | | | 1,353,466 | | | | 1,405,221 | | | | 1.37 | % |
| | | | | | | | | | | | | | | | | | |
| Pharmaceuticals & Biotechnology | | | 7,600.00 | | AMGEN INC COM | | | 404,968 | | | | 455,164 | | | | | |
| BMC FUND, INC. | | | | SCHEDULE I |
| INVESTMENTS IN SECURITIES OF UNAFFILIATED ISSUERS (CONTINUED) | | | |
| October 31, 2008 | | | | | | |
| | | | | | | |
Sectors and Industries | | Shares Held | | Company Name | | Cost | | | Market Value | | | Percent of Net Assets | |
| | | | 20,000.00 | | BRISTOL MYERS SQUIBB COM | | | 490,286 | | | | 411,000 | | | | |
| | | | 7,500.00 | | JOHNSON & JOHNSON COM | | | 460,377 | | | | 460,050 | | | | |
| | | | 28,000.00 | | MERCK & CO INC COM | | | 893,719 | | | | 866,600 | | | | |
| | | | 3,000.00 | | PDL BIOPHARMA INC COM | | | 37,599 | | | | 29,250 | | | | |
| | | | 67,500.00 | | PFIZER INC COM | | | 1,334,601 | | | | 1,195,425 | | | | |
| | | | 53,000.00 | | SCHERING PLOUGH CORP COM | | | 1,012,150 | | | | 767,970 | | | | |
| | | | 15,000.00 | | WYETH COM | | | 647,022 | | | | 482,700 | | | | |
| | | | | | | | | 5,280,722 | | | | 4,668,159 | | | | 4.55 | % |
| | | | | | | | | | | | | | | | | | |
| Asia Ex-Japan Stock | | | 2,000.00 | | FRESENIUS MED CARE AG SPON | | | 110,365 | | | | 90,160 | | | | 0.09 | % |
| | | | | | | | | | | | | | | | | | |
| Health | | | 1,500.00 | | STRYKER CORP | | | 101,234 | | | | 80,190 | | | | 0.08 | % |
| | | | | | | | | | | | | | | | | | |
| TOTAL HEALTH CARE | | | | | | | | 6,845,787 | | | | 6,243,730 | | | | 6.09 | % |
| | | | | | | | | | | | | | | | | | |
| INDUSTRIALS | �� | | | | | | | | | | | | | | | | |
| Capital Goods | | | 6,000.00 | | 3M COMPANY | | | 522,256 | | | | 385,800 | | | | | |
| | | | 8,500.00 | | CATERPILLAR INC DEL COM | | | 475,618 | | | | 324,700 | | | | | |
| | | | 10,000.00 | | DEERE & CO COM | | | 584,223 | | | | 385,600 | | | | | |
| | | | 8,000.00 | | EMERSON ELEC CO COM | | | 333,888 | | | | 261,840 | | | | | |
| | | | 25,000.00 | | GENERAL ELEC CO COM | | | 703,335 | | | | 487,750 | | | | | |
| | | | 11,000.00 | | IDEX CORP | | | 368,924 | | | | 254,980 | | | | | |
| | | | 1,000.00 | | II-VI INC. | | | 30,286 | | | | 28,090 | | | | | |
| | | | 3,000.00 | | WATTS WATER TECHNOLOGIES | | | 82,507 | | | | 79,290 | | | | | |
| | | | | | | | | 3,101,037 | | | | 2,208,050 | | | | 2.15 | % |
| | | | | | | | | | | | | | | | | | |
| Commercial Services & Supplies | | | 3,000.00 | | AMERICAN ECOLOGY CORP | | | 96,549 | | | | 52,620 | | | | | |
| | | | 250.00 | | STERICYCLE INC COM | | | 12,177 | | | | 14,607 | | | | | |
| | | | | | | | | 108,726 | | | | 67,227 | | | | 0.07 | % |
| | | | | | | | | | | | | | | | | | |
| Transportation | | | 200.00 | | NORFOLK SOUTHERN CORP COM | | | 12,103 | | | | 11,988 | | | | 0.01 | % |
| | | | | | | | | | | | | | | | | | |
| TOTAL INDUSTRIALS | | | | | | | | 3,221,866 | | | | 2,287,265 | | | | 2.23 | % |
| | | | | | | | | | | | | | | | | | |
| INFORMATION TECHNOLOGY | | | | | | | | | | | | | | | | | |
| Software & Services | | | 200.00 | | CACI INTL INC CL A | | | 9,943 | | | | 8,236 | | | | | |
| | | | 16,000.00 | | MICROSOFT CORP COM | | | 430,940 | | | | 357,280 | | | | | |
| | | | 7,000.00 | | ORACLE CORP COM | | | 148,921 | | | | 128,030 | | | | | |
| | | | 10,000.00 | | UNITED ONLINE INC COM | | | 114,228 | | | | 74,000 | | | | | |
| | | | | | | | | 704,032 | | | | 567,546 | | | | 0.55 | % |
| | | | | | | | | | | | | | | | | | |
| Technology Hardware & Equipment | | | 1,000.00 | | APPLE COMPUTER INC COM | | | 132,855 | | | | 107,590 | | | | | |
| | | | 3,000.00 | | CISCO SYS INC COM | | | 90,205 | | | | 53,310 | | | | | |
| | | | 6,000.00 | | INTERNATIONAL BUS MACH COM | | | 472,096 | | | | 557,820 | | | | | |
| | | | 1,300.00 | | L-3 COMMUNICATNS HLDGS COM | | | 137,210 | | | | 105,521 | | | | | |
| | | | 25,000.00 | | TYCO ELECTRONICS | | | 741,066 | | | | 486,000 | | | | | |
| | | | | | | | | 1,573,432 | | | | 1,310,241 | | | | 1.28 | % |
| | | | | | | | | | | | | | | | | | |
| Semiconductors & | | | 500.00 | | AMERICAN SUPERCONDUCTOR | | | 16,195 | | | | 6,255 | | | | | |
| Semiconductor Equipment | | | 2,000.00 | | INTEL CORP COM | | | 51,695 | | | | 32,062 | | | | | |
| | | | | | | | | 67,890 | | | | 38,317 | | | | 0.04 | % |
| BMC FUND, INC. | | | | SCHEDULE I |
| INVESTMENTS IN SECURITIES OF UNAFFILIATED ISSUERS (CONTINUED) | | | |
| October 31, 2008 | | | | | | |
| | | | | | | |
Sectors and Industries | | Shares Held | | Company Name | | Cost | | | Market Value | | | Percent of Net Assets | |
| | | | | | | | | | | | | | | | | |
| TOTAL INFORMATION TECHNOLOGY | | | | | | | 2,345,354 | | | | 1,916,104 | | | | 1.87 | % |
| | | | | | | | | | | | | | | | | |
| MATERIALS | | | 20.00 | | ANGLO AMERN PLC ADR | | | 660 | | | | 251 | | | | | |
| | | | 100.00 | | BHP BILLITON LTD SPONSORED | | | 7,683 | | | | 3,888 | | | | | |
| | | | 110.00 | | BROOKFIELD INFRASTRUCTURE | | | 2,310 | | | | 1,650 | | | | | |
| | | | 3,000.00 | | CEMEX S A SPON ADR 5 ORD | | | 52,524 | | | | 22,680 | | | | | |
| | | | 2,000.00 | | COMPANHIA VALE DO RIO DOCE | | | 55,280 | | | | 26,240 | | | | | |
| | | | 3,500.00 | | ROHM & HAAS CO COM | | | 244,627 | | | | 246,225 | | | | | |
| | | | 20,000.00 | | SEALED AIR CORP NEW | | | 443,629 | | | | 338,400 | | | | | |
| | | | 750.00 | | SOUTHERN COPPER CORP | | | 29,003 | | | | 10,920 | | | | | |
| | | | 200.00 | | SYNGENTA AG SPONSORED ADR | | | 12,789 | | | | 7,476 | | | | | |
| TOTAL MATERIALS | | | | | | | | 848,505 | | | | 657,730 | | | | 0.64 | % |
| | | | | | | | | | | | | | | | | | |
| TELECOMMUNICATION SERVICES | | | 1,200.00 | | BRASIL TELECOM | | | 90,830 | | | | 41,100 | | | | | |
| | | | 10,000.00 | | BT GROUP | | | 207,598 | | | | 189,000 | | | | | |
| | | | 200.00 | | CHINA MOBILE HONG KONG SPO | | | 9,247 | | | | 8,778 | | | | | |
| | | | 15,000.00 | | PARTNER COMMUNICATIONS | | | 233,861 | | | | 280,200 | | | | | |
| | | | 500.00 | | SK TELECOM LTD SPONSORED A | | | 9,648 | | | | 8,605 | | | | | |
| | | | 5,688.00 | | TELECOM CP NEW ZEALAND SPO | | | 82,004 | | | | 39,588 | | | | | |
| | | | 18,500.00 | | TELECOMUNCA DE SAO PAU SPO | | | 418,772 | | | | 420,875 | | | | | |
| | | | 10,000.00 | | WINDSTREAM CORP COM | | | 136,850 | | | | 75,100 | | | | | |
| TOTAL TELECOMMUNICATION SERVICES | | | | | | | | 1,188,810 | | | | 1,063,246 | | | | 1.04 | % |
| | | | | | | | | | | | | | | | | | |
| UTILITIES | | | 10,000.00 | | AMERIGAS PARTNERS L P UNIT | | | 343,733 | | | | 314,300 | | | | | |
| | | | 5,000.00 | | COMPANHIA PARANAENSE de EN | | | 74,827 | | | | 55,600 | | | | | |
| | | | 5,000.00 | | CONSTELLATION ENERGY COM | | | 119,157 | | | | 121,050 | | | | | |
| | | | 7,500.00 | | DUKE ENERGY CORP COM | | | 114,787 | | | | 122,850 | | | | | |
| | | | 5,500.00 | | PROGRESS ENERGY | | | 207,987 | | | | 216,535 | | | | | |
| | | | 10,000.00 | | VEOLIA ENVIRONMENT ADS | | | 240,096 | | | | 249,500 | | | | | |
| TOTAL UTILITIES | | | | | | | | 1,100,587 | | | | 1,079,835 | | | | 1.05 | % |
| | | | | | | | | | | | | | | | | | |
| TOTAL INVESTMENTS IN COMMON STOCKS | | | | | | | $ | 33,428,299 | | | $ | 28,881,186 | | | | 28.16 | % |
| | | | SCHEDULE I |
| INVESTMENTS IN SECURITIES OF UNAFFILIATED ISSUERS (CONTINUED) |
| October 31, 2008 | | | | |
| | | | | | | | | | | |
| Company Name | | Shares Held | | | Cost | | | Market Value | | Percent of Net Assets |
| | | | | | | | | | | |
| PREFERRED STOCKS: | | | | | | | | | | |
| BLUE WATER TR I | | | 10 | | | $ | 1,001,109 | | | $ | 1,000,000 | | |
| COMCAST CORP 7% NOTE | | | 4,000 | | | $ | 91,267 | | | $ | 80,280 | | |
| LEARNINGSTATION.COM | | | 1,224,661 | | | | 500,000 | | | | - | | |
| | | | | | | | | | | | | | |
| TOTAL INVESTMENTS IN PREFERRED STOCKS | | | | | | $ | 1,592,376 | | | $ | 1,080,280 | | 1.05% |
| BMC FUND, INC. | | | | | SCHEDULE I |
| INVESTMENTS IN SECURITIES OF UNAFFILIATED ISSUERS (CONTINUED) | | |
| October 31, 2008 | | | | | | |
| | | | | | | Market | | | Percent of | |
| Industries | Company Name | | Cost | | | Value | | | Net Assets | |
| | | | | | | | | | | |
| Short-term Investments | First American Treasury Oblig. Fund Z | | $ | 45,468,215 | | | $ | 45,468,215 | | | | |
| | | | | | | | | | | | | |
| Total Short-term Investments | | | $ | 45,468,215 | | | | 45,468,215 | | | | 44.33 | % |
| | | | | | | | | | | | | | |
| | | | | | | | | | | | | | |
| TOTAL INVESTMENTS - MARKET VALUE | | | | | | | $ | 100,250,816 | | | | 97.73 | % |
| | | | | | | | | | | | | | |
| | | | | | | | | | | | | | |
| | | | | | | | | | | | | | |
| | | | | | | | | | | | | | |
| | | | | | | | | | | | | | |
| Aggregate gross unrealized appreciation of security values | | | | | | $ | 4,929,322 | | | | | |
| Aggregate gross unrealized depreciation of security values | | | | | | | (17,957,467 | ) | | | | |
| Net appreciation of security values | | | | | | | | (13,028,145 | ) | | | | |
| Tax cost of securities | | | | | | | | 113,278,961 | | | | | |
| | | | | | | | | | | | | | |
| Total market value of securities | | | | | | | $ | 100,250,816 | | | | | |
| BMC FUND, INC. | | | | | SCHEDULE II |
| INVESTMENTS IN AFFILIATES | | | | | | |
| As of and for the Year Ended October 31, 2008 | | | | | |
| | | | | | | | | | | | |
| | | Number of | | | Amount of Equity | | | | | | |
| | | Shares Held At | | | In Net Profit | | | Amount of | | Value at | |
| | | October 31, | | | And Loss for the | | | Dividends | | October 31, | |
| Issuer | | 2008 | | | Period | | | | (1) | | 2008 | |
| | | | | | | | | | | | | |
| Broyhill Industries, Inc. - wholly owned | | | | | | | | | | | | |
| subsidiary | | | 1,000 | | | $ | (55,754 | ) | | $ | - | | $ | 636,595 | |
| | | | | | | | | | | | | | | | |
| P. B. Realty, Inc. - wholly owned | | | | | | | | | | | | | | | |
| subsidiary (2) | | | - | | | | 792,052 | | | | 5,555,000 | | | - | |
| | | | | | | | | | | | | | | | |
| TOTAL | | | | | | $ | 736,298 | | | $ | 5,555,000 | | $ | 636,595 | |
| | | | | | | | | | | | | | | | |
| | | | | | | | | | | | | | | | |
| (1) | All of the dividends received by BMC Fund, Inc. from its wholly owned subsidiaries have been credited to the investment account since BMC Fund, Inc. is accounting for its investment in the subsidiary companies on the equity method. |
| (2) | The Company conducted a spin off of P. B. Realty, Inc. effective October 31, 2008. |
Item. 2. Code of Ethics.
On July 26, 2003, the Board of Directors of the Registrant
adopted a Code of Ethics for the principal executive
officer and principal financial and accounting officer. The Code
was amended by the Board of Directors on February 24, 2007.
(c)-(e) N/A
(f) A copy of the Code of Ethics is attached as an exhibit.
Item 3. Audit Committee Financial Expert.
The Board of Directors of the Registrant has determined
that R. Donald Farmer, a member of its Audit Committee,
is an audit committee financial expert. Mr. Farmer is an
independent director of the Registrant.
Item 4. Principal Accountant Fees and Services.
(a) Audit Fees: $45,117.00 for the fiscal year ended
October 31, 2007; $41,484.00 for the fiscal year ended
October 31, 2008.
(b) Audit-Related Fees: $2,033.00 for the fiscal year ended
October 31, 2007 and $1,884.00 for the fiscal year
ended October 31, 2008.
(c) Tax Fees: $0.00 for the fiscal year ended
October 31, 2007; $0.00 for the fiscal year ended
October 31, 2008. These fees were incurred for review
of the tax returns.
(d) All Other Fees: $899.00 for the fiscal year ended
October 31, 2007; $0.00 for the fiscal year
ended October 31, 2008. The fee was incurred for report
production and printing.
(e)(1) A copy of the Audit Committee's pre-approval policies and
procedures is attached as an exhibit.
(e)(2) One hundred percent of the services described in
Items 4(b) through 4(d) were approved in accordance with the
Audit Committee Pre-Approval Policy. As a result, none
of such services was approved pursuant to
paragraph (c)(7)(i)(C) of Rule 2-01 of Regulation S-X.
(f) None of the hours expended on the principal accountant's
engagement to audit the Registrant's financial statements for
the fiscal year ended October 31, 2008 was attributed to work
performed by persons other than the principal accountant's
full-time, permanent employees.
(g) N/A
(h) N/A
Item 5. Audit Committee of Listed Registrants.
N/A
Item 6. Schedule of Investments.
Included as a part of the report to shareholders filed
under Item 1.
Item 7. Disclosure of Proxy Voting Policies and Procedures for
Closed-End Management Investment Companies.
The Board of Directors of the Registrant adopted
Proxy Voting Policies and Procedures on July 26, 2003 and
amended them October 30, 2003, April 5, 2004 and May 26, 2005.
A copy as amended is attached as an exhibit.
Item 8. Portfolio Managers of Closed-End Investment Companies.
(a)(1) As of the date of filing of this report, Paul H. Broyhill, Chairman and Chief Executive Officer, Michael G. Landry, Vice President and Chief Investment Officer, M. Hunt Broyhill, President, Christopher R. Pavese, CFA, Managing Director, and Dan J. Wakin, Managing Director – Alternative Investments, are primarily responsible for the day-to-day management of the Registrant’s portfolio. Mr. Paul Broyhill has served in such capacity since the inception of the Registrant in 1982. Messrs. Landry and Hunt Broyhill have served in such capacity since 2001. Messrs. Landry and Hunt Broyhill have been engaged in asset management for various institutions and high net worth individuals for more than five years. Prior to joining the Registrant on March 1, 2005, Mr. Pavese was a Vice President and Portfolio Manager at JP Morgan Private Bank from January 1999 until February 2005. At JP Morgan, Mr. Pavese was engaged in asset management, portfolio strategy, and asset allocation for high net worth individuals, personal trusts, endowments and foundations. Mr. Wakin has served as a portfolio manager since February 2006. He has been employed by the Registrant since 1995, researching and advising management about hedge funds and other alternative investments.
(a)(2) The following tables provide information regarding registered investment companies other than the Registrant, other pooled investment vehicles, and other accounts over which the Registrant’s portfolio managers also have day-to-day management responsibilities. The tables provide the numbers of such accounts, the total assets in such accounts and the number of accounts and the total assets in the accounts with respect to which the fees are based on performance. The information is provided as of the Registrant’s fiscal year ended October 31, 2008.
Paul H. Broyhill
| | Other Registered Investment Companies | Other Pooled Investment Vehicles | Other Accounts |
Number of Accounts Managed | None | None | 5 |
Number of Accounts Managed with Performance-Based Advisory Fees | None | None | None |
| Assets Managed | $0 | $0 | $41,181,618 |
Assets Managed with Performance-Based Advisory Fees | $0 | $0 | $0 |
Michael G. Landry
| | Other Registered Investment Companies | Other Pooled Investment Vehicles | Other Accounts |
Number of Accounts Managed | None | None | 0 |
Number of Accounts Managed with Performance-Based Advisory Fees | None | None | 0 |
| Assets Managed | $0 | $0 | $0 |
Assets Managed with Performance-Based Advisory Fees | $0 | $0 | $0 |
M. Hunt Broyhill
| | Other Registered Investment Companies | Other Pooled Investment Vehicles | Other Accounts |
Number of Accounts Managed | None | 1 | 3 |
Number of Accounts Managed with Performance-Based Advisory Fees | None | None | None |
| Assets Managed | $0 | $13,684,000 | $33,815,960 |
Assets Managed with Performance-Based Advisory Fees | $0 | $12,965,000 | $0 |
Christopher R. Pavese
| | Other Registered Investment Companies | Other Pooled Investment Vehicles | Other Accounts |
Number of Accounts Managed | None | 1 | 18 |
Number of Accounts Managed with Performance-Based Advisory Fees | None | 1 | None |
| Assets Managed | $0 | $8,800,000 | $3,600,000 |
Assets Managed with Performance-Based Advisory Fees | $0 | $200,000 | $0 |
Dan J. Wakin
| | Other Registered Investment Companies | Other Pooled Investment Vehicles | Other Accounts |
Number of Accounts Managed | None | 1 | 42 |
Number of Accounts Managed with Performance-Based Advisory Fees | None | 1 | None |
| Assets Managed | $0 | $13,684,000 | $6,625,000 |
Assets Managed with Performance-Based Advisory Fees | $0 | $12,965,000 | $0 |
Material Conflicts of Interest
The Fund recognizes that actual or potential conflicts of interest are inherent in our business. These actual or potential conflicts may arise when a portfolio manager has day-to-day portfolio management responsibilities with respect to more than one fund or account. Certain investments may be appropriate for the Fund and also for other clients advised by the portfolio manager. Investment decisions for the Fund and other clients are made with a view to achieving their respective investment objectives and after consideration of such factors as their current holdings, availability of cash for investment and the size of their investments generally. Therein lies the possibility that a particular security could be bought or sold for the Fund and also for other clients, along with the possibility that a particular security could be bought or sold for the Fund while the opposite transaction could be occurring for other clients due to their investment strategy.
To the extent that a portfolio manager has responsibilities for managing accounts in addition to the Fund, the portfolio manager will need to divide his time and attention among relevant accounts.
The Fund also recognizes that in some cases, an actual or potential conflict may arise where a portfolio manager may have an incentive, such as a performance-based fee.
The Fund is in the process of developing written policies and procedures designed to address conflicts of interest its portfolio managers may face.
(a)(3)
Compensation Structure of Portfolio Managers
The compensation structure for each portfolio manager is based upon a fixed salary as well as a discretionary bonus determined by the senior management of the Fund. Salaries are determined by the senior management and are based upon an individual’s position and overall value to the Fund. Bonuses are also determined by management and are based upon an individual’s overall contribution to the success of the Fund and the profitability of the Fund. Salaries and bonuses for portfolio managers are not based upon criteria such as performance of the Fund or the value of assets of the Fund. Portfolio managers also have the opportunity to participate in other employee benefits available to all of the employees of the Fund.
(a)(4) The dollar range of the Registrant’s equity securities owned beneficially by the Registrant’s portfolio managers as of the Registrant’s fiscal year ended October 31, 2008 is set forth below:
Name of Portfolio Manager | Dollar ($) Range of Registrant’s Shares Beneficially Owned |
| Paul H. Broyhill | Over $1,000,000 |
| Michael G. Landry | $1-$10,000 |
| M. Hunt Broyhill | Over $1,000,000 |
| Christopher R. Pavese | None |
| Dan J. Wakin | None |
(b) N/A
Item 9. Purchases of Equity Securities by Closed-End Management Investment Company and Affiliated Purchasers.
None
Item 10. Submission of Matters to a Vote of Security Holders.
N/A
Item 11. Controls and Procedures.
Within the 90 days prior to the date of this report, the Registrant's management carried out an evaluation, under the supervision and with the participation of Registrant's Chief Executive Officer and Chief Financial Officer, of the effectiveness of the Registrant's disclosure controls and procedures pursuant to Rule 30a-3(b) of the Investment Company Act of 1940. Based upon the evaluation, the Chief Executive Officer and Chief Financial Officer concluded as of a date within 90 days of the filing of this report that the Registrant's disclosure controls and procedures are effective in timely alerting them to material information relating to the Registrant required to be included in the Registrant's periodic SEC filings.
There were no significant changes in the Registrant's internal control over financial reporting (as defined in Rule 30a-3(d) under the Investment Company Act of 1940) that occurred during the second fiscal quarter of the period covered by the report that have materially affected, or are reasonably likely to materially affect, the Registrant's internal control over financial reporting.
Item 12. Exhibits.
(a)(1) The Registrant's Code of Ethics is attached as Exhibit 12(a)(1).
(a)(2) Certifications.
SIGNATURES
Pursuant to the requirements of the Securities Exchange Act of 1934 and the Investment Company Act of 1940, the Registrant has duly caused this report to be signed on its behalf by the undersigned, thereunto duly authorized.
BMC Fund, Inc.
By
/s/ Boyd C. Wilson, Jr.
Boyd C. Wilson, Jr.
Vice President and
Chief Financial Officer
Date: December 23, 2008
Pursuant to the requirements of the Securities Exchange Act of 1934 and the Investment Company Act of 1940, this report has been signed below by the following persons on behalf of the registrant and in the capacities and on the dates indicated.
By
/s/ Paul H. Broyhill
Paul H. Broyhill
President and Chief Executive Officer
Date: December 23, 2008
By
/s/ Boyd C. Wilson, Jr.
Boyd C. Wilson, Jr.
Vice President and
Chief Financial Officer
Date: December 23, 2008