UNITED STATES
SECURITIES AND EXCHANGE COMMISSION
Washington, D.C. 20549
FORM N-CSR
CERTIFIED SHAREHOLDER REPORT OF REGISTERED
MANAGEMENT INVESTMENT COMPANIES
Investment Company Act file Number _811-03171_
Value Line U.S. Government Securities Fund, Inc.
(Exact name of registrant as specified in charter)
220 East 42nd Street, New York, N.Y. 10017
(Address of principal executive offices) (Zip Code)
Registrant’s telephone number, including area code: 212-907-1500
Date of fiscal year end: August 31, 2008
Date of reporting period: February 29, 2008
Item I. Reports to Stockholders.
A copy of the Semi-Annual Report to Stockholders for the period ended 2/29/08 is included with this Form.
| INVESTMENT ADVISER | Value Line, Inc. 220 East 42nd Street New York, NY 10017-5891 | |||||
| DISTRIBUTOR | Value Line Securities, Inc. 220 East 42nd Street New York, NY 10017-5891 | |||||
| CUSTODIAN BANK | State Street Bank and Trust Co. 225 Franklin Street Boston, MA 02110 | |||||
| SHAREHOLDER SERVICING AGENT | State Street Bank and Trust Co. c/o BFDS P.O. Box 219729 Kansas City, MO 64121-9729 | |||||
| INDEPENDENT REGISTERED PUBLIC ACCOUNTING FIRM | PricewaterhouseCoopers LLP 300 Madison Avenue New York, NY 10017 | |||||
| LEGAL COUNSEL | Peter D. Lowenstein, Esq. 496 Valley Road Cos Cob, CT 06807-0272 | |||||
| DIRECTORS | Jean Bernhard Buttner John W. Chandler Frances T. Newton Francis C. Oakley David H. Porter Paul Craig Roberts Nancy-Beth Sheerr | |||||
| OFFICERS | Jean Bernhard Buttner Chairman and President David T. Henigson Vice President, Secretary/ Chief Compliance Officer Stephen R. Anastasio Treasurer Howard A. Brecher Assistant Secretary/ Assistant Treasurer | |||||
#541514 |
SEMI-ANNUAL REPORT
February 29, 2008
U.S. Government
Securities
Fund, Inc.

Jean Bernhard Buttner
Chairman and President
(1) | The Lehman Brothers Intermediate U.S. Government Bond Index represents the intermediate maturities (1-10 years) of the U.S. Treasury and U.S. Agency segment of the fixed-income market. The returns for the Index do not reflect charges, expenses, or taxes, and it is not possible to directly invest in this Index. |
2
3
FUND EXPENSES (unaudited):
| Beginning account value 9/1/07 | Ending account value 2/29/08 | Expenses* paid during period 9/1/07 thru 2/29/08 | ||||||||||||
|---|---|---|---|---|---|---|---|---|---|---|---|---|---|---|
| Actual | $ | 1,000.00 | $ | 1,062.50 | $ | 3.79 | ||||||||
| Hypothetical (5% return before expenses) | $ | 1,000.00 | $ | 1,021.18 | $ | 3.72 | ||||||||
| * | Expenses are equal to the Fund’s annualized expense ratio of 0.74% multiplied by the average account value over the period, multiplied by 182/366 to reflect the one-half period. This expense ratio may differ from the expense ratio shown in the Financial Highlights. |
4
| Issue | | Principal Amount | | Value | | Percentage of Fund’s Net Assets | ||||||||
|---|---|---|---|---|---|---|---|---|---|---|---|---|---|---|
| Morgan Stanley Repurchase Agreement, 1.65%, 3/3/08 | $ | 4,600,000 | $ | 4,600,000 | 5.1 | % | ||||||||
| Federal Home Loan Bank, 7.45%, 2/3/20 | $ | 3,000,000 | $ | 3,822,972 | 4.2 | % | ||||||||
| Federal Farm Credit Bank, 5.70%, 7/3/17 | $ | 3,000,000 | $ | 3,341,358 | 3.7 | % | ||||||||
| U.S. Treasury Notes, 4.63%, 7/31/12 | $ | 2,000,000 | $ | 2,187,344 | 2.4 | % | ||||||||
| U.S. Treasury Notes, 4.63%, 10/31/11 | $ | 2,000,000 | $ | 2,177,344 | 2.4 | % | ||||||||
| Federal Home Loan Mortgage Corporation, 4.50%, 7/15/13 | $ | 2,000,000 | $ | 2,104,274 | 2.3 | % | ||||||||
| 2.Federal Home Loan Mortgage Corporation, 5.50%, 9/15/11 | $ | 1,500,000 | $ | 1,628,556 | 1.8 | % | ||||||||
| Federal Home Loan Mortgage Corporation Gold PC Pool #G12381, 5.00%, 9/1/21 | $ | 1,590,875 | $ | 1,612,986 | 1.8 | % | ||||||||
| Federal Home Loan Mortgage Corporation Gold PC Pool #C77717, 6.00%, 3/1/33 | $ | 1,561,426 | $ | 1,602,179 | 1.8 | % | ||||||||
| U.S. Treasury Notes, 8.75%, 5/15/17 | $ | 1,000,000 | $ | 1,405,000 | 1.6 | % | ||||||||
| | Percentage of Fund’s investments | |||||
|---|---|---|---|---|---|---|
| Less than 4% | 7.1 | % | ||||
| 4–4.99% | 34.1 | % | ||||
| 5–5.99% | �� | 41.4 | % | |||
| 6–6.99% | 9.2 | % | ||||
| 7–7.99% | 6.6 | % | ||||
| 8–8.99% | 1.6 | % | ||||
5
| Principal Amount | | | Rate | | Maturity Date | | Value | |||||||||||
|---|---|---|---|---|---|---|---|---|---|---|---|---|---|---|---|---|---|---|
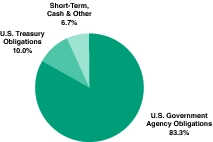
U.S. TREASURY OBLIGATIONS (10.0%) | ||||||||||||||||||
| $2,000,000 | U.S. Treasury Notes | 4.63 | % | 10/31/11 | $ | 2,177,344 | ||||||||||||
| 2,000,000 | U.S. Treasury Notes | 4.63 | 7/31/12 | 2,187,344 | ||||||||||||||
| 1,000,000 | U.S. Treasury Notes | 4.00 | 11/15/12 | 1,069,063 | ||||||||||||||
| 1,100,010 | U.S. Treasury Notes(1) | 1.63 | 1/15/15 | 1,164,894 | ||||||||||||||
| 1,000,000 | U.S. Treasury Notes | 4.13 | 5/15/15 | 1,065,157 | ||||||||||||||
1,000,000 | U.S. Treasury Notes | 8.75 | 5/15/17 | 1,405,000 | ||||||||||||||
8,100,010 | TOTAL U.S. TREASURY OBLIGATIONS (Cost $8,349,541) | 9,068,802 | ||||||||||||||||
U.S. GOVERNMENT AGENCY OBLIGATIONS (83.3%) | ||||||||||||||||||
FEDERAL FARM CREDIT BANK (7.2%) | ||||||||||||||||||
| 1,000,000 | Federal Farm Credit Bank | 6.82 | 3/16/09 | 1,045,946 | ||||||||||||||
| 1,000,000 | Federal Farm Credit Bank | 4.85 | 10/25/12 | 1,068,054 | ||||||||||||||
| 1,000,000 | Federal Farm Credit Bank | 5.30 | 6/22/15 | 1,000,221 | ||||||||||||||
3,000,000 | Federal Farm Credit Bank | 5.70 | 7/3/17 | 3,341,358 | ||||||||||||||
6,000,000 | TOTAL FEDERAL FARM CREDIT BANK (Cost $6,085,581) | 6,455,579 | ||||||||||||||||
FEDERAL HOME LOAN BANK (11.1%) | ||||||||||||||||||
| 1,000,000 | Federal Home Loan Bank | 4.10 | 6/13/08 | 1,003,666 | ||||||||||||||
| 1,000,000 | Federal Home Loan Bank | 5.25 | 11/14/08 | 1,018,960 | ||||||||||||||
| 1,000,000 | Federal Home Loan Bank | 4.38 | 3/17/10 | 1,040,677 | ||||||||||||||
| 1,000,000 | Federal Home Loan Bank | 4.38 | 9/17/10 | 1,044,999 | ||||||||||||||
| 1,000,000 | Federal Home Loan Bank | 4.88 | 11/18/11 | 1,067,484 | ||||||||||||||
| 1,000,000 | Federal Home Loan Bank | 4.50 | 9/16/13 | 1,050,908 | ||||||||||||||
3,000,000 | Federal Home Loan Bank | 7.45 | 2/3/20 | 3,822,972 | ||||||||||||||
9,000,000 | TOTAL FEDERAL HOME LOAN BANK (Cost $9,337,377) | 10,049,666 | ||||||||||||||||
FEDERAL HOME LOAN MORTGAGE CORPORATION (40.6%) | ||||||||||||||||||
| 1,000,000 | Federal Home Loan Mortgage Corporation | 4.25 | 7/15/09 | 1,026,813 | ||||||||||||||
| 1,000,000 | Federal Home Loan Mortgage Corporation | 4.00 | 12/15/09 | 1,029,695 | ||||||||||||||
| 1,000,000 | Federal Home Loan Mortgage Corporation | 4.13 | 7/12/10 | 1,037,233 | ||||||||||||||
| 1,500,000 | Federal Home Loan Mortgage Corporation | 5.50 | 9/15/11 | 1,628,556 | ||||||||||||||
| 1,000,000 | Federal Home Loan Mortgage Corporation | 4.50 | 5/14/12 | 1,004,001 | ||||||||||||||
| 1,000,000 | Federal Home Loan Mortgage Corporation | 5.13 | 7/15/12 | 1,080,106 | ||||||||||||||
| 1,000,000 | Federal Home Loan Mortgage Corporation | 5.50 | 8/20/12 | 1,094,828 | ||||||||||||||
| 1,000,000 | Federal Home Loan Mortgage Corporation | 4.75 | 5/6/13 | 1,003,402 | ||||||||||||||
| 1,000,000 | Federal Home Loan Mortgage Corporation | 4.00 | 6/12/13 | 1,028,345 | ||||||||||||||
| 2,000,000 | Federal Home Loan Mortgage Corporation | 4.50 | 7/15/13 | 2,104,274 | ||||||||||||||
6
| Principal Amount | | | Rate | | Maturity Date | | Value | |||||||||||
|---|---|---|---|---|---|---|---|---|---|---|---|---|---|---|---|---|---|---|
| $1,312,218 | Federal Home Loan Mortgage Corporation REMIC Trust Series 3197 Class AB | 5.50 | % | 8/15/13 | $ | 1,343,269 | ||||||||||||
| 1,000,000 | Federal Home Loan Mortgage Corporation | 5.00 | 1/30/14 | 1,073,485 | ||||||||||||||
| 1,000,000 | Federal Home Loan Mortgage Corporation | 4.50 | 1/15/15 | 1,042,339 | ||||||||||||||
| 738,506 | Federal Home Loan Mortgage Corporation REMIC Trust Series 2849 Class VA | 5.00 | 8/15/15 | 768,725 | ||||||||||||||
| 806,672 | Federal Home Loan Mortgage Corporation REMIC Trust Series R003 Class AG | 5.13 | 10/15/15 | 824,641 | ||||||||||||||
| 1,070,864 | Federal Home Loan Mortgage Corporation REMIC Trust Series 2767 Class CA | 4.00 | 9/15/17 | 1,074,268 | ||||||||||||||
| 20,920 | Federal Home Loan Mortgage Corporation Gold PC Pool #E92226 | 5.00 | 11/1/17 | 21,271 | ||||||||||||||
| 1,000,000 | Federal Home Loan Mortgage Corporation | 5.13 | 11/17/17 | 1,067,413 | ||||||||||||||
| 353,600 | Federal Home Loan Mortgage Corporation Gold PC Pool #E93499 | 5.00 | 12/1/17 | 359,533 | ||||||||||||||
| 23,773 | Federal Home Loan Mortgage Corporation Gold PC Pool #E92829 | 5.00 | 12/1/17 | 24,171 | ||||||||||||||
| 623,620 | Federal Home Loan Mortgage Corporation REMIC Trust Series 2892 Class DC | 4.50 | 12/15/17 | 630,287 | ||||||||||||||
| 22,318 | Federal Home Loan Mortgage Corporation Gold PC Pool #E98960 | 5.00 | 9/1/18 | 22,661 | ||||||||||||||
| 54,425 | Federal Home Loan Mortgage Corporation Gold PC Pool #B12822 | 5.00 | 3/1/19 | 55,262 | ||||||||||||||
| 52,214 | Federal Home Loan Mortgage Corporation Gold PC Pool #B17398 | 4.50 | 12/1/19 | 52,390 | ||||||||||||||
| 396,622 | Federal Home Loan Mortgage Corporation Gold PC Pool #G18044 | 4.50 | 3/1/20 | 396,487 | ||||||||||||||
| 185,692 | Federal Home Loan Mortgage Corporation Gold PC Pool #B18034 | 4.50 | 4/1/20 | 185,629 | ||||||||||||||
| 57,740 | Federal Home Loan Mortgage Corporation Gold PC Pool #J00118 | 5.00 | 10/1/20 | 58,542 | ||||||||||||||
| 568,752 | Federal Home Loan Mortgage Corporation Gold PC Pool #J00139 | 5.00 | 10/1/20 | 576,657 | ||||||||||||||
| 55,032 | Federal Home Loan Mortgage Corporation Gold PC Pool #G11986 | 5.00 | 4/1/21 | 55,731 | ||||||||||||||
| 68,799 | Federal Home Loan Mortgage Corporation Gold PC Pool #G12319 | 5.00 | 6/1/21 | 69,756 | ||||||||||||||
| 226,593 | Federal Home Loan Mortgage Corporation Gold PC Pool #J03233 | 5.00 | 8/1/21 | 229,469 | ||||||||||||||
| 1,590,875 | Federal Home Loan Mortgage Corporation Gold PC Pool #G12381 | 5.00 | 9/1/21 | 1,612,986 | ||||||||||||||
| 782,661 | Federal Home Loan Mortgage Corporation REMIC Trust Series 2773 Class DA | 5.00 | 6/15/22 | 802,632 | ||||||||||||||
7
| Principal Amount | | | Rate | | Maturity Date | | Value | |||||||||||
|---|---|---|---|---|---|---|---|---|---|---|---|---|---|---|---|---|---|---|
| $503,014 | Federal Home Loan Mortgage Corporation REMIC Trust Series 2937 Class JC | 5.00 | % | 9/15/22 | $ | 507,764 | ||||||||||||
| 611,043 | Federal Home Loan Mortgage Corporation Gold PC Pool #C90684 | 4.50 | 5/1/23 | 595,641 | ||||||||||||||
| 736,803 | Federal Home Loan Mortgage Corporation REMIC Trust Series 3132 Class MA | 5.50 | 12/15/23 | 759,637 | ||||||||||||||
| 848,588 | Federal Home Loan Mortgage Corporation REMIC Trust Series 3147 Class YE | 5.50 | 7/15/24 | 875,979 | ||||||||||||||
| 1,000,000 | Federal Home Loan Mortgage Corporation REMIC Trust Series 2690 Class OE | 5.00 | 11/15/28 | 1,032,022 | ||||||||||||||
| 1,000,000 | Federal Home Loan Mortgage Corporation | 6.75 | 3/15/31 | 1,241,722 | ||||||||||||||
| 820,656 | Federal Home Loan Mortgage Corporation REMIC Trust Series 3061 Class HA | 5.50 | 4/15/31 | 840,348 | ||||||||||||||
| 529,481 | Federal Home Loan Mortgage Corporation REMIC Trust Series 2645 Class NA | 3.50 | 9/15/31 | 521,967 | ||||||||||||||
| 383,333 | Federal Home Loan Mortgage Corporation REMIC Trust Series 2594 Class OR | 4.25 | 6/15/32 | 385,394 | ||||||||||||||
| 1,561,426 | Federal Home Loan Mortgage Corporation Gold PC Pool #C77717 | 6.00 | 3/1/33 | 1,602,179 | ||||||||||||||
| 942,777 | Federal Home Loan Mortgage Corporation Gold PC Pool #A29526 | 5.00 | 1/1/35 | 930,442 | ||||||||||||||
| 539,772 | Federal Home Loan Mortgage Corporation Gold PC Pool #A29633 | 5.00 | 1/1/35 | 532,710 | ||||||||||||||
| 593,609 | Federal Home Loan Mortgage Corporation Pool #783022 (2) | 4.42 | 2/1/35 | 605,178 | ||||||||||||||
| 588,436 | Federal Home Loan Mortgage Corporation Gold PC Pool #A56491 | 5.00 | 1/1/37 | 579,804 | ||||||||||||||
| 380,663 | Federal Home Loan Mortgage Corporation Gold PC Pool #G08184 | 5.00 | 1/1/37 | 375,079 | ||||||||||||||
950,909 | Federal Home Loan Mortgage Corporation Gold PC Pool #A56467 | 5.50 | 1/1/37 | 957,211 | ||||||||||||||
35,502,406 | TOTAL FEDERAL HOME LOAN MORTGAGE CORPORATION (Cost $35,534,824) | 36,727,934 | ||||||||||||||||
FEDERAL NATIONAL MORTGAGE ASSOCIATION (22.3%) | ||||||||||||||||||
| 33,576 | Federal National Mortgage Association Pool #254243 | 6.00 | 2/1/09 | 34,248 | ||||||||||||||
| 73,390 | Federal National Mortgage Association Pool #254273 | 5.00 | 3/1/09 | 74,013 | ||||||||||||||
| 1,000,000 | Federal National Mortgage Association | 4.50 | 2/15/11 | 1,048,063 | ||||||||||||||
| 295,919 | Federal National Mortgage Association Pool #255325 | 4.50 | 7/1/11 | 297,094 | ||||||||||||||
| 99,063 | Federal National Mortgage Association Pool #511823 | 5.50 | 5/1/16 | 101,816 | ||||||||||||||
| 93,567 | Federal National Mortgage Association Pool #615289 | 5.50 | 12/1/16 | 96,167 | ||||||||||||||
| 214,258 | Federal National Mortgage Association Pool #622373 | 5.50 | 12/1/16 | 220,211 | ||||||||||||||
| 129,836 | Federal National Mortgage Association Pool #631328 | 5.50 | 2/1/17 | 133,396 | ||||||||||||||
8
| Principal Amount | | | Rate | | Maturity Date | | Value | |||||||||||
|---|---|---|---|---|---|---|---|---|---|---|---|---|---|---|---|---|---|---|
| $182,388 | Federal National Mortgage Association Pool #623503 | 6.00 | % | 2/1/17 | $ | 189,006 | ||||||||||||
| 17,779 | Federal National Mortgage Association Pool #643277 | 5.50 | 4/1/17 | 18,266 | ||||||||||||||
| 16,294 | Federal National Mortgage Association Pool #638247 | 5.50 | 5/1/17 | 16,741 | ||||||||||||||
| 350,773 | Federal National Mortgage Association Pool #254684 | 5.00 | 3/1/18 | 356,289 | ||||||||||||||
| 112,413 | Federal National Mortgage Association Pool #685183 | 5.00 | 3/1/18 | 114,180 | ||||||||||||||
| 125,634 | Federal National Mortgage Association Pool #703936 | 5.00 | 5/1/18 | 127,609 | ||||||||||||||
| 539,045 | Federal National Mortgage Association Pool #790984 | 5.00 | 7/1/19 | 546,832 | ||||||||||||||
| 553,028 | Federal National Mortgage Association Pool #786915 | 5.00 | 8/1/19 | 561,017 | ||||||||||||||
| 378,523 | Federal National Mortgage Association REMIC Trust Series 2003-28 Class KA | 4.25 | 3/25/22 | 380,363 | ||||||||||||||
| 948,676 | Federal National Mortgage Association REMICS Trust Series 2003-17 Class ED | 4.25 | 9/25/22 | 949,783 | ||||||||||||||
| 369,019 | Federal National Mortgage Association REMIC Trust Series 2003-38 Class TC | 5.00 | 3/25/23 | 380,058 | ||||||||||||||
| 185,565 | Federal National Mortgage Association Pool #412682 | 6.00 | 3/1/28 | 191,249 | ||||||||||||||
| 63,293 | Federal National Mortgage Association Pool #424691 | 6.50 | 4/1/28 | 66,273 | ||||||||||||||
| 186,022 | Federal National Mortgage Association Pool #425239 | 6.50 | 4/1/28 | 194,781 | ||||||||||||||
| 923,371 | Federal National Mortgage Association REMIC Trust Series 2003-26 Class AW | 4.00 | 4/25/30 | 925,149 | ||||||||||||||
| 1,000,000 | Federal National Mortgage Association REMIC Trust Series 2006-102 Class PB | 5.00 | 4/25/30 | 1,027,000 | ||||||||||||||
| 1,000,000 | Federal National Mortgage Association | 7.25 | 5/15/30 | 1,303,576 | ||||||||||||||
| 1,322 | Federal National Mortgage Association Pool #568625 | 7.50 | 1/1/31 | 1,430 | ||||||||||||||
| 100,299 | Federal National Mortgage Association Pool #571090 | 7.50 | 1/1/31 | 108,455 | ||||||||||||||
| 1,898 | Federal National Mortgage Association Pool #573935 | 7.50 | 3/1/31 | 2,052 | ||||||||||||||
| 48,612 | Federal National Mortgage Association Pool #629297 | 6.50 | 2/1/32 | 50,770 | ||||||||||||||
| 481,912 | Federal National Mortgage Association Pool #626440 | 7.50 | 2/1/32 | 519,587 | ||||||||||||||
| 53,487 | Federal National Mortgage Association Pool #634996 | 6.50 | 5/1/32 | 55,848 | ||||||||||||||
| 78,552 | Federal National Mortgage Association Pool #254383 | 7.50 | 6/1/32 | 84,693 | ||||||||||||||
| 329,909 | Federal National Mortgage Association Pool #254476 | 5.50 | 9/1/32 | 333,356 | ||||||||||||||
| 10,081 | Federal National Mortgage Association Pool #688539 | 5.50 | 3/1/33 | 10,181 | ||||||||||||||
| 456,303 | Federal National Mortgage Association Pool #650386 | 5.00 | 7/1/33 | 451,565 | ||||||||||||||
| 494,797 | Federal National Mortgage Association Pool #726889 | 5.50 | 7/1/33 | 499,704 | ||||||||||||||
| 478,663 | Federal National Mortgage Association Pool #759028 | 5.50 | 1/1/34 | 483,410 | ||||||||||||||
| 235,618 | Federal National Mortgage Association Pool #761913 | 5.50 | 2/1/34 | 237,626 | ||||||||||||||
| 282,419 | Federal National Mortgage Association Pool #763393 | 5.50 | 2/1/34 | 285,220 | ||||||||||||||
| 271,864 | Federal National Mortgage Association Pool #769862 | 5.50 | 2/1/34 | 274,180 | ||||||||||||||
| 27,151 | Federal National Mortgage Association Pool #769682 | 5.00 | 3/1/34 | 26,841 | ||||||||||||||
| 947,780 | Federal National Mortgage Association REMIC Trust Series 2004-60 Class LB | 5.00 | 4/25/34 | 973,720 | ||||||||||||||
| 21,829 | Federal National Mortgage Association Pool #778141 | 5.00 | 5/1/34 | 21,579 | ||||||||||||||
| 404,719 | Federal National Mortgage Association Pool #773586 | 5.50 | 6/1/34 | 408,167 | ||||||||||||||
| 439,143 | Federal National Mortgage Association Pool #255311 | 6.00 | 7/1/34 | 450,159 | ||||||||||||||
9
| Principal Amount | | | Rate | | Maturity Date | | Value | |||||||||||
|---|---|---|---|---|---|---|---|---|---|---|---|---|---|---|---|---|---|---|
| $22,724 | Federal National Mortgage Association Pool #258149 | 5.50 | % | 9/1/34 | $ | 22,918 | ||||||||||||
| 4,371 | Federal National Mortgage Association Pool #789150 | 5.00 | 10/1/34 | 4,321 | ||||||||||||||
| 647,339 | Federal National Mortgage Association Pool #255496 | 5.00 | 11/1/34 | 639,946 | ||||||||||||||
| 63,851 | Federal National Mortgage Association Pool #797154 | 5.50 | 11/1/34 | 64,395 | ||||||||||||||
| 140,246 | Federal National Mortgage Association Pool #801063 | 5.50 | 11/1/34 | 141,441 | ||||||||||||||
| 259,074 | Federal National Mortgage Association Pool #803675 | 5.50 | 12/1/34 | 261,282 | ||||||||||||||
| 273,474 | Federal National Mortgage Association Pool #804683 | 5.50 | 12/1/34 | 275,804 | ||||||||||||||
| 576,888 | Federal National Mortgage Association Pool #815813(2) | 4.58 | 2/1/35 | 590,427 | ||||||||||||||
| 48,370 | Federal National Mortgage Association Pool #255580 | 5.50 | 2/1/35 | 48,782 | ||||||||||||||
| 643,907 | Federal National Mortgage Association Pool #735224 | 5.50 | 2/1/35 | 650,293 | ||||||||||||||
| 826,039 | Federal National Mortgage Association Pool #896016 | 6.00 | 8/1/36 | 844,612 | ||||||||||||||
| 951,879 | Federal National Mortgage Association Pool #901561 | 5.50 | 10/1/36 | 958,183 | ||||||||||||||
971,479 | Federal National Mortgage Association Pool #919584 | 6.00 | 6/1/37 | 993,195 | ||||||||||||||
19,487,431 | TOTAL FEDERAL NATIONAL MORTGAGE ASSOCIATION (Cost $19,603,693) | 20,127,322 | ||||||||||||||||
GOVERNMENT NATIONAL MORTGAGE ASSOCIATION (2.1%) | ||||||||||||||||||
| 218,872 | Government National Mortgage Association Pool #003645 | 4.50 | 12/20/19 | 219,183 | ||||||||||||||
| 11,164 | Government National Mortgage Association Pool #541349 | 6.00 | 4/15/31 | 11,596 | ||||||||||||||
| 14,481 | Government National Mortgage Association Pool #557681 | 6.00 | 8/15/31 | 15,040 | ||||||||||||||
| 136,400 | Government National Mortgage Association Pool #548880 | 6.00 | 12/15/31 | 141,673 | ||||||||||||||
| 99,454 | Government National Mortgage Association Pool #551762 | 6.00 | 4/15/32 | 103,253 | ||||||||||||||
| 48,943 | Government National Mortgage Association Pool #582415 | 6.00 | 11/15/32 | 50,813 | ||||||||||||||
| 319,193 | Government National Mortgage Association Pool #604485 | 6.00 | 7/15/33 | 331,285 | ||||||||||||||
| 164,209 | Government National Mortgage Association Pool #622603 | 6.00 | 11/15/33 | 170,429 | ||||||||||||||
| 8,515 | Government National Mortgage Association Pool #429786 | 6.00 | 12/15/33 | 8,838 | ||||||||||||||
| 376,128 | Government National Mortgage Association Pool #605025 | 6.00 | 2/15/34 | 390,135 | ||||||||||||||
| 10,393 | Government National Mortgage Association Pool #626480 | 6.00 | 2/15/34 | 10,780 | ||||||||||||||
| 87,467 | Government National Mortgage Association Pool #610944 | 5.50 | 4/15/34 | 89,584 | ||||||||||||||
| 109,517 | Government National Mortgage Association Pool #605245 | 5.50 | 6/15/34 | 112,167 | ||||||||||||||
252,693 | Government National Mortgage Association Pool #583008 | 5.50 | 6/15/34 | 258,809 | ||||||||||||||
1,857,429 | TOTAL GOVERNMENT NATIONAL MORTGAGE ASSOCIATION (Cost $1,884,587) | 1,913,585 | ||||||||||||||||
71,847,266 | TOTAL U.S. GOVERNMENT AGENCY OBLIGATIONS (Cost $72,446,062) | 75,274,086 | ||||||||||||||||
TOTAL INVESTMENT SECURITIES (93.3%) (Cost $80,795,603) | 84,342,888 | |||||||||||||||||
10
| Principal Amount | | | Value | |||||||
|---|---|---|---|---|---|---|---|---|---|---|
REPURCHASE AGREEMENT (5.1%) | ||||||||||
$4,600,000 | With Morgan Stanley, 1.650%, dated 2/29/08, due 3/3/08, delivery value $4,600,632 (collateralized by $4,630,000 U.S. Treasury Notes 4.875%, due 8/31/08 with a value of $4,698,727) (Cost $4,600,000) | $ | 4,600,000 | |||||||
CASH AND OTHER ASSETS IN EXCESS OF LIABILITIES (1.6%) | 1,475,240 | |||||||||
NET ASSETS (100.0%) | $ | 90,418,128 | ||||||||
NET ASSET VALUE, OFFERING AND REDEMPTION PRICE PER OUTSTANDING SHARE ($90,418,128 ÷ 7,620,623 shares outstanding) | $ | 11.86 | ||||||||
(1) | Treasury Inflation Protected Security (TIPS). |
(2) | Adjustable rate security. The rate shown is as of February 29, 2008. |
11
at February 29, 2008 (unaudited)
Assets: | ||||||
| Investment securities, at value (Cost — $80,795,603) | $ | 84,342,888 | ||||
| Repurchase agreements (Cost — $4,600,000) | 4,600,000 | |||||
| Cash | 40,679 | |||||
| Receivable for securities sold | 903,263 | |||||
| Interest receivable | 666,391 | |||||
| Receivable for capital shares sold | 19,684 | |||||
| Prepaid expenses | 7,210 | |||||
Total Assets | 90,580,115 | |||||
Liabilities: | ||||||
| Payable for capital shares repurchased | 99,977 | |||||
| Accrued expenses: | ||||||
| Advisory fee | 35,626 | |||||
| Directors’ fees and expenses | 2,343 | |||||
| Other | 24,041 | |||||
Total Liabilities | 161,987 | |||||
Net Assets | $ | 90,418,128 | ||||
Net assets consist of: | ||||||
| Capital stock, at $1 par value (authorized 100,000,000, outstanding 7,620,623 shares) | $ | 7,620,623 | ||||
| Additional paid-in capital | 81,702,425 | |||||
| Undistributed net investment income | 614,072 | |||||
| Accumulated net realized loss on investments | (3,066,277 | ) | ||||
| Net unrealized appreciation of investments | 3,547,285 | |||||
Net Assets | $ | 90,418,128 | ||||
Net Asset Value, Offering and Redemption Price per Outstanding Share ($90,418,128 ÷ 7,620,623 shares outstanding) | $ | 11.86 |
Statement of Operations for the
Six Months Ended February 29, 2008 (unaudited)
Investment Income: | ||||||
| Interest | $ | 2,149,668 | ||||
Expenses: | ||||||
| Advisory fee | 220,988 | |||||
| Service and distribution plan fees | 110,494 | |||||
| Transfer agent fees | 29,673 | |||||
| Printing and postage | 19,989 | |||||
| Auditing and legal fees | 18,147 | |||||
| Custodian fees | 17,739 | |||||
| Registration and filing fees | 11,952 | |||||
| Directors’ fees and expenses | 3,398 | |||||
| Insurance | 3,216 | |||||
| Telephone | 2,852 | |||||
| Other | 2,054 | |||||
| Total Expenses Before Custody Credits and Fees Waived | 440,502 | |||||
| Less: Service and Distribution Plan Fees Waived | (110,494 | ) | ||||
| Less: Custody Credits | (1,428 | ) | ||||
| Net Expenses | 328,580 | |||||
Net Investment Income | 1,821,088 | |||||
Net Realized and Unrealized Gain/(Loss) on Investments: | ||||||
| Net Realized Gain | 81,972 | |||||
| Change in Net Unrealized Appreciation/(Depreciation) | 3,562,691 | |||||
Net Realized Gain and Change in Net Unrealized Appreciation/(Depreciation) on Investments | 3,644,663 | |||||
Net Increase in Net Assets From Operations | $ | 5,465,751 |
12
for the Six Months Ended February 29, 2008 (unaudited) and for the Year Ended August 31, 2007
| Six Months Ended February 29, 2008 (unaudited) | | Year Ended August 31, 2007 | ||||||||
|---|---|---|---|---|---|---|---|---|---|---|
Operations: | ||||||||||
| Net investment income | $ | 1,821,088 | $ | 3,932,844 | ||||||
| Net realized gain/(loss) on investments | 81,972 | (324,815 | ) | |||||||
| Change in net unrealized appreciation/(depreciation) | 3,562,691 | 704,073 | ||||||||
Net increase in net assets from operations | 5,465,751 | 4,312,102 | ||||||||
Distributions to Shareholders: | ||||||||||
| Net investment income | (2,002,306 | ) | (3,962,359 | ) | ||||||
Capital Share Transactions: | ||||||||||
| Proceeds from sale of shares | 2,648,943 | 2,701,583 | ||||||||
| Proceeds from reinvestment of distributions to shareholders | 1,722,428 | 3,390,260 | ||||||||
| Cost of shares repurchased | (6,302,462 | ) | (14,761,153 | ) | ||||||
Decrease from capital share transactions | (1,931,091 | ) | (8,669,310 | ) | ||||||
Total Increase (Decrease) in Net Assets | 1,532,354 | (8,319,567 | ) | |||||||
Net Assets: | ||||||||||
| Beginning of period | 88,885,774 | 97,205,341 | ||||||||
| End of period | $ | 90,418,128 | $ | 88,885,774 | ||||||
Undistributed net investment income, at end of period | $ | 614,072 | $ | 795,290 | ||||||
13
1. | Significant Accounting Policies |
14
2. | Investment Risks |
15
3. | Capital Share Transactions and Dividends to Shareholders |
| Six Months Ended February 29, 2008 (unaudited) | | Year Ended August 31, 2007 | ||||||||
|---|---|---|---|---|---|---|---|---|---|---|
| Shares sold | 228,144 | 237,939 | ||||||||
| Shares issued in reinvestment of dividends | 150,750 | 299,774 | ||||||||
| Shares repurchased | (544,616 | ) | (1,299,287 | ) | ||||||
| Net decrease | (165,722 | ) | (761,574 | ) | ||||||
| Dividends per share from net investment income | $ | 0.2625 | $ | 0.4900 | ||||||
4. | Purchases and Sales of Securities |
| Six Months Ended February 29, 2008 (unaudited) | ||||||
|---|---|---|---|---|---|---|
Purchases: | ||||||
| U.S. Treasury Obligations | $ | 2,016,172 | ||||
| U.S. Government Agency Obligations | 4,126,147 | |||||
| $ | 6,142,319 | |||||
Sales: | ||||||
| U.S. Treasury Obligations | $ | 1,013,437 | ||||
| U.S. Government Agency Obligations | 6,611,982 | |||||
| $ | 7,625,419 | |||||
5. | Income Taxes (unaudited) |
| Cost of investments for tax purposes | $ | 85,395,603 | ||||
| Gross tax unrealized appreciation | $ | 3,647,998 | ||||
| Gross tax unrealized depreciation | (100,713 | ) | ||||
| Net tax unrealized appreciation on investments | $ | 3,547,285 | ||||
| Undistributed ordinary income | $ | 614,072 | ||||
| Capital loss carryforward, expires August 31, 2008 | $ | 2,132,091 | ||||
| Capital loss carryforward, expires August 31, 2012 | 11,348 | |||||
| Capital loss carryforward, expires August 31, 2014 | 39,865 | |||||
| Capital loss carryforward, expires August 31, 2015 | 781,920 | |||||
| Capital loss carryforward, at August 31, 2007 | $ | 2,965,224 |
6. | Investment Advisory Fees, Service and Distribution Fees and Transactions With Affiliates |
16
administrative services, office space, equipment and compensation of administrative, bookkeeping, and clerical personnel necessary for managing the affairs of the Fund. The Advisor also provides persons, satisfactory to the Fund’s Board of Directors, to act as officers and employees of the Fund and pays their salaries and wages. Direct expenses of the Fund are charged to the Fund while common expenses of the Value Line Funds, are allocated proportionately based upon the Funds’ respective net assets. The Fund bears all other costs and expenses.
17
| Six Months Ended February 29, 2008 | Years Ended August 31, | | |||||||||||||||||||||||||
|---|---|---|---|---|---|---|---|---|---|---|---|---|---|---|---|---|---|---|---|---|---|---|---|---|---|---|---|
| (unaudited) | | 2007 | | 2006 | | 2005 | | 2004 | | 2003 | |||||||||||||||||
Net Asset Value, beginning of period | $ | 11.42 | $ | 11.37 | $ | 11.74 | $ | 11.87 | $ | 11.84 | $ | 12.00 | |||||||||||||||
Income (loss) from Investment Operations: | |||||||||||||||||||||||||||
| Net investment income | 0.24 | 0.51 | 0.47 | 0.52 | 0.41 | 0.44 | |||||||||||||||||||||
| Net gains or (losses) on securities (both realized and unrealized) | 0.46 | 0.03 | (0.32 | ) | (0.19 | ) | 0.03 | (0.15 | ) | ||||||||||||||||||
| Total income from investment operations | 0.70 | 0.54 | 0.15 | 0.33 | 0.44 | 0.29 | |||||||||||||||||||||
Less dividends and distributions: | |||||||||||||||||||||||||||
| Dividends from net investment income | (0.26 | ) | (0.49 | ) | (0.52 | ) | (0.46 | ) | (0.41 | ) | (0.45 | ) | |||||||||||||||
Net Asset Value, end of period | $ | 11.86 | $ | 11.42 | $ | 11.37 | $ | 11.74 | $ | 11.87 | $ | 11.84 | |||||||||||||||
Total return | 6.25 | %(3) | 4.86 | % | 1.33 | % | 2.86 | % | 3.79 | % | 2.35 | % | |||||||||||||||
Ratios/Supplemental Data: | |||||||||||||||||||||||||||
| Net assets, end of period (in thousands) | $ | 90,418 | $ | 88,886 | $ | 97,205 | $ | 112,140 | $ | 121,444 | $ | 144,264 | |||||||||||||||
Ratio of operating expenses to average net assets(1) | 1.00 | %(2), (4) | 0.93 | %(2) | 1.05 | %(2) | 1.04 | % | 0.98 | % | 0.96 | % | |||||||||||||||
| Ratio of net investment income to average net assets | 4.12 | %(4) | 4.28 | % | 3.88 | % | 3.60 | % | 3.40 | % | 3.57 | % | |||||||||||||||
| Portfolio turnover rate | 7 | %(3) | 38 | % | 22 | % | 60 | % | 35 | % | 65 | % | |||||||||||||||
(1) | Ratio reflects expenses grossed up for custody credit arrangement. The ratio of expenses to average net assets, net of custody credits would have been 0.99% (annualized) for the six months ended February 29, 2008, 0.92% for the year ended August 31, 2007, 1.04% for the year ended August 31, 2006 and would not have changed for the years ended August 31, 2005, August 31, 2004 and August 31, 2003. |
(2) | Ratio reflects expenses grossed up for the voluntary fee waiver of a portion of the service fee and distribution plan fees by the Distributor. The ratio of expenses to average net assets net of the voluntary fee waiver, but exclusive of the custody credit arrangement would have been 0.75% (annualized) for the six months ended February 29, 2008, 0.75% for the year ended August 31, 2007 and 1.00% as of August 31, 2006. |
(3) | Not annualized. |
(4) | Annualized. |
18
19
| Name, Address, and Age | | Position | | Length of Time Served | | Principal Occupation During the Past 5 Years | | Other Directorships Held by Director | ||||||||||
|---|---|---|---|---|---|---|---|---|---|---|---|---|---|---|---|---|---|---|
Interested Director* | ||||||||||||||||||
| Jean Bernhard Buttner Age 73 | Chairman of the Board of Directors and President | Since 1983 | Chairman, President and Chief Executive Officer of Value Line, Inc. (the “Adviser”) and Value Line Publishing, Inc. Chairman and President of each of the 14 Value Line Funds and Value Line Securities, Inc. (the “Distributor”). | Value Line, Inc. | ||||||||||||||
Non-Interested Directors | ||||||||||||||||||
| John W. Chandler 416 North Hemlock Lane Williamstown, MA 01267 Age 84 | Director (Lead Independent Director since 2007) | Since 1991 | Consultant, Academic Search Consultation Service, Inc.; 1992–2004; Trustee Emeritus and Chairman (1993–1994) of the Board of Trustees of Duke University; President Emeritus, Williams College. | None | ||||||||||||||
| Frances T. Newton 4921 Buckingham Drive Charlotte, NC 28209 Age 66 | Director | Since 2000 | Retired; Customer Support Analyst, Duke Power Company until 2007. | None | ||||||||||||||
| Francis C. Oakley 54 Scott Hill Road Williamstown, MA 01267 Age 76 | Director | Since 2000 | Professor of History, Williams College, 1961 to 2002. Professor Emeritus since 2002. President Emeritus since 1994 and President, 1985–1994; Chairman (1993–1997) and Interim President (2002–2003) of the American Council of Learned Societies. Trustee since 1997 and Chairman of the Board since 2005, National Humanities Center. | None | ||||||||||||||
| David H. Porter 5 Birch Run Drive Saratoga Springs, NY 12866 Age 72 | Director | Since 1997 | Visiting Professor of Classics, Williams College, since 1999; President Emeritus, Skidmore College since 1999 and President, 1987–1998. | None | ||||||||||||||
20
| Name, Address, and Age | | Position | | Length of Time Served | | Principal Occupation During the Past 5 Years | | Other Directorships Held by Director | ||||||||||
|---|---|---|---|---|---|---|---|---|---|---|---|---|---|---|---|---|---|---|
| Paul Craig Roberts 169 Pompano St. Panama City Beach, FL 32413 Age 68 | Director | Since 1983 | Chairman, Institute for Political Economy. | None | ||||||||||||||
| Nancy-Beth Sheerr 1409 Beaumont Drive Gladwyne, PA 19035 Age 58 | Director | Since 1996 | Senior Financial Advisor, Veritable L.P. (investment adviser) since 2004; Senior Financial Advisor, Hawthorn, 2001–2004. | None | ||||||||||||||
Officers | ||||||||||||||||||
| David T. Henigson Age 50 | Vice President, Secretary and Chief Compliance Officer | Since 1994 | Director, Vice President and Chief Compliance Officer of the Adviser. Director, Vice President and Chief Compliance Officer of the Distributor. Vice President, Secretary and Chief Compliance Officer of each of the 14 Value Line Funds. | |||||||||||||||
| Stephen R. Anastasio Age 48 | Treasurer | Since 2005 | Controller of the Adviser until 2003; Chief Financial Officer of the Adviser 2003–2005; Treasurer of the Adviser since 2005; Treasurer of each of the 14 Value Line Funds since 2005. | |||||||||||||||
| Howard A. Brecher Age 53 | Assistant Treasurer/ Assistant Secretary | Since 2005 | Director, Vice President and Secretary of the Adviser. Director and Vice President of the Distributor. | |||||||||||||||
| * | Mrs. Buttner is an “interested person” as defined in the Investment Company Act of 1940 by virtue of her positions with the Adviser and her indirect ownership of a controlling interest in the Adviser. |
The Fund’s Statement of Additional Information (SAI) includes additional information about the Fund’s directors and is available, without charge, upon request by calling 1-800-243-2729. |
21
22
23
| * | Only available through the purchase of Guardian Investor, a tax deferred variable annuity, or ValuePlus, a variable life insurance policy. |
24
Item 11. Controls and Procedures.
| (a) | The registrant’s principal executive officer and principal financial officer have concluded that the registrant’s disclosure controls and procedures (as defined in rule 30a-2(c) under the Act (17 CFR 270.30a-2(c) ) based on their evaluation of these controls and procedures as of a date within 90 days of the filing date of this report, are appropriately designed to ensure that material information relating to the registrant is made known to such officers and are operating effectively. |
| (b) | The registrant’s principal executive officer and principal financial officer have determined that there have been no significant changes in the registrant’s internal controls or in other factors that could significantly affect these controls subsequent to the date of their evaluation, including corrective actions with regard to significant deficiencies and material weaknesses. |
Item 12. Exhibits.
| (a) | (1) Certification pursuant to Rule 30a-2(a) under the Investment Company Act of 1940 (17 CFR 270.30a-2) attached hereto as Exhibit 99.CERT. |
|
| (2) | Certification pursuant to Section 906 of the Sarbanes-Oxley Act of 2002 attached hereto as Exhibit 99.906.CERT. |
SIGNATURES
Pursuant to the requirements of the Securities Exchange Act of 1934 and the Investment Company Act of 1940, the registrant has duly caused this report to be signed on its behalf by the undersigned, thereunto duly authorized.
By | /s/ Jean B. Buttner |
| Jean B. Buttner, President |
Date: | April 29, 2008 |
Pursuant to the requirements of the Securities Exchange Act of 1934 and the Investment Company Act of 1940, this report has been signed below by the following persons on behalf of the registrant and in the capacities and on the dates indicated.
By: | /s/ Jean B. Buttner |
| Jean B. Buttner, President, Principal Executive Officer |
By: | /s/ Stephen R. Anastasio |
| Stephen R. Anastasio, Treasurer, Principal Financial Officer |
Date: | April 29, 2008 |