UNITED STATES
SECURITIES AND EXCHANGE COMMISSION
Washington, D.C. 20549
FORM N-CSR
CERTIFIED SHAREHOLDER REPORT OF REGISTERED
MANAGEMENT INVESTMENT COMPANIES
Investment Company Act file Number _811-03171_
Value Line U.S. Government Securities Fund, Inc.
(Exact name of registrant as specified in charter)
220 East 42nd Street, New York, N.Y. 10017
(Address of principal executive offices) (Zip Code)
Registrant’s telephone number, including area code: 212-907-1500
Date of fiscal year end: August 31, 2010
Date of reporting period: February 28, 2010
Item I. Reports to Stockholders.
A copy of the Semi-Annual Report to Stockholders for the period ended 2/28/10 is included with this Form.
| INVESTMENT ADVISER | EULAV Asset Management, LLC 220 East 42nd Street New York, NY 10017-5891 | S E M I - A N N U A L R E P O R T |
| F e b r u a r y 2 8 , 2 0 1 0 | ||
| DISTRIBUTOR | EULAV Securities, Inc. 220 East 42nd Street New York, NY 10017-5891 | |
| CUSTODIAN BANK | State Street Bank and Trust Co. 225 Franklin Street Boston, MA 02110 | |
| SHAREHOLDER | State Street Bank and Trust Co. | |
| SERVICING AGENT | c/o BFDS P.O. Box 219729 Kansas City, MO 64121-9729 | |
| INDEPENDENT | PricewaterhouseCoopers LLP | Value Line U.S. Government Securities Fund, Inc. |
| REGISTERED PUBLIC | 300 Madison Avenue | |
| ACCOUNTING FIRM | New York, NY 10017 | |
| LEGAL COUNSEL | Peter D. Lowenstein, Esq. 496 Valley Road Cos Cob, CT 06807-0272 | |
| DIRECTORS | Joyce E. Heinzerling Francis C. Oakley David H. Porter Paul Craig Roberts Thomas T. Sarkany Nancy-Beth Sheerr Daniel S. Vandivort | |
| OFFICERS | Mitchell E. Appel President Howard A. Brecher Vice President and Secretary Michael Wagner Chief Compliance Officer Emily D. Washington Treasurer | |
 |
| This unaudited report is issued for information to shareholders. It is not authorized for distribution to prospective investors unless preceded or accompanied by a currently effective prospectus of the Trust (obtainable from the Distributor). | ||
| 00071689 | ||
Value Line U.S. Government Securities Fund, Inc.
| To Our Value Line U.S. Government |
To Our Shareholders (unaudited):
Enclosed is your semi-annual report for the period ended February 28, 2010. The report includes our economic observation, your Fund’s performance data and highlights, schedule of investments, and financial statements.
Bond prices were mixed during the six-month period ending February 28, 2010. Interest rates among shorter maturities declined as prices rose, while rates on longer maturity issues increased.
The short-term 5-year U.S. Treasury note fell from a yield of 2.39% to 2.30%. Short-term issues benefited from the continued accommodative low interest rate policy of the Federal Reserve Board. However, rates of the long-term 10-year U.S. Treasury note rose from 3.40% to 3.61%, as prices fell. This rise was due to a strengthening economy and concern that continued growth and the Federal Reserve’s easy monetary policy stance could push up inflation.
For the period, your Fund generated a total return of 2.13%. The Fund outperformed its benchmark, the Barclays Capital Intermediate U.S. Government Bond Index, which returned 1.87% (1). The Fund’s performance benefited from its position in AAA high quality mortgage-backed securities which outperformed all other government sectors.
Going forward, interest rates appear to have an upward bias as the economy improves. This will lower bond prices. Therefore, the Fund has reduced its exposure to longer-term issues since they carry the most price risk.
We will continue to maintain our strategy of investing the Fund’s assets in a well-diversified highly rated portfolio of U.S. Treasuries, U.S. government agencies and mortgage-backed securities issued by U.S. government agencies. Additionally, by limiting the average maturity to no more than ten years, we provide a counterweight against gyrating interest rates. Thank you for your confidence in the Fund and we appreciate your continued support.
As always, we thank you for your continued investment with us.
| Sincerely, | |
| /s/ Mitchell Appel, | |
| Mitchell Appel, President | |
| April 14, 2010 | |
| (1) | The Barclays Capital Intermediate U.S. Government Bond Fund Index represents the intermediate maturities (1-10 years) of the U.S. Treasury and U.S. Agency segment of the fixed-income market. The returns for the Index do not reflect charges, expenses, or taxes, and it is not possible to directly invest in this Index. |
2
Value Line U.S. Government Securities Fund, Inc.
| Securities Fund Shareholders |
Economic Observations (unaudited)
The recession, which commenced in the latter stages of 2007 and proved long and severe, most likely ended last year, although the National Bureau of Economic Research, which assigns beginning and ending dates to recessions, has yet to rule that the downturn has, indeed, concluded. In all, the business contraction—which produced a succession of quarterly declines in the U.S. gross domestic product along with countless other upheavals—apparently concluded with the restoration of GDP growth in the final half of 2009 and the first three months of this year. The nascent up cycle was underpinned initially by a positive swing in the inventory cycle, a strengthening in business equipment expenditures, and a slightly better showing on the consumer spending front.
Going forward, the upturn should be supported by further, but uneven, improvement in consumer and industrial activity, and some stabilization in the troubled housing sector. It is worth noting that the prospective rate of GDP growth in 2010 should be on the order of 3%, which is below the historical norm of 3%-4%. The problem is that there is just too much overall weakness in certain critical sectors at this time—notably housing and employment—to generate the greater levels of consumer spending needed for significantly higher rates of GDP growth, in our opinion.
The long and painful recession was traceable to several events, beginning with sharp declines in housing construction, home sales, and real estate prices. Other contributing factors included a large reduction in credit availability, a high level of bank failures, increasing foreclosures and bank repossessions, a multi-decade high in the unemployment rate, weak retail activity, and trendless manufacturing. Unfortunately, several of these problems are likely to stay with us for some months yet—notably the weakness in housing and employment.
Such prospective difficulties underscore why we expect below-trend rates of GDP growth for a year or more. Encouragingly, though, most business barometers are now either stabilizing or improving modestly. It is much the same overseas, where severe business declines had been seen earlier across much of Europe and Asia. Those setbacks, which generally got under way somewhat after our own reversal commenced, have also largely run their course. Following this initially moderate recovery stateside, we would look for sufficient brightening in housing and employment to help underpin a substantial and durable economic recovery lasting, perhaps, through the middle years of this decade.
Inflation, which moved up sharply last year, following dramatic gains in oil, food, and commodity prices, has now moved onto a more stable and largely benign path. Going forward, we expect pricing to chart an uneven course, with further up-and-down swings in oil and commodities being the norm, as the economy’s evolving expansion matures. On average, we think that pricing will increase less sharply over the next year or two than it did before the 2007-2009 recession. Looking further out, we see pricing pressures developing later on in the business up cycle—as is only natural, as demand for labor and materials revives. The Federal Reserve Board, meanwhile, continues to express support for an accommodative monetary approach. As a result, we believe the Fed is unlikely to start increasing interest rates until later this year or even 2011. Once it does opt to tighten, we believe it will do so rather gently. That is because the risks to the sustainability of the business up cycle seem too great for the central bank to consider moving to aggressively tighten anytime soon.
3
Value Line U.S. Government Securities Fund, Inc.
| FUND EXPENSES (unaudited): |
Example
As a shareholder of the Fund, you incur ongoing costs, including management fees, distribution and service (12b-1) fees, and other Fund expenses. This Example is intended to help you understand your ongoing costs (in dollars) of investing in the Fund and to compare these costs with the ongoing costs of investing in other mutual funds.
The Example is based on an investment of $1,000 invested at the beginning of the period and held for the entire period (September 1, 2009 through February 28, 2010).
Actual Expenses
The first line of the table below provides information about actual account values and actual expenses. You may use the information in this line, together with the amount you invested, to estimate the expenses that you paid over the period. Simply divide your account value by $1,000 (for example an $8,600 account value divided by $1,000 = 8.6), then multiply the result by the number in the first line under the heading “Expenses Paid During Period” to estimate the expenses you paid on your account during this period.
Hypothetical Example for Comparison Purposes
The second line of the table below provides information about hypothetical account values and hypothetical expenses based on the Fund’s actual expense ratio and an assumed rate of return of 5% per year before expenses, which is not the Fund’s actual return. The hypothetical account values and expenses may not be used to estimate the actual ending account balance or expenses you paid for the period. You may use this information to compare the ongoing costs of investing in the Fund and other funds. To do so, compare this 5% hypothetical example with the 5% hypothetical examples that appear in the shareholder reports of the other funds.
Please note that the expenses shown in the table are meant to highlight your ongoing costs only and do not reflect any transactional costs, such as sales charges (loads), redemption fees, or exchange fees. Therefore, the table is useful in comparing ongoing costs only and will not help you determine the relative total costs of owning different funds. In addition, if transactional costs were included, your costs would have been higher.
Expenses paid during period 9/1/09 thru 2/28/10* | ||||||||||||
Beginning account value 9/1/09 | Ending account value 2/28/10 | |||||||||||
| Actual | $ | 1,000.00 | $ | 1,021.26 | $ | 4.06 | ||||||
| Hypothetical (5% return before expenses) | $ | 1,000.00 | $ | 1,020.78 | $ | 4.06 | ||||||
| * | Expenses are equal to the Fund’s annualized expense ratio of 0.81% multiplied by the average account value over the period, multiplied by 181/365 to reflect the one-half year period. This expense ratio may differ from the expense ratio shown in the Financial Highlights. |
4
| Value Line U.S. Government Securities Fund, Inc. |
| Portfolio Highlights at February 28, 2010 (unaudited) |
Ten Largest Holdings
| Issue | Principal Amount | Value | Percentage of Net Assets | |||||||||
| U.S. Treasury Bonds, 7.88%, 02/15/21 | $ | 3,000,000 | $ | 4,105,782 | 4.7 | % | ||||||
| U.S. Treasury Notes, 3.13%, 10/31/16 | $ | 4,000,000 | $ | 4,043,436 | 4.6 | % | ||||||
| Federal Home Loan Bank, 3.63%, 10/18/13 | $ | 3,500,000 | $ | 3,713,255 | 4.2 | % | ||||||
| Federal Home Loan Bank, 5.00%, 12/21/15 | $ | 3,000,000 | $ | 3,338,325 | 3.8 | % | ||||||
| Federal National Mortgage Association, 2.75%, 03/13/14 | $ | 3,000,000 | $ | 3,079,551 | 3.5 | % | ||||||
| Federal Farm Credit Bank, 3.50%, 10/03/11 | $ | 2,000,000 | $ | 2,084,384 | 2.4 | % | ||||||
| Federal Home Loan Mortgage Corporation, 3.00%, 07/28/14 | $ | 2,000,000 | $ | 2,059,638 | 2.4 | % | ||||||
| U.S. Treasury Notes, 3.25%, 05/31/16 | $ | 2,000,000 | $ | 2,052,656 | 2.3 | % | ||||||
| U.S. Treasury Notes, 3.63%, 02/15/20 | $ | 2,000,000 | $ | 2,005,312 | 2.3 | % | ||||||
| Government National Mortgage Association REMIC Trust Series 2009-34 Class HA, 4.50%, 02/16/34 | $ | 1,875,269 | $ | 1,969,200 | 2.2 | % | ||||||
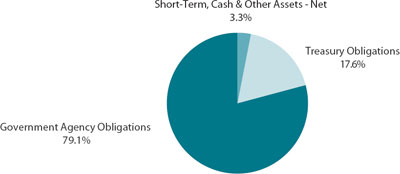
Asset Allocation — Percentage of Fund’s Net Assets
| Coupon Distribution | ||||
| Percentage of | ||||
| Fund’s | ||||
| Investments | ||||
| Less than 4% | 34.5 | % | ||
| 4-4.99% | 13.9 | % | ||
| 5-5.99% | 38.5 | % | ||
| 6-6.99% | 6.0 | % | ||
| 7-7.99% | 7.1 | % | ||
5
| Value Line U.S. Government Securities Fund, Inc. | |
| Schedule of Investments (unaudited) | February 28, 2010 |
| Principal | Maturity | ||||||||||
| Amount | Rate | Date | Value | ||||||||
| U.S. GOVERNMENT AGENCY OBLIGATIONS (79.1%) FEDERAL FARM CREDIT BANK (3.6%) | |||||||||||
| $ | 2,000,000 | Federal Farm Credit Bank | 3.50 | % | 10/3/11 | $ | 2,084,384 | ||||
| 1,000,000 | Federal Farm Credit Bank | 2.63 | 4/17/14 | 1,015,688 | |||||||
| 3,000,000 | TOTAL FEDERAL FARM CREDIT BANK (Cost $2,996,248) | 3,100,072 | |||||||||
| FEDERAL HOME LOAN BANK (13.0%) | |||||||||||
| 1,000,000 | Federal Home Loan Bank | 3.63 | 5/29/13 | 1,060,774 | |||||||
| 3,500,000 | Federal Home Loan Bank | 3.63 | 10/18/13 | 3,713,255 | |||||||
| 1,000,000 | Federal Home Loan Bank | 4.50 | 11/14/14 | 1,086,725 | |||||||
| 3,000,000 | Federal Home Loan Bank | 5.00 | 12/21/15 | 3,338,325 | |||||||
| 1,000,000 | Federal Home Loan Bank | 5.13 | 10/19/16 | 1,110,131 | |||||||
| 1,000,000 | Federal Home Loan Bank | 5.00 | 11/17/17 | 1,101,914 | |||||||
| 10,500,000 | TOTAL FEDERAL HOME LOAN BANK (Cost $11,134,945) | 11,411,124 | |||||||||
| FEDERAL HOME LOAN MORTGAGE CORPORATION (31.3%) | |||||||||||
| 603,685 | Federal Home Loan Mortgage Corporation REMIC Trust Series 3197 Class AB | 5.50 | 8/15/13 | 608,644 | |||||||
| 1,500,000 | Federal Home Loan Mortgage Corporation | 2.50 | 1/7/14 | 1,527,252 | |||||||
| 2,000,000 | Federal Home Loan Mortgage Corporation | 3.00 | 7/28/14 | 2,059,638 | |||||||
| 567,250 | Federal Home Loan Mortgage Corporation REMIC Trust Series 2849 Class VA | 5.00 | 8/15/15 | 609,336 | |||||||
| 389,877 | Federal Home Loan Mortgage Corporation REMIC Trust Series R003 Class AG | 5.13 | 10/15/15 | 401,004 | |||||||
| 1,000,000 | Federal Home Loan Mortgage Corporation | 5.50 | 7/18/16 | 1,137,077 | |||||||
| 617,995 | Federal Home Loan Mortgage Corporation REMIC Trust Series 2767 Class CA | 4.00 | 9/15/17 | 642,237 | |||||||
| 12,612 | Federal Home Loan Mortgage Corporation Gold PC Pool #E92226 | 5.00 | 11/1/17 | 13,442 | |||||||
| 1,000,000 | Federal Home Loan Mortgage Corporation | 5.13 | 11/17/17 | 1,114,276 | |||||||
| 202,046 | Federal Home Loan Mortgage Corporation Gold PC Pool #E93499 | 5.00 | 12/1/17 | 215,352 | |||||||
| 14,848 | Federal Home Loan Mortgage Corporation Gold PC Pool #E92829 | 5.00 | 12/1/17 | 15,826 | |||||||
| 453,588 | Federal Home Loan Mortgage Corporation REMIC Trust Series 2892 Class DC | 4.50 | 12/15/17 | 470,864 | |||||||
| 723,496 | Federal Home Loan Mortgage Corporation REMIC Trust Series 2643 Class ME | 3.50 | 3/15/18 | 750,506 | |||||||
| 13,204 | Federal Home Loan Mortgage Corporation Gold PC Pool #E98960 | 5.00 | 9/1/18 | 14,066 | |||||||
| 45,550 | Federal Home Loan Mortgage Corporation Gold PC Pool #B12822 | 5.00 | 3/1/19 | 48,521 |
See Notes to Financial Statements.
6
| Value Line U.S. Government Securities Fund, Inc. |
| Schedule of Investments (unaudited) |
| Principal | Maturity | ||||||||||
| Amount | Rate | Date | Value | ||||||||
| $ | 1,000,000 | Federal Home Loan Mortgage Corporation | 3.75 | % | 3/27/19 | $ | 999,558 | ||||
| 36,961 | Federal Home Loan Mortgage Corporation Gold PC Pool #B17398 | 4.50 | 12/1/19 | 38,992 | |||||||
| 256,654 | Federal Home Loan Mortgage Corporation Gold PC Pool #G18044 | 4.50 | 3/1/20 | 270,114 | |||||||
| 127,438 | Federal Home Loan Mortgage Corporation Gold PC Pool #B18034 | 4.50 | 4/1/20 | 134,122 | |||||||
| 31,719 | Federal Home Loan Mortgage Corporation Gold PC Pool #J00118 | 5.00 | 10/1/20 | 33,738 | |||||||
| 453,365 | Federal Home Loan Mortgage Corporation Gold PC Pool #J00139 | 5.00 | 10/1/20 | 482,230 | |||||||
| 31,930 | Federal Home Loan Mortgage Corporation Gold PC Pool #G11986 | 5.00 | 4/1/21 | 33,863 | |||||||
| 40,932 | Federal Home Loan Mortgage Corporation Gold PC Pool #G12319 | 5.00 | 6/1/21 | 43,538 | |||||||
| 159,573 | Federal Home Loan Mortgage Corporation Gold PC Pool #J03233 | 5.00 | 8/1/21 | 169,234 | |||||||
| 935,323 | Federal Home Loan Mortgage Corporation Gold PC Pool #G12381 | 5.00 | 9/1/21 | 994,874 | |||||||
| 449,814 | Federal Home Loan Mortgage Corporation REMIC Trust Series 2773 Class DA | 5.00 | 6/15/22 | 469,774 | |||||||
| 1,052,212 | Federal Home Loan Mortgage Corporation Gold PC Pool #J08096 | 5.00 | 6/1/23 | 1,112,405 | |||||||
| 657,017 | Federal Home Loan Mortgage Corporation Gold PC Pool #J08202 | 5.00 | 7/1/23 | 694,602 | |||||||
| 589,095 | Federal Home Loan Mortgage Corporation Gold PC Pool #J09098 | 5.00 | 12/1/23 | 622,795 | |||||||
| 390,281 | Federal Home Loan Mortgage Corporation REMIC Trust Series 3132 Class MA | 5.50 | 12/15/23 | 405,657 | |||||||
| 959,041 | Federal Home Loan Mortgage Corporation Gold PC Pool #J09739 | 4.50 | 5/1/24 | 1,000,949 | |||||||
| 421,513 | Federal Home Loan Mortgage Corporation REMIC Trust Series 3147 Class YE | 5.50 | 7/15/24 | 441,500 | |||||||
| 1,000,000 | Federal Home Loan Mortgage Corporation REMIC Trust Series 2690 Class OE | 5.00 | 11/15/28 | 1,057,074 | |||||||
| 918,477 | Federal Home Loan Mortgage Corporation Gold PC Pool #C91239 | 4.50 | 3/1/29 | 945,077 | |||||||
| 1,000,000 | Federal Home Loan Mortgage Corporation | 6.75 | 3/15/31 | 1,242,619 | |||||||
| 414,613 | Federal Home Loan Mortgage Corporation REMIC Trust Series 3061 Class HA | 5.50 | 4/15/31 | 427,946 | |||||||
| 730,038 | Federal Home Loan Mortgage Corporation REMIC Trust Series 2878 Class AQ | 5.00 | 5/15/31 | 762,956 | |||||||
| 672,956 | Federal Home Loan Mortgage Corporation REMIC Trust Series 2761 Class AB | 5.00 | 8/15/31 | 707,039 | |||||||
| 275,689 | Federal Home Loan Mortgage Corporation REMIC Trust Series 2645 Class NA | 3.50 | 9/15/31 | 283,788 | |||||||
| 165,220 | Federal Home Loan Mortgage Corporation REMIC Trust Series 2594 Class OR | 4.25 | 6/15/32 | 169,314 | |||||||
| 946,645 | Federal Home Loan Mortgage Corporation Gold PC Pool #C77717 | 6.00 | 3/1/33 | 1,026,413 |
See Notes to Financial Statements.
7
| Value Line U.S. Government Securities Fund, Inc. |
| February 28, 2010 |
Principal Amount | Rate | Maturity Date | Value | ||||||||
| $ | 325,821 | Federal Home Loan Mortgage Corporation Gold PC Pool #A29633 | 5.00 | % | 1/1/35 | $ | 339,538 | ||||
| 597,250 | Federal Home Loan Mortgage Corporation Gold PC Pool #A29526 | 5.00 | 1/1/35 | 622,394 | |||||||
| 337,979 | Federal Home Loan Mortgage Corporation Pool #783022 (1) | 3.95 | 2/1/35 | 345,554 | |||||||
| 378,726 | Federal Home Loan Mortgage Corporation Gold PC Pool #A56491 | 5.00 | 1/1/37 | 394,255 | |||||||
| 254,224 | Federal Home Loan Mortgage Corporation Gold PC Pool #G08184 | 5.00 | 1/1/37 | 264,648 | |||||||
| 553,178 | Federal Home Loan Mortgage Corporation Gold PC Pool #A56467 | 5.50 | 1/1/37 | 585,683 | |||||||
| 681,965 | Federal Home Loan Mortgage Corporation Gold PC Pool #A80938 | 5.50 | 8/1/38 | 721,894 | |||||||
| 25,989,800 | TOTAL FEDERAL HOME LOAN MORTGAGE CORPORATION (Cost $26,210,438) | 27,472,178 | |||||||||
| FEDERAL NATIONAL MORTGAGE ASSOCIATION (26.0%) | |||||||||||
| 150,897 | Federal National Mortgage Association Pool #255325 | 4.50 | 7/1/11 | 155,611 | |||||||
| 3,000,000 | Federal National Mortgage Association | 2.75 | 3/13/14 | 3,079,551 | |||||||
| 42,936 | Federal National Mortgage Association Pool #511823 | 5.50 | 5/1/16 | 46,071 | |||||||
| 931,767 | Federal National Mortgage Association REMIC Trust Series 2005-40 Class VG | 4.50 | 6/25/16 | 989,876 | |||||||
| 40,817 | Federal National Mortgage Association Pool #615289 | 5.50 | 12/1/16 | 43,797 | |||||||
| 120,608 | Federal National Mortgage Association Pool #622373 | 5.50 | 12/1/16 | 129,414 | |||||||
| 84,114 | Federal National Mortgage Association Pool #631328 | 5.50 | 2/1/17 | 90,414 | |||||||
| 118,037 | Federal National Mortgage Association Pool #623503 | 6.00 | 2/1/17 | 127,424 | |||||||
| 5,308 | Federal National Mortgage Association Pool #643277 | 5.50 | 4/1/17 | 5,705 | |||||||
| 12,409 | Federal National Mortgage Association Pool #638247 | 5.50 | 5/1/17 | 13,338 | |||||||
| 565,930 | Federal National Mortgage Association REMIC Trust Series 2003-52 Class KR | 3.50 | 7/25/17 | 584,524 | |||||||
| 216,266 | Federal National Mortgage Association Pool #254684 | 5.00 | 3/1/18 | 230,130 | |||||||
| 68,800 | Federal National Mortgage Association Pool #685183 | 5.00 | 3/1/18 | 73,211 | |||||||
| 83,583 | Federal National Mortgage Association Pool #703936 | 5.00 | 5/1/18 | 88,941 | |||||||
| 750,393 | Federal National Mortgage Association Pool #257566 | 4.50 | 1/1/19 | 789,867 | |||||||
| 854,749 | Federal National Mortgage Association Pool #780956 | 4.50 | 5/1/19 | 901,315 | |||||||
| 324,621 | Federal National Mortgage Association Pool #790984 | 5.00 | 7/1/19 | 345,229 | |||||||
| 324,560 | Federal National Mortgage Association Pool #786915 | 5.00 | 8/1/19 | 345,164 | |||||||
| 860,543 | Federal National Mortgage Association Pool #735063 | 4.50 | 12/1/19 | 907,424 | |||||||
| 190,415 | Federal National Mortgage Association REMIC Trust Series 2003-28 Class KA | 4.25 | 3/25/22 | 197,520 | |||||||
| 521,962 | Federal National Mortgage Association REMIC Trust Series 2003-17 Class ED | 4.25 | 9/25/22 | 543,194 | |||||||
| 222,555 | Federal National Mortgage Association REMIC Trust Series 2003-38 Class TC | 5.00 | 3/25/23 | 235,969 | |||||||
See Notes to Financial Statements.
8
| Value Line U.S. Government Securities Fund, Inc. |
| Schedule of Investments (unaudited) |
Principal Amount | Rate | Maturity Date | Value | ||||||||
| $ | 106,710 | Federal National Mortgage Association Pool #412682 | 6.00 | % | 3/1/28 | $ | 114,968 | ||||
| 74,864 | Federal National Mortgage Association Pool #425239 | 6.50 | 4/1/28 | 81,277 | |||||||
| 391,474 | Federal National Mortgage Association REMIC Trust Series 2003-26 Class AW | 4.00 | 4/25/30 | 395,165 | |||||||
| 1,000,000 | Federal National Mortgage Association REMIC Trust Series 2006-102 Class PB | 5.00 | 4/25/30 | 1,056,883 | |||||||
| 1,000,000 | Federal National Mortgage Association | 7.25 | 5/15/30 | 1,303,423 | |||||||
| 96,830 | Federal National Mortgage Association Pool #571090 | 7.50 | 1/1/31 | 109,073 | |||||||
| 1,265 | Federal National Mortgage Association Pool #568625 | 7.50 | 1/1/31 | 1,425 | |||||||
| 1,838 | Federal National Mortgage Association Pool #573935 | 7.50 | 3/1/31 | 2,071 | |||||||
| 35,899 | Federal National Mortgage Association Pool #629297 | 6.50 | 2/1/32 | 38,975 | |||||||
| 389,974 | Federal National Mortgage Association Pool #626440 | 7.50 | 2/1/32 | 439,626 | |||||||
| 44,885 | Federal National Mortgage Association Pool #634996 | 6.50 | 5/1/32 | 48,730 | |||||||
| 63,572 | Federal National Mortgage Association Pool #254383 | 7.50 | 6/1/32 | 71,666 | |||||||
| 189,379 | Federal National Mortgage Association Pool #254476 | 5.50 | 9/1/32 | 200,596 | |||||||
| 6,974 | Federal National Mortgage Association Pool #688539 | 5.50 | 3/1/33 | 7,383 | |||||||
| 367,047 | Federal National Mortgage Association Pool #650386 | 5.00 | 7/1/33 | 382,500 | |||||||
| 301,965 | Federal National Mortgage Association Pool #726889 | 5.50 | 7/1/33 | 319,662 | |||||||
| 331,038 | Federal National Mortgage Association Pool #759028 | 5.50 | 1/1/34 | 350,439 | |||||||
| 222,642 | Federal National Mortgage Association Pool #761913 | 5.50 | 2/1/34 | 235,446 | |||||||
| 205,737 | Federal National Mortgage Association Pool #763393 | 5.50 | 2/1/34 | 217,794 | |||||||
| 202,790 | Federal National Mortgage Association Pool #769862 | 5.50 | 2/1/34 | 214,452 | |||||||
| 21,183 | Federal National Mortgage Association Pool #769682 | 5.00 | 3/1/34 | 22,064 | |||||||
| 688,996 | Federal National Mortgage Association REMIC Trust Series 2004-60 Class LB | 5.00 | 4/25/34 | 735,563 | |||||||
| 16,328 | Federal National Mortgage Association Pool #778141 | 5.00 | 5/1/34 | 17,008 | |||||||
| 294,177 | Federal National Mortgage Association Pool #773586 | 5.50 | 6/1/34 | 311,096 | |||||||
| 320,294 | Federal National Mortgage Association Pool #255311 | 6.00 | 7/1/34 | 343,679 | |||||||
| 14,389 | Federal National Mortgage Association Pool #258149 | 5.50 | 9/1/34 | 15,216 | |||||||
| 2,887 | Federal National Mortgage Association Pool #789150 | 5.00 | 10/1/34 | 3,007 | |||||||
| 471,161 | Federal National Mortgage Association Pool #255496 | 5.00 | 11/1/34 | 490,775 | |||||||
| 42,895 | Federal National Mortgage Association Pool #797154 | 5.50 | 11/1/34 | 45,362 | |||||||
| 109,360 | Federal National Mortgage Association Pool #801063 | 5.50 | 11/1/34 | 115,650 | |||||||
| 181,313 | Federal National Mortgage Association Pool #803675 | 5.50 | 12/1/34 | 191,740 | |||||||
| 188,049 | Federal National Mortgage Association Pool #804683 | 5.50 | 12/1/34 | 198,864 | |||||||
| 375,388 | Federal National Mortgage Association Pool #815813 (1) | 3.03 | 2/1/35 | 384,077 | |||||||
| 35,581 | Federal National Mortgage Association Pool #255580 | 5.50 | 2/1/35 | 37,628 | |||||||
| 448,350 | Federal National Mortgage Association Pool #735224 | 5.50 | 2/1/35 | 474,625 | |||||||
| 443,921 | Federal National Mortgage Association Pool #896016 | 6.00 | 8/1/36 | 472,310 | |||||||
| 1,196,226 | Federal National Mortgage Association Pool #976615 | 5.50 | 9/1/36 | 1,266,331 | |||||||
| 569,650 | Federal National Mortgage Association Pool #901561 | 5.50 | 10/1/36 | 600,720 | |||||||
| 768,957 | Federal National Mortgage Association Pool #919584 | 6.00 | 6/1/37 | 816,691 | |||||||
| 701,171 | Federal National Mortgage Association Pool #943647 | 5.50 | 7/1/37 | 739,266 | |||||||
| 21,416,429 | TOTAL FEDERAL NATIONAL MORTGAGE ASSOCIATION (Cost $21,734,584) | 22,796,915 | |||||||||
See Notes to Financial Statements.
9
| Value Line U.S. Government Securities Fund, Inc. |
| February 28, 2010 |
Principal Amount | Rate | Maturity Date | Value | ||||||||
| GOVERNMENT NATIONAL MORTGAGE ASSOCIATION (5.2%) | |||||||||||
| $ | 160,291 | Government National Mortgage Association Pool #003645 | 4.50 | % | 12/20/19 | $ | 168,983 | ||||
| 10,484 | Government National Mortgage Association Pool #541349 | 6.00 | 4/15/31 | 11,354 | |||||||
| 3,525 | Government National Mortgage Association Pool #557681 | 6.00 | 8/15/31 | 3,817 | |||||||
| 67,201 | Government National Mortgage Association Pool #548880 | 6.00 | 12/15/31 | 72,773 | |||||||
| 1,293,783 | Government National Mortgage Association REMIC Trust Series 2009-20 Class AB | 5.00 | 3/16/32 | 1,360,548 | |||||||
| 64,411 | Government National Mortgage Association Pool #551762 | 6.00 | 4/15/32 | 69,752 | |||||||
| 31,850 | Government National Mortgage Association Pool #582415 | 6.00 | 11/15/32 | 34,492 | |||||||
| 219,096 | Government National Mortgage Association Pool #604485 | 6.00 | 7/15/33 | 236,717 | |||||||
| 136,206 | Government National Mortgage Association Pool #622603 | 6.00 | 11/15/33 | 147,160 | |||||||
| 5,262 | Government National Mortgage Association Pool #429786 | 6.00 | 12/15/33 | 5,686 | |||||||
| 140,508 | Government National Mortgage Association Pool #605025 | 6.00 | 2/15/34 | 151,281 | |||||||
| 7,880 | Government National Mortgage Association Pool #626480 | 6.00 | 2/15/34 | 8,485 | |||||||
| 1,875,269 | Government National Mortgage Association REMIC Trust Series 2009-34 Class HA | 4.50 | 2/16/34 | 1,969,200 | |||||||
| 84,480 | Government National Mortgage Association Pool #610944 | 5.50 | 4/15/34 | 90,009 | |||||||
| 169,346 | Government National Mortgage Association Pool #583008 | 5.50 | 6/15/34 | 180,429 | |||||||
| 65,803 | Government National Mortgage Association Pool #605245 | 5.50 | 6/15/34 | 70,109 | |||||||
| 4,335,395 | TOTAL GOVERNMENT NATIONAL MORTGAGE ASSOCIATION (Cost $4,460,833) | 4,580,795 | |||||||||
| 65,241,624 | TOTAL U.S. GOVERNMENT AGENCY OBLIGATIONS (Cost $66,537,048) | 69,361,084 | |||||||||
| U.S. TREASURY OBLIGATIONS (17.6%) | |||||||||||
| 1,000,000 | U.S. Treasury Notes | 1.13 | 12/15/12 | 997,109 | |||||||
| 1,168,940 | U.S. Treasury Notes (2) | 2.00 | 1/15/14 | 1,247,570 | |||||||
| 2,000,000 | U.S. Treasury Notes | 3.25 | 5/31/16 | 2,052,656 | |||||||
| 1,000,000 | U.S. Treasury Notes | 3.25 | 7/31/16 | 1,024,062 | |||||||
| 4,000,000 | U.S. Treasury Notes | 3.13 | 10/31/16 | 4,043,436 | |||||||
| 2,000,000 | U.S. Treasury Notes | 3.63 | 2/15/20 | 2,005,312 | |||||||
| 3,000,000 | U.S. Treasury Bonds | 7.88 | 2/15/21 | 4,105,782 | |||||||
| 14,168,940 | TOTAL U.S. TREASURY OBLIGATIONS (Cost $15,184,289) | 15,475,927 | |||||||||
TOTAL INVESTMENT SECURITIES (3) (96.7%) (Cost $81,721,337) | 84,837,011 | ||||||||||
See Notes to Financial Statements.
10
| Value Line U.S. Government Securities Fund, Inc. |
| Schedule of Investments (unaudited) |
Principal Amount | Value | ||||||
| REPURCHASE AGREEMENT (3) (2.6%) | |||||||
| $ | 2,300,000 | With Morgan Stanley, 0.09%, dated 2/26/10, due 3/1/10, delivery value $2,300,017 (collateralized by $2,345,000 U.S. Treasury Notes 1.375%, due 02/15/13 with a value of $2,348,911) | $ | 2,300,000 | |||
| CASH AND OTHER ASSETS IN EXCESS OF LIABILITIES (0.7%) | 581,282 | ||||||
| NET ASSETS (100.0%) | $ | 87,718,293 | |||||
NET ASSET VALUE, OFFERING AND REDEMPTION PRICE PER OUTSTANDING SHARE ($87,718,293 ÷ 7,275,026 shares outstanding) | $ | 12.06 | |||||
| (1) | Adjustable rate security. The rate shown is as of February 26, 2010. |
| (2) | Treasury Inflation Protected Security (TIPS). |
| (3) | Values determined based on Level 2 inputs established by FASB ASC 820-10, Fair Value Measurements and Disclosures. |
See Notes to Financial Statements.
11
| Value Line U.S. Government Securities Fund, Inc. |
Statement of Assets and Liabilities at February 28, 2010 (unaudited) |
| Assets: | ||||
Investment securities, at value (Cost - $81,721,337) | $ | 84,837,011 | ||
Repurchase agreement (Cost - $2,300,000) | 2,300,000 | |||
| Cash | 92,904 | |||
| Interest receivable | 556,172 | |||
| Prepaid expenses | 17,353 | |||
| Receivable for capital shares sold | 3,000 | |||
| Total Assets | 87,806,440 | |||
| Liabilities: | ||||
| Payable for capital shares redeemed | 13,833 | |||
| Accrued expenses: | ||||
| Advisory fee | 33,623 | |||
| Directors’ fees and expenses | 3,870 | |||
| Other | 36,821 | |||
| Total Liabilities | 88,147 | |||
| Net Assets | $ | 87,718,293 | ||
| Net assets consist of: | ||||
Capital stock, at $1.00 par value (authorized 100,000,000, outstanding 7,275,026 shares) | $ | 7,275,026 | ||
| Additional paid-in capital | 76,389,393 | |||
| Undistributed net investment income | 451,188 | |||
| Accumulated net realized gain on investments | 487,012 | |||
| Net unrealized appreciation of investments | 3,115,674 | |||
| Net Assets | $ | 87,718,293 | ||
| Net Asset Value, Offering and Redemption Price per Outstanding Share ($87,718,293 ÷ 7,275,026 shares outstanding) | $ | 12.06 |
Statement of Operations for the Six Months Ended February 28, 2010 (unaudited) |
| Investment Income: | ||||
| Interest | $ | 1,694,143 | ||
| Expenses: | ||||
| Advisory fee | 221,447 | |||
| Service and distribution plan fees | 110,723 | |||
| Printing and postage | 28,866 | |||
| Transfer agent fees | 27,185 | |||
| Auditing and legal fees | 25,423 | |||
| Custodian fees | 16,965 | |||
| Registration and filing fees | 16,113 | |||
| Insurance | 5,591 | |||
| Directors’ fees and expenses | 4,226 | |||
| Other | 13,485 | |||
| Total Expenses Before Custody Credits and Fees Waived | 470,024 | |||
| Less: Service and Distribution | ||||
| Plan Fees Waived | (110,723 | ) | ||
| Less: Custody Credits | (17 | ) | ||
| Net Expenses | 359,284 | |||
| Net Investment Income | 1,334,859 | |||
Net Realized and Unrealized Gain/(Loss) on Investments: | ||||
| Net Realized Gain | 643,087 | |||
| Change in Net Unrealized Appreciation/ (Depreciation) | (15,172 | ) | ||
| Net Realized Gain and Change in Net Unrealized Appreciation/(Depreciation) on Investments | 627,915 | |||
| Net Increase in Net Assets from Operations | $ | 1,962,774 |
See Notes to Financial Statements.
12
| Value Line U.S. Government Securities Fund, Inc. | |
Statement of Changes in Net Assets for the Six Months Ended February 28, 2010 (unaudited) and for the Year Ended August 31, 2009 | |
| Six Months Ended | ||||||||
| February 28, 2010 | Year Ended | |||||||
| (unaudited) | August 31, 2009 | |||||||
| Operations: | ||||||||
| Net investment income | $ | 1,334,859 | $ | 3,043,526 | ||||
| Net realized gain on investments | 643,087 | 1,298,443 | ||||||
| Change in net unrealized appreciation/(depreciation) | (15,172 | ) | 2,078,952 | |||||
| Net increase in net assets from operations | 1,962,774 | 6,420,921 | ||||||
| Distributions to Shareholders: | ||||||||
| Net investment income | (1,388,300 | ) | (3,136,882 | ) | ||||
| Net realized gain from investment transactions | (554,852 | ) | — | |||||
| Total Distributions | (1,943,152 | ) | (3,136,882 | ) | ||||
| Capital Share Transactions: | ||||||||
| Proceeds from sale of shares | 2,070,028 | 8,161,899 | ||||||
| Proceeds from reinvestment of dividends and distributions to shareholders | 1,723,687 | 2,727,452 | ||||||
| Cost of shares redeemed | (5,703,741 | ) | (12,483,573 | ) | ||||
| Net decrease in net assets from capital share transactions | (1,910,026 | ) | (1,594,222 | ) | ||||
| Total Increase/(Decrease) in Net Assets | (1,890,404 | ) | 1,689,817 | |||||
| Net Assets: | ||||||||
| Beginning of period | 89,608,697 | 87,918,880 | ||||||
| End of period | $ | 87,718,293 | $ | 89,608,697 | ||||
| Undistributed net investment income, at end of period | $ | 451,188 | $ | 504,629 | ||||
See Notes to Financial Statements.
13
| Value Line U.S. Government Securities Fund, Inc. |
| Notes to Financial Statements (unaudited) |
| 1. | Significant Accounting Policies |
Value Line U.S. Government Securities Fund, Inc. (the “Fund”) is registered under the Investment Company Act of 1940, as amended, as a diversified, open-end management investment company whose primary investment objective is to obtain maximum income without undue risk to principal. Capital preservation and possible capital appreciation are secondary objectives.
The following significant accounting principles are in conformity with generally accepted accounting principles for investment companies. Such policies are consistently followed by the Fund in the preparation of its financial statements. Generally accepted accounting principles require management to make estimates and assumptions that affect the reported amounts and disclosure in the financial statements. Actual results may differ from those estimates.
(A) Security Valuation: The Fund’s investments are carried at fair value. With assistance from an independent pricing service (the “Service”) approved by the Board of Directors, portfolio securities are valued at the midpoint between the latest available and representative asked and bid prices on the basis of valuations provided by dealers in such securities. Some of the general factors which may be considered by the dealers in arriving at such valuations include the fundamental analytic data relating to the security and an evaluation of the forces which influence the market in which these securities are purchased and sold. Determination of values may involve subjective judgment, as the actual market value of a particular security can be established only by negotiation between the parties in a sales transaction. If a portfolio security is not priced in this manner, the value is determined on the valuation date by reference to valuations obtained from the Service which determines valuations for normal institutional-size trading units of debt securities, without exclusive reliance upon quoted prices. The Service takes into account appropriate factors such as institutional-size trading in similar groups of securities, yield, quality, coupon rate, maturity, type of issue, trading characteristics and other market data in determining valuations. Short-term instruments with maturities of 60 days or less at the date of purchase are valued at amortized cost, which approximates market value. Other assets and securities for which market valuations are not readily available will be valued at fair value by the Adviser pursuant to policies and procedures adopted by the Board of Directors. At February 28, 2010, there were no securities that had been fair valued.
(B) Fair Value Measurements: In accordance with Financial Accounting Standards Board Accounting Standards Codification (FASB ASC 820-10), Fair Value Measurements and Disclosures, (formerly Statement of Financial Accounting Standards (“SFAS”) No. 157), the Fund discloses the fair value of its investments in a hierarchy that prioritizes the inputs to valuation techniques used to measure the fair value. The hierarchy gives the highest priority to valuations based upon unadjusted quoted prices in active markets for identical assets or liabilities (level 1 measurement) and the lowest priority to valuations based upon unobservable inputs that are significant to the valuation (level 3 measurements). FASB ASC 820-10-35-39 to 55 provides three levels of the fair value hierarchy as follows:
● | Level 1 – Inputs that reflect unadjusted quoted prices in active markets for identical assets or liabilities that the Fund has the ability to access at the measurement date; |
● | Level 2 – Inputs other than quoted prices that are observable for the asset or liability either directly or indirectly, including inputs in markets that are not considered to be active; |
● | Level 3 – Inputs that are unobservable. |
During the year ended February 28, 2010, the Fund adopted the authoritative guidance included in FASB ASC 820-10, Fair Value Measurements and Disclosures, on determining fair value when the volume and level of activity for the asset or liability have significantly decreased and identifying transactions that are not orderly (formerly FSP FAS 157-4). FASB ASC 820-10-35-51A to 51H indicates that if an entity determines that either the volume and/or level of activity for an asset or liability has significantly decreased (from normal conditions for that asset or liability) or price quotations or observable inputs are not associated with orderly transactions, increased analysis and management judgment will be required to estimate fair value.
14
| Value Line U.S. Government Securities Fund, Inc. |
| February 28, 2010 |
Valuation techniques such as an income approach might be appropriate to supplement or replace a market approach in those circumstances. It provides a list of factors to determine whether there has been a significant decrease in relation to normal market activity. Regardless, however, of the valuation technique and inputs used, the objective for the fair value measurement in those circumstances is unchanged from what it would be if markets were operating at normal activity levels and/or transactions were orderly; that is, to determine the current exit price as promulgated by FASB ASC 820-10.
The following is a summary of the inputs used as of February 28, 2010 in valuing the Fund’s investments carried at value:
Investments in Securities: | Level 1 | Level 2 | Level 3 | Total | ||||||||||||
| Assets | ||||||||||||||||
U.S. Government Agency Obligations | $ | 0 | $ | 69,361,084 | $ | 0 | $ | 69,361,084 | ||||||||
| U.S. Treasury Obligation | 0 | 15,475,927 | 0 | 15,475,927 | ||||||||||||
| Short Term Investments | 0 | 2,300,000 | 0 | 2,300,000 | ||||||||||||
Total Investments in Securities | ||||||||||||||||
| $ | 0 | $ | 87,137,011 | $ | 0 | $ | 87,137,011 | |||||||||
For the six months ended February 28, 2010, there were no Level 3 investments. The types of inputs used to value each security are identified in the Schedule of Investments, which also includes a breakdown of the Schedule’s investments by category.
(C) Repurchase Agreements: In connection with transactions in repurchase agreements, the Fund’s custodian takes possession of the underlying collateral securities, the value of which exceeds the principal amount of the repurchase transaction, including accrued interest. To the extent that any repurchase transaction exceeds one business day, it is the Fund’s policy to mark-to-market the collateral on a daily basis to ensure the adequacy of the collateral. In the event of default of the obligation to repurchase, the Fund has the right to liquidate the collateral and apply the proceeds in satisfaction of the obligation. Under certain circumstances, in the event of default or bankruptcy by the other party to the agreement, realization and/or retention of the collateral or proceeds may be subject to legal proceedings.
(D) Federal Income Taxes: It is the Fund’s policy to comply with the requirements of the Internal Revenue Code applicable to regulated investment companies, including the distribution requirements of the Tax Reform Act of 1986, and to distribute all of its taxable income and capital gains to its shareholders. Therefore, no federal income tax provision is required.
In July 2006, the Financial Accounting Standards Board issued Interpretation No. 48, “Accounting for Uncertainty in Income Taxes – an Interpretation of FASB Statement No. 109” (the “Interpretation” or “FIN 48”). The Interpretation establishes for all entities, including pass-through entities such as the Fund, a minimum threshold for financial statement recognition of the benefit of positions taken in filing tax returns (including whether an entity is taxable in a particular jurisdiction), and requires certain expanded tax disclosures. The Interpretation is effective for fiscal years beginning after December 15, 2006, and is applied to all open tax years as of the date of effectiveness. As of February 28, 2010, management has reviewed the tax positions for the tax years still subject to tax audit under the statute of limitations, evaluated the implications of FIN 48, and has determined that there is no impact to the Fund’s financial statements at this time.
15
| Value Line U.S. Government Securities Fund, Inc. |
| Notes to Financial Statements (unaudited) |
(E) Security Transactions and Related Income: Security transactions are accounted for on the date the securities are purchased or sold. Realized gains and losses on securities transactions are determined using the identified cost method. Interest income, adjusted for the amortization of discount and premium, is earned from settlement date and recognized on the accrual basis. Gains and losses realized on prepayments received on mortgage-related securities are recorded as interest income.
The Fund may invest in Treasury Inflation-Protection Securities (TIPS). The principal value and interest payout of TIPS are periodically adjusted according to the rate of inflation based on the Consumer Price Index. The adjustments for principal and income due to inflation are reflected in interest income in the Statement of Operations.
(F) Representations and Indemnifications: In the normal course of business, the Fund enters into contracts that contain a variety of representations and warranties which provide general indemnifications. The Fund’s maximum exposure under these arrangements is unknown as this would involve future claims that may be made against the Fund that have not yet occurred. However, based on experience, the Fund expects the risk of loss to be remote.
(G) Other: On November 4, 2009, the Securities and Exchange Commission (“SEC”), Value Line, Inc. (“VLI”), Value Line Securities, Inc. currently, EULAV Securities, Inc. (“ESI” or the “Distributor”), Jean B. Buttner, former Chairman, President and Chief Executive Officer of VLI and David Henigson, a former Director and Officer of VLI, settled a matter related to brokerage commissions charged by ESI to certain Value Line mutual funds (“Funds”) from 1986 through November of 2004. The matter also involved alleged misleading disclosures provided by VLI to the Board of Directors/Trustees and shareholders of the Funds regarding such brokerage commissions. VLI agreed to pay disgorgement in the amount of $24,168,979 (representing disgorgement of commissions received), prejudgment interest of $9,536,786, and a civil penalty in the amount of $10,000,000. Also as part of the settlement, Mrs. Buttner and Mr. Henigson each agreed to pay a civil penalty, are barred from association with any broker, dealer or investment adviser, and are prohibited from serving as an employee, officer, director, member of an advisory board, investment adviser or depositor of, or principal underwriter for, a registered investment company or affiliated person of such investment adviser, depositor, or principal underwriter, subject to a limited exception (limited in scope and for a one-year period) for Mrs. Buttner. Pursuant to Section 308(a) of the Sarbanes-Oxley Act of 2002, a fund will be created for VLI’s disgorgement, interest and penalty (“Fair Fund”). VLI will bear all costs associated with any Fair Fund distribution, including retaining a third-party consultant approved by the SEC staff to administer any Fair Fund distribution. VLI informed the Funds’ Board that it has paid the settlement, continues to have adequate liquid assets, and that the resolution of this matter will not have a materially adverse effect on the ability of EULAV Asset Management LLC (“EULAV” or the “Adviser”), the Funds’ investment adviser, or ESI, the Funds’ distributor, to perform their respective contracts with the Funds.
On March 11, 2010, VLI and the Boards of Trustees/Directors of the Value Line Funds entered into an agreement pursuant to which VLI will reimburse the Funds in the aggregate amount of $917,302 for various expenses incurred by the Funds in connection with the SEC matter referred to above. The receivable for this expense reimbursement was accrued on March 11, 2010 by the applicable Funds that incurred the expenses and will be paid by VLI in twelve equal monthly installments commencing April 1, 2010. The Fund accrued $7,601 in expense reimbursements from VLI.
(H) Subsequent Events: Management has evaluated all subsequent transactions and events through the date on which these financial statements were issued. On March 11, 2010, with an effective date of January 1, 2011, the Distributor contractually ageed to waive 0.25% of the 12b-1 fee for a one year period.
16
| Value Line U.S. Government Securities Fund, Inc. |
| February 28, 2010 |
| 2. | Investment Risks |
Securities issued by U.S. Government agencies or government-sponsored enterprises may not be guaranteed by the by the U.S. Treasury. The Government National Mortgage Association (“GNMA” or “Ginnie Mae”), a wholly-owned U.S. Government corporation, is authorized to guarantee, with the full faith and credit of the U.S. Government, the timely payment of principal and interest on securities issued by institutions approved by GNMA and backed by pools of mortgages insured by the Federal Housing Administration or guaranteed by the Department of Veteran Affairs. Government-related guarantors (i.e., not backed by the full faith and credit of the U.S. Government) include the Federal National Mortgage Association (“FNMA” or “Fannie Mae”) and the Federal Home Loan Mortgage Corporation (“FHLMC” or “Freddie Mac”). Pass-through securities issued by FNMA are guaranteed as to timely payment of principal and interest by FNMA but are not backed by the full faith and credit of the U.S. Government. FHLMC guarantees the timely payment of interest and ultimate collection of principal, but its participation certificates are not backed by the full faith and credit of the U.S. Government.
| 3. | Capital Share Transactions and Dividends to Shareholders |
Transactions in capital stock were as follows:
| Six Months Ended | ||||||||
| February 28, 2010 | Year Ended | |||||||
| (unaudited) | August 31, 2009 | |||||||
| Shares sold | 171,968 | 687,083 | ||||||
| Shares issued to shareholders in reinvestment of dividends | 144,042 | 229,495 | ||||||
| Shares redeemed | (473,558 | ) | (1,051,082 | ) | ||||
| Net decrease | (157,548 | ) | (134,504 | ) | ||||
| Dividends per share from net investment income | $ | 0.1877 | $ | 0.4148 | ||||
| Distributions per share from net realized gains | $ | 0.0755 | $ | — | ||||
Dividends and distributions to shareholders are recorded on the ex-dividend date.
| 4. | Purchases and Sales of Securities |
Purchases and sales of investment securities, excluding short-term securities, were as follows:
| Six Months Ended | ||||
| February 28, 2010 | ||||
| (unaudited) | ||||
| Purchases: | ||||
| U.S. Treasury Obligations | $ | 14,175,625 | ||
| U.S. Government Agency Obligations | 8,753,039 | |||
| Total Purchases | $ | 22,928,664 | ||
| Sales: | ||||
| U.S. Treasury Obligations | $ | 6,840,497 | ||
| U.S. Government Agency Obligations | 10,447,266 | |||
| Total Sales | $ | 17,287,763 | ||
| 5. | Income Taxes |
At February 28, 2010, information on the tax components of capital is as follows:
| Cost of investments for tax purposes | $ | 81,721,337 | ||
| Gross tax unrealized appreciation | $ | 3,119,353 | ||
| Gross tax unrealized depreciation | $ | (3,679 | ) | |
| Net tax unrealized appreciation on investments | $ | 3,115,674 |
| 6. | Investment Advisory Fees, Service and Distribution Fees and Transactions With Affiliates |
An advisory fee of $221,447 was paid or payable to EULAV Asset Management, LLC (the “Adviser”) for the six months ended February 28, 2010. This was computed at the rate of 0.50% of the Fund’s average daily net assets during the period and paid monthly.
17
| Value Line U.S. Government Securities Fund, Inc. |
| Notes to Financial Statements (unaudited) |
The Adviser provides research, investment programs, and supervision of the investment portfolio and pays costs of administrative services, office space, equipment, and compensation of administrative, bookkeeping, and clerical personnel necessary for managing the affairs of the Fund. The Adviser also provides persons, satisfactory to the Fund’s Board of Directors, to act as officers of the Fund and pays their salaries.
The Fund has a Service and Distribution Plan (the “Plan”) adopted pursuant to Rule 12b-1 under the Investment Company Act of 1940. The Plan compensates EULAV Securities, Inc. (the “Distributor”) for advertising, marketing and distributing the Fund’s shares and for servicing the Fund’s shareholders at an annual rate of 0.25% of the Fund’s average daily net assets. Fees amounting to $110,723, before fee waivers, were accrued under the Plan for the six months ended February 28, 2010. Effective January 1, 2009 through December 31, 2010, the Distributor contractually agreed to waive the 12b-1 fee. For the six months ended February 28, 2010 all 12-1 fees were waived. The Distributor has no right to recoup previously waived amounts. There is no assurance that the Distributor will extend the fee waiver beyond such date.
For the six months ended February 28, 2010, the Fund’s expenses were reduced by $17 under a custody credit arrangement with the custodian.
Direct expenses of the Fund are charged to the Fund while common expenses of the Value Line Funds are allocated proportionately based upon the Funds’ respective net assets. The Fund bears all other costs and expenses.
Certain officers, employees and directors of Value Line and affiliated companies are also officers and a director of the Fund.
Value Line and/or affiliated companies and the Value Line Profit Sharing and Savings Plan at February 28, 2010 owned 11,788 shares of the Fund’s capital stock, representing 1.45% of the outstanding shares. In addition, certain officers and directors of the Fund as a group owned 445 shares, representing less than 1% of the outstanding shares.
18
| Value Line U.S. Government Securities Fund, Inc. | |
| Financial Highlights | |
| Selected data for a share of capital stock outstanding throughout each period: | |
| Six Months Ended | ||||||||||||||||||||||||
| February 28, 2010 | Years Ended August 31, | |||||||||||||||||||||||
| (unaudited) | 2009 | 2008 | 2007 | 2006 | 2005 | |||||||||||||||||||
| Net asset value, beginning of period | $ | 12.06 | $ | 11.62 | $ | 11.42 | $ | 11.37 | $ | 11.74 | $ | 11.87 | ||||||||||||
| Income from investment operations: | ||||||||||||||||||||||||
| Net investment income | 0.18 | 0.40 | 0.46 | 0.51 | 0.47 | 0.52 | ||||||||||||||||||
| Net gains or (losses) on securities (both realized and unrealized) | 0.09 | 0.45 | 0.24 | 0.03 | (0.32 | ) | (0.19 | ) | ||||||||||||||||
| Total from investment operations | 0.27 | 0.85 | 0.70 | 0.54 | 0.15 | 0.33 | ||||||||||||||||||
| Less distributions: | ||||||||||||||||||||||||
| Dividends from net investment income | (0.19 | ) | (0.41 | ) | (0.50 | ) | (0.49 | ) | (0.52 | ) | (0.46 | ) | ||||||||||||
| Distributions from net realized gains | (0.08 | ) | — | — | — | — | — | |||||||||||||||||
| Total distributions | (0.27 | ) | (0.41 | ) | (0.50 | ) | (0.49 | ) | (0.52 | ) | (0.46 | ) | ||||||||||||
| Net asset value, end of period | $ | 12.06 | $ | 12.06 | $ | 11.62 | $ | 11.42 | $ | 11.37 | $ | 11.74 | ||||||||||||
| Total return | 2.13 | %(3) | 7.46 | % | 6.22 | % | 4.86 | % | 1.33 | % | 2.86 | % | ||||||||||||
| Ratios/Supplemental Data: | ||||||||||||||||||||||||
| Net assets, end of period (in thousands) | $ | 87,718 | $ | 89,609 | $ | 87,919 | $ | 88,886 | $ | 97,205 | $ | 112,140 | ||||||||||||
Ratio of expenses to average net assets(1) | 1.06 | %(4) | 1.07 | % | 1.01 | % | 0.93 | % | 1.05 | % | 1.04 | % | ||||||||||||
Ratio of expenses to average net assets(2) | 0.81 | %(4) | 0.82 | % | 0.76 | % | 0.75 | % | 1.00 | % | 1.04 | % | ||||||||||||
| Ratio of net investment income to average net assets | 3.01 | %(4) | 3.37 | % | 3.96 | % | 4.28 | % | 3.88 | % | 3.60 | % | ||||||||||||
| Portfolio turnover rate | 21 | %(3) | 58 | % | 51 | % | 38 | % | 22 | % | 60 | % | ||||||||||||
| (1) | Ratio reflects expenses grossed up for custody credit arrangement and grossed up for the waiver of the service and distribution plan fees by the Distributor. The ratio of expenses to average net assets, net of custody credits, but exclusive of the waiver of the service and distribution plan fees by the Distributor would have been 1.00%, 0.92% and 1.04% for the years ended August 31, 2008, 2007, and 2006, respectively, and would not have changed for the other periods shown. |
| (2) | Ratio reflects expenses net of the custody credit arrangement and net of the waiver of the service and distribution plan fees by the Distributor. |
| (3) | Not annualized. |
| (4) | Annualized. |
See Notes to Financial Statements.
19
| Value Line U.S. Government Securities Fund, Inc. | |
The Fund files its complete schedule of portfolio holdings with the Securities and Exchange Commission (“SEC”) for the first and third quarters of each fiscal year on Form N-Q. The Fund’s Forms N-Q are available on the SEC’s website at http://www.sec.gov and may be reviewed and copied at the SEC’s Public Reference Room in Washington, D.C. Information on the operation of the Public Reference Room may be obtained by calling 1-800-SEC-0330.
A description of the policies and procedures that the Fund uses to determine how to vote proxies relating to portfolio securities, and information regarding how the Fund voted these proxies for the 12-month period ended June 30 is available through the Fund’s website at http://www.vlfunds.com and on the SEC’s website at http://www.sec.gov. The description of the policies and procedures is also available without charge, upon request, by calling 1-800-243-2729.
20
Value Line U.S. Government Securities Fund, Inc. | |
| Management of the Fund |
MANAGEMENT INFORMATION
The business and affairs of the Fund are managed by the Fund’s officers under the direction of the Board of Directors. The following table sets forth information on each Director and Officer of the Fund. Each Director serves as a director or trustee of each of the 14 Value Line Funds. Each Director serves until his or her successor is elected and qualified.
| Other | |||||||||
| Length of | Principal Occupation | Directorships | |||||||
| Name, Address, and DOB | Position | Time Served | During the Past 5 Years | Held by Director | |||||
Interested Director* | |||||||||
Thomas T. Sarkany DOB: June 1946 | Director | Since 2008 | Mutual Fund Marketing Director of EULAV Securities, Inc. (the “Distributor”), formerly Value Line Securities, Inc. Secretary of Value Line, Inc. since November 2009 and Director since February 2010. | Value Line, Inc. | |||||
Non-Interested Directors | |||||||||
Joyce E. Heinzerling 500 East 77th Street New York, NY 10162 DOB: January 1956 | Director | Since 2008 | President, Meridian Fund Advisers LLC. (consultants) since April 2009; General Counsel, Archery Capital LLC (private investment fund) until April 2009. | Burnham Investors Trust, since 2004 (4 funds). | |||||
Francis C. Oakley 54 Scott Hill Road Williamstown, MA 01267 DOB: October 1931 | Director | Since 2000 | Professor of History, Williams College, (1961-2002). Professor Emeritus since 2002; President Emeritus since 1994 and President, (1985-1994); Chairman (1993-1997) and Interim President (2002-2003) of the American Council of Learned Societies. Trustee since 1997 and Chairman of the Board since 2005, National Humanities Center. | None | |||||
David H. Porter 5 Birch Run Drive Saratoga Springs, NY 12866 DOB: October 1935 | Director | Since 1997 | Professor, Skidmore College since 2008; Visiting Professor of Classics, Williams College, (1999-2008); President Emeritus, Skidmore College since 1999 and President, (1987-1998). | None | |||||
Paul Craig Roberts 169 Pompano St. Panama City Beach, FL 32413 DOB: April 1939 | Director | Since 1986 | Chairman, Institute for Political Economy. | None | |||||
Nancy-Beth Sheerr 1409 Beaumont Drive Gladwyne, PA 19035 DOB: March 1949 | Director | Since 1996 | Senior Financial Advisor, Veritable L.P. (Investment adviser). | None | |||||
21
Value Line U.S. Government Securities Fund, Inc. |
| Management of the Fund |
| Other | |||||||||
| Length of | Principal Occupation | Directorships | |||||||
| Name, Address, and DOB | Position | Time Served | During the Past 5 Years | Held by Director | |||||
Daniel S. Vandivort 59 Indian Head Road Riverside, CT 06878 DOB: July 1954 | Director (Chairman of Board since March 2010) | Since 2008 | President, Chief Investment Officer, Weiss, Peck and Greer/Robeco Investment Management 2005-2007; Managing Director, Weiss, Peck and Greer, 1995-2005. | None | |||||
| Officers | |||||||||
Mitchell E. Appel DOB: August 1970 | President | Since 2008 | President of each of the Value Line Funds since June 2008; Chief Financial Officer of Value Line since April 2008 and from September 2005 to November 2007; Treasurer from June 2005 to September 2005; Director since February 2010; Chief Financial Officer of XTF Asset Management from November 2007 to April 2008; Chief Financial Officer of Circle Trust Company from 2003 through May 2005; Chief Financial Officer of the Distributor since April 2008 and President since February 2009; President of the Adviser since February 2009. | ||||||
Howard A. Brecher DOB: October 1953 | Vice President and Secretary | Since 2008 | Vice President and Secretary of each of the Value Line Funds since June 2008; Vice President and Secretary of Value Line until November 2009; Director of Value Line; Acting Chairman and Acting CEO of Value Line since November 2009; Secretary and Treasurer of the Adviser since February 2009; Vice President, Secretary, Treasurer, General Counsel and a Director of Arnold Bernhard & Co., Inc. | ||||||
Michael J. Wagner DOB: November 1950 | Chief Compliance Officer | Since 2009 | Chief Compliance Officer of each of the Value Line Funds since June 2009; President, Northern Lights Compliance Services, LLC, since 2006; Compliance Services Officer, Northstar Financial Services, LLC, 2006 to January 2008; Chief Operating Officer, Northern Lights Compliance Services, LLC, 2004 to 2006; President and Manager, Gemini Fund Services, LLC, 2004 to 2006; Director of Constellation Trust Company, 2004 to 2008. | ||||||
Emily D. Washington DOB: January 1979 | Treasurer | Since 2008 | Treasurer and Chief Financial Officer (Principal Financial and Accounting Officer) of each of the Value Line Funds since August 2008; Associate Director of Mutual Fund Accounting at Value Line until August 2008. | ||||||
| * | Mr. Sarkany is an “interested person” as defined in the Investment Company Act of 1940 by virtue of his position with the Distributor. |
Unless otherwise indicated, the address for each of the above officers is c/o Value Line Funds, 220 East 42nd Street, New York, NY 10017. | |
| The Fund’s Statement of Additional Information (SAI) includes additional information about the Fund’s Directors and is available, without charge, upon request by calling 1-800-243-2729. |
22
[This Page Intentionally Left Blank.]
Value Line U.S. Government Securities Fund, Inc.
| The Value Line Family of Funds |
1950 — The Value Line Fund seeks long-term growth of capital. Current income is a secondary objective.
1952 — Value Line Income and Growth Fund’s primary investment objective is income, as high and dependable as is consistent with reasonable risk. Capital growth to increase total return is a secondary objective.
1956 — Value Line Premier Growth Fund seeks long-term growth of capital. No consideration is given to current income in the choice of investments.
1972 — Value Line Larger Companies Fund’s sole investment objective is to realize capital growth.
1979 — Value Line U.S. Government Money Market Fund**, a money market fund, seeks to secure as high a level of current income as is consistent with maintaining liquidity and preserving capital. An investment in the Fund is not insured or guaranteed by the Federal Deposit Insurance Corporation or any other government agency. Although the Fund seeks to preserve the value of your investment at $1.00 per share, it is possible to lose money by investing in the Fund.
1981 — Value Line U.S. Government Securities Fund seeks maximum income without undue risk to capital. Under normal conditions, at least 80% of the value of its net assets will be invested in securities issued or guaranteed by the U.S. Government and its agencies and instrumentalities.
1983 — Value Line Centurion Fund* seeks long-term growth of capital.
1984 — The Value Line Tax Exempt Fund seeks to provide investors with the maximum income exempt from federal income taxes while avoiding undue risk to principal. The fund may be subject to state and local taxes and the Alternative Minimum Tax (if applicable).
1985 — Value Line Convertible Fund seeks high current income together with capital appreciation primarily from convertible securities ranked 1, 2 or 3 for the year-ahead performance by the Value Line Convertible Ranking System.
1986 — Value Line Aggressive Income Trust seeks to maximize current income.
1987 — Value Line New York Tax Exempt Trust seeks to provide New York taxpayers with the maximum income exempt from New York State, New York City and federal income taxes while avoiding undue risk to principal. The Trust may be subject to state and local taxes and the Alternative Minimum Tax (if applicable).
1987 — Value Line Strategic Asset Management Trust* seeks to achieve a high total investment return consistent with reasonable risk.
1993 — Value Line Emerging Opportunities Fund invests in US common stocks of small capitalization companies, with its primary objective being long-term growth of capital.
1993 — Value Line Asset Allocation Fund seeks high total investment return, consistent with reasonable risk. The Fund invests in stocks, bonds and money market instruments utilizing quantitative modeling to determine the asset mix.
| * | Only available through the purchase of Guardian Investor, a tax deferred variable annuity, or ValuePlus, a variable life insurance policy. |
| ** | Effective August 19, 2009, The Value Line Cash Fund, Inc. changed its name to the Value Line U.S. Government Money Market Fund, Inc. |
| For more complete information about any of the Value Line Funds, including charges and expenses, send for a prospectus from EULAV Securities, Inc., 220 East 42nd Street, New York, New York 10017-5891 or call 1-800-243-2729, 9am-5pm CST, Monday-Friday, or visit us at www.vlfunds.com. Read the prospectus carefully before you invest or send money. | |
24
Item 11. Controls and Procedures.
| (a) | The registrant’s principal executive officer and principal financial officer have concluded that the registrant’s disclosure controls and procedures (as defined in rule 30a-2(c) under the Act (17 CFR 270.30a-2(c) ) based on their evaluation of these controls and procedures as of a date within 90 days of the filing date of this report, are appropriately designed to ensure that material information relating to the registrant is made known to such officers and are operating effectively. | |
| (b) | The registrant’s principal executive officer and principal financial officer have determined that there have been no significant changes in the registrant’s internal controls or in other factors that could significantly affect these controls subsequent to the date of their evaluation, including corrective actions with regard to significant deficiencies and material weaknesses. |
Item 12. Exhibits.
| (a) | (1) Certification pursuant to Rule 30a-2(a) under the Investment Company Act of 1940 (17 CFR 270.30a-2) attached hereto as Exhibit 99.CERT. | |
| (2) Certification pursuant to Section 906 of the Sarbanes-Oxley Act of 2002 attached hereto as Exhibit 99.906.CERT. |
SIGNATURES
Pursuant to the requirements of the Securities Exchange Act of 1934 and the Investment Company Act of 1940, the registrant has duly caused this report to be signed on its behalf by the undersigned, thereunto duly authorized.
| By | /s/ Mitchell E. Appel | |
| Mitchell E. Appel, President | ||
| Date: | May 4, 2010 |
Pursuant to the requirements of the Securities Exchange Act of 1934 and the Investment Company Act of 1940, this report has been signed below by the following persons on behalf of the registrant and in the capacities and on the dates indicated.
| By: | /s/ Mitchell E. Appel | |
| Mitchell E. Appel, President, Principal Executive Officer | ||
| By: | /s/ Emily D. Washington | |
| Emily D. Washington, Treasurer, Principal Financial Officer | ||
| Date: | May 4, 2010 | |