| UNITED STATES |
| SECURITIES AND EXCHANGE COMMISSION |
| Washington, D.C. 20549 |
| FORM N-CSR |
| CERTIFIED SHAREHOLDER REPORT OF REGISTERED |
| MANAGEMENT INVESTMENT COMPANIES |
Investment Company Act file Number _811-03171_
| Value Line U.S. Government Securities Fund, Inc. | |
| (Exact name of registrant as specified in charter) |
7 Times Square, 21st Floor, New York, N.Y. 10036-6524 | |
| (Address of principal executive offices) (Zip Code) |
Registrant’s telephone number, including area code: 212-907-1900
Date of fiscal year end: August 31, 2013
Date of reporting period: February 28, 2013
Item I. Reports to Stockholders.
A copy of the Semi-Annual Report to Stockholders for the period ended 2/28/13 is included with this Form.
| INVESTMENT ADVISER | EULAV Asset Management | S E M I - A N N U A L R E P O R T | ||||
7 Times Square 21st Floor | F e b r u a r y 2 8 , 2 0 1 3 | |||||
| New York, NY 10036-6524 | ||||||
| DISTRIBUTOR | EULAV Securities LLC | Value Line U.S. Government Securities Fund, Inc. | ||||
7 Times Square 21st Floor | ||||||
| New York, NY 10036-6524 | ||||||
| CUSTODIAN BANK | State Street Bank and Trust Co. | |||||
| 225 Franklin Street | ||||||
| Boston, MA 02110 | ||||||
| SHAREHOLDER | State Street Bank and Trust Co. | |||||
| SERVICING AGENT | c/o BFDS | |||||
| P.O. Box 219729 | ||||||
| Kansas City, MO 64121-9729 | ||||||
| INDEPENDENT | PricewaterhouseCoopers LLP | |||||
| REGISTERED PUBLIC | 300 Madison Avenue | |||||
| ACCOUNTING FIRM | New York, NY 10017 | |||||
| LEGAL COUNSEL | Peter D. Lowenstein, Esq. | |||||
| 496 Valley Road | ||||||
| Cos Cob, CT 06807-0272 | ||||||
| DIRECTORS | Mitchell E. Appel | |||||
| Joyce E. Heinzerling | ||||||
| Francis C. Oakley | ||||||
| David H. Porter | ||||||
| Paul Craig Roberts | ||||||
| Nancy-Beth Sheerr | ||||||
| Daniel S. Vandivort | ||||||
| OFFICERS | Mitchell E. Appel | |||||
| President | ||||||
| Michael J. Wagner | ||||||
| Chief Compliance Officer | ||||||
| Emily D. Washington | ||||||
| Treasurer and Secretary | ||||||
 |  | |||||
| This unaudited report is issued for information to shareholders. It is not authorized for distribution to prospective investors unless preceded or accompanied by a currently effective prospectus of the Fund (obtainable from the Distributor). | ||||||
| #00096008 | ||||||
| Value Line U.S. Government Securities Fund, Inc. |
| To Our Value Line U.S. Government |
To Our Shareholders (unaudited):
Enclosed is your semi-annual report for the period ended February 28, 2013. I encourage you to carefully review this report, which includes economic observations, your Fund’s performance data and highlights, schedule of investments, and financial statements.
For the six-month period that ended on February 28th, bond prices fell as interest rates rose among both short and long-term maturities. The yield on the short-term 5-year U.S. Treasury note increased from 0.59% to 0.76%. The yield on the 10-year U.S. Treasury note rose from 1.55% to 1.88%. Interest rates rose when the sovereign debt and banking crisis within the European Union stabilized following emergency funding from the European Central Bank. Additionally, continued improvement in U.S. economic growth added to the pressure on interest rates.
For the period your fund lost -0.78% lagging its benchmark, the Barclay’s 50% Government/ 50% Mortgage Index, which lost -0.36%. (1). The Fund had a slightly longer risk position than the benchmark within its U.S Treasury allocation. The Fund lagged the index as treasuries underperformed the agency and mortgage sectors for the period. Management continues to believe that over a longer time frame of one year, treasuries will outperform as interest rates will remain lower than expected.
On March 21, 2013, shareholders approved a merger of the Fund into the Value Line Core Bond Fund that was effective March 22nd. The merger is a tax-free exchange for shareholders. The Core Bond Fund has the same investment objective as your Fund but has a broader investment strategy that includes investing in government securities as well as intermediate investment grade corporate debt.
We wish to thank you for investing in Value Line’s U.S. Government Securities Fund and look forward to meeting your investment needs in the future. For a complete line up of the Value Line Funds, visit www.vlfunds.com.
| Sincerely, | |
| /s/ Mitchell Appel | |
| Mitchell Appel, President | |
| /s/ Jeff Geffen | |
| Jeff Geffen, Senior Portfolio Manager |
March 28, 2013
| (1) | The Barclays 50% Government, 50% Mortgage Index represents the intermediate maturities (1-10 years) of the U.S. Treasury and U.S. Agency segment of the fixed-income market. The returns for the Index do not reflect charges, expenses, or taxes, and it is not possible to directly invest in this Index. |
Past performance does not guarantee future results. Investment return and principal value of an investment can fluctuate so that an investor’s shares, when redeemed, may be worth more or less than their original cost; and that current performance may be lower or higher than the performance data quoted. Investors should carefully consider the investment objectives, risks, charges and expense of a fund. This and other important information about a fund is contained in the fund’s prospectus. A copy of our fund’s prospectus can be obtained free of charge by going to our website at www.vlfunds.com or calling 800.243.2729. |
2
Value Line U.S. Government Securities Fund, Inc.
| Securities Fund Shareholders |
Economic Highlights (unaudited)
The S&P 500 continued to climb in the new year returning 6.20% through February 28th. The equity market has found support from a significantly stronger real estate market and a modest drop in the national unemployment rate.
Consumer spending ended 2012 on a high note and has continued to tick up in early 2013. Auto sales were a major contributor to the increase in month-over-month retail sales seen in both January and February. There had been concerns that consumers would have pulled back on their spending due to increases in the payroll tax. However, consumers seemed to be buoyed by the rising real estate sector and a national unemployment rate still under 8%.
The labor market has been improving at a measured pace. The national unemployment rate stood at 7.7% at the end of February down from 7.8% at year end, though with significant variation among the states. While a number of states posted unemployment rates under 6%, there were several states, including California, with rates still exceeding 9%. Despite the improving trend in job creation, it has not been strong enough for the Fed to alter its economic stimulus policy of keeping short term interest rates at extremely low levels. The Fed recently reaffirmed its policy of future monetary tightening being contingent on the unemployment rate falling below 6.5% or inflation breaching 2.5%.
At home, GDP grew 2.2% in 2012, indicating an economy firmly in a mid-cycle expansion. Another year of economic expansion is expected in 2013, with growth slower earlier in the year and picking up later in the year. Some economic weakness is expected early in the year due to tax hikes and disruption from the sequester budget cuts. Assuming fiscal policy is clarified enough by midyear to encourage a rebound in capital spending, a 3% growth rate in the U.S. is possible in late 2013.
Despite the growing economy, inflationary pressures have remained modest. Consumer prices have remained in check, with the National Consumer Price Index rising 1.7% in 2012, edging up to 2.0% for the 12 months ending February 28th. Limited wage growth has contributed to the relatively benign inflationary environment.
3
| Value Line U.S. Government Securities Fund, Inc. |
FUND EXPENSES (unaudited):
Example
As a shareholder of the Fund, you incur ongoing costs, including management fees, distribution and service (12b-1) fees, and other Fund expenses. This Example is intended to help you understand your ongoing costs (in dollars) of investing in the Fund and to compare these costs with the ongoing costs of investing in other mutual funds.
The Example is based on an investment of $1,000 invested at the beginning of the period and held for the entire period (September 1, 2012 through February 28, 2013).
Actual Expenses
The first line of the table below provides information about actual account values and actual expenses. You may use the information in this line, together with the amount you invested, to estimate the expenses that you paid over the period. Simply divide your account value by $1,000 (for example an $8,600 account value divided by $1,000 = 8.6), then multiply the result by the number in the first line under the heading “Expenses Paid During Period” to estimate the expenses you paid on your account during this period.
Hypothetical Example for Comparison Purposes
The second line of the table below provides information about hypothetical account values and hypothetical expenses based on the Fund’s actual expense ratio and an assumed rate of return of 5% per year before expenses, which is not the Fund’s actual return. The hypothetical account values and expenses may not be used to estimate the actual ending account balance or expenses you paid for the period. You may use this information to compare the ongoing costs of investing in the Fund and other funds. To do so, compare this 5% hypothetical example with the 5% hypothetical examples that appear in the shareholder reports of other funds.
Please note that the expenses shown in the table are meant to highlight your ongoing costs only and do not reflect any transactional costs, such as sales charges (loads), redemption fees, or exchange fees. Therefore, the table is useful in comparing ongoing costs only and will not help you determine the relative total costs of owning different funds. In addition, if transactional costs were included, your costs would have been higher.
| Expenses | ||||||||||||
| Beginning | Ending | paid during | ||||||||||
| account value | account value | period 9/1/12 | ||||||||||
| 9/1/12 | 2/28/13 | thru 2/28/13* | ||||||||||
| Actual | $ | 1,000.00 | $ | 992.18 | $ | 5.56 | ||||||
| Hypothetical (5% return before expenses) | $ | 1,000.00 | $ | 1,019.22 | $ | 5.63 | ||||||
| * | Expenses are equal to the Fund’s annualized expense ratio of 1.13% multiplied by the average account value over the period, multiplied by 181/365 to reflect the one-half year period. This expense ratio may differ from the expense ratio shown in the Financial Highlights. |
4
Value Line U.S. Government Securities Fund, Inc.
| Portfolio Highlights at February 28, 2013 (unaudited) |
| Ten Largest Holdings | ||||||||||||
| Principal | Percentage of | |||||||||||
| Issue | Amount | Value | Net Assets | |||||||||
| U.S. Treasury Notes, 1.50%, 7/31/16 | $ | 2,300,000 | $ | 2,382,837 | 3.2 | % | ||||||
| U.S. Treasury Notes, 3.13%, 5/15/19 | 2,100,000 | 2,365,780 | 3.2 | % | ||||||||
| U.S. Treasury Notes, 1.00%, 3/31/17 | 2,300,000 | 2,339,532 | 3.1 | % | ||||||||
| Federal Home Loan Bank, 5.00%, 12/21/15 | 2,000,000 | 2,255,290 | 3.0 | % | ||||||||
| U.S. Treasury Notes, 0.38%, 1/15/16 | 2,000,000 | 2,002,032 | 2.7 | % | ||||||||
| Federal National Mortgage Association Pool #MA1107, 3.50%, 7/1/32 | 1,566,217 | 1,661,938 | 2.2 | % | ||||||||
| Federal National Mortgage Association, 2.38%, 7/28/15 | 1,500,000 | 1,571,467 | 2.1 | % | ||||||||
| Federal National Mortgage Association, 7.25%, 5/15/30 | 1,000,000 | 1,565,377 | 2.1 | % | ||||||||
| U.S. Treasury Notes, 3.50%, 5/15/20 | 1,100,000 | 1,268,782 | 1.7 | % | ||||||||
| U.S. Treasury Notes, 1.50%, 8/31/18 | 1,200,000 | 1,239,187 | 1.7 | % | ||||||||
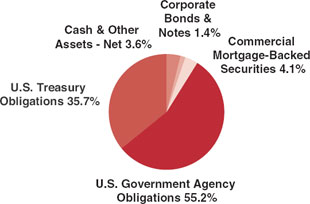
| Asset Allocation — Percentage of Fund’s Net Assets | ||||||||||||
| Coupon Distribution |
| Percentage of | ||||
| Fund’s | ||||
| Investments | ||||
| Less than 4% | 64.3 | % | ||
| 4-4.99% | 13.1 | % | ||
| 5-5.99% | 15.5 | % | ||
| 6-6.99% | 2.4 | % | ||
| 7-7.99% | 4.7 | % | ||
5
Value Line U.S. Government Securities Fund, Inc.
| Schedule of Investments (unaudited) | February 28, 2013 |
Principal Amount | Rate | Maturity Date | Value | ||||||||
| U.S. GOVERNMENT AGENCY OBLIGATIONS (55.2%) | |||||||||||
| FEDERAL HOME LOAN BANK (4.6%) | |||||||||||
| $ | 2,000,000 | Federal Home Loan Bank | 5.00 | % | 12/21/15 | $ | 2,255,290 | ||||
| 1,000,000 | Federal Home Loan Bank | 5.00 | 11/17/17 | 1,194,271 | |||||||
| 3,000,000 | TOTAL FEDERAL HOME LOAN BANK | ||||||||||
| (Cost $3,154,101) | 3,449,561 | ||||||||||
| FEDERAL HOME LOAN MORTGAGE CORPORATION (21.9%) | |||||||||||
| 276,088 | Federal Home Loan Mortgage Corporation REMIC Trust Series 2849 Class VA | 5.00 | 8/15/15 | 281,096 | |||||||
| 1,000,000 | Federal Home Loan Mortgage Corporation | 5.50 | 7/18/16 | 1,166,299 | |||||||
| 1,000,000 | Federal Home Loan Mortgage Corporation | 2.00 | 8/25/16 | 1,049,715 | |||||||
| 1,100,000 | Federal Home Loan Mortgage Corporation | 1.25 | 5/12/17 | 1,124,152 | |||||||
| 3,581 | Federal Home Loan Mortgage Corporation Gold PC Pool #E92226 | 5.00 | 11/1/17 | 3,824 | |||||||
| 1,000,000 | Federal Home Loan Mortgage Corporation | 5.13 | 11/17/17 | 1,197,399 | |||||||
| 50,023 | Federal Home Loan Mortgage Corporation Gold PC Pool #E93499 | 5.00 | 12/1/17 | 53,415 | |||||||
| 4,626 | Federal Home Loan Mortgage Corporation Gold PC Pool #E92829 | 5.00 | 12/1/17 | 4,939 | |||||||
| 220,259 | Federal Home Loan Mortgage Corporation REMIC Trust Series 2643 Class ME | 3.50 | 3/15/18 | 226,769 | |||||||
| 5,396 | Federal Home Loan Mortgage Corporation Gold PC Pool #E98960 | 5.00 | 9/1/18 | 5,762 | |||||||
| 24,968 | Federal Home Loan Mortgage Corporation Gold PC Pool #B12822 | 5.00 | 3/1/19 | 27,036 | |||||||
| 1,000,000 | Federal Home Loan Mortgage Corporation | 3.75 | 3/27/19 | 1,149,474 | |||||||
| 12,807 | Federal Home Loan Mortgage Corporation Gold PC Pool #B17398 | 4.50 | 12/1/19 | 13,666 | |||||||
| 78,547 | Federal Home Loan Mortgage Corporation Gold PC Pool #G18044 | 4.50 | 3/1/20 | 83,935 | |||||||
| 57,341 | Federal Home Loan Mortgage Corporation Gold PC Pool #B18034 | 4.50 | 4/1/20 | 61,274 | |||||||
| 227,025 | Federal Home Loan Mortgage Corporation Gold PC Pool #J12462 | 4.00 | 6/1/20 | 242,367 | |||||||
| 10,209 | Federal Home Loan Mortgage Corporation Gold PC Pool #J00118 | 5.00 | 10/1/20 | 10,962 | |||||||
See Notes to Financial Statements.
Value Line U.S. Government Securities Fund, Inc.
| Schedule of Investments (unaudited) |
| Principal | Maturity | ||||||||||
| Amount | Rate | Date | Value | ||||||||
| $ | 234,596 | Federal Home Loan Mortgage Corporation Gold PC Pool #J00139 | 5.00 | % | 10/1/20 | $ | 251,605 | ||||
| 9,115 | Federal Home Loan Mortgage Corporation Gold PC Pool #G11986 | 5.00 | 4/1/21 | 9,777 | |||||||
| 12,786 | Federal Home Loan Mortgage Corporation Gold PC Pool #G12319 | 5.00 | 6/1/21 | 13,729 | |||||||
| 650,443 | Federal Home Loan Mortgage Corporation Gold PC Pool #G14216 | 3.50 | 7/1/21 | 686,649 | |||||||
| 67,881 | Federal Home Loan Mortgage Corporation Gold PC Pool #J03233 | 5.00 | 8/1/21 | 72,813 | |||||||
| 158,141 | Federal Home Loan Mortgage Corporation Gold PC Pool #J08096 | 5.00 | 6/1/23 | 169,013 | |||||||
| 518,944 | Federal Home Loan Mortgage Corporation Gold PC Pool #J09739 | 4.50 | 5/1/24 | 552,919 | |||||||
| 545,012 | Federal Home Loan Mortgage Corporation Gold PC Pool #J11587 | 4.00 | 1/1/25 | 594,617 | |||||||
| 122,093 | Federal Home Loan Mortgage Corporation Gold PC Pool #E02704 | 4.50 | 7/1/25 | 130,048 | |||||||
| 294,585 | Federal Home Loan Mortgage Corporation REMIC Trust Series 3567 Class BJ | 4.50 | 6/15/27 | 302,744 | |||||||
| 27,932 | Federal Home Loan Mortgage Corporation REMIC Trust Series 2645 Class NA | 3.50 | 9/15/31 | 28,270 | |||||||
| 320,052 | Federal Home Loan Mortgage Corporation Gold PC Pool #C77717 | 6.00 | 3/1/33 | 357,851 | |||||||
| 279,138 | Federal Home Loan Mortgage Corporation Gold PC Pool #A29526 | 5.00 | 1/1/35 | 301,332 | |||||||
| 95,417 | Federal Home Loan Mortgage Corporation Gold PC Pool #A29633 | 5.00 | 1/1/35 | 103,004 | |||||||
| 192,584 | Federal Home Loan Mortgage Corporation Pool #783022 (1) | 2.40 | 2/1/35 | 205,650 | |||||||
| 85,154 | Federal Home Loan Mortgage Corporation Gold PC Pool #A56491 | 5.00 | 1/1/37 | 91,684 | |||||||
| 75,999 | Federal Home Loan Mortgage Corporation Gold PC Pool #G08184 | 5.00 | 1/1/37 | 81,828 | |||||||
| 158,123 | Federal Home Loan Mortgage Corporation Gold PC Pool #A56467 | 5.50 | 1/1/37 | 171,609 | |||||||
| 1,000,230 | Federal Home Loan Mortgage Corporation REMIC Trust Series 3632 Class AP | 3.00 | 2/15/40 | 1,061,123 | |||||||
See Notes to Financial Statements.
Value Line U.S. Government Securities Fund, Inc.
| February 28, 2013 |
| Principal | Maturity | ||||||||||
| Amount | Rate | Date | Value | ||||||||
| $ | 575,695 | Federal Home Loan Mortgage Corporation Gold PC Pool #C03516 | 4.00 | % | 9/1/40 | $ | 611,842 | ||||
| 882,382 | Federal Home Loan Mortgage Corporation Gold PC Pool #A95803 | 4.00 | 12/1/40 | 966,464 | |||||||
| 350,797 | Federal Home Loan Mortgage Corporation Gold PC Pool #A96409 | 3.50 | 1/1/41 | 369,504 | |||||||
| 327,155 | Federal Home Loan Mortgage Corporation Gold PC Pool #G06224 | 3.50 | 1/1/41 | 344,601 | |||||||
| 57,820 | Federal Home Loan Mortgage Corporation Gold PC Pool #Q01181 | 4.50 | 6/1/41 | 62,162 | |||||||
| 162,489 | Federal Home Loan Mortgage Corporation Gold PC Pool #Q06307 | 3.50 | 2/1/42 | 171,154 | |||||||
| 905,332 | Federal Home Loan Mortgage Corporation Gold PC Pool #G08488 | 3.50 | 4/1/42 | 955,873 | |||||||
| 905,281 | Federal Home Loan Mortgage Corporation Gold PC Pool #C09004 | 3.50 | 7/1/42 | 955,819 | |||||||
| 15,086,046 | TOTAL FEDERAL HOME LOAN MORTGAGE CORPORATION (Cost $15,535,252) | 16,325,768 | |||||||||
| FEDERAL NATIONAL MORTGAGE ASSOCIATION (22.3%) | |||||||||||
| 1,500,000 | Federal National Mortgage Association | 2.38 | 7/28/15 | 1,571,467 | |||||||
| 8,436 | Federal National Mortgage Association Pool #511823 | 5.50 | 5/1/16 | 9,022 | |||||||
| 511,739 | Federal National Mortgage Association REMIC Trust Series 2005-40 Class VG | 4.50 | 6/25/16 | 521,374 | |||||||
| 3,963 | Federal National Mortgage Association Pool #615289 | 5.50 | 12/1/16 | 4,238 | |||||||
| 37,318 | Federal National Mortgage Association Pool #622373 | 5.50 | 12/1/16 | 39,907 | |||||||
| 28,313 | Federal National Mortgage Association Pool #631328 | 5.50 | 2/1/17 | 30,366 | |||||||
| 47,859 | Federal National Mortgage Association Pool #623503 | 6.00 | 2/1/17 | 51,399 | |||||||
| 2,431 | Federal National Mortgage Association Pool #643277 | 5.50 | 4/1/17 | 2,608 | |||||||
| 2,809 | Federal National Mortgage Association Pool #638247 | 5.50 | 5/1/17 | 3,013 | |||||||
| 500,000 | Federal National Mortgage Association | 1.10 | 7/11/17 | 502,495 | |||||||
| 72,281 | Federal National Mortgage Association Pool #254684 | 5.00 | 3/1/18 | 78,345 | |||||||
| 22,690 | Federal National Mortgage Association Pool #685183 | 5.00 | 3/1/18 | 24,593 | |||||||
| 1,000,000 | Federal National Mortgage Association | 1.10 | 3/12/18 | 1,004,175 | |||||||
| 34,198 | Federal National Mortgage Association Pool #703936 | 5.00 | 5/1/18 | 37,067 | |||||||
| 394,906 | Federal National Mortgage Association Pool #780956 | 4.50 | 5/1/19 | 433,826 | |||||||
| 123,748 | Federal National Mortgage Association Pool #790984 | 5.00 | 7/1/19 | 134,131 | |||||||
See Notes to Financial Statements.
Value Line U.S. Government Securities Fund, Inc.
| Schedule of Investments (unaudited) |
| Principal | Maturity | ||||||||||
| Amount | Rate | Date | Value | ||||||||
| $ | 153,475 | Federal National Mortgage Association Pool #786915 | 5.00 | % | 8/1/19 | $ | 167,408 | ||||
| 75,833 | Federal National Mortgage Association REMIC Trust Series 2003-17 Class ED | 4.25 | 9/25/22 | 76,995 | |||||||
| 61,289 | Federal National Mortgage Association REMIC Trust Series 2003-38 Class TC | 5.00 | 3/25/23 | 64,672 | |||||||
| 485,427 | Federal National Mortgage Association Pool #AB5231 | 2.50 | 5/1/27 | 504,768 | |||||||
| 41,016 | Federal National Mortgage Association Pool #412682 | 6.00 | 3/1/28 | 45,976 | |||||||
| 1,000,000 | Federal National Mortgage Association | 7.25 | 5/15/30 | 1,565,377 | |||||||
| 318,120 | Federal National Mortgage Association Pool #MA0616 | 4.00 | 1/1/31 | 341,411 | |||||||
| 200 | Federal National Mortgage Association Pool #568625 | 7.50 | 1/1/31 | 207 | |||||||
| 31,425 | Federal National Mortgage Association Pool #571090 | 7.50 | 1/1/31 | 32,174 | |||||||
| 672,008 | Federal National Mortgage Association Pool #MA0641 | 4.00 | 2/1/31 | 721,209 | |||||||
| 1,726 | Federal National Mortgage Association Pool #573935 | 7.50 | 3/1/31 | 1,856 | |||||||
| 1,428 | Federal National Mortgage Association Pool #629297 | 6.50 | 2/1/32 | 1,617 | |||||||
| 263,279 | Federal National Mortgage Association Pool #626440 | 7.50 | 2/1/32 | 321,854 | |||||||
| 23,827 | Federal National Mortgage Association Pool #254383 | 7.50 | 6/1/32 | 29,210 | |||||||
| 1,566,217 | Federal National Mortgage Association Pool #MA1107 | 3.50 | 7/1/32 | 1,661,938 | |||||||
| 74,034 | Federal National Mortgage Association Pool #254476 | 5.50 | 9/1/32 | 81,598 | |||||||
| 2,992 | Federal National Mortgage Association Pool #688539 | 5.50 | 3/1/33 | 3,291 | |||||||
| 159,220 | Federal National Mortgage Association Pool #650386 | 5.00 | 7/1/33 | 173,397 | |||||||
| 78,445 | Federal National Mortgage Association Pool #726889 | 5.50 | 7/1/33 | 86,288 | |||||||
| 104,556 | Federal National Mortgage Association Pool #759028 | 5.50 | 1/1/34 | 115,009 | |||||||
| 66,210 | Federal National Mortgage Association Pool #763393 | 5.50 | 2/1/34 | 72,829 | |||||||
| 73,384 | Federal National Mortgage Association Pool #769862 | 5.50 | 2/1/34 | 80,881 | |||||||
| 7,999 | Federal National Mortgage Association Pool #769682 | 5.00 | 3/1/34 | 8,691 | |||||||
| 316,123 | Federal National Mortgage Association REMIC Trust Series 2004-60 Class LB | 5.00 | 4/25/34 | 345,722 | |||||||
| 2,724 | Federal National Mortgage Association Pool #778141 | 5.00 | 5/1/34 | 2,959 | |||||||
| 6,252 | Federal National Mortgage Association Pool #258149 | 5.50 | 9/1/34 | 6,886 | |||||||
| 1,341 | Federal National Mortgage Association Pool #789150 | 5.00 | 10/1/34 | 1,457 | |||||||
| 166,506 | Federal National Mortgage Association Pool #255496 | 5.00 | 11/1/34 | 180,916 | |||||||
| 22,187 | Federal National Mortgage Association Pool #797154 | 5.50 | 11/1/34 | 24,613 | |||||||
| 50,327 | Federal National Mortgage Association Pool #801063 | 5.50 | 11/1/34 | 55,469 | |||||||
| 37,521 | Federal National Mortgage Association Pool #803675 | 5.50 | 12/1/34 | 41,354 | |||||||
| 72,052 | Federal National Mortgage Association Pool #804683 | 5.50 | 12/1/34 | 79,413 | |||||||
| 257,367 | Federal National Mortgage Association Pool #815813 (1) | 2.57 | 2/1/35 | 274,498 | |||||||
See Notes to Financial Statements.
Value Line U.S. Government Securities Fund, Inc.
| February 28, 2013 |
| Principal | Maturity | ||||||||||
| Amount | Rate | Date | Value | ||||||||
| $ | 12,967 | Federal National Mortgage Association Pool #255580 | 5.50 | % | 2/1/35 | $ | 14,292 | ||||
| 163,650 | Federal National Mortgage Association Pool #735224 | 5.50 | 2/1/35 | 180,011 | |||||||
| 345,753 | Federal National Mortgage Association Pool #919584 | 6.00 | 6/1/37 | 379,780 | |||||||
| 49,083 | Federal National Mortgage Association Pool #AA2531 | 4.50 | 3/1/39 | 52,827 | |||||||
| 591,900 | Federal National Mortgage Association REMIC Trust Series 2009-88 Class MA | 4.50 | 10/25/39 | 648,745 | |||||||
| 49,761 | Federal National Mortgage Association Pool #AD1035 | 4.50 | 2/1/40 | 53,712 | |||||||
| 315,036 | Federal National Mortgage Association Pool #AD7136 | 5.00 | 7/1/40 | 342,694 | |||||||
| 845,715 | Federal National Mortgage Association Pool #AD8408 | 4.50 | 8/1/40 | 912,872 | |||||||
| 246,072 | Federal National Mortgage Association Pool #AD8536 | 5.00 | 8/1/40 | 271,361 | |||||||
| 717,084 | Federal National Mortgage Association Pool #AH5575 | 4.00 | 2/1/41 | 765,103 | |||||||
| 282,257 | Federal National Mortgage Association Pool #AJ5888 | 4.50 | 11/1/41 | 303,776 | |||||||
| 480,689 | Federal National Mortgage Association Pool #AQ0287 | 3.00 | 10/1/42 | 498,133 | |||||||
| 500,000 | Federal National Mortgage Association TBA | 3.00 | 12/1/99 | 517,656 | |||||||
| 15,085,168 | TOTAL FEDERAL NATIONAL MORTGAGE ASSOCIATION (Cost $15,618,658) | 16,560,931 | |||||||||
| GOVERNMENT NATIONAL MORTGAGE ASSOCIATION (6.4%) | |||||||||||
| 51,670 | Government National Mortgage Association Pool #003645 | 4.50 | 12/20/19 | 56,609 | |||||||
| 3,261 | Government National Mortgage Association Pool #557681 | 6.00 | 8/15/31 | 3,737 | |||||||
| 43,489 | Government National Mortgage Association Pool #548880 | 6.00 | 12/15/31 | 49,839 | |||||||
| 38,790 | Government National Mortgage Association Pool #551762 | 6.00 | 4/15/32 | 44,380 | |||||||
| 18,233 | Government National Mortgage Association Pool #582415 | 6.00 | 11/15/32 | 20,861 | |||||||
| 197,591 | Government National Mortgage Association Pool #604485 | 6.00 | 7/15/33 | 226,564 | |||||||
| 85,443 | Government National Mortgage Association Pool #622603 | 6.00 | 11/15/33 | 97,545 | |||||||
| 2,855 | Government National Mortgage Association Pool #429786 | 6.00 | 12/15/33 | 3,314 | |||||||
| 75,041 | Government National Mortgage Association Pool #605025 | 6.00 | 2/15/34 | 85,898 | |||||||
| 6,260 | Government National Mortgage Association Pool #626480 | 6.00 | 2/15/34 | 7,199 | |||||||
| 49,188 | Government National Mortgage Association Pool #610944 | 5.50 | 4/15/34 | 54,109 | |||||||
| 30,071 | Government National Mortgage Association Pool #605245 | 5.50 | 6/15/34 | 33,168 | |||||||
| 80,094 | Government National Mortgage Association Pool #583008 | 5.50 | 6/15/34 | 88,342 | |||||||
| 642,529 | Government National Mortgage Association Series 2009-103 Class TK | 3.00 | 9/20/38 | 666,414 | |||||||
| 300,000 | Government National Mortgage Association Series 2010-155 Class B | 2.53 | 6/16/39 | 315,289 | |||||||
See Notes to Financial Statements.
Value Line U.S. Government Securities Fund, Inc.
| Schedule of Investments (unaudited) |
| Principal | Maturity | ||||||||||
| Amount | Rate | Date | Value | ||||||||
| $776,446 | Government National Mortgage Association Series 2010-151 Class KA | 3.00 | % | 9/16/39 | $ | 816,915 | |||||
| 431,847 | Government National Mortgage Association Series 2011-17 Class EP | 3.50 | 12/16/39 | 451,371 | |||||||
| 564,229 | Government National Mortgage Association Series 2011-136 Class GB | 2.50 | 5/20/40 | 582,883 | |||||||
| 349,568 | Government National Mortgage Association Series 2013-12 Class AB | 1.83 | 11/16/52 | 355,210 | |||||||
| 350,000 | Government National Mortgage Association Series 2013-12 Class B (1) | 2.45 | 11/16/52 | 356,205 | |||||||
| 447,752 | Government National Mortgage Association Series 2012-125 Class AB (1) | 2.11 | 2/16/53 | 461,692 | |||||||
| 4,544,357 | TOTAL GOVERNMENT NATIONAL MORTGAGE ASSOCIATION (Cost $4,682,356) | 4,777,544 | |||||||||
| 37,715,571 | TOTAL U.S. GOVERNMENT AGENCY OBLIGATIONS (Cost $38,990,367) | 41,113,804 | |||||||||
| COMMERCIAL MORTGAGE-BACKED SECURITIES (4.1%) | |||||||||||
| 500,000 | Federal Home Loan Mortgage Corp. Multifamily Structured Pass Through Certificates, Series K704, Class A2 | 2.41 | 8/25/18 | 524,180 | |||||||
| 1,000,000 | Federal Home Loan Mortgage Corp. Multifamily Structured Pass Through Certificates, Series K709, Class A2 | 2.09 | 3/25/19 | 1,035,792 | |||||||
| 1,000,000 | Federal Home Loan Mortgage Corp. Multifamily Structured Pass Through Certificates, Series K710, Class A2 | 1.88 | 5/25/19 | 1,022,035 | |||||||
| 500,000 | Commercial Mortgage Pass Through Certificates, Series 2013-LC6, Class A4 | 2.94 | 1/10/46 | 506,873 | |||||||
| 3,000,000 | TOTAL COMMERCIAL MORTGAGE-BACKED SECURITIES (Cost $3,109,355) | 3,088,880 | |||||||||
| CORPORATE BONDS & NOTES (1.4%) | |||||||||||
| 1,000,000 | Private Export Funding Corp. | 2.45 | 7/15/24 | 1,009,310 | |||||||
| 1,000,000 | TOTAL CORPORATE BONDS & NOTES (Cost $1,009,310) | 1,009,310 | |||||||||
| U.S. TREASURY OBLIGATIONS (35.7%) | |||||||||||
| 100,000 | U.S. Treasury Notes | 0.25 | 8/15/15 | 99,883 | |||||||
See Notes to Financial Statements.
Value Line U.S. Government Securities Fund, Inc.
| February 28, 2013 |
| Principal | Maturity | ||||||||||
| Amount | Rate | Date | Value | ||||||||
| $ | 2,000,000 | U.S. Treasury Notes | 0.38 | % | 1/15/16 | $ | 2,002,032 | ||||
| 100,000 | U.S. Treasury Notes | 1.50 | 6/30/16 | 103,562 | |||||||
| 2,300,000 | U.S. Treasury Notes | 1.50 | 7/31/16 | 2,382,837 | |||||||
| 1,000,000 | U.S. Treasury Notes | 1.00 | 8/31/16 | 1,018,828 | |||||||
| 600,000 | U.S. Treasury Notes | 0.88 | 12/31/16 | 608,110 | |||||||
| 2,300,000 | U.S. Treasury Notes | 1.00 | 3/31/17 | 2,339,532 | |||||||
| 1,000,000 | U.S. Treasury Notes | 1.88 | 8/31/17 | 1,053,984 | |||||||
| 1,150,000 | U.S. Treasury Notes | 1.88 | 9/30/17 | 1,212,171 | |||||||
| 1,000,000 | U.S. Treasury Notes | 2.38 | 5/31/18 | 1,079,766 | |||||||
| 1,200,000 | U.S. Treasury Notes | 1.50 | 8/31/18 | 1,239,187 | |||||||
| 1,000,000 | U.S. Treasury Notes | 1.38 | 9/30/18 | 1,025,312 | |||||||
| 1,100,000 | U.S. Treasury Notes | 1.38 | 12/31/18 | 1,125,523 | |||||||
| 700,000 | U.S. Treasury Notes | 1.38 | 2/28/19 | 714,930 | |||||||
| 2,100,000 | U.S. Treasury Notes | 3.13 | 5/15/19 | 2,365,780 | |||||||
| 1,100,000 | U.S. Treasury Notes | 3.50 | 5/15/20 | 1,268,782 | |||||||
| 500,000 | U.S. Treasury Notes | 2.63 | 8/15/20 | 545,312 | |||||||
| 900,000 | U.S. Treasury Notes | 3.13 | 5/15/21 | 1,011,797 | |||||||
| 1,000,000 | U.S. Treasury Notes | 2.13 | 8/15/21 | 1,042,188 | |||||||
| 250,000 | U.S. Treasury Notes | 1.63 | 11/15/22 | 244,805 | |||||||
| 578,460 | U.S. Treasury Notes (2) | 2.00 | 1/15/26 | 751,140 | |||||||
| 150,000 | U.S. Treasury Bonds | 7.25 | 8/15/22 | 222,973 | |||||||
| 800,000 | U.S. Treasury Bonds | 7.88 | 2/15/21 | 1,191,438 | |||||||
| 250,000 | U.S. Treasury Bonds | 6.00 | 2/15/26 | 355,625 | |||||||
| 500,000 | U.S. Treasury Bonds | 5.38 | 2/15/31 | 695,859 | |||||||
| 500,000 | U.S. Treasury Bonds | 4.50 | 5/15/38 | 640,156 | |||||||
| 200,000 | U.S. Treasury Bonds | 4.38 | 5/15/40 | 252,094 | |||||||
| 24,378,460 | TOTAL U.S. TREASURY OBLIGATIONS (Cost $26,451,610) | 26,593,606 | |||||||||
| TOTAL INVESTMENT SECURITIES (96.4%) (Cost $69,560,642) | 71,805,600 | ||||||||||
| CASH AND OTHER ASSETS IN EXCESS OF LIABILITIES (3.6%) | 2,690,623 | ||||||||||
| NET ASSETS (100.0%) | $ | 74,496,223 | |||||||||
| NET ASSET VALUE, OFFERING AND REDEMPTION PRICE PER OUTSTANDING SHARE ($74,496,223 ÷ 6,295,849 shares outstanding) | $ | 11.83 | |||||||||
| (1) | Adjustable rate security. The rate shown is as of February 28, 2013. |
| (2) | Treasury Inflation Protected Security (TIPS) |
| TBA | To Be Announced. |
See Notes to Financial Statements.
| Value Line U.S. Government Securities Fund, Inc. |
Statement of Assets and Liabilities at February 28, 2013 (unaudited) |
| Assets: | ||||
| Investment securities, at value (Cost - $69,560,642) | $ | 71,805,600 | ||
| Receivable for securities sold | 6,253,554 | |||
| Interest receivable | 304,035 | |||
| Receivable for capital shares sold | 27,256 | |||
| Receivable for securities lending income | 6 | |||
| Total Assets | 78,390,451 | |||
| Liabilities: | ||||
| Payable for securities purchased | 3,039,817 | |||
| Due to custodian | 671,364 | |||
| Payable for capital shares redeemed | 43,038 | |||
| Accrued expenses: | ||||
| Advisory fee | 28,698 | |||
| Directors’ fees and expenses | 4,485 | |||
| Other | 106,826 | |||
| Total Liabilities | 3,894,228 | |||
| Net Assets | $ | 74,496,223 | ||
| Net assets consist of: | ||||
| Capital stock, at $1.00 par value (authorized 100,000,000, outstanding 6,295,849 shares) | $ | 6,295,849 | ||
| Additional paid-in capital | 65,491,605 | |||
| Undistributed net investment income | 50,479 | |||
| Accumulated net realized gain on investments | 413,332 | |||
| Net unrealized appreciation of investments | 2,244,958 | |||
| Net Assets | $ | 74,496,223 | ||
| Net Asset Value, Offering and Redemption Price per Outstanding Share ($74,496,223 ÷ 6,295,849 shares outstanding) | $ | 11.83 |
| Statement of Operations |
| for the Six Months Ended February 28, 2013 (unaudited) |
| Investment Income: | ||||
| Interest | $ | 882,522 | ||
| Securities lending income | 491 | |||
| Total Income | 883,013 | |||
| Expenses: | ||||
| Advisory fee | 193,276 | |||
| Auditing and legal fees | 113,149 | |||
| Service and distribution plan fees | 96,638 | |||
| Printing and postage | 28,592 | |||
| Transfer agent fees | 25,954 | |||
| Custodian fees | 24,221 | |||
| Registration and filing fees | 21,041 | |||
| Directors’ fees and expenses | 12,532 | |||
| Insurance | 8,196 | |||
| Other | 7,994 | |||
| Total Expenses Before Fees Waived and Custody Credits | 531,593 | |||
| Less: Service and Distribution Plan Fees Waived | (96,638 | ) | ||
| Less: Custody Credits | (67 | ) | ||
| Net Expenses | 434,888 | |||
| Net Investment Income | 448,125 | |||
| Net Realized and Unrealized Gain/(Loss) on Investments: | ||||
| Net Realized Gain | 485,477 | |||
| Change in Net Unrealized Appreciation/(Depreciation) | (1,560,638 | ) | ||
| Net Realized Gain and Change in Net Unrealized Appreciation/(Depreciation) on Investments | (1,075,161 | ) | ||
| Net Decrease in Net Assets from Operations | $ | (627,036 | ) |
See Notes to Financial Statements.
| Value Line U.S. Government Securities Fund, Inc. |
Statement of Changes in Net Assets for the Six Months Ended February 28, 2013 (unaudited) and for the Year Ended August 31, 2012 |
Six Months Ended February 28, 2013 (unaudited) | Year Ended August 31, 2012 | |||||||
| Operations: | ||||||||
| Net investment income | $ | 448,125 | $ | 1,566,972 | ||||
| Net realized gain on investments | 485,477 | 1,984,985 | ||||||
| Change in net unrealized appreciation/(depreciation) | (1,560,638 | ) | (904,927 | ) | ||||
| Net increase/(decrease) in net assets from operations | (627,036 | ) | 2,647,030 | |||||
| Distributions to Shareholders: | ||||||||
| Net investment income | (426,693 | ) | (1,861,489 | ) | ||||
| Net realized gain from investment transactions | (1,339,195 | ) | (1,670,740 | ) | ||||
| Total Distributions | (1,765,888 | ) | (3,532,229 | ) | ||||
| Capital Share Transactions: | ||||||||
| Proceeds from sale of shares | 1,134,380 | 3,407,631 | ||||||
Proceeds from reinvestment of dividends and distributions to shareholders | 1,610,934 | 3,161,640 | ||||||
| Cost of shares redeemed | (6,310,740 | ) | (7,640,465 | ) | ||||
| Net decrease in net assets from capital share transactions | (3,565,426 | ) | (1,071,194 | ) | ||||
Total Decrease in Net Assets | (5,958,350 | ) | (1,956,393 | ) | ||||
| Net Assets: | ||||||||
| Beginning of period | 80,454,573 | 82,410,966 | ||||||
| End of period | $ | 74,496,223 | $ | 80,454,573 | ||||
| Undistributed net investment income, at end of period | $ | 50,479 | $ | 29,047 | ||||
See Notes to Financial Statements.
| Value Line U.S. Government Securities Fund, Inc. |
| Notes to Financial Statements (unaudited) |
1. Significant Accounting Policies
Value Line U.S. Government Securities Fund, Inc., (the “Fund”) is registered under the Investment Company Act of 1940, as amended, as a diversified, open-end management investment company whose primary investment objective is to obtain maximum income without undue risk to principal. Capital preservation and possible capital appreciation are secondary objectives.
The following significant accounting policies are in conformity with generally accepted accounting principles for investment companies. Such policies are consistently followed by the Fund in the preparation of its financial statements. Generally accepted accounting principles require management to make estimates and assumptions that affect the reported amounts and disclosures in the financial statements. Actual results may differ from those estimates and such differences could be material.
(A) Security Valuation: The Fund’s investments are carried at fair value. With assistance from an independent pricing service (the “Service”) approved by the Board of Directors, portfolio securities are valued at the bid prices on the basis of valuations provided by dealers in such securities. Some of the general factors which may be considered by the dealers in arriving at such valuations include the fundamental analytic data relating to the security and an evaluation of the forces which influence the market in which these securities are purchased and sold. Determination of values may involve subjective judgment, as the actual market value of a particular security can be established only by negotiation between the parties in a sales transaction. If a portfolio security is not priced in this manner, the value is determined on the valuation date by reference to valuations obtained from the Service which determines valuations for normal institutional-size trading units of debt securities, without exclusive reliance upon quoted prices. The Service takes into account appropriate factors such as institutional-size trading in similar groups of securities, yield, quality, coupon rate, maturity, type of issue, trading characteristics and other market data in determining valuations. Short-term instruments with maturities of 60 days or less at the date of purchase are valued at amortized cost, which approximates market value. Other assets and securities for which market valuations are not readily available will be valued at fair value by the Adviser pursuant to policies and procedures adopted by the Board of Directors. At February 28, 2013, there were no securities that had been fair valued.
(B) Fair Value Measurements: The Fund follows fair valuation accounting standards (FASB ASC 820-10) which establish a definition of fair value and set out a hierarchy for measuring fair value. These standards require additional disclosures about the various inputs and valuation techniques used to develop the measurements of fair value and a discussion of changes in valuation techniques and related inputs during the period. These inputs are summarized in the three broad levels listed below:
| ● | Level 1 – Inputs that reflect unadjusted quoted prices in active markets for identical assets or liabilities that the Fund has the ability to access at the measurement date; |
| ● | Level 2 – Inputs other than quoted prices that are observable for the asset or liability either directly or indirectly, including inputs in markets that are not considered to be active; |
| ● | Level 3 – Inputs that are unobservable. |
Transfers between investment levels may occur as the markets fluctuate and/or the availability of data used in an investment’s valuation changes. The inputs or methodologies used for valuing securities are not necessarily an indication of the risk associated with investing in those securities.
| Value Line U.S. Government Securities Fund, Inc. |
| February 28, 2013 |
The following table summarizes the inputs used to value the Fund’s investments in securities as of February 28, 2013:
Investments in Securities: | Level 1 | Level 2 | Level 3 | Total | ||||||||||||
| Assets | ||||||||||||||||
| U.S. Government Agency Obligations | $ | 0 | $ | 41,113,804 | $ | 0 | $ | 41,113,804 | ||||||||
| Commercial Mortgage-Backed Securities | 0 | 3,088,880 | 0 | 3,088,880 | ||||||||||||
| Corporate Bonds & Notes | 0 | 1,009,310 | 0 | 1,009,310 | ||||||||||||
| U.S. Treasury Obligations | 0 | 26,593,606 | 0 | 26,593,606 | ||||||||||||
| Total Investments in Securities | $ | 0 | $ | 71,805,600 | $ | 0 | $ | 71,805,600 | ||||||||
The Fund follows the updated provisions surrounding fair value measurements and disclosures on transfers in and out of all levels of the fair value hierarchy on a gross basis and the reasons for the transfers as well as to disclosures about the valuation techniques and inputs used to measure fair value for investments that fall in either Level 2 or Level 3 of the value hierarchy.
The amounts and reasons for all transfers in and out of each level within the three-tier hierarchy are disclosed when the Fund had an amount of total transfers during the reporting period that was meaningful in relation to its net assets as of the end of the reporting period. An investment asset’s or liability’s level within the fair value hierarchy is based on the lowest level input, individually or in aggregate, that is significant to fair value measurement. The objective of fair value measurement remains the same even when there is a significant decrease in the volume and level of activity for an asset or liability and regardless of the valuation techniques used.
For the six months ended February 28, 2013, there were no Level 3 investments. The Schedule of Investments includes a breakdown of the Schedule’s investments by category.
(C) Repurchase Agreements: In connection with transactions in repurchase agreements, the Fund’s custodian takes possession of the underlying collateral securities, the value of which exceeds the principal amount of the repurchase transaction, including accrued interest. To the extent that any repurchase transaction exceeds one business day, it is the Fund’s policy to mark-to-market on a daily basis to ensure the adequacy of the collateral. In the event of default of the obligation to repurchase, the Fund has the right to liquidate the collateral and apply the proceeds in satisfaction of the obligation. Under certain circumstances, in the event of default or bankruptcy by the other party to the agreement, realization and/or retention of the collateral or proceeds may be subject to legal proceedings. There were no open repurchase agreements at February 28, 2013.
In December 2011, the Financial Accounting Standards Board issued Accounting Standards Update No. 2011-11 (“ASU 2011-11”), “Balance Sheet (Topic 210): Disclosures about Offsetting Assets and Liabilities.” The ASU 2011-11 requires disclosure of both gross and net balances for certain investments and transactions entered into under master netting agreements, better aligning US GAAP requirements with International Financial Reporting Standards. The ASU 2011-11 is effective for annual periods beginning on or after January 1, 2013. The Fund’s management is evaluating the effect of this guidance on the financial statements.
(D) Federal Income Taxes: It is the policy of the Fund to qualify as a regulated investment company by complying with the provisions available to regulated investment companies, as defined in the applicable sections of the Internal Revenue Code, and to distribute all of its investment income and capital gains to its shareholders. Therefore, no provision for federal income tax is required.
16
Value Line U.S. Government Securities Fund, Inc. |
| Notes to Financial Statements (unaudited) |
Management has analyzed the Fund’s tax positions taken on federal and state income tax returns for all open tax years (fiscal years ended August 31, 2009 through August 31, 2012), and has concluded that no provision for federal or state income tax is required in the Fund’s financial statements. The Fund’s federal and state income tax returns for tax years for which the applicable statutes of limitations have not expired are subject to examination by the Internal Revenue Service and state departments of revenue.
(E) Security Transactions and Related Income: Security transactions are accounted for on the date the securities are purchased or sold. Realized gains and losses on securities transactions are determined using the identified cost method. Interest income, adjusted for the amortization of discount and premium, is earned from settlement date and recognized on the accrual basis. Gains and losses realized on prepayments received on mortgage-related securities are recorded as interest income.
The Fund may invest in Treasury Inflation-Protection Securities (TIPS). The principal value and interest payout of TIPS are periodically adjusted according to the rate of inflation based on the Consumer Price Index. The adjustments for principal and income due to inflation are reflected in interest income in the Statement of Operations.
(F) Representations and Indemnifications: In the normal course of business, the Fund enters into contracts that contain a variety of representations and warranties which provide general indemnifications. The Fund’s maximum exposure under these arrangements is unknown, as this would involve future claims that may be made against the Fund that have not yet occurred. However, based on experience, the Fund expects the risk of loss to be remote.
(G) Securities Lending: Under an agreement with State Street Bank & Trust (“State Street”), the Fund can lend its securities to brokers, dealers and other financial institutions approved by the Board of Directors. By lending its investment securities, the Fund attempts to increase its net investment income through receipt of interest on the loan. Any gain or loss in the market price of the securities loaned that might occur and any interest or dividends declared during the term of the loan would accrue to the account of the Fund. Risks of delay in recovery of the securities or even loss of rights in the collateral may occur should the borrower of the securities fail financially. Generally, in the event of a counter-party default, the Fund has the right to use the collateral to offset the losses incurred. The lending fees received and the Fund’s portion of the interest income earned on the cash collateral are included in the Statement of Operations.
Upon entering into a securities lending transaction, the Fund receives cash or other securities as collateral in an amount equal to or exceeding 102% of the current market value of the loaned securities. Any cash received as collateral is invested by State Street Global Advisors, acting in its capacity as securities lending agent (the “Agent”), in The Value Line Funds collateral account, which is subsequently invested into joint repurchase agreements. A portion of the dividends received on the collateral is rebated to the borrower of the securities and the remainder is split between the Agent and the Fund.
The Fund enters into joint repurchase agreements whereby its uninvested cash collateral from securities lending is deposited into a joint cash account with other funds managed by the investment adviser and is used to invest in one or more repurchase agreements. The value and face amount of the joint repurchase agreement are allocated to the funds based on their pro-rata interest. A repurchase agreement is accounted for as a loan by the fund to the seller, collateralized by securities which are delivered to the fund’s custodian. The market value, including accrued interest, of the initial collateralization is required to be at least 102% of the dollar amount invested by the funds, with the value of the underlying securities marked to market daily to maintain coverage of at least 100%. There were no open joint repurchase agreements at February 28, 2013.
17
| Value Line U.S. Government Securities Fund, Inc. |
| February 28, 2013 |
The Fund did participate in securities lending throughout the period. However, as of February 28, 2013, the Fund did not have any securities on loan.
(H) Other: On December 13, 2012, subject to shareholders approval, the Board of Directors of the Fund approved an agreement and plan of Reorganization pursuant to which the Fund’s shareholders would become shareholders of the Value Line Core Bond Fund. At a special shareholder’s meeting held on March 21, 2013, the Funds’ shareholders approved the proposal to merge the Value Line U.S. Government Securities Fund, Inc. into the Value Line Core Bond Fund. Effective March 22, 2013, each share of the Value Line U.S. Government Securities Fund, Inc. was exchanged for 2.29115793620 shares of the Value Line Core Bond Fund.
(I) Subsequent Events: Management has evaluated all subsequent transactions and events through the date on which these financial statements were issued and has determined that no additional items require disclosure.
2. Investment Risks
Securities issued by U.S. Government agencies or government-sponsored enterprises may not be guaranteed by the U.S. Treasury. The Government National Mortgage Association (“GNMA” or “Ginnie Mae”), a wholly-owned U.S. Government corporation, is authorized to guarantee, with the full faith and credit of the U.S. Government, the timely payment of principal and interest on securities issued by institutions approved by GNMA and backed by pools of mortgages insured by the Federal Housing Administration or guaranteed by the Department of Veteran Affairs. Government-related guarantors (i.e., not backed by the full faith and credit of the U.S. Government) include the Federal National Mortgage Association (“FNMA” or “Fannie Mae”) and the Federal Home Loan Mortgage Corporation (“FHLMC” or “Freddie Mac”). Pass-through securities issued by FNMA are guaranteed as to timely payment of principal and interest by FNMA, but are not backed by the full faith and credit of the U.S. Government. FHLMC guarantees the timely payment of interest and ultimate collection of principal, but its participation certificates are not backed by the full faith and credit of the U.S. Government.
3. Capital Share Transactions and Dividends to Shareholders
Transactions in capital stock were as follows:
Six Months Ended February 28, 2013 (unaudited) | Year Ended August 31, 2012 | |||||||
| Shares sold | 94,067 | 279,080 | ||||||
| Shares issued to shareholders in reinvestment of dividends and distributions | 135,193 | 261,601 | ||||||
| Shares redeemed | (525,661 | ) | (625,941 | ) | ||||
| Net decrease | (296,401 | ) | (85,260 | ) | ||||
| Dividends per share from net investment income | $ | 0.0661 | $ | 0.2815 | ||||
| Distributions per share from net realized gains | $ | 0.2099 | $ | 0.2556 | ||||
Dividends and distributions to shareholders are recorded on the ex-dividend date.
18
| Value Line U.S. Government Securities Fund, Inc. |
| Notes to Financial Statements (unaudited) |
4. Purchases and Sales of Securities
Purchases and sales of investment securities, excluding short-term securities, were as follows:
Six Months Ended February 28, 2013 (unaudited) | ||||
| Purchases: | ||||
| U.S. Treasury & Government Agency Obligations | $ | 25,782,408 | ||
| Other Investment Securities | 1,519,427 | |||
| Total Purchases | $ | 27,301,835 | ||
| Sales: | ||||
| U.S. Treasury & Government Agency Obligations | $ | 27,164,222 | ||
| Other Investment Securities | — | |||
| Total Sales | $ | 27,164,222 | ||
5. Income Taxes
At February 28, 2013, information on the tax components of capital is as follows:
| Cost of investments for tax purposes | $ | 69,560,642 | ||
| Gross tax unrealized appreciation | $ | 2,375,774 | ||
| Gross tax unrealized depreciation | (130,816 | ) | ||
| Net tax unrealized appreciation on investments | $ | 2,244,958 |
6. Investment Advisory Fees, Service and Distribution Fees and Transactions With Affiliates
An advisory fee of $193,276 was paid or payable to EULAV Asset Management (the “Adviser”) for the six months ended February 28, 2013. This was computed at the rate of 0.50% of the Fund’s average daily net assets during the period and paid monthly. The Adviser provides research, investment programs, supervision of the investment portfolio and pays costs of administrative services, office space, equipment and compensation of administrative, bookkeeping, and clerical personnel necessary for managing the affairs of the Fund. The Adviser also provides persons, satisfactory to the Fund’s Board of Directors, to act as officers and employees of the Fund and pays their salaries.
The Fund has a Service and Distribution Plan (the “Plan”), adopted pursuant to Rule 12b-1 under the Investment Company Act of 1940, which compensates EULAV Securities LLC (the “Distributor”) for advertising, marketing and distributing the Fund’s shares and for servicing the Fund’s shareholders at an annual rate of 0.25% of the Fund’s average daily net assets. For the six months ended February 28, 2013, fees amounting to $96,638, before fee waivers, were accrued under the Plan. Effective January 1, 2009, and renewed annually, the Distributor contractually agreed to waive the 12b-1 fee. For the six months ended February 28, 2013, all 12b-1 fees were waived. The Distributor has no right to recoup previously waived amounts.
For the six months ended February 28, 2013, the Fund’s expenses were reduced by $67 under a custody credit arrangement with the custodian.
Direct expenses of the Fund are charged to the Fund while common expenses of the Value Line Funds are allocated proportionately based upon the Funds’ respective net assets. The Fund bears all other costs and expenses.
Certain officers and Trustee of the Adviser are also officers and a director of the Fund. At February 28, 2013, the officers and Director of the Fund as a group owned less than 1% of the outstanding shares.
| Value Line U.S. Government Securities Fund, Inc. |
| Financial Highlights |
Selected data for a share of capital stock outstanding throughout each period:
| Six Months Ended | ||||||||||||||||||||||
| February 28, 2013 | Years Ended August 31, | |||||||||||||||||||||
| (unaudited) | 2012 | 2011 | 2010 | 2009 | 2008 | |||||||||||||||||
| Net asset value, beginning of period | $ | 12.20 | $ | 12.34 | $ | 12.41 | $ | 12.06 | $ | 11.62 | $ | 11.42 | ||||||||||
| Income from investment operations: | ||||||||||||||||||||||
| Net investment income | 0.07 | 0.24 | 0.28 | 0.35 | 0.40 | 0.46 | ||||||||||||||||
| Net gains or (losses) on securities (both realized and unrealized) | (0.16 | ) | 0.16 | 0.15 | 0.44 | 0.45 | 0.24 | |||||||||||||||
| Total from investment operations | (0.09 | ) | 0.40 | 0.43 | 0.79 | 0.85 | 0.70 | |||||||||||||||
| Less distributions: | ||||||||||||||||||||||
| Dividends from net investment income | (0.07 | ) | (0.28 | ) | (0.32 | ) | (0.36 | ) | (0.41 | ) | (0.50 | ) | ||||||||||
| Distributions from net realized gains | (0.21 | ) | (0.26 | ) | (0.18 | ) | (0.08 | ) | — | — | ||||||||||||
| Total distributions | (0.28 | ) | (0.54 | ) | (0.50 | ) | (0.44 | ) | (0.41 | ) | (0.50 | ) | ||||||||||
| Net asset value, end of period | $ | 11.83 | $ | 12.20 | $ | 12.34 | $ | 12.41 | $ | 12.06 | $ | 11.62 | ||||||||||
| Total return | (0.78 | )%(1) | 3.32 | % | 3.65 | % | 6.69 | % | 7.46 | % | 6.22 | % | ||||||||||
| Ratios/Supplemental Data: | ||||||||||||||||||||||
| Net assets, end of period (in thousands) | $ | 74,496 | $ | 80,455 | $ | 82,411 | $ | 87,426 | $ | 89,609 | $ | 87,919 | ||||||||||
Ratio of expenses to average net assets(2) | 1.38 | %(3) | 1.12 | % | 1.09 | % | 1.03 | %(4) | 1.07 | % | 1.01 | % | ||||||||||
Ratio of expenses to average net assets(5) | 1.13 | %(3) | 0.87 | % | 0.84 | % | 0.77 | %(6) | 0.82 | % | 0.76 | % | ||||||||||
| Ratio of net investment income to average net assets | 1.16 | %(3) | 1.94 | % | 2.31 | % | 2.87 | % | 3.37 | % | 3.96 | % | ||||||||||
| Portfolio turnover rate | 36 | %(1) | 103 | % | 71 | % | 50 | % | 58 | % | 51 | % | ||||||||||
| (1) | Not annualized. |
| (2) | Ratio reflects expenses grossed up for the custody credit arrangement and grossed up for the waiver of the service and distribution plan fees by the Distributor. The ratio of expenses to average net assets net of custody credits, but exclusive of the fee waivers, would have been 1.00% for the year ended August 31, 2008, and would have been unchanged for the other years shown. |
| (3) | Annualized. |
| (4) | Ratio reflects expenses grossed up for the reimbursement by Value Line, Inc. of certain expenses incurred by the Fund. |
| (5) | Ratio reflects expenses net of the custody credit arrangement and net of the waiver of service and distribution plan fees by the Distributor. |
| (6) | Ratio reflects expenses net of the reimbursement by Value Line, Inc. of certain expenses incurred by the Fund. |
See Notes to Financial Statements.
| Value Line U.S. Government Securities Fund, Inc. |
PROXY RESULTS
FOR
VALUE LINE U.S. GOVERNMENT SECURITIES FUND, INC.
A Special Meeting of Shareholders was held on March 21, 2013 for shareholders to approve an Agreement and Plan of Reorganization between the Fund and the Value Line Core Bond Fund (the “Acquiring Fund”) providing for; (a) the acquisition of all the assets, and assumption of all of the liabilities, of the Fund by the Acquiring Fund, in exchange for shares of the Acquiring Fund; (b) the distribution of such shares of the Acquiring Fund to the shareholders of the Fund; and (c) the liquidation and dissolution of the Fund.
| VOTES FOR | VOTES AGAINST | VOTES ABSTAINING | ||
| 3,173,223 | 403,278 | 244,539 |
| Value Line U.S. Government Securities Fund, Inc. |
The Fund files its complete schedule of portfolio holdings with the Securities and Exchange Commission (“SEC”) for the first and third quarters of each fiscal year on Form N-Q. The Fund’s Forms N-Q are available on the SEC’s website at http://www.sec.gov and may be reviewed and copied at the SEC’s Public Reference Room in Washington, D.C. Information on the operation of the Public Reference Room may be obtained by calling 1-800-SEC-0330.
A description of the policies and procedures that the Fund uses to determine how to vote proxies relating to portfolio securities, and information regarding how the Fund voted these proxies for the 12-month period ended June 30 is available through the Fund’s website at http://www.vlfunds.com and on the SEC’s website at http://www.sec.gov. The description of the policies and procedures is also available without charge, upon request, by calling 1-800-243-2729.
22
Value Line U.S. Government Securities Fund, Inc.
| Management of the Fund |
MANAGEMENT INFORMATION
The business and affairs of the Fund are managed by the Fund’s officers under the direction of the Board of Directors. The following table sets forth information on each Director and Officer of the Fund. Each Director serves as a director or trustee of each of the 10 Value Line Funds. Each Director serves until his or her successor is elected and qualified.
| Length of | Principal Occupation | |||||
| Name, Address, and YOB | Position | Time Served | During the Past 5 Years | |||
| Interested Director* | ||||||
Mitchell E. Appel YOB: 1970 Other Directorships: None | Director | Since 2010 | President of each of the Value Line Funds since June 2008; Chief Financial Officer of Value Line, Inc. (“Value Line”) from April 2008 to December 2010 and from September 2005 to November 2007; Director from February 2010 to December 2010; Chief Financial Officer of XTF Asset Management from November 2007 to April 2008; Chief Financial Officer of the Distributor since April 2008 and President since February 2009; President of the Adviser since February 2009, Trustee since December 2010 and Treasurer since January 2011. | |||
| Non-Interested Directors | ||||||
Joyce E. Heinzerling 500 East 77th Street New York, NY 10162 YOB: 1956 Other Directorships: Burnham Investors Trust, since 2004 (4 funds) | Director | Since 2008 | President, Meridian Fund Advisers LLC. (consultants) since April 2009; General Counsel, Archery Capital LLC (private investment fund) until April 2009. | |||
Francis C. Oakley 54 Scott Hill Road Williamstown, MA 01267 YOB: 1931 Other Directorships: None | Director | Since 2000 | Professor of History, Williams College, (1961-2002). Professor Emeritus since 2002; President Emeritus since 1994 and President, (1985-1994); Chairman (1993-1997) and Interim President (2002-2003) of the American Council of Learned Societies. Trustee since 1997 and Chairman of the Board since 2005, National Humanities Center. | |||
David H. Porter 5 Birch Run Drive Saratoga Springs, NY 12866 YOB: 1935 Other Directorships: None | Director | �� | Since 1997 | Professor, Skidmore College since 2008; Visiting Professor of Classics, Williams College, (1999-2008); President Emeritus, Skidmore College since 1999 and President, (1987-1998). | ||
Paul Craig Roberts 169 Pompano St. Panama City Beach, FL 32413 YOB: 1939 Other Directorships: None | Director | Since 1983 | Chairman, Institute for Political Economy. |
Value Line U.S. Government Securities Fund, Inc.
| Management of the Fund |
| Name, Address, and YOB | Position | Length of Time Served | Principal Occupation During the Past 5 Years | |||
Nancy-Beth Sheerr 1409 Beaumont Drive Gladwyne, PA 19035 YOB: 1949 Other Directorships: None | Director | Since 1996 | Senior Financial Adviser Veritable L.P. (Investment Adviser). | |||
Daniel S. Vandivort 59 Indian Head Road Riverside, CT 06878 YOB: 1954 Other Directorships: None | Director (Chairman of Board Since 2010) | Since 2008 | President, Chief Investment Officer, Weiss, Peck and Greer/Robeco Investment Management (2005-2007); Managing Director, Weiss, Peck and Greer, (1995-2005). | |||
| Officers | ||||||
Mitchell E. Appel YOB: 1970 | President | Since 2008 | President of each of the Value Line Funds since June 2008; Chief Financial Officer of Value Line from April 2008 to December 2010 and from September 2005 to November 2007; Director from February 2010 to December 2010; Chief Financial Officer of XTF Asset Management from November 2007 to April 2008; Chief Financial Officer of the Distributor since April 2008 and President since February 2009; President of the Adviser since February 2009, Trustee since December 2010 and Treasurer since January 2011. | |||
Michael J. Wagner YOB: 1950 | Chief Compliance Officer | Since 2009 | Chief Compliance Officer of Value Line Funds since June 2009; President of Northern Lights Compliance Service, LLC (formerly Fund Compliance Services, LLC (2006 – present)) and Senior Vice President (2004 – 2006) and President and Chief Operations Officer (2003 – 2006) of Gemini Fund Services, LLC; Director of Constellation Trust Company until 2008. | |||
Emily D. Washington YOB: 1979 | Treasurer and Secretary | Since 2008 | Treasurer and Chief Financial Officer (Principal Financial and Accounting Officer) of each of the Value Line Funds since August 2008 and Secretary since 2010; Associate Director of Mutual Fund Accounting at Value Line until August 2008. |
| * | Mr. Appel is an “interested person” as defined in the Investment Company Act of 1940 by virtue of his position with the Adviser and Distributor. |
Unless otherwise indicated, the address for each of the above officers is c/o Value Line Funds, 7 Times Square, New York, NY 10036.
The Fund’s Statement of Additional Information (SAI) includes additional information about the Fund’s Directors and is available, without charge, upon request by calling 1-800-243-2729 or on the Fund’s website, www.vlfunds.com. |
Value Line U.S. Government Securities Fund, Inc.
[This Page Intentionally Left Blank.]
Value Line U.S. Government Securities Fund, Inc.
[This Page Intentionally Left Blank.]
Value Line U.S. Government Securities Fund, Inc.
[This Page Intentionally Left Blank.]
Value Line U.S. Government Securities Fund, Inc.
The Value Line Family of Funds |
In 1950, Value Line started its first mutual fund. Since then, knowledgeable investors have been relying on the Value Line Funds to help them build their financial futures. Over the years, Value Line Funds has evolved into what we are today — a diversified family of no-load mutual funds with a wide range of investment objectives — ranging from small, mid and large capitalization equities to taxable and tax-exempt fixed income. We also provide strategies that effectively combine both equities and fixed income, diligently taking into account the potential risk and reward of each investment.
1950 — The Value Line Fund seeks long-term growth of capital. Current income is a secondary objective.
1952 — Value Line Income and Growth Fund’s primary investment objective is income, as high and dependable as is consistent with reasonable risk. Capital growth to increase total return is a secondary objective.
1956 — Value Line Premier Growth Fund seeks long-term growth of capital. No consideration is given to current income in the choice of investments.
1972 — Value Line Larger Companies Fund’s sole investment objective is to realize capital growth.
1983 — Value Line Centurion Fund* seeks long-term growth of capital.
1984 — The Value Line Tax Exempt Fund seeks to provide investors with the maximum income exempt from federal income taxes while avoiding undue risk to principal. The fund may be subject to state and local taxes and the Alternative Minimum Tax (if applicable).
1986 — Value Line Core Bond Fund** seeks to maximize current income.
1987 — Value Line Strategic Asset Management Trust* seeks to achieve a high total investment return consistent with reasonable risk.
1993 — Value Line Small Cap Opportunities Fund*** invests in U.S. common stocks of small capitalization companies, with its primary objective being long-term growth of capital.
1993 — Value Line Asset Allocation Fund seeks high total investment return, consistent with reasonable risk. The Fund invests in stocks, bonds and money market instruments utilizing quantitative modeling to determine the asset mix.
| * | Only available through the purchase of Guardian Investor, a tax deferred variable annuity, or ValuePlus, a variable life insurance policy. |
| ** | Formerly known as the Value Line Aggressive Income Trust. |
| *** | Formerly known as the Value Line Emerging Opportunities Fund, Inc. |
For more complete information about any of the Value Line Funds, including charges and expenses, send for a prospectus from EULAV Securities LLC, 7 Times Square, New York, New York 10036-6524 or call 1-800-243-2729, 9am–5pm CST, Monday–Friday, or visit us at www.vlfunds.com. Read the prospectus carefully before you invest or send money.
Item 11. Controls and Procedures.
| (a) | The registrant’s principal executive officer and principal financial officer have concluded that the registrant’s disclosure controls and procedures (as defined in rule 30a-2(c) under the Act (17 CFR 270.30a-2(c) ) based on their evaluation of these controls and procedures as of a date within 90 days of the filing date of this report, are appropriately designed to ensure that material information relating to the registrant is made known to such officers and are operating effectively. |
| (b) | The registrant’s principal executive officer and principal financial officer have determined that there have been no significant changes in the registrant’s internal controls or in other factors that could significantly affect these controls subsequent to the date of their evaluation, including corrective actions with regard to significant deficiencies and material weaknesses. |
Item 12. Exhibits.
| (a) | (1) Certification pursuant to Rule 30a-2(a) under the Investment Company Act of 1940 (17 CFR 270.30a-2) attached hereto as Exhibit 99.CERT. |
(2) Certification pursuant to Section 906 of the Sarbanes-Oxley Act of 2002
attached hereto as Exhibit 99.906.CERT.
SIGNATURES
Pursuant to the requirements of the Securities Exchange Act of 1934 and the Investment Company Act of 1940, the registrant has duly caused this report to be signed on its behalf by the undersigned, thereunto duly authorized.
| By | /s/ Mitchell E. Appel | ||
| Mitchell E. Appel, President | |||
| Date: | May 3, 2013 | ||
Pursuant to the requirements of the Securities Exchange Act of 1934 and the Investment Company Act of 1940, this report has been signed below by the following persons on behalf of the registrant and in the capacities and on the dates indicated.
| By: | /s/ Mitchell E. Appel | ||
| Mitchell E. Appel, President, Principal Executive Officer | |||
| By: | /s/ Emily D. Washington | ||
| Emily D. Washington, Treasurer, Principal Financial Officer | |||
| Date: | May 3, 2013 | ||