UNITED STATES
SECURITIES AND EXCHANGE COMMISSION
Washington, D.C. 20549
FORM N-CSR
CERTIFIED SHAREHOLDER REPORT OF REGISTERED
MANAGEMENT INVESTMENT COMPANIES
Investment Company Act file Number 811-03171
Value Line U.S. Government Securities Fund, Inc.
(Exact name of registrant as specified in charter)
7 Times Square,21st Floor, New York, N.Y. 10036-6524
(Address of principal executive offices) (Zip Code)
Registrant’s telephone number, including area code: 212-907-1900
Date of fiscal year end: August 31, 2012
Date of reporting period: February 29, 2012
Item I. Reports to Stockholders.
A copy of the Semi-Annual Report to Stockholders for the period ended 2/29/12 is included with this Form.
INVESTMENT ADVISER | EULAV Asset Management | S E M I - A N N U A L R E P O R T | ||||
7 Times Square 21st Floor | F e b r u a r y 2 9 , 2 0 1 2 | |||||
| New York, NY 10036-6524 | ||||||
| DISTRIBUTOR | EULAV Securities LLC 7 Times Square 21st Floor New York, NY 10036-6524 | Value Line U.S. Government Securities Fund, Inc. | ||||
| CUSTODIAN BANK | State Street Bank and Trust Co. 225 Franklin Street Boston, MA 02110 | |||||
SHAREHOLDER SERVICING AGENT | State Street Bank and Trust Co. | |||||
c/o BFDS P.O. Box 219729 Kansas City, MO 64121-9729 | ||||||
INDEPENDENT REGISTERED PUBLIC ACCOUNTING FIRM | PricewaterhouseCoopers LLP 300 Madison Avenue New York, NY 10017 | |||||
| LEGAL COUNSEL | Peter D. Lowenstein, Esq. 496 Valley Road Cos Cob, CT 06807-0272 | |||||
| DIRECTORS | Mitchell E. Appel Joyce E. Heinzerling Francis C. Oakley David H. Porter Paul Craig Roberts Nancy-Beth Sheerr Daniel S. Vandivort | |||||
| OFFICERS | Mitchell E. Appel President Michael J. Wagner Chief Compliance Officer Emily D. Washington Treasurer and Secretary | |||||
 | ||||||
| This unaudited report is issued for information to shareholders. It is not authorized for distribution to prospective investors unless preceded or accompanied by a currently effective prospectus of the Fund (obtainable from the Distributor). | ||||||
| #00084301 | ||||||
| Value Line U.S. Government Securities Fund, Inc. | |
| To Our Value Line U.S. Government |
To Our Shareholders (unaudited):
Enclosed is your semi-annual report for the period ended February 29, 2012. I encourage you to carefully review this report, which includes economic observations, your Fund’s performance data and highlights, schedule of investments, and financial statements.
For the six-month period that ended on February 29, 2012, bond prices rose and interest rates fell among both short and long-term maturities. Interest rates dropped in response to the sovereign debt and banking crisis within the European Union, which threatened the stability of the global economy. Even though U.S economic growth was on an improving path, investors were worried the European crisis would short circuit the U.S. recovery, as well as growth within Asia and South America.
For the period your Fund gained 1.33% lagging its benchmark, Barclays 50% Government/ 50% Mortgage Index, which gained 1.87%(1). During the period intermediate interest rates reached their lowest levels ever, with the 10-year Treasury note falling below 2.00%, reaching a low point of 1.79%. We had felt yields were very unattractive, providing almost a negative return after inflation was factored out. We believed that interest rates could not sustain these levels and would rise modestly, exerting some downward pressure on bond prices. Therefore, we kept the risk of the Fund slightly less than its index benchmark. However, rates remained extremely low and therefore we did not gain as much ground as our Index. By February of 2012, interest rates did show signs of trending higher as they rose above 2.00%, as the debt and banking crisis within Europe became more stable.
Going forward we believe interest rates will trend higher than the extremely low levels, which characterized the recent six-month period. However, we do not expect rates to rise significantly. Continued uncertainty surrounding the problems within the European Union and the slow growth pattern of the U.S., will keep rates low and cause the Federal Reserve Board to maintain its accommodative monetary policy.
We will continue to maintain our strategy of investing the Fund’s assets in a well-diversified highly rated portfolio of U.S. Treasuries, U.S. government agencies and mortgage-backed securities issued by U.S. government agencies. Additionally, by limiting the average maturity to no more than ten years, we provide a counterweight against gyrating interest rates.
Thank you for your confidence in the Fund and we appreciate your continued support.
| Sincerely, | |
| /s/ Mitchell Appel | |
| Mitchell Appel, President | |
| /s/ Jeff Geffen | |
| Jeff Geffen, Senior Portfolio Manager |
March 29, 2012
| (1) | The Barclays 50% Government/50% Mortgage Index represents the intermediate maturities (1-10 years) of the U.S. Treasury and U.S. Agency segment of the fixed-income market. The returns for the Index do not reflect charges, expenses, or taxes, and it is not possible to directly invest in this Index. |
Past performance does not guarantee future results. Investment return and principal value of an investment can fluctuate so that an investor’s shares, when redeemed, may be worth more or less than their original cost; and that current performance may be lower or higher than the performance data quoted. Investors should carefully consider the investment objectives, risks, charges and expense of a fund. This and other important information about a fund is contained in the fund’s prospectus. A copy of our funds’ prospectus can be obtained by going to our website at www.vlfunds.com or calling 800.243-2729. |
2
Value Line U.S. Government Securities Fund, Inc.
| Securities Fund Shareholders |
Economic Highlights (unaudited)
The first half of 2011 saw the broad U.S. stock market rising on the heels of strengthening corporate profits. The S&P 500 returned 6% for the first six months of the year despite significant global economic concerns. Several members of the European Union continued to face a serious debt crisis including Greece, Portugal, Ireland, and Spain. Further, the nuclear disaster in Japan and the geopolitical upheaval in commodity markets added to investor concerns. At home, disappointing job growth in the United States kept the national unemployment rate firmly above 9% for the second quarter.
By mid-year there was mounting evidence that the U.S. recovery had slowed to a crawl. Consumer spending, which accounts for roughly 70% of economic activity, declined in June for the first time in 2 years. First quarter GDP was up by only 0.4%, and second quarter GDP growth, while stronger, was still disappointing at 1.3%. Employment growth in July lagged June numbers, and it was reported that the level of new factory orders decreased. By August, only 58% of the population was working, the lowest level in nearly 3 decades. Housing prices remained almost uniformly weak. There were additional pressures on the market coming from Europe stemming from the sovereign debt crisis and increasing fears of a double dip recession.
Much of the summer was consumed by the drama of the U.S. debt ceiling negotiations, resulting in an 11th hour deal that appeared to satisfy few constituents. It surely did not satisfy Standard & Poors who felt that the $2.1 trillion deficit reduction over 10 years was insufficient to solve the country’s debt problem. The rating agency proceeded to downgrade U.S. Treasury debt from AAA to AA+. Within a few days the rating agency imposed the same rating cut on the long-term debt of several U.S. Agencies including Fannie Mae and Freddie Mac. The other major rating agencies, Moody’s and Fitch, maintained AAA ratings for U.S. Treasury debt as well as for the U.S. Agencies. Investor confidence plunged on the heels of the debt ceiling debacle and the U.S. Treasury debt downgrade. Returns for the S&P 500 turned negative in August giving up its returns for the year.
The bond market rallied as stocks took a dive. Yields fell and prices rose across fixed income markets as investors looked for safer havens. Despite the rating downgrade, investor demand for Treasuries soared, and by early September, 10-year Treasury note yields had fallen to an all-time low of 1.90%. This downward pressure on Treasury yields came largely from an employment report showing no new jobs being added in August. While modestly better job creation was reported in September, it was not enough to move the unemployment level below 9.1%.
The market posted a strong rally in the final quarter of 2011. Investors increased their purchase of risk assets as news regarding progress in the European debt crisis began to emerge and U.S. economic data came in slightly better than expected. The S&P 500 Index closed out the year with a gain of 2.1%. This positive momentum followed the markets into the new year. An improving job market, rising stock prices, and housing starts near a 3-year high are combing to add lift to the U.S. economy.
3
| Value Line U.S. Government Securities Fund, Inc. |
FUND EXPENSES (unaudited):
Example
As a shareholder of the Fund, you incur ongoing costs, including management fees, distribution and service (12b-1) fees, and other Fund expenses. This Example is intended to help you understand your ongoing costs (in dollars) of investing in the Fund and to compare these costs with the ongoing costs of investing in other mutual funds.
The Example is based on an investment of $1,000 invested at the beginning of the period and held for the entire period (September 1, 2011 through February 29, 2012).
Actual Expenses
The first line of the table below provides information about actual account values and actual expenses. You may use the information in this line, together with the amount you invested, to estimate the expenses that you paid over the period. Simply divide your account value by $1,000 (for example an $8,600 account value divided by $1,000 = 8.6), then multiply the result by the number in the first line under the heading “Expenses Paid During Period” to estimate the expenses you paid on your account during this period.
Hypothetical Example for Comparison Purposes
The second line of the table below provides information about hypothetical account values and hypothetical expenses based on the Fund’s actual expense ratio and an assumed rate of return of 5% per year before expenses, which is not the Fund’s actual return. The hypothetical account values and expenses may not be used to estimate the actual ending account balance or expenses you paid for the period. You may use this information to compare the ongoing costs of investing in the Fund and other funds. To do so, compare this 5% hypothetical example with the 5% hypothetical examples that appear in the shareholder reports of other funds.
Please note that the expenses shown in the table are meant to highlight your ongoing costs only and do not reflect any transactional costs, such as sales charges (loads), redemption fees, or exchange fees. Therefore, the table is useful in comparing ongoing costs only and will not help you determine the relative total costs of owning different funds. In addition, if transactional costs were included, your costs would have been higher.
Beginning account value 9/1/11 | Ending account value 2/29/12 | Expenses paid during period 9/1/11 thru 2/29/12* | ||||||||||
| Actual | $ | 1,000.00 | $ | 1,013.32 | $ | 4.25 | ||||||
| Hypothetical (5% return before expenses) | $ | 1,000.00 | $ | 1,020.64 | $ | 4.27 | ||||||
| * | Expenses are equal to the Fund’s annualized expense ratio of 0.85% multiplied by the average account value over the period, multiplied by 182/366 to reflect the one-half year period. This expense ratio may differ from the expense ratio shown in the Financial Highlights. |
4
Value Line U.S. Government Securities Fund, Inc.
| Portfolio Highlights at February 29, 2012 (unaudited) |
| Ten Largest Holdings |
| Issue | Principal Amount | Value | Percentage of Net Assets | |||||||
| U.S. Treasury Notes, 2.25%, 7/31/18 | $ | 3,200,000 | $ | 3,398,250 | 4.2 | % | ||||
| U.S. Treasury Bonds, 7.88%, 2/15/21 | 2,000,000 | 3,029,376 | 3.8 | % | ||||||
| Federal Home Loan Banks, 5.00%, 12/21/15 | 2,000,000 | 2,298,638 | 2.9 | % | ||||||
| U.S. Treasury Notes, 2.38%, 7/31/17 | 2,000,000 | 2,146,250 | 2.7 | % | ||||||
| U.S. Treasury Notes, 3.50%, 5/15/20 | 1,700,000 | 1,946,367 | 2.4 | % | ||||||
| Federal National Mortgage Association, 2.38%, 7/28/15 | 1,500,000 | 1,589,407 | 2.0 | % | ||||||
| Federal National Mortgage Association, 7.25%, 5/15/30 | 1,000,000 | 1,541,622 | 1.9 | % | ||||||
| U.S. Treasury Notes, 3.13%, 5/15/19 | 1,300,000 | 1,451,531 | 1.8 | % | ||||||
| U.S. Treasury Bonds, 6.00%, 2/15/26 | 1,000,000 | 1,420,312 | 1.8 | % | ||||||
| U.S. Treasury Bonds, 6.25%, 8/15/23 | 1,000,000 | 1,419,219 | 1.8 | % | ||||||
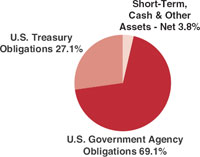
Asset Allocation — Percentage of Fund’s Net Assets
| Coupon Distribution |
Percentage of Fund’s Investments | ||||
| Less than 4% | 32.4 | % | ||
| 4-4.99% | 30.5 | % | ||
| 5-5.99% | 22.8 | % | ||
| 6-6.99% | 6.8 | % | ||
| 7-7.99% | 7.5 | % | ||
5
| Value Line U.S. Government Securities Fund, Inc. | |
| Schedule of Investments (unaudited) | February 29, 2012 |
Principal Amount | Rate | Maturity Date | Value | ||||||||||
| U.S. GOVERNMENT AGENCY OBLIGATIONS (69.1%) | |||||||||||||
| FEDERAL FARM CREDIT BANK (1.2%) | |||||||||||||
| $ | 1,000,000 | Federal Farm Credit Bank | 1.90 | % | 11/15/17 | $ | 997,155 | ||||||
| 1,000,000 | TOTAL FEDERAL FARM CREDIT BANK (Cost $1,000,000) | 997,155 | |||||||||||
| FEDERAL HOME LOAN BANK (5.8%) | |||||||||||||
| 2,000,000 | Federal Home Loan Banks | 5.00 | 12/21/15 | 2,298,638 | |||||||||
| 1,000,000 | Federal Home Loan Banks | 5.13 | 10/19/16 | 1,185,868 | |||||||||
| 1,000,000 | Federal Home Loan Banks | 5.00 | 11/17/17 | 1,205,756 | |||||||||
| 4,000,000 | TOTAL FEDERAL HOME LOAN BANK (Cost $4,273,984) | 4,690,262 | |||||||||||
| FEDERAL HOME LOAN MORTGAGE | |||||||||||||
| CORPORATION (25.6%) | |||||||||||||
| 378,023 | Federal Home Loan Mortgage Corporation REMIC Trust Series 2849 Class VA | 5.00 | 8/15/15 | 399,776 | |||||||||
| 1,000,000 | Federal Home Loan Mortgage Corporation | 5.50 | 7/18/16 | 1,198,403 | |||||||||
| 1,000,000 | Federal Home Loan Mortgage Corporation | 2.00 | 8/25/16 | 1,047,257 | |||||||||
| 153,236 | Federal Home Loan Mortgage Corporation REMIC Trust Series 2767 Class CA | 4.00 | 9/15/17 | 154,951 | |||||||||
| 5,672 | Federal Home Loan Mortgage Corporation Gold PC Pool #E92226 | 5.00 | 11/1/17 | 6,120 | |||||||||
| 1,000,000 | Federal Home Loan Mortgage Corporation | 5.13 | 11/17/17 | 1,214,818 | |||||||||
| 80,932 | Federal Home Loan Mortgage Corporation Gold PC Pool #E93499 | 5.00 | 12/1/17 | 87,322 | |||||||||
| 7,147 | Federal Home Loan Mortgage Corporation Gold PC Pool #E92829 | 5.00 | 12/1/17 | 7,711 | |||||||||
| 44,125 | Federal Home Loan Mortgage Corporation REMIC Trust Series 2892 Class DC | 4.50 | 12/15/17 | 44,257 | |||||||||
| 361,103 | Federal Home Loan Mortgage Corporation REMIC Trust Series 2643 Class ME | 3.50 | 3/15/18 | 371,409 | |||||||||
| 8,952 | Federal Home Loan Mortgage Corporation Gold PC Pool #E98960 | 5.00 | 9/1/18 | 9,659 | |||||||||
| 29,972 | Federal Home Loan Mortgage Corporation Gold PC Pool #B12822 | 5.00 | 3/1/19 | 32,442 | |||||||||
| 1,000,000 | Federal Home Loan Mortgage Corporation | 3.75 | 3/27/19 | 1,148,054 | |||||||||
| 18,785 | Federal Home Loan Mortgage Corporation Gold PC Pool #B17398 | 4.50 | 12/1/19 | 20,151 | |||||||||
See Notes to Financial Statements.
6
| Value Line U.S. Government Securities Fund, Inc. |
| Schedule of Investments (unaudited) |
Principal Amount | Rate | Maturity Date | Value | ||||||||||
| $ | 124,054 | Federal Home Loan Mortgage Corporation Gold PC Pool #G18044 | 4.50 | % | 3/1/20 | $ | 132,997 | ||||||
| 77,029 | Federal Home Loan Mortgage Corporation Gold PC Pool #B18034 | 4.50 | 4/1/20 | 82,582 | |||||||||
| 374,043 | Federal Home Loan Mortgage Corporation Gold PC Pool #J12462 | 4.00 | 6/1/20 | 398,782 | |||||||||
| 19,553 | Federal Home Loan Mortgage Corporation Gold PC Pool #J00118 | 5.00 | 10/1/20 | 21,116 | |||||||||
| 354,502 | Federal Home Loan Mortgage Corporation Gold PC Pool #J00139 | 5.00 | 10/1/20 | 382,827 | |||||||||
| 13,996 | Federal Home Loan Mortgage Corporation Gold PC Pool #G11986 | 5.00 | 4/1/21 | 15,093 | |||||||||
| 19,053 | Federal Home Loan Mortgage Corporation Gold PC Pool #G12319 | 5.00 | 6/1/21 | 20,575 | |||||||||
| 902,241 | Federal Home Loan Mortgage Corporation Gold PC Pool #G14216 | 3.50 | 7/1/21 | 950,636 | |||||||||
| 95,846 | Federal Home Loan Mortgage Corporation Gold PC Pool #J03233 | 5.00 | 8/1/21 | 103,354 | |||||||||
| 433,837 | Federal Home Loan Mortgage Corporation Gold PC Pool #G12381 | 5.00 | 9/1/21 | 468,500 | |||||||||
| 57,643 | Federal Home Loan Mortgage Corporation REMIC Trust Series 2773 Class DA | 5.00 | 6/15/22 | 58,066 | |||||||||
| 668,633 | Federal Home Loan Mortgage Corporation Gold PC Pool #G13085 | 4.50 | 4/1/23 | 714,117 | |||||||||
| 269,439 | Federal Home Loan Mortgage Corporation Gold PC Pool #J08096 | 5.00 | 6/1/23 | 289,535 | |||||||||
| 294,132 | Federal Home Loan Mortgage Corporation Gold PC Pool #J08202 | 5.00 | 7/1/23 | 316,071 | |||||||||
| 255,335 | Federal Home Loan Mortgage Corporation Gold PC Pool #J09098 | 5.00 | 12/1/23 | 276,031 | |||||||||
| 68,664 | Federal Home Loan Mortgage Corporation REMIC Trust Series 3132 Class MA | 5.50 | 12/15/23 | 69,430 | |||||||||
| 661,636 | Federal Home Loan Mortgage Corporation Gold PC Pool #J09739 | 4.50 | 5/1/24 | 706,644 | |||||||||
| 81,593 | Federal Home Loan Mortgage Corporation REMIC Trust Series 3147 Class YE | 5.50 | 7/15/24 | 83,137 | |||||||||
| 467,048 | Federal Home Loan Mortgage Corporation Gold PC Pool #J11210 | 4.00 | 11/1/24 | 493,997 | |||||||||
See Notes to Financial Statements.
7
| Value Line U.S. Government Securities Fund, Inc. |
| February 29, 2012 |
Principal Amount | Rate | Maturity Date | Value | ||||||||||
| $ | 735,718 | Federal Home Loan Mortgage Corporation Gold PC Pool #J11587 | 4.00 | % | 1/1/25 | $ | 797,712 | ||||||
| 517,143 | Federal Home Loan Mortgage Corporation Gold PC Pool #G13855 | 4.50 | 6/1/25 | 551,917 | |||||||||
| 176,658 | Federal Home Loan Mortgage Corporation Gold PC Pool #E02704 | 4.50 | 7/1/25 | 188,565 | |||||||||
| 619,693 | Federal Home Loan Mortgage Corporation REMIC Trust Series 3567 Class BJ | 4.50 | 6/15/27 | 660,093 | |||||||||
| 393,627 | Federal Home Loan Mortgage Corporation Gold PC Pool #C91239 | 4.50 | 3/1/29 | 418,677 | |||||||||
| 39,361 | Federal Home Loan Mortgage Corporation REMIC Trust Series 2878 Class AQ | 5.00 | 5/15/31 | 39,420 | |||||||||
| 65,975 | Federal Home Loan Mortgage Corporation REMIC Trust Series 2645 Class NA | 3.50 | 9/15/31 | 67,420 | |||||||||
| 520,904 | Federal Home Loan Mortgage Corporation Gold PC Pool #C77717 | 6.00 | 3/1/33 | 581,226 | |||||||||
| 360,410 | Federal Home Loan Mortgage Corporation Gold PC Pool #A29526 | 5.00 | 1/1/35 | 389,018 | |||||||||
| 97,994 | Federal Home Loan Mortgage Corporation Gold PC Pool #A29633 | 5.00 | 1/1/35 | 105,773 | |||||||||
| 236,213 | Federal Home Loan Mortgage Corporation Pool #783022 (1) | 2.46 | 2/1/35 | 249,911 | |||||||||
| 171,650 | Federal Home Loan Mortgage Corporation Gold PC Pool #A56491 | 5.00 | 1/1/37 | 185,221 | |||||||||
| 137,197 | Federal Home Loan Mortgage Corporation Gold PC Pool #G08184 | 5.00 | 1/1/37 | 148,044 | |||||||||
| 267,662 | Federal Home Loan Mortgage Corporation Gold PC Pool #A56467 | 5.50 | 1/1/37 | 292,014 | |||||||||
| 414,822 | Federal Home Loan Mortgage Corporation Gold PC Pool #A80938 | 5.50 | 8/1/38 | 450,489 | |||||||||
| 1,194,970 | Federal Home Loan Mortgage Corporation REMIC Trust Series 3632 Class AP | 3.00 | 2/15/40 | 1,250,421 | |||||||||
| 921,768 | Federal Home Loan Mortgage Corporation Gold PC Pool #C03516 | 4.00 | 9/1/40 | 968,576 | |||||||||
| 986,124 | Federal Home Loan Mortgage Corporation Gold PC Pool #A95803 | 4.00 | 12/1/40 | 1,046,017 | |||||||||
| 740,175 | Federal Home Loan Mortgage Corporation Gold PC Pool #A97135 | 4.50 | 2/1/41 | 786,816 | |||||||||
See Notes to Financial Statements.
8
| Value Line U.S. Government Securities Fund, Inc. |
| Schedule of Investments (unaudited) |
Principal Amount | Rate | Maturity Date | Value | ||||||||||
| $ | 98,549 | Federal Home Loan Mortgage Corporation Gold PC Pool #Q01181 | 4.50 | % | 6/1/41 | $ | 104,758 | ||||||
| 19,022,837 | TOTAL FEDERAL HOME LOAN MORTGAGE CORPORATION (Cost $19,503,681) | 20,607,908 | |||||||||||
FEDERAL NATIONAL MORTGAGE ASSOCIATION (33.0%) | |||||||||||||
| 1,500,000 | Federal National Mortgage Association | 2.38 | 7/28/15 | 1,589,407 | |||||||||
| 17,889 | Federal National Mortgage Association Pool #511823 | 5.50 | 5/1/16 | 19,489 | |||||||||
| 658,082 | Federal National Mortgage Association REMIC Trust Series 2005-40 Class VG | 4.50 | 6/25/16 | 692,345 | |||||||||
| 15,960 | Federal National Mortgage Association Pool #615289 | 5.50 | 12/1/16 | 17,387 | |||||||||
| 59,035 | Federal National Mortgage Association Pool #622373 | 5.50 | 12/1/16 | 64,315 | |||||||||
| 41,344 | Federal National Mortgage Association Pool #631328 | 5.50 | 2/1/17 | 45,068 | |||||||||
| 64,247 | Federal National Mortgage Association Pool #623503 | 6.00 | 2/1/17 | 69,438 | |||||||||
| 3,028 | Federal National Mortgage Association Pool #643277 | 5.50 | 4/1/17 | 3,301 | |||||||||
| 5,886 | Federal National Mortgage Association Pool #638247 | 5.50 | 5/1/17 | 6,416 | |||||||||
| 94,376 | Federal National Mortgage Association REMIC Trust Series 2003-52 Class KR | 3.50 | 7/25/17 | 95,004 | |||||||||
| 108,315 | Federal National Mortgage Association Pool #254684 | 5.00 | 3/1/18 | 117,222 | |||||||||
| 33,835 | Federal National Mortgage Association Pool #685183 | 5.00 | 3/1/18 | 36,617 | |||||||||
| 46,147 | Federal National Mortgage Association Pool #703936 | 5.00 | 5/1/18 | 49,942 | |||||||||
| 321,025 | Federal National Mortgage Association Pool #257566 | 4.50 | 1/1/19 | 343,686 | |||||||||
| 530,547 | Federal National Mortgage Association Pool #780956 | 4.50 | 5/1/19 | 577,781 | |||||||||
| 172,287 | Federal National Mortgage Association Pool #790984 | 5.00 | 7/1/19 | 186,481 | |||||||||
| 203,223 | Federal National Mortgage Association Pool #786915 | 5.00 | 8/1/19 | 221,141 | |||||||||
| 448,167 | Federal National Mortgage Association Pool #735063 | 4.50 | 12/1/19 | 481,484 | |||||||||
| 36,643 | Federal National Mortgage Association REMIC Trust Series 2003-28 Class KA | 4.25 | 3/25/22 | 37,004 | |||||||||
| 184,321 | Federal National Mortgage Association REMIC Trust Series 2003-17 Class ED | 4.25 | 9/25/22 | 189,693 | |||||||||
| 977,634 | Federal National Mortgage Association Pool #890121 | 5.00 | 3/1/23 | 1,057,721 | |||||||||
| 101,485 | Federal National Mortgage Association REMIC Trust Series 2003-38 Class TC | 5.00 | 3/25/23 | 107,470 | |||||||||
| 667,388 | Federal National Mortgage Association Pool #AH8061 | 4.00 | 6/1/26 | 708,504 | |||||||||
| 964,670 | Federal National Mortgage Association Pool #AI3053 | 4.00 | 7/1/26 | 1,024,101 | |||||||||
| 56,759 | Federal National Mortgage Association Pool #412682 | 6.00 | 3/1/28 | 63,332 | |||||||||
| 70,579 | Federal National Mortgage Association Pool #425239 | 6.50 | 4/1/28 | 80,881 | |||||||||
| 1,000,000 | Federal National Mortgage Association | 7.25 | 5/15/30 | 1,541,622 | |||||||||
See Notes to Financial Statements.
9
| Value Line U.S. Government Securities Fund, Inc. | |
| February 29, 2012 |
Principal Amount | Rate | Maturity Date | Value | ||||||||||
| $ | 576 | Federal National Mortgage Association Pool #568625 | 7.50 | % | 1/1/31 | $ | 636 | ||||||
| 32,202 | Federal National Mortgage Association Pool #571090 | 7.50 | 1/1/31 | 33,019 | |||||||||
| 905,721 | Federal National Mortgage Association Pool #MA0641 | 4.00 | 2/1/31 | 960,590 | |||||||||
| 1,767 | Federal National Mortgage Association Pool #573935 | 7.50 | 3/1/31 | 1,906 | |||||||||
| 886,073 | Federal National Mortgage Association Pool #MA0804 | 4.00 | 7/1/31 | 939,752 | |||||||||
| 511,733 | Federal National Mortgage Association Pool #MA3894 | 4.00 | 9/1/31 | 542,734 | |||||||||
| 7,448 | Federal National Mortgage Association Pool #629297 | 6.50 | 2/1/32 | 8,498 | |||||||||
| 311,984 | Federal National Mortgage Association Pool #626440 | 7.50 | 2/1/32 | 375,995 | |||||||||
| 25,189 | Federal National Mortgage Association Pool #634996 | 6.50 | 5/1/32 | 28,739 | |||||||||
| 31,303 | Federal National Mortgage Association Pool #254383 | 7.50 | 6/1/32 | 37,774 | |||||||||
| 107,529 | Federal National Mortgage Association Pool #254476 | 5.50 | 9/1/32 | 117,497 | |||||||||
| 4,004 | Federal National Mortgage Association Pool #688539 | 5.50 | 3/1/33 | 4,375 | |||||||||
| 243,922 | Federal National Mortgage Association Pool #650386 | 5.00 | 7/1/33 | 263,709 | |||||||||
| 134,649 | Federal National Mortgage Association Pool #726889 | 5.50 | 7/1/33 | 147,132 | |||||||||
| 144,325 | Federal National Mortgage Association Pool #759028 | 5.50 | 1/1/34 | 157,704 | |||||||||
| 148,751 | Federal National Mortgage Association Pool #761913 | 5.50 | 2/1/34 | 162,773 | |||||||||
| 121,890 | Federal National Mortgage Association Pool #763393 | 5.50 | 2/1/34 | 133,189 | |||||||||
| 112,223 | Federal National Mortgage Association Pool #769862 | 5.50 | 2/1/34 | 122,591 | |||||||||
| 11,850 | Federal National Mortgage Association Pool #769682 | 5.00 | 3/1/34 | 12,811 | |||||||||
| 433,576 | Federal National Mortgage Association REMIC Trust Series 2004-60 Class LB | 5.00 | 4/25/34 | 480,542 | |||||||||
| 7,340 | Federal National Mortgage Association Pool #778141 | 5.00 | 5/1/34 | 7,936 | |||||||||
| 158,167 | Federal National Mortgage Association Pool #773586 | 5.50 | 6/1/34 | 172,780 | |||||||||
| 199,387 | Federal National Mortgage Association Pool #255311 | 6.00 | 7/1/34 | 221,075 | |||||||||
| 7,592 | Federal National Mortgage Association Pool #258149 | 5.50 | 9/1/34 | 8,310 | |||||||||
| 1,558 | Federal National Mortgage Association Pool #789150 | 5.00 | 10/1/34 | 1,685 | |||||||||
| 270,587 | Federal National Mortgage Association Pool #255496 | 5.00 | 11/1/34 | 292,536 | |||||||||
| 29,094 | Federal National Mortgage Association Pool #797154 | 5.50 | 11/1/34 | 31,982 | |||||||||
| 69,728 | Federal National Mortgage Association Pool #801063 | 5.50 | 11/1/34 | 76,171 | |||||||||
| 77,399 | Federal National Mortgage Association Pool #803675 | 5.50 | 12/1/34 | 84,550 | |||||||||
| 110,296 | Federal National Mortgage Association Pool #804683 | 5.50 | 12/1/34 | 120,486 | |||||||||
| 304,483 | Federal National Mortgage Association Pool #815813 (1) | 2.50 | 2/1/35 | 321,815 | |||||||||
| 20,019 | Federal National Mortgage Association Pool #255580 | 5.50 | 2/1/35 | 21,869 | |||||||||
| 247,351 | Federal National Mortgage Association Pool #735224 | 5.50 | 2/1/35 | 270,280 | |||||||||
| 240,581 | Federal National Mortgage Association Pool #896016 | 6.00 | 8/1/36 | 265,133 | |||||||||
| 219,661 | Federal National Mortgage Association Pool #901561 | 5.50 | 10/1/36 | 239,544 | |||||||||
| 481,460 | Federal National Mortgage Association Pool #919584 | 6.00 | 6/1/37 | 530,293 | |||||||||
See Notes to Financial Statements.
10
| Value Line U.S. Government Securities Fund, Inc. | |
| Schedule of Investments (unaudited) |
Principal Amount | Rate | Maturity Date | Value | ||||||||||
| $ | 301,001 | Federal National Mortgage Association Pool #943647 | 5.50 | % | 7/1/37 | $ | 328,057 | ||||||
| 119,688 | Federal National Mortgage Association Pool #AA2531 | 4.50 | 3/1/39 | 127,641 | |||||||||
| 318,012 | Federal National Mortgage Association Pool #AA9181 | 4.50 | 8/1/39 | 339,144 | |||||||||
| 757,059 | Federal National Mortgage Association REMIC Trust Series 2009-88 Class MA | 4.50 | 10/25/39 | 832,316 | |||||||||
| 77,186 | Federal National Mortgage Association Pool #AD1035 | 4.50 | 2/1/40 | 82,315 | |||||||||
| 310,947 | Federal National Mortgage Association Pool #AD5234 | 4.50 | 7/1/40 | 331,610 | |||||||||
| 457,992 | Federal National Mortgage Association Pool #AD7136 | 5.00 | 7/1/40 | 494,856 | |||||||||
| 823,937 | Federal National Mortgage Association Pool #890236 | 4.50 | 8/1/40 | 878,097 | |||||||||
| 1,193,627 | Federal National Mortgage Association Pool #AD8408 | 4.50 | 8/1/40 | 1,272,944 | |||||||||
| 745,322 | Federal National Mortgage Association Pool #AE2078 | 4.50 | 8/1/40 | 794,849 | |||||||||
| 346,488 | Federal National Mortgage Association Pool #AD8536 | 5.00 | 8/1/40 | 374,377 | |||||||||
| 964,121 | Federal National Mortgage Association Pool #AH5575 | 4.00 | 2/1/41 | 1,015,749 | |||||||||
| 971,230 | Federal National Mortgage Association Pool #AI3051 | 4.50 | 7/1/41 | 1,035,769 | |||||||||
| 973,189 | Federal National Mortgage Association Pool #AI0814 | 4.50 | 8/1/41 | 1,037,858 | |||||||||
| 307,510 | Federal National Mortgage Association Pool #AJ5888 | 4.50 | 11/1/41 | 327,944 | |||||||||
| 680,949 | Federal National Mortgage Association Pool #AJ7440 | 4.50 | 11/1/41 | 726,199 | |||||||||
| 24,352,548 | TOTAL FEDERAL NATIONAL MORTGAGE ASSOCIATION (Cost $25,072,410) | 26,624,988 | |||||||||||
| GOVERNMENT NATIONAL MORTGAGE ASSOCIATION (3.5%) | |||||||||||||
| 79,736 | Government National Mortgage Association Pool #003645 | 4.50 | 12/20/19 | 86,823 | |||||||||
| 3,354 | Government National Mortgage Association Pool #557681 | 6.00 | 8/15/31 | 3,789 | |||||||||
| 44,945 | Government National Mortgage Association Pool #548880 | 6.00 | 12/15/31 | 50,765 | |||||||||
| 46,540 | Government National Mortgage Association Pool #551762 | 6.00 | 4/15/32 | 52,567 | |||||||||
| 21,252 | Government National Mortgage Association Pool #582415 | 6.00 | 11/15/32 | 24,003 | |||||||||
| 207,162 | Government National Mortgage Association Pool #604485 | 6.00 | 7/15/33 | 234,701 | |||||||||
| 104,904 | Government National Mortgage Association Pool #622603 | 6.00 | 11/15/33 | 118,489 | |||||||||
| 3,615 | Government National Mortgage Association Pool #429786 | 6.00 | 12/15/33 | 4,085 | |||||||||
| 94,664 | Government National Mortgage Association Pool #605025 | 6.00 | 2/15/34 | 106,922 | |||||||||
| 6,411 | Government National Mortgage Association Pool #626480 | 6.00 | 2/15/34 | 7,279 | |||||||||
| 79,831 | Government National Mortgage Association Pool #610944 | 5.50 | 4/15/34 | 89,428 | |||||||||
| 107,173 | Government National Mortgage Association Pool #583008 | 5.50 | 6/15/34 | 119,790 | |||||||||
| 51,351 | Government National Mortgage Association Pool #605245 | 5.50 | 6/15/34 | 57,396 | |||||||||
| 906,282 | Government National Mortgage Association Series 2010-151 Class KA | 3.00 | 9/16/39 | 940,968 | |||||||||
See Notes to Financial Statements.
11
| Value Line U.S. Government Securities Fund, Inc. | |
| February 29, 2012 |
Principal Amount | Rate | Maturity Date | Value | ||||||||||
| $ | 874,866 | Government National Mortgage Association Series 2011-17 Class EP | 3.50 | % | 12/16/39 | $ | 920,650 | ||||||
| 2,632,086 | TOTAL GOVERNMENT NATIONAL MORTGAGE ASSOCIATION (Cost $2,720,834) | 2,817,655 | |||||||||||
| 51,007,471 | TOTAL U.S. GOVERNMENT AGENCY OBLIGATIONS (Cost $52,570,909) | 55,737,968 | |||||||||||
| U.S. TREASURY OBLIGATIONS (27.1%) | |||||||||||||
| 800,000 | U.S. Treasury Notes | 2.75 | 11/30/16 | 871,500 | |||||||||
| 1,000,000 | U.S. Treasury Notes | 3.13 | 1/31/17 | 1,108,672 | |||||||||
| 2,000,000 | U.S. Treasury Notes | 2.38 | 7/31/17 | 2,146,250 | |||||||||
| 1,000,000 | U.S. Treasury Notes | 1.88 | 9/30/17 | 1,045,547 | |||||||||
| 1,000,000 | U.S. Treasury Notes | 2.88 | 3/31/18 | 1,102,109 | |||||||||
| 3,200,000 | U.S. Treasury Notes | 2.25 | 7/31/18 | 3,398,250 | |||||||||
| 1,300,000 | U.S. Treasury Notes | 3.13 | 5/15/19 | 1,451,531 | |||||||||
| 1,700,000 | U.S. Treasury Notes | 3.50 | 5/15/20 | 1,946,367 | |||||||||
| 1,000,000 | U.S. Treasury Notes | 3.63 | 2/15/21 | 1,153,984 | |||||||||
| 500,000 | U.S. Treasury Notes | 3.13 | 5/15/21 | 555,156 | |||||||||
| 400,000 | U.S. Treasury Notes | 2.00 | 11/15/21 | 402,000 | |||||||||
| 2,000,000 | U.S. Treasury Bonds | 7.88 | 2/15/21 | 3,029,376 | |||||||||
| 1,000,000 | U.S. Treasury Bonds | 6.25 | 8/15/23 | 1,419,219 | |||||||||
| 500,000 | U.S. Treasury Bonds | 7.63 | 2/15/25 | 798,437 | |||||||||
| 1,000,000 | U.S. Treasury Bonds | 6.00 | 2/15/26 | 1,420,312 | |||||||||
| 18,400,000 | TOTAL U.S. TREASURY OBLIGATIONS (Cost $21,575,234) | 21,848,710 | |||||||||||
| TOTAL INVESTMENT SECURITIES (96.2%) (Cost $74,146,143) | 77,586,678 | ||||||||||||
| REPURCHASE AGREEMENT (3.3%) | |||||||||||||
| 2,700,000 | With Morgan Stanley, 0.12%, dated 02/29/12, due 03/01/12, delivery value $2,700,009 (collateralized by $2,680,000 U.S. Treasury Notes 1.7500% due 01/31/14, with a value of $2,757,960) | 2,700,000 | |||||||||||
| CASH AND OTHER ASSETS IN EXCESS OF LIABILITIES (0.5%) | 382,017 | ||||||||||||
| NET ASSETS (100.0%) | $ | 80,668,695 | |||||||||||
| NET ASSET VALUE, OFFERING AND REDEMPTION PRICE PER OUTSTANDING SHARE ($80,668,695 ÷ 6,664,945 shares outstanding) | $ | 12.10 | |||||||||||
| (1) | Adjustable rate security. The rate shown is as of February 29, 2012. |
See Notes to Financial Statements.
12
| Value Line U.S. Government Securities Fund, Inc. |
| Statement of Assets and Liabilities at February 29, 2012 (unaudited) |
| Assets: | ||||
| Investment securities, at value (Cost - $74,146,143) | $ | 77,586,678 | ||
| Repurchase agreement (Cost - $2,700,000) | 2,700,000 | |||
| Cash | 648,641 | |||
| Interest receivable | 357,117 | |||
| Prepaid expenses | 8,079 | |||
| Total Assets | 81,300,515 | |||
| Liabilities: | ||||
| Payable for securities purchased | 544,741 | |||
| Payable for capital shares redeemed | 40,713 | |||
| Accrued expenses: | ||||
| Advisory fee | 31,979 | |||
| Other | 14,387 | |||
| Total Liabilities | 631,820 | |||
| Net Assets | $ | 80,668,695 | ||
| Net assets consist of: | ||||
| Capital stock, at $1.00 par value (authorized 100,000,000, outstanding 6,664,945 shares) | $ | 6,664,945 | ||
| Additional paid-in capital | 69,571,047 | |||
| Undistributed net investment income | 183,182 | |||
| Accumulated net realized gain on investments | 808,986 | |||
| Net unrealized appreciation of investments | 3,440,535 | |||
| Net Assets | $ | 80,668,695 | ||
| Net Asset Value, Offering and Redemption Price per Outstanding Share ($80,668,695 ÷ 6,664,945 shares outstanding) | $ | 12.10 |
| Statement of Operations for the Six Months Ended February 29, 2012 (unaudited) |
| Investment Income: | ||||
| Interest | $ | 1,161,320 | ||
| Expenses: | ||||
| Advisory fee | 202,333 | |||
| Service and distribution plan fees | 101,167 | |||
| Auditing and legal fees | 34,541 | |||
| Transfer agent fees | 27,318 | |||
| Custodian fees | 22,272 | |||
| Printing and postage | 21,875 | |||
| Registration and filing fees | 16,825 | |||
| Directors’ fees and expenses | 7,812 | |||
| Insurance | 5,287 | |||
| Other | 7,433 | |||
| Total Expenses Before Fees Waived and Custody Credits | 446,863 | |||
| Less: Service and Distribution Plan Fees Waived | (101,167 | ) | ||
| Less: Custody Credits | (76 | ) | ||
| Net Expenses | 345,620 | |||
| Net Investment Income | 815,700 | |||
| Net Realized and Unrealized Gain/(Loss) on Investments: | ||||
| Net Realized Gain | 1,538,274 | |||
| Change in Net Unrealized Appreciation/(Depreciation) | (1,269,988 | ) | ||
Net Realized Gain and Change in Net Unrealized Appreciation/(Depreciation) on Investments | 268,286 | |||
| Net Increase in Net Assets from Operations | $ | 1,083,986 |
See Notes to Financial Statements.
13
| Value Line U.S. Government Securities Fund, Inc. |
| Statement of Changes in Net Assets |
| for the Six Months Ended February 29, 2012 (unaudited) and for the Year Ended August 31, 2011 |
Six Months Ended February 29, 2012 (unaudited) | Year Ended August 31, 2011 | ||||||
| Operations: | |||||||
| Net investment income | $ | 815,700 | $ | 1,922,124 | |||
| Net realized gain on investments | 1,538,274 | 1,416,088 | |||||
| Change in net unrealized appreciation/(depreciation) | (1,269,988 | ) | (512,738 | ) | |||
| Net increase in net assets from operations | 1,083,986 | 2,825,474 | |||||
| Distributions to Shareholders: | |||||||
| Net investment income | (967,435 | ) | (2,167,104 | ) | |||
| Net realized gain from investment transactions | (1,670,740 | ) | (1,269,237 | ) | |||
| Total Distributions | (2,638,175 | ) | (3,436,341 | ) | |||
| Capital Share Transactions: | |||||||
| Proceeds from sale of shares | 2,087,156 | 3,225,747 | |||||
| Proceeds from reinvestment of dividends and distributions to shareholders | 2,372,908 | 3,049,842 | |||||
| Cost of shares redeemed | (4,648,146 | ) | (10,680,017 | ) | |||
| Net decrease in net assets from capital share transactions | (188,082 | ) | (4,404,428 | ) | |||
| Total Decrease in Net Assets | (1,742,271 | ) | (5,015,295 | ) | |||
| Net Assets: | |||||||
| Beginning of period | 82,410,966 | 87,426,261 | |||||
| End of period | $ | 80,668,695 | $ | 82,410,966 | |||
| Undistributed net investment income, at end of period | $ | 183,182 | $ | 334,917 | |||
See Notes to Financial Statements.
14
| Value Line U.S. Government Securities Fund, Inc. | |
| Notes to Financial Statements (unaudited) |
1. Significant Accounting Policies
Value Line U.S. Government Securities Fund, Inc. (the “Fund”) is registered under the Investment Company Act of 1940, as amended, as a diversified, open-end management investment company whose primary investment objective is to obtain maximum income without undue risk to principal. Capital preservation and possible capital appreciation are secondary objectives.
The following significant accounting principles are in conformity with generally accepted accounting principles for investment companies. Such policies are consistently followed by the Fund in the preparation of its financial statements. Generally accepted accounting principles require management to make estimates and assumptions that affect the reported amounts and disclosures in the financial statements. Actual results may differ from those estimates.
(A) Security Valuation: The Fund’s investments are carried at fair value. With assistance from an independent pricing service (the “Service”) approved by the Board of Directors, portfolio securities are valued at the midpoint between the latest available and representative asked and bid prices on the basis of valuations provided by dealers in such securities. Some of the general factors which may be considered by the dealers in arriving at such valuations include the fundamental analytic data relating to the security and an evaluation of the forces which influence the market in which these securities are purchased and sold. Determination of values may involve subjective judgment, as the actual market value of a particular security can be established only by negotiation between the parties in a sales transaction. If a portfolio security is not priced in this manner, the value is determined on the valuation date by reference to valuations obtained from the Service which determines valuations for normal institutional-size trading units of debt securities, without exclusive reliance upon quoted prices. The Service takes into account appropriate factors such as institutional-size trading in similar groups of securities, yield, quality, coupon rate, maturity, type of issue, trading characteristics and other market data in determining valuations. Short-term instruments with maturities of 60 days or less at the date of purchase are valued at amortized cost, which approximates market value. Other assets and securities for which market valuations are not readily available will be valued at fair value by the Adviser pursuant to policies and procedures adopted by the Board of Directors. At February 29, 2012, there were no securities that had been fair valued.
(B) Fair Value Measurements: The Fund follows fair valuation accounting standards (FASB ASC 820-10) which establish a definition of fair value and set out a hierarchy for measuring fair value. These standards require additional disclosures about the various inputs and valuation techniques used to develop the measurements of fair value and a discussion of changes in valuation techniques and related inputs during the period. These inputs are summarized in the three broad levels listed below:
| ● | Level 1 - Inputs that reflect unadjusted quoted prices in active markets for identical assets or liabilities that the Fund has the ability to access at the measurement date; |
● | Level 2 - Inputs other than quoted prices that are observable for the asset or liability either directly or indirectly, including inputs in markets that are not considered to be active; |
● | Level 3 - Inputs that are unobservable. |
Transfers between investment levels may occur as the markets fluctuate and/or the availability of data used in an investment’s valuation changes. The inputs or methodologies used for valuing securities are not necessarily an indication of the risk associated with investing in those securities.
15
Value Line U.S. Government Securities Fund, Inc. | |
| February 29, 2012 |
The following table summarizes the inputs used to value the Fund’s investments in securities as of February 29, 2012:
| Investments in Securities: | Level 1 | Level 2 | Level 3 | Total | |||||||||
| Assets | |||||||||||||
| U.S.Government Agency Obligations | $ | 0 | $ | 55,737,968 | $ | 0 | $ | 55,737,968 | |||||
| U.S.Treasury Obligations | 0 | 21,848,710 | 0 | 21,848,710 | |||||||||
| Short-Term Investments | 0 | 2,700,000 | 0 | 2,700,000 | |||||||||
| Total Investments in Securities | $ | 0 | $ | 80,286,678 | $ | 0 | $ | 80,286,678 | |||||
In May 2011, the Financial Accounting Standards Board (“FASB”) issued Accounting Standards Update No. 2011-04, “Fair Value Measurements and Disclosures (Topic 820) - Amendments to Achieve Common Fair Value Measurement and Disclosure Requirements in U.S. GAAP and IFRSs” (“ASU 2011-04”). ASU 2011-04 clarifies the application of existing fair value measurement requirements, changes in certain principles related to measuring fair value, and requires additional disclosures about fair value measurements.
Specifically, the guidance specifies that the concepts of highest and best use and valuation of premise in a fair value measurement are only relevant when measuring the fair value of nonfinancial assets whereas they are not relevant when measuring the fair value of financial assets and liabilities.
Required disclosures are expanded under the new guidance, especially for fair value measurements that are categorized within Level 3 of the fair value hierarchy, for which quantitative information about the unobservable inputs used, and a narrative description of the valuation processes in place and sensitivity of recurring Level 3 measurements to changes in unobservable inputs will be required. Entities will also be required to disclose the categorization by level of the fair value hierarchy for items that are not measured at fair value in the statement of financial position but for which the fair value is required to be disclosed.
ASU 2011-04 is effective for annual periods beginning after December 15, 2011 and is to be applied prospectively. The Fund is currently assessing the impact of this guidance on its financial statements.
The Fund follows the updated provisions surrounding fair value measurements and disclosures on transfers in and out of all levels of the fair value hierarchy on a gross basis and the reasons for the transfers as well as to disclosures about the valuation techniques and inputs used to measure fair value for investments that fall in either Level 2 or Level 3 fair value hierarchy.
For the six months ended February 29, 2012, there was no significant transfer activity between Level 1 and Level 2.
For the six months ended February 29, 2012, there were no Level 3 investments. The Schedule of Investments includes a breakdown of the Schedule’s investments by category.
(C) Repurchase Agreements: In connection with transactions in repurchase agreements, the Fund’s custodian takes possession of the underlying collateral securities, the value of which exceeds the principal amount of the repurchase transaction, including accrued interest. To the extent that any repurchase transaction exceeds one business day, it is the Fund’s policy to mark-to-market the collateral on a daily basis to ensure the adequacy of the collateral. In the event of default of the obligation to repurchase, the Fund has the right to liquidate the collateral and apply the proceeds in satisfaction of the obligation. Under certain circumstances, in the event of default or bankruptcy by the other party to the agreement, realization and/or retention of the collateral or proceeds may be subject to legal proceedings.
16
| Value Line U.S. Government Securities Fund, Inc. | |
| Notes to Financial Statements (unaudited) |
(D) Federal Income Taxes: It is the policy of the Fund to qualify as a regulated investment company by complying with the provisions available to regulated investment companies, as defined in the applicable sections of the Internal Revenue Code, and to distribute all of its investment income and capital gains to its shareholders. Therefore, no provision for federal income tax is required.
Management has analyzed the Fund’s tax positions taken on federal and state income tax returns for all open tax years (fiscal years ended August 31, 2008 through August 31, 2011), and has concluded that no provision for federal or state income tax is required in the Fund’s financial statements. The Fund’s federal and state income tax returns for tax years for which the applicable statutes of limitations have not expired are subject to examination by the Internal Revenue Service and state departments of revenue.
(E) Security Transactions and Related Income: Security transactions are accounted for on the date the securities are purchased or sold. Realized gains and losses on securities transactions are determined using the identified cost method. Interest income, adjusted for the amortization of discount and premium, is earned from settlement date and recognized on the accrual basis. Gains and losses realized on prepayments received on mortgage-related securities are recorded as interest income.
The Fund may invest in Treasury Inflation-Protection Securities (TIPS). The principal value and interest payout of TIPS are periodically adjusted according to the rate of inflation based on the Consumer Price Index. The adjustments for principal and income due to inflation are reflected in interest income in the Statement of Operations.
(F) Representations and Indemnifications: In the normal course of business, the Fund enters into contracts that contain a variety of representations and warranties which provide general indemnifications. The Fund’s maximum exposure under these arrangements is unknown, as this would involve future claims that may be made against the Fund that have not yet occurred. However, based on experience, the Fund expects the risk of loss to be remote.
(G) Subsequent Events: Management has evaluated all subsequent transactions and events through the date on which these financial statements were issued, and except as already included in the notes to these financial statements, has determined that no additional items require disclosure.
2. Investment Risks
Securities issued by U.S. Government agencies or government-sponsored enterprises may not be guaranteed by the U.S. Treasury. The Government National Mortgage Association (“GNMA” or “Ginnie Mae”), a wholly-owned U.S. Government corporation, is authorized to guarantee, with the full faith and credit of the U.S. Government, the timely payment of principal and interest on securities issued by institutions approved by GNMA and backed by pools of mortgages insured by the Federal Housing Administration or guaranteed by the Department of Veteran Affairs. Government-related guarantors (i.e., not backed by the full faith and credit of the U.S. Government) include the Federal National Mortgage Association (“FNMA” or “Fannie Mae”) and the Federal Home Loan Mortgage Corporation (“FHLMC” or “Freddie Mac”). Pass-through securities issued by FNMA are guaranteed as to timely payment of principal and interest by FNMA but are not backed by the full faith and credit of the U.S. Government. FHLMC guarantees the timely payment of interest and ultimate collection of principal, but its participation certificates are not backed by the full faith and credit of the U.S. Government.
17
Value Line U.S. Government Securities Fund, Inc.
| February 29, 2012 |
3. Capital Share Transactions and Dividends to Shareholders
Transactions in capital stock were as follows:
Six Months Ended February 29, 2012 (unaudited) | Year Ended August 31, 2011 | |||||||
| Shares sold | 170,006 | 266,418 | ||||||
| Shares issued to shareholders in reinvestment of dividends and distributions | 196,142 | 255,299 | ||||||
| Shares redeemed | (378,713 | ) | (886,402 | ) | ||||
| Net decrease | (12,565 | ) | (364,685 | ) | ||||
| Dividends per share from net investment income | $ | 0.1466 | $ | 0.3158 | ||||
| Distributions per share from net realized gains | $ | 0.2556 | $ | 0.1837 | ||||
Dividends and distributions to shareholders are recorded on the ex-dividend date.
4. Purchases and Sales of Securities
Purchases and sales of investment securities, excluding short-term securities, were as follows:
Six Months Ended February 29, 2012 (unaudited) | ||||
| Purchases: | ||||
| U.S. Treasury Obligations | $ | 45,442,922 | ||
| U.S. Government Agency Obligations | 12,418,353 | |||
| Total Purchases | $ | 57,861,275 | ||
| Sales: | ||||
| U.S. Treasury Obligations | $ | 44,291,016 | ||
| U.S. Government Agency Obligations | 8,814,851 | |||
| Total Sales | $ | 53,105,867 | ||
5. Income Taxes
At February 29, 2012, information on the tax components of capital is as follows:
| Cost of investments for tax purposes | $ | 76,846,143 | ||
| Gross tax unrealized appreciation | $ | 3,463,994 | ||
| Gross tax unrealized depreciation | $ | (23,459 | ) | |
| Net tax unrealized appreciation on investments | $ | 3,440,535 |
6. Investment Advisory Fees, Service and Distribution Fees and Transactions With Affiliates
An advisory fee of $202,333 was paid or payable to EULAV Asset Management (the “Adviser”) for the six months ended February 29, 2012. This was computed at the rate of 0.50% of the Fund’s average daily net assets during the period and paid monthly. The Adviser provides research, investment programs, supervision of the investment portfolio and pays costs of administrative services, office space, equipment, and compensation of administrative, bookkeeping, and clerical personnel necessary for managing the affairs of the Fund. The Adviser also provides persons, satisfactory to the Fund’s Board of Directors, to act as officers and employees of the Fund and pays their salaries.
The Fund has a Service and Distribution Plan (the “Plan”), adopted pursuant to Rule 12b-1 under the Investment Company Act of 1940, which compensates EULAV Securities LLC (the “Distributor”) for advertising, marketing and distributing the Fund’s shares and for servicing the Fund’s shareholders at an annual rate of 0.25% of the Fund’s average daily net assets. Fees amounting to $101,167, before fee waivers, were accrued under the Plan for the six months ended February 29, 2012. Effective January 1, 2009 through December 31, 2012, the Distributor contractually agreed to waive the 12b-1 fee. For the six months ended February 29, 2012, all 12b-1 fees were waived. The Distributor has no right to recoup previously waived amounts. There is no assurance that the Distributor will extend the fee waiver beyond such date.
18
| Value Line U.S. Government Securities Fund, Inc. |
| Notes to Financial Statements (unaudited) |
For the six months ended February 29, 2012, the Fund’s expenses were reduced by $76 under a custody credit arrangement with the custodian.
Direct expenses of the Fund are charged to the Fund while common expenses of the Value Line Funds are allocated proportionately based upon the Funds’ respective net assets. The Fund bears all other costs and expenses.
Certain officers and Trustee of the Adviser are also officers and a director of the Fund. At February 29, 2012, the officers and Director of the Fund as a group owned 566 shares, representing less than 1% of the outstanding shares.
19
Value Line U.S. Government Securities Fund, Inc.
| Financial Highlights |
Selected data for a share of capital stock outstanding throughout each period:
Six Months Ended February 29, 2012 (unaudited) | ||||||||||||||||||||||||
| Years Ended August 31, | ||||||||||||||||||||||||
| 2011 | 2010 | 2009 | 2008 | 2007 | ||||||||||||||||||||
| Net asset value, beginning of period | $ | 12.34 | $ | 12.41 | $ | 12.06 | $ | 11.62 | $ | 11.42 | $ | 11.37 | ||||||||||||
| Income from investment operations: | ||||||||||||||||||||||||
| Net investment income | 0.12 | 0.28 | 0.35 | 0.40 | 0.46 | 0.51 | ||||||||||||||||||
| Net gains on securities (both realized and unrealized) | 0.04 | 0.15 | 0.44 | 0.45 | 0.24 | 0.03 | ||||||||||||||||||
| Total from investment operations | 0.16 | 0.43 | 0.79 | 0.85 | 0.70 | 0.54 | ||||||||||||||||||
| Less distributions: | ||||||||||||||||||||||||
| Dividends from net investment income | (0.15 | ) | (0.32 | ) | (0.36 | ) | (0.41 | ) | (0.50 | ) | (0.49 | ) | ||||||||||||
| Distributions from net realized gains | (0.25 | ) | (0.18 | ) | (0.08 | ) | — | — | — | |||||||||||||||
| Total distributions | (0.40 | ) | (0.50 | ) | (0.44 | ) | (0.41 | ) | (0.50 | ) | (0.49 | ) | ||||||||||||
| Net asset value, end of period | $ | 12.10 | $ | 12.34 | $ | 12.41 | $ | 12.06 | $ | 11.62 | $ | 11.42 | ||||||||||||
| Total return | 1.33 | %(1) | 3.65 | % | 6.69 | % | 7.46 | % | 6.22 | % | 4.86 | % | ||||||||||||
| Ratios/Supplemental Data: | ||||||||||||||||||||||||
| Net assets, end of period (in thousands) | $ | 80,669 | $ | 82,411 | $ | 87,426 | $ | 89,609 | $ | 87,919 | $ | 88,886 | ||||||||||||
Ratio of expenses to average net assets(2) | 1.10 | %(3) | 1.09 | % | 1.03 | %(4) | 1.07 | % | 1.01 | % | 0.93 | % | ||||||||||||
Ratio of expenses to average net assets(5) | 0.85 | %(3) | 0.84 | % | 0.77 | %(6) | 0.82 | % | 0.76 | % | 0.75 | % | ||||||||||||
| Ratio of net investment income to average net assets | 2.02 | %(3) | 2.31 | % | 2.87 | % | 3.37 | % | 3.96 | % | 4.28 | % | ||||||||||||
| Portfolio turnover rate | 68 | %(1) | 71 | % | 50 | % | 58 | % | 51 | % | 38 | % | ||||||||||||
| (1) | Not annualized. |
| (2) | Ratio reflects expenses grossed up for custody credit arrangement and grossed up for the waiver of the service and distribution plan fees by the Distributor. The ratio of expenses to average net assets net of custody credits, but exclusive of the fee waivers, would have been 1.00% for the year ended August 31, 2008, 0.92% for the year ended August 31, 2007 and would have been unchanged for the other periods shown. |
| (3) | Annualized. |
| (4) | Ratio reflects expenses grossed up for the reimbursement by Value Line, Inc. of certain expenses incurred by the Fund. |
| (5) | Ratio reflects expenses net of the custody credit arrangement and net of the waiver of the service and distribution plan fees by the Distributor. |
| (6) | Ratio reflects expenses net of the reimbursement by Value Line, Inc. of certain expenses incurred by the Fund. |
See Notes to Financial Statements.
20
Value Line U.S. Government Securities Fund, Inc.
| FACTORS CONSIDERED BY THE BOARD IN APPROVING CONTINUANCE OF |
| THE INVESTMENT ADVISORY AGREEMENT |
| FOR VALUE LINE U.S. GOVERNMENT SECURITIES FUND, INC. (UNAUDITED) |
The Investment Company Act of 1940 (the “1940 Act”) requires the Board of Directors, including a majority of Directors who are not “interested persons” of Value Line U.S. Government Securities Fund, Inc. (the “Fund”), as that term is defined in the 1940 Act (the “Independent Directors”), to annually consider the continuance of the Fund’s investment advisory agreement (“Agreement”) with its investment adviser, EULAV Asset Management.1
In considering whether the continuance of the Agreement was in the best interests of the Fund and its shareholders, the Board requested and the Adviser provided such information as the Board deemed to be reasonably necessary to evaluate the terms of the Agreement. At meetings held throughout the year, including the meeting specifically focused upon the review of the Agreement, the Independent Directors met in executive sessions separately from the non-Independent Director of the Fund and any officers of the Adviser. In selecting the Adviser and approving the continuance of the Agreement, the Independent Directors relied upon the assistance of counsel to the Independent Directors.
Both in the meeting that specifically addressed the continuance of the Agreement and at other meetings, the Board, including the Independent Directors, received materials relating to the Adviser’s investment and management services under the Agreement. These materials included information on: (i) the investment performance of the Fund, compared to a peer group of funds consisting of the Fund and all retail and institutional intermediate U.S. government funds regardless of asset size or primary channel of distribution (the “Performance Universe”), and its benchmark index, each as classified by Lipper Inc., an independent evaluation service (“Lipper”); (ii) the investment process, portfolio holdings, investment restrictions, valuation procedures, and financial statements for the Fund; (iii) sales and redemption data with respect to the Fund; (iv) the general investment outlook in the markets in which the Fund invests; (v) arrangements with respect to the distribution of the Fund’s shares; (vi) the allocation and cost of the Fund’s brokerage (none of which was effected through any affiliate of the Adviser); and (vii) the overall nature, quality and extent of services provided by the Adviser.
As part of their review, the Board requested, and the Adviser provided, additional information in order to evaluate the quality of the Adviser’s services and the reasonableness of its fees under the Agreement. In a separate executive session, the Independent Directors reviewed information, which included data comparing: (i) the Fund’s management fee rate, transfer agent and custodian fee rates, service fee (including 12b-1 fees) rates, and the rate of the Fund’s other non-management fees, to those incurred by a peer group of funds consisting of the Fund and nine other retail no-load intermediate U.S. government funds (excluding outliers), as selected objectively by Lipper (“Expense Group”), and a peer group of funds consisting of the Fund, the Expense Group and all other retail no-load intermediate U.S. government funds (excluding outliers), as selected objectively by Lipper (“Expense Universe”); (ii) the Fund’s expense ratio to those of its Expense Group and Expense Universe; and (iii) the Fund’s investment performance over various time periods to the average performance of the Performance Universe as well as the appropriate Lipper Index, as selected objectively by Lipper (the “Lipper Index”).
1 For periods prior to December 23, 2010, the term “Adviser” means the Adviser’s predecessor entities that previously served as the Fund’s adviser, EULAV Asset Management, LLC and Value Line, Inc. (“VLI”). In accordance with the 1940 Act, the Agreement had a two-year initial term ending December 2012. Nevertheless, the Board determined to consider the Agreement’s continuance annually and undertook that review in June 2011.
21
Value Line U.S. Government Securities Fund, Inc.
In the separate executive session, the Independent Directors also reviewed information regarding: (a) the financial results and condition of the Adviser both before and after its restructuring on December 23, 2010,2 and the Adviser’s and certain of its affiliates’ profitability from the services that have been performed for the Fund and the Value Line family of funds; (b) the Adviser’s investment management staffing and resources; (c) the ownership, control and day-today management of the Adviser, including representations of VLI that it does not “control” (as that term is defined in the 1940 Act) either the Adviser or Value Line Securities, Inc. (the “Distributor”)3 after the restructuring; and (d) the Fund’s potential for achieving economies of scale. In support of its review of the statistical information, the Board was provided with a detailed description of the methodology used by Lipper to determine the Expense Group, the Expense Universe and the Performance Universe to prepare its information.
The following summarizes matters considered by the Board in connection with its continuance of the Agreement. However, the Board did not identify any single factor as all-important or controlling, and the summary does not detail all the matters that were considered.
Investment Performance. The Board reviewed the Fund’s overall investment performance and compared it to its Performance Universe and the Lipper Index. The Board noted that the Fund performed better than the Performance Universe average for the one-year period ended March 31, 2011, but performed approximately the same as the Performance Universe average for the three-year, five-year and ten-year periods ended March 31, 2011. The Board also noted that the Fund’s performance for the one-year, three-year, five-year, and ten-year periods ended March 31, 2011 was below the performance of the Lipper Index.
The Adviser’s Personnel and Methods. The Board reviewed the background of the portfolio manager responsible for the daily management of the Fund’s portfolio, seeking to achieve the Fund’s investment objectives and adhering to the Fund’s investment strategies. The Independent Directors also engaged in discussions with the Adviser’s senior management responsible for the overall functioning of the Fund’s investment operations. The Board viewed favorably (i) the Adviser’s commitment of resources to acquire analytic tools in support of the portfolio management and compliance functions, (ii) actions taken by the Adviser to attract and retain personnel, including improvements to the Adviser’s employee benefit programs and increased merit-based compensation for certain staff members, and (iii) that the Adviser continues to receive the Value Line ranking systems without cost. The Board concluded that the Fund’s management team and the Adviser’s overall resources were adequate and that the Adviser had investment management capabilities and personnel essential to performing its duties under the Agreement.
Management Fee and Expenses. The Board considered the Adviser’s fee rate under the Agreement relative to the management fee rates applicable to the funds in the Expense Group and Expense Universe averages, both before and after applicable fee waivers. The Board noted that, for the most recent fiscal year for which audited financial data was available, the Fund’s management fee rate was slightly less than that of the Expense Group average and nearly equal to that of the Expense Universe average after giving effect to fee waivers applicable to certain funds in the Expense Group and Expense Universe. Before giving effect to such waivers, the Board also noted that, for the most recent fiscal year for which audited financial data is available, the Fund’s management fee rate was less than that of the Expense Group average. The Board concluded that the Fund’s management fee rate was satisfactory for the purpose of approving continuance of the Agreement.
2 On December 23, 2010, the Adviser was restructured as a Delaware statutory trust and renamed EULAV Asset Management. It had formerly been organized as a limited liability company named EULAV Asset Management, LLC.
3 On December 23, 2010, the Distributor was restructured as a Delaware limited liability company with the name EULAV Securities LLC and became a wholly-owned subsidiary of the Adviser. No other changes were made to the Distributor’s organization, including its operations and personnel.
22
Value Line U.S. Government Securities Fund, Inc.
The Board also considered the Fund’s total expense ratio relative to its Expense Group and Expense Universe averages. The Board noted that the Distributor and the Board previously agreed that the Distributor would contractually waive all of the Fund’s Rule 12b-1 fee, effectively reducing the Fund’s Rule 12b-1 fee rate from 0.25% to 0.00% of the Fund’s average daily net assets for the one-year period ended December 31, 2011 and that the Distributor and the Board had agreed to extend this contractual Rule 12b-1 fee waiver through December 31, 2012. Such waiver cannot be changed during the contractual waiver period without the Board’s approval. The Board noted that, for the most recent fiscal year for which audited financial data is available, the Fund’s expense ratio was less than that of the Expense Group average and that of the Expense Universe average, after giving effect to fee waivers applicable to the Fund and certain funds in the Expense Group and Universe. The Board concluded that the average expense ratio was satisfactory for the purpose of approving continuance of the Agreement.
Nature, Extent and Quality of Services. The Board considered the nature, extent and quality of other services provided by the Adviser and the Distributor. At meetings held throughout the year, the Board reviewed the resources and effectiveness of the Adviser’s overall compliance program, as well as the services provided by the Distributor. The Board viewed favorably the additional resources devoted by the Adviser to enhance its and the Fund’s overall compliance program as well as steps being undertaken to enhance the shareholders’ experience with the Fund, such as a more robust website. The Board reviewed the services provided by the Adviser and its affiliates in supervising the Fund’s third party service providers. Based on this review, the Board concluded that the nature, quality, cost, and extent of such other services provided by the Adviser and its affiliates were satisfactory, reliable and beneficial to the Fund’s shareholders.
Profitability. The Board considered the level of profitability of the Adviser and its affiliates with respect to the Fund individually and in the aggregate for all the funds within the Value Line group of funds, including the impact of the restructuring and certain actions taken during prior years. These actions included the reduction (voluntary in some instances and contractual in other instances) of management and/or Rule 12b-1 fees for certain funds, the Adviser’s termination of the use of soft dollar research, and the cessation of trading through the Distributor. The Board also considered the Adviser’s continued attention to the rationalization and differentiation of funds within the Value Line group of funds to better identify opportunities for savings and efficiencies among the funds. The Board concluded that the profitability of the Adviser and its affiliates with respect to the Fund, including the financial results derived from the Fund’s Agreement, were within a range the Board considered reasonable.
Other Benefits. The Board also considered the character and amount of other direct and incidental benefits received by the Adviser and its affiliates from their association with the Fund. The Board concluded that potential “fall-out” benefits that the Adviser and its affiliates may receive, such as greater name recognition, appear to be reasonable, and may in some cases benefit the Fund.
23
Value Line U.S. Government Securities Fund, Inc.
Economies of Scale. The Board considered that, given the current and anticipated size of the Fund, any perceived and potential economies of scale were not yet a significant consideration for the Fund and that the addition of break points to the fee structure was not currently necessary.
Fees and Services Provided for Other Comparable Funds/Accounts Managed by the Adviser and its Affiliates. The Board was informed by the Adviser that the Adviser does not manage any non-mutual fund account that has similar objectives and policies as those of the Fund.
Conclusion. The Board examined the totality of the information it was provided at the meeting specifically addressing approval of the Agreement and at other meetings held during the past year and did not identify any single controlling factor. Based on its evaluation of all material factors deemed relevant and with the advice of independent counsel, the Board concluded that the rate at which the Fund pays a management fee to the Adviser under the Agreement does not constitute a fee that is so disproportionately large as to bear no reasonable relationship to the services rendered and that could not have been the product of arm’s-length bargaining. Further, the Board concluded that the Fund’s Agreement, and the management fee rate thereunder, is fair and reasonable and voted to continue the Agreement as in the best interest of the Fund and its shareholders.
24
Value Line U.S. Government Securities Fund, Inc.
The Fund files its complete schedule of portfolio holdings with the Securities and Exchange Commission (“SEC”) for the first and third quarters of each fiscal year on Form N-Q. The Fund’s Forms N-Q are available on the SEC’s website at http://www.sec.gov and may be reviewed and copied at the SEC’s Public Reference Room in Washington, D.C. Information on the operation of the Public Reference Room may be obtained by calling 1-800-SEC-0330.
A description of the policies and procedures that the Fund uses to determine how to vote proxies relating to portfolio securities, and information regarding how the Fund voted these proxies for the 12-month period ended June 30 is available through the Fund’s website at http://www.vlfunds.com and on the SEC’s website at http://www.sec.gov. The description of the policies and procedures is also available without charge, upon request, by calling 1-800-243-2729.
25
Value Line U.S. Government Securities Fund, Inc.
| Management of the Fund |
MANAGEMENT INFORMATION
The business and affairs of the Fund are managed by the Fund’s officers under the direction of the Board of Directors. The following table sets forth information on each Director and Officer of the Fund. Each Director serves as a director or trustee of each of the 13 Value Line Funds. Each Director serves until his or her successor is elected and qualified.
| Name, Address, and YOB | Position | Length of Time Served | Principal Occupation During the Past 5 Years | Other Directorships Held by Director | ||||
| Interested Director* | ||||||||
Mitchell E. Appel YOB: 1970 | Director | Since 2010 | President of each of the Value Line Funds since June 2008; Chief Financial Officer of Value Line, Inc. (“Value Line”) from April 2008 to December 2010 and from September 2005 to November 2007; Director from February 2010 to December 2010; Chief Financial Officer of XTF Asset Management from November 2007 to April 2008; Chief Financial Officer of the Distributor since April 2008 and President since February 2009; President of the Adviser since February 2009, Trustee since December 2010 and Treasurer since January 2011. | None | ||||
| Non-Interested Directors | ||||||||
Joyce E. Heinzerling 500 East 77th Street New York, NY 10162 YOB: 1956 | Director | Since 2008 | President, Meridian Fund Advisers LLC. (consultants) since April 2009; General Counsel, Archery Capital LLC (private investment fund) until April 2009. | Burnham Investors Trust, since 2004 (4 funds). | ||||
Francis C. Oakley 54 Scott Hill Road Williamstown, MA 01267 YOB: 1931 | Director | Since 2000 | Professor of History, Williams College, (1961-2002). Professor Emeritus since 2002; President Emeritus since 1994 and President, (1985-1994); Chairman (1993-1997) and Interim President (2002-2003) of the American Council of Learned Societies. Trustee since 1997 and Chairman of the Board since 2005, National Humanities Center. | None | ||||
David H. Porter 5 Birch Run Drive Saratoga Springs, NY 12866 YOB: 1935 | Director | Since 1997 | Professor, Skidmore College since 2008; Visiting Professor of Classics, Williams College, (1999-2008); President Emeritus, Skidmore College since 1999 and President, (1987-1998). | None |
26
Value Line U.S. Government Securities Fund, Inc.
| Management of the Fund |
| Name, Address, and YOB | Position | Length of Time Served | Principal Occupation During the Past 5 Years | Other Directorships Held by Director | ||||
Paul Craig Roberts 169 Pompano St. Panama City Beach, FL 32413 YOB: 1939 | Director | Since 1983 | Chairman, Institute for Political Economy. | None | ||||
Nancy-Beth Sheerr 1409 Beaumont Drive Gladwyne, PA 19035 YOB: 1949 | Director | Since 1996 | Senior Financial Adviser, Veritable L.P. (Investment Adviser). | None | ||||
Daniel S. Vandivort 59 Indian Head Road Riverside, CT 06878 YOB: 1954 | Director (Chairman of Board Since 2010) | Since 2008 | President, Chief Investment Officer, Weiss, Peck and Greer/Robeco Investment Management (2005-2007); Managing Director, Weiss, Peck and Greer, (1995-2005). | None | ||||
| Officers | ||||||||
Mitchell E. Appel YOB: 1970 | President | Since 2008 | President of each of the Value Line Funds since June 2008; Chief Financial Officer of Value Line from April 2008 to December 2010 and from September 2005 to November 2007; Director from February 2010 to December 2010; Chief Financial Officer of XTF Asset management from November 2007 to April 2008; Chief Financial Officer of the Distributor since April 2008 and President since February 2009; President of the Adviser since February 2009, Trustee since December 2010 and Treasurer since January 2011. | |||||
Michael J. Wagner YOB: 1950 | Chief Compliance Officer | Since 2009 | Chief Compliance Officer of Value Line Funds since June 2009; President of Northern Lights Compliance Services, LLC (formerly Fund Compliance Services, LLC (2006 – present)) and Senior Vice President (2004-2006) and President and Chief Operations Officer (2003-2006) of Gemini Fund Services, LLC; Director of Constellation Trust Company until 2008. | |||||
Emily D. Washington YOB: 1979 | Treasurer and Secretary | Since 2008 | Treasurer and Chief Financial Officer (Principal Financial and Accounting Officer) of each of the Value Line Funds since August 2008 and secretary since 2010; Associate Director of Mutual Fund Accounting at Value Line until August 2008. | |||||
| * | Mr. Appel is an “interested person” as defined in the Investment Company Act of 1940 by virtue of his position with the Adviser and Distributor. |
| Unless otherwise indicated, the address for each of the above officers is c/o Value Line Funds, 7 Times Square, New York, NY 10036. | |
| The Fund’s Statement of Additional Information (SAI) includes additional information about the Fund’s Directors and is available, without charge, upon request by calling 1-800-243-2729 or on the Fund’s website, www.vlfunds.com. | |
27
Value Line U.S. Government Securities Fund, Inc.
| The Value Line Family of Funds |
1950 — The Value Line Fund seeks long-term growth of capital. Current income is a secondary objective.
1952 — Value Line Income and Growth Fund’s primary investment objective is income, as high and dependable as is consistent with reasonable risk. Capital growth to increase total return is a secondary objective.
1956 — Value Line Premier Growth Fund seeks long-term growth of capital. No consideration is given to current income in the choice of investments.
1972 — Value Line Larger Companies Fund’s sole investment objective is to realize capital growth.
1979 — Value Line U.S. Government Money Market Fund, a money market fund, seeks to secure as high a level of current income as is consistent with maintaining liquidity and preserving capital. An investment in the Fund is not insured or guaranteed by the Federal Deposit Insurance Corporation or any other government agency. Although the Fund seeks to preserve the value of your investment at $1.00 per share, it is possible to lose money by investing in the Fund.
1981 — Value Line U.S. Government Securities Fund seeks maximum income without undue risk to capital. Under normal conditions, at least 80% of the value of its net assets will be invested in securities issued or guaranteed by the U.S. Government and its agencies and instrumentalities.
1983 — Value Line Centurion Fund* seeks long-term growth of capital.
1984 — The Value Line Tax Exempt Fund seeks to provide investors with the maximum income exempt from federal income taxes while avoiding undue risk to principal. The fund may be subject to state and local taxes and the Alternative Minimum Tax (if applicable).
1986 — Value Line Aggressive Income Trust seeks to maximize current income.
1987 — Value Line New York Tax Exempt Trust seeks to provide New York taxpayers with the maximum income exempt from New York State, New York City and federal income taxes while avoiding undue risk to principal. The Trust may be subject to state and local taxes and the Alternative Minimum Tax (if applicable).
1987 — Value Line Strategic Asset Management Trust* seeks to achieve a high total investment return consistent with reasonable risk.
1993 — Value Line Emerging Opportunities Fund invests in US common stocks of small capitalization companies, with its primary objective being long-term growth of capital.
1993 — Value Line Asset Allocation Fund seeks high total investment return, consistent with reasonable risk. The Fund invests in stocks, bonds and money market instruments utilizing quantitative modeling to determine the asset mix.
| * | Only available through the purchase of Guardian Investor, a tax deferred variable annuity, or ValuePlus, a variable life insurance policy. |
For more complete information about any of the Value Line Funds, including charges and expenses, send for a prospectus from EULAV Securities LLC, 7 Times Square, New York, New York 10036-6524 or call 1-800-243-2729, 9am-5pm CST, Monday-Friday, or visit us at www.vlfunds.com. Read the prospectus carefully before you invest or send money.
28
Item 11. Controls and Procedures.
| (a) | The registrant’s principal executive officer and principal financial officer have concluded that the registrant’s disclosure controls and procedures (as defined in rule 30a-2(c) under the Act (17 CFR 270.30a-2(c) ) based on their evaluation of these controls and procedures as of a date within 90 days of the filing date of this report, are appropriately designed to ensure that material information relating to the registrant is made known to such officers and are operating effectively. | |
| (b) | The registrant’s principal executive officer and principal financial officer have determined that there have been no significant changes in the registrant’s internal controls or in other factors that could significantly affect these controls subsequent to the date of their evaluation, including corrective actions with regard to significant deficiencies and material weaknesses. |
Item 12. Exhibits.
| (a) | (1) | Certification pursuant to Rule 30a-2(a) under the Investment Company Act of 1940 (17 CFR 270.30a-2) attached hereto as Exhibit 99.CERT. |
| (2) | Certification pursuant to Section 906 of the Sarbanes-Oxley Act of 2002 attached hereto as Exhibit 99.906.CERT. |
SIGNATURES
Pursuant to the requirements of the Securities Exchange Act of 1934 and the Investment Company Act of 1940, this report has been signed below by the following persons on behalf of the registrant and in the capacities and on the dates indicated.
| By | /s/ Mitchell E. Appel | |||
| Mitchell E. Appel, President | ||||
| Date: | May 3, 2012 | |||
| Pursuant to the requirements of the Securities Exchange Act of 1934 and the Investment Company Act of 1940, the registrant has duly caused this report to be signed on its behalf by the undersigned, thereunto duly authorized. | ||||
| By: | /s/ Mitchell E. Appel | |||
| Mitchell E. Appel, President, Principal Executive Officer | ||||
| By: | /s/ Emily D. Washington | |||
| Emily D. Washington, Treasurer, Principal Financial Officer | ||||
| Date: | May 3, 2012 | |||