UNITED STATES
SECURITIES AND EXCHANGE COMMISSION
Washington, D.C. 20549
FORM N-CSR
CERTIFIED SHAREHOLDER REPORT OF REGISTERED
MANAGEMENT INVESTMENT COMPANIES
Investment Company Act file Number 811-03171
Value Line U.S. Government Securities Fund, Inc.
(Exact name of registrant as specified in charter)
220 East 42nd Street, New York, N.Y. 10017
(Address of principal executive offices) (Zip Code)
Registrant’s telephone number, including area code: 212-907-1500
Date of fiscal year end: August 31, 2009
Date of reporting period: February 28, 2009
Item I. Reports to Stockholders.
A copy of the Semi-Annual Report to Stockholders for the period ended 2/28/09 is included with this Form.
| INVESTMENT ADVISER | EULAV Asset Management, LLC 220 East 42nd Street New York, NY 10017-5891 | S E M I - A N N U A L R E P O R T |
| F e b r u a r y 2 8, 2 0 0 9 | ||
| DISTRIBUTOR | Value Line Securities, Inc. | |
| 220 East 42nd Street | ||
| New York, NY 10017-5891 | ||
| CUSTODIAN BANK | State Street Bank and Trust Co. | |
| 225 Franklin Street | ||
| Boston, MA 02110 | Value Line U.S. Government Securities Fund, Inc. | |
| SHAREHOLDER | State Street Bank and Trust Co. | |
| SERVICING AGENT | c/o BFDS | |
| P.O. Box 219729 | ||
| Kansas City, MO 64121-9729 | ||
| INDEPENDENT | PricewaterhouseCoopers LLP | |
| REGISTERED PUBLIC | 300 Madison Avenue | |
| ACCOUNTING FIRM | New York, NY 10017 | |
| LEGAL COUNSEL | Peter D. Lowenstein, Esq. | |
| 496 Valley Road | ||
| Cos Cob, CT 06807-0272 | ||
| DIRECTORS | Joyce E. Heinzerling | |
| Francis C. Oakley | ||
| David H. Porter | ||
| Paul Craig Roberts | ||
| Thomas T. Sarkany | ||
| Nancy-Beth Sheerr | ||
| Daniel S. Vandivort | ||
| OFFICERS | Mitchell E. Appel | |
| President | ||
| Howard A. Brecher | ||
| Vice President and Secretary | ||
| Emily D. Washington | ||
| Treasurer | ||
 | ||
| This unaudited report is issued for information to shareholders. It is not authorized for distribution to prospective investors unless preceded or accompanied by a currently effective prospectus of the Fund (obtainable from the Distributor). | ||
| #00063846 | ||
Value Line U.S. Government Securities Fund, Inc.
| To Our Value Line U.S. Government |
To Our Shareholders (unaudited):
Bond prices climbed as interest rates fell during the six-month period ending February 28, 2009. The drop in interest rates resulted from a severe global recession and financial crisis, when the viability of a number of U.S. banks became uncertain. World credit markets froze as lending dropped precipitously.
Interest rates fell throughout the maturity spectrum, but the declines were most pronounced in short-term maturities. The Federal Reserve Board, attempting to stabilize the economic and financial outlook, lowered short-term rates from 2.00% to close to 0%. As a result, the short-term 2-year U.S. Treasury note fell from a yield of 2.37% to 0.97%. Longer maturities experienced a drop in yield as well. The 10-year U.S. Treasury note yield declined from 3.81% to 3.01%.
Your Fund benefited from the bond rally generating a total return for the six months ended February 28, 2009 of 5.00%. The return practically matched the 5.14% return of its benchmark, the Barclays Capital Intermediate U.S. Government Bond Index (1).
All sectors of the portfolio, U.S. Treasuries, U.S. government agencies, and government sponsored mortgage-backed securities, performed well. The Fund’s overweight in Treasuries and government agency bonds added to performance.
Going forward, we expect to maintain our strategy of investing the Fund’s assets in a well-diversified highly rated portfolio of U.S. Treasuries, U.S. government agencies and mortgage-backed securities issued by U.S. government agencies. Additionally, by limiting the average maturity to no more than ten years, we provide a counterweight against gyrating interest rates. Thank you for your confidence in the Fund and we appreciate your continued support.
| Sincerely, | ||
| /s/ Mitchell E. Appel | ||
| Mitchell Appel, President | ||
| April 7, 2009 | ||
| (1) | The Barclays Capital Intermediate U.S. Government Bond Index represents the intermediate maturities (1-10 years) of the U.S. Treasury and U.S. Agency segment of the fixed-income market. The returns for the Index do not reflect charges, expenses, or taxes, and it is not possible to directly invest in this Index. |
| 2 |
Value Line U.S. Government Securities Fund, Inc.
| Securities Fund Shareholders |
Economic Observations (unaudited)
The recession is in full bloom, having hit this country with its worst business setback in several generations. Meanwhile, the downturn has spread overseas with ferocity creating a global crisis.
The current situation is traceable to several events, beginning with the sharp declines in housing construction, home sales, and real estate prices. We also have seen a reduction in credit availability, a high level of bank failures, rising foreclosure rates, increasing unemployment, a contraction in auto activity, and declines in manufacturing and nonmanufacturing. These developments are consistent with a deep and prolonged recession. As 2009 proceeds, we are facing a serious worldwide contraction that will at best end by late this year. Government reaction to this global upheaval is likely to involve attempts to foster major infrastructure rebuilding and stabilize employment. It is hoped that such efforts will shorten the downturn’s duration and reduce its severity.
Inflation, which had earlier moved sharply higher in this country due to dramatic increases in oil, food, and commodity prices, has moderated noticeably, thanks to more recent declines in energy prices. Our expectation is that absent a more potent long-term business expansion than we now project, inflation should remain in check for the most part over the next year or so. In fact, there is the possibility that we could see selective deflation along the way, especially if consumer demand falters much further. By early next decade, however, the massive governmental efforts being undertaken may result in somewhat higher inflation.
| 3 |
Value Line U.S. Government Securities Fund, Inc.
FUND EXPENSES (unaudited):
Example
As a shareholder of the Fund, you incur ongoing costs, including management fees, distribution and service (12b-1) fees, and other Fund expenses. This Example is intended to help you understand your ongoing costs (in dollars) of investing in the Fund and to compare these costs with the ongoing costs of investing in other mutual funds.
The Example is based on an investment of $1,000 invested at the beginning of the period and held for the entire period (September 1, 2008 through February 28, 2009).
Actual Expenses
The first line of the table below provides information about actual account values and actual expenses. You may use the information in this line, together with the amount you invested, to estimate the expenses that you paid over the period. Simply divide your account value by $1,000 (for example an $8,600 account value divided by $1,000 = 8.6), then multiply the result by the number in the first line under the heading “Expenses Paid During Period” to estimate the expenses you paid on your account during this period.
Hypothetical Example for Comparison Purposes
The second line of the table below provides information about hypothetical account values and hypothetical expenses based on the Fund’s actual expense ratio and an assumed rate of return of 5% per year before expenses, which is not the Fund’s actual return. The hypothetical account values and expenses may not be used to estimate the actual ending account balance or expenses you paid for the period. You may use this information to compare the ongoing costs of investing in the Fund and other funds. To do so, compare this 5% hypothetical example with the 5% hypothetical examples that appear in the shareholder reports of the other funds.
Please note that the expenses shown in the table are meant to highlight your ongoing costs only and do not reflect any transactional costs, such as sales charges (loads), redemption fees, or exchange fees. Therefore, the table is useful in comparing ongoing costs only, and will not help you determine the relative total costs of owning different funds. In addition, if transactional costs were included your costs would have been higher.
Beginning account value 9/1/08 | Ending account value 2/28/09 | Expenses paid during period 9/1/08 thru 2/28/09* | ||||||||||
| Actual | $ | 1,000.00 | $ | 1,049.96 | $ | 3.86 | ||||||
| Hypothetical (5% return before expenses) | $ | 1,000.00 | $ | 1,021.03 | $ | 3.81 | ||||||
| * | Expenses are equal to the Fund’s annualized expense ratio of 0.76% multiplied by the average account value over the period, multiplied by 181/365 to reflect the one-half year period. This expense ratio may differ from the expense ratio shown in the Financial Highlights. |
| 4 |
Value Line U.S. Government Securities Fund, Inc.
| Portfolio Highlights at February 28, 2009 (unaudited) |
Ten Largest Holdings
| Issue | Principal Amount | Value | Percentage of Net Assets | |||||||||
| Federal Farm Credit Bank, 3.70%, 5/15/13 | $ | 6,000,000 | $ | 6,253,680 | 6.9 | % | ||||||
| Federal Home Loan Bank, 7.45%, 2/3/20 | $ | 3,000,000 | $ | 3,813,990 | 4.2 | % | ||||||
| Federal Farm Credit Bank, 5.70%, 7/3/17 | $ | 3,000,000 | $ | 3,397,689 | 3.8 | % | ||||||
| Morgan Stanley Repurchase Agreement, 0.15%, 3/2/09 | $ | 3,300,000 | $ | 3,300,000 | 3.6 | % | ||||||
| Federal Farm Credit Bank, 3.50%, 10/3/11 | $ | 3,000,000 | $ | 3,116,847 | 3.4 | % | ||||||
| Federal Home Loan Bank, 3.88%, 12/10/10 | $ | 2,200,000 | $ | 2,283,624 | 2.5 | % | ||||||
| Federal Home Loan Mortgage Corporation Gold PC, 5.00%, 6/1/23 | $ | 1,864,148 | $ | 1,920,453 | 2.1 | % | ||||||
| Federal Home Loan Mortgage Corporation, 2.50%, 1/7/14 | $ | 1,500,000 | $ | 1,490,673 | 1.7 | % | ||||||
| Federal Home Loan Mortgage Corporation Gold PC, 5.50%, 4/1/37 | $ | 1,369,698 | $ | 1,404,139 | 1.6 | % | ||||||
| Federal Home Loan Mortgage Corporation Gold PC, 6.00%, 3/1/33 | $ | 1,331,573 | $ | 1,387,511 | 1.5 | % | ||||||
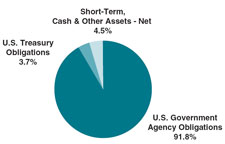
| Asset Allocation — Percentage of Fund’s Net Assets |
| Coupon Distribution |
Percentage of Fund’s investments | ||||
| Less than 4% | 26.8 | % | ||
| 4–4.99% | 19.5 | % | ||
| 5–5.99% | 40.1 | % | ||
| 6–6.99% | 7.1 | % | ||
| 7–7.99% | 6.5 | % | ||
| 5 |
Value Line U.S. Government Securities Fund, Inc.
| Schedule of Investments (unaudited) |
Principal Amount | Rate | Maturity Date | Value | |||||||||
| U.S. GOVERNMENT AGENCY OBLIGATIONS (91.8%) | ||||||||||||
| FEDERAL FARM CREDIT BANK (16.5%) | ||||||||||||
| $ | 1,000,000 | Federal Farm Credit Bank | 4.88 | % | 2/18/11 | $ | 1,062,368 | |||||
| 3,000,000 | Federal Farm Credit Bank | 3.50 | 10/3/11 | 3,116,847 | ||||||||
| 1,000,000 | Federal Farm Credit Bank | 4.85 | 10/25/12 | 1,091,273 | ||||||||
| 6,000,000 | Federal Farm Credit Bank | 3.70 | 5/15/13 | 6,253,680 | ||||||||
| 3,000,000 | Federal Farm Credit Bank | 5.70 | 7/3/17 | 3,397,689 | ||||||||
| 14,000,000 | TOTAL FEDERAL FARM CREDIT BANK | |||||||||||
| (Cost $14,050,500) | 14,921,857 | |||||||||||
| FEDERAL HOME LOAN BANK (15.2%) | ||||||||||||
| 2,200,000 | Federal Home Loan Bank | 3.88 | 12/10/10 | 2,283,624 | ||||||||
| 1,000,000 | Federal Home Loan Bank | 2.63 | 5/20/11 | 1,012,576 | ||||||||
| 1,000,000 | Federal Home Loan Bank | 4.25 | 6/10/11 | 1,057,067 | ||||||||
| 1,300,000 | Federal Home Loan Bank | 3.38 | 6/24/11 | 1,344,710 | ||||||||
| 1,000,000 | Federal Home Loan Bank | 3.63 | 5/29/13 | 1,042,660 | ||||||||
| 1,000,000 | Federal Home Loan Bank | 4.00 | 9/6/13 | 1,057,387 | ||||||||
| 1,000,000 | Federal Home Loan Bank | 4.50 | 9/16/13 | 1,079,701 | ||||||||
| 1,000,000 | Federal Home Loan Bank | 4.50 | 11/14/14 | 1,057,568 | ||||||||
| 3,000,000 | Federal Home Loan Bank | 7.45 | 2/3/20 | 3,813,990 | ||||||||
| 12,500,000 | TOTAL FEDERAL HOME LOAN BANK | |||||||||||
| (Cost $12,787,644) | 13,749,283 | |||||||||||
| FEDERAL HOME LOAN MORTGAGE CORPORATION (34.4%) | ||||||||||||
| 992,499 | Federal Home Loan Mortgage Corporation REMIC Trust Series 3197 Class AB | 5.50 | 8/15/13 | 1,015,618 | ||||||||
| 1,500,000 | Federal Home Loan Mortgage Corporation | 2.50 | 1/7/14 | 1,490,673 | ||||||||
| 1,000,000 | Federal Home Loan Mortgage Corporation | 4.50 | 1/15/15 | 1,075,750 | ||||||||
| 655,014 | Federal Home Loan Mortgage Corporation REMIC Trust Series 2849 Class VA | 5.00 | 8/15/15 | 683,486 | ||||||||
| 660,892 | Federal Home Loan Mortgage Corporation REMIC Trust Series R003 Class AG | 5.13 | 10/15/15 | 675,072 | ||||||||
| 862,423 | Federal Home Loan Mortgage Corporation REMIC Trust Series 2767 Class CA | 4.00 | 9/15/17 | 870,204 | ||||||||
| 16,876 | Federal Home Loan Mortgage Corporation Gold PC Pool #E92226 | 5.00 | 11/1/17 | 17,481 | ||||||||
| 1,000,000 | Federal Home Loan Mortgage Corporation | 5.13 | 11/17/17 | 1,099,749 | ||||||||
| 290,601 | Federal Home Loan Mortgage Corporation Gold PC Pool #E93499 | 5.00 | 12/1/17 | 301,029 | ||||||||
| 19,789 | Federal Home Loan Mortgage Corporation Gold PC Pool #E92829 | 5.00 | 12/1/17 | 20,499 | ||||||||
| 621,811 | Federal Home Loan Mortgage Corporation REMIC Trust Series 2892 Class DC | 4.50 | 12/15/17 | 632,760 | ||||||||
| See Notes to Financial Statements. |
| 6 |
Value Line U.S. Government Securities Fund, Inc.
| February 28, 2009 |
Principal Amount | Rate | Maturity Date | Value | |||||||||
| $ | 927,149 | Federal Home Loan Mortgage Corporation REMIC Trust Series 2643 Class ME | 3.50 | % | 3/15/18 | $ | 921,840 | |||||
| 17,487 | Federal Home Loan Mortgage Corporation Gold PC Pool #E98960 | 5.00 | 9/1/18 | 18,093 | ||||||||
| 50,112 | Federal Home Loan Mortgage Corporation Gold PC Pool #B12822 | 5.00 | 3/1/19 | 51,848 | ||||||||
| 46,755 | Federal Home Loan Mortgage Corporation Gold PC Pool #B17398 | 4.50 | 12/1/19 | 47,754 | ||||||||
| 336,185 | Federal Home Loan Mortgage Corporation Gold PC Pool #G18044 | 4.50 | 3/1/20 | 342,944 | ||||||||
| 172,761 | Federal Home Loan Mortgage Corporation Gold PC Pool #B18034 | 4.50 | 4/1/20 | 176,234 | ||||||||
| 41,769 | Federal Home Loan Mortgage Corporation Gold PC Pool #J00118 | 5.00 | 10/1/20 | 43,085 | ||||||||
| 528,778 | Federal Home Loan Mortgage Corporation Gold PC Pool #J00139 | 5.00 | 10/1/20 | 545,440 | ||||||||
| 45,355 | Federal Home Loan Mortgage Corporation Gold PC Pool #G11986 | 5.00 | 4/1/21 | 46,749 | ||||||||
| 56,730 | Federal Home Loan Mortgage Corporation Gold PC Pool #G12319 | 5.00 | 6/1/21 | 58,517 | ||||||||
| 192,982 | Federal Home Loan Mortgage Corporation Gold PC Pool #J03233 | 5.00 | 8/1/21 | 198,912 | ||||||||
| 1,317,369 | Federal Home Loan Mortgage Corporation Gold PC Pool #G12381 | 5.00 | 9/1/21 | 1,358,880 | ||||||||
| 679,300 | Federal Home Loan Mortgage Corporation REMIC Trust Series 2773 Class DA | 5.00 | 6/15/22 | 695,331 | ||||||||
| 204,715 | Federal Home Loan Mortgage Corporation REMIC Trust Series 2937 Class JC | 5.00 | 9/15/22 | 206,100 | ||||||||
| 1,864,148 | Federal Home Loan Mortgage Corporation Gold PC Pool #J08096 | 5.00 | 6/1/23 | 1,920,453 | ||||||||
| 992,769 | Federal Home Loan Mortgage Corporation Gold PC Pool #J08202 | 5.00 | 7/1/23 | 1,022,910 | ||||||||
| 992,127 | Federal Home Loan Mortgage Corporation Gold PC Pool #J09098 | 5.00 | 12/1/23 | 1,022,094 | ||||||||
| 592,512 | Federal Home Loan Mortgage Corporation REMIC Trust Series 3132 Class MA | 5.50 | 12/15/23 | 609,319 | ||||||||
| 670,684 | Federal Home Loan Mortgage Corporation REMIC Trust Series 3147 Class YE | 5.50 | 7/15/24 | 693,112 | ||||||||
| 1,000,000 | Federal Home Loan Mortgage Corporation REMIC Trust Series 2690 Class OE | 5.00 | 11/15/28 | 1,034,620 | ||||||||
| 1,000,000 | Federal Home Loan Mortgage Corporation | 6.75 | 3/15/31 | 1,326,890 | ||||||||
| 678,318 | Federal Home Loan Mortgage Corporation REMIC Trust Series 3061 Class HA | 5.50 | 4/15/31 | 692,071 | ||||||||
| See Notes to Financial Statements. | |
| 7 | |
| Value Line U.S. Government Securities Fund, Inc. |
| Schedule of Investments (unaudited) |
Principal Amount | Rate | Maturity Date | Value | ||||||||
| $ | 1,083,431 | Federal Home Loan Mortgage Corporation REMIC Trust Series 2878 Class AQ | 5.00 | % | 5/15/31 | $ | 1,110,806 | ||||
| 959,010 | Federal Home Loan Mortgage Corporation REMIC Trust Series 2761 Class AB | 5.00 | 8/15/31 | 984,903 | |||||||
| 447,671 | Federal Home Loan Mortgage Corporation REMIC Trust Series 2645 Class NA | 3.50 | 9/15/31 | 442,638 | |||||||
| 313,633 | Federal Home Loan Mortgage Corporation REMIC Trust Series 2594 Class OR | 4.25 | 6/15/32 | 315,619 | |||||||
| 1,331,573 | Federal Home Loan Mortgage Corporation Gold PC Pool #C77717 | 6.00 | 3/1/33 | 1,387,511 | |||||||
| 840,485 | Federal Home Loan Mortgage Corporation Gold PC Pool #A29526 | 5.00 | 1/1/35 | 855,465 | |||||||
| 445,195 | Federal Home Loan Mortgage Corporation Gold PC Pool #A29633 | 5.00 | 1/1/35 | 453,130 | |||||||
| 485,295 | Federal Home Loan Mortgage Corporation Pool #783022 (1) | 4.42 | 2/1/35 | 478,706 | |||||||
| 554,095 | Federal Home Loan Mortgage Corporation Gold PC Pool #A56491 | 5.00 | 1/1/37 | 563,365 | |||||||
| 341,894 | Federal Home Loan Mortgage Corporation Gold PC Pool #G08184 | 5.00 | 1/1/37 | 347,614 | |||||||
| 817,769 | Federal Home Loan Mortgage Corporation Gold PC Pool #A56467 | 5.50 | 1/1/37 | 838,505 | |||||||
| 1,369,698 | Federal Home Loan Mortgage Corporation Gold PC Pool #A59334 | 5.50 | 4/1/37 | 1,404,139 | |||||||
| 959,758 | Federal Home Loan Mortgage Corporation Gold PC Pool #A80938 | 5.50 | 8/1/38 | 983,891 | |||||||
| 29,977,417 | TOTAL FEDERAL HOME LOAN MORTGAGE CORPORATION | ||||||||||
| (Cost $30,071,985) | 31,081,809 | ||||||||||
| FEDERAL NATIONAL MORTGAGE ASSOCIATION (23.9%) | |||||||||||
| 6,611 | Federal National Mortgage Association Pool #254273 | 5.00 | 3/1/09 | 6,659 | |||||||
| 900,000 | Federal National Mortgage Association | 3.75 | 6/25/10 | 907,455 | |||||||
| 232,848 | Federal National Mortgage Association Pool #255325 | 4.50 | 7/1/11 | 237,696 | |||||||
| 68,604 | Federal National Mortgage Association Pool #511823 | 5.50 | 5/1/16 | 71,538 | |||||||
| 57,896 | Federal National Mortgage Association Pool #615289 | 5.50 | 12/1/16 | 60,371 | |||||||
| 171,568 | Federal National Mortgage Association Pool #622373 | 5.50 | 12/1/16 | 178,904 | |||||||
| 103,287 | Federal National Mortgage Association Pool #631328 | 5.50 | 2/1/17 | 107,639 | |||||||
| 148,227 | Federal National Mortgage Association Pool #623503 | 6.00 | 2/1/17 | 155,353 | |||||||
| 13,224 | Federal National Mortgage Association Pool #643277 | 5.50 | 4/1/17 | 13,781 | |||||||
| 14,610 | Federal National Mortgage Association Pool #638247 | 5.50 | 5/1/17 | 15,226 | |||||||
| 815,777 | Federal National Mortgage Association REMIC Trust | ||||||||||
| Series 2003-52 Class KR | 3.50 | 7/25/17 | 814,680 | ||||||||
| 286,713 | Federal National Mortgage Association Pool #254684 | 5.00 | 3/1/18 | 296,553 | |||||||
| 92,913 | Federal National Mortgage Association Pool #685183 | 5.00 | 3/1/18 | 96,102 | |||||||
| See Notes to Financial Statements. |
| 8 |
| Value Line U.S. Government Securities Fund, Inc. |
| February 28, 2009 |
Principal Amount | Rate | Maturity Date | Value | ||||||||
| $ | 104,988 | Federal National Mortgage Association Pool #703936 | 5.00 | % | 5/1/18 | $ | 108,592 | ||||
| 1,023,466 | Federal National Mortgage Association Pool #780956 | 4.50 | 5/1/19 | 1,045,641 | |||||||
| 424,864 | Federal National Mortgage Association Pool #790984 | 5.00 | 7/1/19 | 438,650 | |||||||
| 470,502 | Federal National Mortgage Association Pool #786915 | 5.00 | 8/1/19 | 485,769 | |||||||
| 1,082,565 | Federal National Mortgage Association Pool #735063 | 4.50 | 12/1/19 | 1,106,020 | |||||||
| 305,178 | Federal National Mortgage Association REMIC Trust Series 2003-28 Class KA | 4.25 | 3/25/22 | 308,637 | |||||||
| 782,081 | Federal National Mortgage Association REMIC Trust Series 2003-17 Class ED | 4.25 | 9/25/22 | 789,055 | |||||||
| 313,515 | Federal National Mortgage Association REMIC Trust Series 2003-38 Class TC | 5.00 | 3/25/23 | 320,552 | |||||||
| 151,267 | Federal National Mortgage Association Pool #412682 | 6.00 | 3/1/28 | 157,726 | |||||||
| 181,765 | Federal National Mortgage Association Pool #425239 | 6.50 | 4/1/28 | 192,059 | |||||||
| 747,647 | Federal National Mortgage Association REMIC Trust Series 2003-26 Class AW | 4.00 | 4/25/30 | 745,239 | |||||||
| 1,000,000 | Federal National Mortgage Association REMIC Trust Series 2006-102 Class PB | 5.00 | 4/25/30 | 1,032,826 | |||||||
| 1,000,000 | Federal National Mortgage Association | 7.25 | 5/15/30 | 1,387,282 | |||||||
| 1,294 | Federal National Mortgage Association Pool #568625 | 7.50 | 1/1/31 | 1,384 | |||||||
| 98,681 | Federal National Mortgage Association Pool #571090 | 7.50 | 1/1/31 | 105,526 | |||||||
| 1,869 | Federal National Mortgage Association Pool #573935 | 7.50 | 3/1/31 | 1,999 | |||||||
| 42,479 | Federal National Mortgage Association Pool #629297 | 6.50 | 2/1/32 | 44,805 | |||||||
| 399,291 | Federal National Mortgage Association Pool #626440 | 7.50 | 2/1/32 | 426,736 | |||||||
| 45,746 | Federal National Mortgage Association Pool #634996 | 6.50 | 5/1/32 | 48,222 | |||||||
| 70,357 | Federal National Mortgage Association Pool #254383 | 7.50 | 6/1/32 | 75,193 | |||||||
| 279,704 | Federal National Mortgage Association Pool #254476 | 5.50 | 9/1/32 | 287,889 | |||||||
| 8,826 | Federal National Mortgage Association Pool #688539 | 5.50 | 3/1/33 | 9,079 | |||||||
| 410,712 | Federal National Mortgage Association Pool #650386 | 5.00 | 7/1/33 | 419,494 | |||||||
| 436,410 | Federal National Mortgage Association Pool #726889 | 5.50 | 7/1/33 | 448,908 | |||||||
| 435,827 | Federal National Mortgage Association Pool #759028 | 5.50 | 1/1/34 | 448,309 | |||||||
| 229,325 | Federal National Mortgage Association Pool #761913 | 5.50 | 2/1/34 | 235,677 | |||||||
| 236,423 | Federal National Mortgage Association Pool #763393 | 5.50 | 2/1/34 | 243,194 | |||||||
| 235,397 | Federal National Mortgage Association Pool #769862 | 5.50 | 2/1/34 | 241,918 | |||||||
| 24,684 | Federal National Mortgage Association Pool #769682 | 5.00 | 3/1/34 | 25,189 | |||||||
| 825,161 | Federal National Mortgage Association REMIC Trust Series 2004-60 Class LB | 5.00 | 4/25/34 | 851,951 | |||||||
| 19,736 | Federal National Mortgage Association Pool #778141 | 5.00 | 5/1/34 | 20,139 | |||||||
| 367,169 | Federal National Mortgage Association Pool #773586 | 5.50 | 6/1/34 | 377,340 | |||||||
| 388,947 | Federal National Mortgage Association Pool #255311 | 6.00 | 7/1/34 | 403,368 | |||||||
| 17,151 | Federal National Mortgage Association Pool #258149 | 5.50 | 9/1/34 | 17,626 | |||||||
| 4,100 | Federal National Mortgage Association Pool #789150 | 5.00 | 10/1/34 | 4,184 | |||||||
| 588,822 | Federal National Mortgage Association Pool #255496 | 5.00 | 11/1/34 | 600,861 | |||||||
| See Notes to Financial Statements. |
| 9 |
| Value Line U.S. Government Securities Fund, Inc. |
| Schedule of Investments (unaudited) |
Principal Amount | Rate | Maturity Date | Value | ||||||||
| $ | 56,774 | Federal National Mortgage Association Pool #797154 | 5.50 | % | 11/1/34 | $ | 58,347 | ||||
| 134,838 | Federal National Mortgage Association Pool #801063 | 5.50 | 11/1/34 | 138,573 | |||||||
| 231,566 | Federal National Mortgage Association Pool #803675 | 5.50 | 12/1/34 | 237,980 | |||||||
| 249,082 | Federal National Mortgage Association Pool #804683 | 5.50 | 12/1/34 | 255,982 | |||||||
| 475,018 | Federal National Mortgage Association Pool #815813 (1) | 4.59 | 2/1/35 | 471,553 | |||||||
| 43,379 | Federal National Mortgage Association Pool #255580 | 5.50 | 2/1/35 | 44,581 | |||||||
| 574,166 | Federal National Mortgage Association Pool #735224 | 5.50 | 2/1/35 | 590,609 | |||||||
| 621,440 | Federal National Mortgage Association Pool #896016 | 6.00 | 8/1/36 | 643,121 | |||||||
| 820,379 | Federal National Mortgage Association Pool #901561 | 5.50 | 10/1/36 | 841,566 | |||||||
| 918,823 | Federal National Mortgage Association Pool #919584 | 6.00 | 6/1/37 | 950,110 | |||||||
| 931,577 | Federal National Mortgage Association Pool #943647 | 5.50 | 7/1/37 | 955,292 | |||||||
| 20,725,269 | TOTAL FEDERAL NATIONAL MORTGAGE ASSOCIATION | ||||||||||
| (Cost $20,905,498) | 21,606,710 | ||||||||||
| GOVERNMENT NATIONAL MORTGAGE ASSOCIATION (1.8%) | |||||||||||
| 190,482 | Government National Mortgage Association Pool #003645 | 4.50 | 12/20/19 | 196,878 | |||||||
| 10,840 | Government National Mortgage Association Pool #541349 | 6.00 | 4/15/31 | 11,284 | |||||||
| 8,862 | Government National Mortgage Association Pool #557681 | 6.00 | 8/15/31 | 9,225 | |||||||
| 116,514 | Government National Mortgage Association Pool #548880 | 6.00 | 12/15/31 | 121,289 | |||||||
| 81,694 | Government National Mortgage Association Pool #551762 | 6.00 | 4/15/32 | 85,017 | |||||||
| 43,461 | Government National Mortgage Association Pool #582415 | 6.00 | 11/15/32 | 45,229 | |||||||
| 312,748 | Government National Mortgage Association Pool #604485 | 6.00 | 7/15/33 | 325,273 | |||||||
| 161,546 | Government National Mortgage Association Pool #622603 | 6.00 | 11/15/33 | 168,015 | |||||||
| 7,434 | Government National Mortgage Association Pool #429786 | 6.00 | 12/15/33 | 7,732 | |||||||
| 268,119 | Government National Mortgage Association Pool #605025 | 6.00 | 2/15/34 | 278,270 | |||||||
| 9,519 | Government National Mortgage Association Pool #626480 | 6.00 | 2/15/34 | 9,879 | |||||||
| 86,020 | Government National Mortgage Association Pool #610944 | 5.50 | 4/15/34 | 88,651 | |||||||
| 227,481 | Government National Mortgage Association Pool #583008 | 5.50 | 6/15/34 | 234,440 | |||||||
| See Notes to Financial Statements. |
| 10 |
| Value Line U.S. Government Securities Fund, Inc. |
| February 28, 2009 |
Principal Amount | Rating | Maturity Date | Value | ||||||||
| $ | 97,881 | Government National Mortgage Association Pool #605245 | 5.50 | % | 6/15/34 | $ | 100,876 | ||||
| 1,622,601 | TOTAL GOVERNMENT NATIONAL MORTGAGE ASSOCIATION | ||||||||||
| (Cost $1,643,988) | 1,682,058 | ||||||||||
| 78,825,287 | TOTAL U.S. GOVERNMENT AGENCY OBLIGATIONS | ||||||||||
| (Cost $79,459,615) | 83,041,717 | ||||||||||
| U.S. TREASURY OBLIGATIONS (3.7%) | |||||||||||
| 1,138,610 | U.S. Treasury Notes (2) | 2.00 | 1/15/14 | 1,132,917 | |||||||
| 1,000,000 | U.S. Treasury Notes | 4.00 | 2/15/15 | 1,095,625 | |||||||
| 1,000,000 | U.S. Treasury Notes | 4.13 | 5/15/15 | 1,098,750 | |||||||
| 3,138,610 | TOTAL U.S. TREASURY OBLIGATIONS | ||||||||||
| (Cost $3,255,174) | 3,327,292 | ||||||||||
TOTAL INVESTMENT SECURITIES (95.5%) (Cost $82,714,789) | 86,369,009 | ||||||||||
| REPURCHASE AGREEMENT (3.6%) | |||||||||||
| 3,300,000 | With Morgan Stanley, 0.15%, dated 2/27/09, due 3/2/09, | ||||||||||
delivery value $3,300,041 (collateralized by $3,385,000 U.S. Treasury Bills 0.66%, due 11/19/09 with a value of $3,369,053) (Cost $3,300,000) | 3,300,000 | ||||||||||
CASH AND OTHER ASSETS IN EXCESS OF LIABILITIES (0.9%) | 769,343 | ||||||||||
| NET ASSETS (100.0%) | $ | 90,438,352 | |||||||||
NET ASSET VALUE, OFFERING AND REDEMPTION PRICE PER OUTSTANDING SHARE ($90,438,352 ÷ 7,564,831 shares outstanding) | $ | 11.96 | |||||||||
| (1) | Adjustable rate security. The rate shown is as of February 28, 2009. |
| (2) | Treasury Inflation Protected Security (TIPS). |
| See Notes to Financial Statements. | |
| 11 | |
Value Line U.S. Government Securities Fund, Inc.
Statement of Assets and Liabilities at February 28, 2009 (unaudited) |
| Assets: | ||||
| Investment securities, at value (Cost - $82,714,789) | $ | 86,369,009 | ||
| Repurchase agreement (Cost - $3,300,000) | 3,300,000 | |||
| Cash | 55,445 | |||
| Interest receivable | 553,579 | |||
| Receivable for capital shares sold | 215,150 | |||
| Prepaid expenses | 16,638 | |||
| Total Assets | 90,509,821 | |||
| Liabilities: | ||||
| Payable for capital shares repurchased | 15,588 | |||
| Accrued expenses: | ||||
| Advisory fee | 34,717 | |||
| Directors’ fees and expenses | 3,156 | |||
| Other | 18,008 | |||
Total Liabilities | 71,469 | |||
| Net Assets | $ | 90,438,352 | ||
| Net assets consist of: | ||||
| Capital stock, at $1.00 par value (authorized 100,000,000, outstanding 7,564,831 shares) | $ | 7,564,831 | ||
| Additional paid-in capital | 79,584,068 | |||
| Undistributed net investment income | 297,024 | |||
| Accumulated net realized loss on investments | (661,791 | ) | ||
| Net unrealized appreciation of investments | 3,654,220 | |||
| Net Assets | $ | 90,438,352 | ||
| Net Asset Value, Offering and Redemption Price per Outstanding Share ($90,438,352 ÷ 7,564,831 shares outstanding) | $ | 11.96 |
Statement of Operations for the Six Months Ended February 28, 2009 (unaudited) |
| Investment Income: | ||||
| Interest | $ | 1,866,599 | ||
| Expenses: | ||||
| Advisory fee | 221,675 | |||
| Service and distribution plan fees | 110,838 | |||
| Transfer agent fees | 27,945 | |||
| Printing and postage | 27,454 | |||
| Custodian fees | 19,747 | |||
| Auditing and legal fees | 19,694 | |||
| Registration and filing fees | 12,146 | |||
| Directors’ fees and expenses | 5,109 | |||
| Insurance | 3,145 | |||
| Other | 5,550 | |||
| Total Expenses Before Custody Credits and Fees Waived | 453,303 | |||
| Less: Service and Distribution Plan Fees Waived | (110,838 | ) | ||
| Less: Custody Credits | (4,045 | ) | ||
| Net Expenses | 338,420 | |||
| Net Investment Income | 1,528,179 | |||
| Net Realized and Unrealized Gain/(Loss) on Investments: | ||||
| Net Realized Gain | 193,402 | |||
| Change in Net Unrealized Appreciation/(Depreciation) | 2,602,326 | |||
| Net Realized Gain and Change in Net Unrealized Appreciation/(Depreciation) on Investments | 2,795,728 | |||
| Net Increase in Net Assets from Operations | $ | 4,323,907 |
| See Notes to Financial Statements. |
| 12 |
Value Line U.S. Government Securities Fund, Inc.
Statement of Changes in Net Assets for the Six Months Ended February 28, 2009 (unaudited) and for the Year Ended August 31, 2008 |
Six Months Ended February 28, 2009 (unaudited) | Year Ended August 31, 2008 | |||||||
| Operations: | ||||||||
| Net investment income | $ | 1,528,179 | $ | 3,526,167 | ||||
| Net realized gain on investments | 193,402 | 776,804 | ||||||
| Change in net unrealized appreciation/(depreciation) | 2,602,326 | 1,067,300 | ||||||
| Net increase in net assets from operations | 4,323,907 | 5,370,271 | ||||||
| Distributions to Shareholders: | ||||||||
| Net investment income | (1,784,667 | ) | (3,798,290 | ) | ||||
| Capital Share Transactions: | ||||||||
| Proceeds from sale of shares | 3,562,292 | 5,566,270 | ||||||
| Proceeds from reinvestment of dividends to shareholders | 1,545,653 | 3,269,818 | ||||||
| Cost of shares repurchased | (5,127,713 | ) | (11,374,963 | ) | ||||
| Net decrease in net assets from capital share transactions | (19,768 | ) | (2,538,875 | ) | ||||
| Total Increase/(Decrease) in Net Assets | 2,519,472 | (966,894 | ) | |||||
| Net Assets: | ||||||||
| Beginning of period | 87,918,880 | 88,885,774 | ||||||
| End of period | $ | 90,438,352 | $ | 87,918,880 | ||||
| Undistributed net investment income, at end of period | $ | 297,024 | $ | 553,512 | ||||
| See Notes to Financial Statements. |
| 13 |
Value Line U.S. Government Securities Fund, Inc.
| Notes to Financial Statements (unaudited) |
| 1. | Significant Accounting Policies |
Value Line U.S. Government Securities Fund, Inc. (the “Fund”) is registered under the Investment Company Act of 1940, as amended, as a diversified, open-end management investment company whose primary investment objective is to obtain maximum income without undue risk to principal. Capital preservation and possible capital appreciation are secondary objectives.
The following significant accounting principles are in conformity with generally accepted accounting principles for investment companies. Such policies are consistently followed by the Fund in the preparation of its financial statements. Generally accepted accounting principles require management to make estimates and assumptions that affect the reported amounts and disclosures in the financial statements. Actual results may differ from those estimates.
(A) Security Valuation: The Fund’s investments are carried at value. With assistance from an independent pricing service (the “Service”) approved by the Board of Directors, portfolio securities are valued at the midpoint between the latest available and representative asked and bid prices on the basis of valuations provided by dealers in such securities. Some of the general factors which may be considered by the dealers in arriving at such valuations include the fundamental analytic data relating to the security and an evaluation of the forces which influence the market in which these securities are purchased and sold. Determination of values may involve subjective judgment, as the actual market value of a particular security can be established only by negotiation between the parties in a sales transaction. If a portfolio security is not priced in this manner, the value is determined on the valuation date by reference to valuations obtained from the Service which determines valuations for normal institutional-size trading units of debt securities, without exclusive reliance upon quoted prices. The Service takes into account appropriate factors such as institutional-size trading in similar groups of securities, yield, quality, coupon rate, maturity, type of issue, trading characteristics and other market data in determining valuations. Short-term instruments with maturities of 60 days or less at the date of purchase are valued at amortized cost, which approximates market value. Other assets and securities for which market valuations are not readily available will be valued at fair value by the Adviser pursuant to policies and procedures adopted by the Board of Directors. At February 28, 2009, there were no securities that had been fair valued.
(B) Fair Value Measurements: The Fund adopted Financial Accounting Standards Board Statement of Financial Accounting Standards No. 157, Fair Value Measurements (“FAS 157”), effective September 1, 2008. In accordance with FAS 157, fair value is defined as the price that the Fund would receive upon selling an investment in a timely transaction to an independent buyer in the principal or most advantageous market of the investment. FAS 157 established a three-tier hierarchy to maximize the use of observable market data and minimize the use of unobservable inputs and to establish classification of fair value measurements for disclosure purposes. Inputs refer broadly to the assumptions that market participants would use in pricing the asset or liability, including assumptions about risk, for example, the risk inherent in a particular valuation technique used to measure fair value including such a pricing model and/or the risk inherent in the inputs to the valuation technique. Inputs may be observable or unobservable. Observable inputs are inputs that reflect the assumptions market participants would use in pricing the asset or liability developed based on market data obtained from sources independent of the reporting entity. Unobservable inputs are inputs that reflect the reporting entity’s own assumptions about the assumptions market participants would use in pricing the asset or liability developed based on the best information available in the circumstances. The three-tier hierarchy of inputs is summarized in the three broad Levels listed below.
● | Level 1 — quoted prices in active markets for identical investments |
● | Level 2 — other significant observable inputs (including quoted prices for similar investments, interest rates, prepayment speeds, credit risk, etc.) |
14 |
Value Line U.S. Government Securities Fund, Inc.
| February 28, 2009 |
● | Level 3 — significant unobservable inputs (including the Fund’s own assumptions in determining the fair value of investments) |
The following is a summary of the inputs used as of February 28, 2009 in valuing the Fund’s investments carried at value:
| Valuation Inputs | Investments in Securities | Other Financial Instruments* | ||||||
| Level 1 — Quoted Prices | $ | — | — | |||||
| Level 2 — Other Significant Observable Inputs | 89,669,009 | — | ||||||
| Level 3 — Significant Unobservable Inputs | — | — | ||||||
| Total | $ | 89,669,009 | — | |||||
| * | Other financial instruments include futures, forwards and swap contracts. |
For the period ended February 28, 2009, there were no Level 3 investments.
(C) Repurchase Agreements: In connection with transactions in repurchase agreements, the Fund’s custodian takes possession of the underlying collateral securities, the value of which exceeds the principal amount of the repurchase transaction, including accrued interest. To the extent that any repurchase transaction exceeds one business day, it is the Fund’s policy to mark-to-market the collateral on a daily basis to ensure the adequacy of the collateral. In the event of default of the obligation to repurchase, the Fund has the right to liquidate the collateral and apply the proceeds in satisfaction of the obligation. Under certain circumstances, in the event of default or bankruptcy by the other party to the agreement, realization and/or retention of the collateral or proceeds may be subject to legal proceedings.
(D) Federal Income Taxes: It is the Fund’s policy to comply with the requirements of the Internal Revenue Code applicable to regulated investment companies, including the distribution requirements of the Tax Reform Act of 1986, and to distribute all of its taxable income and capital gains to its shareholders. Therefore, no federal income tax provision is required.
(E) Security Transactions and Related Income: Security transactions are accounted for on the date the securities are purchased or sold. Realized gains and losses on securities transactions are determined using the identified cost method. Interest income, adjusted for amortization of discount and premium, is earned from settlement date and recognized on the accrual basis. Gains and losses realized on prepayments received on mortgage-related securities are recorded as interest income.
The Fund may invest in Treasury Inflation-Protection Securities (TIPS). The principal value and interest payout of TIPS are periodically adjusted according to the rate of inflation based on the Consumer Price Index. The adjustments for principal and income due to inflation are reflected in interest income in the Statement of Operations.
(F) Representations and Indemnifications: In the normal course of business, the Fund enters into contracts that contain a variety of representations and warranties which provide general indemnifications. The Fund’s maximum exposure under these arrangements is unknown, as this would involve future claims that may be made against the Fund that have not yet occurred. However, based on experience, the Fund expects the risk of loss to be remote.
| 15 |
Value Line U.S. Government Securities Fund, Inc.
| Notes to Financial Statements (unaudited) |
| 2. | Investment Risks |
Securities issued by U.S. Government agencies or government-sponsored enterprises may not be guaranteed by the U.S. Treasury. The Government National Mortgage Association (“GNMA” or “Ginnie Mae”), a wholly-owned U.S. Government corporation, is authorized to guarantee, with the full faith and credit of the U.S. Government, the timely payment of principal and interest on securities issued by institutions approved by GNMA and backed by pools of mortgages insured by the Federal Housing Administration or guaranteed by the Department of Veterans Affairs. Government-related guarantors (i.e., not backed by the full faith and credit of the U.S. Government) include the Federal National Mortgage Association (“FNMA”or “Fannie Mae”) and the Federal Home Loan Mortgage Corporation (“FHLMC” or “Freddie Mac”). Pass-through securities issued by FNMA are guaranteed as to timely payment of principal and interest by FNMA but are not backed by the full faith and credit of the U.S. Government. FHLMC guarantees the timely payment of interest and ultimate collection of principal, but its participation certificates are not backed by the full faith and credit of the U.S. Government.
| 3. | Capital Share Transactions and Diviends to Shareholders |
Transactions in capital stock were as follows:
Six Months Ended February 28, 2009 (unaudited) | Year Ended August 31, 2008 | |||||||
| Shares sold | 303,197 | 476,713 | ||||||
| Shares issued in reinvestment of dividends | 130,244 | 284,139 | ||||||
| Shares repurchased | (435,688 | ) | (980,119 | ) | ||||
| Net decrease | (2,247 | ) | (219,267 | ) | ||||
| Dividends per share from net investment income | $ | 0.2375 | $ | 0.4975 | ||||
Dividends and distributions to shareholders are recorded on the ex-dividend date.
| 4. | Purchases and Sales of Securities |
Purchases and sales of investment securities, excluding short-term investments, were as follows:
Six Months Ended February 28, 2009 (unaudited) | ||||
| Purchases: | ||||
| U.S. Treasury Obligations | $ | 3,295,916 | ||
| U.S. Government Agency Obligations | 11,813,952 | |||
| $ | 15,109,868 | |||
| Sales: | ||||
| U.S. Treasury Obligations | $ | 4,269,173 | ||
| U.S. Government Agency Obligations | 11,628,677 | |||
| $ | 15,897,850 | |||
| 5. | Income Taxes (unaudited) |
At February 28, 2009, information on the tax basis of investments is as follows:
| Cost of investments for tax purposes | $ | 86,014,789 | ||
| Gross tax unrealized appreciation | $ | 3,729,653 | ||
| Gross tax unrealized depreciation | (75,433 | ) | ||
| Net tax unrealized appreciation on investments | $ | 3,654,220 | ||
| Undistributed ordinary income | $ | 297,024 | ||
| Capital loss carryforward, expires August 31, 2012 | $ | (11,348 | ) | |
| Capital loss carryforward, expires August 31, 2014 | (39,865 | ) | ||
| Capital loss carryforward, expires August 31, 2015 | (781,920 | ) | ||
| Capital loss carryforward, at August 31, 2008 | $ | (833,133 | ) |
| 16 |
Value Line U.S. Government Securities Fund, Inc.
| February 28, 2009 |
To the extent that current or future capital gains are offset by capital losses, the Fund does not anticipate distributing any such gains to shareholders.
During the year ended August 31, 2008, the Fund utilized capital loss carryforwards of $585,494.
During the year ended August 31, 2008, $1,546,597 of the Fund’s capital loss carryforward expired.
| 6. | Investment Advisory Fees, Service and Distribution Fees and Transactions With Affiliates |
On June 30, 2008, Value Line, Inc. (“Value Line”) reorganized its investment management division into EULAV Asset Management, LLC (“EULAV”), a newly formed, wholly-owned subsidiary. As part of the reorganization, each advisory agreement was transferred from Value Line to EULAV and EULAV replaced Value Line as the Fund’s investment adviser. The portfolio managers, who are now employees of EULAV, have not changed as a result of the reorganization.
An advisory fee of $221,675 was paid or payable to EULAV, (the “Adviser”), for the six months ended February 28, 2009. This was computed at the rate of 1/2 of 1% of the Fund’s average daily net assets during the period and was paid monthly.
The Adviser provides research, investment programs, and supervision of the investment portfolio and pays costs of administrative services, office space, equipment and compensation of administrative, bookkeeping, and clerical personnel necessary for managing the affairs of the Fund. The Adviser also provides persons, satisfactory to the Fund’s Board of Directors, to act as officers and employees of the Fund and pays their salaries and wages. Direct expenses of the Fund are charged to the Fund while common expenses of the Value Line Funds, are allocated proportionately based upon the Funds’ respective net assets. The Fund bears all other costs and expenses.
The Fund has a Service and Distribution Plan (the “Plan”), adopted pursuant to Rule 12b-1 under the Investment Company Act of 1940. The Plan compensates Value Line Securities, Inc. (the “Distributor” or “VLS”), a wholly-owned subsidiary of Value Line, for advertising, marketing and distributing the Fund’s shares and for servicing the Fund’s shareholders at an annual rate of 0.25% of the Fund’s average daily net assets. Fees amounting to $110,838, before fee waivers, were accrued under this Plan for the six months ended February 28, 2009. Effective March 7, 2006, the Distributor voluntarily reduced the Fund’s 12b-1 Fee by 0.10% under the Plan. Effective February 20, 2007, the Distributor voluntarily increased such waiver to equal 0.25% of the Fund’s average daily net assets. Effective January 1, 2009 through December 31, 2010, the Distributor contractually agreed to waive the 12b-1 fee. The fees waived amounted to $110,838 for the six months ended February 28, 2009. The Distributor has no right to recoup previously waived amounts. There is no assurance that the Distributor will extend the fee waiver beyond such date.
For the six months ended February 28, 2009 the Fund’s expenses were reduced by $4,045 under a custody credit arrangement with the Custodian.
Certain officers, employees and a director of Value Line and the Distributor are also officers and a director of the Fund.
Value Line and/or affiliated companies and the Value Line Profit Sharing and Savings Plan at February 28, 2009 owned 108,965 shares of the Fund’s capital stock, representing less than 1.44% of the outstanding shares. In addition, certain officers and directors of the Fund owned 428 shares, representing less than 1% of the outstanding shares.
| 17 |
Value Line U.S. Government Securities Fund, Inc.
| Notes to Financial Statements (unaudited) |
| 7. | Other |
By letter dated June 15, 2005, the staff of the Northeast Regional Office of the Securities and Exchange Commission (“SEC”) informed Value Line that it was conducting an investigation in the matter of Value Line Securities, Inc. (“VLS”). Value Line has supplied numerous documents to the SEC in response to its requests and various individuals, including employees and former employees of Value Line, directors of the Fund and others, have provided testimony to the SEC. On May 8, 2008, the SEC issued a formal order of private investigation regarding whether VLS’ brokerage charges and related expense reimbursements from the Value Line Funds (“Funds”) during periods prior to 2005 were excessive and whether adequate disclosure was made to the SEC and the Boards of Directors and shareholders of the Funds. Thereafter, certain officers of Value Line, who are former officers of the Funds, asserted their constitutional privilege not to provide testimony. Value Line has informed the Funds that it believes that the SEC has completed the fact finding phase of its investigation and Value Line will seek to settle this matter with the SEC. Although management of Value Line cannot determine the effect that the investigation will have on Value Line’s financial statements, it believes that any settlement is likely to be material to it and has informed the Funds of its belief, in light of settlement discussions to date, that there are no loss contingencies that should be accrued or disclosed in the Fund’s financial statements and that the resolution of this matter is not likely to have a materially adverse effect on the ability of the Adviser or VLS to perform their respective contracts with the Fund.
| 18 |
Value Line U.S. Government Securities Fund, Inc.
| Financial Highlights |
Selected data for a share of capital stock outstanding throughout each period:
Six Months Ended February 28, 2009 (unaudited) | |||||||||||||||||||
| Years Ended August 31, | |||||||||||||||||||
| 2008 | 2007 | 2006 | 2005 | 2004 | |||||||||||||||
| Net asset value, beginning of period | $ | 11.62 | $ | 11.42 | $ | 11.37 | $ | 11.74 | $ | 11.87 | $ | 11.84 | |||||||
| Income from investment operations: | |||||||||||||||||||
| Net investment income | 0.20 | 0.46 | 0.51 | 0.47 | 0.52 | 0.41 | |||||||||||||
| Net gains or (losses) on securities (both realized and unrealized) | 0.38 | 0.24 | 0.03 | (0.32 | ) | (0.19 | ) | 0.03 | |||||||||||
| Total from investment operations | 0.58 | 0.70 | 0.54 | 0.15 | 0.33 | 0.44 | |||||||||||||
| Less distributions: | |||||||||||||||||||
| Dividends from net investment income | (0.24 | ) | (0.50 | ) | (0.49 | ) | (0.52 | ) | (0.46 | ) | (0.41 | ) | |||||||
| Net asset value, end of period | $ | 11.96 | $ | 11.62 | $ | 11.42 | $ | 11.37 | $ | 11.74 | $ | 11.87 | |||||||
| Total return | 5.00 | %(3) | 6.22 | % | 4.86 | % | 1.33 | % | 2.86 | % | 3.79 | % | |||||||
| Ratios/Supplemental Data: | |||||||||||||||||||
| Net assets, end of period (in thousands) | $ | 90,438 | $ | 87,919 | $ | 88,886 | $ | 97,205 | $ | 112,140 | $ | 121,444 | |||||||
Ratio of expenses to average net assets(1) | 1.02 | %(2)(4) | 1.01 | %(2) | 0.93 | %(2) | 1.05 | %(2) | 1.04 | % | 0.98 | % | |||||||
| Ratio of net investment income to average net assets | 3.45 | %(4) | 3.96 | % | 4.28 | % | 3.88 | % | 3.60 | % | 3.40 | % | |||||||
| Portfolio turnover rate | 18 | %(3) | 51 | % | 38 | % | 22 | % | 60 | % | 35 | % | |||||||
| (1) | Ratio reflects expenses grossed up for custody credit arrangement. The ratio of expenses to average net assets, net of custody credits, would have been 1.01% (annualized) for the six months ended February 28, 2009, 1.00% for the year ended August 31, 2008, 0.92% for the year ended August 31, 2007, 1.04% for the year ended August 31, 2006 and would not have changed for the years ended August 31, 2005 and August 31, 2004. |
| (2) | Ratio reflects expenses grossed up for the fee waiver of a portion of the service and distribution plan fees by the Distributor. The ratio of expenses to average net assets net of the fee waiver, but exclusive of the custody credit arrangement would have been 0.77% (annualized) for the six months ended February 28, 2009, 0.76% for the year ended August 31, 2008, 0.75% for the year ended August 31, 2007 and 1.00% as of August 31, 2006. |
| (3) | Not annualized. |
| (4) | Annualized. |
| See Notes to Financial Statements. |
| 19 |
| Value Line U.S. Government Securities Fund, Inc. |
The Fund files its complete schedule of portfolio holdings with the Securities and Exchange Commission (“SEC”) for the first and third quarters of each fiscal year on Form N-Q. The Fund’s Forms N-Q are available on the SEC’s website at http://www.sec.gov and may be reviewed and copied at the SEC’s Public Reference Room in Washington, D.C. Information on the operation of the Public Reference Room may be obtained by calling 1-800-SEC-0330.
A description of the policies and procedures that the Fund uses to determine how to vote proxies relating to portfolio securities, and information regarding how the Fund voted these proxies during the most recent 12-month period ended June 30 is available through the Fund’s website at http://www.vlfunds.com and on the SEC’s website at http://www.sec.gov. The description of the policies and procedures is also available without charge, upon request, by calling 1-800-243-2729.
| 20 |
Value Line U.S. Government Securities Fund, Inc.
| Management of the Fund |
| MANAGEMENT INFORMATION |
The business and affairs of the Fund are managed by the Fund’s officers under the direction of the Board of Directors. The following table sets forth information on each Director and Officer of the Fund. Each Director serves as a director or trustee of each of the 14 Value Line Funds. Each Director serves until his or her successor is elected and qualified.
| Name, Address, and Age | Position | Length of Time Served | Principal Occupation During the Past 5 Years | Other Directorships Held by Director | ||||
Interested Director* | ||||||||
Thomas T. Sarkany Age 62 | Director | Since 2008 | Mutual Fund Marketing Director of Value Line Securities, Inc. (the “Distributor”). | None | ||||
Non-Interested Directors | ||||||||
Joyce E. Heinzerling 500 East 77th Street New York, NY 10162 Age 53 | Director | Since 2008 | General Counsel, Archery Capital LLC (private investment fund). | Burnham Investors Trust, since 2004 (4 funds). | ||||
Francis C. Oakley 54 Scott Hill Road Williamstown, MA 01267 Age 77 | Director (Lead Independent Director since 2008) | Since 2000 | Professor of History, Williams College, (1961 to 2002). Professor Emeritus since 2002. President Emeritus since 1994 and President, (1985–1994); Chairman (1993–1997) and Interim President (2002–2003) of the American Council of Learned Societies. Trustee since 1997 and Chairman of the Board since 2005, National Humanities Center. | None | ||||
David H. Porter 5 Birch Run Drive Saratoga Springs, NY 12866 Age 73 | Director | Since 1997 | Professor, Skidmore College since 2008; Visiting Professor of Classics, Williams College, (1999 – 2008); President Emeritus, Skidmore College since 1999 and President, (1987–1998). | None | ||||
Paul Craig Roberts 169 Pompano St. Panama City Beach, FL 32413 Age 69 | Director | Since 1983 | Chairman, Institute for Political Economy. | None | ||||
Nancy-Beth Sheerr 1409 Beaumont Drive Gladwyne, PA 19035 Age 59 | Director | Since 1996 | Senior Financial Advisor, Veritable L.P. (Investment adviser) since 2004; Senior Financial Advisor, Hawthorn, (2001–2004). | None |
| 21 |
Value Line U.S. Government Securities Fund, Inc.
| Management of the Fund |
| Name, Address, and Age | Position | Length of Time Served | Principal Occupation During the Past 5 Years | Other Directorships Held by Director | ||||
Daniel S. Vandivort 59 Indian Head Road Riverside, CT 06878 Age 54 | Director | Since 2008 | President, Chief Investment Officer, Weiss, Peck and Greer/Robeco Investment Management 2005–2007; Managing Director, Weiss, Peck and Greer, 1995–2005. | None | ||||
Officers | ||||||||
Mitchell E. Appel Age 38 | President | Since 2008 | President of each of the Value Line Funds since June 2008; Chief Financial Officer of Value Line since April 2008 and from September 2005 to November 2007; Treasurer from June 2005 to September 2005; Chief Financial Officer of XTF Asset Management from November 2007 to April 2008; Chief Financial Officer of Circle Trust Company from January 2003 to May 2005; Chief Financial Officer of the Distributor since April 2008; President of the Distributor and President of the Advisor since February 2009. | |||||
Howard A. Brecher Age 55 | Vice President and Secretary | Since 2008 | Vice President and Secretary of each of the Value Line Funds since June 2008; Vice President, Secretary and a Director of Value Line; Vice President of the Distributor and Secretary since June 2008; Secretary of the Advisor since February 2009; Vice President, Secretary, Treasurer, General Counsel and a Director of Arnold Bernhard & Co., Inc. | |||||
Emily D. Washington Age 30 | Treasurer | Since 2008 | Treasurer and Chief Financial Officer (Principal Financial and Accounting Officer) of each of the Value Line Funds Since August 2008; Associate Director of Mutual Fund Accounting at Value Line until August 2008. |
| * | Mr. Sarkany is an “interested person” as defined in the Investment Company Act of 1940 by virtue of his position with the Distributor. |
Unless otherwise indicated, the address for each of the above officers is c/o Value Line Funds, 220 East 42nd Street, New York, NY 10017.
| The Fund’s Statement of Additional Information (SAI) includes additional information about the Fund’s Directors and is available, without charge, upon request by calling 1-800-243-2729 or on the Fund’s website, www.vlfunds.com. |
| 22 |
| Value Line U.S. Government Securities Fund, Inc. |
| [This Page Intentionally Left Blank.] |
| 23 |
Value Line U.S. Government Securities Fund, Inc.
| The Value Line Family of Funds |
1950 — The Value Line Fund seeks long-term growth of capital. Current income is a secondary objective.
1952 — Value Line Income and Growth Fund’s primary investment objective is income, as high and dependable as is consistent with reasonable risk. Capital growth to increase total return is a secondary objective.
1956 — The Value Line Premier Growth Fund seeks long-term growth of capital. No consideration is given to current income in the choice of investments.
1972 — Value Line Larger Companies Fund’s sole investment objective is to realize capital growth.
1979 — The Value Line Cash Fund, a money market fund, seeks to secure as high a level of current income as is consistent with maintaining liquidity and preserving capital. An investment in the Fund is not insured or guaranteed by the Federal Deposit Insurance Corporation or any other government agency. Although the Fund seeks to preserve the value of your investment at $1.00 per share, it is possible to lose money by investing in the Fund.
1981 — Value Line U.S. Government Securities Fund seeks maximum income without undue risk to capital. Under normal conditions, at least 80% of the value of its net assets will be invested in securities issued or guaranteed by the U.S. Government and its agencies and instrumentalities.
1983 — Value Line Centurion Fund* seeks long-term growth of capital.
1984 — The Value Line Tax Exempt Fund seeks to provide investors with the maximum income exempt from federal income taxes while avoiding undue risk to principal. The fund may be subject to state and local taxes and the Alternative Minimum Tax (if applicable).
1985 — Value Line Convertible Fund seeks high current income together with capital appreciation primarily from convertible securities ranked 1 or 2 for year-ahead performance by the Value Line Convertible Ranking System.
1986 — Value Line Aggressive Income Trust seeks to maximize current income.
1987 — Value Line New York Tax Exempt Trust seeks to provide New York taxpayers with the maximum income exempt from New York State, New York City and federal income taxes while avoiding undue risk to principal. The Trust may be subject to state and local taxes and the Alternative Minimum Tax (if applicable).
1987 — Value Line Strategic Asset Management Trust* seeks to achieve a high total investment return consistent with reasonable risk.
1993 — Value Line Emerging Opportunities Fund invests primarily in common stocks or securities convertible into common stock, with its primary objective being long-term growth of capital.
1993 — Value Line Asset Allocation Fund seeks high total investment return, consistent with reasonable risk. The Fund invests in stocks, bonds and money market instruments utilizing quantitative modeling to determine the asset mix.
| * | Only available through the purchase of Guardian Investor, a tax deferred variable annuity, or ValuePlus, a variable life insurance policy. |
For more complete information about any of the Value Line Funds, including charges and expenses, send for a prospectus from Value Line Securities, Inc., 220 East 42nd Street, New York, New York 10017-5891 or call 1-800-243-2729, 9am – 5pm CST, Monday – Friday, or visit us at www.vlfunds.com. Read the prospectus carefully before you invest or send money.
| 24 |
Item 11. Controls and Procedures.
| (a) | The registrant’s principal executive officer and principal financial officer have concluded that the registrant’s disclosure controls and procedures (as defined in rule 30a-2(c) under the Act (17 CFR 270.30a-2(c) ) based on their evaluation of these controls and procedures as of a date within 90 days of the filing date of this report, are appropriately designed to ensure that material information relating to the registrant is made known to such officers and are operating effectively. |
| (b) | The registrant’s principal executive officer and principal financial officer have determined that there have been no significant changes in the registrant’s internal controls or in other factors that could significantly affect these controls subsequent to the date of their evaluation, including corrective actions with regard to significant deficiencies and material weaknesses. |
Item 12. Exhibits.
| (a) | (1) Certification pursuant to Rule 30a-2(a) under the Investment Company Act of 1940 (17 CFR 270.30a-2) attached hereto as Exhibit 99.CERT. |
| (2) Certification pursuant to Section 906 of the Sarbanes-Oxley Act of 2002 attached hereto as Exhibit 99.906.CERT. |
SIGNATURES
Pursuant to the requirements of the Securities Exchange Act of 1934 and the Investment Company Act of 1940, the registrant has duly caused this report to be signed on its behalf by the undersigned, thereunto duly authorized.
| By | /s/ Mitchell E. Appel | |
| Mitchell E. Appel, President |
| Date: | May 8, 2009 |
Pursuant to the requirements of the Securities Exchange Act of 1934 and the Investment Company Act of 1940, this report has been signed below by the following persons on behalf of the registrant and in the capacities and on the dates indicated.
| By: | /s/ Mitchell E. Appel | |
| Mitchell E. Appel, President, Principal Executive Officer |
| By: | /s/ Emily D. Washington | |
| Emily D. Washington, Treasurer, Principal Financial Officer |
| Date: | May 8, 2009 |