UNITED STATES
SECURITIES AND EXCHANGE COMMISSION
Washington, D.C. 20549
FORM N-CSR
CERTIFIED SHAREHOLDER REPORT OF REGISTERED
MANAGEMENT INVESTMENT COMPANIES
Investment Company Act file number 811-02105
Fidelity Salem Street Trust
(Exact name of registrant as specified in charter)
245 Summer St., Boston, MA 02210
(Address of principal executive offices) (Zip code)
Cynthia Lo Bessette, Secretary
245 Summer St.
Boston, Massachusetts 02210
(Name and address of agent for service)
Registrant's telephone number, including area code:
617-563-7000
| |
Date of fiscal year end: | July 31 |
|
|
Date of reporting period: | January 31, 2023 |
Item 1.
Reports to Stockholders
Fidelity® SAI U.S. Momentum Index Fund
Semi-Annual Report
January 31, 2023
Offered exclusively to certain clients of the Adviser, or its affiliates, including Strategic Advisers LLC (Strategic Advisers) - not available for sale to the general public. Fidelity ® SAI is a product name of Fidelity ® funds dedicated to certain programs affiliated with Strategic Advisers.
Contents
To view a fund's proxy voting guidelines and proxy voting record for the 12-month period ended June 30, visit http://www.fidelity.com/proxyvotingresults or visit the Securities and Exchange Commission's (SEC) web site at http://www.sec.gov.
You may also call 1-800-544-3455 to request a free copy of the proxy voting guidelines.
The funds or securities referred to herein are not sponsored, endorsed, or promoted by MSCI, and MSCI bears no liability with respect to any such funds or securities or any index on which such funds or securities are based. The prospectus contains a more detailed description of the limited relationship MSCI has with Fidelity and any related funds.
Standard & Poor's, S&P and S&P 500 are registered service marks of The McGraw-Hill Companies, Inc. and have been licensed for use by Fidelity Distributors Corporation.
Other third-party marks appearing herein are the property of their respective owners.
All other marks appearing herein are registered or unregistered trademarks or service marks of FMR LLC or an affiliated company. © 2023 FMR LLC. All rights reserved.
This report and the financial statements contained herein are submitted for the general information of the shareholders of the Fund. This report is not authorized for distribution to prospective investors in the Fund unless preceded or accompanied by an effective prospectus.
A fund files its complete schedule of portfolio holdings with the SEC for the first and third quarters of each fiscal year on Form N-PORT. Forms N-PORT are available on the SEC's web site at http://www.sec.gov. A fund's Forms N-PORT may be reviewed and copied at the SEC's Public Reference Room in Washington, DC. Information regarding the operation of the SEC's Public Reference Room may be obtained by calling 1-800-SEC-0330.
For a complete list of a fund's portfolio holdings, view the most recent holdings listing, semiannual report, or annual report on Fidelity's web site at http://www.fidelity.com, http://www.institutional.fidelity.com, or http://www.401k.com, as applicable.
NOT FDIC INSURED •MAY LOSE VALUE •NO BANK GUARANTEE
Neither the Fund nor Fidelity Distributors Corporation is a bank.
Top Holdings (% of Fund's net assets) |
| |
| Exxon Mobil Corp. | 5.1 | |
| Chevron Corp. | 4.7 | |
| Eli Lilly & Co. | 4.6 | |
| Merck & Co., Inc. | 4.0 | |
| UnitedHealth Group, Inc. | 3.8 | |
| ConocoPhillips Co. | 2.7 | |
| AbbVie, Inc. | 2.5 | |
| PepsiCo, Inc. | 2.5 | |
| Cigna Corp. | 1.7 | |
| The Coca-Cola Co. | 1.6 | |
| | 33.2 | |
| |
| Market Sectors (% of Fund's net assets) |
| |
| Health Care | 31.0 | |
| Energy | 24.1 | |
| Consumer Staples | 9.6 | |
| Industrials | 8.6 | |
| Financials | 7.5 | |
| Consumer Discretionary | 5.4 | |
| Information Technology | 4.9 | |
| Utilities | 3.7 | |
| Materials | 2.7 | |
| Communication Services | 1.8 | |
| Real Estate | 0.5 | |
| |
Asset Allocation (% of Fund's net assets) |
|
Foreign investments - 3% |
Percentages shown as 0.0% may reflect amounts less than 0.05%. |
|
Showing Percentage of Net Assets
| Common Stocks - 99.8% |
| | | Shares | Value ($) |
| COMMUNICATION SERVICES - 1.8% | | | |
| Entertainment - 0.4% | | | |
| Liberty Media Corp. Liberty Formula One Series C (a) | | 14,164 | 1,002,811 |
| Netflix, Inc. (a) | | 10,497 | 3,714,468 |
| | | | 4,717,279 |
| Media - 0.1% | | | |
| Omnicom Group, Inc. | | 5,712 | 491,175 |
| Wireless Telecommunication Services - 1.3% | | | |
| T-Mobile U.S., Inc. (a) | | 99,166 | 14,806,475 |
TOTAL COMMUNICATION SERVICES | | | 20,014,929 |
| CONSUMER DISCRETIONARY - 5.4% | | | |
| Automobiles - 0.7% | | | |
| Ford Motor Co. | | 69,274 | 935,892 |
| Rivian Automotive, Inc. (a)(b) | | 7,314 | 141,892 |
| Tesla, Inc. (a) | | 41,272 | 7,149,136 |
| | | | 8,226,920 |
| Distributors - 0.4% | | | |
| Genuine Parts Co. | | 26,720 | 4,484,150 |
| LKQ Corp. | | 5,339 | 314,787 |
| | | | 4,798,937 |
| Hotels, Restaurants & Leisure - 0.8% | | | |
| ARAMARK Holdings Corp. | | 10,060 | 447,972 |
| Las Vegas Sands Corp. (a) | | 25,262 | 1,490,458 |
| McDonald's Corp. | | 16,450 | 4,398,730 |
| Starbucks Corp. | | 20,234 | 2,208,339 |
| Wynn Resorts Ltd. (a) | | 2,554 | 264,697 |
| | | | 8,810,196 |
| Internet & Direct Marketing Retail - 0.0% | | | |
| Chewy, Inc. (a)(b) | | 1,714 | 77,233 |
| Multiline Retail - 0.9% | | | |
| Dollar General Corp. | | 26,955 | 6,296,688 |
| Dollar Tree, Inc. (a) | | 25,131 | 3,774,174 |
| | | | 10,070,862 |
| Specialty Retail - 2.6% | | | |
| AutoZone, Inc. (a) | | 3,284 | 8,009,183 |
| O'Reilly Automotive, Inc. (a) | | 10,860 | 8,604,921 |
| Ross Stores, Inc. | | 18,610 | 2,199,516 |
| TJX Companies, Inc. | | 105,399 | 8,627,962 |
| Tractor Supply Co. | | 1,760 | 401,262 |
| Ulta Beauty, Inc. (a) | | 3,071 | 1,578,371 |
| | | | 29,421,215 |
TOTAL CONSUMER DISCRETIONARY | | | 61,405,363 |
| CONSUMER STAPLES - 9.6% | | | |
| Beverages - 4.8% | | | |
| Brown-Forman Corp. Class B (non-vtg.) | | 13,111 | 872,930 |
| Constellation Brands, Inc. Class A (sub. vtg.) | | 7,860 | 1,819,747 |
| Keurig Dr. Pepper, Inc. | | 28,168 | 993,767 |
| Molson Coors Beverage Co. Class B | | 8,470 | 445,353 |
| Monster Beverage Corp. (a) | | 34,732 | 3,614,907 |
| PepsiCo, Inc. | | 165,451 | 28,295,430 |
| The Coca-Cola Co. | | 292,252 | 17,920,893 |
| | | | 53,963,027 |
| Food & Staples Retailing - 1.8% | | | |
| Costco Wholesale Corp. | | 28,281 | 14,455,550 |
| Kroger Co. | | 28,325 | 1,264,145 |
| Walmart, Inc. | | 28,272 | 4,067,493 |
| | | | 19,787,188 |
| Food Products - 3.0% | | | |
| Archer Daniels Midland Co. | | 102,002 | 8,450,866 |
| Bunge Ltd. | | 9,089 | 900,720 |
| Campbell Soup Co. | | 35,827 | 1,860,496 |
| Conagra Brands, Inc. | | 29,096 | 1,082,080 |
| General Mills, Inc. | | 120,645 | 9,453,742 |
| Hormel Foods Corp. | | 11,890 | 538,736 |
| Kellogg Co. | | 34,439 | 2,361,827 |
| Lamb Weston Holdings, Inc. | | 13,137 | 1,312,255 |
| The Hershey Co. | | 25,151 | 5,648,915 |
| The J.M. Smucker Co. | | 14,539 | 2,221,559 |
| Tyson Foods, Inc. Class A | | 5,823 | 382,862 |
| | | | 34,214,058 |
TOTAL CONSUMER STAPLES | | | 107,964,273 |
| ENERGY - 24.1% | | | |
| Energy Equipment & Services - 1.6% | | | |
| Baker Hughes Co. Class A | | 36,137 | 1,146,988 |
| Halliburton Co. | | 115,321 | 4,753,532 |
| Schlumberger Ltd. | | 219,516 | 12,508,022 |
| | | | 18,408,542 |
| Oil, Gas & Consumable Fuels - 22.5% | | | |
| APA Corp. | | 52,042 | 2,307,022 |
| Cheniere Energy, Inc. | | 51,445 | 7,860,282 |
| Chesapeake Energy Corp. | | 7,838 | 679,711 |
| Chevron Corp. | | 306,026 | 53,254,645 |
| ConocoPhillips Co. | | 248,109 | 30,237,044 |
| Coterra Energy, Inc. | | 124,720 | 3,121,742 |
| Devon Energy Corp. | | 110,503 | 6,988,210 |
| Diamondback Energy, Inc. | | 22,242 | 3,250,001 |
| EOG Resources, Inc. | | 89,433 | 11,827,514 |
| EQT Corp. | | 66,062 | 2,158,246 |
| Exxon Mobil Corp. | | 496,494 | 57,598,259 |
| Hess Corp. | | 52,929 | 7,947,819 |
| HF Sinclair Corp. | | 15,870 | 903,003 |
| Kinder Morgan, Inc. | | 25,910 | 474,153 |
| Marathon Oil Corp. | | 125,716 | 3,453,419 |
| Marathon Petroleum Corp. | | 105,245 | 13,526,087 |
| Occidental Petroleum Corp. | | 196,466 | 12,729,032 |
| ONEOK, Inc. | | 14,226 | 974,196 |
| Ovintiv, Inc. | | 16,365 | 805,649 |
| Phillips 66 Co. | | 59,476 | 5,963,659 |
| Pioneer Natural Resources Co. | | 28,971 | 6,673,470 |
| Targa Resources Corp. | | 28,196 | 2,115,264 |
| Texas Pacific Land Corp. (b) | | 1,467 | 2,927,912 |
| The Williams Companies, Inc. | | 154,405 | 4,978,017 |
| Valero Energy Corp. | | 75,029 | 10,506,311 |
| | | | 253,260,667 |
TOTAL ENERGY | | | 271,669,209 |
| FINANCIALS - 7.5% | | | |
| Banks - 0.3% | | | |
| First Citizens Bancshares, Inc. | | 580 | 451,054 |
| First Horizon National Corp. | | 38,412 | 949,929 |
| M&T Bank Corp. | | 12,884 | 2,009,904 |
| | | | 3,410,887 |
| Capital Markets - 1.5% | | | |
| Ameriprise Financial, Inc. | | 6,004 | 2,102,120 |
| Cboe Global Markets, Inc. | | 1,976 | 242,811 |
| Charles Schwab Corp. | | 87,061 | 6,740,263 |
| FactSet Research Systems, Inc. | | 2,943 | 1,244,712 |
| LPL Financial | | 14,528 | 3,444,879 |
| NASDAQ, Inc. | | 7,200 | 433,368 |
| Raymond James Financial, Inc. | | 23,036 | 2,597,770 |
| | | | 16,805,923 |
| Diversified Financial Services - 0.5% | | | |
| Berkshire Hathaway, Inc. Class B (a) | | 16,577 | 5,164,067 |
| Insurance - 5.2% | | | |
| AFLAC, Inc. | | 54,841 | 4,030,814 |
| Allstate Corp. | | 3,513 | 451,315 |
| American Financial Group, Inc. | | 5,486 | 782,249 |
| Aon PLC | | 3,727 | 1,187,720 |
| Arch Capital Group Ltd. (a) | | 47,015 | 3,025,415 |
| Arthur J. Gallagher & Co. | | 32,071 | 6,276,936 |
| Assurant, Inc. | | 1,344 | 178,201 |
| Brown & Brown, Inc. | | 12,226 | 715,955 |
| Chubb Ltd. | | 36,434 | 8,288,371 |
| Erie Indemnity Co. Class A | | 5,462 | 1,334,640 |
| Everest Re Group Ltd. | | 2,865 | 1,001,862 |
| Globe Life, Inc. | | 9,579 | 1,157,622 |
| Marsh & McLennan Companies, Inc. | | 33,643 | 5,884,497 |
| MetLife, Inc. | | 27,094 | 1,978,404 |
| Principal Financial Group, Inc. | | 23,569 | 2,181,311 |
| Progressive Corp. | | 101,005 | 13,772,032 |
| The Travelers Companies, Inc. | | 17,863 | 3,413,977 |
| W.R. Berkley Corp. | | 33,336 | 2,338,187 |
| Willis Towers Watson PLC | | 4,418 | 1,123,011 |
| | | | 59,122,519 |
TOTAL FINANCIALS | | | 84,503,396 |
| HEALTH CARE - 31.0% | | | |
| Biotechnology - 8.1% | | | |
| AbbVie, Inc. | | 193,044 | 28,522,251 |
| Alnylam Pharmaceuticals, Inc. (a) | | 17,949 | 4,063,654 |
| Amgen, Inc. | | 51,526 | 13,005,162 |
| Biogen, Inc. (a) | | 15,069 | 4,383,572 |
| BioMarin Pharmaceutical, Inc. (a) | | 17,672 | 2,038,465 |
| Gilead Sciences, Inc. | | 149,483 | 12,547,603 |
| Horizon Therapeutics PLC (a) | | 5,972 | 655,248 |
| Neurocrine Biosciences, Inc. (a) | | 15,616 | 1,732,283 |
| Regeneron Pharmaceuticals, Inc. (a) | | 9,514 | 7,216,084 |
| Seagen, Inc. (a) | | 4,059 | 566,149 |
| Vertex Pharmaceuticals, Inc. (a) | | 53,258 | 17,207,660 |
| | | | 91,938,131 |
| Health Care Equipment & Supplies - 0.5% | | | |
| Boston Scientific Corp. (a) | | 60,576 | 2,801,640 |
| DexCom, Inc. (a) | | 17,192 | 1,841,091 |
| Insulet Corp. (a) | | 3,186 | 915,402 |
| | | | 5,558,133 |
| Health Care Providers & Services - 11.0% | | | |
| AmerisourceBergen Corp. | | 22,679 | 3,831,844 |
| Cardinal Health, Inc. | | 54,240 | 4,190,040 |
| Centene Corp. (a) | | 59,527 | 4,538,338 |
| Cigna Corp. | | 61,445 | 19,457,788 |
| CVS Health Corp. | | 89,596 | 7,904,159 |
| Elevance Health, Inc. | | 31,301 | 15,650,187 |
| HCA Holdings, Inc. | | 5,847 | 1,491,394 |
| Humana, Inc. | | 16,008 | 8,191,294 |
| McKesson Corp. | | 35,030 | 13,265,160 |
| Molina Healthcare, Inc. (a) | | 6,621 | 2,064,626 |
| UnitedHealth Group, Inc. | | 86,108 | 42,984,253 |
| Universal Health Services, Inc. Class B | | 1,845 | 273,447 |
| | | | 123,842,530 |
| Life Sciences Tools & Services - 0.2% | | | |
| Agilent Technologies, Inc. | | 12,047 | 1,832,108 |
| Pharmaceuticals - 11.2% | | | |
| Bristol-Myers Squibb Co. | | 213,036 | 15,477,065 |
| Eli Lilly & Co. | | 150,652 | 51,846,886 |
| Jazz Pharmaceuticals PLC (a) | | 4,124 | 646,066 |
| Johnson & Johnson | | 31,033 | 5,071,413 |
| Merck & Co., Inc. | | 425,410 | 45,693,288 |
| Pfizer, Inc. | | 172,280 | 7,607,885 |
| Royalty Pharma PLC | | 15,458 | 605,799 |
| | | | 126,948,402 |
TOTAL HEALTH CARE | | | 350,119,304 |
| INDUSTRIALS - 8.6% | | | |
| Aerospace & Defense - 3.6% | | | |
| General Dynamics Corp. | | 29,663 | 6,913,259 |
| HEICO Corp. (b) | | 2,902 | 496,097 |
| HEICO Corp. Class A | | 1,580 | 211,214 |
| Howmet Aerospace, Inc. | | 17,825 | 725,299 |
| Huntington Ingalls Industries, Inc. | | 5,911 | 1,303,612 |
| L3Harris Technologies, Inc. | | 4,328 | 929,741 |
| Lockheed Martin Corp. | | 29,200 | 13,527,192 |
| Northrop Grumman Corp. | | 29,974 | 13,429,551 |
| Raytheon Technologies Corp. | | 28,736 | 2,869,290 |
| | | | 40,405,255 |
| Air Freight & Logistics - 0.1% | | | |
| C.H. Robinson Worldwide, Inc. | | 9,646 | 966,240 |
| Building Products - 0.2% | | | |
| Carlisle Companies, Inc. | | 5,855 | 1,468,785 |
| Trane Technologies PLC | | 3,966 | 710,390 |
| | | | 2,179,175 |
| Commercial Services & Supplies - 0.9% | | | |
| Republic Services, Inc. | | 18,082 | 2,256,995 |
| Rollins, Inc. | | 20,697 | 753,371 |
| Waste Connections, Inc. (United States) | | 16,017 | 2,128,659 |
| Waste Management, Inc. | | 36,009 | 5,571,673 |
| | | | 10,710,698 |
| Construction & Engineering - 0.3% | | | |
| Quanta Services, Inc. | | 24,292 | 3,696,999 |
| Electrical Equipment - 0.3% | | | |
| AMETEK, Inc. | | 9,125 | 1,322,395 |
| Emerson Electric Co. | | 13,708 | 1,236,736 |
| Hubbell, Inc. Class B | | 4,614 | 1,056,191 |
| | | | 3,615,322 |
| Industrial Conglomerates - 0.3% | | | |
| Honeywell International, Inc. | | 15,982 | 3,331,927 |
| Machinery - 1.9% | | | |
| Caterpillar, Inc. | | 25,289 | 6,380,162 |
| Cummins, Inc. | | 10,840 | 2,705,014 |
| Deere & Co. | | 16,090 | 6,803,496 |
| IDEX Corp. | | 6,470 | 1,550,730 |
| PACCAR, Inc. | | 31,921 | 3,489,285 |
| Snap-On, Inc. | | 953 | 237,040 |
| Xylem, Inc. | | 8,260 | 859,123 |
| | | | 22,024,850 |
| Professional Services - 0.4% | | | |
| Booz Allen Hamilton Holding Corp. Class A | | 22,446 | 2,124,289 |
| CoStar Group, Inc. (a) | | 23,795 | 1,853,631 |
| Leidos Holdings, Inc. | | 5,467 | 540,358 |
| | | | 4,518,278 |
| Road & Rail - 0.1% | | | |
| Knight-Swift Transportation Holdings, Inc. Class A | | 2,555 | 151,001 |
| Old Dominion Freight Lines, Inc. | | 1,770 | 589,835 |
| U-Haul Holding Co. (non-vtg.) | | 1,422 | 87,865 |
| | | | 828,701 |
| Trading Companies & Distributors - 0.5% | | | |
| United Rentals, Inc. | | 2,000 | 881,900 |
| W.W. Grainger, Inc. | | 7,186 | 4,236,003 |
| | | | 5,117,903 |
TOTAL INDUSTRIALS | | | 97,395,348 |
| INFORMATION TECHNOLOGY - 4.9% | | | |
| Communications Equipment - 0.6% | | | |
| Arista Networks, Inc. (a) | | 25,038 | 3,155,289 |
| Juniper Networks, Inc. | | 4,291 | 138,599 |
| Motorola Solutions, Inc. | | 12,172 | 3,128,326 |
| | | | 6,422,214 |
| Electronic Equipment & Components - 0.1% | | | |
| Keysight Technologies, Inc. (a) | | 7,444 | 1,335,081 |
| IT Services - 1.9% | | | |
| Automatic Data Processing, Inc. | | 57,250 | 12,927,623 |
| Broadridge Financial Solutions, Inc. | | 3,047 | 458,147 |
| EPAM Systems, Inc. (a) | | 3,311 | 1,101,404 |
| Gartner, Inc. (a) | | 6,304 | 2,131,635 |
| IBM Corp. | | 15,793 | 2,127,791 |
| Jack Henry & Associates, Inc. | | 8,102 | 1,459,089 |
| Paychex, Inc. | | 14,009 | 1,623,083 |
| | | | 21,828,772 |
| Semiconductors & Semiconductor Equipment - 1.2% | | | |
| Enphase Energy, Inc. (a) | | 26,227 | 5,806,133 |
| First Solar, Inc. (a) | | 12,075 | 2,144,520 |
| KLA Corp. | | 2,493 | 978,453 |
| onsemi (a) | | 63,546 | 4,667,454 |
| SolarEdge Technologies, Inc. (a) | | 1,660 | 529,756 |
| | | | 14,126,316 |
| Software - 1.1% | | | |
| Aspen Technology, Inc. (a) | | 1,567 | 311,441 |
| Black Knight, Inc. (a) | | 3,330 | 201,765 |
| Cadence Design Systems, Inc. (a) | | 24,357 | 4,453,190 |
| Fair Isaac Corp. (a) | | 2,436 | 1,622,254 |
| Fortinet, Inc. (a) | | 11,702 | 612,483 |
| Palo Alto Networks, Inc. (a)(b) | | 15,903 | 2,522,852 |
| Synopsys, Inc. (a) | | 7,000 | 2,476,250 |
| | | | 12,200,235 |
TOTAL INFORMATION TECHNOLOGY | | | 55,912,618 |
| MATERIALS - 2.7% | | | |
| Chemicals - 1.9% | | | |
| Air Products & Chemicals, Inc. | | 10,286 | 3,296,766 |
| Albemarle Corp. | | 10,006 | 2,816,189 |
| CF Industries Holdings, Inc. | | 40,119 | 3,398,079 |
| Corteva, Inc. | | 120,996 | 7,798,192 |
| FMC Corp. | | 8,777 | 1,168,482 |
| RPM International, Inc. | | 11,252 | 1,011,667 |
| The Mosaic Co. | | 39,988 | 1,981,006 |
| | | | 21,470,381 |
| Containers & Packaging - 0.0% | | | |
| Amcor PLC | | 32,149 | 387,717 |
| Metals & Mining - 0.8% | | | |
| Nucor Corp. | | 28,883 | 4,881,805 |
| Steel Dynamics, Inc. | | 31,035 | 3,744,062 |
| | | | 8,625,867 |
TOTAL MATERIALS | | | 30,483,965 |
| REAL ESTATE - 0.5% | | | |
| Equity Real Estate Investment Trusts (REITs) - 0.5% | | | |
| Extra Space Storage, Inc. | | 4,747 | 749,219 |
| Gaming & Leisure Properties | | 4,542 | 243,270 |
| Host Hotels & Resorts, Inc. | | 11,294 | 212,892 |
| Iron Mountain, Inc. | | 14,136 | 771,543 |
| VICI Properties, Inc. | | 82,650 | 2,824,977 |
| WP Carey, Inc. | | 4,237 | 362,391 |
| | | | 5,164,292 |
| UTILITIES - 3.7% | | | |
| Electric Utilities - 2.1% | | | |
| American Electric Power Co., Inc. | | 32,387 | 3,043,083 |
| Constellation Energy Corp. | | 70,280 | 5,999,101 |
| Edison International | | 23,616 | 1,627,142 |
| Exelon Corp. | | 69,480 | 2,931,361 |
| FirstEnergy Corp. | | 7,198 | 294,758 |
| NRG Energy, Inc. | | 10,177 | 348,257 |
| PG&E Corp. (a) | | 187,130 | 2,975,367 |
| Southern Co. | | 79,595 | 5,386,990 |
| Xcel Energy, Inc. | | 13,355 | 918,423 |
| | | | 23,524,482 |
| Gas Utilities - 0.1% | | | |
| Atmos Energy Corp. | | 14,370 | 1,689,050 |
| Independent Power and Renewable Electricity Producers - 0.2% | | | |
| The AES Corp. | | 68,533 | 1,878,490 |
| Vistra Corp. | | 36,354 | 838,323 |
| | | | 2,716,813 |
| Multi-Utilities - 1.3% | | | |
| CenterPoint Energy, Inc. | | 62,425 | 1,880,241 |
| Consolidated Edison, Inc. | | 42,395 | 4,040,667 |
| DTE Energy Co. | | 4,091 | 476,070 |
| NiSource, Inc. | | 19,114 | 530,414 |
| Sempra Energy | | 41,398 | 6,637,341 |
| WEC Energy Group, Inc. | | 8,248 | 775,230 |
| | | | 14,339,963 |
TOTAL UTILITIES | | | 42,270,308 |
| TOTAL COMMON STOCKS (Cost $938,550,035) | | | 1,126,903,005 |
| | | | |
| U.S. Treasury Obligations - 0.1% |
| | | Principal Amount (c) | Value ($) |
U.S. Treasury Bills, yield at date of purchase 4.65% 6/29/23 (d) (Cost $294,373) | | 300,000 | 294,368 |
| | | | |
| Money Market Funds - 0.5% |
| | | Shares | Value ($) |
| Fidelity Cash Central Fund 4.38% (e) | | 883,210 | 883,387 |
| Fidelity Securities Lending Cash Central Fund 4.38% (e)(f) | | 4,822,943 | 4,823,425 |
| TOTAL MONEY MARKET FUNDS (Cost $5,706,812) | | | 5,706,812 |
| | | | |
| TOTAL INVESTMENT IN SECURITIES - 100.4% (Cost $944,551,220) | 1,132,904,185 |
NET OTHER ASSETS (LIABILITIES) - (0.4)% | (4,025,286) |
| NET ASSETS - 100.0% | 1,128,878,899 |
| | |
| Futures Contracts |
| | Number of contracts | Expiration Date | Notional Amount ($) | Value ($) | Unrealized Appreciation/ (Depreciation) ($) |
| Purchased | | | | | |
| | | | | | |
| Equity Index Contracts | | | | | |
| CME E-mini S&P 500 Index Contracts (United States) | 9 | Mar 2023 | 1,840,500 | 51,869 | 51,869 |
| | | | | | |
| The notional amount of futures purchased as a percentage of Net Assets is 0.2% |
Legend
| (b) | Security or a portion of the security is on loan at period end. |
| (c) | Amount is stated in United States dollars unless otherwise noted. |
| (d) | Security or a portion of the security was pledged to cover margin requirements for futures contracts. At period end, the value of securities pledged amounted to $112,841. |
| (e) | Affiliated fund that is generally available only to investment companies and other accounts managed by Fidelity Investments. The rate quoted is the annualized seven-day yield of the fund at period end. A complete unaudited listing of the fund's holdings as of its most recent quarter end is available upon request. In addition, each Fidelity Central Fund's financial statements are available on the SEC's website or upon request. |
| (f) | Investment made with cash collateral received from securities on loan. |
Affiliated Central Funds
Fiscal year to date information regarding the Fund's investments in Fidelity Central Funds, including the ownership percentage, is presented below.
| Affiliate | Value, beginning of period ($) | Purchases ($) | Sales Proceeds ($) | Dividend Income ($) | Realized Gain (loss) ($) | Change in Unrealized appreciation (depreciation) ($) | Value, end of period ($) | % ownership, end of period |
| Fidelity Cash Central Fund 4.38% | 4,991,361 | 74,750,397 | 78,858,371 | 38,329 | - | - | 883,387 | 0.0% |
| Fidelity Securities Lending Cash Central Fund 4.38% | 2,360,785 | 37,119,570 | 34,656,930 | 17,514 | - | - | 4,823,425 | 0.0% |
| Total | 7,352,146 | 111,869,967 | 113,515,301 | 55,843 | - | - | 5,706,812 | |
| | | | | | | | | |
Amounts in the dividend income column in the above table include any capital gain distributions from underlying funds, which are presented in the corresponding line item in the Statement of Operations, if applicable.
Amount for Fidelity Securities Lending Cash Central Fund represents the income earned on investing cash collateral, less rebates paid to borrowers and any lending agent fees associated with the loan, plus any premium payments received for lending certain types of securities.
Amounts included in the purchases and sales proceeds columns may include in-kind transactions, if applicable.
Investment Valuation
The following is a summary of the inputs used, as of January 31, 2023, involving the Fund's assets and liabilities carried at fair value. The inputs or methodology used for valuing securities may not be an indication of the risk associated with investing in those securities. For more information on valuation inputs, and their aggregation into the levels used below, please refer to the Investment Valuation section in the accompanying Notes to Financial Statements.
| Valuation Inputs at Reporting Date: |
| Description | Total ($) | Level 1 ($) | Level 2 ($) | Level 3 ($) |
Investments in Securities: | | | | |
|
| Equities: | | | | |
Communication Services | 20,014,929 | 20,014,929 | - | - |
Consumer Discretionary | 61,405,363 | 61,405,363 | - | - |
Consumer Staples | 107,964,273 | 107,964,273 | - | - |
Energy | 271,669,209 | 271,669,209 | - | - |
Financials | 84,503,396 | 84,503,396 | - | - |
Health Care | 350,119,304 | 350,119,304 | - | - |
Industrials | 97,395,348 | 97,395,348 | - | - |
Information Technology | 55,912,618 | 55,912,618 | - | - |
Materials | 30,483,965 | 30,483,965 | - | - |
Real Estate | 5,164,292 | 5,164,292 | - | - |
Utilities | 42,270,308 | 42,270,308 | - | - |
|
| U.S. Government and Government Agency Obligations | 294,368 | - | 294,368 | - |
|
| Money Market Funds | 5,706,812 | 5,706,812 | - | - |
| Total Investments in Securities: | 1,132,904,185 | 1,132,609,817 | 294,368 | - |
Derivative Instruments: | | | | �� |
|
| Assets | | | | |
Futures Contracts | 51,869 | 51,869 | - | - |
| Total Assets | 51,869 | 51,869 | - | - |
| Total Derivative Instruments: | 51,869 | 51,869 | - | - |
Value of Derivative Instruments
The following table is a summary of the Fund's value of derivative instruments by primary risk exposure as of January 31, 2023. For additional information on derivative instruments, please refer to the Derivative Instruments section in the accompanying Notes to Financial Statements.
Primary Risk Exposure / Derivative Type | Value |
| Asset ($) | Liability ($) |
| Equity Risk | | |
Futures Contracts (a) | 51,869 | 0 |
| Total Equity Risk | 51,869 | 0 |
| Total Value of Derivatives | 51,869 | 0 |
(a)Reflects gross cumulative appreciation (depreciation) on futures contracts as presented in the Schedule of Investments. In the Statement of Assets and Liabilities, the period end daily variation margin is included in receivable or payable for daily variation margin on futures contracts, and the net cumulative appreciation (depreciation) is included in Total accumulated earnings (loss).
| Statement of Assets and Liabilities |
| | | | January 31, 2023 (Unaudited) |
| | | | | |
| Assets | | | | |
| Investment in securities, at value (including securities loaned of $4,762,735) - See accompanying schedule: | | | | |
Unaffiliated issuers (cost $938,844,408) | $ | 1,127,197,373 | | |
Fidelity Central Funds (cost $5,706,812) | | 5,706,812 | | |
| | | | | |
| | | | | |
| Total Investment in Securities (cost $944,551,220) | | | $ | 1,132,904,185 |
| Receivable for investments sold | | | | 78,606,627 |
| Receivable for fund shares sold | | | | 175,032 |
| Dividends receivable | | | | 904,766 |
| Distributions receivable from Fidelity Central Funds | | | | 2,194 |
| Receivable for daily variation margin on futures contracts | | | | 28,763 |
| Prepaid expenses | | | | 3,594 |
Total assets | | | | 1,212,625,161 |
| Liabilities | | | | |
| Payable for investments purchased | $ | 78,338,773 | | |
| Payable for fund shares redeemed | | 436,418 | | |
| Accrued management fee | | 93,924 | | |
| Other payables and accrued expenses | | 53,722 | | |
| Collateral on securities loaned | | 4,823,425 | | |
| Total Liabilities | | | | 83,746,262 |
| Net Assets | | | $ | 1,128,878,899 |
| Net Assets consist of: | | | | |
| Paid in capital | | | $ | 1,033,113,213 |
| Total accumulated earnings (loss) | | | | 95,765,686 |
| Net Assets | | | $ | 1,128,878,899 |
Net Asset Value , offering price and redemption price per share ($1,128,878,899 ÷ 81,476,616 shares) | | | $ | 13.86 |
| Statement of Operations |
| | | | Six months ended January 31, 2023 (Unaudited) |
| Investment Income | | | | |
| Dividends | | | $ | 34,661,646 |
| Interest | | | | 3,848 |
| Income from Fidelity Central Funds (including $17,514 from security lending) | | | | 55,843 |
| Total Income | | | | 34,721,337 |
| Expenses | | | | |
| Management fee | $ | 1,464,333 | | |
| Custodian fees and expenses | | 36,928 | | |
| Independent trustees' fees and expenses | | 6,836 | | |
| Registration fees | | 30,908 | | |
| Audit | | 27,847 | | |
| Legal | | 3,857 | | |
| Interest | | 42,483 | | |
| Miscellaneous | | 11,036 | | |
| Total Expenses | | | | 1,624,228 |
| Net Investment income (loss) | | | | 33,097,109 |
| Realized and Unrealized Gain (Loss) | | | | |
| Net realized gain (loss) on: | | | | |
| Investment Securities: | | | | |
| Unaffiliated issuers | | 113,919,467 | | |
| Futures contracts | | 169,972 | | |
| Total net realized gain (loss) | | | | 114,089,439 |
| Change in net unrealized appreciation (depreciation) on: | | | | |
| Investment Securities: | | | | |
| Unaffiliated issuers | | (101,876,047) | | |
| Futures contracts | | (615,371) | | |
| Total change in net unrealized appreciation (depreciation) | | | | (102,491,418) |
| Net gain (loss) | | | | 11,598,021 |
| Net increase (decrease) in net assets resulting from operations | | | $ | 44,695,130 |
| Statement of Changes in Net Assets |
| |
| | Six months ended January 31, 2023 (Unaudited) | | Year ended July 31, 2022 |
| Increase (Decrease) in Net Assets | | | | |
| Operations | | | | |
| Net investment income (loss) | $ | 33,097,109 | $ | 42,515,461 |
| Net realized gain (loss) | | 114,089,439 | | (109,569,656) |
| Change in net unrealized appreciation (depreciation) | | (102,491,418) | | (275,243,396) |
| Net increase (decrease) in net assets resulting from operations | | 44,695,130 | | (342,297,591) |
| Distributions to shareholders | | (61,615,588) | | (545,772,044) |
| Share transactions | | | | |
| Proceeds from sales of shares | | 41,450,493 | | 2,470,011,092 |
| Reinvestment of distributions | | 60,451,730 | | 528,193,833 |
| Cost of shares redeemed | | (3,480,338,243) | | (494,759,472) |
Net increase (decrease) in net assets resulting from share transactions | | (3,378,436,020) | | 2,503,445,453 |
| Total increase (decrease) in net assets | | (3,395,356,478) | | 1,615,375,818 |
| | | | | |
| Net Assets | | | | |
| Beginning of period | | 4,524,235,377 | | 2,908,859,559 |
| End of period | $ | 1,128,878,899 | $ | 4,524,235,377 |
| | | | | |
| Other Information | | | | |
| Shares | | | | |
| Sold | | 3,021,722 | | 172,552,413 |
| Issued in reinvestment of distributions | | 4,354,609 | | 31,671,872 |
| Redeemed | | (250,149,598) | | (32,697,591) |
| Net increase (decrease) | | (242,773,267) | | 171,526,694 |
| | | | | |
Financial Highlights
| Fidelity® SAI U.S. Momentum Index Fund |
| |
| | Six months ended (Unaudited) January 31, 2023 | | Years ended July 31, 2022 | | 2021 | | 2020 | | 2019 | | 2018 |
Selected Per-Share Data | | | | | | | | | | | | |
| Net asset value, beginning of period | $ | 13.95 | $ | 19.05 | $ | 15.74 | $ | 13.77 | $ | 13.31 | $ | 10.98 |
| Income from Investment Operations | | | | | | | | | | | | |
Net investment income (loss) A,B | | .16 | | .19 | | .10 | | .19 | | .20 | | .15 |
| Net realized and unrealized gain (loss) | | .04 C | | (1.81) | | 4.66 | | 2.07 | | .71 D | | 2.29 |
| Total from investment operations | | .20 | | (1.62) | | 4.76 | | 2.26 | | .91 | | 2.44 |
| Distributions from net investment income | | (.29) | | (.10) | | (.18) | | (.22) | | (.12) | | (.06) |
| Distributions from net realized gain | | - | | (3.38) | | (1.27) | | (.08) | | (.33) | | (.04) |
| Total distributions | | (.29) | | (3.48) | | (1.45) | | (.29) E | | (.45) | | (.11) E |
| Net asset value, end of period | $ | 13.86 | $ | 13.95 | $ | 19.05 | $ | 15.74 | $ | 13.77 | $ | 13.31 |
Total Return F,G | | 1.45% C | | (11.06)% | | 32.98% | | 16.76% | | 6.94% D | | 22.33% |
Ratios to Average Net Assets B,H,I | | | | | | | | | | | | |
| Expenses before reductions | | .11% J | | .11% | | .11% | | .11% | | .21% | | .23% |
| Expenses net of fee waivers, if any | | .11% J | | .11% | | .11% | | .11% | | .15% | | .15% |
| Expenses net of all reductions | | .11% J | | .11% | | .11% | | .11% | | .15% | | .15% |
| Net investment income (loss) | | 2.23% J | | 1.25% | | .58% | | 1.36% | | 1.54% | | 1.19% |
| Supplemental Data | | | | | | | | | | | | |
| Net assets, end of period (000 omitted) | $ | 1,128,879 | $ | 4,524,235 | $ | 2,908,860 | $ | 1,798,387 | $ | 3,655,491 | $ | 2,512,747 |
Portfolio turnover rate K | | 85% J | | 138% | | 128% | | 163% | | 161% | | 153% |
A Calculated based on average shares outstanding during the period.
B Net investment income (loss) is affected by the timing of the declaration of dividends by any underlying mutual funds or exchange-traded funds (ETFs). Net investment income (loss) of any mutual funds or ETFs is not included in the Fund's net investment income (loss) ratio.
C Amount includes a reimbursement from the investment adviser for an operational error which amounted to less than $.01 per share. Excluding this reimbursement, the total return would have been 1.43%.
D Amount includes a reimbursement from the investment adviser for an operational error which amounted to less than $.01 per share. Excluding this reimbursement, the total return would have been 6.91%.
E Total distributions per share do not sum due to rounding.
F Total returns for periods of less than one year are not annualized.
G Total returns would have been lower if certain expenses had not been reduced during the applicable periods shown.
H Fees and expenses of any underlying mutual funds or exchange-traded funds (ETFs) are not included in the Fund's expense ratio. The Fund indirectly bears its proportionate share of these expenses. For additional expense information related to investments in Fidelity Central Funds, please refer to the "Investments in Fidelity Central Funds" note found in the Notes to Financial Statements section of the most recent Annual or Semi-Annual report.
I Expense ratios reflect operating expenses of the class. Expenses before reductions do not reflect amounts reimbursed, waived, or reduced through arrangements with the investment adviser, brokerage services, or other offset arrangements, if applicable, and do not represent the amount paid by the class during periods when reimbursements, waivers or reductions occur.
J Annualized.
K Amount does not include the portfolio activity of any underlying mutual funds or exchange-traded funds (ETFs).
For the period ended January 31, 2023
1. Organization.
Fidelity SAI U.S. Momentum Index Fund (the Fund) is a fund of Fidelity Salem Street Trust (the Trust) and is authorized to issue an unlimited number of shares. Shares are offered exclusively to certain clients of Fidelity Management & Research Company LLC (FMR) or its affiliates. The Trust is registered under the Investment Company Act of 1940, as amended (the 1940 Act), as an open-end management investment company organized as a Massachusetts business trust.
2. Investments in Fidelity Central Funds.
Funds may invest in Fidelity Central Funds, which are open-end investment companies generally available only to other investment companies and accounts managed by the investment adviser and its affiliates. The Schedule of Investments lists any Fidelity Central Funds held as an investment as of period end, but does not include the underlying holdings of each Fidelity Central Fund. An investing fund indirectly bears its proportionate share of the expenses of the underlying Fidelity Central Funds.
Based on its investment objective, each Fidelity Central Fund may invest or participate in various investment vehicles or strategies that are similar to those of the investing fund. These strategies are consistent with the investment objectives of the investing fund and may involve certain economic risks which may cause a decline in value of each of the Fidelity Central Funds and thus a decline in the value of the investing fund.
| Fidelity Central Fund | Investment Manager | Investment Objective | Investment Practices | Expense Ratio A |
| Fidelity Money Market Central Funds | Fidelity Management & Research Company LLC (FMR) | Each fund seeks to obtain a high level of current income consistent with the preservation of capital and liquidity. | Short-term Investments | Less than .005% |
A Expenses expressed as a percentage of average net assets and are as of each underlying Central Fund's most recent annual or semi-annual shareholder report.
A complete unaudited list of holdings for each Fidelity Central Fund is available upon request or at the Securities and Exchange Commission website at www.sec.gov. In addition, the financial statements of the Fidelity Central Funds which contain the significant accounting policies (including investment valuation policies) of those funds, and are not covered by the Report of Independent Registered Public Accounting Firm, are available on the Securities and Exchange Commission website or upon request.
3. Significant Accounting Policies.
The Fund is an investment company and applies the accounting and reporting guidance of the Financial Accounting Standards Board (FASB) Accounting Standards Codification Topic 946 Financial Services - Investment Companies . The financial statements have been prepared in conformity with accounting principles generally accepted in the United States of America (GAAP), which require management to make certain estimates and assumptions at the date of the financial statements. Actual results could differ from those estimates. Subsequent events, if any, through the date that the financial statements were issued have been evaluated in the preparation of the financial statements. The Fund's Schedule of Investments lists any underlying mutual funds or exchange-traded funds (ETFs) but does not include the underlying holdings of these funds. The following summarizes the significant accounting policies of the Fund:
Investment Valuation. Investments are valued as of 4:00 p.m. Eastern time on the last calendar day of the period. The Board of Trustees (the Board) has designated the Fund's investment adviser as the valuation designee responsible for the fair valuation function and performing fair value determinations as needed. The investment adviser has established a Fair Value Committee (the Committee) to carry out the day-to-day fair valuation responsibilities and has adopted policies and procedures to govern the fair valuation process and the activities of the Committee. In accordance with these fair valuation policies and procedures, which have been approved by the Board, the Fund attempts to obtain prices from one or more third party pricing services or brokers to value its investments. When current market prices, quotations or currency exchange rates are not readily available or reliable, investments will be fair valued in good faith by the Committee, in accordance with the policies and procedures. Factors used in determining fair value vary by investment type and may include market or investment specific events, transaction data, estimated cash flows, and market observations of comparable investments. The frequency that the fair valuation procedures are used cannot be predicted and they may be utilized to a significant extent. The Committee manages the Fund's fair valuation practices and maintains the fair valuation policies and procedures. The Fund's investment adviser reports to the Board information regarding the fair valuation process and related material matters.
The Fund categorizes the inputs to valuation techniques used to value its investments into a disclosure hierarchy consisting of three levels as shown below:
Level 1 - unadjusted quoted prices in active markets for identical investments
Level 2 - other significant observable inputs (including quoted prices for similar investments, interest rates, prepayment speeds, etc.)
Level 3 - unobservable inputs (including the Fund's own assumptions based on the best information available)
Valuation techniques used to value the Fund's investments by major category are as follows:
Equity securities, including restricted securities, for which market quotations are readily available, are valued at the last reported sale price or official closing price as reported by a third party pricing service on the primary market or exchange on which they are traded and are categorized as Level 1 in the hierarchy. In the event there were no sales during the day or closing prices are not available, securities are valued at the last quoted bid price or may be valued using the last available price and are generally categorized as Level 2 in the hierarchy. For foreign equity securities, when market or security specific events arise, comparisons to the valuation of American Depositary Receipts (ADRs), futures contracts, ETFs and certain indexes as well as quoted prices for similar securities may be used and would be categorized as Level 2 in the hierarchy. For equity securities, including restricted securities, where observable inputs are limited, assumptions about market activity and risk are used and these securities may be categorized as Level 3 in the hierarchy.
Debt securities, including restricted securities, are valued based on evaluated prices received from third party pricing services or from brokers who make markets in such securities. U.S. government and government agency obligations are valued by pricing services who utilize matrix pricing which considers yield or price of bonds of comparable quality, coupon, maturity and type or by broker-supplied prices. When independent prices are unavailable or unreliable, debt securities may be valued utilizing pricing methodologies which consider similar factors that would be used by third party pricing services. Debt securities are generally categorized as Level 2 in the hierarchy but may be Level 3 depending on the circumstances.
Futures contracts are valued at the settlement price established each day by the board of trade or exchange on which they are traded and are categorized as Level 1 in the hierarchy. Investments in open-end mutual funds, including the Fidelity Central Funds, are valued at their closing net asset value (NAV) each business day and are categorized as Level 1 in the hierarchy.
Changes in valuation techniques may result in transfers in or out of an assigned level within the disclosure hierarchy. The aggregate value of investments by input level as of January 31, 2023 is included at the end of the Fund's Schedule of Investments.
Investment Transactions and Income. For financial reporting purposes, the Fund's investment holdings and NAV include trades executed through the end of the last business day of the period. The NAV per share for processing shareholder transactions is calculated as of the close of business of the New York Stock Exchange (NYSE), normally 4:00 p.m. Eastern time and includes trades executed through the end of the prior business day. Gains and losses on securities sold are determined on the basis of identified cost. Commissions paid to certain brokers with whom the investment adviser, or its affiliates, places trades on behalf of a fund include an amount in addition to trade execution, which may be rebated back to a fund. Any such rebates are included in net realized gain (loss) on investments in the Statement of Operations. Dividend income is recorded on the ex-dividend date, except for certain dividends from foreign securities where the ex-dividend date may have passed, which are recorded as soon as the Fund is informed of the ex-dividend date. Non-cash dividends included in dividend income, if any, are recorded at the fair market value of the securities received. Income and capital gain distributions from Fidelity Central Funds, if any, are recorded on the ex-dividend date. Certain distributions received by the Fund represent a return of capital or capital gain. The Fund determines the components of these distributions subsequent to the ex-dividend date, based upon receipt of tax filings or other correspondence relating to the underlying investment. These distributions are recorded as a reduction of cost of investments and/or as a realized gain. Interest income is accrued as earned and includes coupon interest and amortization of premium and accretion of discount on debt securities as applicable.
Expenses. Expenses directly attributable to a fund are charged to that fund. Expenses attributable to more than one fund are allocated among the respective funds on the basis of relative net assets or other appropriate methods. Expenses included in the accompanying financial statements reflect the expenses of that fund and do not include any expenses associated with any underlying mutual funds or exchange-traded funds. Although not included in a fund's expenses, a fund indirectly bears its proportionate share of these expenses through the net asset value of each underlying mutual fund or exchange-traded fund. Expense estimates are accrued in the period to which they relate and adjustments are made when actual amounts are known.
Income Tax Information and Distributions to Shareholders. Each year, the Fund intends to qualify as a regulated investment company under Subchapter M of the Internal Revenue Code, including distributing substantially all of its taxable income and realized gains. As a result, no provision for U.S. Federal income taxes is required. The Fund files a U.S. federal tax return, in addition to state and local tax returns as required. The Fund's federal income tax returns are subject to examination by the Internal Revenue Service (IRS) for a period of three fiscal years after they are filed. State and local tax returns may be subject to examination for an additional fiscal year depending on the jurisdiction.
Distributions are declared and recorded on the ex-dividend date. Income and capital gain distributions are determined in accordance with income tax regulations, which may differ from GAAP.
Capital accounts within the financial statements are adjusted for permanent book-tax differences. These adjustments have no impact on net assets or the results of operations. Capital accounts are not adjusted for temporary book-tax differences which will reverse in a subsequent period.
Book-tax differences are primarily due to futures contracts and losses deferred due to wash sales and excise tax regulations.
As of period end, the cost and unrealized appreciation (depreciation) in securities, and derivatives if applicable, for federal income tax purposes were as follows:
| Gross unrealized appreciation | $191,520,929 |
| Gross unrealized depreciation | (6,363,608) |
| Net unrealized appreciation (depreciation) | $185,157,321 |
| Tax cost | $947,798,733 |
The Fund elected to defer to its next fiscal year approximately $192,740,076 of capital losses recognized during the period November 1, 2021 to July 31, 2022.
4. Derivative Instruments.
Risk Exposures and the Use of Derivative Instruments. The Fund's investment objectives allow for various types of derivative instruments, including futures contracts. Derivatives are investments whose value is primarily derived from underlying assets, indices or reference rates and may be transacted on an exchange or over-the-counter (OTC). Derivatives may involve a future commitment to buy or sell a specified asset based on specified terms, to exchange future cash flows at periodic intervals based on a notional principal amount, or for one party to make one or more payments upon the occurrence of specified events in exchange for periodic payments from the other party.
Derivatives were used to increase returns and to manage exposure to certain risks as defined below. The success of any strategy involving derivatives depends on analysis of numerous economic factors, and if the strategies for investment do not work as intended, the objectives may not be achieved.
Derivatives were used to increase or decrease exposure to the following risk(s):
| Equity Risk | Equity risk relates to the fluctuations in the value of financial instruments as a result of changes in market prices (other than those arising from interest rate risk or foreign exchange risk), whether caused by factors specific to an individual investment, its issuer, or all factors affecting all instruments traded in a market or market segment. |
Funds are also exposed to additional risks from investing in derivatives, such as liquidity risk and counterparty credit risk. Liquidity risk is the risk that a fund will be unable to close out the derivative in the open market in a timely manner. Counterparty credit risk is the risk that the counterparty will not be able to fulfill its obligation to a fund. Counterparty credit risk related to exchange-traded contracts may be mitigated by the protection provided by the exchange on which they trade.
Investing in derivatives may involve greater risks than investing in the underlying assets directly and, to varying degrees, may involve risk of loss in excess of any initial investment and collateral received and amounts recognized in the Statement of Assets and Liabilities. In addition, there may be the risk that the change in value of the derivative contract does not correspond to the change in value of the underlying instrument.
Futures Contracts. A futures contract is an agreement between two parties to buy or sell a specified underlying instrument for a fixed price at a specified future date. Futures contracts were used to manage exposure to the stock market.
Upon entering into a futures contract, a fund is required to deposit either cash or securities (initial margin) with a clearing broker in an amount equal to a certain percentage of the face value of the contract. Futures contracts are marked-to-market daily and subsequent daily payments are made or received by a fund depending on the daily fluctuations in the value of the futures contracts and are recorded as unrealized appreciation or (depreciation). This receivable and/or payable, if any, is included in daily variation margin on futures contracts in the Statement of Assets and Liabilities. Realized gain or (loss) is recorded upon the expiration or closing of a futures contract. The net realized gain (loss) and change in net unrealized appreciation (depreciation) on futures contracts during the period is presented in the Statement of Operations.
Any open futures contracts at period end are presented in the Schedule of Investments under the caption "Futures Contracts". The notional amount at value reflects each contract's exposure to the underlying instrument or index at period end, and is representative of volume of activity during the period unless an average notional amount is presented. Any securities deposited to meet initial margin requirements are identified in the Schedule of Investments. Any cash deposited to meet initial margin requirements is presented as segregated cash with brokers for derivative instruments in the Statement of Assets and Liabilities.
5. Purchases and Sales of Investments.
Purchases and sales of securities, other than short-term securities and in-kind transactions, as applicable, are noted in the table below.
| | Purchases ($) | Sales ($) |
| Fidelity SAI U.S. Momentum Index Fund | 1,242,062,737 | 4,627,697,845 |
6. Fees and Other Transactions with Affiliates.
Management Fee. Fidelity Management & Research Company LLC (the investment adviser) and its affiliates provide the Fund with investment management related services for which the Fund pays a monthly management fee that is based on an annual rate of .10% of the Fund's average net assets.
Sub-Adviser. Geode Capital Management, LLC (Geode), serves as sub-adviser for the Fund. Geode provides discretionary investment advisory services to the Fund and is paid by the investment adviser for providing these services.
Interfund Lending Program. Pursuant to an Exemptive Order issued by the Securities and Exchange Commission (the SEC), the Fund, along with other registered investment companies having management contracts with Fidelity Management & Research Company LLC (FMR), or other affiliated entities of FMR, may participate in an interfund lending program. This program provides an alternative credit facility allowing the Fund to borrow from, or lend money to, other participating affiliated funds. At period end, there were no interfund loans outstanding. Activity in this program during the period for which loans were outstanding was as follows:
| | Borrower or Lender | Average Loan Balance | Weighted Average Interest Rate | Interest Expense |
Fidelity SAI U.S. Momentum Index Fund | Borrower | $60,153,333 | 2.83% | $42,483 |
Interfund Trades. Funds may purchase from or sell securities to other Fidelity Funds under procedures adopted by the Board. The procedures have been designed to ensure these interfund trades are executed in accordance with Rule 17a-7 of the 1940 Act. Any interfund trades are included within the respective purchases and sales amounts shown in the Purchases and Sales of Investments note. During the period, there were no interfund trades.
Other. During the period, FMR reimbursed the Fund $693,014 for an operational error which is included in Net Realized Gain (Loss) in the accompanying Statement of Operations.
7. Committed Line of Credit.
Certain Funds participate with other funds managed by the investment adviser or an affiliate in a $4.25 billion credit facility (the "line of credit") to be utilized for temporary or emergency purposes to fund shareholder redemptions or for other short-term liquidity purposes. The participating funds have agreed to pay commitment fees on their pro-rata portion of the line of credit, which are reflected in Miscellaneous expenses on the Statement of Operations, and are listed below. During the period, there were no borrowings on this line of credit.
| | Amount |
| Fidelity SAI U.S. Momentum Index Fund | $4,833 |
8. Security Lending.
Funds lend portfolio securities from time to time in order to earn additional income. Lending agents are used, including National Financial Services (NFS), an affiliate of the investment adviser. Pursuant to a securities lending agreement, NFS will receive a fee, which is capped at 9.9% of a fund's daily lending revenue, for its services as lending agent. A fund may lend securities to certain qualified borrowers, including NFS. On the settlement date of the loan, a fund receives collateral (in the form of U.S. Treasury obligations, letters of credit and/or cash) against the loaned securities and maintains collateral in an amount not less than 100% of the market value of the loaned securities during the period of the loan. The market value of the loaned securities is determined at the close of business of a fund and any additional required collateral is delivered to a fund on the next business day. A fund or borrower may terminate the loan at any time, and if the borrower defaults on its obligation to return the securities loaned because of insolvency or other reasons, a fund may apply collateral received from the borrower against the obligation. A fund may experience delays and costs in recovering the securities loaned. Any cash collateral received is invested in the Fidelity Securities Lending Cash Central Fund. Any loaned securities are identified as such in the Schedule of Investments, and the value of loaned securities and cash collateral at period end, as applicable, are presented in the Statement of Assets and Liabilities. Security lending income represents the income earned on investing cash collateral, less rebates paid to borrowers and any lending agent fees associated with the loan, plus any premium payments received for lending certain types of securities. Security lending income is presented in the Statement of Operations as a component of income from Fidelity Central Funds. Affiliated security lending activity, if any, was as follows:
| | Total Security Lending Fees Paid to NFS | Security Lending Income From Securities Loaned to NFS | Value of Securities Loaned to NFS at Period End |
| Fidelity SAI U.S. Momentum Index Fund | $1,717 | $268 | $- |
9. Other.
A fund's organizational documents provide former and current trustees and officers with a limited indemnification against liabilities arising in connection with the performance of their duties to the fund. In the normal course of business, a fund may also enter into contracts that provide general indemnifications. A fund's maximum exposure under these arrangements is unknown as this would be dependent on future claims that may be made against a fund. The risk of material loss from such claims is considered remote.
At the end of the period, the following mutual funds managed by the investment adviser or its affiliates were the owners of record of 10% or more of the total outstanding shares.
| | Strategic Advisers Fidelity U.S. Total Stock Fund |
| Fidelity SAI U.S. Momentum Index Fund | 46% |
Mutual funds managed by the investment adviser or its affiliates, in aggregate, were the owners of record of more than 20% of the total outstanding shares.
| Fund | % of shares held |
| Fidelity SAI U.S. Momentum Index Fund | 47% |
10. Risk and Uncertainties.
Many factors affect a fund's performance. Developments that disrupt global economies and financial markets, such as pandemics, epidemics, outbreaks of infectious diseases, war, terrorism, and environmental disasters, may significantly affect a fund's investment performance. The effects of these developments to a fund will be impacted by the types of securities in which a fund invests, the financial condition, industry, economic sector, and geographic location of an issuer, and a fund's level of investment in the securities of that issuer.
As a shareholder, you incur two types of costs: (1) transaction costs, which may include sales charges (loads) on purchase payments or redemption proceeds, as applicable and (2) ongoing costs, which generally include management fees, distribution and/or service (12b-1) fees and other Fund expenses. This Example is intended to help you understand your ongoing costs (in dollars) of investing in a fund and to compare these costs with the ongoing costs of investing in other mutual funds.
| The Example is based on an investment of $1,000 invested at the beginning of the period and held for the entire period (August 1, 2022 to January 31, 2023). |
Actual Expenses
The first line of the accompanying table provides information about actual account values and actual expenses. You may use the information in this line, together with the amount you invested, to estimate the expenses that you paid over the period. Simply divide your account value by $1,000.00 (for example, an $8,600 account value divided by $1,000.00 = 8.6), then multiply the result by the number in the first line for a class/Fund under the heading entitled "Expenses Paid During Period" to estimate the expenses you paid on your account during this period. If any fund is a shareholder of any underlying mutual funds or exchange-traded funds (ETFs) (the Underlying Funds), such fund indirectly bears its proportional share of the expenses of the Underlying Funds in addition to the direct expenses incurred presented in the table. These fees and expenses are not included in the annualized expense ratio used to calculate the expense estimate in the table below.
Hypothetical Example for Comparison Purposes
The second line of the accompanying table provides information about hypothetical account values and hypothetical expenses based on the actual expense ratio and an assumed rate of return of 5% per year before expenses, which is not the actual return. The hypothetical account values and expenses may not be used to estimate the actual ending account balance or expenses you paid for the period. You may use this information to compare the ongoing costs of investing in the Fund and other funds. To do so, compare this 5% hypothetical example with the 5% hypothetical examples that appear in the shareholder reports of the other funds. If any fund is a shareholder of any Underlying Funds, such fund indirectly bears its proportional share of the expenses of the Underlying Funds in addition to the direct expenses as presented in the table. These fees and expenses are not included in the annualized expense ratio used to calculate the expense estimate in the table below.
Please note that the expenses shown in the table are meant to highlight your ongoing costs only and do not reflect any transaction costs. Therefore, the second line of the table is useful in comparing ongoing costs only, and will not help you determine the relative total costs of owning different funds. In addition, if these transactional costs were included, your costs would have been higher.
| | | | | Annualized Expense Ratio- A | | Beginning Account Value August 1, 2022 | | Ending Account Value January 31, 2023 | | Expenses Paid During Period- C August 1, 2022 to January 31, 2023 |
| | | | | | | | | | |
| Fidelity® SAI U.S. Momentum Index Fund | | | | .11% | | | | | | |
| Actual | | | | | | $ 1,000 | | $ 1,014.50 | | $ .56 |
Hypothetical- B | | | | | | $ 1,000 | | $ 1,024.65 | | $ .56 |
| |
A Annualized expense ratio reflects expenses net of applicable fee waivers.
B 5% return per year before expenses
C Expenses are equal to the annualized expense ratio, multiplied by the average account value over the period, multiplied by 184/ 365 (to reflect the one-half year period). The fees and expenses of any Underlying Funds are not included in each annualized expense ratio.
Board Approval of Investment Advisory Contracts and Management Fees
Fidelity SAI U.S. Momentum Index Fund
Each year, the Board of Trustees, including the Independent Trustees (together, the Board), votes on the renewal of the management contract with Fidelity Management & Research Company LLC (FMR) and the sub-advisory agreement (Sub-Advisory Agreement) for the fund with Geode Capital Management, LLC (Geode) (together, the Advisory Contracts). FMR and Geode are referred to herein as the Investment Advisers. The Board, assisted by the advice of fund counsel and Independent Trustees' counsel, requests and considers a broad range of information relevant to the renewal of the Advisory Contracts throughout the year.
The Board meets regularly and, at each of its meetings, covers an extensive agenda of topics and materials and considers factors that are relevant to its annual consideration of the renewal of the fund's Advisory Contracts, including the services and support provided to the fund and its shareholders. The Board has established four standing committees (Committees) - Operations, Audit, Fair Valuation, and Governance and Nominating - each composed of and chaired by Independent Trustees with varying backgrounds, to which the Board has assigned specific subject matter responsibilities in order to enhance effective decision-making by the Board. The Operations Committee, of which all the Independent Trustees are members, meets regularly throughout the year and requests, receives and considers, among other matters, information related to the annual consideration of the renewal of the fund's Advisory Contracts before making its recommendation to the Board. The Board also meets as needed to review matters specifically related to the Board's annual consideration of the renewal of the Advisory Contracts. Members of the Board may also meet from time to time with trustees of other Fidelity funds through joint ad hoc committees to discuss certain matters relevant to all of the Fidelity funds.
At its September 2022 meeting, the Board unanimously determined to renew the fund's Advisory Contracts. In reaching its determination, the Board considered all factors it believed relevant, including (i) the nature, extent, and quality of the services provided to the fund and its shareholders (including the investment performance of the fund); (ii) the competitiveness relative to peer funds of the fund's management fee and total expense ratio; (iii) the total costs of the services provided by and the profits realized by Fidelity and Geode from their respective relationships with the fund; and (iv) the extent to which, if any, economies of scale exist and are realized as the fund grows, and whether any economies of scale are appropriately shared with fund shareholders.
In considering whether to renew the Advisory Contracts for the fund, the Board reached a determination, with the assistance of fund counsel and Independent Trustees' counsel and through the exercise of its business judgment, that the renewal of the Advisory Contracts was in the best interests of the fund and its shareholders and that the compensation payable under the Advisory Contracts was fair and reasonable. The Board's decision to renew the Advisory Contracts was not based on any single factor, but rather was based on a comprehensive consideration of all the information provided to the Board at its meetings throughout the year. The Board, in reaching its determination to renew the Advisory Contracts, was aware that shareholders of the fund have a broad range of investment choices available to them, including a wide choice among funds offered by Fidelity's competitors, and that the fund's shareholders, who have the opportunity to review and weigh the disclosure provided by the fund in its prospectus and other public disclosures, have chosen to invest in this fund, which is part of the Fidelity family of funds.
Nature, Extent, and Quality of Services Provided. The Board considered staffing as it relates to the fund, including the backgrounds of investment personnel of Fidelity and Geode, and also considered the fund's investment objective, strategies, and related investment philosophy. The Independent Trustees also had discussions with senior management of Fidelity's investment operations and investment groups and with senior management of Geode. The Board considered the structure of the investment personnel compensation programs and whether the structures provide appropriate incentives to act in the best interests of the fund. The Board also considered the steps Fidelity and Geode had taken to ensure the continued provision of high quality services to the Fidelity funds throughout the COVID-19 pandemic, including the expansion of staff in client facing positions to maintain service levels in periods of high volumes and volatility.
The Trustees also discussed with representatives of Fidelity, at meetings throughout the year, Fidelity's role in, among other things, overseeing compliance with federal securities laws and other applicable requirements by Geode with respect to the fund and monitoring and overseeing the performance and investment capabilities of Geode. The Trustees considered that the Board had received from Fidelity periodic reports about its oversight and due diligence processes, as well as periodic reports regarding the performance of Geode.
The Board also considered the nature, extent and quality of services provided by Geode. The Trustees noted that under the Sub-Advisory Agreement, subject to oversight by Fidelity, Geode is responsible for, among other things, identifying investments and arranging for execution of portfolio transactions to implement the fund's investment strategy. In addition, the Trustees noted that Geode is responsible for providing such reporting as may be requested by Fidelity to fulfill its oversight responsibilities discussed above.
Resources Dedicated to Investment Management and Support Services . The Board reviewed the general qualifications and capabilities of Fidelity's and Geode's investment staffs, including their size, education, experience, and resources, as well as Fidelity's and Geode's approach to recruiting, training, managing, and compensating investment personnel. The Board noted the resources devoted to Fidelity's global investment organization and that Fidelity's and Geode's analysts have extensive resources, tools and capabilities that allow them to conduct quantitative and fundamental analysis, as well as credit analysis of issuers, counterparties, and guarantors. Further, the Board considered that Fidelity's and Geode's investment professionals have sufficient access to information and data so as to provide competitive investment results over time, and that those professionals also have access to sophisticated tools that permit them to assess portfolio construction and risk and performance attribution characteristics continuously. Additionally, in its deliberations, the Board considered Fidelity's and Geode's trading, risk management, compliance, cybersecurity, and technology and operations capabilities and resources, which are integral parts of the investment management process.
Shareholder and Administrative Services . The Board considered (i) the nature, extent, quality, and cost of advisory, administrative, and shareholder services performed by the Investment Advisers and their affiliates under the Advisory Contracts and by FMR's affiliates under separate agreements covering transfer agency, pricing and bookkeeping, and securities lending services for the fund; (ii) the nature and extent of the supervision of third party service providers, principally custodians, subcustodians, and pricing vendors; and (iii) the resources devoted to, and the record of compliance with, the fund's compliance policies and procedures. The Board also reviewed the allocation of fund brokerage, including allocations to brokers affiliated with the Investment Advisers.
The Board noted that the growth of fund assets over time across the complex allows Fidelity to reinvest in the development of services designed to enhance the value and convenience of the Fidelity funds as investment vehicles. These services include 24-hour access to account information and market information over the Internet and through telephone representatives, investor education materials and asset allocation tools. The Board also considered that it reviews customer service metrics such as telephone response times, continuity of services on the website and metrics addressing services at Fidelity Investor Centers.
Investment in a Large Fund Family . The Board considered the benefits to shareholders of investing in a Fidelity fund, including the benefits of investing in a fund that is part of a large family of funds offering a variety of investment disciplines and providing a large variety of mutual fund investor services. The Board noted that Fidelity had taken, or had made recommendations to the Board that resulted in the Fidelity funds taking, a number of actions over the previous year that benefited particular funds, including: (i) continuing to dedicate additional resources to Fidelity's investment research process, which includes meetings with management of issuers of securities in which the funds invest; (ii) continuing efforts to enhance Fidelity's global research capabilities; (iii) launching new funds, ETFs, and share classes with innovative structures, strategies and pricing and making other enhancements to meet investor needs; (iv) broadening eligibility requirements for certain funds and share classes; (v) reducing management fees and total expenses for certain funds and classes; (vi) lowering expenses for certain existing funds and classes by implementing or lowering expense caps; (vii) rationalizing product lines and gaining increased efficiencies from fund mergers and liquidations; (viii) continuing to develop, acquire and implement systems and technology to improve services to the funds and shareholders, strengthen information security, and increase efficiency; and (ix) continuing to implement enhancements to further strengthen Fidelity's product line to increase investors' probability of success in achieving their investment goals, including their retirement income goals.
Investment Performance . The Board considered whether the fund has operated in accordance with its investment objective, as well as its record of compliance with its investment restrictions and its performance history.
The Board took into account discussions that occur at Board meetings throughout the year with representatives of the Investment Advisers about fund investment performance. In this regard the Board noted that as part of regularly scheduled fund reviews and other reports to the Board on fund performance, the Board considers annualized return information for the fund for different time periods, measured against the securities market index the fund seeks to track. The Board also periodically considers the fund's tracking error versus its benchmark index.
In addition to reviewing absolute and relative fund performance, the Independent Trustees periodically consider the appropriateness of fund performance metrics in evaluating the results achieved. In general, the Independent Trustees believe that an index fund's performance should be evaluated based on gross performance (before fees and expenses but after transaction costs) compared to the fund's benchmark index, over appropriate time periods, taking into account relevant factors including the following: general market conditions; the characteristics of the fund's benchmark index; the extent to which statistical sampling is employed; any securities lending revenues; and fund cash flows and other factors. The Independent Trustees generally give greater weight to fund performance over longer time periods than over shorter time periods. Depending on the circumstances, the Independent Trustees may be satisfied with a fund's performance notwithstanding that it lags its benchmark index for certain periods.
The Independent Trustees recognize that shareholders evaluate performance on a net basis (after fees and expenses) over their own holding periods, for which one-, three-, and five-year periods are often used as a proxy. For this reason, the performance information reviewed by the Board also included net cumulative calendar year total return information for the fund and its benchmark index for the most recent one- and three-year periods. No performance peer group information was considered by the Board as Fidelity advised the Board that the peer group, which is created by a third-party provider, includes a number of actively-managed funds. The Independent Trustees recognize that shareholders who are not investing through a tax-advantaged retirement account also consider tax consequences in evaluating performance.
Based on its review, the Board concluded that the nature, extent, and quality of services provided to the fund under the Advisory Contracts should continue to benefit the shareholders of the fund.
Competitiveness of Management Fee and Total Expense Ratio . The Board considered the fund's management fee and total expense ratio compared to selected groups of competitive funds and classes (referred to as "mapped groups" below) for the purpose of facilitating the Trustees' competitive analysis of management fees and total expenses. Fidelity creates "mapped groups" by combining similar investment objective categories (as classified by Lipper) that have comparable investment mandates. Combining funds with similar investment objective categories aids the Board's comparison of management fees and total expense ratios by broadening the competitive group used for such comparison.
Management Fee . The Board considered two proprietary management fee comparisons for the 12-month (or shorter) periods shown in basis points (BP) in the chart below. The group of Lipper funds used by the Board for management fee comparisons is referred to below as the "Total Mapped Group." The Total Mapped Group comparison focuses on a fund's standing in terms of gross management fees before expense reimbursements or caps relative to the total universe of funds with comparable investment mandates, regardless of whether their management fee structures also are comparable. Funds with comparable investment mandates offer exposure to similar types of securities. Funds with comparable management fee structures have similar management fee contractual arrangements (e.g., flat rate charged for advisory services, all-inclusive fee rate, etc.). "TMG %" represents the percentage of funds in the Total Mapped Group that had management fees that were lower than the fund's. For example, a hypothetical TMG % of 20% would mean that 80% of the funds in the Total Mapped Group had higher, and 20% had lower, management fees than the fund. The fund's actual TMG %s and the number of funds in the Total Mapped Group are in the chart below. The "Asset-Sized Peer Group" (ASPG) comparison focuses on a fund's standing relative to a subset of non-Fidelity funds within the Total Mapped Group that are similar in size and management fee structure. For example, if a fund is in the first quartile of the ASPG, the fund's management fee ranks in the least expensive or lowest 25% of funds in the ASPG. The ASPG represents at least 15% of the funds in the Total Mapped Group with comparable asset size and management fee structures, subject to a minimum of 50 funds (or all funds in the Total Mapped Group if fewer than 50). Additional information, such as the ASPG quartile in which the fund's management fee rate ranked, is also included in the chart and was considered by the Board.
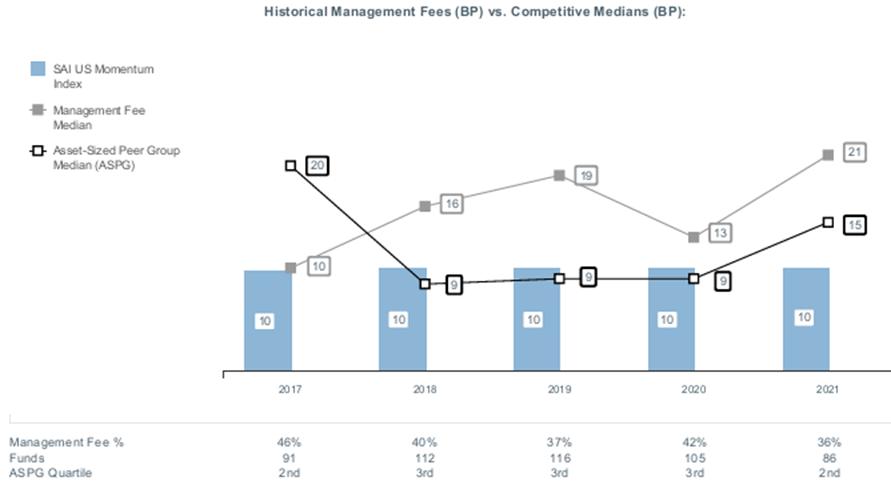
The Board noted that the fund's management fee rate ranked below the median of its Total Mapped Group and below the median of its ASPG for 2021.
At its September 2022 meeting, the Board also approved an amendment to the fund's sub-advisory agreement with Geode (effective October 1, 2022) that reduced the sub-advisory fee rate that FMR pays to Geode.
Based on its review, the Board concluded that the fund's management fee is fair and reasonable in light of the services that the fund receives and the other factors considered.
Total Expense Ratio . In its review of the fund's total expense ratio, the Board considered the fund's management fee rate as well as other fund expenses, such as custodial, legal, and audit fees. The Board also noted that Fidelity may agree to waive fees or reimburse expenses from time to time, and the extent to which, if any, it has done so for the fund. The fund is compared to those funds and classes in the Total Mapped Group (used by the Board for management fee comparisons) that have a similar sales load structure. The Board also considered a total expense ASPG comparison, which focuses on the total expenses of the fund relative to a subset of non-Fidelity funds within the similar sales load structure group that are similar in size and management fee structure. The total expense ASPG is limited to 15 larger and 15 smaller classes of different funds, where possible. The total expense ASPG comparison excludes performance adjustments and fund-paid 12b-1 fees to eliminate variability in expenses relating to these items.
The Board noted that the fund's total net expense ratio ranked below the similar sales load structure group competitive median and above the ASPG competitive median for 2021. The Board considered that, when compared to a subset of the ASPG that excludes funds in a fund complex with a unique at-cost service model, the fund would not be above the ASPG competitive median for 2021.
The Board further considered that FMR has contractually agreed to reimburse the fund to the extent that total operating expenses, with certain exceptions, as a percentage of its average net assets, exceed 0.15% through November 30, 2023.
Fees Charged to Other Clients. The Board also considered fee structures and other information with respect to clients of Fidelity and Geode, such as other funds advised or subadvised by Fidelity or Geode, pension plan clients, and other institutional clients with similar mandates. The Board noted that a joint ad hoc committee created by it and the boards of other Fidelity funds periodically reviews and compares Fidelity's institutional investment advisory business with its business of providing services to the Fidelity funds and also noted the most recent findings of the committee. The Board noted that the committee's review included a consideration of the differences in services provided, fees charged, and costs incurred, as well as competition in the markets serving the different categories of clients.
Based on its review of total expense ratios and fees charged to other Fidelity clients, the Board concluded that the fund's total expense ratio was reasonable in light of the services that the fund and its shareholders receive and the other factors considered.
Costs of the Services and Profitability . The Board considered the revenues earned and the expenses incurred by Fidelity in conducting the business of developing, marketing, distributing, managing, administering and servicing the fund and servicing the fund's shareholders. The Board also considered the level of Fidelity's profits in respect of all the Fidelity funds.
On an annual basis, Fidelity presents to the Board information about the profitability of its relationships with the fund. Fidelity calculates profitability information for each fund, as well as aggregate profitability information for groups of Fidelity funds and all Fidelity funds, using a series of detailed revenue and cost allocation methodologies which originate with the books and records of Fidelity on which Fidelity's audited financial statements are based. The Audit Committee of the Board reviews any significant changes from the prior year's methodologies and the full Board approves such changes.
A public accounting firm has been engaged annually by the Board as part of the Board's assessment of Fidelity's profitability analysis. The engagement includes the review and assessment of the methodologies used by Fidelity in determining the revenues and expenses attributable to Fidelity's mutual fund business, and completion of agreed-upon procedures in respect of the mathematical accuracy of certain fund profitability information and its conformity to established allocation methodologies. After considering the reports issued under the engagement and information provided by Fidelity, the Board concluded that while other allocation methods may also be reasonable, Fidelity's profitability methodologies are reasonable in all material respects.
The Board also reviewed Fidelity's and Geode's non-fund businesses and potential indirect benefits such businesses may have received as a result of their association with Fidelity's mutual fund business (i.e., fall-out benefits) as well as cases where Fidelity's and Geode's affiliates may benefit from the funds' business. The Board considered areas where potential indirect benefits to the Fidelity funds from their relationships with Fidelity may exist. The Board's consideration of these matters was informed by the findings of a joint ad hoc committee created by it and the boards of other Fidelity funds to evaluate potential fall-out benefits.
The Board considered the costs of the services provided by and the profits realized by Fidelity in connection with the operation of the fund and was satisfied that the profitability was not excessive.
The Board also considered information regarding the profitability of Geode's relationship with the fund.
Economies of Scale . The Board considered whether there have been economies of scale in respect of the management of the Fidelity funds, whether the Fidelity funds (including the fund) have appropriately benefited from any such economies of scale, and whether there is potential for realization of any further economies of scale. The Board considered the extent to which the fund will benefit from economies of scale as assets grow through increased services to the fund, through waivers or reimbursements, or through fee or expense ratio reductions. The Board also noted that a committee (the Economies of Scale Committee) created by it and the boards of other Fidelity funds periodically analyzes whether Fidelity attains economies of scale in respect of the management and servicing of the Fidelity funds, whether the Fidelity funds have appropriately benefited from such economies of scale, and whether there is potential for realization of any further economies of scale.
The Board concluded, taking into account the analysis of the Economies of Scale Committee, that economies of scale, if any, are being appropriately shared between fund shareholders and Fidelity.
Additional Information Requested by the Board . In order to develop fully the factual basis for consideration of the Fidelity funds' advisory contracts, the Board requested and received additional information on certain topics, including: (i) Fidelity's fund profitability methodology, profitability trends for certain funds, the allocation of various costs to different funds, and the impact of certain factors on fund profitability results; (ii) portfolio manager changes that have occurred during the past year and the amount of the investment that each portfolio manager has made in the Fidelity fund(s) that he or she manages; (iii) the extent to which current market conditions have affected retention and recruitment of personnel; (iv) the arrangements with and compensation paid to certain fund sub-advisers on behalf of the Fidelity funds and the treatment of such compensation within Fidelity's fund profitability methodology; (v) the terms of the funds' various management fee structures, including the basic group fee and the terms of Fidelity's voluntary expense limitation arrangements; (vi) Fidelity's transfer agent, pricing and bookkeeping fees, expense and service structures for different funds and classes relative to competitive trends; (vii) the impact on fund profitability of recent industry trends, such as the growth in passively managed funds and the changes in flows for different types of funds; (viii) the types of management fee and total expense comparisons provided, and the challenges and limitations associated with such information; and (ix) explanations regarding the relative total expense ratios and management fees of certain funds and classes, total expense and management fee competitive trends, and methodologies for total expense and management fee competitive comparisons. In addition, the Board considered its discussions with Fidelity regarding Fidelity's efforts to maintain the continuous investment and shareholder services necessary for the funds during the current pandemic and economic circumstances.
Based on its evaluation of all of the conclusions noted above, and after considering all factors it believed relevant, the Board concluded that the advisory and sub-advisory fee arrangements are fair and reasonable and that the fund's Advisory Contracts should be renewed.
The Securities and Exchange Commission adopted Rule 22e-4 under the Investment Company Act of 1940 (the Liquidity Rule) to promote effective liquidity risk management throughout the open-end investment company industry, thereby reducing the risk that funds will be unable to meet their redemption obligations and mitigating dilution of the interests of fund shareholders.
The Fund has adopted and implemented a liquidity risk management program (the Program) reasonably designed to assess and manage the Fund's liquidity risk and to comply with the requirements of the Liquidity Rule. The Fund's Board of Trustees (the Board) has designated the Fund's investment adviser as administrator of the Program. The Fidelity advisers have established a Liquidity Risk Management Committee (the LRM Committee) to manage the Program for each of the Fidelity Funds. The LRM Committee monitors the adequacy and effectiveness of implementation of the Program and on a periodic basis assesses each Fund's liquidity risk based on a variety of factors including (1) the Fund's investment strategy, (2) portfolio liquidity and cash flow projections during normal and reasonably foreseeable stressed conditions, (3) shareholder redemptions, (4) borrowings and other funding sources and (5) certain factors specific to ETFs including the effect of the Fund's prices and spreads, market participants, and basket compositions on the overall liquidity of the Fund's portfolio, as applicable.
In accordance with the Program, each of the Fund's portfolio investments is classified into one of four defined liquidity categories based on a determination of a reasonable expectation for how long it would take to convert the investment to cash (or sell or dispose of the investment) without significantly changing its market value.
- Highly liquid investments - cash or convertible to cash within three business days or less
- Moderately liquid investments - convertible to cash in three to seven calendar days
- Less liquid investments - can be sold or disposed of, but not settled, within seven calendar days
- Illiquid investments - cannot be sold or disposed of within seven calendar days
Liquidity classification determinations take into account a variety of factors including various market, trading and investment-specific considerations, as well as market depth, and generally utilize analysis from a third-party liquidity metrics service.
The Liquidity Rule places a 15% limit on a fund's illiquid investments and requires funds that do not primarily hold assets that are highly liquid investments to determine and maintain a minimum percentage of the fund's net assets to be invested in highly liquid investments (highly liquid investment minimum or HLIM). The Program includes provisions reasonably designed to comply with the 15% limit on illiquid investments and for determining, periodically reviewing and complying with the HLIM requirement as applicable.
At a recent meeting of the Fund's Board of Trustees, the LRM Committee provided a written report to the Board pertaining to the operation, adequacy, and effectiveness of the Program for the period December 1, 2021 through November 30, 2022. The report concluded that the Program is operating effectively and is reasonably designed to assess and manage the Fund's liquidity risk.
1.9878818.105
SY1-SANN-0423
Fidelity® Real Estate Index Fund
Semi-Annual Report
January 31, 2023
Contents
To view a fund's proxy voting guidelines and proxy voting record for the 12-month period ended June 30, visit http://www.fidelity.com/proxyvotingresults or visit the Securities and Exchange Commission's (SEC) web site at http://www.sec.gov.
You may also call 1-800-544-8544 to request a free copy of the proxy voting guidelines.
The funds or securities referred to herein are not sponsored, endorsed, or promoted by MSCI, and MSCI bears no liability with respect to any such funds or securities or any index on which such funds or securities are based. The prospectus contains a more detailed description of the limited relationship MSCI has with Fidelity and any related funds.
Standard & Poor's, S&P and S&P 500 are registered service marks of The McGraw-Hill Companies, Inc. and have been licensed for use by Fidelity Distributors Corporation.
Other third-party marks appearing herein are the property of their respective owners.
All other marks appearing herein are registered or unregistered trademarks or service marks of FMR LLC or an affiliated company. © 2023 FMR LLC. All rights reserved.
This report and the financial statements contained herein are submitted for the general information of the shareholders of the Fund. This report is not authorized for distribution to prospective investors in the Fund unless preceded or accompanied by an effective prospectus.
A fund files its complete schedule of portfolio holdings with the SEC for the first and third quarters of each fiscal year on Form N-PORT. Forms N-PORT are available on the SEC's web site at http://www.sec.gov. A fund's Forms N-PORT may be reviewed and copied at the SEC's Public Reference Room in Washington, DC. Information regarding the operation of the SEC's Public Reference Room may be obtained by calling 1-800-SEC-0330.
For a complete list of a fund's portfolio holdings, view the most recent holdings listing, semiannual report, or annual report on Fidelity's web site at http://www.fidelity.com, http://www.institutional.fidelity.com, or http://www.401k.com, as applicable.
NOT FDIC INSURED •MAY LOSE VALUE •NO BANK GUARANTEE
Neither the Fund nor Fidelity Distributors Corporation is a bank.
Top Holdings (% of Fund's net assets) |
| |
| Prologis (REIT), Inc. | 8.7 | |
| American Tower Corp. | 7.5 | |
| Equinix, Inc. | 4.9 | |
| Crown Castle International Corp. | 4.6 | |
| Public Storage | 3.5 | |
| Simon Property Group, Inc. | 3.1 | |
| Realty Income Corp. | 3.0 | |
| Welltower, Inc. | 2.5 | |
| VICI Properties, Inc. | 2.4 | |
| Digital Realty Trust, Inc. | 2.4 | |
| | 42.6 | |
| |
| Top Five REIT Sectors (% of Fund's net assets) |
| |
| REITs - Diversified | 23.3 | |
| REITs - Warehouse/Industrial | 11.6 | |
| REITs - Management/Investment | 10.9 | |
| REITs - Apartments | 10.6 | |
| REITs - Storage | 7.9 | |
| |
Asset Allocation (% of Fund's net assets) |
|
Foreign investments - 0.2% |
Percentages shown as 0.0% may reflect amounts less than 0.05%. |
|
Showing Percentage of Net Assets
| Common Stocks - 99.6% |
| | | Shares | Value ($) |
| Equity Real Estate Investment Trusts (REITs) - 94.6% | | | |
| REITs - Apartments - 10.6% | | | |
| American Homes 4 Rent Class A | | 596,966 | 20,469,964 |
| Apartment Investment & Management Co. Class A | | 276,606 | 2,077,311 |
| AvalonBay Communities, Inc. | | 266,640 | 47,312,602 |
| Camden Property Trust (SBI) | | 193,994 | 23,902,001 |
| Centerspace | | 29,818 | 2,016,293 |
| Equity Residential (SBI) | | 681,446 | 43,374,038 |
| Essex Property Trust, Inc. | | 124,695 | 28,189,799 |
| Independence Realty Trust, Inc. | | 435,354 | 8,197,716 |
| Invitation Homes, Inc. | | 1,167,660 | 37,948,950 |
| Mid-America Apartment Communities, Inc. | | 220,854 | 36,820,731 |
| UDR, Inc. | | 607,581 | 25,876,875 |
| | | | 276,186,280 |
| REITs - Diversified - 23.3% | | | |
| Alexander & Baldwin, Inc. | | 133,638 | 2,675,433 |
| Apartment Income (REIT) Corp. | | 298,490 | 11,420,227 |
| Apple Hospitality (REIT), Inc. | | 414,629 | 7,351,372 |
| Armada Hoffler Properties, Inc. | | 134,150 | 1,701,022 |
| Broadstone Net Lease, Inc. | | 326,384 | 5,910,814 |
| Cousins Properties, Inc. | | 286,860 | 7,865,701 |
| Crown Castle International Corp. | | 803,701 | 119,036,155 |
| Digital Realty Trust, Inc. | | 543,177 | 62,258,948 |
| Elme Communities (SBI) | | 160,644 | 3,084,365 |
| EPR Properties | | 143,040 | 6,076,339 |
| Equinix, Inc. (a) | | 173,211 | 127,852,235 |
| Gaming & Leisure Properties | | 483,074 | 25,873,443 |
| Gladstone Commercial Corp. | | 75,324 | 1,279,755 |
| Gladstone Land Corp. | | 64,363 | 1,257,653 |
| Global Net Lease, Inc. | | 195,687 | 2,925,521 |
| InvenTrust Properties Corp. | | 128,720 | 3,201,266 |
| Lamar Advertising Co. Class A | | 165,999 | 17,685,533 |
| Necessity Retail (REIT), Inc./The | | 251,902 | 1,720,491 |
| NexPoint Diversified Real Estate Trust | | 8,080 | 105,767 |
| NexPoint Residential Trust, Inc. | | 44,985 | 2,271,743 |
| One Liberty Properties, Inc. | | 34,588 | 833,917 |
| Outfront Media, Inc. | | 276,087 | 5,494,131 |
| Potlatch Corp. | | 155,421 | 7,607,858 |
| Safehold, Inc. | | 50,658 | 1,771,004 |
| SBA Communications Corp. Class A | | 205,016 | 60,998,410 |
| Store Capital Corp. | | 471,815 | 15,197,161 |
| Uniti Group, Inc. | | 485,275 | 3,197,962 |
| VICI Properties, Inc. | | 1,832,410 | 62,631,774 |
| Vornado Realty Trust | | 312,531 | 7,622,631 |
| WP Carey, Inc. | | 365,708 | 31,279,005 |
| | | | 608,187,636 |
| REITs - Health Care - 7.2% | | | |
| CareTrust (REIT), Inc. | | 186,250 | 3,859,100 |
| Community Healthcare Trust, Inc. | | 47,919 | 2,054,767 |
| Diversified Healthcare Trust (SBI) | | 483,669 | 382,776 |
| Global Medical REIT, Inc. | | 133,009 | 1,493,691 |
| Healthcare Trust of America, Inc. | | 724,129 | 15,590,497 |
| Healthpeak Properties, Inc. | | 1,026,145 | 28,198,465 |
| LTC Properties, Inc. | | 72,147 | 2,752,408 |
| Medical Properties Trust, Inc. (a) | | 1,151,096 | 14,906,693 |
| Physicians Realty Trust | | 426,949 | 6,771,411 |
| Sabra Health Care REIT, Inc. | | 438,316 | 5,917,266 |
| Universal Health Realty Income Trust (SBI) | | 25,413 | 1,392,887 |
| Ventas, Inc. | | 757,922 | 39,267,939 |
| Welltower, Inc. | | 862,993 | 64,758,995 |
| | | | 187,346,895 |
| REITs - Health Care Facilities - 0.7% | | | |
| National Health Investors, Inc. | | 86,292 | 5,076,558 |
| Omega Healthcare Investors, Inc. | | 448,739 | 13,210,876 |
| | | | 18,287,434 |
| REITs - Hotels - 2.6% | | | |
| Chatham Lodging Trust | | 87,081 | 1,237,421 |
| DiamondRock Hospitality Co. | | 409,421 | 3,942,724 |
| Host Hotels & Resorts, Inc. | | 1,362,555 | 25,684,162 |
| Park Hotels & Resorts, Inc. | | 447,237 | 6,578,856 |
| Pebblebrook Hotel Trust | | 254,604 | 4,175,506 |
| RLJ Lodging Trust | | 317,072 | 3,985,595 |
| Ryman Hospitality Properties, Inc. | | 100,094 | 9,297,732 |
| Service Properties Trust | | 320,165 | 2,852,670 |
| Summit Hotel Properties, Inc. | | 209,613 | 1,785,903 |
| Sunstone Hotel Investors, Inc. | | 412,152 | 4,529,550 |
| Xenia Hotels & Resorts, Inc. | | 220,641 | 3,287,551 |
| | | | 67,357,670 |
| REITs - Industrial Buildings - 0.5% | | | |
| Stag Industrial, Inc. | | 345,500 | 12,299,800 |
| REITs - Management/Investment - 10.9% | | | |
| American Assets Trust, Inc. | | 97,615 | 2,778,123 |
| American Tower Corp. | | 876,754 | 195,858,076 |
| Empire State Realty Trust, Inc. | | 271,468 | 2,264,043 |
| iStar Financial, Inc. | | 161,504 | 1,498,757 |
| LXP Industrial Trust (REIT) | | 545,823 | 6,304,256 |
| National Retail Properties, Inc. | | 326,081 | 15,439,935 |
| Rayonier, Inc. | | 277,105 | 10,083,851 |
| UMH Properties, Inc. | | 104,170 | 1,866,726 |
| Weyerhaeuser Co. | | 1,420,807 | 48,918,385 |
| | | | 285,012,152 |
| REITs - Manufactured Homes - 2.3% | | | |
| Equity Lifestyle Properties, Inc. | | 334,787 | 24,031,011 |
| Sun Communities, Inc. | | 232,268 | 36,433,558 |
| | | | 60,464,569 |
| REITs - Office Buildings - 0.1% | | | |
| Office Properties Income Trust | | 98,315 | 1,687,085 |
| REITs - Office Property - 4.8% | | | |
| Alexandria Real Estate Equities, Inc. | | 295,651 | 47,522,942 |
| Boston Properties, Inc. | | 283,921 | 21,163,471 |
| Brandywine Realty Trust (SBI) | | 348,756 | 2,287,839 |
| City Office REIT, Inc. | | 81,303 | 800,022 |
| Corporate Office Properties Trust (SBI) | | 212,483 | 5,964,398 |
| Douglas Emmett, Inc. | | 340,405 | 5,701,784 |
| Easterly Government Properties, Inc. | | 169,301 | 2,749,448 |
| Equity Commonwealth | | 196,218 | 5,007,483 |
| Franklin Street Properties Corp. | | 198,768 | 612,205 |
| Highwoods Properties, Inc. (SBI) | | 203,819 | 6,189,983 |
| Hudson Pacific Properties, Inc. | | 276,207 | 3,145,998 |
| JBG SMITH Properties | | 206,796 | 4,164,871 |
| Kilroy Realty Corp. | | 201,241 | 8,258,931 |
| Orion Office (REIT), Inc. | | 105,246 | 1,015,624 |
| Paramount Group, Inc. | | 330,060 | 2,128,887 |
| Piedmont Office Realty Trust, Inc. Class A | | 241,007 | 2,554,674 |
| SL Green Realty Corp. | | 123,047 | 5,063,384 |
| Veris Residential, Inc. (b) | | 146,489 | 2,534,260 |
| | | | 126,866,204 |
| REITs - Regional Malls - 3.5% | | | |
| CBL & Associates Properties, Inc. | | 24,327 | 648,315 |
| Simon Property Group, Inc. | | 624,359 | 80,205,157 |
| Tanger Factory Outlet Centers, Inc. | | 200,545 | 3,832,415 |
| The Macerich Co. | | 412,297 | 5,664,961 |
| | | | 90,350,848 |
| REITs - Shopping Centers - 7.2% | | | |
| Acadia Realty Trust (SBI) | | 174,513 | 2,710,187 |
| Alexanders, Inc. | | 4,035 | 957,425 |
| Brixmor Property Group, Inc. | | 568,910 | 13,386,452 |
| Federal Realty Investment Trust (SBI) | | 136,260 | 15,197,078 |
| Kimco Realty Corp. | | 1,177,565 | 26,448,110 |
| Kite Realty Group Trust | | 421,664 | 9,150,109 |
| Phillips Edison & Co., Inc. | | 219,962 | 7,373,126 |
| Realty Income Corp. | | 1,153,720 | 78,256,828 |
| Regency Centers Corp. | | 294,987 | 19,654,984 |
| Retail Opportunity Investments Corp. | | 237,959 | 3,766,891 |
| RPT Realty | | 164,586 | 1,724,861 |
| Saul Centers, Inc. | | 26,660 | 1,141,315 |
| SITE Centers Corp. | | 373,381 | 5,096,651 |
| Urban Edge Properties | | 227,323 | 3,580,337 |
| Urstadt Biddle Properties, Inc. Class A | | 54,484 | 1,023,210 |
| | | | 189,467,564 |
| REITs - Single Tenant - 1.4% | | | |
| Agree Realty Corp. | | 142,516 | 10,635,969 |
| Essential Properties Realty Trust, Inc. | | 255,417 | 6,508,025 |
| Four Corners Property Trust, Inc. | | 150,862 | 4,338,791 |
| Getty Realty Corp. | | 73,389 | 2,673,561 |
| NETSTREIT Corp. (a) | | 99,849 | 2,009,960 |
| Spirit Realty Capital, Inc. | | 255,373 | 11,205,767 |
| | | | 37,372,073 |
| REITs - Storage - 7.9% | | | |
| CubeSmart | | 430,021 | 19,690,662 |
| Extra Space Storage, Inc. | | 256,152 | 40,428,470 |
| Iron Mountain, Inc. | | 551,582 | 30,105,346 |
| Life Storage, Inc. | | 162,005 | 17,503,020 |
| National Storage Affiliates Trust | | 171,744 | 7,007,155 |
| Public Storage | | 300,641 | 91,497,082 |
| | | | 206,231,735 |
| REITs - Warehouse/Industrial - 11.6% | | | |
| Americold Realty Trust | | 512,012 | 16,082,297 |
| EastGroup Properties, Inc. | | 80,397 | 13,526,795 |
| First Industrial Realty Trust, Inc. | | 252,013 | 13,444,894 |
| Industrial Logistics Properties Trust | | 143,591 | 633,236 |
| Plymouth Industrial REIT, Inc. | | 83,292 | 1,864,075 |
| Prologis (REIT), Inc. | | 1,757,106 | 227,158,660 |
| Rexford Industrial Realty, Inc. | | 319,427 | 20,274,032 |
| Terreno Realty Corp. | | 146,517 | 9,440,090 |
| | | | 302,424,079 |
TOTAL EQUITY REAL ESTATE INVESTMENT TRUSTS (REITS) | | | 2,469,542,024 |
| Real Estate Management & Development - 5.0% | | | |
| Diversified Real Estate Activities - 0.1% | | | |
| The RMR Group, Inc. | | 27,130 | 841,573 |
| The St. Joe Co. | | 63,169 | 2,975,260 |
| | | | 3,816,833 |
| Real Estate Development - 0.3% | | | |
| Forestar Group, Inc. (b) | | 36,293 | 540,040 |
| Howard Hughes Corp. (b) | | 72,665 | 6,212,131 |
| | | | 6,752,171 |
| Real Estate Operating Companies - 0.4% | | | |
| Digitalbridge Group, Inc. | | 292,337 | 4,326,588 |
| FRP Holdings, Inc. (b) | | 8,209 | 461,100 |
| Kennedy-Wilson Holdings, Inc. | | 228,629 | 4,087,887 |
| WeWork, Inc. (a)(b) | | 367,099 | 583,687 |
| | | | 9,459,262 |
| Real Estate Services - 4.2% | | | |
| Anywhere Real Estate, Inc. (b) | | 222,676 | 1,888,292 |
| CBRE Group, Inc. (b) | | 619,907 | 53,008,248 |
| Compass, Inc. (b) | | 469,625 | 1,887,893 |
| Cushman & Wakefield PLC (b) | | 282,527 | 4,076,865 |
| Doma Holdings, Inc. Class A (a)(b) | | 299,063 | 212,335 |
| Douglas Elliman, Inc. | | 154,513 | 720,031 |
| eXp World Holdings, Inc. (a) | | 142,627 | 2,223,555 |
| Jones Lang LaSalle, Inc. (b) | | 92,405 | 17,082,912 |
| Marcus & Millichap, Inc. | | 46,486 | 1,684,653 |
| Newmark Group, Inc. | | 315,647 | 2,705,095 |
| Offerpad Solutions, Inc. (a)(b) | | 146,122 | 134,067 |
| Opendoor Technologies, Inc. (a)(b) | | 820,175 | 1,796,183 |
| RE/MAX Holdings, Inc. | | 33,947 | 774,331 |
| Redfin Corp. (a)(b) | | 199,586 | 1,492,903 |
| Zillow Group, Inc.: | | | |
| Class A (b) | | 104,750 | 4,500,060 |
| Class C (a)(b) | | 320,508 | 14,169,659 |
| | | | 108,357,082 |
| REITs - Shopping Centers - 0.0% | | | |
| Seritage Growth Properties (a)(b) | | 68,202 | 828,654 |
TOTAL REAL ESTATE MANAGEMENT & DEVELOPMENT | | | 129,214,002 |
| TOTAL COMMON STOCKS (Cost $2,314,809,012) | | | 2,598,756,026 |
| | | | |
| U.S. Treasury Obligations - 0.0% |
| | | Principal Amount (c) | Value ($) |
U.S. Treasury Bills, yield at date of purchase 4.65% 6/29/23 (d) (Cost $588,746) | | 600,000 | 588,736 |
| | | | |
| Money Market Funds - 1.1% |
| | | Shares | Value ($) |
| Fidelity Cash Central Fund 4.38% (e) | | 4,507,136 | 4,508,037 |
| Fidelity Securities Lending Cash Central Fund 4.38% (e)(f) | | 24,224,957 | 24,227,380 |
| TOTAL MONEY MARKET FUNDS (Cost $28,735,417) | | | 28,735,417 |
| | | | |
| TOTAL INVESTMENT IN SECURITIES - 100.7% (Cost $2,344,133,175) | 2,628,080,179 |
NET OTHER ASSETS (LIABILITIES) - (0.7)% | (19,013,612) |
| NET ASSETS - 100.0% | 2,609,066,567 |
| | |
| Futures Contracts |
| | Number of contracts | Expiration Date | Notional Amount ($) | Value ($) | Unrealized Appreciation/ (Depreciation) ($) |
| Purchased | | | | | |
| | | | | | |
| Equity Index Contracts | | | | | |
| CBOT Dow Jones U.S. Real Estate Index Contracts (United States) | 105 | Mar 2023 | 3,784,200 | 225,486 | 225,486 |
| CME E-mini S&P MidCap 400 Index Contracts (United States) | 24 | Mar 2023 | 6,390,960 | 160,204 | 160,204 |
| | | | | | |
| TOTAL FUTURES CONTRACTS | | | | | 385,690 |
| The notional amount of futures purchased as a percentage of Net Assets is 0.4% |
Legend
| (a) | Security or a portion of the security is on loan at period end. |
| (c) | Amount is stated in United States dollars unless otherwise noted. |
| (d) | Security or a portion of the security was pledged to cover margin requirements for futures contracts. At period end, the value of securities pledged amounted to $535,749. |
| (e) | Affiliated fund that is generally available only to investment companies and other accounts managed by Fidelity Investments. The rate quoted is the annualized seven-day yield of the fund at period end. A complete unaudited listing of the fund's holdings as of its most recent quarter end is available upon request. In addition, each Fidelity Central Fund's financial statements are available on the SEC's website or upon request. |
| (f) | Investment made with cash collateral received from securities on loan. |
Affiliated Central Funds
Fiscal year to date information regarding the Fund's investments in Fidelity Central Funds, including the ownership percentage, is presented below.
| Affiliate | Value, beginning of period ($) | Purchases ($) | Sales Proceeds ($) | Dividend Income ($) | Realized Gain (loss) ($) | Change in Unrealized appreciation (depreciation) ($) | Value, end of period ($) | % ownership, end of period |
| Fidelity Cash Central Fund 4.38% | 10,489,960 | 193,488,543 | 199,470,466 | 74,248 | - | - | 4,508,037 | 0.0% |
| Fidelity Securities Lending Cash Central Fund 4.38% | 21,330,991 | 93,695,064 | 90,798,675 | 47,544 | - | - | 24,227,380 | 0.1% |
| Total | 31,820,951 | 287,183,607 | 290,269,141 | 121,792 | - | - | 28,735,417 | |
| | | | | | | | | |
Amounts in the dividend income column in the above table include any capital gain distributions from underlying funds, which are presented in the corresponding line item in the Statement of Operations, if applicable.
Amount for Fidelity Securities Lending Cash Central Fund represents the income earned on investing cash collateral, less rebates paid to borrowers and any lending agent fees associated with the loan, plus any premium payments received for lending certain types of securities.
Amounts included in the purchases and sales proceeds columns may include in-kind transactions, if applicable.
Investment Valuation
The following is a summary of the inputs used, as of January 31, 2023, involving the Fund's assets and liabilities carried at fair value. The inputs or methodology used for valuing securities may not be an indication of the risk associated with investing in those securities. For more information on valuation inputs, and their aggregation into the levels used below, please refer to the Investment Valuation section in the accompanying Notes to Financial Statements.
| Valuation Inputs at Reporting Date: |
| Description | Total ($) | Level 1 ($) | Level 2 ($) | Level 3 ($) |
Investments in Securities: | | | | |
|
| Common Stocks | 2,598,756,026 | 2,598,756,026 | - | - |
|
| U.S. Treasury Obligations | 588,736 | - | 588,736 | - |
|
| Money Market Funds | 28,735,417 | 28,735,417 | - | - |
| Total Investments in Securities: | 2,628,080,179 | 2,627,491,443 | 588,736 | - |
Derivative Instruments: | | | | |
|
| Assets | | | | |
Futures Contracts | 385,690 | 385,690 | - | - |
| Total Assets | 385,690 | 385,690 | - | - |
| Total Derivative Instruments: | 385,690 | 385,690 | - | - |
Value of Derivative Instruments
The following table is a summary of the Fund's value of derivative instruments by primary risk exposure as of January 31, 2023. For additional information on derivative instruments, please refer to the Derivative Instruments section in the accompanying Notes to Financial Statements.
Primary Risk Exposure / Derivative Type | Value |
| Asset ($) | Liability ($) |
| Equity Risk | | |
Futures Contracts (a) | 385,690 | 0 |
| Total Equity Risk | 385,690 | 0 |
| Total Value of Derivatives | 385,690 | 0 |
(a)Reflects gross cumulative appreciation (depreciation) on futures contracts as presented in the Schedule of Investments. In the Statement of Assets and Liabilities, the period end daily variation margin is included in receivable or payable for daily variation margin on futures contracts, and the net cumulative appreciation (depreciation) is included in Total accumulated earnings (loss).
| Statement of Assets and Liabilities |
| | | | January 31, 2023 (Unaudited) |
| | | | | |
| Assets | | | | |
| Investment in securities, at value (including securities loaned of $23,740,413) - See accompanying schedule: | | | | |
Unaffiliated issuers (cost $2,315,397,758) | $ | 2,599,344,762 | | |
Fidelity Central Funds (cost $28,735,417) | | 28,735,417 | | |
| | | | | |
| | | | | |
| Total Investment in Securities (cost $2,344,133,175) | | | $ | 2,628,080,179 |
| Receivable for fund shares sold | | | | 4,773,067 |
| Dividends receivable | | | | 2,364,345 |
| Distributions receivable from Fidelity Central Funds | | | | 18,582 |
| Receivable for daily variation margin on futures contracts | | | | 151,789 |
Total assets | | | | 2,635,387,962 |
| Liabilities | | | | |
| Payable for fund shares redeemed | $ | 1,958,805 | | |
| Accrued management fee | | 145,246 | | |
| Collateral on securities loaned | | 24,217,344 | | |
| Total Liabilities | | | | 26,321,395 |
| Net Assets | | | $ | 2,609,066,567 |
| Net Assets consist of: | | | | |
| Paid in capital | | | $ | 2,516,070,718 |
| Total accumulated earnings (loss) | | | | 92,995,849 |
| Net Assets | | | $ | 2,609,066,567 |
Net Asset Value , offering price and redemption price per share ($2,609,066,567 ÷ 162,527,892 shares) | | | $ | 16.05 |
| Statement of Operations |
| | | | Six months ended January 31, 2023 (Unaudited) |
| Investment Income | | | | |
| Dividends | | | $ | 36,829,374 |
| Interest | | | | 5,245 |
| Income from Fidelity Central Funds (including $47,544 from security lending) | | | | 121,792 |
| Total Income | | | | 36,956,411 |
| Expenses | | | | |
| Management fee | $ | 870,868 | | |
| Independent trustees' fees and expenses | | 4,839 | | |
| Interest | | 20,651 | | |
| Total expenses before reductions | | 896,358 | | |
| Expense reductions | | (1,594) | | |
| Total expenses after reductions | | | | 894,764 |
| Net Investment income (loss) | | | | 36,061,647 |
| Realized and Unrealized Gain (Loss) | | | | |
| Net realized gain (loss) on: | | | | |
| Investment Securities: | | | | |
| Unaffiliated issuers | | (5,848,837) | | |
| Futures contracts | | 57,760 | | |
| Total net realized gain (loss) | | | | (5,791,077) |
| Change in net unrealized appreciation (depreciation) on: | | | | |
| Investment Securities: | | | | |
| Unaffiliated issuers | | (187,738,092) | | |
| Futures contracts | | (441,828) | | |
| Total change in net unrealized appreciation (depreciation) | | | | (188,179,920) |
| Net gain (loss) | | | | (193,970,997) |
| Net increase (decrease) in net assets resulting from operations | | | $ | (157,909,350) |
| Statement of Changes in Net Assets |
| |
| | Six months ended January 31, 2023 (Unaudited) | | Year ended July 31, 2022 |
| Increase (Decrease) in Net Assets | | | | |
| Operations | | | | |
| Net investment income (loss) | $ | 36,061,647 | $ | 73,299,104 |
| Net realized gain (loss) | | (5,791,077) | | 14,185,832 |
| Change in net unrealized appreciation (depreciation) | | (188,179,920) | | (218,840,191) |
| Net increase (decrease) in net assets resulting from operations | | (157,909,350) | | (131,355,255) |
| Distributions to shareholders | | (61,053,536) | | (42,077,828) |
| Share transactions | | | | |
| Proceeds from sales of shares | | 320,611,951 | | 892,386,902 |
| Reinvestment of distributions | | 53,473,562 | | 37,344,832 |
| Cost of shares redeemed | | (420,052,867) | | (821,916,537) |
Net increase (decrease) in net assets resulting from share transactions | | (45,967,354) | | 107,815,197 |
| Total increase (decrease) in net assets | | (264,930,240) | | (65,617,886) |
| | | | | |
| Net Assets | | | | |
| Beginning of period | | 2,873,996,807 | | 2,939,614,693 |
| End of period | $ | 2,609,066,567 | $ | 2,873,996,807 |
| | | | | |
| Other Information | | | | |
| Shares | | | | |
| Sold | | 21,238,692 | | 48,869,785 |
| Issued in reinvestment of distributions | | 3,452,748 | | 1,946,305 |
| Redeemed | | (27,073,370) | | (45,350,781) |
| Net increase (decrease) | | (2,381,930) | | 5,465,309 |
| | | | | |
Financial Highlights
| Fidelity® Real Estate Index Fund |
| |
| | Six months ended (Unaudited) January 31, 2023 | | Years ended July 31, 2022 | | 2021 | | 2020 | | 2019 | | 2018 |
Selected Per-Share Data | | | | | | | | | | | | |
| Net asset value, beginning of period | $ | 17.43 | $ | 18.44 | $ | 13.58 | $ | 16.82 | $ | 15.76 | $ | 15.70 |
| Income from Investment Operations | | | | | | | | | | | | |
Net investment income (loss) A,B | | .22 | | .44 | | .39 | | .51 | | .53 | | .46 |
| Net realized and unrealized gain (loss) | | (1.22) | | (1.19) | | 4.88 | | (3.15) | | 1.13 | | .13 |
| Total from investment operations | | (1.00) | | (.75) | | 5.27 | | (2.64) | | 1.66 | | .59 |
| Distributions from net investment income | | (.38) | | (.26) | | (.41) | | (.47) | | (.50) | | (.44) |
| Distributions from net realized gain | | - | | - | | - | | (.13) | | (.10) | | (.09) |
| Total distributions | | (.38) | | (.26) | | (.41) | | (.60) | | (.60) | | (.53) |
Redemption fees added to paid in capital A | | - | | - | | - | | - | | - | | - C |
| Net asset value, end of period | $ | 16.05 | $ | 17.43 | $ | 18.44 | $ | 13.58 | $ | 16.82 | $ | 15.76 |
Total Return D,E | | (5.65)% | | (4.21)% | | 39.73% | | (16.34)% | | 10.84% | | 3.90% |
Ratios to Average Net Assets B,F,G | | | | | | | | | | | | |
| Expenses before reductions | | .07% H | | .07% | | .07% | | .07% | | .07% | | .07% |
| Expenses net of fee waivers, if any | | .07% H | | .07% | | .07% | | .07% | | .07% | | .07% |
| Expenses net of all reductions | | .07% H | | .07% | | .07% | | .07% | | .07% | | .07% |
| Net investment income (loss) | | 2.89% H | | 2.45% | | 2.53% | | 3.32% | | 3.33% | | 3.12% |
| Supplemental Data | | | | | | | | | | | | |
| Net assets, end of period (000 omitted) | $ | 2,609,067 | $ | 2,873,997 | $ | 2,939,615 | $ | 2,082,589 | $ | 2,256,495 | $ | 380,099 |
Portfolio turnover rate I | | 8% H | | 10% | | 44% | | 26% | | 10% | | 6% |
A Calculated based on average shares outstanding during the period.
B Net investment income (loss) is affected by the timing of the declaration of dividends by any underlying mutual funds or exchange-traded funds (ETFs). Net investment income (loss) of any mutual funds or ETFs is not included in the Fund's net investment income (loss) ratio.
C Amount represents less than $.005 per share.
D Total returns for periods of less than one year are not annualized.
E Total returns would have been lower if certain expenses had not been reduced during the applicable periods shown.
F Fees and expenses of any underlying mutual funds or exchange-traded funds (ETFs) are not included in the Fund's expense ratio. The Fund indirectly bears its proportionate share of these expenses. For additional expense information related to investments in Fidelity Central Funds, please refer to the "Investments in Fidelity Central Funds" note found in the Notes to Financial Statements section of the most recent Annual or Semi-Annual report.
G Expense ratios reflect operating expenses of the class. Expenses before reductions do not reflect amounts reimbursed, waived, or reduced through arrangements with the investment adviser, brokerage services, or other offset arrangements, if applicable, and do not represent the amount paid by the class during periods when reimbursements, waivers or reductions occur.
H Annualized.
I Amount does not include the portfolio activity of any underlying mutual funds or exchange-traded funds (ETFs).
For the period ended January 31, 2023
1. Organization.
Fidelity Real Estate Index Fund (the Fund) is a fund of Fidelity Salem Street Trust (the Trust) and is authorized to issue an unlimited number of shares. Share transactions on the Statement of Changes in Net Assets may contain exchanges between affiliated funds. The Trust is registered under the Investment Company Act of 1940, as amended (the 1940 Act), as an open-end management investment company organized as a Massachusetts business trust.
Investments in Fidelity Central Funds.
Funds may invest in Fidelity Central Funds, which are open-end investment companies generally available only to other investment companies and accounts managed by the investment adviser and its affiliates. The Schedule of Investments lists any Fidelity Central Funds held as an investment as of period end, but does not include the underlying holdings of each Fidelity Central Fund. An investing fund indirectly bears its proportionate share of the expenses of the underlying Fidelity Central Funds.
Based on its investment objective, each Fidelity Central Fund may invest or participate in various investment vehicles or strategies that are similar to those of the investing fund. These strategies are consistent with the investment objectives of the investing fund and may involve certain economic risks which may cause a decline in value of each of the Fidelity Central Funds and thus a decline in the value of the investing fund.
| Fidelity Central Fund | Investment Manager | Investment Objective | Investment Practices | Expense Ratio A |
| Fidelity Money Market Central Funds | Fidelity Management & Research Company LLC (FMR) | Each fund seeks to obtain a high level of current income consistent with the preservation of capital and liquidity. | Short-term Investments | Less than .005% |
A Expenses expressed as a percentage of average net assets and are as of each underlying Central Fund's most recent annual or semi-annual shareholder report.
A complete unaudited list of holdings for each Fidelity Central Fund is available upon request or at the Securities and Exchange Commission website at www.sec.gov. In addition, the financial statements of the Fidelity Central Funds which contain the significant accounting policies (including investment valuation policies) of those funds, and are not covered by the Report of Independent Registered Public Accounting Firm, are available on the Securities and Exchange Commission website or upon request.
3. Significant Accounting Policies.
The Fund is an investment company and applies the accounting and reporting guidance of the Financial Accounting Standards Board (FASB) Accounting Standards Codification Topic 946 Financial Services - Investment Companies . The financial statements have been prepared in conformity with accounting principles generally accepted in the United States of America (GAAP), which require management to make certain estimates and assumptions at the date of the financial statements. Actual results could differ from those estimates. Subsequent events, if any, through the date that the financial statements were issued have been evaluated in the preparation of the financial statements. The Fund's Schedule of Investments lists any underlying mutual funds or exchange-traded funds (ETFs) but does not include the underlying holdings of these funds. The following summarizes the significant accounting policies of the Fund:
Investment Valuation. Investments are valued as of 4:00 p.m. Eastern time on the last calendar day of the period. The Board of Trustees (the Board) has designated the Fund's investment adviser as the valuation designee responsible for the fair valuation function and performing fair value determinations as needed. The investment adviser has established a Fair Value Committee (the Committee) to carry out the day-to-day fair valuation responsibilities and has adopted policies and procedures to govern the fair valuation process and the activities of the Committee. In accordance with these fair valuation policies and procedures, which have been approved by the Board, the Fund attempts to obtain prices from one or more third party pricing services or brokers to value its investments. When current market prices, quotations or currency exchange rates are not readily available or reliable, investments will be fair valued in good faith by the Committee, in accordance with the policies and procedures. Factors used in determining fair value vary by investment type and may include market or investment specific events, transaction data, estimated cash flows, and market observations of comparable investments. The frequency that the fair valuation procedures are used cannot be predicted and they may be utilized to a significant extent. The Committee manages the Fund's fair valuation practices and maintains the fair valuation policies and procedures. The Fund's investment adviser reports to the Board information regarding the fair valuation process and related material matters.
The Fund categorizes the inputs to valuation techniques used to value its investments into a disclosure hierarchy consisting of three levels as shown below:
Level 1 - unadjusted quoted prices in active markets for identical investments
Level 2 - other significant observable inputs (including quoted prices for similar investments, interest rates, prepayment speeds, etc.)
Level 3 - unobservable inputs (including the Fund's own assumptions based on the best information available)
Valuation techniques used to value the Fund's investments by major category are as follows:
Equity securities, including restricted securities, for which market quotations are readily available, are valued at the last reported sale price or official closing price as reported by a third party pricing service on the primary market or exchange on which they are traded and are categorized as Level 1 in the hierarchy. In the event there were no sales during the day or closing prices are not available, securities are valued at the last quoted bid price or may be valued using the last available price and are generally categorized as Level 2 in the hierarchy. For foreign equity securities, when market or security specific events arise, comparisons to the valuation of American Depositary Receipts (ADRs), futures contracts, ETFs and certain indexes as well as quoted prices for similar securities may be used and would be categorized as Level 2 in the hierarchy. For equity securities, including restricted securities, where observable inputs are limited, assumptions about market activity and risk are used and these securities may be categorized as Level 3 in the hierarchy.
Debt securities, including restricted securities, are valued based on evaluated prices received from third party pricing services or from brokers who make markets in such securities. U.S. government and government agency obligations are valued by pricing services who utilize matrix pricing which considers yield or price of bonds of comparable quality, coupon, maturity and type or by broker-supplied prices. When independent prices are unavailable or unreliable, debt securities may be valued utilizing pricing methodologies which consider similar factors that would be used by third party pricing services. Debt securities are generally categorized as Level 2 in the hierarchy but may be Level 3 depending on the circumstances.
Futures contracts are valued at the settlement price established each day by the board of trade or exchange on which they are traded and are categorized as Level 1 in the hierarchy. Investments in open-end mutual funds, including the Fidelity Central Funds, are valued at their closing net asset value (NAV) each business day and are categorized as Level 1 in the hierarchy.
Changes in valuation techniques may result in transfers in or out of an assigned level within the disclosure hierarchy. The aggregate value of investments by input level as of January 31, 2023 is included at the end of the Fund's Schedule of Investments.
Investment Transactions and Income. For financial reporting purposes, the Fund's investment holdings and NAV include trades executed through the end of the last business day of the period. The NAV per share for processing shareholder transactions is calculated as of the close of business of the New York Stock Exchange (NYSE), normally 4:00 p.m. Eastern time and includes trades executed through the end of the prior business day. Gains and losses on securities sold are determined on the basis of identified cost. Commissions paid to certain brokers with whom the investment adviser, or its affiliates, places trades on behalf of a fund include an amount in addition to trade execution, which may be rebated back to a fund. Any such rebates are included in net realized gain (loss) on investments in the Statement of Operations. Dividend income is recorded on the ex-dividend date, except for certain dividends from foreign securities where the ex-dividend date may have passed, which are recorded as soon as the Fund is informed of the ex-dividend date. Non-cash dividends included in dividend income, if any, are recorded at the fair market value of the securities received. Income and capital gain distributions from Fidelity Central Funds, if any, are recorded on the ex-dividend date. Certain distributions received by the Fund represent a return of capital or capital gain. The Fund determines the components of these distributions subsequent to the ex-dividend date, based upon receipt of tax filings or other correspondence relating to the underlying investment. These distributions are recorded as a reduction of cost of investments and/or as a realized gain. Interest income is accrued as earned and includes coupon interest and amortization of premium and accretion of discount on debt securities as applicable.
Expenses. Expenses directly attributable to a fund are charged to that fund. Expenses attributable to more than one fund are allocated among the respective funds on the basis of relative net assets or other appropriate methods. Expenses included in the accompanying financial statements reflect the expenses of that fund and do not include any expenses associated with any underlying mutual funds or exchange-traded funds. Although not included in a fund's expenses, a fund indirectly bears its proportionate share of these expenses through the net asset value of each underlying mutual fund or exchange-traded fund. Expense estimates are accrued in the period to which they relate and adjustments are made when actual amounts are known.
Income Tax Information and Distributions to Shareholders. Each year, the Fund intends to qualify as a regulated investment company under Subchapter M of the Internal Revenue Code, including distributing substantially all of its taxable income and realized gains. As a result, no provision for U.S. Federal income taxes is required. The Fund files a U.S. federal tax return, in addition to state and local tax returns as required. The Fund's federal income tax returns are subject to examination by the Internal Revenue Service (IRS) for a period of three fiscal years after they are filed. State and local tax returns may be subject to examination for an additional fiscal year depending on the jurisdiction.
Distributions are declared and recorded on the ex-dividend date. Income and capital gain distributions are determined in accordance with income tax regulations, which may differ from GAAP.
Capital accounts within the financial statements are adjusted for permanent book-tax differences. These adjustments have no impact on net assets or the results of operations. Capital accounts are not adjusted for temporary book-tax differences which will reverse in a subsequent period.
Book-tax differences are primarily due to futures contracts, capital loss carryforwards and losses deferred due to wash sales.
As of period end, the cost and unrealized appreciation (depreciation) in securities, and derivatives if applicable, for federal income tax purposes were as follows:
| Gross unrealized appreciation | $494,762,757 |
| Gross unrealized depreciation | (226,143,921) |
| Net unrealized appreciation (depreciation) | $268,618,836 |
| Tax cost | $2,359,847,033 |
Capital loss carryforwards are only available to offset future capital gains of the Fund to the extent provided by regulations and may be limited. The capital loss carryforward information presented below, including any applicable limitation, is estimated as of prior fiscal period end and is subject to adjustment.
| Short-term | $(67,548,644) |
| Long-term | (102,170,750) |
| Total capital loss carryforward | $(169,719,394) |
4. Derivative Instruments.
Risk Exposures and the Use of Derivative Instruments. The Fund's investment objectives allow for various types of derivative instruments, including futures contracts. Derivatives are investments whose value is primarily derived from underlying assets, indices or reference rates and may be transacted on an exchange or over-the-counter (OTC). Derivatives may involve a future commitment to buy or sell a specified asset based on specified terms, to exchange future cash flows at periodic intervals based on a notional principal amount, or for one party to make one or more payments upon the occurrence of specified events in exchange for periodic payments from the other party.
Derivatives were used to increase returns and to manage exposure to certain risks as defined below. The success of any strategy involving derivatives depends on analysis of numerous economic factors, and if the strategies for investment do not work as intended, the objectives may not be achieved.
Derivatives were used to increase or decrease exposure to the following risk(s):
| | |
| Equity Risk | Equity risk relates to the fluctuations in the value of financial instruments as a result of changes in market prices (other than those arising from interest rate risk or foreign exchange risk), whether caused by factors specific to an individual investment, its issuer, or all factors affecting all instruments traded in a market or market segment. |
Funds are also exposed to additional risks from investing in derivatives, such as liquidity risk and counterparty credit risk. Liquidity risk is the risk that a fund will be unable to close out the derivative in the open market in a timely manner. Counterparty credit risk is the risk that the counterparty will not be able to fulfill its obligation to a fund. Counterparty credit risk related to exchange-traded contracts may be mitigated by the protection provided by the exchange on which they trade.
Investing in derivatives may involve greater risks than investing in the underlying assets directly and, to varying degrees, may involve risk of loss in excess of any initial investment and collateral received and amounts recognized in the Statement of Assets and Liabilities. In addition, there may be the risk that the change in value of the derivative contract does not correspond to the change in value of the underlying instrument.
Futures Contracts. A futures contract is an agreement between two parties to buy or sell a specified underlying instrument for a fixed price at a specified future date. Futures contracts were used to manage exposure to the stock market.
Upon entering into a futures contract, a fund is required to deposit either cash or securities (initial margin) with a clearing broker in an amount equal to a certain percentage of the face value of the contract. Futures contracts are marked-to-market daily and subsequent daily payments are made or received by a fund depending on the daily fluctuations in the value of the futures contracts and are recorded as unrealized appreciation or (depreciation). This receivable and/or payable, if any, is included in daily variation margin on futures contracts in the Statement of Assets and Liabilities. Realized gain or (loss) is recorded upon the expiration or closing of a futures contract. The net realized gain (loss) and change in net unrealized appreciation (depreciation) on futures contracts during the period is presented in the Statement of Operations.
Any open futures contracts at period end are presented in the Schedule of Investments under the caption "Futures Contracts". The notional amount at value reflects each contract's exposure to the underlying instrument or index at period end, and is representative of volume of activity during the period unless an average notional amount is presented. Any securities deposited to meet initial margin requirements are identified in the Schedule of Investments. Any cash deposited to meet initial margin requirements is presented as segregated cash with brokers for derivative instruments in the Statement of Assets and Liabilities.
5. Purchases and Sales of Investments.
Purchases and sales of securities, other than short-term securities and U.S. government securities and in-kind transactions, as applicable, are noted in the table below.
| | Purchases ($) | Sales ($) |
| Fidelity Real Estate Index Fund | 97,849,722 | 137,462,140 |
6. Fees and Other Transactions with Affiliates.
Management Fee. Fidelity Management & Research Company LLC (the investment adviser) and its affiliates provide the Fund with investment management related services for which the Fund pays a monthly management fee. The management fee is based on an annual rate of .07% of the Fund's average net assets. Under the management contract, the investment adviser pays all other operating expenses, except the compensation of the independent Trustees and certain other expenses such as interest expense.
Sub-Adviser. Geode Capital Management, LLC (Geode), serves as sub-adviser for the Fund. Geode provides discretionary investment advisory services to the Fund and is paid by the investment adviser for providing these services.
Interfund Lending Program. Pursuant to an Exemptive Order issued by the Securities and Exchange Commission (the SEC), the Fund, along with other registered investment companies having management contracts with Fidelity Management & Research Company LLC (FMR), or other affiliated entities of FMR, may participate in an interfund lending program. This program provides an alternative credit facility allowing the Fund to borrow from, or lend money to, other participating affiliated funds. At period end, there were no interfund loans outstanding. Activity in this program during the period for which loans were outstanding was as follows:
| | Borrower or Lender | Average Loan Balance | Weighted Average Interest Rate | Interest Expense |
| Fidelity Real Estate Index Fund | Borrower | $18,398,750 | 3.37% | $20,651 |
Interfund Trades. Funds may purchase from or sell securities to other Fidelity Funds under procedures adopted by the Board. The procedures have been designed to ensure these interfund trades are executed in accordance with Rule 17a-7 of the 1940 Act. Any interfund trades are included within the respective purchases and sales amounts shown in the Purchases and Sales of Investments note. During the period, there were no interfund trades.
7. Committed Line of Credit.
Certain Funds participate with other funds managed by the investment adviser or an affiliate in a $4.25 billion credit facility (the "line of credit") to be utilized for temporary or emergency purposes to fund shareholder redemptions or for other short-term liquidity purposes. The commitment fees on the pro-rata portion of the line of credit are borne by the investment adviser. During the period, there were no borrowings on this line of credit.
8. Security Lending.
Funds lend portfolio securities from time to time in order to earn additional income. Lending agents are used, including National Financial Services (NFS), an affiliate of the investment adviser. Pursuant to a securities lending agreement, NFS will receive a fee, which is capped at 9.9% of a fund's daily lending revenue, for its services as lending agent. A fund may lend securities to certain qualified borrowers, including NFS. On the settlement date of the loan, a fund receives collateral (in the form of U.S. Treasury obligations, letters of credit and/or cash) against the loaned securities and maintains collateral in an amount not less than 100% of the market value of the loaned securities during the period of the loan. The market value of the loaned securities is determined at the close of business of a fund and any additional required collateral is delivered to a fund on the next business day. A fund or borrower may terminate the loan at any time, and if the borrower defaults on its obligation to return the securities loaned because of insolvency or other reasons, a fund may apply collateral received from the borrower against the obligation. A fund may experience delays and costs in recovering the securities loaned. Any cash collateral received is invested in the Fidelity Securities Lending Cash Central Fund. Any loaned securities are identified as such in the Schedule of Investments, and the value of loaned securities and cash collateral at period end, as applicable, are presented in the Statement of Assets and Liabilities. Security lending income represents the income earned on investing cash collateral, less rebates paid to borrowers and any lending agent fees associated with the loan, plus any premium payments received for lending certain types of securities. Security lending income is presented in the Statement of Operations as a component of income from Fidelity Central Funds. Affiliated security lending activity, if any, was as follows:
| | Total Security Lending Fees Paid to NFS | Security Lending Income From Securities Loaned to NFS | Value of Securities Loaned to NFS at Period End |
| Fidelity Real Estate Index Fund | $4,794 | $1,866 | $- |
9. Expense Reductions.
Through arrangements with the Fund's custodian, credits realized as a result of certain uninvested cash balances were used to reduce the Fund's expenses by $1,594.
10. Other.
A fund's organizational documents provide former and current trustees and officers with a limited indemnification against liabilities arising in connection with the performance of their duties to the fund. In the normal course of business, a fund may also enter into contracts that provide general indemnifications. A fund's maximum exposure under these arrangements is unknown as this would be dependent on future claims that may be made against a fund. The risk of material loss from such claims is considered remote.
11. Risk and Uncertainties.
Many factors affect a fund's performance. Developments that disrupt global economies and financial markets, such as pandemics, epidemics, outbreaks of infectious diseases, war, terrorism, and environmental disasters, may significantly affect a fund's investment performance. The effects of these developments to a fund will be impacted by the types of securities in which a fund invests, the financial condition, industry, economic sector, and geographic location of an issuer, and a fund's level of investment in the securities of that issuer.
As a shareholder, you incur two types of costs: (1) transaction costs, which may include sales charges (loads) on purchase payments or redemption proceeds, as applicable and (2) ongoing costs, which generally include management fees, distribution and/or service (12b-1) fees and other Fund expenses. This Example is intended to help you understand your ongoing costs (in dollars) of investing in a fund and to compare these costs with the ongoing costs of investing in other mutual funds.
| The Example is based on an investment of $1,000 invested at the beginning of the period and held for the entire period (August 1, 2022 to January 31, 2023). |
Actual Expenses
The first line of the accompanying table provides information about actual account values and actual expenses. You may use the information in this line, together with the amount you invested, to estimate the expenses that you paid over the period. Simply divide your account value by $1,000.00 (for example, an $8,600 account value divided by $1,000.00 = 8.6), then multiply the result by the number in the first line for a class/Fund under the heading entitled "Expenses Paid During Period" to estimate the expenses you paid on your account during this period. If any fund is a shareholder of any underlying mutual funds or exchange-traded funds (ETFs) (the Underlying Funds), such fund indirectly bears its proportional share of the expenses of the Underlying Funds in addition to the direct expenses incurred presented in the table. These fees and expenses are not included in the annualized expense ratio used to calculate the expense estimate in the table below.
Hypothetical Example for Comparison Purposes
The second line of the accompanying table provides information about hypothetical account values and hypothetical expenses based on the actual expense ratio and an assumed rate of return of 5% per year before expenses, which is not the actual return. The hypothetical account values and expenses may not be used to estimate the actual ending account balance or expenses you paid for the period. You may use this information to compare the ongoing costs of investing in the Fund and other funds. To do so, compare this 5% hypothetical example with the 5% hypothetical examples that appear in the shareholder reports of the other funds. If any fund is a shareholder of any Underlying Funds, such fund indirectly bears its proportional share of the expenses of the Underlying Funds in addition to the direct expenses as presented in the table. These fees and expenses are not included in the annualized expense ratio used to calculate the expense estimate in the table below.
Please note that the expenses shown in the table are meant to highlight your ongoing costs only and do not reflect any transaction costs. Therefore, the second line of the table is useful in comparing ongoing costs only, and will not help you determine the relative total costs of owning different funds. In addition, if these transactional costs were included, your costs would have been higher.
| | | | | Annualized Expense Ratio- A | | Beginning Account Value August 1, 2022 | | Ending Account Value January 31, 2023 | | Expenses Paid During Period- C August 1, 2022 to January 31, 2023 |
| | | | | | | | | | |
| Fidelity® Real Estate Index Fund | | | | .07% | | | | | | |
| Actual | | | | | | $ 1,000 | | $ 943.50 | | $ .34 |
Hypothetical- B | | | | | | $ 1,000 | | $ 1,024.85 | | $ .36 |
| |
A Annualized expense ratio reflects expenses net of applicable fee waivers.
B 5% return per year before expenses
C Expenses are equal to the annualized expense ratio, multiplied by the average account value over the period, multiplied by 184/ 365 (to reflect the one-half year period). The fees and expenses of any Underlying Funds are not included in each annualized expense ratio.
Board Approval of Investment Advisory Contracts and Management Fees
Fidelity Real Estate Index Fund
Each year, the Board of Trustees, including the Independent Trustees (together, the Board), votes on the renewal of the management contract with Fidelity Management & Research Company LLC (FMR) and the sub-advisory agreement (Sub-Advisory Agreement) for the fund with Geode Capital Management, LLC (Geode) (together, the Advisory Contracts). FMR and Geode are referred to herein as the Investment Advisers. The Board, assisted by the advice of fund counsel and Independent Trustees' counsel, requests and considers a broad range of information relevant to the renewal of the Advisory Contracts throughout the year.
The Board meets regularly and, at each of its meetings, covers an extensive agenda of topics and materials and considers factors that are relevant to its annual consideration of the renewal of the fund's Advisory Contracts, including the services and support provided to the fund and its shareholders. The Board has established four standing committees (Committees) - Operations, Audit, Fair Valuation, and Governance and Nominating - each composed of and chaired by Independent Trustees with varying backgrounds, to which the Board has assigned specific subject matter responsibilities in order to enhance effective decision-making by the Board. The Operations Committee, of which all the Independent Trustees are members, meets regularly throughout the year and requests, receives and considers, among other matters, information related to the annual consideration of the renewal of the fund's Advisory Contracts before making its recommendation to the Board. The Board also meets as needed to review matters specifically related to the Board's annual consideration of the renewal of the Advisory Contracts. Members of the Board may also meet from time to time with trustees of other Fidelity funds through joint ad hoc committees to discuss certain matters relevant to all of the Fidelity funds.
At its September 2022 meeting, the Board unanimously determined to renew the fund's Advisory Contracts. In reaching its determination, the Board considered all factors it believed relevant, including (i) the nature, extent, and quality of the services provided to the fund and its shareholders (including the investment performance of the fund); (ii) the competitiveness relative to peer funds of the fund's management fee and total expense ratio; (iii) the total costs of the services provided by and the profits realized by Fidelity and Geode from their respective relationships with the fund; and (iv) the extent to which, if any, economies of scale exist and are realized as the fund grows, and whether any economies of scale are appropriately shared with fund shareholders.
In considering whether to renew the Advisory Contracts for the fund, the Board reached a determination, with the assistance of fund counsel and Independent Trustees' counsel and through the exercise of its business judgment, that the renewal of the Advisory Contracts was in the best interests of the fund and its shareholders and that the compensation payable under the Advisory Contracts was fair and reasonable. The Board's decision to renew the Advisory Contracts was not based on any single factor, but rather was based on a comprehensive consideration of all the information provided to the Board at its meetings throughout the year. The Board, in reaching its determination to renew the Advisory Contracts, was aware that shareholders of the fund have a broad range of investment choices available to them, including a wide choice among funds offered by Fidelity's competitors, and that the fund's shareholders, who have the opportunity to review and weigh the disclosure provided by the fund in its prospectus and other public disclosures, have chosen to invest in this fund, which is part of the Fidelity family of funds.
Nature, Extent, and Quality of Services Provided. The Board considered staffing as it relates to the fund, including the backgrounds of investment personnel of Fidelity and Geode, and also considered the fund's investment objective, strategies, and related investment philosophy. The Independent Trustees also had discussions with senior management of Fidelity's investment operations and investment groups and with senior management of Geode. The Board considered the structure of the investment personnel compensation programs and whether the structures provide appropriate incentives to act in the best interests of the fund. The Board also considered the steps Fidelity and Geode had taken to ensure the continued provision of high quality services to the Fidelity funds throughout the COVID-19 pandemic, including the expansion of staff in client facing positions to maintain service levels in periods of high volumes and volatility.
The Trustees also discussed with representatives of Fidelity, at meetings throughout the year, Fidelity's role in, among other things, overseeing compliance with federal securities laws and other applicable requirements by Geode with respect to the fund and monitoring and overseeing the performance and investment capabilities of Geode. The Trustees considered that the Board had received from Fidelity periodic reports about its oversight and due diligence processes, as well as periodic reports regarding the performance of Geode.
The Board also considered the nature, extent and quality of services provided by Geode. The Trustees noted that under the Sub-Advisory Agreement, subject to oversight by Fidelity, Geode is responsible for, among other things, identifying investments and arranging for execution of portfolio transactions to implement the fund's investment strategy. In addition, the Trustees noted that Geode is responsible for providing such reporting as may be requested by Fidelity to fulfill its oversight responsibilities discussed above.
Resources Dedicated to Investment Management and Support Services . The Board reviewed the general qualifications and capabilities of Fidelity's and Geode's investment staffs, including their size, education, experience, and resources, as well as Fidelity's and Geode's approach to recruiting, training, managing, and compensating investment personnel. The Board noted the resources devoted to Fidelity's global investment organization and that Fidelity's and Geode's analysts have extensive resources, tools and capabilities that allow them to conduct quantitative and fundamental analysis, as well as credit analysis of issuers, counterparties, and guarantors. Further, the Board considered that Fidelity's and Geode's investment professionals have sufficient access to information and data so as to provide competitive investment results over time, and that those professionals also have access to sophisticated tools that permit them to assess portfolio construction and risk and performance attribution characteristics continuously. Additionally, in its deliberations, the Board considered Fidelity's and Geode's trading, risk management, compliance, cybersecurity, and technology and operations capabilities and resources, which are integral parts of the investment management process.
Shareholder and Administrative Services . The Board considered (i) the nature, extent, quality, and cost of advisory, administrative, and shareholder services performed by the Investment Advisers and their affiliates under the Advisory Contracts and by FMR's affiliates under separate agreements covering transfer agency, pricing and bookkeeping, and securities lending services for the fund; (ii) the nature and extent of the supervision of third party service providers, principally custodians, subcustodians, and pricing vendors; and (iii) the resources devoted to, and the record of compliance with, the fund's compliance policies and procedures. The Board also reviewed the allocation of fund brokerage, including allocations to brokers affiliated with the Investment Advisers.
The Board noted that the growth of fund assets over time across the complex allows Fidelity to reinvest in the development of services designed to enhance the value and convenience of the Fidelity funds as investment vehicles. These services include 24-hour access to account information and market information over the Internet and through telephone representatives, investor education materials and asset allocation tools. The Board also considered that it reviews customer service metrics such as telephone response times, continuity of services on the website and metrics addressing services at Fidelity Investor Centers.
Investment in a Large Fund Family . The Board considered the benefits to shareholders of investing in a Fidelity fund, including the benefits of investing in a fund that is part of a large family of funds offering a variety of investment disciplines and providing a large variety of mutual fund investor services. The Board noted that Fidelity had taken, or had made recommendations to the Board that resulted in the Fidelity funds taking, a number of actions over the previous year that benefited particular funds, including: (i) continuing to dedicate additional resources to Fidelity's investment research process, which includes meetings with management of issuers of securities in which the funds invest; (ii) continuing efforts to enhance Fidelity's global research capabilities; (iii) launching new funds, ETFs, and share classes with innovative structures, strategies and pricing and making other enhancements to meet investor needs; (iv) broadening eligibility requirements for certain funds and share classes; (v) reducing management fees and total expenses for certain funds and classes; (vi) lowering expenses for certain existing funds and classes by implementing or lowering expense caps; (vii) rationalizing product lines and gaining increased efficiencies from fund mergers and liquidations; (viii) continuing to develop, acquire and implement systems and technology to improve services to the funds and shareholders, strengthen information security, and increase efficiency; and (ix) continuing to implement enhancements to further strengthen Fidelity's product line to increase investors' probability of success in achieving their investment goals, including their retirement income goals.
I nvestment Performance . The Board considered whether the fund has operated in accordance with its investment objective, as well as its record of compliance with its investment restrictions and its performance history.
The Board took into account discussions that occur at Board meetings throughout the year with representatives of the Investment Advisers about fund investment performance. In this regard the Board noted that as part of regularly scheduled fund reviews and other reports to the Board on fund performance, the Board considers annualized return information for the fund for different time periods, measured against the securities market index the fund seeks to track. The Board also periodically considers the fund's tracking error versus its benchmark index.
In addition to reviewing absolute and relative fund performance, the Independent Trustees periodically consider the appropriateness of fund performance metrics in evaluating the results achieved. In general, the Independent Trustees believe that an index fund's performance should be evaluated based on gross performance (before fees and expenses but after transaction costs) compared to the fund's benchmark index, over appropriate time periods, taking into account relevant factors including the following: general market conditions; the characteristics of the fund's benchmark index; the extent to which statistical sampling is employed; any securities lending revenues; and fund cash flows and other factors. The Independent Trustees generally give greater weight to fund performance over longer time periods than over shorter time periods. Depending on the circumstances, the Independent Trustees may be satisfied with a fund's performance notwithstanding that it lags its benchmark index for certain periods.
The Independent Trustees recognize that shareholders evaluate performance on a net basis (after fees and expenses) over their own holding periods, for which one-, three-, and five-year periods are often used as a proxy. For this reason, the performance information reviewed by the Board also included net cumulative calendar year total return information for the fund and its benchmark index for the most recent one-, three-, and five-year periods. No performance peer group information was considered by the Board as Fidelity advised the Board that the peer group, which is created by a third-party provider, includes a number of actively-managed funds. The Independent Trustees recognize that shareholders who are not investing through a tax-advantaged retirement account also consider tax consequences in evaluating performance.
Based on its review, the Board concluded that the nature, extent, and quality of services provided to the fund under the Advisory Contracts should continue to benefit the shareholders of the fund.
Competitiveness of Management Fee and Total Expense Ratio . The Board considered the fund's management fee and total expense ratio compared to selected groups of competitive funds and classes (referred to as "mapped groups" below) for the purpose of facilitating the Trustees' competitive analysis of management fees and total expenses. Fidelity creates "mapped groups" by combining similar investment objective categories (as classified by Lipper) that have comparable investment mandates. Combining funds with similar investment objective categories aids the Board's comparison of management fees and total expense ratios by broadening the competitive group used for such comparison.
Management Fee . The Board considered two proprietary management fee comparisons for the 12-month periods shown in basis points (BP) in the chart below. The group of Lipper funds used by the Board for management fee comparisons is referred to below as the "Total Mapped Group." The Total Mapped Group comparison focuses on a fund's standing in terms of gross management fees before expense reimbursements or caps relative to the total universe of funds with comparable investment mandates, regardless of whether their management fee structures also are comparable. Funds with comparable investment mandates offer exposure to similar types of securities. Funds with comparable management fee structures have similar management fee contractual arrangements (e.g., flat rate charged for advisory services, all-inclusive fee rate, etc.). "TMG %" represents the percentage of funds in the Total Mapped Group that had management fees that were lower than the fund's. For example, a hypothetical TMG % of 20% would mean that 80% of the funds in the Total Mapped Group had higher, and 20% had lower, management fees than the fund. The fund's actual TMG %s and the number of funds in the Total Mapped Group are in the chart below. The "Asset-Sized Peer Group" (ASPG) comparison focuses on a fund's standing relative to a subset of non-Fidelity funds within the Total Mapped Group that are similar in size and management fee structure. For example, if a fund is in the first quartile of the ASPG, the fund's management fee ranks in the least expensive or lowest 25% of funds in the ASPG. The ASPG represents at least 15% of the funds in the Total Mapped Group with comparable asset size and management fee structures, subject to a minimum of 50 funds (or all funds in the Total Mapped Group if fewer than 50). Additional information, such as the ASPG quartile in which the fund's management fee rate ranked, is also included in the chart and was considered by the Board.
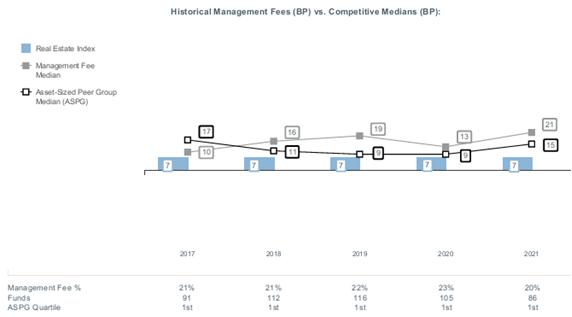
The Board noted that the fund's management fee rate ranked below the median of its Total Mapped Group and below the median of its ASPG for 2021.
At its September 2022 meeting, the Board also approved an amendment to the fund's sub-advisory agreement with Geode (effective October 1, 2022) that reduced the sub-advisory fee rate that FMR pays to Geode.
Based on its review, the Board concluded that the fund's management fee is fair and reasonable in light of the services that the fund receives and the other factors considered.
Total Expense Ratio . In its review of the fund's total expense ratio, the Board considered the fund's unitary (subject to certain limited exceptions) fee rate as well as fund expenses paid by FMR under the fund's management contract, such as transfer agent fees, pricing and bookkeeping fees, and custodial, legal, and audit fees. The Board also noted that Fidelity may agree to waive fees or reimburse expenses from time to time, and the extent to which, if any, it has done so for the fund. The fund is compared to those funds and classes in the Total Mapped Group (used by the Board for management fee comparisons) that have a similar sales load structure. The Board also considered a total expense ASPG comparison, which focuses on the total expenses of the fund relative to a subset of non-Fidelity funds within the similar sales load structure group that are similar in size and management fee structure. The total expense ASPG is limited to 15 larger and 15 smaller classes of different funds, where possible. The total expense ASPG comparison excludes performance adjustments and fund-paid 12b-1 fees to eliminate variability in expenses relating to these items.
The Board noted that the fund's total net expense ratio ranked below the similar sales load structure group competitive median and below the ASPG competitive median for 2021.
Fees Charged to Other Clients . The Board also considered fee structures and other information with respect to clients of Fidelity and Geode, such as other funds advised or subadvised by Fidelity or Geode, pension plan clients, and other institutional clients with similar mandates. The Board noted that a joint ad hoc committee created by it and the boards of other Fidelity funds periodically reviews and compares Fidelity's institutional investment advisory business with its business of providing services to the Fidelity funds and also noted the most recent findings of the committee. The Board noted that the committee's review included a consideration of the differences in services provided, fees charged, and costs incurred, as well as competition in the markets serving the different categories of clients.
Based on its review of total expense ratios and fees charged to other Fidelity clients, the Board concluded that the fund's total expense ratio was reasonable in light of the services that the fund and its shareholders receive and the other factors considered.
Costs of the Services and Profitability . The Board considered the revenues earned and the expenses incurred by Fidelity in conducting the business of developing, marketing, distributing, managing, administering and servicing the fund and servicing the fund's shareholders. The Board also considered the level of Fidelity's profits in respect of all the Fidelity funds.
On an annual basis, Fidelity presents to the Board information about the profitability of its relationships with the fund. Fidelity calculates profitability information for each fund, as well as aggregate profitability information for groups of Fidelity funds and all Fidelity funds, using a series of detailed revenue and cost allocation methodologies which originate with the books and records of Fidelity on which Fidelity's audited financial statements are based. The Audit Committee of the Board reviews any significant changes from the prior year's methodologies and the full Board approves such changes.
A public accounting firm has been engaged annually by the Board as part of the Board's assessment of Fidelity's profitability analysis. The engagement includes the review and assessment of the methodologies used by Fidelity in determining the revenues and expenses attributable to Fidelity's mutual fund business, and completion of agreed-upon procedures in respect of the mathematical accuracy of certain fund profitability information and its conformity to established allocation methodologies. After considering the reports issued under the engagement and information provided by Fidelity, the Board concluded that while other allocation methods may also be reasonable, Fidelity's profitability methodologies are reasonable in all material respects.
The Board also reviewed Fidelity's and Geode's non-fund businesses and potential indirect benefits such businesses may have received as a result of their association with Fidelity's mutual fund business (i.e., fall-out benefits) as well as cases where Fidelity's and Geode's affiliates may benefit from the funds' business. The Board considered areas where potential indirect benefits to the Fidelity funds from their relationships with Fidelity may exist. The Board's consideration of these matters was informed by the findings of a joint ad hoc committee created by it and the boards of other Fidelity funds to evaluate potential fall-out benefits.
The Board considered the costs of the services provided by and the profits realized by Fidelity in connection with the operation of the fund and was satisfied that the profitability was not excessive.
The Board also considered information regarding the profitability of Geode's relationship with the fund.
Economies of Scale . The Board considered whether there have been economies of scale in respect of the management of the Fidelity funds, whether the Fidelity funds (including the fund) have appropriately benefited from any such economies of scale, and whether there is potential for realization of any further economies of scale. The Board considered the extent to which the fund will benefit from economies of scale as assets grow through increased services to the fund, through waivers or reimbursements, or through fee or expense ratio reductions. The Board recognized that, due to the fund's current contractual arrangements, its expense ratio will not decline if the fund's operating costs decrease as assets grow, or rise as assets decrease. The Board also noted that a committee (the Economies of Scale Committee) created by it and the boards of other Fidelity funds periodically analyzes whether Fidelity attains economies of scale in respect of the management and servicing of the Fidelity funds, whether the Fidelity funds have appropriately benefited from such economies of scale, and whether there is potential for realization of any further economies of scale.
The Board concluded, taking into account the analysis of the Economies of Scale Committee, that economies of scale, if any, are being appropriately shared between fund shareholders and Fidelity.
Additional Information Requested by the Board . In order to develop fully the factual basis for consideration of the Fidelity funds' advisory contracts, the Board requested and received additional information on certain topics, including: (i) Fidelity's fund profitability methodology, profitability trends for certain funds, the allocation of various costs to different funds, and the impact of certain factors on fund profitability results; (ii) portfolio manager changes that have occurred during the past year and the amount of the investment that each portfolio manager has made in the Fidelity fund(s) that he or she manages; (iii) the extent to which current market conditions have affected retention and recruitment of personnel; (iv) the arrangements with and compensation paid to certain fund sub-advisers on behalf of the Fidelity funds and the treatment of such compensation within Fidelity's fund profitability methodology; (v) the terms of the funds' various management fee structures, including the basic group fee and the terms of Fidelity's voluntary expense limitation arrangements; (vi) Fidelity's transfer agent, pricing and bookkeeping fees, expense and service structures for different funds and classes relative to competitive trends; (vii) the impact on fund profitability of recent industry trends, such as the growth in passively managed funds and the changes in flows for different types of funds; (viii) the types of management fee and total expense comparisons provided, and the challenges and limitations associated with such information; and (ix) explanations regarding the relative total expense ratios and management fees of certain funds and classes, total expense and management fee competitive trends, and methodologies for total expense and management fee competitive comparisons. In addition, the Board considered its discussions with Fidelity regarding Fidelity's efforts to maintain the continuous investment and shareholder services necessary for the funds during the current pandemic and economic circumstances.
Based on its evaluation of all of the conclusions noted above, and after considering all factors it believed relevant, the Board concluded that the advisory and sub-advisory fee arrangements are fair and reasonable and that the fund's Advisory Contracts should be renewed.
The Securities and Exchange Commission adopted Rule 22e-4 under the Investment Company Act of 1940 (the Liquidity Rule) to promote effective liquidity risk management throughout the open-end investment company industry, thereby reducing the risk that funds will be unable to meet their redemption obligations and mitigating dilution of the interests of fund shareholders.
The Fund has adopted and implemented a liquidity risk management program (the Program) reasonably designed to assess and manage the Fund's liquidity risk and to comply with the requirements of the Liquidity Rule. The Fund's Board of Trustees (the Board) has designated the Fund's investment adviser as administrator of the Program. The Fidelity advisers have established a Liquidity Risk Management Committee (the LRM Committee) to manage the Program for each of the Fidelity Funds. The LRM Committee monitors the adequacy and effectiveness of implementation of the Program and on a periodic basis assesses each Fund's liquidity risk based on a variety of factors including (1) the Fund's investment strategy, (2) portfolio liquidity and cash flow projections during normal and reasonably foreseeable stressed conditions, (3) shareholder redemptions, (4) borrowings and other funding sources and (5) certain factors specific to ETFs including the effect of the Fund's prices and spreads, market participants, and basket compositions on the overall liquidity of the Fund's portfolio, as applicable.
In accordance with the Program, each of the Fund's portfolio investments is classified into one of four defined liquidity categories based on a determination of a reasonable expectation for how long it would take to convert the investment to cash (or sell or dispose of the investment) without significantly changing its market value.
- Highly liquid investments - cash or convertible to cash within three business days or less
- Moderately liquid investments - convertible to cash in three to seven calendar days
- Less liquid investments - can be sold or disposed of, but not settled, within seven calendar days
- Illiquid investments - cannot be sold or disposed of within seven calendar days
Liquidity classification determinations take into account a variety of factors including various market, trading and investment-specific considerations, as well as market depth, and generally utilize analysis from a third-party liquidity metrics service.
The Liquidity Rule places a 15% limit on a fund's illiquid investments and requires funds that do not primarily hold assets that are highly liquid investments to determine and maintain a minimum percentage of the fund's net assets to be invested in highly liquid investments (highly liquid investment minimum or HLIM). The Program includes provisions reasonably designed to comply with the 15% limit on illiquid investments and for determining, periodically reviewing and complying with the HLIM requirement as applicable.
At a recent meeting of the Fund's Board of Trustees, the LRM Committee provided a written report to the Board pertaining to the operation, adequacy, and effectiveness of the Program for the period December 1, 2021 through November 30, 2022. The report concluded that the Program is operating effectively and is reasonably designed to assess and manage the Fund's liquidity risk.
1.929346.111
URX-I-SANN-0423
Fidelity® SAI U.S. Large Cap Index Fund
Semi-Annual Report
January 31, 2023
Offered exclusively to certain clients of the Adviser, or its affiliates, including Strategic Advisers LLC (Strategic Advisers) - not available for sale to the general public. Fidelity ® SAI is a product name of Fidelity ® funds dedicated to certain programs affiliated with Strategic Advisers.
Contents
To view a fund's proxy voting guidelines and proxy voting record for the 12-month period ended June 30, visit http://www.fidelity.com/proxyvotingresults or visit the Securities and Exchange Commission's (SEC) web site at http://www.sec.gov.
You may also call 1-800-544-3455 to request a free copy of the proxy voting guidelines.
Standard & Poor's ® ; and S&P ® ; are registered trademarks of Standard & Poor's Financial Services LLC ("S&P") and Dow Jones ® ; is a registered trademark of Dow Jones Trademark Holdings LLC ("Dow Jones"). The fund is not sponsored, endorsed, sold or promoted by SPDJI, Dow Jones, S&P, or their respective affiliates and none of such parties make any representation regarding the advisability of investing in such product(s) nor do they have any liability for any errors, omissions, or interruptions of the index or indices.
Standard & Poor's, S&P and S&P 500 are registered service marks of The McGraw-Hill Companies, Inc. and have been licensed for use by Fidelity Distributors Corporation.
Other third-party marks appearing herein are the property of their respective owners.
All other marks appearing herein are registered or unregistered trademarks or service marks of FMR LLC or an affiliated company. © 2023 FMR LLC. All rights reserved.
This report and the financial statements contained herein are submitted for the general information of the shareholders of the Fund. This report is not authorized for distribution to prospective investors in the Fund unless preceded or accompanied by an effective prospectus.
A fund files its complete schedule of portfolio holdings with the SEC for the first and third quarters of each fiscal year on Form N-PORT. Forms N-PORT are available on the SEC's web site at http://www.sec.gov. A fund's Forms N-PORT may be reviewed and copied at the SEC's Public Reference Room in Washington, DC. Information regarding the operation of the SEC's Public Reference Room may be obtained by calling 1-800-SEC-0330.
For a complete list of a fund's portfolio holdings, view the most recent holdings listing, semiannual report, or annual report on Fidelity's web site at http://www.fidelity.com, http://www.institutional.fidelity.com, or http://www.401k.com, as applicable.
NOT FDIC INSURED •MAY LOSE VALUE •NO BANK GUARANTEE
Neither the Fund nor Fidelity Distributors Corporation is a bank.
Top Holdings (% of Fund's net assets) |
| |
| Apple, Inc. | 6.3 | |
| Microsoft Corp. | 5.4 | |
| Amazon.com, Inc. | 2.7 | |
| Alphabet, Inc. Class A | 1.7 | |
| Berkshire Hathaway, Inc. Class B | 1.6 | |
| Alphabet, Inc. Class C | 1.6 | |
| NVIDIA Corp. | 1.4 | |
| Exxon Mobil Corp. | 1.4 | |
| UnitedHealth Group, Inc. | 1.4 | |
| Tesla, Inc. | 1.4 | |
| | 24.9 | |
| |
| Market Sectors (% of Fund's net assets) |
| |
| Information Technology | 26.4 | |
| Health Care | 14.6 | |
| Financials | 11.7 | |
| Consumer Discretionary | 10.6 | |
| Industrials | 8.3 | |
| Communication Services | 7.8 | |
| Consumer Staples | 6.7 | |
| Energy | 5.0 | |
| Utilities | 2.9 | |
| Materials | 2.8 | |
| Real Estate | 2.8 | |
| |
Asset Allocation (% of Fund's net assets) |
|
Foreign investments - 3.4% |
Percentages shown as 0.0% may reflect amounts less than 0.05%. |
|
Showing Percentage of Net Assets
| Common Stocks - 99.6% |
| | | Shares | Value ($) |
| COMMUNICATION SERVICES - 7.8% | | | |
| Diversified Telecommunication Services - 0.9% | | | |
| AT&T, Inc. | | 2,369,087 | 48,258,302 |
| Lumen Technologies, Inc. (a) | | 318,567 | 1,672,477 |
| Verizon Communications, Inc. | | 1,395,953 | 58,029,766 |
| | | | 107,960,545 |
| Entertainment - 1.5% | | | |
| Activision Blizzard, Inc. | | 236,716 | 18,125,344 |
| Electronic Arts, Inc. | | 87,175 | 11,217,679 |
| Live Nation Entertainment, Inc. (b) | | 47,476 | 3,821,343 |
| Netflix, Inc. (b) | | 147,933 | 52,347,571 |
| Take-Two Interactive Software, Inc. (b) | | 52,459 | 5,939,933 |
| The Walt Disney Co. (b) | | 606,024 | 65,747,544 |
| Warner Bros Discovery, Inc. (b) | | 734,639 | 10,887,350 |
| | | | 168,086,764 |
| Interactive Media & Services - 4.3% | | | |
| Alphabet, Inc.: | | | |
| Class A (b) | | 1,985,500 | 196,246,820 |
| Class C (b) | | 1,760,131 | 175,784,283 |
| Match Group, Inc. (b) | | 92,846 | 5,024,826 |
| Meta Platforms, Inc. Class A (b) | | 747,500 | 111,355,075 |
| | | | 488,411,004 |
| Media - 0.8% | | | |
| Charter Communications, Inc. Class A (b) | | 35,705 | 13,721,789 |
| Comcast Corp. Class A | | 1,434,026 | 56,428,923 |
| DISH Network Corp. Class A (b) | | 82,822 | 1,191,809 |
| Fox Corp.: | | | |
| Class A | | 100,285 | 3,403,673 |
| Class B | | 46,556 | 1,475,825 |
| Interpublic Group of Companies, Inc. | | 129,423 | 4,718,763 |
| News Corp.: | | | |
| Class A | | 127,654 | 2,586,270 |
| Class B | | 38,569 | 788,350 |
| Omnicom Group, Inc. | | 67,840 | 5,833,562 |
| Paramount Global Class B (a) | | 167,846 | 3,887,313 |
| | | | 94,036,277 |
| Wireless Telecommunication Services - 0.3% | | | |
| T-Mobile U.S., Inc. (b) | | 198,502 | 29,638,334 |
TOTAL COMMUNICATION SERVICES | | | 888,132,924 |
| CONSUMER DISCRETIONARY - 10.6% | | | |
| Auto Components - 0.1% | | | |
| Aptiv PLC (b) | | 90,089 | 10,188,165 |
| BorgWarner, Inc. | | 77,733 | 3,675,216 |
| | | | 13,863,381 |
| Automobiles - 1.7% | | | |
| Ford Motor Co. | | 1,312,931 | 17,737,698 |
| General Motors Co. | | 472,264 | 18,569,420 |
| Tesla, Inc. (b) | | 892,242 | 154,554,159 |
| | | | 190,861,277 |
| Distributors - 0.2% | | | |
| Genuine Parts Co. | | 46,839 | 7,860,521 |
| LKQ Corp. | | 84,489 | 4,981,471 |
| Pool Corp. | | 12,978 | 5,004,447 |
| | | | 17,846,439 |
| Hotels, Restaurants & Leisure - 2.1% | | | |
| Booking Holdings, Inc. (b) | | 12,895 | 31,387,720 |
| Caesars Entertainment, Inc. (b) | | 71,202 | 3,706,776 |
| Carnival Corp. (a)(b) | | 332,375 | 3,596,298 |
| Chipotle Mexican Grill, Inc. (b) | | 9,216 | 15,173,038 |
| Darden Restaurants, Inc. | | 40,697 | 6,021,935 |
| Domino's Pizza, Inc. | | 11,743 | 4,145,279 |
| Expedia, Inc. (b) | | 50,082 | 5,724,373 |
| Hilton Worldwide Holdings, Inc. | | 89,938 | 13,049,104 |
| Las Vegas Sands Corp. (b) | | 109,251 | 6,445,809 |
| Marriott International, Inc. Class A | | 89,457 | 15,581,620 |
| McDonald's Corp. | | 243,482 | 65,107,087 |
| MGM Resorts International | | 105,719 | 4,377,824 |
| Norwegian Cruise Line Holdings Ltd. (a)(b) | | 139,297 | 2,118,707 |
| Royal Caribbean Cruises Ltd. (a)(b) | | 72,975 | 4,738,997 |
| Starbucks Corp. | | 381,605 | 41,648,370 |
| Wynn Resorts Ltd. (b) | | 34,287 | 3,553,505 |
| Yum! Brands, Inc. | | 93,654 | 12,222,784 |
| | | | 238,599,226 |
| Household Durables - 0.4% | | | |
| D.R. Horton, Inc. | | 103,950 | 10,258,826 |
| Garmin Ltd. | | 51,039 | 5,046,736 |
| Lennar Corp. Class A | | 84,601 | 8,663,142 |
| Mohawk Industries, Inc. (b) | | 17,566 | 2,108,974 |
| Newell Brands, Inc. | | 125,713 | 2,006,379 |
| NVR, Inc. (b) | | 1,001 | 5,275,270 |
| PulteGroup, Inc. | | 75,625 | 4,302,306 |
| Whirlpool Corp. | | 18,155 | 2,824,736 |
| | | | 40,486,369 |
| Internet & Direct Marketing Retail - 2.8% | | | |
| Amazon.com, Inc. (b) | | 2,950,367 | 304,271,349 |
| eBay, Inc. | | 180,403 | 8,929,949 |
| Etsy, Inc. (b) | | 41,813 | 5,752,633 |
| | | | 318,953,931 |
| Leisure Products - 0.0% | | | |
| Hasbro, Inc. | | 43,304 | 2,562,298 |
| Multiline Retail - 0.5% | | | |
| Dollar General Corp. | | 74,985 | 17,516,496 |
| Dollar Tree, Inc. (b) | | 69,976 | 10,508,996 |
| Target Corp. | | 153,004 | 26,338,109 |
| | | | 54,363,601 |
| Specialty Retail - 2.3% | | | |
| Advance Auto Parts, Inc. | | 19,964 | 3,040,118 |
| AutoZone, Inc. (b) | | 6,310 | 15,389,144 |
| Bath & Body Works, Inc. | | 75,915 | 3,492,849 |
| Best Buy Co., Inc. | | 66,652 | 5,913,365 |
| CarMax, Inc. (a)(b) | | 52,441 | 3,694,468 |
| Lowe's Companies, Inc. | | 206,335 | 42,969,264 |
| O'Reilly Automotive, Inc. (b) | | 20,801 | 16,481,672 |
| Ross Stores, Inc. | | 115,375 | 13,636,171 |
| The Home Depot, Inc. | | 340,309 | 110,317,969 |
| TJX Companies, Inc. | | 385,965 | 31,595,095 |
| Tractor Supply Co. | | 36,720 | 8,371,793 |
| Ulta Beauty, Inc. (b) | | 17,026 | 8,750,683 |
| | | | 263,652,591 |
| Textiles, Apparel & Luxury Goods - 0.5% | | | |
| NIKE, Inc. Class B | | 418,805 | 53,326,441 |
| Ralph Lauren Corp. | | 13,580 | 1,681,883 |
| Tapestry, Inc. | | 79,942 | 3,642,957 |
| VF Corp. | | 109,596 | 3,390,900 |
| | | | 62,042,181 |
TOTAL CONSUMER DISCRETIONARY | | | 1,203,231,294 |
| CONSUMER STAPLES - 6.7% | | | |
| Beverages - 1.8% | | | |
| Brown-Forman Corp. Class B (non-vtg.) | | 60,786 | 4,047,132 |
| Constellation Brands, Inc. Class A (sub. vtg.) | | 53,964 | 12,493,745 |
| Keurig Dr. Pepper, Inc. | | 282,463 | 9,965,295 |
| Molson Coors Beverage Co. Class B | | 62,404 | 3,281,202 |
| Monster Beverage Corp. (b) | | 126,609 | 13,177,465 |
| PepsiCo, Inc. | | 457,976 | 78,323,056 |
| The Coca-Cola Co. | | 1,293,804 | 79,336,061 |
| | | | 200,623,956 |
| Food & Staples Retailing - 1.5% | | | |
| Costco Wholesale Corp. | | 147,129 | 75,203,517 |
| Kroger Co. | | 216,499 | 9,662,350 |
| Sysco Corp. | | 168,449 | 13,048,060 |
| Walgreens Boots Alliance, Inc. | | 238,638 | 8,796,197 |
| Walmart, Inc. | | 469,177 | 67,500,495 |
| | | | 174,210,619 |
| Food Products - 1.1% | | | |
| Archer Daniels Midland Co. | | 182,597 | 15,128,161 |
| Campbell Soup Co. | | 66,710 | 3,464,250 |
| Conagra Brands, Inc. | | 159,388 | 5,927,640 |
| General Mills, Inc. | | 197,275 | 15,458,469 |
| Hormel Foods Corp. | | 96,193 | 4,358,505 |
| Kellogg Co. | | 85,133 | 5,838,421 |
| Lamb Weston Holdings, Inc. | | 47,804 | 4,775,142 |
| McCormick & Co., Inc. (non-vtg.) | | 83,306 | 6,257,947 |
| Mondelez International, Inc. | | 453,959 | 29,707,077 |
| The Hershey Co. | | 48,843 | 10,970,138 |
| The J.M. Smucker Co. | | 35,463 | 5,418,746 |
| The Kraft Heinz Co. | | 264,655 | 10,726,467 |
| Tyson Foods, Inc. Class A | | 96,276 | 6,330,147 |
| | | | 124,361,110 |
| Household Products - 1.4% | | | |
| Church & Dwight Co., Inc. | | 81,050 | 6,553,703 |
| Colgate-Palmolive Co. | | 277,610 | 20,690,273 |
| Kimberly-Clark Corp. | | 112,163 | 14,582,312 |
| Procter & Gamble Co. | | 787,733 | 112,157,425 |
| The Clorox Co. | | 41,040 | 5,938,078 |
| | | | 159,921,791 |
| Personal Products - 0.2% | | | |
| Estee Lauder Companies, Inc. Class A | | 76,882 | 21,302,465 |
| Tobacco - 0.7% | | | |
| Altria Group, Inc. | | 595,706 | 26,830,598 |
| Philip Morris International, Inc. | | 515,307 | 53,715,602 |
| | | | 80,546,200 |
TOTAL CONSUMER STAPLES | | | 760,966,141 |
| ENERGY - 5.0% | | | |
| Energy Equipment & Services - 0.4% | | | |
| Baker Hughes Co. Class A | | 332,931 | 10,567,230 |
| Halliburton Co. | | 301,866 | 12,442,917 |
| Schlumberger Ltd. | | 471,377 | 26,859,061 |
| | | | 49,869,208 |
| Oil, Gas & Consumable Fuels - 4.6% | | | |
| APA Corp. | | 107,048 | 4,745,438 |
| Chevron Corp. | | 591,352 | 102,907,075 |
| ConocoPhillips Co. | | 414,205 | 50,479,163 |
| Coterra Energy, Inc. | | 262,028 | 6,558,561 |
| Devon Energy Corp. | | 217,269 | 13,740,092 |
| Diamondback Energy, Inc. | | 58,489 | 8,546,413 |
| EOG Resources, Inc. | | 195,249 | 25,821,680 |
| EQT Corp. | | 121,992 | 3,985,479 |
| Exxon Mobil Corp. | | 1,368,983 | 158,815,718 |
| Hess Corp. | | 92,239 | 13,850,608 |
| Kinder Morgan, Inc. | | 657,541 | 12,033,000 |
| Marathon Oil Corp. | | 211,236 | 5,802,653 |
| Marathon Petroleum Corp. | | 155,778 | 20,020,589 |
| Occidental Petroleum Corp. | | 241,699 | 15,659,678 |
| ONEOK, Inc. | | 148,582 | 10,174,895 |
| Phillips 66 Co. | | 157,093 | 15,751,715 |
| Pioneer Natural Resources Co. | | 78,975 | 18,191,891 |
| Targa Resources Corp. | | 75,320 | 5,650,506 |
| The Williams Companies, Inc. (a) | | 404,888 | 13,053,589 |
| Valero Energy Corp. | | 128,144 | 17,944,004 |
| | | | 523,732,747 |
TOTAL ENERGY | | | 573,601,955 |
| FINANCIALS - 11.7% | | | |
| Banks - 3.9% | | | |
| Bank of America Corp. | | 2,320,122 | 82,317,929 |
| Citigroup, Inc. | | 643,839 | 33,621,273 |
| Citizens Financial Group, Inc. | | 163,670 | 7,090,184 |
| Comerica, Inc. | | 43,493 | 3,188,472 |
| Fifth Third Bancorp | | 228,121 | 8,278,511 |
| First Republic Bank | | 60,806 | 8,566,349 |
| Huntington Bancshares, Inc. | | 479,394 | 7,272,407 |
| JPMorgan Chase & Co. | | 975,052 | 136,468,278 |
| KeyCorp | | 310,319 | 5,955,022 |
| M&T Bank Corp. | | 57,369 | 8,949,564 |
| PNC Financial Services Group, Inc. | | 134,063 | 22,178,042 |
| Regions Financial Corp. | | 310,522 | 7,309,688 |
| Signature Bank | | 20,967 | 2,703,695 |
| SVB Financial Group (b) | | 19,657 | 5,945,063 |
| Truist Financial Corp. | | 441,005 | 21,781,237 |
| U.S. Bancorp | | 449,438 | 22,382,012 |
| Wells Fargo & Co. | | 1,266,682 | 59,369,385 |
| Zions Bancorp NA | | 49,839 | 2,649,441 |
| | | | 446,026,552 |
| Capital Markets - 3.2% | | | |
| Ameriprise Financial, Inc. | | 35,374 | 12,385,145 |
| Bank of New York Mellon Corp. | | 244,511 | 12,364,921 |
| BlackRock, Inc. Class A | | 49,930 | 37,907,355 |
| Cboe Global Markets, Inc. | | 35,254 | 4,332,012 |
| Charles Schwab Corp. | | 507,043 | 39,255,269 |
| CME Group, Inc. | | 119,578 | 21,124,649 |
| FactSet Research Systems, Inc. | | 12,678 | 5,362,033 |
| Franklin Resources, Inc. (a) | | 94,619 | 2,952,113 |
| Goldman Sachs Group, Inc. | | 112,571 | 41,179,598 |
| Intercontinental Exchange, Inc. | | 185,676 | 19,969,454 |
| Invesco Ltd. | | 151,598 | 2,806,079 |
| MarketAxess Holdings, Inc. | | 12,478 | 4,540,120 |
| Moody's Corp. | | 52,376 | 16,904,354 |
| Morgan Stanley | | 438,236 | 42,653,510 |
| MSCI, Inc. | | 26,582 | 14,129,928 |
| NASDAQ, Inc. | | 112,684 | 6,782,450 |
| Northern Trust Corp. | | 69,280 | 6,718,082 |
| Raymond James Financial, Inc. | | 64,349 | 7,256,637 |
| S&P Global, Inc. | | 110,697 | 41,504,733 |
| State Street Corp. | | 121,980 | 11,140,433 |
| T. Rowe Price Group, Inc. | | 74,285 | 8,651,974 |
| | | | 359,920,849 |
| Consumer Finance - 0.6% | | | |
| American Express Co. | | 198,711 | 34,760,515 |
| Capital One Financial Corp. | | 126,867 | 15,097,173 |
| Discover Financial Services | | 90,797 | 10,598,734 |
| Synchrony Financial | | 149,904 | 5,505,974 |
| | | | 65,962,396 |
| Diversified Financial Services - 1.6% | | | |
| Berkshire Hathaway, Inc. Class B (b) | | 598,938 | 186,581,166 |
| Insurance - 2.4% | | | |
| AFLAC, Inc. | | 188,075 | 13,823,513 |
| Allstate Corp. | | 88,164 | 11,326,429 |
| American International Group, Inc. | | 246,910 | 15,609,650 |
| Aon PLC | | 68,760 | 21,912,437 |
| Arch Capital Group Ltd. (b) | | 122,940 | 7,911,189 |
| Arthur J. Gallagher & Co. | | 70,088 | 13,717,623 |
| Assurant, Inc. | | 17,596 | 2,333,054 |
| Brown & Brown, Inc. | | 78,313 | 4,586,009 |
| Chubb Ltd. | | 137,966 | 31,385,885 |
| Cincinnati Financial Corp. | | 52,284 | 5,915,935 |
| Everest Re Group Ltd. | | 13,015 | 4,551,215 |
| Globe Life, Inc. | | 30,047 | 3,631,180 |
| Hartford Financial Services Group, Inc. | | 105,706 | 8,203,843 |
| Lincoln National Corp. | | 50,869 | 1,802,289 |
| Loews Corp. | | 65,447 | 4,023,682 |
| Marsh & McLennan Companies, Inc. | | 164,887 | 28,840,385 |
| MetLife, Inc. | | 219,095 | 15,998,317 |
| Principal Financial Group, Inc. | | 75,614 | 6,998,076 |
| Progressive Corp. | | 194,490 | 26,518,712 |
| Prudential Financial, Inc. | | 122,346 | 12,838,989 |
| The Travelers Companies, Inc. | | 77,893 | 14,886,910 |
| W.R. Berkley Corp. | | 68,069 | 4,774,360 |
| Willis Towers Watson PLC | | 35,980 | 9,145,756 |
| | | | 270,735,438 |
TOTAL FINANCIALS | | | 1,329,226,401 |
| HEALTH CARE - 14.6% | | | |
| Biotechnology - 2.3% | | | |
| AbbVie, Inc. | | 587,871 | 86,857,940 |
| Amgen, Inc. | | 177,369 | 44,767,936 |
| Biogen, Inc. (b) | | 47,868 | 13,924,801 |
| Gilead Sciences, Inc. | | 416,926 | 34,996,768 |
| Incyte Corp. (b) | | 61,458 | 5,232,534 |
| Moderna, Inc. (b) | | 109,827 | 19,336,142 |
| Regeneron Pharmaceuticals, Inc. (b) | | 35,596 | 26,998,498 |
| Vertex Pharmaceuticals, Inc. (b) | | 85,327 | 27,569,154 |
| | | | 259,683,773 |
| Health Care Equipment & Supplies - 2.8% | | | |
| Abbott Laboratories | | 579,593 | 64,074,006 |
| Align Technology, Inc. (b) | | 24,148 | 6,513,440 |
| Baxter International, Inc. | | 167,585 | 7,656,959 |
| Becton, Dickinson & Co. | | 94,802 | 23,910,960 |
| Boston Scientific Corp. (b) | | 476,121 | 22,020,596 |
| Dentsply Sirona, Inc. | | 71,571 | 2,635,960 |
| DexCom, Inc. (b) | | 128,400 | 13,750,356 |
| Edwards Lifesciences Corp. (b) | | 205,513 | 15,762,847 |
| GE HealthCare Technologies, Inc. (b) | | 121,075 | 8,417,134 |
| Hologic, Inc. (b) | | 82,975 | 6,751,676 |
| IDEXX Laboratories, Inc. (b) | | 27,530 | 13,228,165 |
| Intuitive Surgical, Inc. (b) | | 117,473 | 28,861,941 |
| Medtronic PLC | | 441,830 | 36,976,753 |
| ResMed, Inc. | | 48,692 | 11,119,792 |
| STERIS PLC | | 33,182 | 6,852,415 |
| Stryker Corp. | | 111,961 | 28,416,821 |
| Teleflex, Inc. | | 15,589 | 3,794,674 |
| The Cooper Companies, Inc. | | 16,419 | 5,729,082 |
| Zimmer Biomet Holdings, Inc. | | 69,753 | 8,882,347 |
| | | | 315,355,924 |
| Health Care Providers & Services - 3.3% | | | |
| AmerisourceBergen Corp. | | 53,823 | 9,093,934 |
| Cardinal Health, Inc. | | 87,126 | 6,730,484 |
| Centene Corp. (b) | | 188,232 | 14,350,808 |
| Cigna Corp. | | 101,631 | 32,183,489 |
| CVS Health Corp. | | 436,788 | 38,533,437 |
| DaVita HealthCare Partners, Inc. (b) | | 18,140 | 1,494,555 |
| Elevance Health, Inc. | | 79,390 | 39,694,206 |
| HCA Holdings, Inc. | | 70,486 | 17,978,864 |
| Henry Schein, Inc. (b) | | 45,044 | 3,880,541 |
| Humana, Inc. | | 42,083 | 21,533,871 |
| Laboratory Corp. of America Holdings | | 29,451 | 7,425,186 |
| McKesson Corp. | | 47,129 | 17,846,810 |
| Molina Healthcare, Inc. (b) | | 19,424 | 6,056,986 |
| Quest Diagnostics, Inc. | | 37,898 | 5,627,095 |
| UnitedHealth Group, Inc. | | 310,596 | 155,046,417 |
| Universal Health Services, Inc. Class B | | 21,324 | 3,160,430 |
| | | | 380,637,113 |
| Life Sciences Tools & Services - 1.9% | | | |
| Agilent Technologies, Inc. | | 98,406 | 14,965,584 |
| Bio-Rad Laboratories, Inc. Class A (b) | | 7,142 | 3,338,599 |
| Bio-Techne Corp. | | 52,164 | 4,155,384 |
| Charles River Laboratories International, Inc. (b) | | 16,911 | 4,113,601 |
| Danaher Corp. | | 217,790 | 57,579,320 |
| Illumina, Inc. (b) | | 52,294 | 11,201,375 |
| IQVIA Holdings, Inc. (b) | | 61,743 | 14,164,462 |
| Mettler-Toledo International, Inc. (b) | | 7,410 | 11,358,937 |
| PerkinElmer, Inc. | | 41,989 | 5,774,747 |
| Thermo Fisher Scientific, Inc. | | 130,373 | 74,355,633 |
| Waters Corp. (b) | | 19,745 | 6,487,812 |
| West Pharmaceutical Services, Inc. | | 24,608 | 6,535,885 |
| | | | 214,031,339 |
| Pharmaceuticals - 4.3% | | | |
| Bristol-Myers Squibb Co. | | 706,748 | 51,345,242 |
| Catalent, Inc. (b) | | 59,720 | 3,198,006 |
| Eli Lilly & Co. | | 262,160 | 90,222,364 |
| Johnson & Johnson | | 869,096 | 142,027,668 |
| Merck & Co., Inc. | | 842,794 | 90,524,504 |
| Organon & Co. | | 84,774 | 2,554,241 |
| Pfizer, Inc. | | 1,865,938 | 82,399,822 |
| Viatris, Inc. | | 403,703 | 4,909,028 |
| Zoetis, Inc. Class A | | 154,931 | 25,639,531 |
| | | | 492,820,406 |
TOTAL HEALTH CARE | | | 1,662,528,555 |
| INDUSTRIALS - 8.3% | | | |
| Aerospace & Defense - 1.8% | | | |
| General Dynamics Corp. | | 74,825 | 17,438,715 |
| Howmet Aerospace, Inc. | | 122,553 | 4,986,682 |
| Huntington Ingalls Industries, Inc. | | 13,255 | 2,923,258 |
| L3Harris Technologies, Inc. | | 63,285 | 13,594,884 |
| Lockheed Martin Corp. | | 77,529 | 35,916,085 |
| Northrop Grumman Corp. | | 48,090 | 21,546,244 |
| Raytheon Technologies Corp. | | 488,667 | 48,793,400 |
| Textron, Inc. | | 69,490 | 5,062,347 |
| The Boeing Co. (b) | | 186,232 | 39,667,416 |
| TransDigm Group, Inc. | | 17,172 | 12,325,203 |
| | | | 202,254,234 |
| Air Freight & Logistics - 0.6% | | | |
| C.H. Robinson Worldwide, Inc. | | 39,101 | 3,916,747 |
| Expeditors International of Washington, Inc. | | 52,945 | 5,726,002 |
| FedEx Corp. | | 79,576 | 15,426,603 |
| United Parcel Service, Inc. Class B | | 242,587 | 44,934,390 |
| | | | 70,003,742 |
| Airlines - 0.2% | | | |
| Alaska Air Group, Inc. (b) | | 42,351 | 2,174,300 |
| American Airlines Group, Inc. (b) | | 215,945 | 3,485,352 |
| Delta Air Lines, Inc. (b) | | 213,078 | 8,331,350 |
| Southwest Airlines Co. | | 197,310 | 7,057,779 |
| United Airlines Holdings, Inc. (b) | | 108,816 | 5,327,631 |
| | | | 26,376,412 |
| Building Products - 0.5% | | | |
| A.O. Smith Corp. | | 42,267 | 2,861,476 |
| Allegion PLC | | 29,169 | 3,428,816 |
| Carrier Global Corp. | | 277,919 | 12,653,652 |
| Johnson Controls International PLC | | 228,911 | 15,925,338 |
| Masco Corp. | | 74,890 | 3,984,148 |
| Trane Technologies PLC | | 76,538 | 13,709,487 |
| | | | 52,562,917 |
| Commercial Services & Supplies - 0.5% | | | |
| Cintas Corp. | | 28,688 | 12,730,013 |
| Copart, Inc. (b) | | 142,422 | 9,486,729 |
| Republic Services, Inc. | | 68,259 | 8,520,088 |
| Rollins, Inc. | | 77,141 | 2,807,932 |
| Waste Management, Inc. | | 124,153 | 19,210,194 |
| | | | 52,754,956 |
| Construction & Engineering - 0.1% | | | |
| Quanta Services, Inc. | | 47,505 | 7,229,786 |
| Electrical Equipment - 0.6% | | | |
| AMETEK, Inc. | | 76,331 | 11,061,889 |
| Eaton Corp. PLC | | 132,199 | 21,444,000 |
| Emerson Electric Co. | | 196,550 | 17,732,741 |
| Generac Holdings, Inc. (b) | | 21,093 | 2,543,816 |
| Rockwell Automation, Inc. | | 38,175 | 10,766,495 |
| | | | 63,548,941 |
| Industrial Conglomerates - 0.8% | | | |
| 3M Co. | | 183,723 | 21,142,843 |
| General Electric Co. | | 363,221 | 29,232,026 |
| Honeywell International, Inc. | | 223,484 | 46,591,944 |
| | | | 96,966,813 |
| Machinery - 1.8% | | | |
| Caterpillar, Inc. | | 172,994 | 43,644,656 |
| Cummins, Inc. | | 46,876 | 11,697,437 |
| Deere & Co. | | 91,301 | 38,605,715 |
| Dover Corp. | | 46,652 | 7,083,173 |
| Fortive Corp. | | 117,631 | 8,002,437 |
| IDEX Corp. | | 25,080 | 6,011,174 |
| Illinois Tool Works, Inc. | | 92,926 | 21,934,253 |
| Ingersoll Rand, Inc. | | 134,613 | 7,538,328 |
| Nordson Corp. | | 17,870 | 4,347,771 |
| Otis Worldwide Corp. | | 138,488 | 11,387,868 |
| PACCAR, Inc. | | 115,595 | 12,635,689 |
| Parker Hannifin Corp. | | 42,689 | 13,916,614 |
| Pentair PLC | | 54,791 | 3,034,326 |
| Snap-On, Inc. | | 17,658 | 4,392,074 |
| Stanley Black & Decker, Inc. | | 49,076 | 4,382,978 |
| Westinghouse Air Brake Tech Co. | | 60,460 | 6,276,353 |
| Xylem, Inc. | | 59,919 | 6,232,175 |
| | | | 211,123,021 |
| Professional Services - 0.4% | | | |
| CoStar Group, Inc. (b) | | 135,187 | 10,531,067 |
| Equifax, Inc. | | 40,700 | 9,043,540 |
| Jacobs Solutions, Inc. | | 42,479 | 5,248,280 |
| Leidos Holdings, Inc. | | 45,404 | 4,487,731 |
| Robert Half International, Inc. | | 36,131 | 3,033,559 |
| Verisk Analytics, Inc. | | 51,977 | 9,448,899 |
| | | | 41,793,076 |
| Road & Rail - 0.8% | | | |
| CSX Corp. | | 698,842 | 21,608,195 |
| J.B. Hunt Transport Services, Inc. | | 27,568 | 5,211,730 |
| Norfolk Southern Corp. | | 76,956 | 18,916,554 |
| Old Dominion Freight Lines, Inc. | | 30,113 | 10,034,856 |
| Union Pacific Corp. | | 204,367 | 41,729,698 |
| | | | 97,501,033 |
| Trading Companies & Distributors - 0.2% | | | |
| Fastenal Co. | | 190,363 | 9,622,850 |
| United Rentals, Inc. | | 23,038 | 10,158,606 |
| W.W. Grainger, Inc. | | 14,946 | 8,810,368 |
| | | | 28,591,824 |
TOTAL INDUSTRIALS | | | 950,706,755 |
| INFORMATION TECHNOLOGY - 26.4% | | | |
| Communications Equipment - 0.9% | | | |
| Arista Networks, Inc. (b) | | 82,278 | 10,368,674 |
| Cisco Systems, Inc. | | 1,364,890 | 66,429,196 |
| F5, Inc. (b) | | 19,944 | 2,944,931 |
| Juniper Networks, Inc. | | 107,833 | 3,483,006 |
| Motorola Solutions, Inc. | | 55,581 | 14,284,873 |
| | | | 97,510,680 |
| Electronic Equipment & Components - 0.7% | | | |
| Amphenol Corp. Class A | | 197,804 | 15,778,825 |
| CDW Corp. | | 45,000 | 8,821,350 |
| Corning, Inc. | | 253,014 | 8,756,815 |
| Keysight Technologies, Inc. (b) | | 59,429 | 10,658,591 |
| TE Connectivity Ltd. | | 105,728 | 13,443,315 |
| Teledyne Technologies, Inc. (b) | | 15,579 | 6,609,547 |
| Trimble, Inc. (b) | | 81,972 | 4,759,294 |
| Zebra Technologies Corp. Class A (b) | | 17,178 | 5,431,340 |
| | | | 74,259,077 |
| IT Services - 4.4% | | | |
| Accenture PLC Class A | | 209,446 | 58,445,906 |
| Akamai Technologies, Inc. (b) | | 52,368 | 4,658,134 |
| Automatic Data Processing, Inc. | | 137,890 | 31,136,941 |
| Broadridge Financial Solutions, Inc. | | 39,133 | 5,884,038 |
| Cognizant Technology Solutions Corp. Class A | | 170,809 | 11,401,501 |
| DXC Technology Co. (b) | | 76,633 | 2,201,666 |
| EPAM Systems, Inc. (b) | | 19,118 | 6,359,603 |
| Fidelity National Information Services, Inc. | | 197,237 | 14,800,664 |
| Fiserv, Inc. (b) | | 211,078 | 22,517,801 |
| FleetCor Technologies, Inc. (b) | | 24,549 | 5,126,077 |
| Gartner, Inc. (b) | | 26,265 | 8,881,247 |
| Global Payments, Inc. | | 89,882 | 10,131,499 |
| IBM Corp. | | 300,542 | 40,492,024 |
| Jack Henry & Associates, Inc. | | 24,232 | 4,363,941 |
| MasterCard, Inc. Class A | | 282,182 | 104,576,649 |
| Paychex, Inc. | | 106,608 | 12,351,603 |
| PayPal Holdings, Inc. (b) | | 378,966 | 30,881,939 |
| VeriSign, Inc. (b) | | 30,654 | 6,684,105 |
| Visa, Inc. Class A | | 543,506 | 125,120,516 |
| | | | 506,015,854 |
| Semiconductors & Semiconductor Equipment - 5.5% | | | |
| Advanced Micro Devices, Inc. (b) | | 535,975 | 40,278,521 |
| Analog Devices, Inc. | | 170,969 | 29,316,054 |
| Applied Materials, Inc. | | 285,972 | 31,883,018 |
| Broadcom, Inc. | | 134,630 | 78,759,896 |
| Enphase Energy, Inc. (b) | | 45,183 | 10,002,613 |
| First Solar, Inc. (b) | | 32,978 | 5,856,893 |
| Intel Corp. | | 1,371,884 | 38,769,442 |
| KLA Corp. | | 47,106 | 18,488,163 |
| Lam Research Corp. | | 45,333 | 22,671,033 |
| Microchip Technology, Inc. | | 182,806 | 14,189,402 |
| Micron Technology, Inc. | | 361,393 | 21,791,998 |
| Monolithic Power Systems, Inc. | | 14,826 | 6,324,179 |
| NVIDIA Corp. | | 827,725 | 161,712,633 |
| NXP Semiconductors NV | | 86,134 | 15,875,358 |
| onsemi (b) | | 143,739 | 10,557,630 |
| Qorvo, Inc. (b) | | 33,686 | 3,660,321 |
| Qualcomm, Inc. | | 372,631 | 49,638,176 |
| Skyworks Solutions, Inc. | | 53,367 | 5,852,759 |
| SolarEdge Technologies, Inc. (b) | | 18,597 | 5,934,861 |
| Teradyne, Inc. | | 51,834 | 5,271,518 |
| Texas Instruments, Inc. | | 301,680 | 53,460,713 |
| | | | 630,295,181 |
| Software - 8.3% | | | |
| Adobe, Inc. (b) | | 154,540 | 57,232,344 |
| ANSYS, Inc. (b) | | 28,956 | 7,712,720 |
| Autodesk, Inc. (b) | | 71,754 | 15,438,591 |
| Cadence Design Systems, Inc. (b) | | 91,183 | 16,670,988 |
| Ceridian HCM Holding, Inc. (a)(b) | | 51,057 | 3,690,400 |
| Fortinet, Inc. (b) | | 215,538 | 11,281,259 |
| Gen Digital, Inc. | | 192,649 | 4,432,853 |
| Intuit, Inc. | | 93,699 | 39,603,756 |
| Microsoft Corp. | | 2,478,005 | 614,074,419 |
| Oracle Corp. | | 510,862 | 45,190,853 |
| Paycom Software, Inc. (b) | | 16,176 | 5,240,053 |
| PTC, Inc. (b) | | 35,135 | 4,739,009 |
| Roper Technologies, Inc. | | 35,252 | 15,043,791 |
| Salesforce.com, Inc. (b) | | 332,420 | 55,836,587 |
| ServiceNow, Inc. (b) | | 67,148 | 30,561,069 |
| Synopsys, Inc. (b) | | 50,828 | 17,980,405 |
| Tyler Technologies, Inc. (b) | | 13,838 | 4,466,491 |
| | | | 949,195,588 |
| Technology Hardware, Storage & Peripherals - 6.6% | | | |
| Apple, Inc. | | 4,970,876 | 717,247,686 |
| Hewlett Packard Enterprise Co. | | 427,782 | 6,900,124 |
| HP, Inc. | | 294,254 | 8,574,562 |
| NetApp, Inc. | | 72,377 | 4,793,529 |
| Seagate Technology Holdings PLC | | 63,828 | 4,326,262 |
| Western Digital Corp. (b) | | 105,312 | 4,628,462 |
| | | | 746,470,625 |
TOTAL INFORMATION TECHNOLOGY | | | 3,003,747,005 |
| MATERIALS - 2.8% | | | |
| Chemicals - 1.9% | | | |
| Air Products & Chemicals, Inc. | | 73,727 | 23,630,241 |
| Albemarle Corp. | | 38,942 | 10,960,226 |
| Celanese Corp. Class A | | 33,147 | 4,083,710 |
| CF Industries Holdings, Inc. | | 65,296 | 5,530,571 |
| Corteva, Inc. | | 237,488 | 15,306,102 |
| Dow, Inc. | | 233,901 | 13,882,024 |
| DuPont de Nemours, Inc. | | 165,140 | 12,212,103 |
| Eastman Chemical Co. | | 39,861 | 3,514,544 |
| Ecolab, Inc. | | 82,372 | 12,753,657 |
| FMC Corp. | | 41,914 | 5,580,011 |
| International Flavors & Fragrances, Inc. | | 84,756 | 9,531,660 |
| Linde PLC | | 164,339 | 54,386,349 |
| LyondellBasell Industries NV Class A | | 84,405 | 8,161,119 |
| PPG Industries, Inc. | | 78,123 | 10,182,552 |
| Sherwin-Williams Co. | | 78,389 | 18,546,054 |
| The Mosaic Co. | | 113,279 | 5,611,842 |
| | | | 213,872,765 |
| Construction Materials - 0.1% | | | |
| Martin Marietta Materials, Inc. | | 20,637 | 7,421,891 |
| Vulcan Materials Co. | | 44,174 | 8,098,419 |
| | | | 15,520,310 |
| Containers & Packaging - 0.3% | | | |
| Amcor PLC | | 495,154 | 5,971,557 |
| Avery Dennison Corp. | | 26,959 | 5,107,113 |
| Ball Corp. | | 104,379 | 6,079,033 |
| International Paper Co. | | 118,149 | 4,940,991 |
| Packaging Corp. of America | | 30,737 | 4,386,170 |
| Sealed Air Corp. | | 48,189 | 2,638,830 |
| WestRock Co. | | 84,437 | 3,313,308 |
| | | | 32,437,002 |
| Metals & Mining - 0.5% | | | |
| Freeport-McMoRan, Inc. | | 475,152 | 21,201,282 |
| Newmont Corp. | | 263,857 | 13,965,951 |
| Nucor Corp. | | 85,276 | 14,413,350 |
| Steel Dynamics, Inc. | | 55,437 | 6,687,920 |
| | | | 56,268,503 |
TOTAL MATERIALS | | | 318,098,580 |
| REAL ESTATE - 2.8% | | | |
| Equity Real Estate Investment Trusts (REITs) - 2.7% | | | |
| Alexandria Real Estate Equities, Inc. | | 49,644 | 7,979,777 |
| American Tower Corp. | | 154,779 | 34,576,081 |
| AvalonBay Communities, Inc. | | 46,501 | 8,251,137 |
| Boston Properties, Inc. | | 47,356 | 3,529,916 |
| Camden Property Trust (SBI) | | 35,382 | 4,359,416 |
| Crown Castle International Corp. | | 143,955 | 21,321,175 |
| Digital Realty Trust, Inc. | | 95,580 | 10,955,380 |
| Equinix, Inc. | | 30,762 | 22,706,355 |
| Equity Residential (SBI) | | 113,057 | 7,196,078 |
| Essex Property Trust, Inc. | | 21,559 | 4,873,843 |
| Extra Space Storage, Inc. | | 44,515 | 7,025,802 |
| Federal Realty Investment Trust (SBI) | | 24,336 | 2,714,194 |
| Healthpeak Properties, Inc. | | 178,954 | 4,917,656 |
| Host Hotels & Resorts, Inc. | | 237,141 | 4,470,108 |
| Invitation Homes, Inc. | | 193,098 | 6,275,685 |
| Iron Mountain, Inc. | | 96,728 | 5,279,414 |
| Kimco Realty Corp. | | 205,571 | 4,617,125 |
| Mid-America Apartment Communities, Inc. | | 38,389 | 6,400,214 |
| Prologis (REIT), Inc. | | 306,855 | 39,670,214 |
| Public Storage | | 52,541 | 15,990,328 |
| Realty Income Corp. | | 208,465 | 14,140,181 |
| Regency Centers Corp. | | 51,121 | 3,406,192 |
| SBA Communications Corp. Class A | | 35,888 | 10,677,757 |
| Simon Property Group, Inc. | | 108,686 | 13,961,804 |
| UDR, Inc. | | 101,677 | 4,330,423 |
| Ventas, Inc. | | 132,888 | 6,884,927 |
| VICI Properties, Inc. | | 320,122 | 10,941,770 |
| Welltower, Inc. | | 157,084 | 11,787,583 |
| Weyerhaeuser Co. | | 244,602 | 8,421,647 |
| | | | 307,662,182 |
| Real Estate Management & Development - 0.1% | | | |
| CBRE Group, Inc. (b) | | 105,003 | 8,978,807 |
TOTAL REAL ESTATE | | | 316,640,989 |
| UTILITIES - 2.9% | | | |
| Electric Utilities - 1.9% | | | |
| Alliant Energy Corp. | | 83,378 | 4,504,913 |
| American Electric Power Co., Inc. | | 170,798 | 16,048,180 |
| Constellation Energy Corp. | | 108,709 | 9,279,400 |
| Duke Energy Corp. | | 255,966 | 26,223,717 |
| Edison International | | 126,934 | 8,745,753 |
| Entergy Corp. | | 67,627 | 7,322,652 |
| Evergy, Inc. | | 76,425 | 4,788,026 |
| Eversource Energy | | 115,756 | 9,530,191 |
| Exelon Corp. | | 330,346 | 13,937,298 |
| FirstEnergy Corp. | | 180,508 | 7,391,803 |
| NextEra Energy, Inc. | | 660,581 | 49,299,160 |
| NRG Energy, Inc. | | 76,743 | 2,626,145 |
| PG&E Corp. (b) | | 535,201 | 8,509,696 |
| Pinnacle West Capital Corp. | | 37,696 | 2,810,237 |
| PPL Corp. | | 244,756 | 7,244,778 |
| Southern Co. | | 361,879 | 24,491,971 |
| Xcel Energy, Inc. | | 181,878 | 12,507,750 |
| | | | 215,261,670 |
| Gas Utilities - 0.0% | | | |
| Atmos Energy Corp. | | 46,556 | 5,472,192 |
| Independent Power and Renewable Electricity Producers - 0.1% | | | |
| The AES Corp. | | 222,125 | 6,088,446 |
| Multi-Utilities - 0.8% | | | |
| Ameren Corp. | | 85,920 | 7,463,870 |
| CenterPoint Energy, Inc. | | 209,274 | 6,303,333 |
| CMS Energy Corp. | | 96,507 | 6,098,277 |
| Consolidated Edison, Inc. | | 117,948 | 11,241,624 |
| Dominion Energy, Inc. | | 276,992 | 17,627,771 |
| DTE Energy Co. | | 64,387 | 7,492,715 |
| NiSource, Inc. | | 134,856 | 3,742,254 |
| Public Service Enterprise Group, Inc. | | 165,871 | 10,272,391 |
| Sempra Energy | | 104,488 | 16,752,561 |
| WEC Energy Group, Inc. | | 104,843 | 9,854,194 |
| | | | 96,848,990 |
| Water Utilities - 0.1% | | | |
| American Water Works Co., Inc. | | 60,445 | 9,459,038 |
TOTAL UTILITIES | | | 333,130,336 |
| TOTAL COMMON STOCKS (Cost $6,159,367,128) | | | 11,340,010,935 |
| | | | |
| U.S. Treasury Obligations - 0.0% |
| | | Principal Amount (c) | Value ($) |
U.S. Treasury Bills, yield at date of purchase 4.65% 6/29/23 (d) (Cost $784,994) | | 800,000 | 784,981 |
| | | | |
| Money Market Funds - 0.9% |
| | | Shares | Value ($) |
| Fidelity Cash Central Fund 4.38% (e) | | 68,447,845 | 68,461,534 |
| Fidelity Securities Lending Cash Central Fund 4.38% (e)(f) | | 30,936,138 | 30,939,232 |
| TOTAL MONEY MARKET FUNDS (Cost $99,400,766) | | | 99,400,766 |
| | | | |
| TOTAL INVESTMENT IN SECURITIES - 100.5% (Cost $6,259,552,888) | 11,440,196,682 |
NET OTHER ASSETS (LIABILITIES) - (0.5)% | (57,609,735) |
| NET ASSETS - 100.0% | 11,382,586,947 |
| | |
| Futures Contracts |
| | Number of contracts | Expiration Date | Notional Amount ($) | Value ($) | Unrealized Appreciation/ (Depreciation) ($) |
| Purchased | | | | | |
| | | | | | |
| Equity Index Contracts | | | | | |
| CME E-mini S&P 500 Index Contracts (United States) | 212 | Mar 2023 | 43,354,000 | 1,444,854 | 1,444,854 |
| | | | | | |
| The notional amount of futures purchased as a percentage of Net Assets is 0.4% |
Legend
| (a) | Security or a portion of the security is on loan at period end. |
| (c) | Amount is stated in United States dollars unless otherwise noted. |
| (d) | Security or a portion of the security was pledged to cover margin requirements for futures contracts. At period end, the value of securities pledged amounted to $784,981. |
| (e) | Affiliated fund that is generally available only to investment companies and other accounts managed by Fidelity Investments. The rate quoted is the annualized seven-day yield of the fund at period end. A complete unaudited listing of the fund's holdings as of its most recent quarter end is available upon request. In addition, each Fidelity Central Fund's financial statements are available on the SEC's website or upon request. |
| (f) | Investment made with cash collateral received from securities on loan. |
Affiliated Central Funds
Fiscal year to date information regarding the Fund's investments in Fidelity Central Funds, including the ownership percentage, is presented below.
| Affiliate | Value, beginning of period ($) | Purchases ($) | Sales Proceeds ($) | Dividend Income ($) | Realized Gain (loss) ($) | Change in Unrealized appreciation (depreciation) ($) | Value, end of period ($) | % ownership, end of period |
| Fidelity Cash Central Fund 4.38% | 23,327,967 | 2,356,076,398 | 2,310,942,831 | 634,648 | - | - | 68,461,534 | 0.1% |
| Fidelity Securities Lending Cash Central Fund 4.38% | 25,099,899 | 106,874,352 | 101,035,019 | 43,572 | - | - | 30,939,232 | 0.1% |
| Total | 48,427,866 | 2,462,950,750 | 2,411,977,850 | 678,220 | - | - | 99,400,766 | |
| | | | | | | | | |
Amounts in the dividend income column in the above table include any capital gain distributions from underlying funds, which are presented in the corresponding line item in the Statement of Operations, if applicable.
Amount for Fidelity Securities Lending Cash Central Fund represents the income earned on investing cash collateral, less rebates paid to borrowers and any lending agent fees associated with the loan, plus any premium payments received for lending certain types of securities.
Amounts included in the purchases and sales proceeds columns may include in-kind transactions, if applicable.
Investment Valuation
The following is a summary of the inputs used, as of January 31, 2023, involving the Fund's assets and liabilities carried at fair value. The inputs or methodology used for valuing securities may not be an indication of the risk associated with investing in those securities. For more information on valuation inputs, and their aggregation into the levels used below, please refer to the Investment Valuation section in the accompanying Notes to Financial Statements.
| Valuation Inputs at Reporting Date: |
| Description | Total ($) | Level 1 ($) | Level 2 ($) | Level 3 ($) |
Investments in Securities: | | | | |
|
| Equities: | | | | |
Communication Services | 888,132,924 | 888,132,924 | - | - |
Consumer Discretionary | 1,203,231,294 | 1,203,231,294 | - | - |
Consumer Staples | 760,966,141 | 760,966,141 | - | - |
Energy | 573,601,955 | 573,601,955 | - | - |
Financials | 1,329,226,401 | 1,329,226,401 | - | - |
Health Care | 1,662,528,555 | 1,662,528,555 | - | - |
Industrials | 950,706,755 | 950,706,755 | - | - |
Information Technology | 3,003,747,005 | 3,003,747,005 | - | - |
Materials | 318,098,580 | 318,098,580 | - | - |
Real Estate | 316,640,989 | 316,640,989 | - | - |
Utilities | 333,130,336 | 333,130,336 | - | - |
|
| U.S. Government and Government Agency Obligations | 784,981 | - | 784,981 | - |
|
| Money Market Funds | 99,400,766 | 99,400,766 | - | - |
| Total Investments in Securities: | 11,440,196,682 | 11,439,411,701 | 784,981 | - |
Derivative Instruments: | | | | |
|
| Assets | | | | |
Futures Contracts | 1,444,854 | 1,444,854 | - | - |
| Total Assets | 1,444,854 | 1,444,854 | - | - |
| Total Derivative Instruments: | 1,444,854 | 1,444,854 | - | - |
Value of Derivative Instruments
The following table is a summary of the Fund's value of derivative instruments by primary risk exposure as of January 31, 2023. For additional information on derivative instruments, please refer to the Derivative Instruments section in the accompanying Notes to Financial Statements.
Primary Risk Exposure / Derivative Type | Value |
| Asset ($) | Liability ($) |
| Equity Risk | | |
Futures Contracts (a) | 1,444,854 | 0 |
| Total Equity Risk | 1,444,854 | 0 |
| Total Value of Derivatives | 1,444,854 | 0 |
(a)Reflects gross cumulative appreciation (depreciation) on futures contracts as presented in the Schedule of Investments. In the Statement of Assets and Liabilities, the period end daily variation margin is included in receivable or payable for daily variation margin on futures contracts, and the net cumulative appreciation (depreciation) is included in Total accumulated earnings (loss).
| Statement of Assets and Liabilities |
| | | | January 31, 2023 (Unaudited) |
| | | | | |
| Assets | | | | |
| Investment in securities, at value (including securities loaned of $30,993,307) - See accompanying schedule: | | | | |
Unaffiliated issuers (cost $6,160,152,122) | $ | 11,340,795,916 | | |
Fidelity Central Funds (cost $99,400,766) | | 99,400,766 | | |
| | | | | |
| | | | | |
| Total Investment in Securities (cost $6,259,552,888) | | | $ | 11,440,196,682 |
| Segregated cash with brokers for derivative instruments | | | | 1,565,218 |
| Cash | | | | 976 |
| Receivable for fund shares sold | | | | 59,301,027 |
| Dividends receivable | | | | 8,947,287 |
| Distributions receivable from Fidelity Central Funds | | | | 63,978 |
| Receivable for daily variation margin on futures contracts | | | | 639,902 |
| Prepaid expenses | | | | 9,606 |
| Receivable from investment adviser for expense reductions | | | | 49,199 |
| Other receivables | | | | 977 |
Total assets | | | | 11,510,774,852 |
| Liabilities | | | | |
| Payable for investments purchased | $ | 90,356,063 | | |
| Payable for fund shares redeemed | | 6,676,664 | | |
| Accrued management fee | | 137,638 | | |
| Other payables and accrued expenses | | 48,132 | | |
| Collateral on securities loaned | | 30,969,408 | | |
| Total Liabilities | | | | 128,187,905 |
| Net Assets | | | $ | 11,382,586,947 |
| Net Assets consist of: | | | | |
| Paid in capital | | | $ | 6,309,182,884 |
| Total accumulated earnings (loss) | | | | 5,073,404,063 |
| Net Assets | | | $ | 11,382,586,947 |
Net Asset Value , offering price and redemption price per share ($11,382,586,947 ÷ 637,237,567 shares) | | | $ | 17.86 |
| Statement of Operations |
| | | | Six months ended January 31, 2023 (Unaudited) |
| Investment Income | | | | |
| Dividends | | | $ | 90,732,706 |
| Interest | | | | 17,591 |
| Income from Fidelity Central Funds (including $43,572 from security lending) | | | | 678,220 |
| Total Income | | | | 91,428,517 |
| Expenses | | | | |
| Management fee | $ | 807,465 | | |
| Custodian fees and expenses | | 107,210 | | |
| Independent trustees' fees and expenses | | 20,735 | | |
| Registration fees | | 35,873 | | |
| Audit | | 28,151 | | |
| Legal | | 12,764 | | |
| Interest | | 393,351 | | |
| Miscellaneous | | 34,743 | | |
| Total expenses before reductions | | 1,440,292 | | |
| Expense reductions | | (219,178) | | |
| Total expenses after reductions | | | | 1,221,114 |
| Net Investment income (loss) | | | | 90,207,403 |
| Realized and Unrealized Gain (Loss) | | | | |
| Net realized gain (loss) on: | | | | |
| Investment Securities: | | | | |
| Unaffiliated issuers | | 321,895,155 | | |
| Futures contracts | | (2,585,082) | | |
| Total net realized gain (loss) | | | | 319,310,073 |
| Change in net unrealized appreciation (depreciation) on: | | | | |
| Investment Securities: | | | | |
| Unaffiliated issuers | | (523,864,471) | | |
| Futures contracts | | 1,019,624 | | |
| Total change in net unrealized appreciation (depreciation) | | | | (522,844,847) |
| Net gain (loss) | | | | (203,534,774) |
| Net increase (decrease) in net assets resulting from operations | | | $ | (113,327,371) |
| Statement of Changes in Net Assets |
| |
| | Six months ended January 31, 2023 (Unaudited) | | Year ended July 31, 2022 |
| Increase (Decrease) in Net Assets | | | | |
| Operations | | | | |
| Net investment income (loss) | $ | 90,207,403 | $ | 200,594,435 |
| Net realized gain (loss) | | 319,310,073 | | 932,932,604 |
| Change in net unrealized appreciation (depreciation) | | (522,844,847) | | (1,488,595,269) |
| Net increase (decrease) in net assets resulting from operations | | (113,327,371) | | (355,068,230) |
| Distributions to shareholders | | (1,089,852,286) | | (1,599,790,076) |
| Share transactions | | | | |
| Proceeds from sales of shares | | 4,985,047,122 | | 12,169,424,091 |
| Reinvestment of distributions | | 1,074,867,889 | | 1,583,014,796 |
| Cost of shares redeemed | | (5,600,734,813) | | (13,638,764,397) |
Net increase (decrease) in net assets resulting from share transactions | | 459,180,198 | | 113,674,490 |
| Total increase (decrease) in net assets | | (743,999,459) | | (1,841,183,816) |
| | | | | |
| Net Assets | | | | |
| Beginning of period | | 12,126,586,406 | | 13,967,770,222 |
| End of period | $ | 11,382,586,947 | $ | 12,126,586,406 |
| | | | | |
| Other Information | | | | |
| Shares | | | | |
| Sold | | 277,743,112 | | 573,830,765 |
| Issued in reinvestment of distributions | | 59,907,420 | | 74,073,945 |
| Redeemed | | (310,612,211) | | (640,807,880) |
| Net increase (decrease) | | 27,038,321 | | 7,096,830 |
| | | | | |
Financial Highlights
| Fidelity® SAI U.S. Large Cap Index Fund |
| |
| | Six months ended (Unaudited) January 31, 2023 | | Years ended July 31, 2022 | | 2021 | | 2020 | | 2019 | | 2018 |
Selected Per-Share Data | | | | | | | | | | | | |
| Net asset value, beginning of period | $ | 19.87 | $ | 23.16 | $ | 17.68 | $ | 16.09 | $ | 15.21 | $ | 13.30 |
| Income from Investment Operations | | | | | | | | | | | | |
Net investment income (loss) A,B | | .15 | | .30 | | .31 | | .32 | | .30 | | .27 |
| Net realized and unrealized gain (loss) | | (.27) | | (1.23) | | 5.94 | | 1.56 | | .87 | | 1.86 |
| Total from investment operations | | (.12) | | (.93) | | 6.25 | | 1.88 | | 1.17 | | 2.13 |
| Distributions from net investment income | | (.33) | | (.34) | | (.35) | | (.29) | | (.28) | | (.19) |
| Distributions from net realized gain | | (1.56) | | (2.02) | | (.42) | | - | | (.01) | | (.03) |
| Total distributions | | (1.89) | | (2.36) | | (.77) | | (.29) | | (.29) | | (.22) |
| Net asset value, end of period | $ | 17.86 | $ | 19.87 | $ | 23.16 | $ | 17.68 | $ | 16.09 | $ | 15.21 |
Total Return C,D | | (.45)% | | (4.68)% | | 36.43% | | 11.84% | | 7.97% | | 16.22% |
Ratios to Average Net Assets B,E,F | | | | | | | | | | | | |
| Expenses before reductions | | .03% G | | .02% | | .02% | | .02% | | .09% | | .09% |
| Expenses net of fee waivers, if any | | .02% G | | .02% | | .02% | | .02% | | .02% | | .02% |
| Expenses net of all reductions | | .02% G | | .02% | | .02% | | .02% | | .02% | | .02% |
| Net investment income (loss) | | 1.68% G | | 1.43% | | 1.52% | | 1.97% | | 2.00% | | 1.87% |
| Supplemental Data | | | | | | | | | | | | |
| Net assets, end of period (000 omitted) | $ | 11,382,587 | $ | 12,126,586 | $ | 13,967,770 | $ | 15,406,444 | $ | 14,046,976 | $ | 13,692,497 |
Portfolio turnover rate H | | 66% G | | 75% | | 86% | | 80% | | 41% | | 26% |
A Calculated based on average shares outstanding during the period.
B Net investment income (loss) is affected by the timing of the declaration of dividends by any underlying mutual funds or exchange-traded funds (ETFs). Net investment income (loss) of any mutual funds or ETFs is not included in the Fund's net investment income (loss) ratio.
C Total returns for periods of less than one year are not annualized.
D Total returns would have been lower if certain expenses had not been reduced during the applicable periods shown.
E Expense ratios reflect operating expenses of the class. Expenses before reductions do not reflect amounts reimbursed, waived, or reduced through arrangements with the investment adviser, brokerage services, or other offset arrangements, if applicable, and do not represent the amount paid by the class during periods when reimbursements, waivers or reductions occur.
F Fees and expenses of any underlying mutual funds or exchange-traded funds (ETFs) are not included in the Fund's expense ratio. The Fund indirectly bears its proportionate share of these expenses. For additional expense information related to investments in Fidelity Central Funds, please refer to the "Investments in Fidelity Central Funds" note found in the Notes to Financial Statements section of the most recent Annual or Semi-Annual report.
G Annualized.
H Amount does not include the portfolio activity of any underlying mutual funds or exchange-traded funds (ETFs).
For the period ended January 31, 2023
1. Organization.
Fidelity SAI U.S. Large Cap Index Fund (the Fund) is a fund of Fidelity Salem Street Trust (the Trust) and is authorized to issue an unlimited number of shares. Shares are offered exclusively to certain clients of Fidelity Management & Research Company LLC (FMR) or its affiliates. The Trust is registered under the Investment Company Act of 1940, as amended (the 1940 Act), as an open-end management investment company organized as a Massachusetts business trust.
2. Investments in Fidelity Central Funds.
Funds may invest in Fidelity Central Funds, which are open-end investment companies generally available only to other investment companies and accounts managed by the investment adviser and its affiliates. The Schedule of Investments lists any Fidelity Central Funds held as an investment as of period end, but does not include the underlying holdings of each Fidelity Central Fund. An investing fund indirectly bears its proportionate share of the expenses of the underlying Fidelity Central Funds.
Based on its investment objective, each Fidelity Central Fund may invest or participate in various investment vehicles or strategies that are similar to those of the investing fund. These strategies are consistent with the investment objectives of the investing fund and may involve certain economic risks which may cause a decline in value of each of the Fidelity Central Funds and thus a decline in the value of the investing fund.
| Fidelity Central Fund | Investment Manager | Investment Objective | Investment Practices | Expense Ratio A |
| Fidelity Money Market Central Funds | Fidelity Management & Research Company LLC (FMR) | Each fund seeks to obtain a high level of current income consistent with the preservation of capital and liquidity. | Short-term Investments | Less than .005% |
A Expenses expressed as a percentage of average net assets and are as of each underlying Central Fund's most recent annual or semi-annual shareholder report.
A complete unaudited list of holdings for each Fidelity Central Fund is available upon request or at the Securities and Exchange Commission website at www.sec.gov. In addition, the financial statements of the Fidelity Central Funds which contain the significant accounting policies (including investment valuation policies) of those funds, and are not covered by the Report of Independent Registered Public Accounting Firm, are available on the Securities and Exchange Commission website or upon request.
3. Significant Accounting Policies.
The Fund is an investment company and applies the accounting and reporting guidance of the Financial Accounting Standards Board (FASB) Accounting Standards Codification Topic 946 Financial Services - Investment Companies . The financial statements have been prepared in conformity with accounting principles generally accepted in the United States of America (GAAP), which require management to make certain estimates and assumptions at the date of the financial statements. Actual results could differ from those estimates. Subsequent events, if any, through the date that the financial statements were issued have been evaluated in the preparation of the financial statements. The Fund's Schedule of Investments lists any underlying mutual funds or exchange-traded funds (ETFs) but does not include the underlying holdings of these funds. The following summarizes the significant accounting policies of the Fund:
Investment Valuation. Investments are valued as of 4:00 p.m. Eastern time on the last calendar day of the period. The Board of Trustees (the Board) has designated the Fund's investment adviser as the valuation designee responsible for the fair valuation function and performing fair value determinations as needed. The investment adviser has established a Fair Value Committee (the Committee) to carry out the day-to-day fair valuation responsibilities and has adopted policies and procedures to govern the fair valuation process and the activities of the Committee. In accordance with these fair valuation policies and procedures, which have been approved by the Board, the Fund attempts to obtain prices from one or more third party pricing services or brokers to value its investments. When current market prices, quotations or currency exchange rates are not readily available or reliable, investments will be fair valued in good faith by the Committee, in accordance with the policies and procedures. Factors used in determining fair value vary by investment type and may include market or investment specific events, transaction data, estimated cash flows, and market observations of comparable investments. The frequency that the fair valuation procedures are used cannot be predicted and they may be utilized to a significant extent. The Committee manages the Fund's fair valuation practices and maintains the fair valuation policies and procedures. The Fund's investment adviser reports to the Board information regarding the fair valuation process and related material matters.
The Fund categorizes the inputs to valuation techniques used to value its investments into a disclosure hierarchy consisting of three levels as shown below:
Level 1 - unadjusted quoted prices in active markets for identical investments
Level 2 - other significant observable inputs (including quoted prices for similar investments, interest rates, prepayment speeds, etc.)
Level 3 - unobservable inputs (including the Fund's own assumptions based on the best information available)
Valuation techniques used to value the Fund's investments by major category are as follows:
Equity securities, including restricted securities, for which market quotations are readily available, are valued at the last reported sale price or official closing price as reported by a third party pricing service on the primary market or exchange on which they are traded and are categorized as Level 1 in the hierarchy. In the event there were no sales during the day or closing prices are not available, securities are valued at the last quoted bid price or may be valued using the last available price and are generally categorized as Level 2 in the hierarchy. For foreign equity securities, when market or security specific events arise, comparisons to the valuation of American Depositary Receipts (ADRs), futures contracts, ETFs and certain indexes as well as quoted prices for similar securities may be used and would be categorized as Level 2 in the hierarchy. For equity securities, including restricted securities, where observable inputs are limited, assumptions about market activity and risk are used and these securities may be categorized as Level 3 in the hierarchy.
Debt securities, including restricted securities, are valued based on evaluated prices received from third party pricing services or from brokers who make markets in such securities. U.S. government and government agency obligations are valued by pricing services who utilize matrix pricing which considers yield or price of bonds of comparable quality, coupon, maturity and type or by broker-supplied prices. When independent prices are unavailable or unreliable, debt securities may be valued utilizing pricing methodologies which consider similar factors that would be used by third party pricing services. Debt securities are generally categorized as Level 2 in the hierarchy but may be Level 3 depending on the circumstances.
Futures contracts are valued at the settlement price established each day by the board of trade or exchange on which they are traded and are categorized as Level 1 in the hierarchy. Investments in open-end mutual funds, including the Fidelity Central Funds, are valued at their closing net asset value (NAV) each business day and are categorized as Level 1 in the hierarchy.
Changes in valuation techniques may result in transfers in or out of an assigned level within the disclosure hierarchy. The aggregate value of investments by input level as of January 31, 2023 is included at the end of the Fund's Schedule of Investments.
Investment Transactions and Income. For financial reporting purposes, the Fund's investment holdings and NAV include trades executed through the end of the last business day of the period. The NAV per share for processing shareholder transactions is calculated as of the close of business of the New York Stock Exchange (NYSE), normally 4:00 p.m. Eastern time and includes trades executed through the end of the prior business day. Gains and losses on securities sold are determined on the basis of identified cost and include proceeds received from litigation. Commissions paid to certain brokers with whom the investment adviser, or its affiliates, places trades on behalf of a fund include an amount in addition to trade execution, which may be rebated back to a fund. Any such rebates are included in net realized gain (loss) on investments in the Statement of Operations. Dividend income is recorded on the ex-dividend date, except for certain dividends from foreign securities where the ex-dividend date may have passed, which are recorded as soon as the Fund is informed of the ex-dividend date. Non-cash dividends included in dividend income, if any, are recorded at the fair market value of the securities received. Income and capital gain distributions from Fidelity Central Funds, if any, are recorded on the ex-dividend date. Certain distributions received by the Fund represent a return of capital or capital gain. The Fund determines the components of these distributions subsequent to the ex-dividend date, based upon receipt of tax filings or other correspondence relating to the underlying investment. These distributions are recorded as a reduction of cost of investments and/or as a realized gain. Interest income is accrued as earned and includes coupon interest and amortization of premium and accretion of discount on debt securities as applicable.
Expenses. Expenses directly attributable to a fund are charged to that fund. Expenses attributable to more than one fund are allocated among the respective funds on the basis of relative net assets or other appropriate methods. Expenses included in the accompanying financial statements reflect the expenses of that fund and do not include any expenses associated with any underlying mutual funds or exchange-traded funds. Although not included in a fund's expenses, a fund indirectly bears its proportionate share of these expenses through the net asset value of each underlying mutual fund or exchange-traded fund. Expense estimates are accrued in the period to which they relate and adjustments are made when actual amounts are known.
Income Tax Information and Distributions to Shareholders. Each year, the Fund intends to qualify as a regulated investment company under Subchapter M of the Internal Revenue Code, including distributing substantially all of its taxable income and realized gains. As a result, no provision for U.S. Federal income taxes is required. The Fund files a U.S. federal tax return, in addition to state and local tax returns as required. The Fund's federal income tax returns are subject to examination by the Internal Revenue Service (IRS) for a period of three fiscal years after they are filed. State and local tax returns may be subject to examination for an additional fiscal year depending on the jurisdiction.
Distributions are declared and recorded on the ex-dividend date. Income and capital gain distributions are determined in accordance with income tax regulations, which may differ from GAAP.
Capital accounts within the financial statements are adjusted for permanent book-tax differences. These adjustments have no impact on net assets or the results of operations. Capital accounts are not adjusted for temporary book-tax differences which will reverse in a subsequent period.
Book-tax differences are primarily due to futures contracts and losses deferred due to wash sales.
As of period end, the cost and unrealized appreciation (depreciation) in securities, and derivatives if applicable, for federal income tax purposes were as follows:
| Gross unrealized appreciation | $5,301,892,372 |
| Gross unrealized depreciation | (366,869,257) |
| Net unrealized appreciation (depreciation) | $4,935,023,115 |
| Tax cost | $6,506,618,421 |
4. Derivative Instruments.
Risk Exposures and the Use of Derivative Instruments. The Fund's investment objectives allow for various types of derivative instruments, including futures contracts. Derivatives are investments whose value is primarily derived from underlying assets, indices or reference rates and may be transacted on an exchange or over-the-counter (OTC). Derivatives may involve a future commitment to buy or sell a specified asset based on specified terms, to exchange future cash flows at periodic intervals based on a notional principal amount, or for one party to make one or more payments upon the occurrence of specified events in exchange for periodic payments from the other party.
Derivatives were used to increase returns and to manage exposure to certain risks as defined below. The success of any strategy involving derivatives depends on analysis of numerous economic factors, and if the strategies for investment do not work as intended, the objectives may not be achieved.
Derivatives were used to increase or decrease exposure to the following risk(s):
| | |
| Equity Risk | Equity risk relates to the fluctuations in the value of financial instruments as a result of changes in market prices (other than those arising from interest rate risk or foreign exchange risk), whether caused by factors specific to an individual investment, its issuer, or all factors affecting all instruments traded in a market or market segment. |
Funds are also exposed to additional risks from investing in derivatives, such as liquidity risk and counterparty credit risk. Liquidity risk is the risk that a fund will be unable to close out the derivative in the open market in a timely manner. Counterparty credit risk is the risk that the counterparty will not be able to fulfill its obligation to a fund. Counterparty credit risk related to exchange-traded contracts may be mitigated by the protection provided by the exchange on which they trade.
Investing in derivatives may involve greater risks than investing in the underlying assets directly and, to varying degrees, may involve risk of loss in excess of any initial investment and collateral received and amounts recognized in the Statement of Assets and Liabilities. In addition, there may be the risk that the change in value of the derivative contract does not correspond to the change in value of the underlying instrument.
Futures Contracts. A futures contract is an agreement between two parties to buy or sell a specified underlying instrument for a fixed price at a specified future date. Futures contracts were used to manage exposure to the stock market.
Upon entering into a futures contract, a fund is required to deposit either cash or securities (initial margin) with a clearing broker in an amount equal to a certain percentage of the face value of the contract. Futures contracts are marked-to-market daily and subsequent daily payments are made or received by a fund depending on the daily fluctuations in the value of the futures contracts and are recorded as unrealized appreciation or (depreciation). This receivable and/or payable, if any, is included in daily variation margin on futures contracts in the Statement of Assets and Liabilities. Realized gain or (loss) is recorded upon the expiration or closing of a futures contract. The net realized gain (loss) and change in net unrealized appreciation (depreciation) on futures contracts during the period is presented in the Statement of Operations.
Any open futures contracts at period end are presented in the Schedule of Investments under the caption "Futures Contracts". The notional amount at value reflects each contract's exposure to the underlying instrument or index at period end, and is representative of volume of activity during the period unless an average notional amount is presented. Any securities deposited to meet initial margin requirements are identified in the Schedule of Investments. Any cash deposited to meet initial margin requirements is presented as segregated cash with brokers for derivative instruments in the Statement of Assets and Liabilities.
5. Purchases and Sales of Investments.
Purchases and sales of securities, other than short-term securities, U.S. government securities and in-kind transactions, as applicable, are noted in the table below.
| | Purchases ($) | Sales ($) |
| Fidelity SAI U.S. Large Cap Index Fund | 3,622,284,663 | 4,163,850,075 |
6. Fees and Other Transactions with Affiliates.
Management Fee. Fidelity Management & Research Company LLC (the investment adviser) and its affiliates provide the Fund with investment management related services for which the Fund pays a monthly management fee that is based on an annual rate of .015% of the Fund's average net assets.
Sub-Adviser. Geode Capital Management, LLC (Geode), serves as sub-adviser for the Fund. Geode provides discretionary investment advisory services to the Fund and is paid by the investment adviser for providing these services.
Interfund Lending Program. Pursuant to an Exemptive Order issued by the Securities and Exchange Commission (the SEC), the Fund, along with other registered investment companies having management contracts with Fidelity Management & Research Company LLC (FMR), or other affiliated entities of FMR, may participate in an interfund lending program. This program provides an alternative credit facility allowing the Fund to borrow from, or lend money to, other participating affiliated funds. At period end, there were no interfund loans outstanding. Activity in this program during the period for which loans were outstanding was as follows:
| | Borrower or Lender | Average Loan Balance | Weighted Average Interest Rate | Interest Expense |
| Fidelity SAI U.S. Large Cap Index Fund | Borrower | $69,174,689 | 3.25% | $380,778 |
Interfund Trades. Funds may purchase from or sell securities to other Fidelity Funds under procedures adopted by the Board. The procedures have been designed to ensure these interfund trades are executed in accordance with Rule 17a-7 of the 1940 Act. Any interfund trades are included within the respective purchases and sales amounts shown in the Purchases and Sales of Investments note. During the period, there were no interfund trades.
7. Committed Line of Credit.
Certain Funds participate with other funds managed by the investment adviser or an affiliate in a $4.25 billion credit facility (the "line of credit") to be utilized for temporary or emergency purposes to fund shareholder redemptions or for other short-term liquidity purposes. The participating funds have agreed to pay commitment fees on their pro-rata portion of the line of credit, which are reflected in Miscellaneous expenses on the Statement of Operations, and are listed below. During the period, there were no borrowings on this line of credit.
| | Amount |
| Fidelity SAI U.S. Large Cap Index Fund | $15,042 |
8. Security Lending.
Funds lend portfolio securities from time to time in order to earn additional income. Lending agents are used, including National Financial Services (NFS), an affiliate of the investment adviser. Pursuant to a securities lending agreement, NFS will receive a fee, which is capped at 9.9% of a fund's daily lending revenue, for its services as lending agent. A fund may lend securities to certain qualified borrowers, including NFS. On the settlement date of the loan, a fund receives collateral (in the form of U.S. Treasury obligations, letters of credit and/or cash) against the loaned securities and maintains collateral in an amount not less than 100% of the market value of the loaned securities during the period of the loan. The market value of the loaned securities is determined at the close of business of a fund and any additional required collateral is delivered to a fund on the next business day. A fund or borrower may terminate the loan at any time, and if the borrower defaults on its obligation to return the securities loaned because of insolvency or other reasons, a fund may apply collateral received from the borrower against the obligation. A fund may experience delays and costs in recovering the securities loaned. Any cash collateral received is invested in the Fidelity Securities Lending Cash Central Fund. Any loaned securities are identified as such in the Schedule of Investments, and the value of loaned securities and cash collateral at period end, as applicable, are presented in the Statement of Assets and Liabilities. Security lending income represents the income earned on investing cash collateral, less rebates paid to borrowers and any lending agent fees associated with the loan, plus any premium payments received for lending certain types of securities. Security lending income is presented in the Statement of Operations as a component of income from Fidelity Central Funds. Affiliated security lending activity, if any, was as follows:
| | Total Security Lending Fees Paid to NFS | Security Lending Income From Securities Loaned to NFS | Value of Securities Loaned to NFS at Period End |
| Fidelity SAI U.S. Large Cap Index Fund | $4,190 | $- | $- |
9. Bank Borrowings.
The Fund is permitted to have bank borrowings for temporary or emergency purposes to fund shareholder redemptions or for other short-term liquidity requirements. The Fund has established borrowing arrangements with certain banks. The interest rate on the borrowings is the bank's base rate, as revised from time to time. Any open loans, including accrued interest, at period end are presented under the caption "Notes payable" in the Statement of Assets and Liabilities, if applicable. Activity in this program during the period for which loans were outstanding was as follows:
| | Average Loan Balance | Weighted Average Interest Rate | Interest Expense |
| Fidelity SAI U.S. Large Cap Index Fund | $126,436,000 | 3.58% | $12,573 |
10. Expense Reductions.
The investment adviser contractually agreed to reimburse the Fund to the extent annual operating expenses exceeded .015% of average net assets. This reimbursement will remain in place through November 30, 2023. Some expenses, for example the compensation of the independent Trustees, and certain miscellaneous expenses such as proxy and shareholder meeting expenses, are excluded from this reimbursement. During the period this reimbursement reduced the Fund's expenses by $218,896.
Through arrangements with the Fund's custodian, credits realized as a result of certain uninvested cash balances were used to reduce the Fund's expenses by $282.
11. Other.
A fund's organizational documents provide former and current trustees and officers with a limited indemnification against liabilities arising in connection with the performance of their duties to the fund. In the normal course of business, a fund may also enter into contracts that provide general indemnifications. A fund's maximum exposure under these arrangements is unknown as this would be dependent on future claims that may be made against a fund. The risk of material loss from such claims is considered remote.
Atthe end of the period, the following mutual funds managed by the investment adviser or its affiliates were the owners of record of 10% or more of the total outstanding shares.
| | Strategic Advisers Fidelity U.S. Total Stock Fund |
| Fidelity SAI U.S. Large Cap Index Fund | 18% |
12. Risk and Uncertainties.
Many factors affect a fund's performance. Developments that disrupt global economies and financial markets, such as pandemics, epidemics, outbreaks of infectious diseases, war, terrorism, and environmental disasters, may significantly affect a fund's investment performance. The effects of these developments to a fund will be impacted by the types of securities in which a fund invests, the financial condition, industry, economic sector, and geographic location of an issuer, and a fund's level of investment in the securities of that issuer.
As a shareholder, you incur two types of costs: (1) transaction costs, which may include sales charges (loads) on purchase payments or redemption proceeds, as applicable and (2) ongoing costs, which generally include management fees, distribution and/or service (12b-1) fees and other Fund expenses. This Example is intended to help you understand your ongoing costs (in dollars) of investing in a fund and to compare these costs with the ongoing costs of investing in other mutual funds.
| The Example is based on an investment of $1,000 invested at the beginning of the period and held for the entire period (August 1, 2022 to January 31, 2023). |
Actual Expenses
The first line of the accompanying table provides information about actual account values and actual expenses. You may use the information in this line, together with the amount you invested, to estimate the expenses that you paid over the period. Simply divide your account value by $1,000.00 (for example, an $8,600 account value divided by $1,000.00 = 8.6), then multiply the result by the number in the first line for a class/Fund under the heading entitled "Expenses Paid During Period" to estimate the expenses you paid on your account during this period. If any fund is a shareholder of any underlying mutual funds or exchange-traded funds (ETFs) (the Underlying Funds), such fund indirectly bears its proportional share of the expenses of the Underlying Funds in addition to the direct expenses incurred presented in the table. These fees and expenses are not included in the annualized expense ratio used to calculate the expense estimate in the table below.
Hypothetical Example for Comparison Purposes
The second line of the accompanying table provides information about hypothetical account values and hypothetical expenses based on the actual expense ratio and an assumed rate of return of 5% per year before expenses, which is not the actual return. The hypothetical account values and expenses may not be used to estimate the actual ending account balance or expenses you paid for the period. You may use this information to compare the ongoing costs of investing in the Fund and other funds. To do so, compare this 5% hypothetical example with the 5% hypothetical examples that appear in the shareholder reports of the other funds. If any fund is a shareholder of any Underlying Funds, such fund indirectly bears its proportional share of the expenses of the Underlying Funds in addition to the direct expenses as presented in the table. These fees and expenses are not included in the annualized expense ratio used to calculate the expense estimate in the table below.
Please note that the expenses shown in the table are meant to highlight your ongoing costs only and do not reflect any transaction costs. Therefore, the second line of the table is useful in comparing ongoing costs only, and will not help you determine the relative total costs of owning different funds. In addition, if these transactional costs were included, your costs would have been higher.
| | | | | Annualized Expense Ratio- A | | Beginning Account Value August 1, 2022 | | Ending Account Value January 31, 2023 | | Expenses Paid During Period- C August 1, 2022 to January 31, 2023 |
| | | | | | | | | | |
| Fidelity® SAI U.S. Large Cap Index Fund | | | | .02% | | | | | | |
| Actual | | | | | | $ 1,000 | | $ 995.50 | | $ .10 |
Hypothetical- B | | | | | | $ 1,000 | | $ 1,025.10 | | $ .10 |
| |
A Annualized expense ratio reflects expenses net of applicable fee waivers.
B 5% return per year before expenses
C Expenses are equal to the annualized expense ratio, multiplied by the average account value over the period, multiplied by 184/ 365 (to reflect the one-half year period). The fees and expenses of any Underlying Funds are not included in each annualized expense ratio.
Board Approval of Investment Advisory Contracts and Management Fees
Fidelity SAI U.S. Large Cap Index Fund
Each year, the Board of Trustees, including the Independent Trustees (together, the Board), votes on the renewal of the management contract with Fidelity Management & Research Company LLC (FMR) and the sub-advisory agreement (Sub-Advisory Agreement) for the fund with Geode Capital Management, LLC (Geode) (together, the Advisory Contracts). FMR and Geode are referred to herein as the Investment Advisers. The Board, assisted by the advice of fund counsel and Independent Trustees' counsel, requests and considers a broad range of information relevant to the renewal of the Advisory Contracts throughout the year.
The Board meets regularly and, at each of its meetings, covers an extensive agenda of topics and materials and considers factors that are relevant to its annual consideration of the renewal of the fund's Advisory Contracts, including the services and support provided to the fund and its shareholders. The Board has established four standing committees (Committees) - Operations, Audit, Fair Valuation, and Governance and Nominating - each composed of and chaired by Independent Trustees with varying backgrounds, to which the Board has assigned specific subject matter responsibilities in order to enhance effective decision-making by the Board. The Operations Committee, of which all the Independent Trustees are members, meets regularly throughout the year and requests, receives and considers, among other matters, information related to the annual consideration of the renewal of the fund's Advisory Contracts before making its recommendation to the Board. The Board also meets as needed to review matters specifically related to the Board's annual consideration of the renewal of the Advisory Contracts. Members of the Board may also meet from time to time with trustees of other Fidelity funds through joint ad hoc committees to discuss certain matters relevant to all of the Fidelity funds.
At its September 2022 meeting, the Board unanimously determined to renew the fund's Advisory Contracts. In reaching its determination, the Board considered all factors it believed relevant, including (i) the nature, extent, and quality of the services provided to the fund and its shareholders (including the investment performance of the fund); (ii) the competitiveness relative to peer funds of the fund's management fee and total expense ratio; (iii) the total costs of the services provided by and the profits realized by Fidelity and Geode from their respective relationships with the fund; and (iv) the extent to which, if any, economies of scale exist and are realized as the fund grows, and whether any economies of scale are appropriately shared with fund shareholders.
In considering whether to renew the Advisory Contracts for the fund, the Board reached a determination, with the assistance of fund counsel and Independent Trustees' counsel and through the exercise of its business judgment, that the renewal of the Advisory Contracts was in the best interests of the fund and its shareholders and that the compensation payable under the Advisory Contracts was fair and reasonable. The Board's decision to renew the Advisory Contracts was not based on any single factor, but rather was based on a comprehensive consideration of all the information provided to the Board at its meetings throughout the year. The Board, in reaching its determination to renew the Advisory Contracts, was aware that shareholders of the fund have a broad range of investment choices available to them, including a wide choice among funds offered by Fidelity's competitors, and that the fund's shareholders, who have the opportunity to review and weigh the disclosure provided by the fund in its prospectus and other public disclosures, have chosen to invest in this fund, which is part of the Fidelity family of funds.
Nature, Extent, and Quality of Services Provided . The Board considered staffing as it relates to the fund, including the backgrounds of investment personnel of Fidelity and Geode, and also considered the fund's investment objective, strategies, and related investment philosophy. The Independent Trustees also had discussions with senior management of Fidelity's investment operations and investment groups and with senior management of Geode. The Board considered the structure of the investment personnel compensation programs and whether the structures provide appropriate incentives to act in the best interests of the fund. The Board also considered the steps Fidelity and Geode had taken to ensure the continued provision of high quality services to the Fidelity funds throughout the COVID-19 pandemic, including the expansion of staff in client facing positions to maintain service levels in periods of high volumes and volatility.
The Trustees also discussed with representatives of Fidelity, at meetings throughout the year, Fidelity's role in, among other things, overseeing compliance with federal securities laws and other applicable requirements by Geode with respect to the fund and monitoring and overseeing the performance and investment capabilities of Geode. The Trustees considered that the Board had received from Fidelity periodic reports about its oversight and due diligence processes, as well as periodic reports regarding the performance of Geode.
The Board also considered the nature, extent and quality of services provided by Geode. The Trustees noted that under the Sub-Advisory Agreement, subject to oversight by Fidelity, Geode is responsible for, among other things, identifying investments and arranging for execution of portfolio transactions to implement the fund's investment strategy. In addition, the Trustees noted that Geode is responsible for providing such reporting as may be requested by Fidelity to fulfill its oversight responsibilities discussed above.
Resources Dedicated to Investment Management and Support Services . The Board reviewed the general qualifications and capabilities of Fidelity's and Geode's investment staffs, including their size, education, experience, and resources, as well as Fidelity's and Geode's approach to recruiting, training, managing, and compensating investment personnel. The Board noted the resources devoted to Fidelity's global investment organization and that Fidelity's and Geode's analysts have extensive resources, tools and capabilities that allow them to conduct quantitative and fundamental analysis, as well as credit analysis of issuers, counterparties, and guarantors. Further, the Board considered that Fidelity's and Geode's investment professionals have sufficient access to information and data so as to provide competitive investment results over time, and that those professionals also have access to sophisticated tools that permit them to assess portfolio construction and risk and performance attribution characteristics continuously. Additionally, in its deliberations, the Board considered Fidelity's and Geode's trading, risk management, compliance, cybersecurity, and technology and operations capabilities and resources, which are integral parts of the investment management process.
Shareholder and Administrative Services . The Board considered (i) the nature, extent, quality, and cost of advisory, administrative, and shareholder services performed by the Investment Advisers and their affiliates under the Advisory Contracts and by FMR's affiliates under separate agreements covering transfer agency, pricing and bookkeeping, and securities lending services for the fund; (ii) the nature and extent of the supervision of third party service providers, principally custodians, subcustodians, and pricing vendors; and (iii) the resources devoted to, and the record of compliance with, the fund's compliance policies and procedures. The Board also reviewed the allocation of fund brokerage, including allocations to brokers affiliated with the Investment Advisers.
The Board noted that the growth of fund assets over time across the complex allows Fidelity to reinvest in the development of services designed to enhance the value and convenience of the Fidelity funds as investment vehicles. These services include 24-hour access to account information and market information over the Internet and through telephone representatives, investor education materials and asset allocation tools. The Board also considered that it reviews customer service metrics such as telephone response times, continuity of services on the website and metrics addressing services at Fidelity Investor Centers.
Investment in a Large Fund Family . The Board considered the benefits to shareholders of investing in a Fidelity fund, including the benefits of investing in a fund that is part of a large family of funds offering a variety of investment disciplines and providing a large variety of mutual fund investor services. The Board noted that Fidelity had taken, or had made recommendations to the Board that resulted in the Fidelity funds taking, a number of actions over the previous year that benefited particular funds, including: (i) continuing to dedicate additional resources to Fidelity's investment research process, which includes meetings with management of issuers of securities in which the funds invest; (ii) continuing efforts to enhance Fidelity's global research capabilities; (iii) launching new funds, ETFs, and share classes with innovative structures, strategies and pricing and making other enhancements to meet investor needs; (iv) broadening eligibility requirements for certain funds and share classes; (v) reducing management fees and total expenses for certain funds and classes; (vi) lowering expenses for certain existing funds and classes by implementing or lowering expense caps; (vii) rationalizing product lines and gaining increased efficiencies from fund mergers and liquidations; (viii) continuing to develop, acquire and implement systems and technology to improve services to the funds and shareholders, strengthen information security, and increase efficiency; and (ix) continuing to implement enhancements to further strengthen Fidelity's product line to increase investors' probability of success in achieving their investment goals, including their retirement income goals.
Investment Performance . The Board considered whether the fund has operated in accordance with its investment objective, as well as its record of compliance with its investment restrictions and its performance history.
The Board took into account discussions that occur at Board meetings throughout the year with representatives of the Investment Advisers about fund investment performance. In this regard the Board noted that as part of regularly scheduled fund reviews and other reports to the Board on fund performance, the Board considers annualized return information for the fund for different time periods, measured against the securities market index the fund seeks to track. The Board also periodically considers the fund's tracking error versus its benchmark index.
In addition to reviewing absolute and relative fund performance, the Independent Trustees periodically consider the appropriateness of fund performance metrics in evaluating the results achieved. In general, the Independent Trustees believe that an index fund's performance should be evaluated based on gross performance (before fees and expenses but after transaction costs) compared to the fund's benchmark index, over appropriate time periods, taking into account relevant factors including the following: general market conditions; the characteristics of the fund's benchmark index; the extent to which statistical sampling is employed; any securities lending revenues; and fund cash flows and other factors. The Independent Trustees generally give greater weight to fund performance over longer time periods than over shorter time periods. Depending on the circumstances, the Independent Trustees may be satisfied with a fund's performance notwithstanding that it lags its benchmark index for certain periods.
The Independent Trustees recognize that shareholders evaluate performance on a net basis (after fees and expenses) over their own holding periods, for which one-, three-, and five-year periods are often used as a proxy. For this reason, the performance information reviewed by the Board also included net cumulative calendar year total return information for the fund and its benchmark index for the most recent one-, three-, and five-year periods. No performance peer group information was considered by the Board as Fidelity advised the Board that the peer group, which is created by a third-party provider, includes a number of actively-managed funds. The Independent Trustees recognize that shareholders who are not investing through a tax-advantaged retirement account also consider tax consequences in evaluating performance.
Based on its review, the Board concluded that the nature, extent, and quality of services provided to the fund under the Advisory Contracts should continue to benefit the shareholders of the fund.
Competitiveness of Management Fee and Total Expense Ratio. The Board considered the fund's management fee and total expense ratio compared to selected groups of competitive funds and classes (referred to as "mapped groups" below) for the purpose of facilitating the Trustees' competitive analysis of management fees and total expenses. Fidelity creates "mapped groups" by combining similar investment objective categories (as classified by Lipper) that have comparable investment mandates. Combining funds with similar investment objective categories aids the Board's comparison of management fees and total expense ratios by broadening the competitive group used for such comparison.
Management Fee . The Board considered two proprietary management fee comparisons for the 12-month periods shown in basis points (BP) in the chart below. The group of Lipper funds used by the Board for management fee comparisons is referred to below as the "Total Mapped Group." The Total Mapped Group comparison focuses on a fund's standing in terms of gross management fees before expense reimbursements or caps relative to the total universe of funds with comparable investment mandates, regardless of whether their management fee structures also are comparable. Funds with comparable investment mandates offer exposure to similar types of securities. Funds with comparable management fee structures have similar management fee contractual arrangements (e.g., flat rate charged for advisory services, all-inclusive fee rate, etc.). "TMG %" represents the percentage of funds in the Total Mapped Group that had management fees that were lower than the fund's. For example, a hypothetical TMG % of 20% would mean that 80% of the funds in the Total Mapped Group had higher, and 20% had lower, management fees than the fund. The fund's actual TMG %s and the number of funds in the Total Mapped Group are in the chart below. The "Asset-Sized Peer Group" (ASPG) comparison focuses on a fund's standing relative to a subset of non-Fidelity funds within the Total Mapped Group that are similar in size and management fee structure. For example, if a fund is in the first quartile of the ASPG, the fund's management fee ranks in the least expensive or lowest 25% of funds in the ASPG. The ASPG represents at least 15% of the funds in the Total Mapped Group with comparable asset size and management fee structures, subject to a minimum of 50 funds (or all funds in the Total Mapped Group if fewer than 50). Additional information, such as the ASPG quartile in which the fund's management fee rate ranked, is also included in the chart and was considered by the Board.
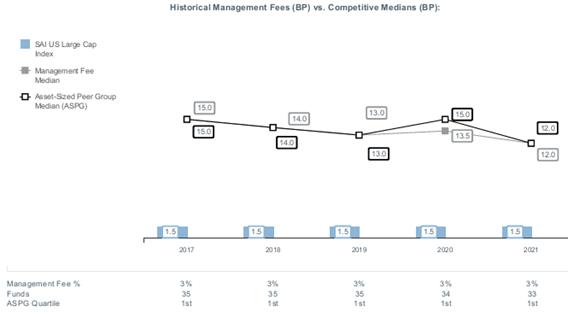
The Board noted that the fund's management fee rate ranked below the median of its Total Mapped Group and below the median of its ASPG for 2021.
At its September 2022 meeting, the Board also approved an amendment to the fund's sub-advisory agreement with Geode (effective October 1, 2022) that reduced the sub-advisory fee rate that FMR pays to Geode.
Based on its review, the Board concluded that the fund's management fee is fair and reasonable in light of the services that the fund receives and the other factors considered.
Total Expense Ratio . In its review of the fund's total expense ratio, the Board considered the fund's management fee rate as well as other fund expenses, such as custodial, legal, and audit fees. The Board also noted that Fidelity may agree to waive fees or reimburse expenses from time to time, and the extent to which, if any, it has done so for the fund. The fund is compared to those funds and classes in the Total Mapped Group (used by the Board for management fee comparisons) that have a similar sales load structure. The Board also considered a total expense ASPG comparison, which focuses on the total expenses of the fund relative to a subset of non-Fidelity funds within the similar sales load structure group that are similar in size and management fee structure. The total expense ASPG is limited to 15 larger and 15 smaller classes of different funds, where possible. The total expense ASPG comparison excludes performance adjustments and fund-paid 12b-1 fees to eliminate variability in expenses relating to these items.
The Board noted that the fund's total net expense ratio ranked below the similar sales load structure group competitive median and below the ASPG competitive median for 2021.
The Board further considered that FMR has contractually agreed to reimburse the fund to the extent that total operating expenses, with certain exceptions, as a percentage of its average net assets, exceed 0.015% through November 30, 2023.
Fees Charged to Other Clients . The Board also considered fee structures and other information with respect to clients of Fidelity and Geode, such as other funds advised or subadvised by Fidelity or Geode, pension plan clients, and other institutional clients with similar mandates. The Board noted that a joint ad hoc committee created by it and the boards of other Fidelity funds periodically reviews and compares Fidelity's institutional investment advisory business with its business of providing services to the Fidelity funds and also noted the most recent findings of the committee. The Board noted that the committee's review included a consideration of the differences in services provided, fees charged, and costs incurred, as well as competition in the markets serving the different categories of clients.
Based on its review of total expense ratios and fees charged to other Fidelity clients, the Board concluded that the fund's total expense ratio was reasonable in light of the services that the fund and its shareholders receive and the other factors considered.
Costs of the Services and Profitability . The Board considered the revenues earned and the expenses incurred by Fidelity in conducting the business of developing, marketing, distributing, managing, administering and servicing the fund and servicing the fund's shareholders. The Board also considered the level of Fidelity's profits in respect of all the Fidelity funds.
On an annual basis, Fidelity presents to the Board information about the profitability of its relationships with the fund. Fidelity calculates profitability information for each fund, as well as aggregate profitability information for groups of Fidelity funds and all Fidelity funds, using a series of detailed revenue and cost allocation methodologies which originate with the books and records of Fidelity on which Fidelity's audited financial statements are based. The Audit Committee of the Board reviews any significant changes from the prior year's methodologies and the full Board approves such changes.
A public accounting firm has been engaged annually by the Board as part of the Board's assessment of Fidelity's profitability analysis. The engagement includes the review and assessment of the methodologies used by Fidelity in determining the revenues and expenses attributable to Fidelity's mutual fund business, and completion of agreed-upon procedures in respect of the mathematical accuracy of certain fund profitability information and its conformity to established allocation methodologies. After considering the reports issued under the engagement and information provided by Fidelity, the Board concluded that while other allocation methods may also be reasonable, Fidelity's profitability methodologies are reasonable in all material respects.
The Board also reviewed Fidelity's and Geode's non-fund businesses and potential indirect benefits such businesses may have received as a result of their association with Fidelity's mutual fund business (i.e., fall-out benefits) as well as cases where Fidelity's and Geode's affiliates may benefit from the funds' business. The Board considered areas where potential indirect benefits to the Fidelity funds from their relationships with Fidelity may exist. The Board's consideration of these matters was informed by the findings of a joint ad hoc committee created by it and the boards of other Fidelity funds to evaluate potential fall-out benefits.
The Board considered the costs of the services provided by and the profits realized by Fidelity in connection with the operation of the fund and was satisfied that the profitability was not excessive.
The Board also considered information regarding the profitability of Geode's relationship with the fund.
Economies of Scale . The Board considered whether there have been economies of scale in respect of the management of the Fidelity funds, whether the Fidelity funds (including the fund) have appropriately benefited from any such economies of scale, and whether there is potential for realization of any further economies of scale. The Board considered the extent to which the fund will benefit from economies of scale as assets grow through increased services to the fund, through waivers or reimbursements, or through fee or expense ratio reductions. The Board also noted that a committee (the Economies of Scale Committee) created by it and the boards of other Fidelity funds periodically analyzes whether Fidelity attains economies of scale in respect of the management and servicing of the Fidelity funds, whether the Fidelity funds have appropriately benefited from such economies of scale, and whether there is potential for realization of any further economies of scale.
The Board concluded, taking into account the analysis of the Economies of Scale Committee, that economies of scale, if any, are being appropriately shared between fund shareholders and Fidelity.
Additional Information Requested by the Board . In order to develop fully the factual basis for consideration of the Fidelity funds' advisory contracts, the Board requested and received additional information on certain topics, including: (i) Fidelity's fund profitability methodology, profitability trends for certain funds, the allocation of various costs to different funds, and the impact of certain factors on fund profitability results; (ii) portfolio manager changes that have occurred during the past year and the amount of the investment that each portfolio manager has made in the Fidelity fund(s) that he or she manages; (iii) the extent to which current market conditions have affected retention and recruitment of personnel; (iv) the arrangements with and compensation paid to certain fund sub-advisers on behalf of the Fidelity funds and the treatment of such compensation within Fidelity's fund profitability methodology; (v) the terms of the funds' various management fee structures, including the basic group fee and the terms of Fidelity's voluntary expense limitation arrangements; (vi) Fidelity's transfer agent, pricing and bookkeeping fees, expense and service structures for different funds and classes relative to competitive trends; (vii) the impact on fund profitability of recent industry trends, such as the growth in passively managed funds and the changes in flows for different types of funds; (viii) the types of management fee and total expense comparisons provided, and the challenges and limitations associated with such information; and (ix) explanations regarding the relative total expense ratios and management fees of certain funds and classes, total expense and management fee competitive trends, and methodologies for total expense and management fee competitive comparisons. In addition, the Board considered its discussions with Fidelity regarding Fidelity's efforts to maintain the continuous investment and shareholder services necessary for the funds during the current pandemic and economic circumstances.
Based on its evaluation of all of the conclusions noted above, and after considering all factors it believed relevant, the Board concluded that the advisory and sub-advisory fee arrangements are fair and reasonable and that the fund's Advisory Contracts should be renewed.
The Securities and Exchange Commission adopted Rule 22e-4 under the Investment Company Act of 1940 (the Liquidity Rule) to promote effective liquidity risk management throughout the open-end investment company industry, thereby reducing the risk that funds will be unable to meet their redemption obligations and mitigating dilution of the interests of fund shareholders.
The Fund has adopted and implemented a liquidity risk management program (the Program) reasonably designed to assess and manage the Fund's liquidity risk and to comply with the requirements of the Liquidity Rule. The Fund's Board of Trustees (the Board) has designated the Fund's investment adviser as administrator of the Program. The Fidelity advisers have established a Liquidity Risk Management Committee (the LRM Committee) to manage the Program for each of the Fidelity Funds. The LRM Committee monitors the adequacy and effectiveness of implementation of the Program and on a periodic basis assesses each Fund's liquidity risk based on a variety of factors including (1) the Fund's investment strategy, (2) portfolio liquidity and cash flow projections during normal and reasonably foreseeable stressed conditions, (3) shareholder redemptions, (4) borrowings and other funding sources and (5) certain factors specific to ETFs including the effect of the Fund's prices and spreads, market participants, and basket compositions on the overall liquidity of the Fund's portfolio, as applicable.
In accordance with the Program, each of the Fund's portfolio investments is classified into one of four defined liquidity categories based on a determination of a reasonable expectation for how long it would take to convert the investment to cash (or sell or dispose of the investment) without significantly changing its market value.
- Highly liquid investments - cash or convertible to cash within three business days or less
- Moderately liquid investments - convertible to cash in three to seven calendar days
- Less liquid investments - can be sold or disposed of, but not settled, within seven calendar days
- Illiquid investments - cannot be sold or disposed of within seven calendar days
Liquidity classification determinations take into account a variety of factors including various market, trading and investment-specific considerations, as well as market depth, and generally utilize analysis from a third-party liquidity metrics service.
The Liquidity Rule places a 15% limit on a fund's illiquid investments and requires funds that do not primarily hold assets that are highly liquid investments to determine and maintain a minimum percentage of the fund's net assets to be invested in highly liquid investments (highly liquid investment minimum or HLIM). The Program includes provisions reasonably designed to comply with the 15% limit on illiquid investments and for determining, periodically reviewing and complying with the HLIM requirement as applicable.
At a recent meeting of the Fund's Board of Trustees, the LRM Committee provided a written report to the Board pertaining to the operation, adequacy, and effectiveness of the Program for the period December 1, 2021 through November 30, 2022. The report concluded that the Program is operating effectively and is reasonably designed to assess and manage the Fund's liquidity risk.
1.9870994.106
SV9-SANN-0423
Fidelity® SAI U.S. Value Index Fund
Semi-Annual Report
January 31, 2023
Offered exclusively to certain clients of the Adviser, or its affiliates, including Strategic Advisers LLC (Strategic Advisers) - not available for sale to the general public. Fidelity ® SAI is a product name of Fidelity ® funds dedicated to certain programs affiliated with Strategic Advisers.
Contents
To view a fund's proxy voting guidelines and proxy voting record for the 12-month period ended June 30, visit http://www.fidelity.com/proxyvotingresults or visit the Securities and Exchange Commission's (SEC) web site at http://www.sec.gov.
You may also call 1-800-544-3455 to request a free copy of the proxy voting guidelines.
The funds or securities referred to herein are not sponsored, endorsed, or promoted by Fidelity Product Services LLC (FPS), and FPS bears no liability with respect to any such funds or securities or any index on which such funds or securities are based. The prospectus contains a more detailed description of the relationship between FPS and any related funds.
Standard & Poor's, S&P and S&P 500 are registered service marks of The McGraw-Hill Companies, Inc. and have been licensed for use by Fidelity Distributors Corporation.
Other third-party marks appearing herein are the property of their respective owners.
All other marks appearing herein are registered or unregistered trademarks or service marks of FMR LLC or an affiliated company. © 2023 FMR LLC. All rights reserved.
This report and the financial statements contained herein are submitted for the general information of the shareholders of the Fund. This report is not authorized for distribution to prospective investors in the Fund unless preceded or accompanied by an effective prospectus.
A fund files its complete schedule of portfolio holdings with the SEC for the first and third quarters of each fiscal year on Form N-PORT. Forms N-PORT are available on the SEC's web site at http://www.sec.gov. A fund's Forms N-PORT may be reviewed and copied at the SEC's Public Reference Room in Washington, DC. Information regarding the operation of the SEC's Public Reference Room may be obtained by calling 1-800-SEC-0330.
For a complete list of a fund's portfolio holdings, view the most recent holdings listing, semiannual report, or annual report on Fidelity's web site at http://www.fidelity.com, http://www.institutional.fidelity.com, or http://www.401k.com, as applicable.
NOT FDIC INSURED •MAY LOSE VALUE •NO BANK GUARANTEE
Neither the Fund nor Fidelity Distributors Corporation is a bank.
Top Holdings (% of Fund's net assets) |
| |
| Meta Platforms, Inc. Class A | 4.1 | |
| Exxon Mobil Corp. | 4.1 | |
| Bank of America Corp. | 3.5 | |
| Wells Fargo & Co. | 3.2 | |
| Verizon Communications, Inc. | 3.1 | |
| Pfizer, Inc. | 3.1 | |
| Comcast Corp. Class A | 3.1 | |
| Bristol-Myers Squibb Co. | 2.8 | |
| ConocoPhillips Co. | 2.7 | |
| AT&T, Inc. | 2.6 | |
| | 32.3 | |
| |
| Market Sectors (% of Fund's net assets) |
| |
| Financials | 22.3 | |
| Communication Services | 15.6 | |
| Information Technology | 15.3 | |
| Energy | 15.1 | |
| Health Care | 14.2 | |
| Consumer Discretionary | 5.3 | |
| Materials | 5.2 | |
| Industrials | 3.2 | |
| Consumer Staples | 2.9 | |
| Utilities | 0.4 | |
| Real Estate | 0.3 | |
| |
Asset Allocation (% of Fund's net assets) |
|
Foreign investments - 1.6% |
Percentages shown as 0.0% may reflect amounts less than 0.05%. |
|
Showing Percentage of Net Assets
| Common Stocks - 99.8% |
| | | Shares | Value ($) |
| COMMUNICATION SERVICES - 15.6% | | | |
| Diversified Telecommunication Services - 6.0% | | | |
| AT&T, Inc. | | 1,900,558 | 38,714,366 |
| Liberty Global PLC Class A (a) | | 116,346 | 2,523,545 |
| Lumen Technologies, Inc. (b) | | 253,857 | 1,332,749 |
| Verizon Communications, Inc. | | 1,119,958 | 46,556,654 |
| | | | 89,127,314 |
| Entertainment - 0.6% | | | |
| Warner Bros Discovery, Inc. (a) | | 589,301 | 8,733,441 |
| Interactive Media & Services - 4.2% | | | |
| Meta Platforms, Inc. Class A (a) | | 409,705 | 61,033,752 |
| Ziff Davis, Inc. (a) | | 12,583 | 1,125,927 |
| | | | 62,159,679 |
| Media - 4.8% | | | |
| Charter Communications, Inc. Class A (a) | | 28,644 | 11,008,176 |
| Comcast Corp. Class A | | 1,150,413 | 45,268,752 |
| DISH Network Corp. Class A (a) | | 67,039 | 964,691 |
| Fox Corp. Class A | | 115,463 | 3,918,814 |
| News Corp. Class A | | 133,839 | 2,711,578 |
| Nexstar Broadcasting Group, Inc. Class A | | 10,058 | 2,059,577 |
| Paramount Global Class B (b) | | 137,469 | 3,183,782 |
| TEGNA, Inc. | | 59,504 | 1,185,915 |
| | | | 70,301,285 |
TOTAL COMMUNICATION SERVICES | | | 230,321,719 |
| CONSUMER DISCRETIONARY - 5.3% | | | |
| Auto Components - 0.2% | | | |
| BorgWarner, Inc. | | 62,485 | 2,954,291 |
| Automobiles - 2.2% | | | |
| Ford Motor Co. | | 1,053,212 | 14,228,894 |
| General Motors Co. | | 378,837 | 14,895,871 |
| Harley-Davidson, Inc. | | 35,468 | 1,632,592 |
| Thor Industries, Inc. (b) | | 14,335 | 1,366,556 |
| | | | 32,123,913 |
| Hotels, Restaurants & Leisure - 0.4% | | | |
| Expedia, Inc. (a) | | 40,150 | 4,589,145 |
| Penn Entertainment, Inc. (a) | | 41,363 | 1,466,318 |
| | | | 6,055,463 |
| Household Durables - 1.7% | | | |
| D.R. Horton, Inc. | | 83,479 | 8,238,543 |
| Lennar Corp. Class A | | 71,175 | 7,288,320 |
| Mohawk Industries, Inc. (a) | | 14,064 | 1,688,524 |
| PulteGroup, Inc. | | 60,658 | 3,450,834 |
| Toll Brothers, Inc. | | 28,109 | 1,672,204 |
| Whirlpool Corp. | | 14,531 | 2,260,878 |
| | | | 24,599,303 |
| Leisure Products - 0.1% | | | |
| Brunswick Corp. | | 19,337 | 1,630,689 |
| Multiline Retail - 0.1% | | | |
| Macy's, Inc. | | 72,270 | 1,707,740 |
| Specialty Retail - 0.5% | | | |
| Academy Sports & Outdoors, Inc. | | 21,266 | 1,242,360 |
| Asbury Automotive Group, Inc. (a) | | 5,903 | 1,298,660 |
| AutoNation, Inc. (a) | | 9,123 | 1,156,067 |
| Lithia Motors, Inc. Class A (sub. vtg.) | | 7,291 | 1,918,991 |
| Williams-Sonoma, Inc. | | 17,791 | 2,400,718 |
| | | | 8,016,796 |
| Textiles, Apparel & Luxury Goods - 0.1% | | | |
| PVH Corp. | | 17,392 | 1,563,541 |
TOTAL CONSUMER DISCRETIONARY | | | 78,651,736 |
| CONSUMER STAPLES - 2.9% | | | |
| Beverages - 0.2% | | | |
| Molson Coors Beverage Co. Class B | | 50,137 | 2,636,203 |
| Food & Staples Retailing - 1.0% | | | |
| Kroger Co. | | 173,708 | 7,752,588 |
| Walgreens Boots Alliance, Inc. | | 191,411 | 7,055,409 |
| | | | 14,807,997 |
| Food Products - 1.7% | | | |
| Archer Daniels Midland Co. | | 146,493 | 12,136,945 |
| The Kraft Heinz Co. | | 212,326 | 8,605,573 |
| Tyson Foods, Inc. Class A | | 77,232 | 5,078,004 |
| | | | 25,820,522 |
TOTAL CONSUMER STAPLES | | | 43,264,722 |
| ENERGY - 15.1% | | | |
| Oil, Gas & Consumable Fuels - 15.1% | | | |
| Antero Resources Corp. (a) | | 73,628 | 2,123,432 |
| APA Corp. | | 85,837 | 3,805,154 |
| Chesapeake Energy Corp. | | 28,575 | 2,478,024 |
| Chord Energy Corp. | | 11,091 | 1,589,673 |
| ConocoPhillips Co. | | 332,273 | 40,494,111 |
| Coterra Energy, Inc. | | 210,232 | 5,262,107 |
| Devon Energy Corp. | | 102,317 | 6,470,527 |
| Diamondback Energy, Inc. | | 46,925 | 6,856,681 |
| EQT Corp. | | 97,874 | 3,197,544 |
| Exxon Mobil Corp. | | 517,906 | 60,082,275 |
| HF Sinclair Corp. | | 35,857 | 2,040,263 |
| Magnolia Oil & Gas Corp. Class A | | 44,622 | 1,053,525 |
| Marathon Oil Corp. | | 169,320 | 4,651,220 |
| Marathon Petroleum Corp. | | 124,968 | 16,060,887 |
| Matador Resources Co. (b) | | 29,924 | 1,979,772 |
| Murphy Oil Corp. | | 38,951 | 1,698,653 |
| Occidental Petroleum Corp. | | 193,898 | 12,562,651 |
| Ovintiv, Inc. | | 66,195 | 3,258,780 |
| PBF Energy, Inc. Class A | | 30,478 | 1,279,771 |
| PDC Energy, Inc. | | 24,566 | 1,663,855 |
| Phillips 66 Co. | | 126,025 | 12,636,527 |
| Pioneer Natural Resources Co. | | 52,897 | 12,184,824 |
| Range Resources Corp. | | 64,426 | 1,611,939 |
| SM Energy Co. | | 32,735 | 1,075,999 |
| Southwestern Energy Co. (a) | | 294,675 | 1,626,606 |
| Valero Energy Corp. | | 102,803 | 14,395,504 |
| Vitesse Energy, Inc. (a)(b) | | 6,239 | 99,574 |
| | | | 222,239,878 |
| FINANCIALS - 22.3% | | | |
| Banks - 13.4% | | | |
| Bank of America Corp. | | 1,474,818 | 52,326,543 |
| Bank OZK | | 29,515 | 1,347,950 |
| Citigroup, Inc. | | 516,502 | 26,971,734 |
| Citizens Financial Group, Inc. | | 131,327 | 5,689,086 |
| Comerica, Inc. | | 34,919 | 2,559,912 |
| East West Bancorp, Inc. | | 37,583 | 2,951,017 |
| FNB Corp., Pennsylvania | | 93,523 | 1,334,573 |
| Hancock Whitney Corp. | | 22,849 | 1,176,267 |
| Huntington Bancshares, Inc. | | 363,305 | 5,511,337 |
| KeyCorp | | 248,785 | 4,774,184 |
| M&T Bank Corp. | | 46,030 | 7,180,680 |
| Popular, Inc. | | 19,385 | 1,330,586 |
| Regions Financial Corp. | | 229,544 | 5,403,466 |
| Signature Bank | | 16,781 | 2,163,910 |
| SVB Financial Group (a) | | 15,761 | 4,766,757 |
| Synovus Financial Corp. | | 38,788 | 1,627,157 |
| Truist Financial Corp. | | 353,806 | 17,474,478 |
| Valley National Bancorp | | 112,062 | 1,331,297 |
| Webster Financial Corp. | | 46,399 | 2,442,907 |
| Wells Fargo & Co. | | 1,016,136 | 47,626,294 |
| Western Alliance Bancorp. | | 29,043 | 2,188,971 |
| | | | 198,179,106 |
| Capital Markets - 4.1% | | | |
| Bank of New York Mellon Corp. | | 193,311 | 9,775,737 |
| Carlyle Group LP | | 58,172 | 2,092,447 |
| Goldman Sachs Group, Inc. | | 90,302 | 33,033,375 |
| Invesco Ltd. | | 121,270 | 2,244,708 |
| Jefferies Financial Group, Inc. | | 48,885 | 1,920,203 |
| State Street Corp. | | 97,847 | 8,936,367 |
| Stifel Financial Corp. | | 28,335 | 1,910,062 |
| | | | 59,912,899 |
| Consumer Finance - 2.0% | | | |
| Ally Financial, Inc. | | 79,657 | 2,588,056 |
| Capital One Financial Corp. | | 101,793 | 12,113,367 |
| Discover Financial Services | | 72,864 | 8,505,415 |
| OneMain Holdings, Inc. | | 32,508 | 1,402,395 |
| SLM Corp. | | 66,730 | 1,172,446 |
| Synchrony Financial | | 120,158 | 4,413,403 |
| | | | 30,195,082 |
| Diversified Financial Services - 0.2% | | | |
| Equitable Holdings, Inc. | | 91,828 | 2,944,924 |
| Insurance - 1.8% | | | |
| American International Group, Inc. | | 198,123 | 12,525,336 |
| Brighthouse Financial, Inc. (a) | | 18,431 | 1,037,112 |
| Fidelity National Financial, Inc. | | 72,636 | 3,198,163 |
| Old Republic International Corp. | | 75,528 | 1,993,184 |
| Principal Financial Group, Inc. | | 60,676 | 5,615,564 |
| Unum Group | | 49,866 | 2,095,868 |
| | | | 26,465,227 |
| Mortgage Real Estate Investment Trusts - 0.5% | | | |
| Annaly Capital Management, Inc. | | 124,780 | 2,928,587 |
| Blackstone Mortgage Trust, Inc. | | 45,568 | 1,086,341 |
| Rithm Capital Corp. | | 126,342 | 1,188,878 |
| Starwood Property Trust, Inc. | | 82,543 | 1,724,323 |
| | | | 6,928,129 |
| Thrifts & Mortgage Finance - 0.3% | | | |
| Essent Group Ltd. | | 28,729 | 1,264,938 |
| MGIC Investment Corp. | | 79,024 | 1,115,819 |
| New York Community Bancorp, Inc. | | 181,432 | 1,812,506 |
| | | | 4,193,263 |
TOTAL FINANCIALS | | | 328,818,630 |
| HEALTH CARE - 14.2% | | | |
| Biotechnology - 2.4% | | | |
| Gilead Sciences, Inc. | | 247,599 | 20,783,460 |
| Moderna, Inc. (a) | | 88,107 | 15,512,118 |
| | | | 36,295,578 |
| Health Care Equipment & Supplies - 0.1% | | | |
| QuidelOrtho Corp. (a) | | 14,256 | 1,220,456 |
| Health Care Providers & Services - 5.0% | | | |
| Centene Corp. (a) | | 151,005 | 11,512,621 |
| Cigna Corp. | | 81,532 | 25,818,738 |
| CVS Health Corp. | | 350,395 | 30,911,847 |
| Laboratory Corp. of America Holdings | | 23,627 | 5,956,839 |
| | | | 74,200,045 |
| Life Sciences Tools & Services - 0.1% | | | |
| Syneos Health, Inc. (a) | | 27,440 | 985,645 |
| Pharmaceuticals - 6.6% | | | |
| Bristol-Myers Squibb Co. | | 566,981 | 41,191,170 |
| Elanco Animal Health, Inc. (a) | | 118,862 | 1,631,975 |
| Jazz Pharmaceuticals PLC (a) | | 16,790 | 2,630,321 |
| Organon & Co. | | 67,829 | 2,043,688 |
| Pfizer, Inc. | | 1,037,163 | 45,801,118 |
| Viatris, Inc. | | 323,388 | 3,932,398 |
| | | | 97,230,670 |
TOTAL HEALTH CARE | | | 209,932,394 |
| INDUSTRIALS - 3.2% | | | |
| Air Freight & Logistics - 0.8% | | | |
| FedEx Corp. | | 63,843 | 12,376,604 |
| Airlines - 0.8% | | | |
| Alaska Air Group, Inc. (a) | | 33,822 | 1,736,421 |
| Southwest Airlines Co. | | 158,334 | 5,663,607 |
| United Airlines Holdings, Inc. (a) | | 87,184 | 4,268,529 |
| | | | 11,668,557 |
| Building Products - 0.5% | | | |
| Builders FirstSource, Inc. (a) | | 39,252 | 3,128,384 |
| Owens Corning | | 24,926 | 2,409,098 |
| UFP Industries, Inc. | | 16,441 | 1,538,056 |
| | | | 7,075,538 |
| Electrical Equipment - 0.3% | | | |
| Atkore, Inc. (a) | | 11,019 | 1,435,225 |
| Regal Rexnord Corp. | | 17,640 | 2,455,488 |
| | | | 3,890,713 |
| Machinery - 0.1% | | | |
| Allison Transmission Holdings, Inc. | | 24,663 | 1,111,808 |
| Professional Services - 0.1% | | | |
| Manpower, Inc. | | 13,480 | 1,174,917 |
| Road & Rail - 0.3% | | | |
| Knight-Swift Transportation Holdings, Inc. Class A | | 42,865 | 2,533,322 |
| Ryder System, Inc. | | 13,350 | 1,260,374 |
| XPO, Inc. (a) | | 30,722 | 1,224,579 |
| | | | 5,018,275 |
| Trading Companies & Distributors - 0.3% | | | |
| AerCap Holdings NV (a) | | 33,439 | 2,113,679 |
| Triton International Ltd. | | 15,686 | 1,108,059 |
| Univar Solutions, Inc. (a) | | 43,515 | 1,500,397 |
| | | | 4,722,135 |
TOTAL INDUSTRIALS | | | 47,038,547 |
| INFORMATION TECHNOLOGY - 15.3% | | | |
| Electronic Equipment & Components - 1.3% | | | |
| Arrow Electronics, Inc. (a) | | 16,403 | 1,927,188 |
| Avnet, Inc. | | 24,408 | 1,119,839 |
| Coherent Corp. (a) | | 36,984 | 1,605,106 |
| Corning, Inc. | | 202,990 | 7,025,484 |
| Flex Ltd. (a) | | 120,746 | 2,819,419 |
| Jabil, Inc. | | 35,904 | 2,823,132 |
| TD SYNNEX Corp. | | 11,210 | 1,145,102 |
| | | | 18,465,270 |
| IT Services - 3.6% | | | |
| Cognizant Technology Solutions Corp. Class A | | 137,046 | 9,147,821 |
| DXC Technology Co. (a) | | 61,353 | 1,762,672 |
| Fidelity National Information Services, Inc. | | 158,238 | 11,874,180 |
| Fiserv, Inc. (a) | | 168,033 | 17,925,760 |
| Global Payments, Inc. | | 72,108 | 8,128,014 |
| SS&C Technologies Holdings, Inc. | | 58,504 | 3,530,716 |
| The Western Union Co. | | 102,990 | 1,459,368 |
| | | | 53,828,531 |
| Semiconductors & Semiconductor Equipment - 5.0% | | | |
| Intel Corp. | | 1,100,531 | 31,101,006 |
| Micron Technology, Inc. | | 289,987 | 17,486,216 |
| MKS Instruments, Inc. | | 15,250 | 1,560,380 |
| Qorvo, Inc. (a) | | 27,031 | 2,937,188 |
| Qualcomm, Inc. | | 104,485 | 13,918,447 |
| Skyworks Solutions, Inc. | | 42,779 | 4,691,573 |
| Synaptics, Inc. (a) | | 10,629 | 1,328,944 |
| | | | 73,023,754 |
| Software - 1.7% | | | |
| Microsoft Corp. | | 103,831 | 25,730,360 |
| Technology Hardware, Storage & Peripherals - 3.7% | | | |
| Apple, Inc. | | 243,038 | 35,067,953 |
| Dell Technologies, Inc. | | 69,100 | 2,806,842 |
| Hewlett Packard Enterprise Co. | | 343,111 | 5,534,380 |
| HP, Inc. | | 236,055 | 6,878,643 |
| Western Digital Corp. (a) | | 84,706 | 3,722,829 |
| | | | 54,010,647 |
TOTAL INFORMATION TECHNOLOGY | | | 225,058,562 |
| MATERIALS - 5.2% | | | |
| Chemicals - 2.5% | | | |
| Celanese Corp. Class A | | 26,604 | 3,277,613 |
| CF Industries Holdings, Inc. | | 52,262 | 4,426,591 |
| Dow, Inc. | | 187,682 | 11,138,927 |
| Eastman Chemical Co. | | 32,003 | 2,821,705 |
| Huntsman Corp. | | 48,166 | 1,526,381 |
| LyondellBasell Industries NV Class A | | 67,736 | 6,549,394 |
| Olin Corp. | | 33,973 | 2,194,316 |
| The Chemours Co. LLC | | 40,252 | 1,464,770 |
| The Mosaic Co. | | 90,761 | 4,496,300 |
| | | | 37,895,997 |
| Containers & Packaging - 0.6% | | | |
| Berry Global Group, Inc. | | 33,361 | 2,059,375 |
| International Paper Co. | | 94,850 | 3,966,627 |
| WestRock Co. | | 67,818 | 2,661,178 |
| | | | 8,687,180 |
| Metals & Mining - 2.0% | | | |
| Alcoa Corp. | | 47,111 | 2,461,079 |
| Cleveland-Cliffs, Inc. (a) | | 137,438 | 2,934,301 |
| Commercial Metals Co. | | 31,316 | 1,699,519 |
| Nucor Corp. | | 68,420 | 11,564,348 |
| Reliance Steel & Aluminum Co. | | 15,657 | 3,561,185 |
| Steel Dynamics, Inc. | | 44,491 | 5,367,394 |
| United States Steel Corp. | | 62,360 | 1,776,636 |
| | | | 29,364,462 |
| Paper & Forest Products - 0.1% | | | |
| Louisiana-Pacific Corp. | | 19,125 | 1,302,221 |
TOTAL MATERIALS | | | 77,249,860 |
| REAL ESTATE - 0.3% | | | |
| Equity Real Estate Investment Trusts (REITs) - 0.1% | | | |
| Medical Properties Trust, Inc. (b) | | 159,478 | 2,065,240 |
| Real Estate Management & Development - 0.2% | | | |
| Jones Lang LaSalle, Inc. (a) | | 12,658 | 2,340,084 |
TOTAL REAL ESTATE | | | 4,405,324 |
| UTILITIES - 0.4% | | | |
| Electric Utilities - 0.1% | | | |
| NRG Energy, Inc. | | 61,441 | 2,102,511 |
| Gas Utilities - 0.2% | | | |
| ONE Gas, Inc. | | 14,438 | 1,189,114 |
| UGI Corp. | | 55,838 | 2,224,028 |
| | | | 3,413,142 |
| Independent Power and Renewable Electricity Producers - 0.1% | | | |
| Clearway Energy, Inc. Class C | | 30,604 | 1,034,109 |
TOTAL UTILITIES | | | 6,549,762 |
| TOTAL COMMON STOCKS (Cost $1,225,749,613) | | | 1,473,531,134 |
| | | | |
| U.S. Treasury Obligations - 0.0% |
| | | Principal Amount (c) | Value ($) |
U.S. Treasury Bills, yield at date of purchase 4.65% 6/29/23 (d) (Cost $294,373) | | 300,000 | 294,368 |
| | | | |
| Money Market Funds - 0.7% |
| | | Shares | Value ($) |
Fidelity Securities Lending Cash Central Fund 4.38% (e)(f) (Cost $9,766,921) | | 9,765,945 | 9,766,921 |
| | | | |
| TOTAL INVESTMENT IN SECURITIES - 100.5% (Cost $1,235,810,907) | 1,483,592,423 |
NET OTHER ASSETS (LIABILITIES) - (0.5)% | (7,865,587) |
| NET ASSETS - 100.0% | 1,475,726,836 |
| | |
| Futures Contracts |
| | Number of contracts | Expiration Date | Notional Amount ($) | Value ($) | Unrealized Appreciation/ (Depreciation) ($) |
| Purchased | | | | | |
| | | | | | |
| Equity Index Contracts | | | | | |
| CME E-mini S&P 500 Index Contracts (United States) | 11 | Mar 2023 | 2,249,500 | 103,774 | 103,774 |
| | | | | | |
| The notional amount of futures purchased as a percentage of Net Assets is 0.2% |
Legend
| (b) | Security or a portion of the security is on loan at period end. |
| (c) | Amount is stated in United States dollars unless otherwise noted. |
| (d) | Security or a portion of the security was pledged to cover margin requirements for futures contracts. At period end, the value of securities pledged amounted to $133,447. |
| (e) | Affiliated fund that is generally available only to investment companies and other accounts managed by Fidelity Investments. The rate quoted is the annualized seven-day yield of the fund at period end. A complete unaudited listing of the fund's holdings as of its most recent quarter end is available upon request. In addition, each Fidelity Central Fund's financial statements are available on the SEC's website or upon request. |
| (f) | Investment made with cash collateral received from securities on loan. |
Affiliated Central Funds
Fiscal year to date information regarding the Fund's investments in Fidelity Central Funds, including the ownership percentage, is presented below.
| Affiliate | Value, beginning of period ($) | Purchases ($) | Sales Proceeds ($) | Dividend Income ($) | Realized Gain (loss) ($) | Change in Unrealized appreciation (depreciation) ($) | Value, end of period ($) | % ownership, end of period |
| Fidelity Cash Central Fund 4.38% | 3,169,874 | 147,178,977 | 150,348,851 | 40,098 | - | - | - | 0.0% |
| Fidelity Securities Lending Cash Central Fund 4.38% | 17,391,449 | 86,050,787 | 93,675,315 | 33,967 | - | - | 9,766,921 | 0.0% |
| Total | 20,561,323 | 233,229,764 | 244,024,166 | 74,065 | - | - | 9,766,921 | |
| | | | | | | | | |
Amounts in the dividend income column in the above table include any capital gain distributions from underlying funds, which are presented in the corresponding line item in the Statement of Operations, if applicable.
Amount for Fidelity Securities Lending Cash Central Fund represents the income earned on investing cash collateral, less rebates paid to borrowers and any lending agent fees associated with the loan, plus any premium payments received for lending certain types of securities.
Amounts included in the purchases and sales proceeds columns may include in-kind transactions, if applicable.
Investment Valuation
The following is a summary of the inputs used, as of January 31, 2023, involving the Fund's assets and liabilities carried at fair value. The inputs or methodology used for valuing securities may not be an indication of the risk associated with investing in those securities. For more information on valuation inputs, and their aggregation into the levels used below, please refer to the Investment Valuation section in the accompanying Notes to Financial Statements.
| Valuation Inputs at Reporting Date: |
| Description | Total ($) | Level 1 ($) | Level 2 ($) | Level 3 ($) |
Investments in Securities: | | | | |
|
| Equities: | | | | |
Communication Services | 230,321,719 | 230,321,719 | - | - |
Consumer Discretionary | 78,651,736 | 78,651,736 | - | - |
Consumer Staples | 43,264,722 | 43,264,722 | - | - |
Energy | 222,239,878 | 222,239,878 | - | - |
Financials | 328,818,630 | 328,818,630 | - | - |
Health Care | 209,932,394 | 209,932,394 | - | - |
Industrials | 47,038,547 | 47,038,547 | - | - |
Information Technology | 225,058,562 | 225,058,562 | - | - |
Materials | 77,249,860 | 77,249,860 | - | - |
Real Estate | 4,405,324 | 4,405,324 | - | - |
Utilities | 6,549,762 | 6,549,762 | - | - |
|
| U.S. Government and Government Agency Obligations | 294,368 | - | 294,368 | - |
|
| Money Market Funds | 9,766,921 | 9,766,921 | - | - |
| Total Investments in Securities: | 1,483,592,423 | 1,483,298,055 | 294,368 | - |
Derivative Instruments: | | | | |
|
| Assets | | | | |
Futures Contracts | 103,774 | 103,774 | - | - |
| Total Assets | 103,774 | 103,774 | - | - |
| Total Derivative Instruments: | 103,774 | 103,774 | - | - |
Value of Derivative Instruments
The following table is a summary of the Fund's value of derivative instruments by primary risk exposure as of January 31, 2023. For additional information on derivative instruments, please refer to the Derivative Instruments section in the accompanying Notes to Financial Statements.
Primary Risk Exposure / Derivative Type | Value |
| Asset ($) | Liability ($) |
| Equity Risk | | |
Futures Contracts (a) | 103,774 | 0 |
| Total Equity Risk | 103,774 | 0 |
| Total Value of Derivatives | 103,774 | 0 |
(a)Reflects gross cumulative appreciation (depreciation) on futures contracts as presented in the Schedule of Investments. In the Statement of Assets and Liabilities, the period end daily variation margin is included in receivable or payable for daily variation margin on futures contracts, and the net cumulative appreciation (depreciation) is included in Total accumulated earnings (loss).
| Statement of Assets and Liabilities |
| | | | January 31, 2023 (Unaudited) |
| | | | | |
| Assets | | | | |
| Investment in securities, at value (including securities loaned of $9,732,481) - See accompanying schedule: | | | | |
Unaffiliated issuers (cost $1,226,043,986) | $ | 1,473,825,502 | | |
Fidelity Central Funds (cost $9,766,921) | | 9,766,921 | | |
| | | | | |
| | | | | |
| Total Investment in Securities (cost $1,235,810,907) | | | $ | 1,483,592,423 |
| Receivable for fund shares sold | | | | 187,320 |
| Dividends receivable | | | | 2,467,313 |
| Distributions receivable from Fidelity Central Funds | | | | 12,690 |
| Receivable for daily variation margin on futures contracts | | | | 34,512 |
| Prepaid expenses | | | | 2,373 |
Total assets | | | | 1,486,296,631 |
| Liabilities | | | | |
| Payable to custodian bank | $ | 193,943 | | |
| Payable for fund shares redeemed | | 466,236 | | |
| Accrued management fee | | 116,842 | | |
| Other payables and accrued expenses | | 26,224 | | |
| Collateral on securities loaned | | 9,766,550 | | |
| Total Liabilities | | | | 10,569,795 |
| Net Assets | | | $ | 1,475,726,836 |
| Net Assets consist of: | | | | |
| Paid in capital | | | $ | 1,221,141,130 |
| Total accumulated earnings (loss) | | | | 254,585,706 |
| Net Assets | | | $ | 1,475,726,836 |
Net Asset Value , offering price and redemption price per share ($1,475,726,836 ÷ 128,673,987 shares) | | | $ | 11.47 |
| Statement of Operations |
| | | | Six months ended January 31, 2023 (Unaudited) |
| Investment Income | | | | |
| Dividends | | | $ | 28,444,329 |
| Interest | | | | 2,752 |
| Income from Fidelity Central Funds (including $33,967 from security lending) | | | | 74,065 |
| Total Income | | | | 28,521,146 |
| Expenses | | | | |
| Management fee | $ | 960,600 | | |
| Custodian fees and expenses | | 17,750 | | |
| Independent trustees' fees and expenses | | 4,393 | | |
| Registration fees | | 30,079 | | |
| Audit | | 28,830 | | |
| Legal | | 2,840 | | |
| Interest | | 152,494 | | |
| Miscellaneous | | 7,981 | | |
| Total Expenses | | | | 1,204,967 |
| Net Investment income (loss) | | | | 27,316,179 |
| Realized and Unrealized Gain (Loss) | | | | |
| Net realized gain (loss) on: | | | | |
| Investment Securities: | | | | |
| Unaffiliated issuers | | 35,717,278 | | |
| Futures contracts | | 50,139 | | |
| Total net realized gain (loss) | | | | 35,767,417 |
| Change in net unrealized appreciation (depreciation) on: | | | | |
| Investment Securities: | | | | |
| Unaffiliated issuers | | (89,439,789) | | |
| Futures contracts | | (513,955) | | |
| Total change in net unrealized appreciation (depreciation) | | | | (89,953,744) |
| Net gain (loss) | | | | (54,186,327) |
| Net increase (decrease) in net assets resulting from operations | | | $ | (26,870,148) |
| Statement of Changes in Net Assets |
| |
| | Six months ended January 31, 2023 (Unaudited) | | Year ended July 31, 2022 |
| Increase (Decrease) in Net Assets | | | | |
| Operations | | | | |
| Net investment income (loss) | $ | 27,316,179 | $ | 87,321,649 |
| Net realized gain (loss) | | 35,767,417 | | 413,578,336 |
| Change in net unrealized appreciation (depreciation) | | (89,953,744) | | (267,711,209) |
| Net increase (decrease) in net assets resulting from operations | | (26,870,148) | | 233,188,776 |
| Distributions to shareholders | | (299,214,923) | | (211,360,654) |
| Share transactions | | | | |
| Proceeds from sales of shares | | 125,777,268 | | 254,286,545 |
| Reinvestment of distributions | | 289,927,267 | | 205,252,752 |
| Cost of shares redeemed | | (1,566,433,395) | | (1,118,086,652) |
Net increase (decrease) in net assets resulting from share transactions | | (1,150,728,860) | | (658,547,355) |
| Total increase (decrease) in net assets | | (1,476,813,931) | | (636,719,233) |
| | | | | |
| Net Assets | | | | |
| Beginning of period | | 2,952,540,767 | | 3,589,260,000 |
| End of period | $ | 1,475,726,836 | $ | 2,952,540,767 |
| | | | | |
| Other Information | | | | |
| Shares | | | | |
| Sold | | 11,563,555 | | 20,783,344 |
| Issued in reinvestment of distributions | | 26,793,151 | | 17,137,513 |
| Redeemed | | (153,103,595) | | (88,301,534) |
| Net increase (decrease) | | (114,746,889) | | (50,380,677) |
| | | | | |
Financial Highlights
| Fidelity® SAI U.S. Value Index Fund |
| |
| | Six months ended (Unaudited) January 31, 2023 | | Years ended July 31, 2022 | | 2021 | | 2020 | | 2019 | | 2018 A |
Selected Per-Share Data | | | | | | | | | | | | |
| Net asset value, beginning of period | $ | 12.13 | $ | 12.22 | $ | 8.82 | $ | 10.06 | $ | 10.36 | $ | 10.00 |
| Income from Investment Operations | | | | | | | | | | | | |
Net investment income (loss) B,C | | .16 | | .31 | | .31 | | .29 | | .25 | | .14 |
| Net realized and unrealized gain (loss) | | .55 | | .31 | | 3.35 | | (1.27) | | (.22) | | .23 |
| Total from investment operations | | .71 | | .62 | | 3.66 | | (.98) | | .03 | | .37 |
| Distributions from net investment income | | (.38) | | (.28) | | (.26) | | (.26) | | (.19) | | (.01) |
| Distributions from net realized gain | | (.99) | | (.42) | | - | | - | | (.14) | | - |
| Total distributions | | (1.37) | | (.71) D | | (.26) | | (.26) | | (.33) | | (.01) |
| Net asset value, end of period | $ | 11.47 | $ | 12.13 | $ | 12.22 | $ | 8.82 | $ | 10.06 | $ | 10.36 |
Total Return E,F | | 6.65% | | 5.21% | | 42.39% | | (10.13)% | | .62% | | 3.67% |
Ratios to Average Net Assets C,G,H | | | | | | | | | | | | |
| Expenses before reductions | | .12% I | | .10% | | .11% | | .11% | | .21% | | .28% I |
| Expenses net of fee waivers, if any | | .12% I | | .10% | | .11% | | .11% | | .15% | | .15% I |
| Expenses net of all reductions | | .12% I | | .10% | | .11% | | .11% | | .15% | | .15% I |
| Net investment income (loss) | | 2.82% I | | 2.49% | | 2.89% | | 3.12% | | 2.61% | | 2.20% I |
| Supplemental Data | | | | | | | | | | | | |
| Net assets, end of period (000 omitted) | $ | 1,475,727 | $ | 2,952,541 | $ | 3,589,260 | $ | 2,282,301 | $ | 1,788,140 | $ | 1,958,157 |
Portfolio turnover rate J | | 67% I | | 62% | | 80% | | 82% | | 99% | | 113% I |
A For the period December 19, 2017 (commencement of operations) through July 31, 2018.
B Calculated based on average shares outstanding during the period.
C Net investment income (loss) is affected by the timing of the declaration of dividends by any underlying mutual funds or exchange-traded funds (ETFs). Net investment income (loss) of any mutual funds or ETFs is not included in the Fund's net investment income (loss) ratio.
D Total distributions per share do not sum due to rounding.
E Total returns for periods of less than one year are not annualized.
F Total returns would have been lower if certain expenses had not been reduced during the applicable periods shown.
G Fees and expenses of any underlying mutual funds or exchange-traded funds (ETFs) are not included in the Fund's expense ratio. The Fund indirectly bears its proportionate share of these expenses. For additional expense information related to investments in Fidelity Central Funds, please refer to the "Investments in Fidelity Central Funds" note found in the Notes to Financial Statements section of the most recent Annual or Semi-Annual report.
H Expense ratios reflect operating expenses of the class. Expenses before reductions do not reflect amounts reimbursed, waived, or reduced through arrangements with the investment adviser, brokerage services, or other offset arrangements, if applicable, and do not represent the amount paid by the class during periods when reimbursements, waivers or reductions occur.
I Annualized.
J Amount does not include the portfolio activity of any underlying mutual funds or exchange-traded funds (ETFs).
For the period ended January 31, 2023
1. Organization.
Fidelity SAI U.S. Value Index Fund (the Fund) is a fund of Fidelity Salem Street Trust (the Trust) and is authorized to issue an unlimited number of shares. Shares are offered exclusively to certain clients of Fidelity Management & Research Company LLC (FMR) or its affiliates. The Trust is registered under the Investment Company Act of 1940, as amended (the 1940 Act), as an open-end management investment company organized as a Massachusetts business trust.
2. Investments in Fidelity Central Funds.
Funds may invest in Fidelity Central Funds, which are open-end investment companies generally available only to other investment companies and accounts managed by the investment adviser and its affiliates. The Schedule of Investments lists any Fidelity Central Funds held as an investment as of period end, but does not include the underlying holdings of each Fidelity Central Fund. An investing fund indirectly bears its proportionate share of the expenses of the underlying Fidelity Central Funds.
Based on its investment objective, each Fidelity Central Fund may invest or participate in various investment vehicles or strategies that are similar to those of the investing fund. These strategies are consistent with the investment objectives of the investing fund and may involve certain economic risks which may cause a decline in value of each of the Fidelity Central Funds and thus a decline in the value of the investing fund.
| Fidelity Central Fund | Investment Manager | Investment Objective | Investment Practices | Expense Ratio A |
| Fidelity Money Market Central Funds | Fidelity Management & Research Company LLC (FMR) | Each fund seeks to obtain a high level of current income consistent with the preservation of capital and liquidity. | Short-term Investments | Less than .005% |
A Expenses expressed as a percentage of average net assets and are as of each underlying Central Fund's most recent annual or semi-annual shareholder report.
A complete unaudited list of holdings for each Fidelity Central Fund is available upon request or at the Securities and Exchange Commission website at www.sec.gov. In addition, the financial statements of the Fidelity Central Funds which contain the significant accounting policies (including investment valuation policies) of those funds, and are not covered by the Report of Independent Registered Public Accounting Firm, are available on the Securities and Exchange Commission website or upon request.
3. Significant Accounting Policies.
The Fund is an investment company and applies the accounting and reporting guidance of the Financial Accounting Standards Board (FASB) Accounting Standards Codification Topic 946 Financial Services - Investment Companies . The financial statements have been prepared in conformity with accounting principles generally accepted in the United States of America (GAAP), which require management to make certain estimates and assumptions at the date of the financial statements. Actual results could differ from those estimates. Subsequent events, if any, through the date that the financial statements were issued have been evaluated in the preparation of the financial statements. The Fund's Schedule of Investments lists any underlying mutual funds or exchange-traded funds (ETFs) but does not include the underlying holdings of these funds. The following summarizes the significant accounting policies of the Fund:
Investment Valuation. Investments are valued as of 4:00 p.m. Eastern time on the last calendar day of the period. The Board of Trustees (the Board) has designated the Fund's investment adviser as the valuation designee responsible for the fair valuation function and performing fair value determinations as needed. The investment adviser has established a Fair Value Committee (the Committee) to carry out the day-to-day fair valuation responsibilities and has adopted policies and procedures to govern the fair valuation process and the activities of the Committee. In accordance with these fair valuation policies and procedures, which have been approved by the Board, the Fund attempts to obtain prices from one or more third party pricing services or brokers to value its investments. When current market prices, quotations or currency exchange rates are not readily available or reliable, investments will be fair valued in good faith by the Committee, in accordance with the policies and procedures. Factors used in determining fair value vary by investment type and may include market or investment specific events, transaction data, estimated cash flows, and market observations of comparable investments. The frequency that the fair valuation procedures are used cannot be predicted and they may be utilized to a significant extent. The Committee manages the Fund's fair valuation practices and maintains the fair valuation policies and procedures. The Fund's investment adviser reports to the Board information regarding the fair valuation process and related material matters.
The Fund categorizes the inputs to valuation techniques used to value its investments into a disclosure hierarchy consisting of three levels as shown below:
Level 1 - unadjusted quoted prices in active markets for identical investments
Level 2 - other significant observable inputs (including quoted prices for similar investments, interest rates, prepayment speeds, etc.)
Level 3 - unobservable inputs (including the Fund's own assumptions based on the best information available)
Valuation techniques used to value the Fund's investments by major category are as follows:
Equity securities, including restricted securities, for which market quotations are readily available, are valued at the last reported sale price or official closing price as reported by a third party pricing service on the primary market or exchange on which they are traded and are categorized as Level 1 in the hierarchy. In the event there were no sales during the day or closing prices are not available, securities are valued at the last quoted bid price or may be valued using the last available price and are generally categorized as Level 2 in the hierarchy. For foreign equity securities, when market or security specific events arise, comparisons to the valuation of American Depositary Receipts (ADRs), futures contracts, ETFs and certain indexes as well as quoted prices for similar securities may be used and would be categorized as Level 2 in the hierarchy. For equity securities, including restricted securities, where observable inputs are limited, assumptions about market activity and risk are used and these securities may be categorized as Level 3 in the hierarchy.
Debt securities, including restricted securities, are valued based on evaluated prices received from third party pricing services or from brokers who make markets in such securities. U.S. government and government agency obligations are valued by pricing services who utilize matrix pricing which considers yield or price of bonds of comparable quality, coupon, maturity and type or by broker-supplied prices. When independent prices are unavailable or unreliable, debt securities may be valued utilizing pricing methodologies which consider similar factors that would be used by third party pricing services. Debt securities are generally categorized as Level 2 in the hierarchy but may be Level 3 depending on the circumstances.
Futures contracts are valued at the settlement price established each day by the board of trade or exchange on which they are traded and are categorized as Level 1 in the hierarchy. Investments in open-end mutual funds, including the Fidelity Central Funds, are valued at their closing net asset value (NAV) each business day and are categorized as Level 1 in the hierarchy.
Changes in valuation techniques may result in transfers in or out of an assigned level within the disclosure hierarchy. The aggregate value of investments by input level as of January 31, 2023 is included at the end of the Fund's Schedule of Investments.
Investment Transactions and Income. For financial reporting purposes, the Fund's investment holdings and NAV include trades executed through the end of the last business day of the period. The NAV per share for processing shareholder transactions is calculated as of the close of business of the New York Stock Exchange (NYSE), normally 4:00 p.m. Eastern time and includes trades executed through the end of the prior business day. Gains and losses on securities sold are determined on the basis of identified cost and include proceeds received from litigation. Commissions paid to certain brokers with whom the investment adviser, or its affiliates, places trades on behalf of a fund include an amount in addition to trade execution, which may be rebated back to a fund. Any such rebates are included in net realized gain (loss) on investments in the Statement of Operations. Dividend income is recorded on the ex-dividend date, except for certain dividends from foreign securities where the ex-dividend date may have passed, which are recorded as soon as the Fund is informed of the ex-dividend date. Non-cash dividends included in dividend income, if any, are recorded at the fair market value of the securities received. Income and capital gain distributions from Fidelity Central Funds, if any, are recorded on the ex-dividend date. Certain distributions received by the Fund represent a return of capital or capital gain. The Fund determines the components of these distributions subsequent to the ex-dividend date, based upon receipt of tax filings or other correspondence relating to the underlying investment. These distributions are recorded as a reduction of cost of investments and/or as a realized gain. Interest income is accrued as earned and includes coupon interest and amortization of premium and accretion of discount on debt securities as applicable.
Expenses. Expenses directly attributable to a fund are charged to that fund. Expenses attributable to more than one fund are allocated among the respective funds on the basis of relative net assets or other appropriate methods. Expenses included in the accompanying financial statements reflect the expenses of that fund and do not include any expenses associated with any underlying mutual funds or exchange-traded funds. Although not included in a fund's expenses, a fund indirectly bears its proportionate share of these expenses through the net asset value of each underlying mutual fund or exchange-traded fund. Expense estimates are accrued in the period to which they relate and adjustments are made when actual amounts are known.
Income Tax Information and Distributions to Shareholders. Each year, the Fund intends to qualify as a regulated investment company under Subchapter M of the Internal Revenue Code, including distributing substantially all of its taxable income and realized gains. As a result, no provision for U.S. Federal income taxes is required. The Fund files a U.S. federal tax return, in addition to state and local tax returns as required. The Fund's federal income tax returns are subject to examination by the Internal Revenue Service (IRS) for a period of three fiscal years after they are filed. State and local tax returns may be subject to examination for an additional fiscal year depending on the jurisdiction.
Distributions are declared and recorded on the ex-dividend date. Income and capital gain distributions are determined in accordance with income tax regulations, which may differ from GAAP.
Capital accounts within the financial statements are adjusted for permanent book-tax differences. These adjustments have no impact on net assets or the results of operations. Capital accounts are not adjusted for temporary book-tax differences which will reverse in a subsequent period.
Book-tax differences are primarily due to futures contracts losses deferred due to wash sales.
As of period end, the cost and unrealized appreciation (depreciation) in securities, and derivatives if applicable, for federal income tax purposes were as follows:
| Gross unrealized appreciation | $303,548,446 |
| Gross unrealized depreciation | (77,324,008) |
| Net unrealized appreciation (depreciation) | $226,224,438 |
| Tax cost | $1,257,471,759 |
4. Derivative Instruments.
Risk Exposures and the Use of Derivative Instruments. The Fund's investment objectives allow for various types of derivative instruments, including futures contracts. Derivatives are investments whose value is primarily derived from underlying assets, indices or reference rates and may be transacted on an exchange or over-the-counter (OTC). Derivatives may involve a future commitment to buy or sell a specified asset based on specified terms, to exchange future cash flows at periodic intervals based on a notional principal amount, or for one party to make one or more payments upon the occurrence of specified events in exchange for periodic payments from the other party.
Derivatives were used to increase returns and to manage exposure to certain risks as defined below. The success of any strategy involving derivatives depends on analysis of numerous economic factors, and if the strategies for investment do not work as intended, the objectives may not be achieved.
Derivatives were used to increase or decrease exposure to the following risk(s):
| Equity Risk | Equity risk relates to the fluctuations in the value of financial instruments as a result of changes in market prices (other than those arising from interest rate risk or foreign exchange risk), whether caused by factors specific to an individual investment, its issuer, or all factors affecting all instruments traded in a market or market segment. |
Funds are also exposed to additional risks from investing in derivatives, such as liquidity risk and counterparty credit risk. Liquidity risk is the risk that a fund will be unable to close out the derivative in the open market in a timely manner. Counterparty credit risk is the risk that the counterparty will not be able to fulfill its obligation to a fund. Counterparty credit risk related to exchange-traded contracts may be mitigated by the protection provided by the exchange on which they trade.
Investing in derivatives may involve greater risks than investing in the underlying assets directly and, to varying degrees, may involve risk of loss in excess of any initial investment and collateral received and amounts recognized in the Statement of Assets and Liabilities. In addition, there may be the risk that the change in value of the derivative contract does not correspond to the change in value of the underlying instrument.
Futures Contracts. A futures contract is an agreement between two parties to buy or sell a specified underlying instrument for a fixed price at a specified future date. Futures contracts were used to manage exposure to the stock market.
Upon entering into a futures contract, a fund is required to deposit either cash or securities (initial margin) with a clearing broker in an amount equal to a certain percentage of the face value of the contract. Futures contracts are marked-to-market daily and subsequent daily payments are made or received by a fund depending on the daily fluctuations in the value of the futures contracts and are recorded as unrealized appreciation or (depreciation). This receivable and/or payable, if any, is included in daily variation margin on futures contracts in the Statement of Assets and Liabilities. Realized gain or (loss) is recorded upon the expiration or closing of a futures contract. The net realized gain (loss) and change in net unrealized appreciation (depreciation) on futures contracts during the period is presented in the Statement of Operations.
Any open futures contracts at period end are presented in the Schedule of Investments under the caption "Futures Contracts". The notional amount at value reflects each contract's exposure to the underlying instrument or index at period end, and is representative of volume of activity during the period unless an average notional amount is presented. Any securities deposited to meet initial margin requirements are identified in the Schedule of Investments. Any cash deposited to meet initial margin requirements is presented as segregated cash with brokers for derivative instruments in the Statement of Assets and Liabilities.
5. Purchases and Sales of Investments.
Purchases and sales of securities, other than short-term securities and in-kind transactions, as applicable, are noted in the table below.
| | Purchases ($) | Sales ($) |
| Fidelity SAI U.S. Value Index Fund | 650,181,604 | 2,066,114,437 |
6. Fees and Other Transactions with Affiliates.
Management Fee. Fidelity Management & Research Company LLC (the investment adviser) and its affiliates provide the Fund with investment management related services for which the Fund pays a monthly management fee that is based on an annual rate of .10% of the Fund's average net assets.
Sub-Adviser. Geode Capital Management, LLC (Geode), serves as sub-adviser for the Fund. Geode provides discretionary investment advisory services to the Fund and is paid by the investment adviser for providing these services.
Interfund Lending Program. Pursuant to an Exemptive Order issued by the Securities and Exchange Commission (the SEC), the Fund, along with other registered investment companies having management contracts with Fidelity Management & Research Company LLC (FMR), or other affiliated entities of FMR, may participate in an interfund lending program. This program provides an alternative credit facility allowing the Fund to borrow from, or lend money to, other participating affiliated funds. At period end, there were no interfund loans outstanding. Activity in this program during the period for which loans were outstanding was as follows:
| | Borrower or Lender | Average Loan Balance | Weighted Average Interest Rate | Interest Expense |
| Fidelity SAI U.S. Value Index Fund | Borrower | $71,650,381 | 3.18% | $133,099 |
Interfund Trades. Funds may purchase from or sell securities to other Fidelity Funds under procedures adopted by the Board. The procedures have been designed to ensure these interfund trades are executed in accordance with Rule 17a-7 of the 1940 Act. Any interfund trades are included within the respective purchases and sales amounts shown in the Purchases and Sales of Investments note. During the period, there were no interfund trades.
7. Committed Line of Credit.
Certain Funds participate with other funds managed by the investment adviser or an affiliate in a $4.25 billion credit facility (the "line of credit") to be utilized for temporary or emergency purposes to fund shareholder redemptions or for other short-term liquidity purposes. The participating funds have agreed to pay commitment fees on their pro-rata portion of the line of credit, which are reflected in Miscellaneous expenses on the Statement of Operations, and are listed below. During the period, there were no borrowings on this line of credit.
| | Amount |
| Fidelity SAI U.S. Value Index Fund | $3,300 |
8. Security Lending.
Funds lend portfolio securities from time to time in order to earn additional income. Lending agents are used, including National Financial Services (NFS), an affiliate of the investment adviser. Pursuant to a securities lending agreement, NFS will receive a fee, which is capped at 9.9% of a fund's daily lending revenue, for its services as lending agent. A fund may lend securities to certain qualified borrowers, including NFS. On the settlement date of the loan, a fund receives collateral (in the form of U.S. Treasury obligations, letters of credit and/or cash) against the loaned securities and maintains collateral in an amount not less than 100% of the market value of the loaned securities during the period of the loan. The market value of the loaned securities is determined at the close of business of a fund and any additional required collateral is delivered to a fund on the next business day. A fund or borrower may terminate the loan at any time, and if the borrower defaults on its obligation to return the securities loaned because of insolvency or other reasons, a fund may apply collateral received from the borrower against the obligation. A fund may experience delays and costs in recovering the securities loaned. Any cash collateral received is invested in the Fidelity Securities Lending Cash Central Fund. Any loaned securities are identified as such in the Schedule of Investments, and the value of loaned securities and cash collateral at period end, as applicable, are presented in the Statement of Assets and Liabilities. Security lending income represents the income earned on investing cash collateral, less rebates paid to borrowers and any lending agent fees associated with the loan, plus any premium payments received for lending certain types of securities. Security lending income is presented in the Statement of Operations as a component of income from Fidelity Central Funds. Affiliated security lending activity, if any, was as follows:
| | Total Security Lending Fees Paid to NFS | Security Lending Income From Securities Loaned to NFS | Value of Securities Loaned to NFS at Period End |
| Fidelity SAI U.S. Value Index Fund | $3,555 | $- | $- |
9. Bank Borrowings.
The Fund is permitted to have bank borrowings for temporary or emergency purposes to fund shareholder redemptions or for other short-term liquidity requirements. The Fund has established borrowing arrangements with certain banks. The interest rate on the borrowings is the bank's base rate, as revised from time to time. Any open loans, including accrued interest, at period end are presented under the caption "Notes payable" in the Statement of Assets and Liabilities, if applicable. Activity in this program during the period for which loans were outstanding was as follows:
| | Average Loan Balance | Weighted Average Interest Rate | Interest Expense |
| Fidelity SAI U.S. Value Index Fund | $24,345,250 | 3.59% | $19,395 |
10. Other.
A fund's organizational documents provide former and current trustees and officers with a limited indemnification against liabilities arising in connection with the performance of their duties to the fund. In the normal course of business, a fund may also enter into contracts that provide general indemnifications. A fund's maximum exposure under these arrangements is unknown as this would be dependent on future claims that may be made against a fund. The risk of material loss from such claims is considered remote.
In addition, at the end of the period, the following mutual funds managed by the investment adviser or its affiliates were the owners of record of 10% or more of the total outstanding shares.
| | Strategic Advisers Fidelity U.S. Total Stock Fund |
| Fidelity SAI U.S. Value Index Fund | 57% |
11. Risk and Uncertainties.
Many factors affect a fund's performance. Developments that disrupt global economies and financial markets, such as pandemics, epidemics, outbreaks of infectious diseases, war, terrorism, and environmental disasters, may significantly affect a fund's investment performance. The effects of these developments to a fund will be impacted by the types of securities in which a fund invests, the financial condition, industry, economic sector, and geographic location of an issuer, and a fund's level of investment in the securities of that issuer.
As a shareholder, you incur two types of costs: (1) transaction costs, which may include sales charges (loads) on purchase payments or redemption proceeds, as applicable and (2) ongoing costs, which generally include management fees, distribution and/or service (12b-1) fees and other Fund expenses. This Example is intended to help you understand your ongoing costs (in dollars) of investing in a fund and to compare these costs with the ongoing costs of investing in other mutual funds.
| The Example is based on an investment of $1,000 invested at the beginning of the period and held for the entire period (August 1, 2022 to January 31, 2023). |
Actual Expenses
The first line of the accompanying table provides information about actual account values and actual expenses. You may use the information in this line, together with the amount you invested, to estimate the expenses that you paid over the period. Simply divide your account value by $1,000.00 (for example, an $8,600 account value divided by $1,000.00 = 8.6), then multiply the result by the number in the first line for a class/Fund under the heading entitled "Expenses Paid During Period" to estimate the expenses you paid on your account during this period. If any fund is a shareholder of any underlying mutual funds or exchange-traded funds (ETFs) (the Underlying Funds), such fund indirectly bears its proportional share of the expenses of the Underlying Funds in addition to the direct expenses incurred presented in the table. These fees and expenses are not included in the annualized expense ratio used to calculate the expense estimate in the table below.
Hypothetical Example for Comparison Purposes
The second line of the accompanying table provides information about hypothetical account values and hypothetical expenses based on the actual expense ratio and an assumed rate of return of 5% per year before expenses, which is not the actual return. The hypothetical account values and expenses may not be used to estimate the actual ending account balance or expenses you paid for the period. You may use this information to compare the ongoing costs of investing in the Fund and other funds. To do so, compare this 5% hypothetical example with the 5% hypothetical examples that appear in the shareholder reports of the other funds. If any fund is a shareholder of any Underlying Funds, such fund indirectly bears its proportional share of the expenses of the Underlying Funds in addition to the direct expenses as presented in the table. These fees and expenses are not included in the annualized expense ratio used to calculate the expense estimate in the table below.
Please note that the expenses shown in the table are meant to highlight your ongoing costs only and do not reflect any transaction costs. Therefore, the second line of the table is useful in comparing ongoing costs only, and will not help you determine the relative total costs of owning different funds. In addition, if these transactional costs were included, your costs would have been higher.
| | | | | Annualized Expense Ratio- A | | Beginning Account Value August 1, 2022 | | Ending Account Value January 31, 2023 | | Expenses Paid During Period- C August 1, 2022 to January 31, 2023 |
| | | | | | | | | | |
| Fidelity® SAI U.S. Value Index Fund | | | | .12% | | | | | | |
| Actual | | | | | | $ 1,000 | | $ 1,066.50 | | $ .63 |
Hypothetical- B | | | | | | $ 1,000 | | $ 1,024.60 | | $ .61 |
| |
A Annualized expense ratio reflects expenses net of applicable fee waivers.
B 5% return per year before expenses
C Expenses are equal to the annualized expense ratio, multiplied by the average account value over the period, multiplied by 184/ 365 (to reflect the one-half year period). The fees and expenses of any Underlying Funds are not included in each annualized expense ratio.
Board Approval of Investment Advisory Contracts and Management Fees
Fidelity SAI U.S. Value Index Fund
Each year, the Board of Trustees, including the Independent Trustees (together, the Board), votes on the renewal of the management contract with Fidelity Management & Research Company LLC (FMR) and the sub-advisory agreement (Sub-Advisory Agreement) for the fund with Geode Capital Management, LLC (Geode) (together, the Advisory Contracts). FMR and Geode are referred to herein as the Investment Advisers. The Board, assisted by the advice of fund counsel and Independent Trustees' counsel, requests and considers a broad range of information relevant to the renewal of the Advisory Contracts throughout the year.
The Board meets regularly and, at each of its meetings, covers an extensive agenda of topics and materials and considers factors that are relevant to its annual consideration of the renewal of the fund's Advisory Contracts, including the services and support provided to the fund and its shareholders. The Board has established four standing committees (Committees) - Operations, Audit, Fair Valuation, and Governance and Nominating - each composed of and chaired by Independent Trustees with varying backgrounds, to which the Board has assigned specific subject matter responsibilities in order to enhance effective decision-making by the Board. The Operations Committee, of which all the Independent Trustees are members, meets regularly throughout the year and requests, receives and considers, among other matters, information related to the annual consideration of the renewal of the fund's Advisory Contracts before making its recommendation to the Board. The Board also meets as needed to review matters specifically related to the Board's annual consideration of the renewal of the Advisory Contracts. Members of the Board may also meet from time to time with trustees of other Fidelity funds through joint ad hoc committees to discuss certain matters relevant to all of the Fidelity funds.
At its September 2022 meeting, the Board unanimously determined to renew the fund's Advisory Contracts. In reaching its determination, the Board considered all factors it believed relevant, including (i) the nature, extent, and quality of the services provided to the fund and its shareholders (including the investment performance of the fund); (ii) the competitiveness relative to peer funds of the fund's management fee and total expense ratio; (iii) the total costs of the services provided by and the profits realized by Fidelity and Geode from their respective relationships with the fund; and (iv) the extent to which, if any, economies of scale exist and are realized as the fund grows, and whether any economies of scale are appropriately shared with fund shareholders.
In considering whether to renew the Advisory Contracts for the fund, the Board reached a determination, with the assistance of fund counsel and Independent Trustees' counsel and through the exercise of its business judgment, that the renewal of the Advisory Contracts was in the best interests of the fund and its shareholders and that the compensation payable under the Advisory Contracts was fair and reasonable. The Board's decision to renew the Advisory Contracts was not based on any single factor, but rather was based on a comprehensive consideration of all the information provided to the Board at its meetings throughout the year. The Board, in reaching its determination to renew the Advisory Contracts, was aware that shareholders of the fund have a broad range of investment choices available to them, including a wide choice among funds offered by Fidelity's competitors, and that the fund's shareholders, who have the opportunity to review and weigh the disclosure provided by the fund in its prospectus and other public disclosures, have chosen to invest in this fund, which is part of the Fidelity family of funds.
Nature, Extent, and Quality of Services Provided . The Board considered staffing as it relates to the fund, including the backgrounds of investment personnel of Fidelity and Geode, and also considered the fund's investment objective, strategies, and related investment philosophy. The Independent Trustees also had discussions with senior management of Fidelity's investment operations and investment groups and with senior management of Geode. The Board considered the structure of the investment personnel compensation programs and whether the structures provide appropriate incentives to act in the best interests of the fund. The Board also considered the steps Fidelity and Geode had taken to ensure the continued provision of high quality services to the Fidelity funds throughout the COVID-19 pandemic, including the expansion of staff in client facing positions to maintain service levels in periods of high volumes and volatility.
The Trustees also discussed with representatives of Fidelity, at meetings throughout the year, Fidelity's role in, among other things, overseeing compliance with federal securities laws and other applicable requirements by Geode with respect to the fund and monitoring and overseeing the performance and investment capabilities of Geode. The Trustees considered that the Board had received from Fidelity periodic reports about its oversight and due diligence processes, as well as periodic reports regarding the performance of Geode.
The Board also considered the nature, extent and quality of services provided by Geode. The Trustees noted that under the Sub-Advisory Agreement, subject to oversight by Fidelity, Geode is responsible for, among other things, identifying investments and arranging for execution of portfolio transactions to implement the fund's investment strategy. In addition, the Trustees noted that Geode is responsible for providing such reporting as may be requested by Fidelity to fulfill its oversight responsibilities discussed above.
Resources Dedicated to Investment Management and Support Services. The Board reviewed the general qualifications and capabilities of Fidelity's and Geode's investment staffs, including their size, education, experience, and resources, as well as Fidelity's and Geode's approach to recruiting, training, managing, and compensating investment personnel. The Board noted the resources devoted to Fidelity's global investment organization and that Fidelity's and Geode's analysts have extensive resources, tools and capabilities that allow them to conduct quantitative and fundamental analysis, as well as credit analysis of issuers, counterparties, and guarantors. Further, the Board considered that Fidelity's and Geode's investment professionals have sufficient access to information and data so as to provide competitive investment results over time, and that those professionals also have access to sophisticated tools that permit them to assess portfolio construction and risk and performance attribution characteristics continuously. Additionally, in its deliberations, the Board considered Fidelity's and Geode's trading, risk management, compliance, cybersecurity, and technology and operations capabilities and resources, which are integral parts of the investment management process.
Shareholder and Administrative Services . The Board considered (i) the nature, extent, quality, and cost of advisory, administrative, and shareholder services performed by the Investment Advisers and their affiliates under the Advisory Contracts and by FMR's affiliates under separate agreements covering transfer agency, pricing and bookkeeping, and securities lending services for the fund; (ii) the nature and extent of the supervision of third party service providers, principally custodians, subcustodians, and pricing vendors; and (iii) the resources devoted to, and the record of compliance with, the fund's compliance policies and procedures. The Board also reviewed the allocation of fund brokerage, including allocations to brokers affiliated with the Investment Advisers.
The Board noted that the growth of fund assets over time across the complex allows Fidelity to reinvest in the development of services designed to enhance the value and convenience of the Fidelity funds as investment vehicles. These services include 24-hour access to account information and market information over the Internet and through telephone representatives, investor education materials and asset allocation tools. The Board also considered that it reviews customer service metrics such as telephone response times, continuity of services on the website and metrics addressing services at Fidelity Investor Centers.
I nvestment in a Large Fund Family . The Board considered the benefits to shareholders of investing in a Fidelity fund, including the benefits of investing in a fund that is part of a large family of funds offering a variety of investment disciplines and providing a large variety of mutual fund investor services. The Board noted that Fidelity had taken, or had made recommendations to the Board that resulted in the Fidelity funds taking, a number of actions over the previous year that benefited particular funds, including: (i) continuing to dedicate additional resources to Fidelity's investment research process, which includes meetings with management of issuers of securities in which the funds invest; (ii) continuing efforts to enhance Fidelity's global research capabilities; (iii) launching new funds, ETFs, and share classes with innovative structures, strategies and pricing and making other enhancements to meet investor needs; (iv) broadening eligibility requirements for certain funds and share classes; (v) reducing management fees and total expenses for certain funds and classes; (vi) lowering expenses for certain existing funds and classes by implementing or lowering expense caps; (vii) rationalizing product lines and gaining increased efficiencies from fund mergers and liquidations; (viii) continuing to develop, acquire and implement systems and technology to improve services to the funds and shareholders, strengthen information security, and increase efficiency; and (ix) continuing to implement enhancements to further strengthen Fidelity's product line to increase investors' probability of success in achieving their investment goals, including their retirement income goals.
Investment Performance. The Board considered whether the fund has operated in accordance with its investment objective, as well as its record of compliance with its investment restrictions and its performance history.
The Board took into account discussions that occur at Board meetings throughout the year with representatives of the Investment Advisers about fund investment performance. In this regard the Board noted that as part of regularly scheduled fund reviews and other reports to the Board on fund performance, the Board considers annualized return information for the fund for different time periods, measured against the securities market index the fund seeks to track. The Board also periodically considers the fund's tracking error versus its benchmark index.
In addition to reviewing absolute and relative fund performance, the Independent Trustees periodically consider the appropriateness of fund performance metrics in evaluating the results achieved. In general, the Independent Trustees believe that an index fund's performance should be evaluated based on gross performance (before fees and expenses but after transaction costs) compared to the fund's benchmark index, over appropriate time periods, taking into account relevant factors including the following: general market conditions; the characteristics of the fund's benchmark index; the extent to which statistical sampling is employed; any securities lending revenues; and fund cash flows and other factors. The Independent Trustees generally give greater weight to fund performance over longer time periods than over shorter time periods. Depending on the circumstances, the Independent Trustees may be satisfied with a fund's performance notwithstanding that it lags its benchmark index for certain periods.
The Independent Trustees recognize that shareholders evaluate performance on a net basis (after fees and expenses) over their own holding periods, for which one-, three-, and five-year periods are often used as a proxy. For this reason, the performance information reviewed by the Board also included net cumulative calendar year total return information for the fund and its benchmark index for the most recent one- and three-year periods. No performance peer group information was considered by the Board as Fidelity advised the Board that the peer group, which is created by a third-party provider, includes a number of actively-managed funds. The Independent Trustees recognize that shareholders who are not investing through a tax-advantaged retirement account also consider tax consequences in evaluating performance.
Based on its review, the Board concluded that the nature, extent, and quality of services provided to the fund under the Advisory Contracts should continue to benefit the shareholders of the fund.
Competitiveness of Management Fee and Total Expense Ratio . The Board considered the fund's management fee and total expense ratio compared to selected groups of competitive funds and classes (referred to as "mapped groups" below) for the purpose of facilitating the Trustees' competitive analysis of management fees and total expenses. Fidelity creates "mapped groups" by combining similar investment objective categories (as classified by Lipper) that have comparable investment mandates. Combining funds with similar investment objective categories aids the Board's comparison of management fees and total expense ratios by broadening the competitive group used for such comparison.
Management Fee . The Board considered two proprietary management fee comparisons for the 12-month (or shorter) periods shown in basis points (BP) in the chart below. The group of Lipper funds used by the Board for management fee comparisons is referred to below as the "Total Mapped Group." The Total Mapped Group comparison focuses on a fund's standing in terms of gross management fees before expense reimbursements or caps relative to the total universe of funds with comparable investment mandates, regardless of whether their management fee structures also are comparable. Funds with comparable investment mandates offer exposure to similar types of securities. Funds with comparable management fee structures have similar management fee contractual arrangements (e.g., flat rate charged for advisory services, all-inclusive fee rate, etc.). "TMG %" represents the percentage of funds in the Total Mapped Group that had management fees that were lower than the fund's. For example, a hypothetical TMG % of 20% would mean that 80% of the funds in the Total Mapped Group had higher, and 20% had lower, management fees than the fund. The fund's actual TMG %s and the number of funds in the Total Mapped Group are in the chart below. The "Asset-Sized Peer Group" (ASPG) comparison focuses on a fund's standing relative to a subset of non-Fidelity funds within the Total Mapped Group that are similar in size and management fee structure. For example, if a fund is in the first quartile of the ASPG, the fund's management fee ranks in the least expensive or lowest 25% of funds in the ASPG. The ASPG represents at least 15% of the funds in the Total Mapped Group with comparable asset size and management fee structures, subject to a minimum of 50 funds (or all funds in the Total Mapped Group if fewer than 50). Additional information, such as the ASPG quartile in which the fund's management fee rate ranked, is also included in the chart and was considered by the Board.
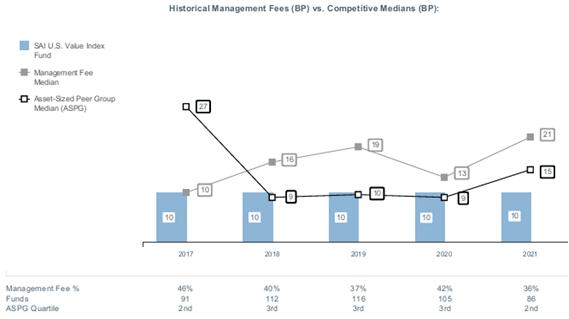
The Board noted that the fund's management fee rate ranked below the median of its Total Mapped Group and below the median of its ASPG for 2021.
Based on its review, the Board concluded that the fund's management fee is fair and reasonable in light of the services that the fund receives and the other factors considered.
Total Expense Ratio . In its review of the fund's total expense ratio, the Board considered the fund's management fee rate as well as other fund expenses, such as custodial, legal, and audit fees. The Board also noted that Fidelity may agree to waive fees or reimburse expenses from time to time, and the extent to which, if any, it has done so for the fund. The fund is compared to those funds and classes in the Total Mapped Group (used by the Board for management fee comparisons) that have a similar sales load structure. The Board also considered a total expense ASPG comparison, which focuses on the total expenses of the fund relative to a subset of non-Fidelity funds within the similar sales load structure group that are similar in size and management fee structure. The total expense ASPG is limited to 15 larger and 15 smaller classes of different funds, where possible. The total expense ASPG comparison excludes performance adjustments and fund-paid 12b-1 fees to eliminate variability in expenses relating to these items.
The Board noted that the fund's total net expense ratio ranked below the similar sales load structure group competitive median and above the ASPG competitive median for 2021. The Board considered that, when compared to a subset of the ASPG that excludes competitor funds that have an in a fund complex that has service model not generally comparable to that of Fidelity and virtually all other industry participants, the fund would not be above the ASPG competitive median for 2021.
The Board further considered that FMR has contractually agreed to reimburse the fund to the extent that total operating expenses, with certain exceptions, as a percentage of its average net assets, exceed 0.15% through November 30, 2023.
Fees Charged to Other Clients . The Board also considered fee structures and other information with respect to clients of Fidelity and Geode, such as other funds advised or subadvised by Fidelity or Geode, pension plan clients, and other institutional clients with similar mandates. The Board noted that a joint ad hoc committee created by it and the boards of other Fidelity funds periodically reviews and compares Fidelity's institutional investment advisory business with its business of providing services to the Fidelity funds and also noted the most recent findings of the committee. The Board noted that the committee's review included a consideration of the differences in services provided, fees charged, and costs incurred, as well as competition in the markets serving the different categories of clients.
Based on its review of total expense ratios and fees charged to other Fidelity clients, the Board concluded that the fund's total expense ratio was reasonable in light of the services that the fund and its shareholders receive and the other factors considered.
Costs of the Services and Profitability . The Board considered the revenues earned and the expenses incurred by Fidelity in conducting the business of developing, marketing, distributing, managing, administering and servicing the fund and servicing the fund's shareholders. The Board also considered the level of Fidelity's profits in respect of all the Fidelity funds.
On an annual basis, Fidelity presents to the Board information about the profitability of its relationships with the fund. Fidelity calculates profitability information for each fund, as well as aggregate profitability information for groups of Fidelity funds and all Fidelity funds, using a series of detailed revenue and cost allocation methodologies which originate with the books and records of Fidelity on which Fidelity's audited financial statements are based. The Audit Committee of the Board reviews any significant changes from the prior year's methodologies and the full Board approves such changes.
A public accounting firm has been engaged annually by the Board as part of the Board's assessment of Fidelity's profitability analysis. The engagement includes the review and assessment of the methodologies used by Fidelity in determining the revenues and expenses attributable to Fidelity's mutual fund business, and completion of agreed-upon procedures in respect of the mathematical accuracy of certain fund profitability information and its conformity to established allocation methodologies. After considering the reports issued under the engagement and information provided by Fidelity, the Board concluded that while other allocation methods may also be reasonable, Fidelity's profitability methodologies are reasonable in all material respects.
The Board also reviewed Fidelity's and Geode's non-fund businesses and potential indirect benefits such businesses may have received as a result of their association with Fidelity's mutual fund business (i.e., fall-out benefits) as well as cases where Fidelity's and Geode's affiliates may benefit from the funds' business. The Board considered areas where potential indirect benefits to the Fidelity funds from their relationships with Fidelity may exist. The Board's consideration of these matters was informed by the findings of a joint ad hoc committee created by it and the boards of other Fidelity funds to evaluate potential fall-out benefits.
The Board considered the costs of the services provided by and the profits realized by Fidelity in connection with the operation of the fund and was satisfied that the profitability was not excessive.
The Board also considered information regarding the profitability of Geode's relationship with the fund.
Economies of Scale . The Board considered whether there have been economies of scale in respect of the management of the Fidelity funds, whether the Fidelity funds (including the fund) have appropriately benefited from any such economies of scale, and whether there is potential for realization of any further economies of scale. The Board considered the extent to which the fund will benefit from economies of scale as assets grow through increased services to the fund, through waivers or reimbursements, or through fee or expense ratio reductions. The Board also noted that a committee (the Economies of Scale Committee) created by it and the boards of other Fidelity funds periodically analyzes whether Fidelity attains economies of scale in respect of the management and servicing of the Fidelity funds, whether the Fidelity funds have appropriately benefited from such economies of scale, and whether there is potential for realization of any further economies of scale.
The Board concluded, taking into account the analysis of the Economies of Scale Committee, that economies of scale, if any, are being appropriately shared between fund shareholders and Fidelity.
Additional Information Requested by the Board . In order to develop fully the factual basis for consideration of the Fidelity funds' advisory contracts, the Board requested and received additional information on certain topics, including: (i) Fidelity's fund profitability methodology, profitability trends for certain funds, the allocation of various costs to different funds, and the impact of certain factors on fund profitability results; (ii) portfolio manager changes that have occurred during the past year and the amount of the investment that each portfolio manager has made in the Fidelity fund(s) that he or she manages; (iii) the extent to which current market conditions have affected retention and recruitment of personnel; (iv) the arrangements with and compensation paid to certain fund sub-advisers on behalf of the Fidelity funds and the treatment of such compensation within Fidelity's fund profitability methodology; (v) the terms of the funds' various management fee structures, including the basic group fee and the terms of Fidelity's voluntary expense limitation arrangements; (vi) Fidelity's transfer agent, pricing and bookkeeping fees, expense and service structures for different funds and classes relative to competitive trends; (vii) the impact on fund profitability of recent industry trends, such as the growth in passively managed funds and the changes in flows for different types of funds; (viii) the types of management fee and total expense comparisons provided, and the challenges and limitations associated with such information; and (ix) explanations regarding the relative total expense ratios and management fees of certain funds and classes, total expense and management fee competitive trends, and methodologies for total expense and management fee competitive comparisons. In addition, the Board considered its discussions with Fidelity regarding Fidelity's efforts to maintain the continuous investment and shareholder services necessary for the funds during the current pandemic and economic circumstances.
Based on its evaluation of all of the conclusions noted above, and after considering all factors it believed relevant, the Board concluded that the advisory and sub-advisory fee arrangements are fair and reasonable and that the fund's Advisory Contracts should be renewed.
The Securities and Exchange Commission adopted Rule 22e-4 under the Investment Company Act of 1940 (the Liquidity Rule) to promote effective liquidity risk management throughout the open-end investment company industry, thereby reducing the risk that funds will be unable to meet their redemption obligations and mitigating dilution of the interests of fund shareholders.
The Fund has adopted and implemented a liquidity risk management program (the Program) reasonably designed to assess and manage the Fund's liquidity risk and to comply with the requirements of the Liquidity Rule. The Fund's Board of Trustees (the Board) has designated the Fund's investment adviser as administrator of the Program. The Fidelity advisers have established a Liquidity Risk Management Committee (the LRM Committee) to manage the Program for each of the Fidelity Funds. The LRM Committee monitors the adequacy and effectiveness of implementation of the Program and on a periodic basis assesses each Fund's liquidity risk based on a variety of factors including (1) the Fund's investment strategy, (2) portfolio liquidity and cash flow projections during normal and reasonably foreseeable stressed conditions, (3) shareholder redemptions, (4) borrowings and other funding sources and (5) certain factors specific to ETFs including the effect of the Fund's prices and spreads, market participants, and basket compositions on the overall liquidity of the Fund's portfolio, as applicable.
In accordance with the Program, each of the Fund's portfolio investments is classified into one of four defined liquidity categories based on a determination of a reasonable expectation for how long it would take to convert the investment to cash (or sell or dispose of the investment) without significantly changing its market value.
- Highly liquid investments - cash or convertible to cash within three business days or less
- Moderately liquid investments - convertible to cash in three to seven calendar days
- Less liquid investments - can be sold or disposed of, but not settled, within seven calendar days
- Illiquid investments - cannot be sold or disposed of within seven calendar days
Liquidity classification determinations take into account a variety of factors including various market, trading and investment-specific considerations, as well as market depth, and generally utilize analysis from a third-party liquidity metrics service.
The Liquidity Rule places a 15% limit on a fund's illiquid investments and requires funds that do not primarily hold assets that are highly liquid investments to determine and maintain a minimum percentage of the fund's net assets to be invested in highly liquid investments (highly liquid investment minimum or HLIM). The Program includes provisions reasonably designed to comply with the 15% limit on illiquid investments and for determining, periodically reviewing and complying with the HLIM requirement as applicable.
At a recent meeting of the Fund's Board of Trustees, the LRM Committee provided a written report to the Board pertaining to the operation, adequacy, and effectiveness of the Program for the period December 1, 2021 through November 30, 2022. The report concluded that the Program is operating effectively and is reasonably designed to assess and manage the Fund's liquidity risk.
1.9885516.105
USV-SANN-0423
Fidelity® SAI Real Estate Index Fund
Semi-Annual Report
January 31, 2023
Offered exclusively to certain clients of the Adviser, or its affiliates, including Strategic Advisers LLC (Strategic Advisers) - not available for sale to the general public. Fidelity ® SAI is a product name of Fidelity ® funds dedicated to certain programs affiliated with Strategic Advisers.
Contents
To view a fund's proxy voting guidelines and proxy voting record for the 12-month period ended June 30, visit http://www.fidelity.com/proxyvotingresults or visit the Securities and Exchange Commission's (SEC) web site at http://www.sec.gov.
You may also call 1-800-544-3455 to request a free copy of the proxy voting guidelines.
The funds or securities referred to herein are not sponsored, endorsed, or promoted by MSCI, and MSCI bears no liability with respect to any such funds or securities or any index on which such funds or securities are based. The prospectus contains a more detailed description of the limited relationship MSCI has with Fidelity and any related funds.
Standard & Poor's, S&P and S&P 500 are registered service marks of The McGraw-Hill Companies, Inc. and have been licensed for use by Fidelity Distributors Corporation.
Other third-party marks appearing herein are the property of their respective owners.
All other marks appearing herein are registered or unregistered trademarks or service marks of FMR LLC or an affiliated company. © 2023 FMR LLC. All rights reserved.
This report and the financial statements contained herein are submitted for the general information of the shareholders of the Fund. This report is not authorized for distribution to prospective investors in the Fund unless preceded or accompanied by an effective prospectus.
A fund files its complete schedule of portfolio holdings with the SEC for the first and third quarters of each fiscal year on Form N-PORT. Forms N-PORT are available on the SEC's web site at http://www.sec.gov. A fund's Forms N-PORT may be reviewed and copied at the SEC's Public Reference Room in Washington, DC. Information regarding the operation of the SEC's Public Reference Room may be obtained by calling 1-800-SEC-0330.
For a complete list of a fund's portfolio holdings, view the most recent holdings listing, semiannual report, or annual report on Fidelity's web site at http://www.fidelity.com, http://www.institutional.fidelity.com, or http://www.401k.com, as applicable.
NOT FDIC INSURED •MAY LOSE VALUE •NO BANK GUARANTEE
Neither the Fund nor Fidelity Distributors Corporation is a bank.
Top Holdings (% of Fund's net assets) |
| |
| Prologis (REIT), Inc. | 8.7 | |
| American Tower Corp. | 7.5 | |
| Equinix, Inc. | 4.9 | |
| Crown Castle International Corp. | 4.6 | |
| Public Storage | 3.5 | |
| Simon Property Group, Inc. | 3.1 | |
| Realty Income Corp. | 3.0 | |
| Welltower, Inc. | 2.5 | |
| VICI Properties, Inc. | 2.4 | |
| Digital Realty Trust, Inc. | 2.4 | |
| | 42.6 | |
| |
| Top Five REIT Sectors (% of Fund's net assets) |
| |
| REITs - Diversified | 23.3 | |
| REITs - Warehouse/Industrial | 11.6 | |
| REITs - Management/Investment | 10.9 | |
| REITs - Apartments | 10.6 | |
| REITs - Storage | 7.9 | |
| |
Asset Allocation (% of Fund's net assets) |
|
Foreign investments - 0.2% |
Percentages shown as 0.0% may reflect amounts less than 0.05%. |
|
Showing Percentage of Net Assets
| Common Stocks - 99.6% |
| | | Shares | Value ($) |
| Equity Real Estate Investment Trusts (REITs) - 94.6% | | | |
| REITs - Apartments - 10.6% | | | |
| American Homes 4 Rent Class A | | 19,912 | 682,782 |
| Apartment Investment & Management Co. Class A | | 9,299 | 69,835 |
| AvalonBay Communities, Inc. | | 8,901 | 1,579,393 |
| Camden Property Trust (SBI) | | 6,476 | 797,908 |
| Centerspace (a) | | 980 | 66,268 |
| Equity Residential (SBI) | | 22,747 | 1,447,847 |
| Essex Property Trust, Inc. | | 4,163 | 941,129 |
| Independence Realty Trust, Inc. | | 14,433 | 271,773 |
| Invitation Homes, Inc. | | 38,935 | 1,265,388 |
| Mid-America Apartment Communities, Inc. | | 7,371 | 1,228,893 |
| UDR, Inc. | | 20,270 | 863,299 |
| | | | 9,214,515 |
| REITs - Diversified - 23.3% | | | |
| Alexander & Baldwin, Inc. | | 4,479 | 89,670 |
| Apartment Income (REIT) Corp. | | 10,005 | 382,791 |
| Apple Hospitality (REIT), Inc. | | 13,841 | 245,401 |
| Armada Hoffler Properties, Inc. (a) | | 4,340 | 55,031 |
| Broadstone Net Lease, Inc. | | 10,911 | 197,598 |
| Cousins Properties, Inc. (a) | | 9,547 | 261,779 |
| Crown Castle International Corp. | | 26,823 | 3,972,755 |
| Digital Realty Trust, Inc. | | 18,118 | 2,076,685 |
| Elme Communities (SBI) | | 5,282 | 101,414 |
| EPR Properties | | 4,749 | 201,738 |
| Equinix, Inc. | | 5,780 | 4,266,391 |
| Gaming & Leisure Properties | | 16,160 | 865,530 |
| Gladstone Commercial Corp. | | 2,584 | 43,902 |
| Gladstone Land Corp. | | 2,111 | 41,249 |
| Global Net Lease, Inc. | | 6,368 | 95,202 |
| InvenTrust Properties Corp. | | 4,263 | 106,021 |
| Lamar Advertising Co. Class A | | 5,516 | 587,675 |
| Necessity Retail (REIT), Inc./The | | 8,198 | 55,992 |
| NexPoint Diversified Real Estate Trust | | 330 | 4,320 |
| NexPoint Residential Trust, Inc. | | 1,483 | 74,892 |
| One Liberty Properties, Inc. (a) | | 1,143 | 27,558 |
| Outfront Media, Inc. | | 9,218 | 183,438 |
| Potlatch Corp. (a) | | 5,184 | 253,757 |
| Safehold, Inc. (a) | | 1,792 | 62,648 |
| SBA Communications Corp. Class A | | 6,842 | 2,035,700 |
| Store Capital Corp. | | 15,827 | 509,788 |
| Uniti Group, Inc. (a) | | 16,069 | 105,895 |
| VICI Properties, Inc. | | 61,178 | 2,091,064 |
| Vornado Realty Trust | | 10,367 | 252,851 |
| WP Carey, Inc. | | 12,235 | 1,046,460 |
| | | | 20,295,195 |
| REITs - Health Care - 7.2% | | | |
| CareTrust (REIT), Inc. | | 6,168 | 127,801 |
| Community Healthcare Trust, Inc. | | 1,611 | 69,080 |
| Diversified Healthcare Trust (SBI) | | 16,511 | 13,067 |
| Global Medical REIT, Inc. | | 4,692 | 52,691 |
| Healthcare Trust of America, Inc. | | 24,173 | 520,445 |
| Healthpeak Properties, Inc. | | 34,260 | 941,465 |
| LTC Properties, Inc. | | 2,447 | 93,353 |
| Medical Properties Trust, Inc. (a) | | 38,399 | 497,267 |
| Physicians Realty Trust | | 14,166 | 224,673 |
| Sabra Health Care REIT, Inc. | | 14,654 | 197,829 |
| Universal Health Realty Income Trust (SBI) (a) | | 885 | 48,507 |
| Ventas, Inc. | | 25,299 | 1,310,741 |
| Welltower, Inc. | | 28,805 | 2,161,527 |
| | | | 6,258,446 |
| REITs - Health Care Facilities - 0.7% | | | |
| National Health Investors, Inc. | | 2,898 | 170,489 |
| Omega Healthcare Investors, Inc. | | 14,992 | 441,364 |
| | | | 611,853 |
| REITs - Hotels - 2.6% | | | |
| Chatham Lodging Trust | | 2,863 | 40,683 |
| DiamondRock Hospitality Co. | | 13,552 | 130,506 |
| Host Hotels & Resorts, Inc. | | 45,412 | 856,016 |
| Park Hotels & Resorts, Inc. | | 14,846 | 218,385 |
| Pebblebrook Hotel Trust | | 8,434 | 138,318 |
| RLJ Lodging Trust | | 10,472 | 131,633 |
| Ryman Hospitality Properties, Inc. | | 3,325 | 308,859 |
| Service Properties Trust | | 10,661 | 94,990 |
| Summit Hotel Properties, Inc. | | 6,888 | 58,686 |
| Sunstone Hotel Investors, Inc. | | 13,710 | 150,673 |
| Xenia Hotels & Resorts, Inc. (a) | | 7,289 | 108,606 |
| | | | 2,237,355 |
| REITs - Industrial Buildings - 0.5% | | | |
| Stag Industrial, Inc. | | 11,518 | 410,041 |
| REITs - Management/Investment - 10.9% | | | |
| American Assets Trust, Inc. | | 3,316 | 94,373 |
| American Tower Corp. | | 29,264 | 6,537,285 |
| Empire State Realty Trust, Inc. (a) | | 9,090 | 75,811 |
| iStar Financial, Inc. | | 5,400 | 50,112 |
| LXP Industrial Trust (REIT) | | 18,140 | 209,517 |
| National Retail Properties, Inc. | | 10,957 | 518,814 |
| Rayonier, Inc. (a) | | 9,252 | 336,680 |
| UMH Properties, Inc. | | 3,479 | 62,344 |
| Weyerhaeuser Co. | | 47,407 | 1,632,223 |
| | | | 9,517,159 |
| REITs - Manufactured Homes - 2.3% | | | |
| Equity Lifestyle Properties, Inc. | | 11,183 | 802,716 |
| Sun Communities, Inc. | | 7,746 | 1,215,038 |
| | | | 2,017,754 |
| REITs - Office Buildings - 0.1% | | | |
| Office Properties Income Trust | | 3,239 | 55,581 |
| REITs - Office Property - 4.8% | | | |
| Alexandria Real Estate Equities, Inc. | | 9,861 | 1,585,057 |
| Boston Properties, Inc. | | 9,473 | 706,117 |
| Brandywine Realty Trust (SBI) | | 11,575 | 75,932 |
| City Office REIT, Inc. | | 2,690 | 26,470 |
| Corporate Office Properties Trust (SBI) | | 7,057 | 198,090 |
| Douglas Emmett, Inc. (a) | | 11,373 | 190,498 |
| Easterly Government Properties, Inc. (a) | | 5,533 | 89,856 |
| Equity Commonwealth | | 6,660 | 169,963 |
| Franklin Street Properties Corp. | | 6,753 | 20,799 |
| Highwoods Properties, Inc. (SBI) | | 6,837 | 207,640 |
| Hudson Pacific Properties, Inc. | | 9,253 | 105,392 |
| JBG SMITH Properties | | 7,112 | 143,236 |
| Kilroy Realty Corp. | | 6,703 | 275,091 |
| Orion Office (REIT), Inc. | | 3,638 | 35,107 |
| Paramount Group, Inc. | | 10,912 | 70,382 |
| Piedmont Office Realty Trust, Inc. Class A | | 7,926 | 84,016 |
| SL Green Realty Corp. | | 4,078 | 167,810 |
| Veris Residential, Inc. (a)(b) | | 4,894 | 84,666 |
| | | | 4,236,122 |
| REITs - Regional Malls - 3.4% | | | |
| CBL & Associates Properties, Inc. | | 805 | 21,453 |
| Simon Property Group, Inc. | | 20,840 | 2,677,106 |
| Tanger Factory Outlet Centers, Inc. | | 6,655 | 127,177 |
| The Macerich Co. | | 13,735 | 188,719 |
| | | | 3,014,455 |
| REITs - Shopping Centers - 7.3% | | | |
| Acadia Realty Trust (SBI) | | 6,115 | 94,966 |
| Alexanders, Inc. | | 140 | 33,219 |
| Brixmor Property Group, Inc. | | 18,892 | 444,529 |
| Federal Realty Investment Trust (SBI) | | 4,547 | 507,127 |
| Kimco Realty Corp. | | 39,251 | 881,577 |
| Kite Realty Group Trust | | 14,020 | 304,234 |
| Phillips Edison & Co., Inc. | | 7,287 | 244,260 |
| Realty Income Corp. | | 38,540 | 2,614,168 |
| Regency Centers Corp. | | 9,849 | 656,239 |
| Retail Opportunity Investments Corp. | | 7,986 | 126,418 |
| RPT Realty (a) | | 5,734 | 60,092 |
| Saul Centers, Inc. | | 878 | 37,587 |
| SITE Centers Corp. | | 12,554 | 171,362 |
| Urban Edge Properties | | 7,560 | 119,070 |
| Urstadt Biddle Properties, Inc. Class A | | 1,854 | 34,818 |
| | | | 6,329,666 |
| REITs - Single Tenant - 1.4% | | | |
| Agree Realty Corp. | | 4,782 | 356,881 |
| Essential Properties Realty Trust, Inc. | | 8,633 | 219,969 |
| Four Corners Property Trust, Inc. | | 5,086 | 146,273 |
| Getty Realty Corp. | | 2,485 | 90,529 |
| NETSTREIT Corp. (a) | | 3,321 | 66,852 |
| Spirit Realty Capital, Inc. | | 8,518 | 373,770 |
| | | | 1,254,274 |
| REITs - Storage - 7.9% | | | |
| CubeSmart | | 14,337 | 656,491 |
| Extra Space Storage, Inc. | | 8,546 | 1,348,815 |
| Iron Mountain, Inc. | | 18,404 | 1,004,490 |
| Life Storage, Inc. | | 5,403 | 583,740 |
| National Storage Affiliates Trust | | 5,716 | 233,213 |
| Public Storage | | 10,038 | 3,054,965 |
| | | | 6,881,714 |
| REITs - Warehouse/Industrial - 11.6% | | | |
| Americold Realty Trust | | 17,039 | 535,195 |
| EastGroup Properties, Inc. | | 2,669 | 449,059 |
| First Industrial Realty Trust, Inc. (a) | | 8,412 | 448,780 |
| Industrial Logistics Properties Trust | | 4,687 | 20,670 |
| Plymouth Industrial REIT, Inc. | | 2,758 | 61,724 |
| Prologis (REIT), Inc. | | 58,634 | 7,580,203 |
| Rexford Industrial Realty, Inc. | | 10,642 | 675,448 |
| Terreno Realty Corp. | | 4,886 | 314,805 |
| | | | 10,085,884 |
TOTAL EQUITY REAL ESTATE INVESTMENT TRUSTS (REITS) | | | 82,420,014 |
| Real Estate Management & Development - 5.0% | | | |
| Diversified Real Estate Activities - 0.1% | | | |
| The RMR Group, Inc. | | 909 | 28,197 |
| The St. Joe Co. | | 2,104 | 99,098 |
| | | | 127,295 |
| Real Estate Development - 0.3% | | | |
| Forestar Group, Inc. (b) | | 1,179 | 17,544 |
| Howard Hughes Corp. (b) | | 2,406 | 205,689 |
| | | | 223,233 |
| Real Estate Operating Companies - 0.4% | | | |
| Digitalbridge Group, Inc. | | 9,699 | 143,545 |
| FRP Holdings, Inc. (b) | | 304 | 17,076 |
| Kennedy-Wilson Holdings, Inc. | | 7,616 | 136,174 |
| WeWork, Inc. (a)(b) | | 13,221 | 21,021 |
| | | | 317,816 |
| Real Estate Services - 4.2% | | | |
| Anywhere Real Estate, Inc. (b) | | 7,311 | 61,997 |
| CBRE Group, Inc. (b) | | 20,642 | 1,765,097 |
| Compass, Inc. (b) | | 15,866 | 63,781 |
| Cushman & Wakefield PLC (b) | | 9,282 | 133,939 |
| Doma Holdings, Inc. Class A (b) | | 11,443 | 8,125 |
| Douglas Elliman, Inc. | | 5,220 | 24,325 |
| eXp World Holdings, Inc. (a) | | 4,923 | 76,750 |
| Jones Lang LaSalle, Inc. (b) | | 3,076 | 568,660 |
| Marcus & Millichap, Inc. | | 1,539 | 55,773 |
| Newmark Group, Inc. | | 10,461 | 89,651 |
| Offerpad Solutions, Inc. (a)(b) | | 6,552 | 6,011 |
| Opendoor Technologies, Inc. (a)(b) | | 28,248 | 61,863 |
| RE/MAX Holdings, Inc. | | 1,168 | 26,642 |
| Redfin Corp. (a)(b) | | 7,110 | 53,183 |
| Zillow Group, Inc. Class C (a)(b) | | 14,156 | 625,837 |
| | | | 3,621,634 |
| REITs - Shopping Centers - 0.0% | | | |
| Seritage Growth Properties (a)(b) | | 2,315 | 28,127 |
TOTAL REAL ESTATE MANAGEMENT & DEVELOPMENT | | | 4,318,105 |
| TOTAL COMMON STOCKS (Cost $70,710,881) | | | 86,738,119 |
| | | | |
| U.S. Treasury Obligations - 0.1% |
| | | Principal Amount (c) | Value ($) |
U.S. Treasury Bills, yield at date of purchase 4.65% 6/29/23 (d) (Cost $98,124) | | 100,000 | 98,123 |
| | | | |
| Money Market Funds - 2.5% |
| | | Shares | Value ($) |
| Fidelity Cash Central Fund 4.38% (e) | | 168,505 | 168,538 |
| Fidelity Securities Lending Cash Central Fund 4.38% (e)(f) | | 2,042,459 | 2,042,663 |
| TOTAL MONEY MARKET FUNDS (Cost $2,211,201) | | | 2,211,201 |
| | | | |
| TOTAL INVESTMENT IN SECURITIES - 102.2% (Cost $73,020,206) | 89,047,443 |
NET OTHER ASSETS (LIABILITIES) - (2.2)% | (1,918,256) |
| NET ASSETS - 100.0% | 87,129,187 |
| | |
| Futures Contracts |
| | Number of contracts | Expiration Date | Notional Amount ($) | Value ($) | Unrealized Appreciation/ (Depreciation) ($) |
| Purchased | | | | | |
| | | | | | |
| Equity Index Contracts | | | | | |
| CBOT Dow Jones U.S. Real Estate Index Contracts (United States) | 3 | Mar 2023 | 108,120 | 8,461 | 8,461 |
| CME E-mini S&P MidCap 400 Index Contracts (United States) | 1 | Mar 2023 | 266,290 | 22,486 | 22,486 |
| | | | | | |
| TOTAL FUTURES CONTRACTS | | | | | 30,947 |
| The notional amount of futures purchased as a percentage of Net Assets is 0.4% |
Legend
| (a) | Security or a portion of the security is on loan at period end. |
| (c) | Amount is stated in United States dollars unless otherwise noted. |
| (d) | Security or a portion of the security was pledged to cover margin requirements for futures contracts. At period end, the value of securities pledged amounted to $28,456. |
| (e) | Affiliated fund that is generally available only to investment companies and other accounts managed by Fidelity Investments. The rate quoted is the annualized seven-day yield of the fund at period end. A complete unaudited listing of the fund's holdings as of its most recent quarter end is available upon request. In addition, each Fidelity Central Fund's financial statements are available on the SEC's website or upon request. |
| (f) | Investment made with cash collateral received from securities on loan. |
Affiliated Central Funds
Fiscal year to date information regarding the Fund's investments in Fidelity Central Funds, including the ownership percentage, is presented below.
| Affiliate | Value, beginning of period ($) | Purchases ($) | Sales Proceeds ($) | Dividend Income ($) | Realized Gain (loss) ($) | Change in Unrealized appreciation (depreciation) ($) | Value, end of period ($) | % ownership, end of period |
| Fidelity Cash Central Fund 4.38% | 1,155,031 | 4,205,207 | 5,191,700 | 7,247 | - | - | 168,538 | 0.0% |
| Fidelity Securities Lending Cash Central Fund 4.38% | 3,415,032 | 8,156,394 | 9,528,763 | 4,805 | - | - | 2,042,663 | 0.0% |
| Total | 4,570,063 | 12,361,601 | 14,720,463 | 12,052 | - | - | 2,211,201 | |
| | | | | | | | | |
Amounts in the dividend income column in the above table include any capital gain distributions from underlying funds, which are presented in the corresponding line item in the Statement of Operations, if applicable.
Amount for Fidelity Securities Lending Cash Central Fund represents the income earned on investing cash collateral, less rebates paid to borrowers and any lending agent fees associated with the loan, plus any premium payments received for lending certain types of securities.
Amounts included in the purchases and sales proceeds columns may include in-kind transactions, if applicable.
Investment Valuation
The following is a summary of the inputs used, as of January 31, 2023, involving the Fund's assets and liabilities carried at fair value. The inputs or methodology used for valuing securities may not be an indication of the risk associated with investing in those securities. For more information on valuation inputs, and their aggregation into the levels used below, please refer to the Investment Valuation section in the accompanying Notes to Financial Statements.
| Valuation Inputs at Reporting Date: |
| Description | Total ($) | Level 1 ($) | Level 2 ($) | Level 3 ($) |
Investments in Securities: | | | | |
|
| Common Stocks | 86,738,119 | 86,738,119 | - | - |
|
| U.S. Treasury Obligations | 98,123 | - | 98,123 | - |
|
| Money Market Funds | 2,211,201 | 2,211,201 | - | - |
| Total Investments in Securities: | 89,047,443 | 88,949,320 | 98,123 | - |
Derivative Instruments: | | | | |
|
| Assets | | | | |
Futures Contracts | 30,947 | 30,947 | - | - |
| Total Assets | 30,947 | 30,947 | - | - |
| Total Derivative Instruments: | 30,947 | 30,947 | - | - |
Value of Derivative Instruments
The following table is a summary of the Fund's value of derivative instruments by primary risk exposure as of January 31, 2023. For additional information on derivative instruments, please refer to the Derivative Instruments section in the accompanying Notes to Financial Statements.
Primary Risk Exposure / Derivative Type | Value |
| Asset ($) | Liability ($) |
| Equity Risk | | |
Futures Contracts (a) | 30,947 | 0 |
| Total Equity Risk | 30,947 | 0 |
| Total Value of Derivatives | 30,947 | 0 |
(a)Reflects gross cumulative appreciation (depreciation) on futures contracts as presented in the Schedule of Investments. In the Statement of Assets and Liabilities, the period end daily variation margin is included in receivable or payable for daily variation margin on futures contracts, and the net cumulative appreciation (depreciation) is included in Total accumulated earnings (loss).
| Statement of Assets and Liabilities |
| | | | January 31, 2023 (Unaudited) |
| | | | | |
| Assets | | | | |
| Investment in securities, at value (including securities loaned of $2,026,386) - See accompanying schedule: | | | | |
Unaffiliated issuers (cost $70,809,005) | $ | 86,836,242 | | |
Fidelity Central Funds (cost $2,211,201) | | 2,211,201 | | |
| | | | | |
| | | | | |
| Total Investment in Securities (cost $73,020,206) | | | $ | 89,047,443 |
| Cash | | | | 41,491 |
| Dividends receivable | | | | 78,387 |
| Distributions receivable from Fidelity Central Funds | | | | 1,653 |
| Receivable for daily variation margin on futures contracts | | | | 8,200 |
| Prepaid expenses | | | | 322 |
| Receivable from investment adviser for expense reductions | | | | 18,440 |
| Other receivables | | | | 10,049 |
Total assets | | | | 89,205,985 |
| Liabilities | | | | |
| Accrued management fee | $ | 4,849 | | |
| Other payables and accrued expenses | | 28,868 | | |
| Collateral on securities loaned | | 2,043,081 | | |
| Total Liabilities | | | | 2,076,798 |
| Net Assets | | | $ | 87,129,187 |
| Net Assets consist of: | | | | |
| Paid in capital | | | $ | 65,955,804 |
| Total accumulated earnings (loss) | | | | 21,173,383 |
| Net Assets | | | $ | 87,129,187 |
Net Asset Value , offering price and redemption price per share ($87,129,187 ÷ 11,698,200 shares) | | | $ | 7.45 |
| Statement of Operations |
| | | | Six months ended January 31, 2023 (Unaudited) |
| Investment Income | | | | |
| Dividends | | | $ | 2,289,750 |
| Interest | | | | 739 |
| Income from Fidelity Central Funds (including $4,805 from security lending) | | | | 12,052 |
| Total Income | | | | 2,302,541 |
| Expenses | | | | |
| Management fee | $ | 49,630 | | |
| Custodian fees and expenses | | 5,132 | | |
| Independent trustees' fees and expenses | | 415 | | |
| Registration fees | | 20,953 | | |
| Audit | | 27,437 | | |
| Legal | | 468 | | |
| Interest | | 19,640 | | |
| Miscellaneous | | 1,226 | | |
| Total expenses before reductions | | 124,901 | | |
| Expense reductions | | (54,208) | | |
| Total expenses after reductions | | | | 70,693 |
| Net Investment income (loss) | | | | 2,231,848 |
| Realized and Unrealized Gain (Loss) | | | | |
| Net realized gain (loss) on: | | | | |
| Investment Securities: | | | | |
| Unaffiliated issuers | | 36,438,265 | | |
| Futures contracts | | (15,943) | | |
| Total net realized gain (loss) | | | | 36,422,322 |
| Change in net unrealized appreciation (depreciation) on: | | | | |
| Investment Securities: | | | | |
| Unaffiliated issuers | | (71,925,568) | | |
| Futures contracts | | (123,109) | | |
| Total change in net unrealized appreciation (depreciation) | | | | (72,048,677) |
| Net gain (loss) | | | | (35,626,355) |
| Net increase (decrease) in net assets resulting from operations | | | $ | (33,394,507) |
| Statement of Changes in Net Assets |
| |
| | Six months ended January 31, 2023 (Unaudited) | | Year ended July 31, 2022 |
| Increase (Decrease) in Net Assets | | | | |
| Operations | | | | |
| Net investment income (loss) | $ | 2,231,848 | $ | 14,994,478 |
| Net realized gain (loss) | | 36,422,322 | | 64,885,646 |
| Change in net unrealized appreciation (depreciation) | | (72,048,677) | | (111,893,551) |
| Net increase (decrease) in net assets resulting from operations | | (33,394,507) | | (32,013,427) |
| Distributions to shareholders | | (64,713,259) | | (38,757,231) |
| Share transactions | | | | |
| Proceeds from sales of shares | | 1,407,824 | | 60,936,662 |
| Reinvestment of distributions | | 64,704,858 | | 38,748,944 |
| Cost of shares redeemed | | (287,662,387) | | (369,953,984) |
Net increase (decrease) in net assets resulting from share transactions | | (221,549,705) | | (270,268,378) |
| Total increase (decrease) in net assets | | (319,657,471) | | (341,039,036) |
| | | | | |
| Net Assets | | | | |
| Beginning of period | | 406,786,658 | | 747,825,694 |
| End of period | $ | 87,129,187 | $ | 406,786,658 |
| | | | | |
| Other Information | | | | |
| Shares | | | | |
| Sold | | 128,760 | | 4,808,281 |
| Issued in reinvestment of distributions | | 7,441,997 | | 2,912,448 |
| Redeemed | | (29,823,123) | | (30,563,748) |
| Net increase (decrease) | | (22,252,366) | | (22,843,019) |
| | | | | |
Financial Highlights
| Fidelity® SAI Real Estate Index Fund |
| |
| | Six months ended (Unaudited) January 31, 2023 | | Years ended July 31, 2022 | | 2021 | | 2020 | | 2019 | | 2018 |
Selected Per-Share Data | | | | | | | | | | | | |
| Net asset value, beginning of period | $ | 11.98 | $ | 13.17 | $ | 9.67 | $ | 11.88 | $ | 11.11 | $ | 11.08 |
| Income from Investment Operations | | | | | | | | | | | | |
Net investment income (loss) A,B | | .15 | | .29 | | .28 | | .36 | | .37 | | .33 |
| Net realized and unrealized gain (loss) | | (.95) | | (.79) | | 3.48 | | (2.20) | | .79 | | .08 |
| Total from investment operations | | (.80) | | (.50) | | 3.76 | | (1.84) | | 1.16 | | .41 |
| Distributions from net investment income | | (.34) | | (.21) | | (.26) | | (.30) | | (.37) | | (.33) |
| Distributions from net realized gain | | (3.39) | | (.48) | | - | | (.07) | | (.02) | | (.05) |
| Total distributions | | (3.73) | | (.69) | | (.26) | | (.37) | | (.39) | | (.38) |
| Net asset value, end of period | $ | 7.45 | $ | 11.98 | $ | 13.17 | $ | 9.67 | $ | 11.88 | $ | 11.11 |
Total Return C,D | | (5.61)% | | (4.24)% | | 39.72% | | (16.04)% | | 10.79% | | 3.87% |
Ratios to Average Net Assets B,E,F | | | | | | | | | | | | |
| Expenses before reductions | | .17% G | | .09% | | .09% | | .16% | | .15% | | .15% |
| Expenses net of fee waivers, if any | | .10% G | | .07% | | .07% | | .07% | | .07% | | .07% |
| Expenses net of all reductions | | .10% G | | .07% | | .07% | | .07% | | .07% | | .07% |
| Net investment income (loss) | | 3.09% G | | 2.28% | | 2.58% | | 3.52% | | 3.31% | | 3.11% |
| Supplemental Data | | | | | | | | | | | | |
| Net assets, end of period (000 omitted) | $ | 87,129 | $ | 406,787 | $ | 747,826 | $ | 572,828 | $ | 104,696 | $ | 95,437 |
Portfolio turnover rate H | | 5% G | | 13% | | 53% | | 82% | | 9% | | 8% |
A Calculated based on average shares outstanding during the period.
B Net investment income (loss) is affected by the timing of the declaration of dividends by any underlying mutual funds or exchange-traded funds (ETFs). Net investment income (loss) of any mutual funds or ETFs is not included in the Fund's net investment income (loss) ratio.
C Total returns for periods of less than one year are not annualized.
D Total returns would have been lower if certain expenses had not been reduced during the applicable periods shown.
E Fees and expenses of any underlying mutual funds or exchange-traded funds (ETFs) are not included in the Fund's expense ratio. The Fund indirectly bears its proportionate share of these expenses. For additional expense information related to investments in Fidelity Central Funds, please refer to the "Investments in Fidelity Central Funds" note found in the Notes to Financial Statements section of the most recent Annual or Semi-Annual report.
F Expense ratios reflect operating expenses of the class. Expenses before reductions do not reflect amounts reimbursed, waived, or reduced through arrangements with the investment adviser, brokerage services, or other offset arrangements, if applicable, and do not represent the amount paid by the class during periods when reimbursements, waivers or reductions occur.
G Annualized.
H Amount does not include the portfolio activity of any underlying mutual funds or exchange-traded funds (ETFs).
For the period ended January 31, 2023
1. Organization.
Fidelity SAI Real Estate Index Fund (the Fund) is a fund of Fidelity Salem Street Trust (the Trust) and is authorized to issue an unlimited number of shares. Shares are offered exclusively to certain clients of Fidelity Management & Research Company LLC (FMR) or its affiliates. The Trust is registered under the Investment Company Act of 1940, as amended (the 1940 Act), as an open-end management investment company organized as a Massachusetts business trust.
2. Investments in Fidelity Central Funds.
Funds may invest in Fidelity Central Funds, which are open-end investment companies generally available only to other investment companies and accounts managed by the investment adviser and its affiliates. The Schedule of Investments lists any Fidelity Central Funds held as an investment as of period end, but does not include the underlying holdings of each Fidelity Central Fund. An investing fund indirectly bears its proportionate share of the expenses of the underlying Fidelity Central Funds.
Based on its investment objective, each Fidelity Central Fund may invest or participate in various investment vehicles or strategies that are similar to those of the investing fund. These strategies are consistent with the investment objectives of the investing fund and may involve certain economic risks which may cause a decline in value of each of the Fidelity Central Funds and thus a decline in the value of the investing fund.
| Fidelity Central Fund | Investment Manager | Investment Objective | Investment Practices | Expense Ratio A |
| Fidelity Money Market Central Funds | Fidelity Management & Research Company LLC (FMR) | Each fund seeks to obtain a high level of current income consistent with the preservation of capital and liquidity. | Short-term Investments | Less than .005% |
A Expenses expressed as a percentage of average net assets and are as of each underlying Central Fund's most recent annual or semi-annual shareholder report.
A complete unaudited list of holdings for each Fidelity Central Fund is available upon request or at the Securities and Exchange Commission website at www.sec.gov. In addition, the financial statements of the Fidelity Central Funds which contain the significant accounting policies (including investment valuation policies) of those funds, and are not covered by the Report of Independent Registered Public Accounting Firm, are available on the Securities and Exchange Commission website or upon request.
3. Significant Accounting Policies.
The Fund is an investment company and applies the accounting and reporting guidance of the Financial Accounting Standards Board (FASB) Accounting Standards Codification Topic 946 Financial Services - Investment Companies . The financial statements have been prepared in conformity with accounting principles generally accepted in the United States of America (GAAP), which require management to make certain estimates and assumptions at the date of the financial statements. Actual results could differ from those estimates. Subsequent events, if any, through the date that the financial statements were issued have been evaluated in the preparation of the financial statements. The Fund's Schedule of Investments lists any underlying mutual funds or exchange-traded funds (ETFs) but does not include the underlying holdings of these funds. The following summarizes the significant accounting policies of the Fund:
Investment Valuation. Investments are valued as of 4:00 p.m. Eastern time on the last calendar day of the period. The Board of Trustees (the Board) has designated the Fund's investment adviser as the valuation designee responsible for the fair valuation function and performing fair value determinations as needed. The investment adviser has established a Fair Value Committee (the Committee) to carry out the day-to-day fair valuation responsibilities and has adopted policies and procedures to govern the fair valuation process and the activities of the Committee. In accordance with these fair valuation policies and procedures, which have been approved by the Board, the Fund attempts to obtain prices from one or more third party pricing services or brokers to value its investments. When current market prices, quotations or currency exchange rates are not readily available or reliable, investments will be fair valued in good faith by the Committee, in accordance with the policies and procedures. Factors used in determining fair value vary by investment type and may include market or investment specific events, transaction data, estimated cash flows, and market observations of comparable investments. The frequency that the fair valuation procedures are used cannot be predicted and they may be utilized to a significant extent. The Committee manages the Fund's fair valuation practices and maintains the fair valuation policies and procedures. The Fund's investment adviser reports to the Board information regarding the fair valuation process and related material matters.
The Fund categorizes the inputs to valuation techniques used to value its investments into a disclosure hierarchy consisting of three levels as shown below:
Level 1 - unadjusted quoted prices in active markets for identical investments
Level 2 - other significant observable inputs (including quoted prices for similar investments, interest rates, prepayment speeds, etc.)
Level 3 - unobservable inputs (including the Fund's own assumptions based on the best information available)
Valuation techniques used to value the Fund's investments by major category are as follows:
Equity securities, including restricted securities, for which market quotations are readily available, are valued at the last reported sale price or official closing price as reported by a third party pricing service on the primary market or exchange on which they are traded and are categorized as Level 1 in the hierarchy. In the event there were no sales during the day or closing prices are not available, securities are valued at the last quoted bid price or may be valued using the last available price and are generally categorized as Level 2 in the hierarchy. For foreign equity securities, when market or security specific events arise, comparisons to the valuation of American Depositary Receipts (ADRs), futures contracts, ETFs and certain indexes as well as quoted prices for similar securities may be used and would be categorized as Level 2 in the hierarchy. For equity securities, including restricted securities, where observable inputs are limited, assumptions about market activity and risk are used and these securities may be categorized as Level 3 in the hierarchy.
Debt securities, including restricted securities, are valued based on evaluated prices received from third party pricing services or from brokers who make markets in such securities. U.S. government and government agency obligations are valued by pricing services who utilize matrix pricing which considers yield or price of bonds of comparable quality, coupon, maturity and type or by broker-supplied prices. When independent prices are unavailable or unreliable, debt securities may be valued utilizing pricing methodologies which consider similar factors that would be used by third party pricing services. Debt securities are generally categorized as Level 2 in the hierarchy but may be Level 3 depending on the circumstances.
Futures contracts are valued at the settlement price established each day by the board of trade or exchange on which they are traded and are categorized as Level 1 in the hierarchy. Investments in open-end mutual funds, including the Fidelity Central Funds, are valued at their closing net asset value (NAV) each business day and are categorized as Level 1 in the hierarchy.
Changes in valuation techniques may result in transfers in or out of an assigned level within the disclosure hierarchy. The aggregate value of investments by input level as of January 31, 2023 is included at the end of the Fund's Schedule of Investments.
Investment Transactions and Income. For financial reporting purposes, the Fund's investment holdings and NAV include trades executed through the end of the last business day of the period. The NAV per share for processing shareholder transactions is calculated as of the close of business of the New York Stock Exchange (NYSE), normally 4:00 p.m. Eastern time and includes trades executed through the end of the prior business day. Gains and losses on securities sold are determined on the basis of identified cost. Commissions paid to certain brokers with whom the investment adviser, or its affiliates, places trades on behalf of a fund include an amount in addition to trade execution, which may be rebated back to a fund. Any such rebates are included in net realized gain (loss) on investments in the Statement of Operations. Dividend income is recorded on the ex-dividend date, except for certain dividends from foreign securities where the ex-dividend date may have passed, which are recorded as soon as the Fund is informed of the ex-dividend date. Non-cash dividends included in dividend income, if any, are recorded at the fair market value of the securities received. Income and capital gain distributions from Fidelity Central Funds, if any, are recorded on the ex-dividend date. Certain distributions received by the Fund represent a return of capital or capital gain. The Fund determines the components of these distributions subsequent to the ex-dividend date, based upon receipt of tax filings or other correspondence relating to the underlying investment. These distributions are recorded as a reduction of cost of investments and/or as a realized gain. Interest income is accrued as earned and includes coupon interest and amortization of premium and accretion of discount on debt securities as applicable.
Expenses. Expenses directly attributable to a fund are charged to that fund. Expenses attributable to more than one fund are allocated among the respective funds on the basis of relative net assets or other appropriate methods. Expenses included in the accompanying financial statements reflect the expenses of that fund and do not include any expenses associated with any underlying mutual funds or exchange-traded funds. Although not included in a fund's expenses, a fund indirectly bears its proportionate share of these expenses through the net asset value of each underlying mutual fund or exchange-traded fund. Expense estimates are accrued in the period to which they relate and adjustments are made when actual amounts are known.
Income Tax Information and Distributions to Shareholders. Each year, the Fund intends to qualify as a regulated investment company under Subchapter M of the Internal Revenue Code, including distributing substantially all of its taxable income and realized gains. As a result, no provision for U.S. Federal income taxes is required. The Fund files a U.S. federal tax return, in addition to state and local tax returns as required. The Fund's federal income tax returns are subject to examination by the Internal Revenue Service (IRS) for a period of three fiscal years after they are filed. State and local tax returns may be subject to examination for an additional fiscal year depending on the jurisdiction.
Distributions are declared and recorded on the ex-dividend date. Income and capital gain distributions are determined in accordance with income tax regulations, which may differ from GAAP.
Capital accounts within the financial statements are adjusted for permanent book-tax differences. These adjustments have no impact on net assets or the results of operations. Capital accounts are not adjusted for temporary book-tax differences which will reverse in a subsequent period.
Book-tax differences are primarily due to futures contracts, capital loss carryforwards and losses deferred due to wash sales and excise tax regulations.
As of period end, the cost and unrealized appreciation (depreciation) in securities, and derivatives if applicable, for federal income tax purposes were as follows:
| Gross unrealized appreciation | $19,199,244 |
| Gross unrealized depreciation | (3,545,784) |
| Net unrealized appreciation (depreciation) | $15,653,460 |
| Tax cost | $73,424,930 |
Capital loss carryforwards are only available to offset future capital gains of the Fund to the extent provided by regulations and may be limited. The capital loss carryforward information presented below, including any applicable limitation is estimated as of fiscal period end and is subject to adjustment.
| No expiration | |
Short-term | $(820,212) |
Long-term | (11,418,962) |
| Total capital loss carryforward | $(12,239,174) |
Due to large redemptions and then subscriptions in a prior period, approximately $12,239,174 of the Fund's realized capital losses are subject to limitation. Due to this limitation, the Fund will only be permitted to use approximately $70,663 of those capital losses per year to offset capital gains.
The Fund elected to defer to its next fiscal year approximately $3,814,831 of capital losses recognized during the period November 1, 2021 to July 31, 2022.
4. Derivative Instruments.
Risk Exposures and the Use of Derivative Instruments. The Fund's investment objectives allow for various types of derivative instruments, including futures contracts. Derivatives are investments whose value is primarily derived from underlying assets, indices or reference rates and may be transacted on an exchange or over-the-counter (OTC). Derivatives may involve a future commitment to buy or sell a specified asset based on specified terms, to exchange future cash flows at periodic intervals based on a notional principal amount, or for one party to make one or more payments upon the occurrence of specified events in exchange for periodic payments from the other party.
Derivatives were used to increase returns and to manage exposure to certain risks as defined below. The success of any strategy involving derivatives depends on analysis of numerous economic factors, and if the strategies for investment do not work as intended, the objectives may not be achieved.
Derivatives were used to increase or decrease exposure to the following risk(s):
| | |
| Equity Risk | Equity risk relates to the fluctuations in the value of financial instruments as a result of changes in market prices (other than those arising from interest rate risk or foreign exchange risk), whether caused by factors specific to an individual investment, its issuer, or all factors affecting all instruments traded in a market or market segment. |
Funds are also exposed to additional risks from investing in derivatives, such as liquidity risk and counterparty credit risk. Liquidity risk is the risk that a fund will be unable to close out the derivative in the open market in a timely manner. Counterparty credit risk is the risk that the counterparty will not be able to fulfill its obligation to a fund. Counterparty credit risk related to exchange-traded contracts may be mitigated by the protection provided by the exchange on which they trade.
Investing in derivatives may involve greater risks than investing in the underlying assets directly and, to varying degrees, may involve risk of loss in excess of any initial investment and collateral received and amounts recognized in the Statement of Assets and Liabilities. In addition, there may be the risk that the change in value of the derivative contract does not correspond to the change in value of the underlying instrument.
Futures Contracts. A futures contract is an agreement between two parties to buy or sell a specified underlying instrument for a fixed price at a specified future date. Futures contracts were used to manage exposure to the stock market.
Upon entering into a futures contract, a fund is required to deposit either cash or securities (initial margin) with a clearing broker in an amount equal to a certain percentage of the face value of the contract. Futures contracts are marked-to-market daily and subsequent daily payments are made or received by a fund depending on the daily fluctuations in the value of the futures contracts and are recorded as unrealized appreciation or (depreciation). This receivable and/or payable, if any, is included in daily variation margin on futures contracts in the Statement of Assets and Liabilities. Realized gain or (loss) is recorded upon the expiration or closing of a futures contract. The net realized gain (loss) and change in net unrealized appreciation (depreciation) on futures contracts during the period is presented in the Statement of Operations.
Any open futures contracts at period end are presented in the Schedule of Investments under the caption "Futures Contracts". The notional amount at value reflects each contract's exposure to the underlying instrument or index at period end, and is representative of volume of activity during the period unless an average notional amount is presented. Any securities deposited to meet initial margin requirements are identified in the Schedule of Investments. Any cash deposited to meet initial margin requirements is presented as segregated cash with brokers for derivative instruments in the Statement of Assets and Liabilities.
5. Purchases and Sales of Investments.
Purchases and sales of securities, other than short-term securities U.S. government securities and in-kind transactions, as applicable, are noted in the table below.
| | Purchases ($) | Sales ($) |
| Fidelity SAI Real Estate Index Fund | 4,327,179 | 284,939,224 |
6. Fees and Other Transactions with Affiliates.
Management Fee. Fidelity Management & Research Company LLC (the investment adviser) and its affiliates provide the Fund with investment management related services for which the Fund pays a monthly management fee that is based on an annual rate of .07% of the Fund's average net assets.
Sub-Adviser. Geode Capital Management, LLC (Geode), serves as sub-adviser for the Fund. Geode provides discretionary investment advisory services to the Fund and is paid by the investment adviser for providing these services.
Interfund Lending Program. Pursuant to an Exemptive Order issued by the Securities and Exchange Commission (the SEC), the Fund, along with other registered investment companies having management contracts with Fidelity Management & Research Company LLC (FMR), or other affiliated entities of FMR, may participate in an interfund lending program. This program provides an alternative credit facility allowing the Fund to borrow from, or lend money to, other participating affiliated funds. At period end, there were no interfund loans outstanding. Activity in this program during the period for which loans were outstanding was as follows:
| | Borrower or Lender | Average Loan Balance | Weighted Average Interest Rate | Interest Expense |
| Fidelity SAI Real Estate Index Fund | Borrower | $ 17,649,000 | 2.56% | $2,515 |
Interfund Trades. Funds may purchase from or sell securities to other Fidelity Funds under procedures adopted by the Board. The procedures have been designed to ensure these interfund trades are executed in accordance with Rule 17a-7 of the 1940 Act. Any interfund trades are included within the respective purchases and sales amounts shown in the Purchases and Sales of Investments note. During the period, there were no interfund trades.
7. Committed Line of Credit.
Certain Funds participate with other funds managed by the investment adviser or an affiliate in a $4.25 billion credit facility (the "line of credit") to be utilized for temporary or emergency purposes to fund shareholder redemptions or for other short-term liquidity purposes. The participating funds have agreed to pay commitment fees on their pro-rata portion of the line of credit, which are reflected in Miscellaneous expenses on the Statement of Operations, and are listed below. During the period, there were no borrowings on this line of credit.
| | Amount |
| Fidelity SAI Real Estate Index Fund | $414 |
8. Security Lending.
Funds lend portfolio securities from time to time in order to earn additional income. Lending agents are used, including National Financial Services (NFS), an affiliate of the investment adviser. Pursuant to a securities lending agreement, NFS will receive a fee, which is capped at 9.9% of a fund's daily lending revenue, for its services as lending agent. A fund may lend securities to certain qualified borrowers, including NFS. On the settlement date of the loan, a fund receives collateral (in the form of U.S. Treasury obligations, letters of credit and/or cash) against the loaned securities and maintains collateral in an amount not less than 100% of the market value of the loaned securities during the period of the loan. The market value of the loaned securities is determined at the close of business of a fund and any additional required collateral is delivered to a fund on the next business day. A fund or borrower may terminate the loan at any time, and if the borrower defaults on its obligation to return the securities loaned because of insolvency or other reasons, a fund may apply collateral received from the borrower against the obligation. A fund may experience delays and costs in recovering the securities loaned. Any cash collateral received is invested in the Fidelity Securities Lending Cash Central Fund. Any loaned securities are identified as such in the Schedule of Investments, and the value of loaned securities and cash collateral at period end, as applicable, are presented in the Statement of Assets and Liabilities. Security lending income represents the income earned on investing cash collateral, less rebates paid to borrowers and any lending agent fees associated with the loan, plus any premium payments received for lending certain types of securities. Security lending income is presented in the Statement of Operations as a component of income from Fidelity Central Funds. Affiliated security lending activity, if any, was as follows:
| | Total Security Lending Fees Paid to NFS | Security Lending Income From Securities Loaned to NFS | Value of Securities Loaned to NFS at Period End |
| Fidelity SAI Real Estate Index Fund | $437 | $15 | $9,900 |
9. Bank Borrowings.
The Fund is permitted to have bank borrowings for temporary or emergency purposes to fund shareholder redemptions or for other short-term liquidity requirements. The Fund has established borrowing arrangements with certain banks. The interest rate on the borrowings is the bank's base rate, as revised from time to time. Any open loans, including accrued interest, at period end are presented under the caption "Notes payable" in the Statement of Assets and Liabilities, if applicable. Activity in this program during the period for which loans were outstanding was as follows:
| | Average Loan Balance | Weighted Average Interest Rate | Interest Expense |
| Fidelity SAI Real Estate Index Fund | $35,785,667 | 2.87% | $17,125 |
10. Expense Reductions.
The investment adviser contractually agreed to reimburse the Fund to the extent annual operating expenses exceeded .07% of average net assets. This reimbursement will remain in place through November 30, 2023. Some expenses, for example the compensation of the independent Trustees, and certain miscellaneous expenses such as proxy and shareholder meeting expenses, are excluded from this reimbursement. During the period this reimbursement reduced the Fund's expenses by $54,047.
Through arrangements with the Fund's custodian, credits realized as a result of certain uninvested cash balances were used to reduce the Fund's expenses by $161.
11. Other.
A fund's organizational documents provide former and current trustees and officers with a limited indemnification against liabilities arising in connection with the performance of their duties to the fund. In the normal course of business, a fund may also enter into contracts that provide general indemnifications. A fund's maximum exposure under these arrangements is unknown as this would be dependent on future claims that may be made against a fund. The risk of material loss from such claims is considered remote.
At the end of the period, the following mutual funds managed by the investment adviser or its affiliates were the owners of record of 10% or more of the total outstanding shares.
| | Strategic Advisers Small-Mid Cap Fund |
| Fidelity SAI Real Estate Index Fund | 99% |
12. Risk and Uncertainties.
Many factors affect a fund's performance. Developments that disrupt global economies and financial markets, such as pandemics, epidemics, outbreaks of infectious diseases, war, terrorism, and environmental disasters, may significantly affect a fund's investment performance. The effects of these developments to a fund will be impacted by the types of securities in which a fund invests, the financial condition, industry, economic sector, and geographic location of an issuer, and a fund's level of investment in the securities of that issuer.
As a shareholder, you incur two types of costs: (1) transaction costs, which may include sales charges (loads) on purchase payments or redemption proceeds, as applicable and (2) ongoing costs, which generally include management fees, distribution and/or service (12b-1) fees and other Fund expenses. This Example is intended to help you understand your ongoing costs (in dollars) of investing in a fund and to compare these costs with the ongoing costs of investing in other mutual funds.
| The Example is based on an investment of $1,000 invested at the beginning of the period and held for the entire period (August 1, 2022 to January 31, 2023). |
Actual Expenses
The first line of the accompanying table provides information about actual account values and actual expenses. You may use the information in this line, together with the amount you invested, to estimate the expenses that you paid over the period. Simply divide your account value by $1,000.00 (for example, an $8,600 account value divided by $1,000.00 = 8.6), then multiply the result by the number in the first line for a class/Fund under the heading entitled "Expenses Paid During Period" to estimate the expenses you paid on your account during this period. If any fund is a shareholder of any underlying mutual funds or exchange-traded funds (ETFs) (the Underlying Funds), such fund indirectly bears its proportional share of the expenses of the Underlying Funds in addition to the direct expenses incurred presented in the table. These fees and expenses are not included in the annualized expense ratio used to calculate the expense estimate in the table below.
Hypothetical Example for Comparison Purposes
The second line of the accompanying table provides information about hypothetical account values and hypothetical expenses based on the actual expense ratio and an assumed rate of return of 5% per year before expenses, which is not the actual return. The hypothetical account values and expenses may not be used to estimate the actual ending account balance or expenses you paid for the period. You may use this information to compare the ongoing costs of investing in the Fund and other funds. To do so, compare this 5% hypothetical example with the 5% hypothetical examples that appear in the shareholder reports of the other funds. If any fund is a shareholder of any Underlying Funds, such fund indirectly bears its proportional share of the expenses of the Underlying Funds in addition to the direct expenses as presented in the table. These fees and expenses are not included in the annualized expense ratio used to calculate the expense estimate in the table below.
Please note that the expenses shown in the table are meant to highlight your ongoing costs only and do not reflect any transaction costs. Therefore, the second line of the table is useful in comparing ongoing costs only, and will not help you determine the relative total costs of owning different funds. In addition, if these transactional costs were included, your costs would have been higher.
| | | | | Annualized Expense Ratio- A | | Beginning Account Value August 1, 2022 | | Ending Account Value January 31, 2023 | | Expenses Paid During Period- C August 1, 2022 to January 31, 2023 |
| | | | | | | | | | |
| Fidelity® SAI Real Estate Index Fund | | | | .10% | | | | | | |
| Actual | | | | | | $ 1,000 | | $ 943.90 | | $ .49 |
Hypothetical- B | | | | | | $ 1,000 | | $ 1,024.70 | | $ .51 |
| |
A Annualized expense ratio reflects expenses net of applicable fee waivers.
B 5% return per year before expenses
C Expenses are equal to the annualized expense ratio, multiplied by the average account value over the period, multiplied by 184/ 365 (to reflect the one-half year period). The fees and expenses of any Underlying Funds are not included in each annualized expense ratio.
Board Approval of Investment Advisory Contracts and Management Fees
Fidelity SAI Real Estate Index Fund
Each year, the Board of Trustees, including the Independent Trustees (together, the Board), votes on the renewal of the management contract with Fidelity Management & Research Company LLC (FMR) and the sub-advisory agreement (Sub-Advisory Agreement) for the fund with Geode Capital Management, LLC (Geode) (together, the Advisory Contracts). FMR and Geode are referred to herein as the Investment Advisers. The Board, assisted by the advice of fund counsel and Independent Trustees' counsel, requests and considers a broad range of information relevant to the renewal of the Advisory Contracts throughout the year.
The Board meets regularly and, at each of its meetings, covers an extensive agenda of topics and materials and considers factors that are relevant to its annual consideration of the renewal of the fund's Advisory Contracts, including the services and support provided to the fund and its shareholders. The Board has established four standing committees (Committees) - Operations, Audit, Fair Valuation, and Governance and Nominating - each composed of and chaired by Independent Trustees with varying backgrounds, to which the Board has assigned specific subject matter responsibilities in order to enhance effective decision-making by the Board. The Operations Committee, of which all the Independent Trustees are members, meets regularly throughout the year and requests, receives and considers, among other matters, information related to the annual consideration of the renewal of the fund's Advisory Contracts before making its recommendation to the Board. The Board also meets as needed to review matters specifically related to the Board's annual consideration of the renewal of the Advisory Contracts. Members of the Board may also meet from time to time with trustees of other Fidelity funds through joint ad hoc committees to discuss certain matters relevant to all of the Fidelity funds.
At its September 2022 meeting, the Board unanimously determined to renew the fund's Advisory Contracts. In reaching its determination, the Board considered all factors it believed relevant, including (i) the nature, extent, and quality of the services provided to the fund and its shareholders (including the investment performance of the fund); (ii) the competitiveness relative to peer funds of the fund's management fee and total expense ratio; (iii) the total costs of the services provided by and the profits realized by Fidelity and Geode from their respective relationships with the fund; and (iv) the extent to which, if any, economies of scale exist and are realized as the fund grows, and whether any economies of scale are appropriately shared with fund shareholders.
In considering whether to renew the Advisory Contracts for the fund, the Board reached a determination, with the assistance of fund counsel and Independent Trustees' counsel and through the exercise of its business judgment, that the renewal of the Advisory Contracts was in the best interests of the fund and its shareholders and that the compensation payable under the Advisory Contracts was fair and reasonable. The Board's decision to renew the Advisory Contracts was not based on any single factor, but rather was based on a comprehensive consideration of all the information provided to the Board at its meetings throughout the year. The Board, in reaching its determination to renew the Advisory Contracts, was aware that shareholders of the fund have a broad range of investment choices available to them, including a wide choice among funds offered by Fidelity's competitors, and that the fund's shareholders, who have the opportunity to review and weigh the disclosure provided by the fund in its prospectus and other public disclosures, have chosen to invest in this fund, which is part of the Fidelity family of funds.
Nature, Extent, and Quality of Services Provided. The Board considered staffing as it relates to the fund, including the backgrounds of investment personnel of Fidelity and Geode, and also considered the fund's investment objective, strategies, and related investment philosophy. The Independent Trustees also had discussions with senior management of Fidelity's investment operations and investment groups and with senior management of Geode. The Board considered the structure of the investment personnel compensation programs and whether the structures provide appropriate incentives to act in the best interests of the fund. The Board also considered the steps Fidelity and Geode had taken to ensure the continued provision of high quality services to the Fidelity funds throughout the COVID-19 pandemic, including the expansion of staff in client facing positions to maintain service levels in periods of high volumes and volatility.
The Trustees also discussed with representatives of Fidelity, at meetings throughout the year, Fidelity's role in, among other things, overseeing compliance with federal securities laws and other applicable requirements by Geode with respect to the fund and monitoring and overseeing the performance and investment capabilities of Geode. The Trustees considered that the Board had received from Fidelity periodic reports about its oversight and due diligence processes, as well as periodic reports regarding the performance of Geode.
The Board also considered the nature, extent and quality of services provided by Geode. The Trustees noted that under the Sub-Advisory Agreement, subject to oversight by Fidelity, Geode is responsible for, among other things, identifying investments and arranging for execution of portfolio transactions to implement the fund's investment strategy. In addition, the Trustees noted that Geode is responsible for providing such reporting as may be requested by Fidelity to fulfill its oversight responsibilities discussed above.
Resources Dedicated to Investment Management and Support Services. The Board reviewed the general qualifications and capabilities of Fidelity's and Geode's investment staffs, including their size, education, experience, and resources, as well as Fidelity's and Geode's approach to recruiting, training, managing, and compensating investment personnel. The Board noted the resources devoted to Fidelity's global investment organization and that Fidelity's and Geode's analysts have extensive resources, tools and capabilities that allow them to conduct quantitative and fundamental analysis, as well as credit analysis of issuers, counterparties, and guarantors. Further, the Board considered that Fidelity's and Geode's investment professionals have sufficient access to information and data so as to provide competitive investment results over time, and that those professionals also have access to sophisticated tools that permit them to assess portfolio construction and risk and performance attribution characteristics continuously. Additionally, in its deliberations, the Board considered Fidelity's and Geode's trading, risk management, compliance, cybersecurity, and technology and operations capabilities and resources, which are integral parts of the investment management process.
Shareholder and Administrative Services . The Board considered (i) the nature, extent, quality, and cost of advisory, administrative, and shareholder services performed by the Investment Advisers and their affiliates under the Advisory Contracts and by FMR's affiliates under separate agreements covering transfer agency, pricing and bookkeeping, and securities lending services for the fund; (ii) the nature and extent of the supervision of third party service providers, principally custodians, subcustodians, and pricing vendors; and (iii) the resources devoted to, and the record of compliance with, the fund's compliance policies and procedures. The Board also reviewed the allocation of fund brokerage, including allocations to brokers affiliated with the Investment Advisers.
The Board noted that the growth of fund assets over time across the complex allows Fidelity to reinvest in the development of services designed to enhance the value and convenience of the Fidelity funds as investment vehicles. These services include 24-hour access to account information and market information over the Internet and through telephone representatives, investor education materials and asset allocation tools. The Board also considered that it reviews customer service metrics such as telephone response times, continuity of services on the website and metrics addressing services at Fidelity Investor Centers.
Investment in a Large Fund Family . The Board considered the benefits to shareholders of investing in a Fidelity fund, including the benefits of investing in a fund that is part of a large family of funds offering a variety of investment disciplines and providing a large variety of mutual fund investor services. The Board noted that Fidelity had taken, or had made recommendations to the Board that resulted in the Fidelity funds taking, a number of actions over the previous year that benefited particular funds, including: (i) continuing to dedicate additional resources to Fidelity's investment research process, which includes meetings with management of issuers of securities in which the funds invest; (ii) continuing efforts to enhance Fidelity's global research capabilities; (iii) launching new funds, ETFs, and share classes with innovative structures, strategies and pricing and making other enhancements to meet investor needs; (iv) broadening eligibility requirements for certain funds and share classes; (v) reducing management fees and total expenses for certain funds and classes; (vi) lowering expenses for certain existing funds and classes by implementing or lowering expense caps; (vii) rationalizing product lines and gaining increased efficiencies from fund mergers and liquidations; (viii) continuing to develop, acquire and implement systems and technology to improve services to the funds and shareholders, strengthen information security, and increase efficiency; and (ix) continuing to implement enhancements to further strengthen Fidelity's product line to increase investors' probability of success in achieving their investment goals, including their retirement income goals.
Investment Performance . The Board considered whether the fund has operated in accordance with its investment objective, as well as its record of compliance with its investment restrictions and its performance history.
The Board took into account discussions that occur at Board meetings throughout the year with representatives of the Investment Advisers about fund investment performance. In this regard the Board noted that as part of regularly scheduled fund reviews and other reports to the Board on fund performance, the Board considers annualized return information for the fund for different time periods, measured against the securities market index the fund seeks to track. The Board also periodically considers the fund's tracking error versus its benchmark index.
In addition to reviewing absolute and relative fund performance, the Independent Trustees periodically consider the appropriateness of fund performance metrics in evaluating the results achieved. In general, the Independent Trustees believe that an index fund's performance should be evaluated based on gross performance (before fees and expenses but after transaction costs) compared to the fund's benchmark index, over appropriate time periods, taking into account relevant factors including the following: general market conditions; the characteristics of the fund's benchmark index; the extent to which statistical sampling is employed; any securities lending revenues; and fund cash flows and other factors. The Independent Trustees generally give greater weight to fund performance over longer time periods than over shorter time periods. Depending on the circumstances, the Independent Trustees may be satisfied with a fund's performance notwithstanding that it lags its benchmark index for certain periods.
The Independent Trustees recognize that shareholders evaluate performance on a net basis (after fees and expenses) over their own holding periods, for which one-, three-, and five-year periods are often used as a proxy. For this reason, the performance information reviewed by the Board also included net cumulative calendar year total return information for the fund and its benchmark index for the most recent one-, three-, and five-year periods. No performance peer group information was considered by the Board as Fidelity advised the Board that the peer group, which is created by a third-party provider, includes a number of actively-managed funds. The Independent Trustees recognize that shareholders who are not investing through a tax-advantaged retirement account also consider tax consequences in evaluating performance.
Based on its review, the Board concluded that the nature, extent, and quality of services provided to the fund under the Advisory Contracts should continue to benefit the shareholders of the fund.
Competitiveness of Management Fee and Total Expense Ratio. The Board considered the fund's management fee and total expense ratio compared to selected groups of competitive funds and classes (referred to as "mapped groups" below) for the purpose of facilitating the Trustees' competitive analysis of management fees and total expenses. Fidelity creates "mapped groups" by combining similar investment objective categories (as classified by Lipper) that have comparable investment mandates. Combining funds with similar investment objective categories aids the Board's comparison of management fees and total expense ratios by broadening the competitive group used for such comparison.
Management Fee . The Board considered two proprietary management fee comparisons for the 12-month periods shown in basis points (BP) in the chart below. The group of Lipper funds used by the Board for management fee comparisons is referred to below as the "Total Mapped Group." The Total Mapped Group comparison focuses on a fund's standing in terms of gross management fees before expense reimbursements or caps relative to the total universe of funds with comparable investment mandates, regardless of whether their management fee structures also are comparable. Funds with comparable investment mandates offer exposure to similar types of securities. Funds with comparable management fee structures have similar management fee contractual arrangements (e.g., flat rate charged for advisory services, all-inclusive fee rate, etc.). "TMG %" represents the percentage of funds in the Total Mapped Group that had management fees that were lower than the fund's. For example, a hypothetical TMG % of 20% would mean that 80% of the funds in the Total Mapped Group had higher, and 20% had lower, management fees than the fund. The fund's actual TMG %s and the number of funds in the Total Mapped Group are in the chart below. The "Asset-Sized Peer Group" (ASPG) comparison focuses on a fund's standing relative to a subset of non-Fidelity funds within the Total Mapped Group that are similar in size and management fee structure. For example, if a fund is in the first quartile of the ASPG, the fund's management fee ranks in the least expensive or lowest 25% of funds in the ASPG. The ASPG represents at least 15% of the funds in the Total Mapped Group with comparable asset size and management fee structures, subject to a minimum of 50 funds (or all funds in the Total Mapped Group if fewer than 50). Additional information, such as the ASPG quartile in which the fund's management fee rate ranked, is also included in the chart and was considered by the Board.

The Board noted that the fund's management fee rate ranked below the median of its Total Mapped Group and below the median of its ASPG for 2021.
At its September 2022 meeting, the Board also approved an amendment to the fund's sub-advisory agreement with Geode (effective October 1, 2022) that reduced the sub-advisory fee rate that FMR pays to Geode.
Based on its review, the Board concluded that the fund's management fee is fair and reasonable in light of the services that the fund receives and the other factors considered.
Total Expense Ratio . In its review of the fund's total expense ratio, the Board considered the fund's management fee rate as well as other fund expenses, such as custodial, legal, and audit fees. The Board also noted that Fidelity may agree to waive fees or reimburse expenses from time to time, and the extent to which, if any, it has done so for the fund. The fund is compared to those funds and classes in the Total Mapped Group (used by the Board for management fee comparisons) that have a similar sales load structure. The Board also considered a total expense ASPG comparison, which focuses on the total expenses of the fund relative to a subset of non-Fidelity funds within the similar sales load structure group that are similar in size and management fee structure. The total expense ASPG is limited to 15 larger and 15 smaller classes of different funds, where possible. The total expense ASPG comparison excludes performance adjustments and fund-paid 12b-1 fees to eliminate variability in expenses relating to these items.
The Board noted that the fund's total net expense ratio ranked below the similar sales load structure group competitive median and below the ASPG competitive median for 2021.
The Board further considered that FMR has contractually agreed to reimburse the fund to the extent that total operating expenses, with certain exceptions, as a percentage of its average net assets, exceed 0.07% through November 30, 2023.
Fees Charged to Other Clients . The Board also considered fee structures and other information with respect to clients of Fidelity and Geode, such as other funds advised or subadvised by Fidelity or Geode, pension plan clients, and other institutional clients with similar mandates. The Board noted that a joint ad hoc committee created by it and the boards of other Fidelity funds periodically reviews and compares Fidelity's institutional investment advisory business with its business of providing services to the Fidelity funds and also noted the most recent findings of the committee. The Board noted that the committee's review included a consideration of the differences in services provided, fees charged, and costs incurred, as well as competition in the markets serving the different categories of clients.
Based on its review of total expense ratios and fees charged to other Fidelity clients, the Board concluded that the fund's total expense ratio was reasonable in light of the services that the fund and its shareholders receive and the other factors considered.
Costs of the Services and Profitability. The Board considered the revenues earned and the expenses incurred by Fidelity in conducting the business of developing, marketing, distributing, managing, administering and servicing the fund and servicing the fund's shareholders. The Board also considered the level of Fidelity's profits in respect of all the Fidelity funds.
On an annual basis, Fidelity presents to the Board information about the profitability of its relationships with the fund. Fidelity calculates profitability information for each fund, as well as aggregate profitability information for groups of Fidelity funds and all Fidelity funds, using a series of detailed revenue and cost allocation methodologies which originate with the books and records of Fidelity on which Fidelity's audited financial statements are based. The Audit Committee of the Board reviews any significant changes from the prior year's methodologies and the full Board approves such changes.
A public accounting firm has been engaged annually by the Board as part of the Board's assessment of Fidelity's profitability analysis. The engagement includes the review and assessment of the methodologies used by Fidelity in determining the revenues and expenses attributable to Fidelity's mutual fund business, and completion of agreed-upon procedures in respect of the mathematical accuracy of certain fund profitability information and its conformity to established allocation methodologies. After considering the reports issued under the engagement and information provided by Fidelity, the Board concluded that while other allocation methods may also be reasonable, Fidelity's profitability methodologies are reasonable in all material respects.
The Board also reviewed Fidelity's and Geode's non-fund businesses and potential indirect benefits such businesses may have received as a result of their association with Fidelity's mutual fund business (i.e., fall-out benefits) as well as cases where Fidelity's and Geode's affiliates may benefit from the funds' business. The Board considered areas where potential indirect benefits to the Fidelity funds from their relationships with Fidelity may exist. The Board's consideration of these matters was informed by the findings of a joint ad hoc committee created by it and the boards of other Fidelity funds to evaluate potential fall-out benefits.
The Board considered the costs of the services provided by and the profits realized by Fidelity in connection with the operation of the fund and was satisfied that the profitability was not excessive.
The Board also considered information regarding the profitability of Geode's relationship with the fund.
Economies of Scale. The Board considered whether there have been economies of scale in respect of the management of the Fidelity funds, whether the Fidelity funds (including the fund) have appropriately benefited from any such economies of scale, and whether there is potential for realization of any further economies of scale. The Board considered the extent to which the fund will benefit from economies of scale as assets grow through increased services to the fund, through waivers or reimbursements, or through fee or expense ratio reductions. The Board also noted that a committee (the Economies of Scale Committee) created by it and the boards of other Fidelity funds periodically analyzes whether Fidelity attains economies of scale in respect of the management and servicing of the Fidelity funds, whether the Fidelity funds have appropriately benefited from such economies of scale, and whether there is potential for realization of any further economies of scale.
The Board concluded, taking into account the analysis of the Economies of Scale Committee, that economies of scale, if any, are being appropriately shared between fund shareholders and Fidelity.
Additional Information Requested by the Board. In order to develop fully the factual basis for consideration of the Fidelity funds' advisory contracts, the Board requested and received additional information on certain topics, including: (i) Fidelity's fund profitability methodology, profitability trends for certain funds, the allocation of various costs to different funds, and the impact of certain factors on fund profitability results; (ii) portfolio manager changes that have occurred during the past year and the amount of the investment that each portfolio manager has made in the Fidelity fund(s) that he or she manages; (iii) the extent to which current market conditions have affected retention and recruitment of personnel; (iv) the arrangements with and compensation paid to certain fund sub-advisers on behalf of the Fidelity funds and the treatment of such compensation within Fidelity's fund profitability methodology; (v) the terms of the funds' various management fee structures, including the basic group fee and the terms of Fidelity's voluntary expense limitation arrangements; (vi) Fidelity's transfer agent, pricing and bookkeeping fees, expense and service structures for different funds and classes relative to competitive trends; (vii) the impact on fund profitability of recent industry trends, such as the growth in passively managed funds and the changes in flows for different types of funds; (viii) the types of management fee and total expense comparisons provided, and the challenges and limitations associated with such information; and (ix) explanations regarding the relative total expense ratios and management fees of certain funds and classes, total expense and management fee competitive trends, and methodologies for total expense and management fee competitive comparisons. In addition, the Board considered its discussions with Fidelity regarding Fidelity's efforts to maintain the continuous investment and shareholder services necessary for the funds during the current pandemic and economic circumstances.
Based on its evaluation of all of the conclusions noted above, and after considering all factors it believed relevant, the Board concluded that the advisory and sub-advisory fee arrangements are fair and reasonable and that the fund's Advisory Contracts should be renewed.
The Securities and Exchange Commission adopted Rule 22e-4 under the Investment Company Act of 1940 (the Liquidity Rule) to promote effective liquidity risk management throughout the open-end investment company industry, thereby reducing the risk that funds will be unable to meet their redemption obligations and mitigating dilution of the interests of fund shareholders.
The Fund has adopted and implemented a liquidity risk management program (the Program) reasonably designed to assess and manage the Fund's liquidity risk and to comply with the requirements of the Liquidity Rule. The Fund's Board of Trustees (the Board) has designated the Fund's investment adviser as administrator of the Program. The Fidelity advisers have established a Liquidity Risk Management Committee (the LRM Committee) to manage the Program for each of the Fidelity Funds. The LRM Committee monitors the adequacy and effectiveness of implementation of the Program and on a periodic basis assesses each Fund's liquidity risk based on a variety of factors including (1) the Fund's investment strategy, (2) portfolio liquidity and cash flow projections during normal and reasonably foreseeable stressed conditions, (3) shareholder redemptions, (4) borrowings and other funding sources and (5) certain factors specific to ETFs including the effect of the Fund's prices and spreads, market participants, and basket compositions on the overall liquidity of the Fund's portfolio, as applicable.
In accordance with the Program, each of the Fund's portfolio investments is classified into one of four defined liquidity categories based on a determination of a reasonable expectation for how long it would take to convert the investment to cash (or sell or dispose of the investment) without significantly changing its market value.
- Highly liquid investments - cash or convertible to cash within three business days or less
- Moderately liquid investments - convertible to cash in three to seven calendar days
- Less liquid investments - can be sold or disposed of, but not settled, within seven calendar days
- Illiquid investments - cannot be sold or disposed of within seven calendar days
Liquidity classification determinations take into account a variety of factors including various market, trading and investment-specific considerations, as well as market depth, and generally utilize analysis from a third-party liquidity metrics service.
The Liquidity Rule places a 15% limit on a fund's illiquid investments and requires funds that do not primarily hold assets that are highly liquid investments to determine and maintain a minimum percentage of the fund's net assets to be invested in highly liquid investments (highly liquid investment minimum or HLIM). The Program includes provisions reasonably designed to comply with the 15% limit on illiquid investments and for determining, periodically reviewing and complying with the HLIM requirement as applicable.
At a recent meeting of the Fund's Board of Trustees, the LRM Committee provided a written report to the Board pertaining to the operation, adequacy, and effectiveness of the Program for the period December 1, 2021 through November 30, 2022. The report concluded that the Program is operating effectively and is reasonably designed to assess and manage the Fund's liquidity risk.
1.9870988.106
SV8-SANN-0423
Fidelity® SAI U.S. Quality Index Fund
Semi-Annual Report
January 31, 2023
Offered exclusively to certain clients of the Adviser, or its affiliates, including Strategic Advisers LLC (Strategic Advisers) - not available for sale to the general public. Fidelity ® SAI is a product name of Fidelity ® funds dedicated to certain programs affiliated with Strategic Advisers.
Contents
To view a fund's proxy voting guidelines and proxy voting record for the 12-month period ended June 30, visit http://www.fidelity.com/proxyvotingresults or visit the Securities and Exchange Commission's (SEC) web site at http://www.sec.gov.
You may also call 1-800-544-3455 to request a free copy of the proxy voting guidelines.
The funds or securities referred to herein are not sponsored, endorsed, or promoted by Fidelity Product Services LLC (FPS), and FPS bears no liability with respect to any such funds or securities or any index on which such funds or securities are based. The prospectus contains a more detailed description of the relationship between FPS and any related funds.
Standard & Poor's, S&P and S&P 500 are registered service marks of The McGraw-Hill Companies, Inc. and have been licensed for use by Fidelity Distributors Corporation.
Other third-party marks appearing herein are the property of their respective owners.
All other marks appearing herein are registered or unregistered trademarks or service marks of FMR LLC or an affiliated company. © 2023 FMR LLC. All rights reserved.
This report and the financial statements contained herein are submitted for the general information of the shareholders of the Fund. This report is not authorized for distribution to prospective investors in the Fund unless preceded or accompanied by an effective prospectus.
A fund files its complete schedule of portfolio holdings with the SEC for the first and third quarters of each fiscal year on Form N-PORT. Forms N-PORT are available on the SEC's web site at http://www.sec.gov. A fund's Forms N-PORT may be reviewed and copied at the SEC's Public Reference Room in Washington, DC. Information regarding the operation of the SEC's Public Reference Room may be obtained by calling 1-800-SEC-0330.
For a complete list of a fund's portfolio holdings, view the most recent holdings listing, semiannual report, or annual report on Fidelity's web site at http://www.fidelity.com, http://www.institutional.fidelity.com, or http://www.401k.com, as applicable.
NOT FDIC INSURED •MAY LOSE VALUE •NO BANK GUARANTEE
Neither the Fund nor Fidelity Distributors Corporation is a bank.
Top Holdings (% of Fund's net assets) |
| |
| Apple, Inc. | 8.7 | |
| Microsoft Corp. | 7.8 | |
| Alphabet, Inc. Class A | 5.9 | |
| Meta Platforms, Inc. Class A | 4.7 | |
| Visa, Inc. Class A | 4.2 | |
| MasterCard, Inc. Class A | 3.9 | |
| Procter & Gamble Co. | 3.8 | |
| The Coca-Cola Co. | 3.6 | |
| AbbVie, Inc. | 3.5 | |
| Pfizer, Inc. | 3.3 | |
| | 49.4 | |
| |
| Market Sectors (% of Fund's net assets) |
| |
| Information Technology | 36.1 | |
| Health Care | 23.8 | |
| Consumer Staples | 13.2 | |
| Communication Services | 11.4 | |
| Industrials | 4.9 | |
| Financials | 4.9 | |
| Consumer Discretionary | 2.1 | |
| Energy | 2.1 | |
| Real Estate | 0.9 | |
| Materials | 0.3 | |
| |
Asset Allocation (% of Fund's net assets) |
|
Foreign investments - 3.7% |
Percentages shown as 0.0% may reflect amounts less than 0.05%. |
|
Showing Percentage of Net Assets
| Common Stocks - 99.7% |
| | | Shares | Value ($) |
| COMMUNICATION SERVICES - 11.4% | | | |
| Entertainment - 0.8% | | | |
| Activision Blizzard, Inc. | | 1,228,498 | 94,066,092 |
| Interactive Media & Services - 10.6% | | | |
| Alphabet, Inc. Class A (a) | | 6,739,029 | 666,085,626 |
| Meta Platforms, Inc. Class A (a) | | 3,504,625 | 522,083,986 |
| | | | 1,188,169,612 |
TOTAL COMMUNICATION SERVICES | | | 1,282,235,704 |
| CONSUMER DISCRETIONARY - 2.1% | | | |
| Household Durables - 0.3% | | | |
| NVR, Inc. (a) | | 6,288 | 33,137,760 |
| Specialty Retail - 1.8% | | | |
| AutoZone, Inc. (a) | | 40,349 | 98,405,159 |
| O'Reilly Automotive, Inc. (a) | | 131,996 | 104,587,031 |
| | | | 202,992,190 |
TOTAL CONSUMER DISCRETIONARY | | | 236,129,950 |
| CONSUMER STAPLES - 13.2% | | | |
| Beverages - 3.8% | | | |
| Brown-Forman Corp. Class B (non-vtg.) | | 378,560 | 25,204,525 |
| The Coca-Cola Co. | | 6,494,555 | 398,246,113 |
| | | | 423,450,638 |
| Household Products - 4.9% | | | |
| Colgate-Palmolive Co. | | 1,726,989 | 128,712,490 |
| Procter & Gamble Co. | | 2,990,539 | 425,792,943 |
| | | | 554,505,433 |
| Tobacco - 4.5% | | | |
| Altria Group, Inc. | | 3,728,482 | 167,930,829 |
| Philip Morris International, Inc. | | 3,209,507 | 334,559,010 |
| | | | 502,489,839 |
TOTAL CONSUMER STAPLES | | | 1,480,445,910 |
| ENERGY - 2.1% | | | |
| Oil, Gas & Consumable Fuels - 2.1% | | | |
| DT Midstream, Inc. | | 200,281 | 10,947,359 |
| EOG Resources, Inc. | | 1,213,367 | 160,467,786 |
| Marathon Oil Corp. | | 1,402,891 | 38,537,416 |
| Texas Pacific Land Corp. (b) | | 12,790 | 25,526,922 |
| | | | 235,479,483 |
| FINANCIALS - 4.9% | | | |
| Capital Markets - 1.6% | | | |
| Ameriprise Financial, Inc. | | 223,950 | 78,409,374 |
| Evercore, Inc. Class A | | 74,561 | 9,678,763 |
| Houlihan Lokey | | 101,373 | 10,043,023 |
| Lazard Ltd. Class A (b) | | 233,474 | 9,357,638 |
| SEI Investments Co. | | 213,196 | 13,309,826 |
| T. Rowe Price Group, Inc. (b) | | 462,178 | 53,829,872 |
| | | | 174,628,496 |
| Insurance - 3.3% | | | |
| Aon PLC | | 436,708 | 139,170,105 |
| Marsh & McLennan Companies, Inc. | | 1,020,574 | 178,508,598 |
| Principal Financial Group, Inc. (b) | | 479,906 | 44,415,300 |
| RLI Corp. | | 83,601 | 11,072,952 |
| | | | 373,166,955 |
TOTAL FINANCIALS | | | 547,795,451 |
| HEALTH CARE - 23.8% | | | |
| Biotechnology - 9.7% | | | |
| AbbVie, Inc. | | 2,631,802 | 388,848,746 |
| Amgen, Inc. | | 1,086,224 | 274,162,938 |
| Biogen, Inc. (a) | | 300,447 | 87,400,032 |
| Regeneron Pharmaceuticals, Inc. (a) | | 221,930 | 168,327,247 |
| Vertex Pharmaceuticals, Inc. (a) | | 530,981 | 171,559,961 |
| | | | 1,090,298,924 |
| Health Care Equipment & Supplies - 4.1% | | | |
| Edwards Lifesciences Corp. (a) | | 1,283,550 | 98,448,285 |
| Hologic, Inc. (a) | | 507,083 | 41,261,344 |
| IDEXX Laboratories, Inc. (a) | | 170,817 | 82,077,569 |
| Medtronic PLC | | 2,751,001 | 230,231,274 |
| | | | 452,018,472 |
| Health Care Technology - 0.5% | | | |
| Doximity, Inc. (a)(b) | | 228,714 | 8,066,743 |
| Veeva Systems, Inc. Class A (a) | | 290,030 | 49,464,617 |
| | | | 57,531,360 |
| Life Sciences Tools & Services - 4.2% | | | |
| Bio-Techne Corp. | | 324,925 | 25,883,526 |
| Danaher Corp. | | 1,355,513 | 358,370,527 |
| Medpace Holdings, Inc. (a) | | 51,987 | 11,492,766 |
| Mettler-Toledo International, Inc. (a) | | 46,599 | 71,432,539 |
| | | | 467,179,358 |
| Pharmaceuticals - 5.3% | | | |
| Merck & Co., Inc. | | 623,652 | 66,986,461 |
| Pfizer, Inc. (b) | | 8,332,905 | 367,981,085 |
| Zoetis, Inc. Class A (b) | | 969,250 | 160,401,183 |
| | | | 595,368,729 |
TOTAL HEALTH CARE | | | 2,662,396,843 |
| INDUSTRIALS - 4.9% | | | |
| Air Freight & Logistics - 0.3% | | | |
| Expeditors International of Washington, Inc. | | 338,712 | 36,631,703 |
| Building Products - 0.3% | | | |
| Masco Corp. (b) | | 466,924 | 24,840,357 |
| Trex Co., Inc. (a) | | 228,292 | 12,035,554 |
| | | | 36,875,911 |
| Industrial Conglomerates - 0.8% | | | |
| 3M Co. (b) | | 777,617 | 89,488,164 |
| Machinery - 1.1% | | | |
| Nordson Corp. | | 108,508 | 26,399,996 |
| Otis Worldwide Corp. (b) | | 870,062 | 71,545,198 |
| Snap-On, Inc. | | 110,288 | 27,431,934 |
| | | | 125,377,128 |
| Professional Services - 1.3% | | | |
| CoStar Group, Inc. (a) | | 805,670 | 62,761,693 |
| Robert Half International, Inc. | | 224,715 | 18,867,071 |
| Verisk Analytics, Inc. | | 324,975 | 59,077,205 |
| | | | 140,705,969 |
| Road & Rail - 0.6% | | | |
| Old Dominion Freight Lines, Inc. | | 189,765 | 63,237,289 |
| Trading Companies & Distributors - 0.5% | | | |
| Fastenal Co. | | 1,189,834 | 60,146,109 |
TOTAL INDUSTRIALS | | | 552,462,273 |
| INFORMATION TECHNOLOGY - 36.1% | | | |
| Electronic Equipment & Components - 0.2% | | | |
| Cognex Corp. (b) | | 359,007 | 19,652,043 |
| IT Services - 10.9% | | | |
| Automatic Data Processing, Inc. | | 860,300 | 194,264,343 |
| MasterCard, Inc. Class A | | 1,197,074 | 443,635,624 |
| Paychex, Inc. | | 663,195 | 76,837,773 |
| VeriSign, Inc. (a) | | 193,246 | 42,137,290 |
| Visa, Inc. Class A (b) | | 2,054,345 | 472,930,762 |
| | | | 1,229,805,792 |
| Semiconductors & Semiconductor Equipment - 3.0% | | | |
| Texas Instruments, Inc. | | 1,891,769 | 335,240,384 |
| Software - 13.3% | | | |
| Adobe, Inc. (a) | | 968,962 | 358,845,387 |
| Cadence Design Systems, Inc. (a) | | 259,828 | 47,504,353 |
| Check Point Software Technologies Ltd. (a) | | 210,321 | 26,752,831 |
| Dropbox, Inc. Class A (a) | | 569,955 | 13,240,055 |
| Fair Isaac Corp. (a)(b) | | 52,285 | 34,819,196 |
| Fortinet, Inc. (a) | | 1,355,041 | 70,922,846 |
| Manhattan Associates, Inc. (a) | | 129,855 | 16,927,898 |
| Microsoft Corp. | | 3,544,167 | 878,280,024 |
| Paycom Software, Inc. (a) | | 100,637 | 32,600,350 |
| Qualys, Inc. (a) | | 72,281 | 8,338,336 |
| | | | 1,488,231,276 |
| Technology Hardware, Storage & Peripherals - 8.7% | | | |
| Apple, Inc. | | 6,766,383 | 976,321,403 |
TOTAL INFORMATION TECHNOLOGY | | | 4,049,250,898 |
| MATERIALS - 0.3% | | | |
| Chemicals - 0.3% | | | |
| CF Industries Holdings, Inc. | | 412,556 | 34,943,493 |
| REAL ESTATE - 0.9% | | | |
| Equity Real Estate Investment Trusts (REITs) - 0.9% | | | |
| Public Storage | | 327,103 | 99,550,527 |
| TOTAL COMMON STOCKS (Cost $9,171,547,496) | | | 11,180,690,532 |
| | | | |
| U.S. Treasury Obligations - 0.0% |
| | | Principal Amount (c) | Value ($) |
U.S. Treasury Bills, yield at date of purchase 4.65% 6/29/23 (d) (Cost $1,962,486) | | 2,000,000 | 1,962,452 |
| | | | |
| Money Market Funds - 3.1% |
| | | Shares | Value ($) |
| Fidelity Cash Central Fund 4.38% (e) | | 13,155,837 | 13,158,468 |
| Fidelity Securities Lending Cash Central Fund 4.38% (e)(f) | | 330,330,242 | 330,363,275 |
| TOTAL MONEY MARKET FUNDS (Cost $343,521,743) | | | 343,521,743 |
| | | | |
| TOTAL INVESTMENT IN SECURITIES - 102.8% (Cost $9,517,031,725) | 11,526,174,727 |
NET OTHER ASSETS (LIABILITIES) - (2.8)% | (316,219,891) |
| NET ASSETS - 100.0% | 11,209,954,836 |
| | |
| Futures Contracts |
| | Number of contracts | Expiration Date | Notional Amount ($) | Value ($) | Unrealized Appreciation/ (Depreciation) ($) |
| Purchased | | | | | |
| | | | | | |
| Equity Index Contracts | | | | | |
| CME E-mini S&P 500 Index Contracts (United States) | 144 | Mar 2023 | 29,448,000 | 1,240,269 | 1,240,269 |
| | | | | | |
| The notional amount of futures purchased as a percentage of Net Assets is 0.3% |
For the period, the average monthly notional amount at value for futures contracts in the aggregate was $26,082,371.
Legend
| (b) | Security or a portion of the security is on loan at period end. |
| (c) | Amount is stated in United States dollars unless otherwise noted. |
| (d) | Security or a portion of the security was pledged to cover margin requirements for futures contracts. At period end, the value of securities pledged amounted to $1,558,187. |
| (e) | Affiliated fund that is generally available only to investment companies and other accounts managed by Fidelity Investments. The rate quoted is the annualized seven-day yield of the fund at period end. A complete unaudited listing of the fund's holdings as of its most recent quarter end is available upon request. In addition, each Fidelity Central Fund's financial statements are available on the SEC's website or upon request. |
| (f) | Investment made with cash collateral received from securities on loan. |
Affiliated Central Funds
Fiscal year to date information regarding the Fund's investments in Fidelity Central Funds, including the ownership percentage, is presented below.
| Affiliate | Value, beginning of period ($) | Purchases ($) | Sales Proceeds ($) | Dividend Income ($) | Realized Gain (loss) ($) | Change in Unrealized appreciation (depreciation) ($) | Value, end of period ($) | % ownership, end of period |
| Fidelity Cash Central Fund 4.38% | 10,085,438 | 1,080,087,902 | 1,077,014,872 | 457,399 | - | - | 13,158,468 | 0.0% |
| Fidelity Securities Lending Cash Central Fund 4.38% | 186,604,050 | 1,412,392,423 | 1,268,633,198 | 114,655 | - | - | 330,363,275 | 1.1% |
| Total | 196,689,488 | 2,492,480,325 | 2,345,648,070 | 572,054 | - | - | 343,521,743 | |
| | | | | | | | | |
Amounts in the dividend income column in the above table include any capital gain distributions from underlying funds, which are presented in the corresponding line item in the Statement of Operations, if applicable.
Amount for Fidelity Securities Lending Cash Central Fund represents the income earned on investing cash collateral, less rebates paid to borrowers and any lending agent fees associated with the loan, plus any premium payments received for lending certain types of securities.
Amounts included in the purchases and sales proceeds columns may include in-kind transactions, if applicable.
Investment Valuation
The following is a summary of the inputs used, as of January 31, 2023, involving the Fund's assets and liabilities carried at fair value. The inputs or methodology used for valuing securities may not be an indication of the risk associated with investing in those securities. For more information on valuation inputs, and their aggregation into the levels used below, please refer to the Investment Valuation section in the accompanying Notes to Financial Statements.
| Valuation Inputs at Reporting Date: |
| Description | Total ($) | Level 1 ($) | Level 2 ($) | Level 3 ($) |
Investments in Securities: | | | | |
|
| Equities: | | | | |
Communication Services | 1,282,235,704 | 1,282,235,704 | - | - |
Consumer Discretionary | 236,129,950 | 236,129,950 | - | - |
Consumer Staples | 1,480,445,910 | 1,480,445,910 | - | - |
Energy | 235,479,483 | 235,479,483 | - | - |
Financials | 547,795,451 | 547,795,451 | - | - |
Health Care | 2,662,396,843 | 2,662,396,843 | - | - |
Industrials | 552,462,273 | 552,462,273 | - | - |
Information Technology | 4,049,250,898 | 4,049,250,898 | - | - |
Materials | 34,943,493 | 34,943,493 | - | - |
Real Estate | 99,550,527 | 99,550,527 | - | - |
|
| U.S. Government and Government Agency Obligations | 1,962,452 | - | 1,962,452 | - |
|
| Money Market Funds | 343,521,743 | 343,521,743 | - | - |
| Total Investments in Securities: | 11,526,174,727 | 11,524,212,275 | 1,962,452 | - |
Derivative Instruments: | | | | |
|
| Assets | | | | |
Futures Contracts | 1,240,269 | 1,240,269 | - | - |
| Total Assets | 1,240,269 | 1,240,269 | - | - |
| Total Derivative Instruments: | 1,240,269 | 1,240,269 | - | - |
Value of Derivative Instruments
The following table is a summary of the Fund's value of derivative instruments by primary risk exposure as of January 31, 2023. For additional information on derivative instruments, please refer to the Derivative Instruments section in the accompanying Notes to Financial Statements.
Primary Risk Exposure / Derivative Type | Value |
| Asset ($) | Liability ($) |
| Equity Risk | | |
Futures Contracts (a) | 1,240,269 | 0 |
| Total Equity Risk | 1,240,269 | 0 |
| Total Value of Derivatives | 1,240,269 | 0 |
(a)Reflects gross cumulative appreciation (depreciation) on futures contracts as presented in the Schedule of Investments. In the Statement of Assets and Liabilities, the period end daily variation margin is included in receivable or payable for daily variation margin on futures contracts, and the net cumulative appreciation (depreciation) is included in Total accumulated earnings (loss).
| Statement of Assets and Liabilities |
| | | | January 31, 2023 (Unaudited) |
| | | | | |
| Assets | | | | |
| Investment in securities, at value (including securities loaned of $326,561,938) - See accompanying schedule: | | | | |
Unaffiliated issuers (cost $9,173,509,982) | $ | 11,182,652,984 | | |
Fidelity Central Funds (cost $343,521,743) | | 343,521,743 | | |
| | | | | |
| | | | | |
| Total Investment in Securities (cost $9,517,031,725) | | | $ | 11,526,174,727 |
| Cash | | | | 2,560 |
| Receivable for fund shares sold | | | | 306,235 |
| Dividends receivable | | | | 15,137,694 |
| Distributions receivable from Fidelity Central Funds | | | | 102,399 |
| Receivable for daily variation margin on futures contracts | | | | 416,887 |
| Prepaid expenses | | | | 9,167 |
| Other receivables | | | | 2,559 |
Total assets | | | | 11,542,152,228 |
| Liabilities | | | | |
| Payable for fund shares redeemed | $ | 872,417 | | |
| Accrued management fee | | 917,841 | | |
| Other payables and accrued expenses | | 57,184 | | |
| Collateral on securities loaned | | 330,349,950 | | |
| Total Liabilities | | | | 332,197,392 |
| Net Assets | | | $ | 11,209,954,836 |
| Net Assets consist of: | | | | |
| Paid in capital | | | $ | 9,152,615,237 |
| Total accumulated earnings (loss) | | | | 2,057,339,599 |
| Net Assets | | | $ | 11,209,954,836 |
Net Asset Value , offering price and redemption price per share ($11,209,954,836 ÷ 701,959,369 shares) | | | $ | 15.97 |
| Statement of Operations |
| | | | Six months ended January 31, 2023 (Unaudited) |
| Investment Income | | | | |
| Dividends | | | $ | 89,742,978 |
| Interest | | | | 18,376 |
| Income from Fidelity Central Funds (including $114,655 from security lending) | | | | 572,054 |
| Total Income | | | | 90,333,408 |
| Expenses | | | | |
| Management fee | $ | 5,505,006 | | |
| Custodian fees and expenses | | 37,637 | | |
| Independent trustees' fees and expenses | | 20,892 | | |
| Registration fees | | 43,353 | | |
| Audit | | 27,847 | | |
| Legal | | 10,665 | | |
| Interest | | 94,850 | | |
| Miscellaneous | | 31,293 | | |
| Total expenses before reductions | | 5,771,543 | | |
| Expense reductions | | (4,652) | | |
| Total expenses after reductions | | | | 5,766,891 |
| Net Investment income (loss) | | | | 84,566,517 |
| Realized and Unrealized Gain (Loss) | | | | |
| Net realized gain (loss) on: | | | | |
| Investment Securities: | | | | |
| Unaffiliated issuers | | 100,377,026 | | |
| Futures contracts | | (15,039,269) | | |
| Total net realized gain (loss) | | | | 85,337,757 |
| Change in net unrealized appreciation (depreciation) on: | | | | |
| Investment Securities: | | | | |
| Unaffiliated issuers | | (381,087,051) | | |
| Futures contracts | | (399,910) | | |
| Total change in net unrealized appreciation (depreciation) | | | | (381,486,961) |
| Net gain (loss) | | | | (296,149,204) |
| Net increase (decrease) in net assets resulting from operations | | | $ | (211,582,687) |
| Statement of Changes in Net Assets |
| |
| | Six months ended January 31, 2023 (Unaudited) | | Year ended July 31, 2022 |
| Increase (Decrease) in Net Assets | | | | |
| Operations | | | | |
| Net investment income (loss) | $ | 84,566,517 | $ | 140,945,176 |
| Net realized gain (loss) | | 85,337,757 | | 42,477,229 |
| Change in net unrealized appreciation (depreciation) | | (381,486,961) | | (902,155,752) |
| Net increase (decrease) in net assets resulting from operations | | (211,582,687) | | (718,733,347) |
| Distributions to shareholders | | (151,433,952) | | (866,284,891) |
| Share transactions | | | | |
| Proceeds from sales of shares | | 860,059,463 | | 3,106,087,211 |
| Reinvestment of distributions | | 148,959,461 | | 855,254,434 |
| Cost of shares redeemed | | (844,998,846) | | (1,103,462,543) |
Net increase (decrease) in net assets resulting from share transactions | | 164,020,078 | | 2,857,879,102 |
| Total increase (decrease) in net assets | | (198,996,561) | | 1,272,860,864 |
| | | | | |
| Net Assets | | | | |
| Beginning of period | | 11,408,951,397 | | 10,136,090,533 |
| End of period | $ | 11,209,954,836 | $ | 11,408,951,397 |
| | | | | |
| Other Information | | | | |
| Shares | | | | |
| Sold | | 55,576,164 | | 179,579,431 |
| Issued in reinvestment of distributions | | 9,395,183 | | 47,131,336 |
| Redeemed | | (54,984,976) | | (61,543,934) |
| Net increase (decrease) | | 9,986,371 | | 165,166,833 |
| | | | | |
Financial Highlights
| Fidelity® SAI U.S. Quality Index Fund |
| |
| | Six months ended (Unaudited) January 31, 2023 | | Years ended July 31, 2022 | | 2021 | | 2020 | | 2019 | | 2018 |
Selected Per-Share Data | | | | | | | | | | | | |
| Net asset value, beginning of period | $ | 16.49 | $ | 19.24 | $ | 15.96 | $ | 15.19 | $ | 14.23 | $ | 12.27 |
| Income from Investment Operations | | | | | | | | | | | | |
Net investment income (loss) A,B | | .12 | | .23 | | .22 | | .26 | | .25 | | .21 |
| Net realized and unrealized gain (loss) | | (.42) | | (1.36) | | 4.58 | | 2.45 | | 1.10 | | 2.25 |
| Total from investment operations | | (.30) | | (1.13) | | 4.80 | | 2.71 | | 1.35 | | 2.46 |
| Distributions from net investment income | | (.22) | | (.20) | | (.28) | | (.24) | | (.19) | | (.19) |
| Distributions from net realized gain | | - | | (1.42) | | (1.25) | | (1.69) | | (.20) | | (.31) |
| Total distributions | | (.22) | | (1.62) | | (1.52) C | | (1.94) C | | (.39) | | (.50) |
| Net asset value, end of period | $ | 15.97 | $ | 16.49 | $ | 19.24 | $ | 15.96 | $ | 15.19 | $ | 14.23 |
Total Return D,E | | (1.82)% | | (6.55)% | | 32.64% | | 20.14% | | 9.70% | | 20.71% |
Ratios to Average Net Assets B,F,G | | | | | | | | | | | | |
| Expenses before reductions | | .10% H | | .10% | | .10% | | .11% | | .19% | | .20% |
| Expenses net of fee waivers, if any | | .10% H | | .10% | | .10% | | .11% | | .15% | | .15% |
| Expenses net of all reductions | | .10% H | | .10% | | .10% | | .11% | | .15% | | .15% |
| Net investment income (loss) | | 1.54% H | | 1.30% | | 1.30% | | 1.83% | | 1.76% | | 1.55% |
| Supplemental Data | | | | | | | | | | | | |
| Net assets, end of period (000 omitted) | $ | 11,209,955 | $ | 11,408,951 | $ | 10,136,091 | $ | 8,332,335 | $ | 8,732,756 | $ | 7,247,643 |
Portfolio turnover rate I | | 49% H | | 47% | | 71% | | 60% | | 99% | | 34% |
A Calculated based on average shares outstanding during the period.
B Net investment income (loss) is affected by the timing of the declaration of dividends by any underlying mutual funds or exchange-traded funds (ETFs). Net investment income (loss) of any mutual funds or ETFs is not included in the Fund's net investment income (loss) ratio.
C Total distributions per share do not sum due to rounding.
D Total returns for periods of less than one year are not annualized.
E Total returns would have been lower if certain expenses had not been reduced during the applicable periods shown.
F Fees and expenses of any underlying mutual funds or exchange-traded funds (ETFs) are not included in the Fund's expense ratio. The Fund indirectly bears its proportionate share of these expenses. For additional expense information related to investments in Fidelity Central Funds, please refer to the "Investments in Fidelity Central Funds" note found in the Notes to Financial Statements section of the most recent Annual or Semi-Annual report.
G Expense ratios reflect operating expenses of the class. Expenses before reductions do not reflect amounts reimbursed, waived, or reduced through arrangements with the investment adviser, brokerage services, or other offset arrangements, if applicable, and do not represent the amount paid by the class during periods when reimbursements, waivers or reductions occur.
H Annualized.
I Amount does not include the portfolio activity of any underlying mutual funds or exchange-traded funds (ETFs).
For the period ended January 31, 2023
1. Organization.
Fidelity SAI U.S. Quality Index Fund (the Fund) is a fund of Fidelity Salem Street Trust (the Trust) and is authorized to issue an unlimited number of shares. Shares are offered exclusively to certain clients of Fidelity Management & Research Company LLC (FMR) or its affiliates. The Trust is registered under the Investment Company Act of 1940, as amended (the 1940 Act), as an open-end management investment company organized as a Massachusetts business trust.
2. Investments in Fidelity Central Funds.
Funds may invest in Fidelity Central Funds, which are open-end investment companies generally available only to other investment companies and accounts managed by the investment adviser and its affiliates. The Schedule of Investments lists any Fidelity Central Funds held as an investment as of period end, but does not include the underlying holdings of each Fidelity Central Fund. An investing fund indirectly bears its proportionate share of the expenses of the underlying Fidelity Central Funds.
Based on its investment objective, each Fidelity Central Fund may invest or participate in various investment vehicles or strategies that are similar to those of the investing fund. These strategies are consistent with the investment objectives of the investing fund and may involve certain economic risks which may cause a decline in value of each of the Fidelity Central Funds and thus a decline in the value of the investing fund.
| Fidelity Central Fund | Investment Manager | Investment Objective | Investment Practices | Expense Ratio A |
| Fidelity Money Market Central Funds | Fidelity Management & Research Company LLC (FMR) | Each fund seeks to obtain a high level of current income consistent with the preservation of capital and liquidity. | Short-term Investments | Less than .005% |
A Expenses expressed as a percentage of average net assets and are as of each underlying Central Fund's most recent annual or semi-annual shareholder report.
A complete unaudited list of holdings for each Fidelity Central Fund is available upon request or at the Securities and Exchange Commission website at www.sec.gov. In addition, the financial statements of the Fidelity Central Funds which contain the significant accounting policies (including investment valuation policies) of those funds, and are not covered by the Report of Independent Registered Public Accounting Firm, are available on the Securities and Exchange Commission website or upon request.
3. Significant Accounting Policies.
The Fund is an investment company and applies the accounting and reporting guidance of the Financial Accounting Standards Board (FASB) Accounting Standards Codification Topic 946 Financial Services - Investment Companies . The financial statements have been prepared in conformity with accounting principles generally accepted in the United States of America (GAAP), which require management to make certain estimates and assumptions at the date of the financial statements. Actual results could differ from those estimates. Subsequent events, if any, through the date that the financial statements were issued have been evaluated in the preparation of the financial statements. The Fund's Schedule of Investments lists any underlying mutual funds or exchange-traded funds (ETFs) but does not include the underlying holdings of these funds. The following summarizes the significant accounting policies of the Fund:
Investment Valuation. Investments are valued as of 4:00 p.m. Eastern time on the last calendar day of the period. The Board of Trustees (the Board) has designated the Fund's investment adviser as the valuation designee responsible for the fair valuation function and performing fair value determinations as needed. The investment adviser has established a Fair Value Committee (the Committee) to carry out the day-to-day fair valuation responsibilities and has adopted policies and procedures to govern the fair valuation process and the activities of the Committee. In accordance with these fair valuation policies and procedures, which have been approved by the Board, the Fund attempts to obtain prices from one or more third party pricing services or brokers to value its investments. When current market prices, quotations or currency exchange rates are not readily available or reliable, investments will be fair valued in good faith by the Committee, in accordance with the policies and procedures. Factors used in determining fair value vary by investment type and may include market or investment specific events, transaction data, estimated cash flows, and market observations of comparable investments. The frequency that the fair valuation procedures are used cannot be predicted and they may be utilized to a significant extent. The Committee manages the Fund's fair valuation practices and maintains the fair valuation policies and procedures. The Fund's investment adviser reports to the Board information regarding the fair valuation process and related material matters.
The Fund categorizes the inputs to valuation techniques used to value its investments into a disclosure hierarchy consisting of three levels as shown below:
Level 1 - unadjusted quoted prices in active markets for identical investments
Level 2 - other significant observable inputs (including quoted prices for similar investments, interest rates, prepayment speeds, etc.)
Level 3 - unobservable inputs (including the Fund's own assumptions based on the best information available)
Valuation techniques used to value the Fund's investments by major category are as follows:
Equity securities, including restricted securities, for which market quotations are readily available, are valued at the last reported sale price or official closing price as reported by a third party pricing service on the primary market or exchange on which they are traded and are categorized as Level 1 in the hierarchy. In the event there were no sales during the day or closing prices are not available, securities are valued at the last quoted bid price or may be valued using the last available price and are generally categorized as Level 2 in the hierarchy. For foreign equity securities, when market or security specific events arise, comparisons to the valuation of American Depositary Receipts (ADRs), futures contracts, ETFs and certain indexes as well as quoted prices for similar securities may be used and would be categorized as Level 2 in the hierarchy. For equity securities, including restricted securities, where observable inputs are limited, assumptions about market activity and risk are used and these securities may be categorized as Level 3 in the hierarchy.
Debt securities, including restricted securities, are valued based on evaluated prices received from third party pricing services or from brokers who make markets in such securities. U.S. government and government agency obligations are valued by pricing services who utilize matrix pricing which considers yield or price of bonds of comparable quality, coupon, maturity and type or by broker-supplied prices. When independent prices are unavailable or unreliable, debt securities may be valued utilizing pricing methodologies which consider similar factors that would be used by third party pricing services. Debt securities are generally categorized as Level 2 in the hierarchy but may be Level 3 depending on the circumstances.
Futures contracts are valued at the settlement price established each day by the board of trade or exchange on which they are traded and are categorized as Level 1 in the hierarchy. Investments in open-end mutual funds, including the Fidelity Central Funds, are valued at their closing net asset value (NAV) each business day and are categorized as Level 1 in the hierarchy.
Changes in valuation techniques may result in transfers in or out of an assigned level within the disclosure hierarchy. The aggregate value of investments by input level as of January 31, 2023, is included at the end of the Fund's Schedule of Investments.
Investment Transactions and Income. For financial reporting purposes, the Fund's investment holdings and NAV include trades executed through the end of the last business day of the period. The NAV per share for processing shareholder transactions is calculated as of the close of business of the New York Stock Exchange (NYSE), normally 4:00 p.m. Eastern time and includes trades executed through the end of the prior business day. Gains and losses on securities sold are determined on the basis of identified cost and include proceeds received from litigation. Commissions paid to certain brokers with whom the investment adviser, or its affiliates, places trades on behalf of a fund include an amount in addition to trade execution, which may be rebated back to a fund. Any such rebates are included in net realized gain (loss) on investments in the Statement of Operations. Dividend income is recorded on the ex-dividend date, except for certain dividends from foreign securities where the ex-dividend date may have passed, which are recorded as soon as the Fund is informed of the ex-dividend date. Non-cash dividends included in dividend income, if any, are recorded at the fair market value of the securities received. Income and capital gain distributions from Fidelity Central Funds, if any, are recorded on the ex-dividend date. Certain distributions received by the Fund represent a return of capital or capital gain. The Fund determines the components of these distributions subsequent to the ex-dividend date, based upon receipt of tax filings or other correspondence relating to the underlying investment. These distributions are recorded as a reduction of cost of investments and/or as a realized gain. Interest income is accrued as earned and includes coupon interest and amortization of premium and accretion of discount on debt securities as applicable.
Expenses. Expenses directly attributable to a fund are charged to that fund. Expenses attributable to more than one fund are allocated among the respective funds on the basis of relative net assets or other appropriate methods. Expenses included in the accompanying financial statements reflect the expenses of that fund and do not include any expenses associated with any underlying mutual funds or exchange-traded funds. Although not included in a fund's expenses, a fund indirectly bears its proportionate share of these expenses through the net asset value of each underlying mutual fund or exchange-traded fund. Expense estimates are accrued in the period to which they relate and adjustments are made when actual amounts are known.
Income Tax Information and Distributions to Shareholders. Each year, the Fund intends to qualify as a regulated investment company under Subchapter M of the Internal Revenue Code, including distributing substantially all of its taxable income and realized gains. As a result, no provision for U.S. Federal income taxes is required. The Fund files a U.S. federal tax return, in addition to state and local tax returns as required. The Fund's federal income tax returns are subject to examination by the Internal Revenue Service (IRS) for a period of three fiscal years after they are filed. State and local tax returns may be subject to examination for an additional fiscal year depending on the jurisdiction.
Distributions are declared and recorded on the ex-dividend date. Income and capital gain distributions are determined in accordance with income tax regulations, which may differ from GAAP.
Capital accounts within the financial statements are adjusted for permanent book-tax differences. These adjustments have no impact on net assets or the results of operations. Capital accounts are not adjusted for temporary book-tax differences which will reverse in a subsequent period.
Book-tax differences are primarily due to futures contracts, passive foreign investment companies (PFIC), partnerships and losses deferred due to wash sales and excise tax regulations.
As of period end, the cost and unrealized appreciation (depreciation) in securities, and derivatives if applicable, for federal income tax purposes were as follows:
| Gross unrealized appreciation | $2,477,903,958 |
| Gross unrealized depreciation | (523,096,976) |
| Net unrealized appreciation (depreciation) | $1,954,806,982 |
| Tax cost | $9,572,608,014 |
The Fund elected to defer to its next fiscal year approximately $20,417,334 of capital losses recognized during the period November 1, 2021 to July 31, 2022.
4. Derivative Instruments.
Risk Exposures and the Use of Derivative Instruments. The Fund's investment objectives allow for various types of derivative instruments, including futures contracts. Derivatives are investments whose value is primarily derived from underlying assets, indices or reference rates and may be transacted on an exchange or over-the-counter (OTC). Derivatives may involve a future commitment to buy or sell a specified asset based on specified terms, to exchange future cash flows at periodic intervals based on a notional principal amount, or for one party to make one or more payments upon the occurrence of specified events in exchange for periodic payments from the other party.
Derivatives were used to increase returns and to manage exposure to certain risks as defined below. The success of any strategy involving derivatives depends on analysis of numerous economic factors, and if the strategies for investment do not work as intended, the objectives may not be achieved.
Derivatives were used to increase or decrease exposure to the following risk(s):
| | |
| Equity Risk | Equity risk relates to the fluctuations in the value of financial instruments as a result of changes in market prices (other than those arising from interest rate risk or foreign exchange risk), whether caused by factors specific to an individual investment, its issuer, or all factors affecting all instruments traded in a market or market segment. |
Funds are also exposed to additional risks from investing in derivatives, such as liquidity risk and counterparty credit risk. Liquidity risk is the risk that a fund will be unable to close out the derivative in the open market in a timely manner. Counterparty credit risk is the risk that the counterparty will not be able to fulfill its obligation to a fund. Counterparty credit risk related to exchange-traded contracts may be mitigated by the protection provided by the exchange on which they trade.
Investing in derivatives may involve greater risks than investing in the underlying assets directly and, to varying degrees, may involve risk of loss in excess of any initial investment and collateral received and amounts recognized in the Statement of Assets and Liabilities. In addition, there may be the risk that the change in value of the derivative contract does not correspond to the change in value of the underlying instrument.
Futures Contracts. A futures contract is an agreement between two parties to buy or sell a specified underlying instrument for a fixed price at a specified future date. Futures contracts were used to manage exposure to the stock market.
Upon entering into a futures contract, a fund is required to deposit either cash or securities (initial margin) with a clearing broker in an amount equal to a certain percentage of the face value of the contract. Futures contracts are marked-to-market daily and subsequent daily payments are made or received by a fund depending on the daily fluctuations in the value of the futures contracts and are recorded as unrealized appreciation or (depreciation). This receivable and/or payable, if any, is included in daily variation margin on futures contracts in the Statement of Assets and Liabilities. Realized gain or (loss) is recorded upon the expiration or closing of a futures contract. The net realized gain (loss) and change in net unrealized appreciation (depreciation) on futures contracts during the period is presented in the Statement of Operations.
Any open futures contracts at period end are presented in the Schedule of Investments under the caption "Futures Contracts". The notional amount at value reflects each contract's exposure to the underlying instrument or index at period end, and is representative of volume of activity during the period unless an average notional amount is presented. Any securities deposited to meet initial margin requirements are identified in the Schedule of Investments. Any cash deposited to meet initial margin requirements is presented as segregated cash with brokers for derivative instruments in the Statement of Assets and Liabilities.
5. Purchases and Sales of Investments.
Purchases and sales of securities, other than short-term securities, U.S. government securities, and in-kind transactions, as applicable, are noted in the table below.
| | Purchases ($) | Sales ($) |
| Fidelity SAI U.S. Quality Index Fund | 2,768,465,425 | 2,689,707,597 |
6. Fees and Other Transactions with Affiliates.
Management Fee. Fidelity Management & Research Company LLC (the investment adviser) and its affiliates provide the Fund with investment management related services for which the Fund pays a monthly management fee that is based on an annual rate of .10% of the Fund's average net assets.
Sub-Adviser. Geode Capital Management, LLC (Geode), serves as sub-adviser for the Fund. Geode provides discretionary investment advisory services to the Fund and is paid by the investment adviser for providing these services.
Interfund Lending Program. Pursuant to an Exemptive Order issued by the Securities and Exchange Commission (the SEC), the Fund, along with other registered investment companies having management contracts with Fidelity Management & Research Company LLC (FMR), or other affiliated entities of FMR, may participate in an interfund lending program. This program provides an alternative credit facility allowing the Fund to borrow from, or lend money to, other participating affiliated funds. At period end, there were no interfund loans outstanding. Activity in this program during the period for which loans were outstanding was as follows:
| | Borrower or Lender | Average Loan Balance | Weighted Average Interest Rate | Interest Expense |
| Fidelity SAI U.S. Quality Index Fund | Borrower | $ 31,795,038 | 3.97% | $91,116 |
Interfund Trades. Funds may purchase from or sell securities to other Fidelity Funds under procedures adopted by the Board. The procedures have been designed to ensure these interfund trades are executed in accordance with Rule 17a-7 of the 1940 Act. Any interfund trades are included within the respective purchases and sales amounts shown in the Purchases and Sales of Investments note. During the period, there were no interfund trades.
7. Committed Line of Credit.
Certain Funds participate with other funds managed by the investment adviser or an affiliate in a $4.25 billion credit facility (the "line of credit") to be utilized for temporary or emergency purposes to fund shareholder redemptions or for other short-term liquidity purposes. The participating funds have agreed to pay commitment fees on their pro-rata portion of the line of credit, which are reflected in Miscellaneous expenses on the Statement of Operations, and are listed below. During the period, there were no borrowings on this line of credit.
| | Amount |
| Fidelity SAI U.S. Quality Index Fund | $14,731 |
8. Security Lending.
Funds lend portfolio securities from time to time in order to earn additional income. Lending agents are used, including National Financial Services (NFS), an affiliate of the investment adviser. Pursuant to a securities lending agreement, NFS will receive a fee, which is capped at 9.9% of a fund's daily lending revenue, for its services as lending agent. A fund may lend securities to certain qualified borrowers, including NFS. On the settlement date of the loan, a fund receives collateral (in the form of U.S. Treasury obligations, letters of credit and/or cash) against the loaned securities and maintains collateral in an amount not less than 100% of the market value of the loaned securities during the period of the loan. The market value of the loaned securities is determined at the close of business of a fund and any additional required collateral is delivered to a fund on the next business day. A fund or borrower may terminate the loan at any time, and if the borrower defaults on its obligation to return the securities loaned because of insolvency or other reasons, a fund may apply collateral received from the borrower against the obligation. A fund may experience delays and costs in recovering the securities loaned. Any cash collateral received is invested in the Fidelity Securities Lending Cash Central Fund. Any loaned securities are identified as such in the Schedule of Investments, and the value of loaned securities and cash collateral at period end, as applicable, are presented in the Statement of Assets and Liabilities. Security lending income represents the income earned on investing cash collateral, less rebates paid to borrowers and any lending agent fees associated with the loan, plus any premium payments received for lending certain types of securities. Security lending income is presented in the Statement of Operations as a component of income from Fidelity Central Funds. Affiliated security lending activity, if any, was as follows:
| | Total Security Lending Fees Paid to NFS | Security Lending Income From Securities Loaned to NFS | Value of Securities Loaned to NFS at Period End |
| Fidelity SAI U.S. Quality Index Fund | $12,178 | $- * | $10,581 |
* Amount represents less than one dollar.
9. Bank Borrowings.
The Fund is permitted to have bank borrowings for temporary or emergency purposes to fund shareholder redemptions or for other short-term liquidity requirements. The Fund has established borrowing arrangements with certain banks. The interest rate on the borrowings is the bank's base rate, as revised from time to time. Any open loans, including accrued interest, at period end are presented under the caption "Notes payable" in the Statement of Assets and Liabilities, if applicable. Activity in this program during the period for which loans were outstanding was as follows:
| | Average Loan Balance | Weighted Average Interest Rate | Interest Expense |
| Fidelity SAI U.S. Quality Index Fund | $ 37,552,000 | 3.58% | $3,734 |
10. Expense Reductions.
Through arrangements with the Fund's custodian, credits realized as a result of certain uninvested cash balances were used to reduce the Fund's expenses by $4,652.
11. Other.
A fund's organizational documents provide former and current trustees and officers with a limited indemnification against liabilities arising in connection with the performance of their duties to the fund. In the normal course of business, a fund may also enter into contracts that provide general indemnifications. A fund's maximum exposure under these arrangements is unknown as this would be dependent on future claims that may be made against a fund. The risk of material loss from such claims is considered remote.
At the end of the period, the following mutual funds managed by the investment adviser or its affiliates were the owners of record of 10% or more of the total outstanding shares.
| | Strategic Advisers Fidelity U.S. Total Stock Fund |
| Fidelity SAI U.S. Quality Index Fund | 81% |
Mutual funds managed by the investment adviser or its affiliates, in aggregate, were the owners of record of more than 20% of the total outstanding shares.
| Fund | % of shares held |
| Fidelity SAI U.S. Quality Index Fund | 89% |
12. Risk and Uncertainties.
Many factors affect a fund's performance. Developments that disrupt global economies and financial markets, such as pandemics, epidemics, outbreaks of infectious diseases, war, terrorism, and environmental disasters, may significantly affect a fund's investment performance. The effects of these developments to a fund will be impacted by the types of securities in which a fund invests, the financial condition, industry, economic sector, and geographic location of an issuer, and a fund's level of investment in the securities of that issuer.
As a shareholder, you incur two types of costs: (1) transaction costs, which may include sales charges (loads) on purchase payments or redemption proceeds, as applicable and (2) ongoing costs, which generally include management fees, distribution and/or service (12b-1) fees and other Fund expenses. This Example is intended to help you understand your ongoing costs (in dollars) of investing in a fund and to compare these costs with the ongoing costs of investing in other mutual funds.
| The Example is based on an investment of $1,000 invested at the beginning of the period and held for the entire period (August 1, 2022 to January 31, 2023). |
Actual Expenses
The first line of the accompanying table provides information about actual account values and actual expenses. You may use the information in this line, together with the amount you invested, to estimate the expenses that you paid over the period. Simply divide your account value by $1,000.00 (for example, an $8,600 account value divided by $1,000.00 = 8.6), then multiply the result by the number in the first line for a class/Fund under the heading entitled "Expenses Paid During Period" to estimate the expenses you paid on your account during this period. If any fund is a shareholder of any underlying mutual funds or exchange-traded funds (ETFs) (the Underlying Funds), such fund indirectly bears its proportional share of the expenses of the Underlying Funds in addition to the direct expenses incurred presented in the table. These fees and expenses are not included in the annualized expense ratio used to calculate the expense estimate in the table below.
Hypothetical Example for Comparison Purposes
The second line of the accompanying table provides information about hypothetical account values and hypothetical expenses based on the actual expense ratio and an assumed rate of return of 5% per year before expenses, which is not the actual return. The hypothetical account values and expenses may not be used to estimate the actual ending account balance or expenses you paid for the period. You may use this information to compare the ongoing costs of investing in the Fund and other funds. To do so, compare this 5% hypothetical example with the 5% hypothetical examples that appear in the shareholder reports of the other funds. If any fund is a shareholder of any Underlying Funds, such fund indirectly bears its proportional share of the expenses of the Underlying Funds in addition to the direct expenses as presented in the table. These fees and expenses are not included in the annualized expense ratio used to calculate the expense estimate in the table below.
Please note that the expenses shown in the table are meant to highlight your ongoing costs only and do not reflect any transaction costs. Therefore, the second line of the table is useful in comparing ongoing costs only, and will not help you determine the relative total costs of owning different funds. In addition, if these transactional costs were included, your costs would have been higher.
| | | | | Annualized Expense Ratio- A | | Beginning Account Value August 1, 2022 | | Ending Account Value January 31, 2023 | | Expenses Paid During Period- C August 1, 2022 to January 31, 2023 |
| | | | | | | | | | |
| Fidelity® SAI U.S. Quality Index Fund | | | | .10% | | | | | | |
| Actual | | | | | | $ 1,000 | | $ 981.80 | | $ .50 |
Hypothetical- B | | | | | | $ 1,000 | | $ 1,024.70 | | $ .51 |
| |
A Annualized expense ratio reflects expenses net of applicable fee waivers.
B 5% return per year before expenses
C Expenses are equal to the annualized expense ratio, multiplied by the average account value over the period, multiplied by 184/ 365 (to reflect the one-half year period). The fees and expenses of any Underlying Funds are not included in each annualized expense ratio.
Board Approval of Investment Advisory Contracts and Management Fees
Fidelity SAI U.S. Quality Index Fund
Each year, the Board of Trustees, including the Independent Trustees (together, the Board), votes on the renewal of the management contract with Fidelity Management & Research Company LLC (FMR) and the sub-advisory agreement (Sub-Advisory Agreement) for the fund with Geode Capital Management, LLC (Geode) (together, the Advisory Contracts). FMR and Geode are referred to herein as the Investment Advisers. The Board, assisted by the advice of fund counsel and Independent Trustees' counsel, requests and considers a broad range of information relevant to the renewal of the Advisory Contracts throughout the year.
The Board meets regularly and, at each of its meetings, covers an extensive agenda of topics and materials and considers factors that are relevant to its annual consideration of the renewal of the fund's Advisory Contracts, including the services and support provided to the fund and its shareholders. The Board has established four standing committees (Committees) - Operations, Audit, Fair Valuation, and Governance and Nominating - each composed of and chaired by Independent Trustees with varying backgrounds, to which the Board has assigned specific subject matter responsibilities in order to enhance effective decision-making by the Board. The Operations Committee, of which all the Independent Trustees are members, meets regularly throughout the year and requests, receives and considers, among other matters, information related to the annual consideration of the renewal of the fund's Advisory Contracts before making its recommendation to the Board. The Board also meets as needed to review matters specifically related to the Board's annual consideration of the renewal of the Advisory Contracts. Members of the Board may also meet from time to time with trustees of other Fidelity funds through joint ad hoc committees to discuss certain matters relevant to all of the Fidelity funds.
At its September 2022 meeting, the Board unanimously determined to renew the fund's Advisory Contracts. In reaching its determination, the Board considered all factors it believed relevant, including (i) the nature, extent, and quality of the services provided to the fund and its shareholders (including the investment performance of the fund); (ii) the competitiveness relative to peer funds of the fund's management fee and total expense ratio; (iii) the total costs of the services provided by and the profits realized by Fidelity and Geode from their respective relationships with the fund; and (iv) the extent to which, if any, economies of scale exist and are realized as the fund grows, and whether any economies of scale are appropriately shared with fund shareholders.
In considering whether to renew the Advisory Contracts for the fund, the Board reached a determination, with the assistance of fund counsel and Independent Trustees' counsel and through the exercise of its business judgment, that the renewal of the Advisory Contracts was in the best interests of the fund and its shareholders and that the compensation payable under the Advisory Contracts was fair and reasonable. The Board's decision to renew the Advisory Contracts was not based on any single factor, but rather was based on a comprehensive consideration of all the information provided to the Board at its meetings throughout the year. The Board, in reaching its determination to renew the Advisory Contracts, was aware that shareholders of the fund have a broad range of investment choices available to them, including a wide choice among funds offered by Fidelity's competitors, and that the fund's shareholders, who have the opportunity to review and weigh the disclosure provided by the fund in its prospectus and other public disclosures, have chosen to invest in this fund, which is part of the Fidelity family of funds.
Nature, Extent, and Quality of Services Provided. The Board considered staffing as it relates to the fund, including the backgrounds of investment personnel of Fidelity and Geode, and also considered the fund's investment objective, strategies, and related investment philosophy. The Independent Trustees also had discussions with senior management of Fidelity's investment operations and investment groups and with senior management of Geode. The Board considered the structure of the investment personnel compensation programs and whether the structures provide appropriate incentives to act in the best interests of the fund. The Board also considered the steps Fidelity and Geode had taken to ensure the continued provision of high quality services to the Fidelity funds throughout the COVID-19 pandemic, including the expansion of staff in client facing positions to maintain service levels in periods of high volumes and volatility.
The Trustees also discussed with representatives of Fidelity, at meetings throughout the year, Fidelity's role in, among other things, overseeing compliance with federal securities laws and other applicable requirements by Geode with respect to the fund and monitoring and overseeing the performance and investment capabilities of Geode. The Trustees considered that the Board
had received from Fidelity periodic reports about its oversight and due diligence processes, as well as periodic reports regarding the performance of Geode.
The Board also considered the nature, extent and quality of services provided by Geode. The Trustees noted that under the Sub-Advisory Agreement, subject to oversight by Fidelity, Geode is responsible for, among other things, identifying investments and arranging for execution of portfolio transactions to implement the fund's investment strategy. In addition, the Trustees noted that Geode is responsible for providing such reporting as may be requested by Fidelity to fulfill its oversight responsibilities discussed above.
Resources Dedicated to Investment Management and Support Services . The Board reviewed the general qualifications and capabilities of Fidelity's and Geode's investment staffs, including their size, education, experience, and resources, as well as Fidelity's and Geode's approach to recruiting, training, managing, and compensating investment personnel. The Board noted the resources devoted to Fidelity's global investment organization and that Fidelity's and Geode's analysts have extensive resources, tools and capabilities that allow them to conduct quantitative and fundamental analysis, as well as credit analysis of issuers, counterparties, and guarantors. Further, the Board considered that Fidelity's and Geode's investment professionals have sufficient access to information and data so as to provide competitive investment results over time, and that those professionals also have access to sophisticated tools that permit them to assess portfolio construction and risk and performance attribution characteristics continuously. Additionally, in its deliberations, the Board considered Fidelity's and Geode's trading, risk management, compliance, cybersecurity, and technology and operations capabilities and resources, which are integral parts of the investment management process.
Shareholder and Administrative Services . The Board considered (i) the nature, extent, quality, and cost of advisory, administrative, and shareholder services performed by the Investment Advisers and their affiliates under the Advisory Contracts and by FMR's affiliates under separate agreements covering transfer agency, pricing and bookkeeping, and securities lending services for the fund; (ii) the nature and extent of the supervision of third party service providers, principally custodians, subcustodians, and pricing vendors; and (iii) the resources devoted to, and the record of compliance with, the fund's compliance policies and procedures. The Board also reviewed the allocation of fund brokerage, including allocations to brokers affiliated with the Investment Advisers.
The Board noted that the growth of fund assets over time across the complex allows Fidelity to reinvest in the development of services designed to enhance the value and convenience of the Fidelity funds as investment vehicles. These services include 24-hour access to account information and market information over the Internet and through telephone representatives, investor education materials and asset allocation tools. The Board also considered that it reviews customer service metrics such as telephone response times, continuity of services on the website and metrics addressing services at Fidelity Investor Centers.
Investment in a Large Fund Family . The Board considered the benefits to shareholders of investing in a Fidelity fund, including the benefits of investing in a fund that is part of a large family of funds offering a variety of investment disciplines and providing a large variety of mutual fund investor services. The Board noted that Fidelity had taken, or had made recommendations to the Board that resulted in the Fidelity funds taking, a number of actions over the previous year that benefited particular funds, including: (i) continuing to dedicate additional resources to Fidelity's investment research process, which includes meetings with management of issuers of securities in which the funds invest; (ii) continuing efforts to enhance Fidelity's global research capabilities; (iii) launching new funds, ETFs, and share classes with innovative structures, strategies and pricing and making other enhancements to meet investor needs; (iv) broadening eligibility requirements for certain funds and share classes; (v) reducing management fees and total expenses for certain funds and classes; (vi) lowering expenses for certain existing funds and classes by implementing or lowering expense caps; (vii) rationalizing product lines and gaining increased efficiencies from fund mergers and liquidations; (viii) continuing to develop, acquire and implement systems and technology to improve services to the funds and shareholders, strengthen information security, and increase efficiency; and (ix) continuing to implement enhancements to further strengthen Fidelity's product line to increase investors' probability of success in achieving their investment goals, including their retirement income goals.
Investment Performance . The Board considered whether the fund has operated in accordance with its investment objective, as well as its record of compliance with its investment restrictions and its performance history.
The Board took into account discussions that occur at Board meetings throughout the year with representatives of the Investment Advisers about fund investment performance. In this regard the Board noted that as part of regularly scheduled fund reviews and other reports to the Board on fund performance, the Board considers annualized return information for the fund for different time periods, measured against the securities market index the fund seeks to track. The Board also periodically considers the fund's tracking error versus its benchmark index.
In addition to reviewing absolute and relative fund performance, the Independent Trustees periodically consider the appropriateness of fund performance metrics in evaluating the results achieved. In general, the Independent Trustees believe that an index fund's performance should be evaluated based on gross performance (before fees and expenses but after transaction costs) compared to the fund's benchmark index, over appropriate time periods, taking into account relevant factors including the following: general market conditions; the characteristics of the fund's benchmark index; the extent to which statistical sampling is employed; any securities lending revenues; and fund cash flows and other factors. The Independent Trustees generally give greater weight to fund performance over longer time periods than over shorter time periods. Depending on the circumstances, the Independent Trustees may be satisfied with a fund's performance notwithstanding that it lags its benchmark index for certain periods.
The Independent Trustees recognize that shareholders evaluate performance on a net basis (after fees and expenses) over their own holding periods, for which one-, three-, and five-year periods are often used as a proxy. For this reason, the performance information reviewed by the Board also included net cumulative calendar year total return information for the fund and its benchmark index for the most recent one-, three-, and five-year periods. No performance peer group information was considered by the Board as Fidelity advised the Board that the peer group, which is created by a third-party provider, includes a number of actively-managed funds. The Independent Trustees recognize that shareholders who are not investing through a tax-advantaged retirement account also consider tax consequences in evaluating performance.
Based on its review, the Board concluded that the nature, extent, and quality of services provided to the fund under the Advisory Contracts should continue to benefit the shareholders of the fund.
Competitiveness of Management Fee and Total Expense Ratio. The Board considered the fund's management fee and total expense ratio compared to selected groups of competitive funds and classes (referred to as "mapped groups" below) for the purpose of facilitating the Trustees' competitive analysis of management fees and total expenses. Fidelity creates "mapped groups" by combining similar investment objective categories (as classified by Lipper) that have comparable investment mandates. Combining funds with similar investment objective categories aids the Board's comparison of management fees and total expense ratios by broadening the competitive group used for such comparison.
Management Fee. The Board considered two proprietary management fee comparisons for the 12-month periods shown in basis points (BP) in the chart below. The group of Lipper funds used by the Board for management fee comparisons is referred to below as the "Total Mapped Group." The Total Mapped Group comparison focuses on a fund's standing in terms of gross management fees before expense reimbursements or caps relative to the total universe of funds with comparable investment mandates, regardless of whether their management fee structures also are comparable. Funds with comparable investment mandates offer exposure to similar types of securities. Funds with comparable management fee structures have similar management fee contractual arrangements (e.g., flat rate charged for advisory services, all-inclusive fee rate, etc.). "TMG %" represents the percentage of funds in the Total Mapped Group that had management fees that were lower than the fund's. For example, a hypothetical TMG % of 20% would mean that 80% of the funds in the Total Mapped Group had higher, and 20% had lower, management fees than the fund. The fund's actual TMG %s and the number of funds in the Total Mapped Group are in the chart below. The "Asset-Sized Peer Group" (ASPG) comparison focuses on a fund's standing relative to a subset of non-Fidelity funds within the Total Mapped Group that are similar in size and management fee structure. For example, if a fund is in the first quartile of the ASPG, the fund's management fee ranks in the least expensive or lowest 25% of funds in the ASPG. The ASPG represents at least 15% of the funds in the Total Mapped Group with comparable asset size and management fee structures, subject to a minimum of 50 funds (or all funds in the Total Mapped Group if fewer than 50). Additional information, such as the ASPG quartile in which the fund's management fee rate ranked, is also included in the chart and was considered by the Board.
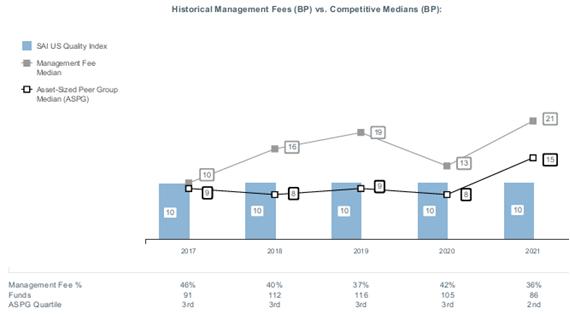
The Board noted that the fund's management fee rate ranked below the median of its Total Mapped Group and below the median of its ASPG for 2021.
Based on its review, the Board concluded that the fund's management fee is fair and reasonable in light of the services that the fund receives and the other factors considered.
Total Expense Ratio . In its review of the fund's total expense ratio, the Board considered the fund's management fee rate as well as other fund expenses, such as custodial, legal, and audit fees. The Board also noted that Fidelity may agree to waive fees or reimburse expenses from time to time, and the extent to which, if any, it has done so for the fund. The fund is compared to those funds and classes in the Total Mapped Group (used by the Board for management fee comparisons) that have a similar sales load structure. The Board also considered a total expense ASPG comparison, which focuses on the total expenses of the fund relative to a subset of non-Fidelity funds within the similar sales load structure group that are similar in size and management fee structure. The total expense ASPG is limited to 15 larger and 15 smaller classes of different funds, where possible. The total expense ASPG comparison excludes performance adjustments and fund-paid 12b-1 fees to eliminate variability in expenses relating to these items.
The Board noted that the fund's total net expense ratio ranked below the similar sales load structure group competitive median and above the ASPG competitive median for 2021. The Board considered that FMR believes the fee that the fund is charged is reasonable for the overall value of services shareholders receive.
The Board further considered that FMR has contractually agreed to reimburse the fund to the extent that total operating expenses, with certain exceptions, as a percentage of its average net assets, exceed 0.15% through November 30, 2023.
Fees Charged to Other Clients . The Board also considered fee structures and other information with respect to clients of Fidelity and Geode, such as other funds advised or subadvised by Fidelity or Geode, pension plan clients, and other institutional clients with similar mandates. The Board noted that a joint ad hoc committee created by it and the boards of other Fidelity funds periodically reviews and compares Fidelity's institutional investment advisory business with its business of providing services to the Fidelity funds and also noted the most recent findings of the committee. The Board noted that the committee's review included a consideration of the differences in services provided, fees charged, and costs incurred, as well as competition in the markets serving the different categories of clients.
Based on its review of total expense ratios and fees charged to other Fidelity clients, the Board concluded that the fund's total expense ratio was reasonable in light of the services that the fund and its shareholders receive and the other factors considered.
Costs of the Services and Profitability . The Board considered the revenues earned and the expenses incurred by Fidelity in conducting the business of developing, marketing, distributing, managing, administering and servicing the fund and servicing the fund's shareholders. The Board also considered the level of Fidelity's profits in respect of all the Fidelity funds.
On an annual basis, Fidelity presents to the Board information about the profitability of its relationships with the fund. Fidelity calculates profitability information for each fund, as well as aggregate profitability information for groups of Fidelity funds and all Fidelity funds, using a series of detailed revenue and cost allocation methodologies which originate with the books and records of Fidelity on which Fidelity's audited financial statements are based. The Audit Committee of the Board reviews any significant changes from the prior year's methodologies and the full Board approves such changes.
A public accounting firm has been engaged annually by the Board as part of the Board's assessment of Fidelity's profitability analysis. The engagement includes the review and assessment of the methodologies used by Fidelity in determining the revenues and expenses attributable to Fidelity's mutual fund business, and completion of agreed-upon procedures in respect of the mathematical accuracy of certain fund profitability information and its conformity to established allocation methodologies. After considering the reports issued under the engagement and information provided by Fidelity, the Board concluded that while other allocation methods may also be reasonable, Fidelity's profitability methodologies are reasonable in all material respects.
The Board also reviewed Fidelity's and Geode's non-fund businesses and potential indirect benefits such businesses may have received as a result of their association with Fidelity's mutual fund business (i.e., fall-out benefits) as well as cases where Fidelity's and Geode's affiliates may benefit from the funds' business. The Board considered areas where potential indirect benefits to the Fidelity funds from their relationships with Fidelity may exist. The Board's consideration of these matters was informed by the findings of a joint ad hoc committee created by it and the boards of other Fidelity funds to evaluate potential fall-out benefits.
The Board considered the costs of the services provided by and the profits realized by Fidelity in connection with the operation of the fund and was satisfied that the profitability was not excessive.
The Board also considered information regarding the profitability of Geode's relationship with the fund.
Economies of Scale. The Board considered whether there have been economies of scale in respect of the management of the Fidelity funds, whether the Fidelity funds (including the fund) have appropriately benefited from any such economies of scale, and whether there is potential for realization of any further economies of scale. The Board considered the extent to which the fund will benefit from economies of scale as assets grow through increased services to the fund, through waivers or reimbursements, or through fee or expense ratio reductions. The Board also noted that a committee (the Economies of Scale Committee) created by it and the boards of other Fidelity funds periodically analyzes whether Fidelity attains economies of scale in respect of the management and servicing of the Fidelity funds, whether the Fidelity funds have appropriately benefited from such economies of scale, and whether there is potential for realization of any further economies of scale.
The Board concluded, taking into account the analysis of the Economies of Scale Committee, that economies of scale, if any, are being appropriately shared between fund shareholders and Fidelity.
Additional Information Requested by the Board . In order to develop fully the factual basis for consideration of the Fidelity funds' advisory contracts, the Board requested and received additional information on certain topics, including: (i) Fidelity's fund profitability methodology, profitability trends for certain funds, the allocation of various costs to different funds, and the impact of certain factors on fund profitability results; (ii) portfolio manager changes that have occurred during the past year and the amount of the investment that each portfolio manager has made in the Fidelity fund(s) that he or she manages; (iii) the extent to which current market conditions have affected retention and recruitment of personnel; (iv) the arrangements with and compensation paid to certain fund sub-advisers on behalf of the Fidelity funds and the treatment of such compensation within Fidelity's fund profitability methodology; (v) the terms of the funds' various management fee structures, including the basic group fee and the terms of Fidelity's voluntary expense limitation arrangements; (vi) Fidelity's transfer agent, pricing and bookkeeping fees, expense and service structures for different funds and classes relative to competitive trends; (vii) the impact on fund profitability of recent industry trends, such as the growth in passively managed funds and the changes in flows for different types of funds; (viii) the types of management fee and total expense comparisons provided, and the challenges and limitations associated with such information; and (ix) explanations regarding the relative total expense ratios and management fees of certain funds and classes, total expense and management fee competitive trends, and methodologies for total expense and management fee competitive comparisons. In addition, the Board considered its discussions with Fidelity regarding Fidelity's efforts to maintain the continuous investment and shareholder services necessary for the funds during the current pandemic and economic circumstances.
Based on its evaluation of all of the conclusions noted above, and after considering all factors it believed relevant, the Board concluded that the advisory and sub-advisory fee arrangements are fair and reasonable and that the fund's Advisory Contracts should be renewed.
The Securities and Exchange Commission adopted Rule 22e-4 under the Investment Company Act of 1940 (the Liquidity Rule) to promote effective liquidity risk management throughout the open-end investment company industry, thereby reducing the risk that funds will be unable to meet their redemption obligations and mitigating dilution of the interests of fund shareholders.
The Fund has adopted and implemented a liquidity risk management program (the Program) reasonably designed to assess and manage the Fund's liquidity risk and to comply with the requirements of the Liquidity Rule. The Fund's Board of Trustees (the Board) has designated the Fund's investment adviser as administrator of the Program. The Fidelity advisers have established a Liquidity Risk Management Committee (the LRM Committee) to manage the Program for each of the Fidelity Funds. The LRM Committee monitors the adequacy and effectiveness of implementation of the Program and on a periodic basis assesses each Fund's liquidity risk based on a variety of factors including (1) the Fund's investment strategy, (2) portfolio liquidity and cash flow projections during normal and reasonably foreseeable stressed conditions, (3) shareholder redemptions, (4) borrowings and other funding sources and (5) certain factors specific to ETFs including the effect of the Fund's prices and spreads, market participants, and basket compositions on the overall liquidity of the Fund's portfolio, as applicable.
In accordance with the Program, each of the Fund's portfolio investments is classified into one of four defined liquidity categories based on a determination of a reasonable expectation for how long it would take to convert the investment to cash (or sell or dispose of the investment) without significantly changing its market value.
- Highly liquid investments - cash or convertible to cash within three business days or less
- Moderately liquid investments - convertible to cash in three to seven calendar days
- Less liquid investments - can be sold or disposed of, but not settled, within seven calendar days
- Illiquid investments - cannot be sold or disposed of within seven calendar days
Liquidity classification determinations take into account a variety of factors including various market, trading and investment-specific considerations, as well as market depth, and generally utilize analysis from a third-party liquidity metrics service.
The Liquidity Rule places a 15% limit on a fund's illiquid investments and requires funds that do not primarily hold assets that are highly liquid investments to determine and maintain a minimum percentage of the fund's net assets to be invested in highly liquid investments (highly liquid investment minimum or HLIM). The Program includes provisions reasonably designed to comply with the 15% limit on illiquid investments and for determining, periodically reviewing and complying with the HLIM requirement as applicable.
At a recent meeting of the Fund's Board of Trustees, the LRM Committee provided a written report to the Board pertaining to the operation, adequacy, and effectiveness of the Program for the period December 1, 2021 through November 30, 2022. The report concluded that the Program is operating effectively and is reasonably designed to assess and manage the Fund's liquidity risk.
1.9868210.107
SV4-SANN-0423
Fidelity® SAI Small-Mid Cap 500 Index Fund
Semi-Annual Report
January 31, 2023
Offered exclusively to certain clients of the Adviser, or its affiliates, including Strategic Advisers LLC (Strategic Advisers) - not available for sale to the general public. Fidelity ® SAI is a product name of Fidelity ® funds dedicated to certain programs affiliated with Strategic Advisers.
Contents
To view a fund's proxy voting guidelines and proxy voting record for the 12-month period ended June 30, visit http://www.fidelity.com/proxyvotingresults or visit the Securities and Exchange Commission's (SEC) web site at http://www.sec.gov.
You may also call 1-800-544-3455 to request a free copy of the proxy voting guidelines.
A fund is not in any way connected to or sponsored, endorsed, sold or promoted by the London Stock Exchange Group plc and its group undertakings (collectively, the "LSE Group"). The LSE Group does not accept any liability whatsoever to any person arising out of the use of a fund or the underlying data.
Standard & Poor's, S&P and S&P 500 are registered service marks of The McGraw-Hill Companies, Inc. and have been licensed for use by Fidelity Distributors Corporation.
Other third-party marks appearing herein are the property of their respective owners.
All other marks appearing herein are registered or unregistered trademarks or service marks of FMR LLC or an affiliated company. © 2023 FMR LLC. All rights reserved.
This report and the financial statements contained herein are submitted for the general information of the shareholders of the Fund. This report is not authorized for distribution to prospective investors in the Fund unless preceded or accompanied by an effective prospectus.
A fund files its complete schedule of portfolio holdings with the SEC for the first and third quarters of each fiscal year on Form N-PORT. Forms N-PORT are available on the SEC's web site at http://www.sec.gov. A fund's Forms N-PORT may be reviewed and copied at the SEC's Public Reference Room in Washington, DC. Information regarding the operation of the SEC's Public Reference Room may be obtained by calling 1-800-SEC-0330.
For a complete list of a fund's portfolio holdings, view the most recent holdings listing, semiannual report, or annual report on Fidelity's web site at http://www.fidelity.com, http://www.institutional.fidelity.com, or http://www.401k.com, as applicable.
NOT FDIC INSURED •MAY LOSE VALUE •NO BANK GUARANTEE
Neither the Fund nor Fidelity Distributors Corporation is a bank.
Top Holdings (% of Fund's net assets) |
| |
| Quanta Services, Inc. | 0.7 | |
| Steel Dynamics, Inc. | 0.6 | |
| LPL Financial | 0.6 | |
| First Solar, Inc. | 0.6 | |
| Fair Isaac Corp. | 0.5 | |
| FactSet Research Systems, Inc. | 0.5 | |
| Iron Mountain, Inc. | 0.5 | |
| Avery Dennison Corp. | 0.5 | |
| Textron, Inc. | 0.5 | |
| Howmet Aerospace, Inc. | 0.4 | |
| | 5.4 | |
| |
| Market Sectors (% of Fund's net assets) |
| |
| Industrials | 19.6 | |
| Financials | 15.1 | |
| Information Technology | 14.5 | |
| Consumer Discretionary | 12.9 | |
| Health Care | 9.5 | |
| Real Estate | 9.2 | |
| Materials | 7.0 | |
| Energy | 3.6 | |
| Consumer Staples | 3.1 | |
| Communication Services | 2.6 | |
| Utilities | 2.6 | |
| |
Asset Allocation (% of Fund's net assets) |
|
Foreign investments - 5.6% |
Percentages shown as 0.0% may reflect amounts less than 0.05%. |
|
Showing Percentage of Net Assets
| Common Stocks - 99.7% |
| | | Shares | Value ($) |
| COMMUNICATION SERVICES - 2.6% | | | |
| Diversified Telecommunication Services - 0.2% | | | |
| Frontier Communications Parent, Inc. (a)(b) | | 95,131 | 2,816,829 |
| Entertainment - 0.8% | | | |
| AMC Entertainment Holdings, Inc. Class A (a)(b) | | 200,744 | 1,073,980 |
| Liberty Media Corp. Liberty Formula One: | | | |
| Class A (a) | | 8,164 | 519,884 |
| Series C (a) | | 77,948 | 5,518,718 |
| Madison Square Garden Sports Corp. | | 7,363 | 1,338,888 |
| Playtika Holding Corp. (a)(b) | | 35,179 | 369,028 |
| World Wrestling Entertainment, Inc. Class A (b) | | 16,719 | 1,414,762 |
| | | | 10,235,260 |
| Interactive Media & Services - 0.2% | | | |
| IAC, Inc. (a) | | 29,850 | 1,686,525 |
| TripAdvisor, Inc. (a) | | 39,667 | 924,241 |
| | | | 2,610,766 |
| Media - 1.4% | | | |
| Altice U.S.A., Inc. Class A (a) | | 81,260 | 398,174 |
| Cable One, Inc. | | 2,240 | 1,769,331 |
| Interpublic Group of Companies, Inc. | | 150,735 | 5,495,798 |
| News Corp.: | | | |
| Class A | | 147,549 | 2,989,343 |
| Class B | | 45,963 | 939,484 |
| Nexstar Broadcasting Group, Inc. Class A | | 14,078 | 2,882,752 |
| The New York Times Co. Class A | | 63,079 | 2,197,672 |
| | | | 16,672,554 |
TOTAL COMMUNICATION SERVICES | | | 32,335,409 |
| CONSUMER DISCRETIONARY - 12.9% | | | |
| Auto Components - 0.9% | | | |
| BorgWarner, Inc. | | 90,652 | 4,286,027 |
| Gentex Corp. | | 91,259 | 2,693,053 |
| Lear Corp. | | 22,853 | 3,331,510 |
| QuantumScape Corp. Class A (a)(b) | | 100,128 | 852,089 |
| | | | 11,162,679 |
| Automobiles - 0.3% | | | |
| Harley-Davidson, Inc. | | 52,251 | 2,405,114 |
| Thor Industries, Inc. (b) | | 20,051 | 1,911,462 |
| | | | 4,316,576 |
| Distributors - 0.5% | | | |
| Pool Corp. | | 14,779 | 5,698,930 |
| Diversified Consumer Services - 0.9% | | | |
| ADT, Inc. | | 81,177 | 713,546 |
| Bright Horizons Family Solutions, Inc. (a)(b) | | 22,336 | 1,714,958 |
| Grand Canyon Education, Inc. (a) | | 11,905 | 1,387,647 |
| H&R Block, Inc. | | 60,334 | 2,351,819 |
| Mister Car Wash, Inc. (a)(b) | | 30,635 | 314,621 |
| Service Corp. International | | 58,098 | 4,307,967 |
| | | | 10,790,558 |
| Hotels, Restaurants & Leisure - 3.0% | | | |
| ARAMARK Holdings Corp. | | 90,045 | 4,009,704 |
| Boyd Gaming Corp. | | 29,655 | 1,847,803 |
| Choice Hotels International, Inc. | | 12,493 | 1,535,265 |
| Churchill Downs, Inc. | | 13,856 | 3,437,674 |
| Hyatt Hotels Corp. Class A (a) | | 18,387 | 2,006,389 |
| Marriott Vacations Worldwide Corp. | | 14,523 | 2,324,261 |
| Norwegian Cruise Line Holdings Ltd. (a)(b) | | 162,446 | 2,470,804 |
| Penn Entertainment, Inc. (a) | | 60,000 | 2,127,000 |
| Planet Fitness, Inc. (a) | | 32,417 | 2,744,099 |
| Six Flags Entertainment Corp. (a) | | 28,871 | 775,186 |
| Travel+Leisure Co. | | 30,975 | 1,312,411 |
| Vail Resorts, Inc. (b) | | 15,624 | 4,098,800 |
| Wendy's Co. | | 66,238 | 1,477,107 |
| Wyndham Hotels & Resorts, Inc. | | 33,715 | 2,613,250 |
| Wynn Resorts Ltd. (a) | | 40,484 | 4,195,762 |
| | | | 36,975,515 |
| Household Durables - 1.5% | | | |
| Leggett & Platt, Inc. (b) | | 51,680 | 1,889,421 |
| Mohawk Industries, Inc. (a) | | 20,429 | 2,452,706 |
| Newell Brands, Inc. | | 146,633 | 2,340,263 |
| PulteGroup, Inc. | | 88,048 | 5,009,051 |
| Tempur Sealy International, Inc. | | 65,269 | 2,659,712 |
| Toll Brothers, Inc. | | 41,240 | 2,453,368 |
| TopBuild Corp. (a) | | 12,388 | 2,478,343 |
| | | | 19,282,864 |
| Internet & Direct Marketing Retail - 0.3% | | | |
| Lyft, Inc. (a) | | 123,391 | 2,005,104 |
| Wayfair LLC Class A (a)(b) | | 30,632 | 1,853,236 |
| | | | 3,858,340 |
| Leisure Products - 0.8% | | | |
| Brunswick Corp. | | 28,061 | 2,366,384 |
| Mattel, Inc. (a) | | 136,538 | 2,793,567 |
| Peloton Interactive, Inc. Class A (a)(b) | | 119,706 | 1,547,799 |
| Polaris, Inc. | | 21,378 | 2,455,050 |
| YETI Holdings, Inc. (a) | | 33,499 | 1,499,415 |
| | | | 10,662,215 |
| Multiline Retail - 0.5% | | | |
| Kohl's Corp. | | 45,083 | 1,459,337 |
| Macy's, Inc. | | 104,673 | 2,473,423 |
| Nordstrom, Inc. (b) | | 43,454 | 849,091 |
| Ollie's Bargain Outlet Holdings, Inc. (a) | | 24,238 | 1,327,273 |
| | | | 6,109,124 |
| Specialty Retail - 2.3% | | | |
| AutoNation, Inc. (a)(b) | | 13,094 | 1,659,272 |
| Carvana Co. Class A (a)(b) | | 40,513 | 412,017 |
| Dick's Sporting Goods, Inc. | | 20,649 | 2,700,063 |
| Five Below, Inc. (a) | | 21,199 | 4,178,959 |
| Floor & Decor Holdings, Inc. Class A (a) | | 40,092 | 3,639,151 |
| GameStop Corp. Class A (b) | | 104,273 | 2,280,451 |
| Gap, Inc. (b) | | 75,554 | 1,025,268 |
| Leslie's, Inc. (a)(b) | | 61,523 | 952,991 |
| Lithia Motors, Inc. Class A (sub. vtg.) (b) | | 10,531 | 2,771,759 |
| Penske Automotive Group, Inc. | | 10,017 | 1,280,373 |
| Petco Health & Wellness Co., Inc. (a)(b) | | 31,255 | 365,371 |
| RH (a) | | 7,383 | 2,303,422 |
| Victoria's Secret & Co. (a) | | 31,507 | 1,328,020 |
| Williams-Sonoma, Inc. | | 25,736 | 3,472,816 |
| | | | 28,369,933 |
| Textiles, Apparel & Luxury Goods - 1.9% | | | |
| Capri Holdings Ltd. (a) | | 48,775 | 3,243,050 |
| Carter's, Inc. | | 14,488 | 1,207,865 |
| Columbia Sportswear Co. | | 13,988 | 1,341,449 |
| Deckers Outdoor Corp. (a) | | 10,229 | 4,372,693 |
| Hanesbrands, Inc. (b) | | 135,368 | 1,142,506 |
| PVH Corp. | | 25,198 | 2,265,300 |
| Ralph Lauren Corp. | | 15,746 | 1,950,142 |
| Skechers U.S.A., Inc. Class A (sub. vtg.) (a) | | 51,962 | 2,501,970 |
| Tapestry, Inc. | | 94,052 | 4,285,950 |
| Under Armour, Inc.: | | | |
| Class A (sub. vtg.) (a) | | 73,184 | 906,750 |
| Class C (non-vtg.) (a) | | 76,645 | 835,431 |
| | | | 24,053,106 |
TOTAL CONSUMER DISCRETIONARY | | | 161,279,840 |
| CONSUMER STAPLES - 3.1% | | | |
| Beverages - 0.1% | | | |
| Boston Beer Co., Inc. Class A (a)(b) | | 3,668 | 1,425,421 |
| Food & Staples Retailing - 1.3% | | | |
| Albertsons Companies, Inc. | | 65,369 | 1,385,823 |
| BJ's Wholesale Club Holdings, Inc. (a) | | 52,046 | 3,771,774 |
| Casey's General Stores, Inc. | | 14,397 | 3,396,396 |
| Grocery Outlet Holding Corp. (a)(b) | | 34,262 | 1,041,222 |
| Performance Food Group Co. (a) | | 59,069 | 3,622,111 |
| U.S. Foods Holding Corp. (a) | | 78,386 | 2,988,858 |
| | | | 16,206,184 |
| Food Products - 1.5% | | | |
| Darling Ingredients, Inc. (a) | | 62,149 | 4,119,857 |
| Flowers Foods, Inc. | | 72,798 | 2,015,777 |
| Freshpet, Inc. (a) | | 17,655 | 1,118,091 |
| Ingredion, Inc. | | 25,458 | 2,617,082 |
| Lamb Weston Holdings, Inc. | | 55,988 | 5,592,641 |
| Pilgrim's Pride Corp. (a) | | 18,079 | 438,958 |
| Post Holdings, Inc. (a) | | 21,245 | 2,017,213 |
| Seaboard Corp. | | 98 | 384,209 |
| | | | 18,303,828 |
| Household Products - 0.1% | | | |
| Reynolds Consumer Products, Inc. | | 21,092 | 627,909 |
| Spectrum Brands Holdings, Inc. | | 15,477 | 1,050,579 |
| | | | 1,678,488 |
| Personal Products - 0.1% | | | |
| Coty, Inc. Class A (a) | | 136,486 | 1,359,401 |
| Olaplex Holdings, Inc. (a) | | 48,274 | 304,609 |
| | | | 1,664,010 |
TOTAL CONSUMER STAPLES | | | 39,277,931 |
| ENERGY - 3.6% | | | |
| Energy Equipment & Services - 0.3% | | | |
| NOV, Inc. | | 152,027 | 3,715,540 |
| Oil, Gas & Consumable Fuels - 3.3% | | | |
| Antero Midstream GP LP | | 130,596 | 1,423,496 |
| Antero Resources Corp. (a) | | 110,154 | 3,176,841 |
| APA Corp. | | 124,450 | 5,516,869 |
| Chesapeake Energy Corp. | | 47,042 | 4,079,482 |
| DT Midstream, Inc. | | 37,641 | 2,057,457 |
| Enviva, Inc. | | 11,888 | 540,666 |
| EQT Corp. | | 143,157 | 4,676,939 |
| HF Sinclair Corp. | | 52,397 | 2,981,389 |
| New Fortress Energy, Inc. | | 21,400 | 830,106 |
| Ovintiv, Inc. | | 96,687 | 4,759,901 |
| PDC Energy, Inc. | | 34,110 | 2,310,270 |
| Range Resources Corp. | | 91,469 | 2,288,554 |
| Southwestern Energy Co. (a) | | 427,396 | 2,359,226 |
| Texas Pacific Land Corp. | | 2,224 | 4,438,770 |
| Vitesse Energy, Inc. (a) | | 9,157 | 146,146 |
| | | | 41,586,112 |
TOTAL ENERGY | | | 45,301,652 |
| FINANCIALS - 15.1% | | | |
| Banks - 4.5% | | | |
| Bank of Hawaii Corp. (b) | | 15,359 | 1,174,810 |
| Bank OZK | | 43,429 | 1,983,402 |
| BOK Financial Corp. | | 11,273 | 1,132,937 |
| Comerica, Inc. | | 50,740 | 3,719,749 |
| Commerce Bancshares, Inc. | | 44,158 | 2,939,156 |
| Cullen/Frost Bankers, Inc. | | 22,655 | 2,951,493 |
| East West Bancorp, Inc. | | 54,931 | 4,313,182 |
| First Citizens Bancshares, Inc. | | 4,266 | 3,317,583 |
| First Hawaiian, Inc. | | 49,610 | 1,361,298 |
| First Horizon National Corp. | | 205,549 | 5,083,227 |
| FNB Corp., Pennsylvania | | 135,538 | 1,934,127 |
| PacWest Bancorp | | 45,138 | 1,248,517 |
| Pinnacle Financial Partners, Inc. | | 29,109 | 2,291,752 |
| Popular, Inc. | | 27,667 | 1,899,063 |
| Prosperity Bancshares, Inc. | | 34,008 | 2,579,847 |
| Signature Bank | | 24,067 | 3,103,440 |
| Synovus Financial Corp. | | 55,919 | 2,345,802 |
| Umpqua Holdings Corp. | | 83,917 | 1,527,289 |
| Webster Financial Corp. | | 67,127 | 3,534,237 |
| Western Alliance Bancorp. | | 41,067 | 3,095,220 |
| Wintrust Financial Corp. | | 23,270 | 2,128,507 |
| Zions Bancorp NA | | 57,183 | 3,039,848 |
| | | | 56,704,486 |
| Capital Markets - 4.0% | | | |
| Affiliated Managers Group, Inc. | | 14,519 | 2,508,012 |
| Carlyle Group LP | | 80,416 | 2,892,564 |
| Cboe Global Markets, Inc. | | 41,126 | 5,053,563 |
| Evercore, Inc. Class A | | 14,161 | 1,838,239 |
| FactSet Research Systems, Inc. | | 14,743 | 6,235,404 |
| Invesco Ltd. | | 145,040 | 2,684,690 |
| Janus Henderson Group PLC | | 52,826 | 1,369,250 |
| Jefferies Financial Group, Inc. | | 77,808 | 3,056,298 |
| Lazard Ltd. Class A | | 32,152 | 1,288,652 |
| LPL Financial | | 30,924 | 7,332,699 |
| MarketAxess Holdings, Inc. | | 14,428 | 5,249,628 |
| Morningstar, Inc. | | 9,658 | 2,345,735 |
| Robinhood Markets, Inc. (a)(b) | | 218,294 | 2,272,441 |
| SEI Investments Co. | | 39,942 | 2,493,579 |
| Stifel Financial Corp. | | 40,127 | 2,704,961 |
| Virtu Financial, Inc. Class A | | 36,643 | 707,576 |
| | | | 50,033,291 |
| Consumer Finance - 0.6% | | | |
| Credit Acceptance Corp. (a)(b) | | 2,605 | 1,205,177 |
| OneMain Holdings, Inc. | | 44,582 | 1,923,267 |
| SLM Corp. | | 97,133 | 1,706,627 |
| SoFi Technologies, Inc. (a)(b) | | 312,927 | 2,168,584 |
| Upstart Holdings, Inc. (a)(b) | | 27,390 | 511,645 |
| | | | 7,515,300 |
| Diversified Financial Services - 0.3% | | | |
| Corebridge Financial, Inc. | | 31,141 | 677,628 |
| Voya Financial, Inc. (b) | | 37,804 | 2,637,585 |
| | | | 3,315,213 |
| Insurance - 4.4% | | | |
| American Financial Group, Inc. | | 26,135 | 3,726,590 |
| Assurant, Inc. | | 20,667 | 2,740,238 |
| Assured Guaranty Ltd. | | 22,370 | 1,400,362 |
| Axis Capital Holdings Ltd. | | 30,221 | 1,890,928 |
| Brighthouse Financial, Inc. (a) | | 26,652 | 1,499,708 |
| Brown & Brown, Inc. | | 91,833 | 5,377,740 |
| Erie Indemnity Co. Class A | | 9,738 | 2,379,480 |
| Everest Re Group Ltd. | | 15,116 | 5,285,914 |
| First American Financial Corp. | | 39,184 | 2,424,314 |
| Globe Life, Inc. | | 34,736 | 4,197,846 |
| Hanover Insurance Group, Inc. | | 13,748 | 1,850,206 |
| Kemper Corp. | | 24,670 | 1,448,869 |
| Lincoln National Corp. | | 65,904 | 2,334,979 |
| Old Republic International Corp. | | 108,445 | 2,861,864 |
| Primerica, Inc. | | 14,240 | 2,303,320 |
| Reinsurance Group of America, Inc. | | 25,954 | 3,939,039 |
| RenaissanceRe Holdings Ltd. | | 16,722 | 3,272,328 |
| Ryan Specialty Group Holdings, Inc. (a)(b) | | 31,944 | 1,361,453 |
| Unum Group | | 76,964 | 3,234,797 |
| White Mountains Insurance Group Ltd. | | 970 | 1,482,121 |
| | | | 55,012,096 |
| Mortgage Real Estate Investment Trusts - 0.9% | | | |
| AGNC Investment Corp. | | 221,598 | 2,570,537 |
| Annaly Capital Management, Inc. | | 181,553 | 4,261,049 |
| Rithm Capital Corp. | | 168,150 | 1,582,292 |
| Starwood Property Trust, Inc. (b) | | 113,445 | 2,369,866 |
| | | | 10,783,744 |
| Thrifts & Mortgage Finance - 0.4% | | | |
| MGIC Investment Corp. | | 114,712 | 1,619,733 |
| New York Community Bancorp, Inc. | | 259,982 | 2,597,220 |
| TFS Financial Corp. (b) | | 19,452 | 277,191 |
| UWM Holdings Corp. Class A (b) | | 36,009 | 164,921 |
| | | | 4,659,065 |
TOTAL FINANCIALS | | | 188,023,195 |
| HEALTH CARE - 9.5% | | | |
| Biotechnology - 2.4% | | | |
| Exact Sciences Corp. (a)(b) | | 67,905 | 4,584,946 |
| Exelixis, Inc. (a) | | 122,731 | 2,162,520 |
| Ionis Pharmaceuticals, Inc. (a) | | 54,858 | 2,187,188 |
| Mirati Therapeutics, Inc. (a)(b) | | 17,333 | 925,756 |
| Natera, Inc. (a) | | 37,936 | 1,628,592 |
| Neurocrine Biosciences, Inc. (a) | | 36,813 | 4,083,666 |
| Novavax, Inc. (a)(b) | | 30,313 | 330,715 |
| Repligen Corp. (a) | | 21,481 | 3,980,429 |
| Sarepta Therapeutics, Inc. (a)(b) | | 32,685 | 4,084,644 |
| Ultragenyx Pharmaceutical, Inc. (a) | | 25,936 | 1,175,679 |
| United Therapeutics Corp. (a) | | 17,325 | 4,559,420 |
| | | | 29,703,555 |
| Health Care Equipment & Supplies - 2.0% | | | |
| Dentsply Sirona, Inc. | | 83,230 | 3,065,361 |
| Enovis Corp. (a) | | 19,664 | 1,237,849 |
| Envista Holdings Corp. (a) | | 63,215 | 2,464,753 |
| Globus Medical, Inc. (a) | | 29,663 | 2,239,557 |
| ICU Medical, Inc. (a)(b) | | 7,833 | 1,513,571 |
| Integra LifeSciences Holdings Corp. (a) | | 28,129 | 1,611,792 |
| Masimo Corp. (a) | | 18,427 | 3,134,064 |
| Novocure Ltd. (a)(b) | | 40,131 | 3,659,145 |
| Penumbra, Inc. (a) | | 13,852 | 3,468,679 |
| QuidelOrtho Corp. (a) | | 18,935 | 1,621,025 |
| Tandem Diabetes Care, Inc. (a) | | 24,783 | 1,009,659 |
| | | | 25,025,455 |
| Health Care Providers & Services - 2.3% | | | |
| Acadia Healthcare Co., Inc. (a) | | 34,588 | 2,906,084 |
| agilon health, Inc. (a)(b) | | 73,434 | 1,597,924 |
| Amedisys, Inc. (a) | | 12,419 | 1,200,421 |
| Chemed Corp. | | 5,674 | 2,866,164 |
| DaVita HealthCare Partners, Inc. (a) | | 21,604 | 1,779,954 |
| Encompass Health Corp. | | 38,037 | 2,375,411 |
| Enhabit Home Health & Hospice (a) | | 19,018 | 292,116 |
| Guardant Health, Inc. (a)(b) | | 37,852 | 1,189,688 |
| Henry Schein, Inc. (a) | | 52,516 | 4,524,253 |
| Oak Street Health, Inc. (a)(b) | | 45,246 | 1,314,849 |
| Premier, Inc. | | 45,725 | 1,525,386 |
| Signify Health, Inc. (a) | | 31,441 | 894,811 |
| Tenet Healthcare Corp. (a) | | 41,286 | 2,264,537 |
| Universal Health Services, Inc. Class B | | 24,099 | 3,571,713 |
| | | | 28,303,311 |
| Health Care Technology - 0.3% | | | |
| Certara, Inc. (a) | | 45,142 | 875,755 |
| Definitive Healthcare Corp. (a)(b) | | 13,295 | 164,592 |
| Doximity, Inc. (a) | | 43,416 | 1,531,282 |
| Teladoc Health, Inc. (a)(b) | | 62,374 | 1,833,796 |
| | | | 4,405,425 |
| Life Sciences Tools & Services - 1.8% | | | |
| 10X Genomics, Inc. (a) | | 35,744 | 1,673,892 |
| Azenta, Inc. (a) | | 28,765 | 1,607,964 |
| Bio-Techne Corp. | | 60,436 | 4,814,332 |
| Bruker Corp. | | 41,644 | 2,920,077 |
| Charles River Laboratories International, Inc. (a) | | 19,586 | 4,764,295 |
| Maravai LifeSciences Holdings, Inc. (a) | | 42,651 | 625,264 |
| QIAGEN NV (a) | | 88,110 | 4,317,390 |
| Sotera Health Co. (a) | | 38,387 | 661,792 |
| Syneos Health, Inc. (a) | | 39,800 | 1,429,616 |
| | | | 22,814,622 |
| Pharmaceuticals - 0.7% | | | |
| Jazz Pharmaceuticals PLC (a) | | 23,913 | 3,746,211 |
| Organon & Co. | | 98,704 | 2,973,952 |
| Perrigo Co. PLC | | 52,162 | 1,951,902 |
| | | | 8,672,065 |
TOTAL HEALTH CARE | | | 118,924,433 |
| INDUSTRIALS - 19.6% | | | |
| Aerospace & Defense - 2.5% | | | |
| Axon Enterprise, Inc. (a) | | 26,238 | 5,127,955 |
| BWX Technologies, Inc. | | 35,462 | 2,158,217 |
| Curtiss-Wright Corp. | | 14,873 | 2,465,943 |
| Hexcel Corp. | | 32,547 | 2,297,167 |
| Howmet Aerospace, Inc. | | 144,163 | 5,865,992 |
| Huntington Ingalls Industries, Inc. | | 15,287 | 3,371,395 |
| Mercury Systems, Inc. (a) | | 19,107 | 955,063 |
| Spirit AeroSystems Holdings, Inc. Class A | | 40,532 | 1,465,232 |
| Textron, Inc. | | 81,004 | 5,901,141 |
| Woodward, Inc. | | 22,861 | 2,337,766 |
| | | | 31,945,871 |
| Air Freight & Logistics - 0.2% | | | |
| GXO Logistics, Inc. (a)(b) | | 41,027 | 2,146,943 |
| Airlines - 0.7% | | | |
| Alaska Air Group, Inc. (a) | | 48,050 | 2,466,887 |
| American Airlines Group, Inc. (a) | | 250,882 | 4,049,235 |
| Copa Holdings SA Class A (a)(b) | | 11,142 | 1,025,955 |
| JetBlue Airways Corp. (a) | | 124,577 | 996,616 |
| | | | 8,538,693 |
| Building Products - 2.8% | | | |
| A.O. Smith Corp. | | 48,594 | 3,289,814 |
| Advanced Drain Systems, Inc. | | 24,885 | 2,509,403 |
| Allegion PLC | | 34,038 | 4,001,167 |
| Armstrong World Industries, Inc. | | 17,594 | 1,361,952 |
| Builders FirstSource, Inc. (a) | | 56,488 | 4,502,094 |
| Carlisle Companies, Inc. | | 19,975 | 5,010,929 |
| Fortune Brands Home & Security, Inc. | | 50,144 | 3,234,789 |
| Hayward Holdings, Inc. (a)(b) | | 26,157 | 352,858 |
| Lennox International, Inc. | | 12,409 | 3,234,034 |
| MasterBrand, Inc. (a) | | 50,144 | 461,325 |
| Owens Corning | | 36,232 | 3,501,823 |
| The AZEK Co., Inc. (a)(b) | | 43,205 | 1,042,537 |
| Trex Co., Inc. (a) | | 42,788 | 2,255,783 |
| | | | 34,758,508 |
| Commercial Services & Supplies - 1.0% | | | |
| Clean Harbors, Inc. (a) | | 19,798 | 2,579,679 |
| Driven Brands Holdings, Inc. (a) | | 24,157 | 705,143 |
| IAA, Inc. (a) | | 51,986 | 2,169,376 |
| MSA Safety, Inc. | | 14,338 | 1,955,560 |
| Stericycle, Inc. (a) | | 35,600 | 1,915,636 |
| Tetra Tech, Inc. | | 20,424 | 3,176,340 |
| | | | 12,501,734 |
| Construction & Engineering - 1.9% | | | |
| AECOM | | 51,150 | 4,463,861 |
| MasTec, Inc. (a) | | 23,676 | 2,325,693 |
| MDU Resources Group, Inc. | | 78,456 | 2,425,075 |
| Quanta Services, Inc. | | 55,279 | 8,412,910 |
| Valmont Industries, Inc. | | 8,160 | 2,690,597 |
| Willscot Mobile Mini Holdings (a) | | 79,000 | 3,828,340 |
| | | | 24,146,476 |
| Electrical Equipment - 2.0% | | | |
| Acuity Brands, Inc. | | 12,451 | 2,347,263 |
| ChargePoint Holdings, Inc. Class A (a)(b) | | 98,306 | 1,193,435 |
| Hubbell, Inc. Class B | | 20,800 | 4,761,328 |
| nVent Electric PLC | | 64,163 | 2,550,479 |
| Plug Power, Inc. (a)(b) | | 201,749 | 3,433,768 |
| Regal Rexnord Corp. | | 25,698 | 3,577,162 |
| Sensata Technologies, Inc. PLC | | 58,731 | 2,986,471 |
| Sunrun, Inc. (a) | | 80,898 | 2,125,999 |
| Vertiv Holdings Co. | | 117,909 | 1,676,666 |
| | | | 24,652,571 |
| Machinery - 4.1% | | | |
| AGCO Corp. | | 24,109 | 3,330,176 |
| Allison Transmission Holdings, Inc. | | 35,777 | 1,612,827 |
| Crane Holdings Co. | | 18,270 | 2,117,676 |
| Donaldson Co., Inc. | | 47,908 | 2,987,064 |
| ESAB Corp. | | 19,687 | 1,138,105 |
| Flowserve Corp. | | 50,573 | 1,740,723 |
| Gates Industrial Corp. PLC (a) | | 41,910 | 553,631 |
| Graco, Inc. | | 65,194 | 4,454,054 |
| ITT, Inc. | | 32,425 | 2,969,806 |
| Lincoln Electric Holdings, Inc. | | 21,760 | 3,631,091 |
| Middleby Corp. (a) | | 20,768 | 3,228,386 |
| Nordson Corp. | | 22,217 | 5,405,396 |
| Oshkosh Corp. | | 25,504 | 2,570,293 |
| Pentair PLC | | 63,910 | 3,539,336 |
| Snap-On, Inc. | | 20,425 | 5,080,310 |
| Timken Co. | | 23,753 | 1,956,060 |
| Toro Co. | | 40,533 | 4,520,240 |
| | | | 50,835,174 |
| Marine - 0.1% | | | |
| Kirby Corp. (a) | | 23,185 | 1,641,034 |
| Professional Services - 1.8% | | | |
| Booz Allen Hamilton Holding Corp. Class A | | 50,993 | 4,825,978 |
| CACI International, Inc. Class A (a) | | 8,998 | 2,772,194 |
| Clarivate Analytics PLC (a) | | 183,351 | 2,038,863 |
| Dun & Bradstreet Holdings, Inc. | | 97,653 | 1,430,616 |
| FTI Consulting, Inc. (a)(b) | | 13,090 | 2,088,117 |
| KBR, Inc. | | 52,932 | 2,711,706 |
| Manpower, Inc. | | 19,517 | 1,701,102 |
| Robert Half International, Inc. | | 41,052 | 3,446,726 |
| Science Applications International Corp. | | 21,351 | 2,215,807 |
| | | | 23,231,109 |
| Road & Rail - 1.3% | | | |
| Avis Budget Group, Inc. (a) | | 9,919 | 1,984,197 |
| Hertz Global Holdings, Inc. (a) | | 73,330 | 1,321,407 |
| Knight-Swift Transportation Holdings, Inc. Class A | | 60,596 | 3,581,224 |
| Landstar System, Inc. | | 13,854 | 2,394,387 |
| RXO, Inc. (a) | | 39,758 | 728,367 |
| Ryder System, Inc. | | 18,868 | 1,781,328 |
| Schneider National, Inc. Class B | | 20,978 | 555,917 |
| U-Haul Holding Co. (b) | | 3,494 | 234,203 |
| U-Haul Holding Co. (non-vtg.) | | 31,453 | 1,943,481 |
| XPO, Inc. (a)(b) | | 39,758 | 1,584,754 |
| | | | 16,109,265 |
| Trading Companies & Distributors - 1.2% | | | |
| Air Lease Corp. Class A | | 40,350 | 1,814,540 |
| Core & Main, Inc. (a)(b) | | 27,681 | 610,920 |
| MSC Industrial Direct Co., Inc. Class A | | 17,946 | 1,484,134 |
| SiteOne Landscape Supply, Inc. (a)(b) | | 17,281 | 2,618,244 |
| Univar Solutions, Inc. (a) | | 62,450 | 2,153,276 |
| Watsco, Inc. (b) | | 12,796 | 3,677,187 |
| WESCO International, Inc. (a) | | 17,304 | 2,578,469 |
| | | | 14,936,770 |
TOTAL INDUSTRIALS | | | 245,444,148 |
| INFORMATION TECHNOLOGY - 14.5% | | | |
| Communications Equipment - 1.0% | | | |
| Ciena Corp. (a) | | 57,231 | 2,977,157 |
| F5, Inc. (a) | | 23,127 | 3,414,933 |
| Juniper Networks, Inc. | | 124,135 | 4,009,561 |
| Lumentum Holdings, Inc. (a) | | 26,455 | 1,592,062 |
| ViaSat, Inc. (a)(b) | | 27,906 | 961,362 |
| | | | 12,955,075 |
| Electronic Equipment & Components - 1.9% | | | |
| Arrow Electronics, Inc. (a) | | 23,794 | 2,795,557 |
| Avnet, Inc. | | 35,322 | 1,620,573 |
| Cognex Corp. | | 67,493 | 3,694,567 |
| Coherent Corp. (a) | | 46,086 | 2,000,132 |
| IPG Photonics Corp. (a) | | 12,664 | 1,419,634 |
| Jabil, Inc. | | 51,053 | 4,014,297 |
| Littelfuse, Inc. | | 9,389 | 2,410,062 |
| National Instruments Corp. | | 50,792 | 2,742,768 |
| TD SYNNEX Corp. | | 18,135 | 1,852,490 |
| Vontier Corp. | | 61,317 | 1,412,131 |
| | | | 23,962,211 |
| IT Services - 2.9% | | | |
| Affirm Holdings, Inc. (a)(b) | | 84,500 | 1,368,055 |
| Amdocs Ltd. | | 46,921 | 4,313,448 |
| Concentrix Corp. | | 16,511 | 2,341,425 |
| DXC Technology Co. (a) | | 89,349 | 2,566,997 |
| Euronet Worldwide, Inc. (a) | | 18,341 | 2,066,664 |
| Genpact Ltd. | | 70,122 | 3,315,368 |
| Globant SA (a) | | 15,812 | 2,564,390 |
| Jack Henry & Associates, Inc. | | 28,193 | 5,077,277 |
| Kyndryl Holdings, Inc. (a) | | 79,380 | 1,062,898 |
| Shift4 Payments, Inc. (a) | | 19,603 | 1,255,376 |
| The Western Union Co. | | 149,455 | 2,117,777 |
| Thoughtworks Holding, Inc. (a) | | 33,067 | 357,124 |
| Toast, Inc. (a)(b) | | 99,030 | 2,209,359 |
| WEX, Inc. (a) | | 16,904 | 3,126,733 |
| Wix.com Ltd. (a) | | 21,412 | 1,862,416 |
| | | | 35,605,307 |
| Semiconductors & Semiconductor Equipment - 2.2% | | | |
| Allegro MicroSystems LLC (a) | | 25,744 | 982,648 |
| Cirrus Logic, Inc. (a) | | 21,282 | 1,923,680 |
| Entegris, Inc. | | 57,650 | 4,652,932 |
| First Solar, Inc. (a) | | 41,266 | 7,328,842 |
| Lattice Semiconductor Corp. (a) | | 52,710 | 3,994,891 |
| MKS Instruments, Inc. | | 22,255 | 2,277,132 |
| Universal Display Corp. | | 16,872 | 2,236,046 |
| Wolfspeed, Inc. (a)(b) | | 47,830 | 3,683,388 |
| | | | 27,079,559 |
| Software - 6.2% | | | |
| Alteryx, Inc. Class A (a) | | 23,321 | 1,294,082 |
| AppLovin Corp. (a)(b) | | 85,002 | 1,079,525 |
| Aspen Technology, Inc. (a)(b) | | 10,471 | 2,081,111 |
| Bentley Systems, Inc. Class B | | 65,487 | 2,557,267 |
| Bill.Com Holdings, Inc. (a) | | 38,413 | 4,441,311 |
| Black Knight, Inc. (a) | | 60,031 | 3,637,278 |
| CCC Intelligent Solutions Holdings, Inc. Class A (a) | | 66,372 | 613,941 |
| Ceridian HCM Holding, Inc. (a) | | 53,156 | 3,842,116 |
| Confluent, Inc. (a) | | 48,242 | 1,114,390 |
| Coupa Software, Inc. (a) | | 29,224 | 2,335,582 |
| Dolby Laboratories, Inc. Class A | | 23,701 | 1,885,652 |
| DoubleVerify Holdings, Inc. (a) | | 28,480 | 774,371 |
| Dropbox, Inc. Class A (a) | | 104,197 | 2,420,496 |
| Dynatrace, Inc. (a) | | 77,257 | 2,968,987 |
| Elastic NV (a) | | 30,056 | 1,768,495 |
| Fair Isaac Corp. (a) | | 9,432 | 6,281,240 |
| Five9, Inc. (a) | | 27,193 | 2,142,265 |
| Gen Digital, Inc. | | 217,283 | 4,999,682 |
| Guidewire Software, Inc. (a) | | 31,833 | 2,331,449 |
| Informatica, Inc. (a)(b) | | 14,297 | 254,487 |
| Jamf Holding Corp. (a) | | 25,697 | 510,599 |
| Manhattan Associates, Inc. (a) | | 24,100 | 3,141,676 |
| nCino, Inc. (a)(b) | | 27,047 | 773,544 |
| NCR Corp. (a) | | 49,373 | 1,353,808 |
| New Relic, Inc. (a) | | 20,695 | 1,263,430 |
| Nutanix, Inc. Class A (a) | | 89,201 | 2,486,032 |
| Paycor HCM, Inc. (a)(b) | | 21,269 | 534,065 |
| Paylocity Holding Corp. (a) | | 15,421 | 3,212,040 |
| Pegasystems, Inc. | | 16,056 | 624,257 |
| Procore Technologies, Inc. (a)(b) | | 27,619 | 1,545,283 |
| PTC, Inc. (a) | | 40,914 | 5,518,480 |
| RingCentral, Inc. (a) | | 33,094 | 1,291,659 |
| SentinelOne, Inc. (a) | | 74,170 | 1,119,225 |
| Smartsheet, Inc. (a) | | 49,383 | 2,133,839 |
| Teradata Corp. (a) | | 39,747 | 1,386,375 |
| UiPath, Inc. Class A (a)(b) | | 146,418 | 2,248,980 |
| | | | 77,967,019 |
| Technology Hardware, Storage & Peripherals - 0.3% | | | |
| Pure Storage, Inc. Class A (a) | | 109,281 | 3,162,592 |
TOTAL INFORMATION TECHNOLOGY | | | 180,731,763 |
| MATERIALS - 7.0% | | | |
| Chemicals - 1.9% | | | |
| Ashland, Inc. | | 19,673 | 2,149,669 |
| Axalta Coating Systems Ltd. (a) | | 85,760 | 2,581,376 |
| Element Solutions, Inc. | | 87,566 | 1,793,352 |
| Ginkgo Bioworks Holdings, Inc. Class A (a)(b) | | 339,181 | 661,403 |
| Huntsman Corp. | | 70,808 | 2,243,906 |
| NewMarket Corp. | | 2,264 | 779,971 |
| Olin Corp. | | 49,023 | 3,166,396 |
| RPM International, Inc. | | 49,573 | 4,457,108 |
| The Chemours Co. LLC | | 58,199 | 2,117,862 |
| The Scotts Miracle-Gro Co. Class A (b) | | 15,676 | 1,131,650 |
| Valvoline, Inc. | | 68,677 | 2,517,699 |
| | | | 23,600,392 |
| Construction Materials - 0.2% | | | |
| Eagle Materials, Inc. | | 14,195 | 2,073,606 |
| Containers & Packaging - 2.5% | | | |
| Aptargroup, Inc. | | 25,433 | 2,941,072 |
| Ardagh Group SA (a) | | 5,444 | 58,414 |
| Ardagh Metal Packaging SA (b) | | 57,921 | 325,516 |
| Avery Dennison Corp. | | 31,629 | 5,991,798 |
| Berry Global Group, Inc. | | 48,636 | 3,002,300 |
| Crown Holdings, Inc. | | 44,708 | 3,941,457 |
| Graphic Packaging Holding Co. | | 118,789 | 2,861,627 |
| Packaging Corp. of America | | 35,448 | 5,058,430 |
| Sealed Air Corp. | | 56,616 | 3,100,292 |
| Silgan Holdings, Inc. | | 32,661 | 1,760,101 |
| Sonoco Products Co. | | 37,795 | 2,309,652 |
| | | | 31,350,659 |
| Metals & Mining - 2.3% | | | |
| Alcoa Corp. | | 68,668 | 3,587,216 |
| Cleveland-Cliffs, Inc. (a) | | 198,490 | 4,237,762 |
| MP Materials Corp. (a)(b) | | 35,241 | 1,145,685 |
| Reliance Steel & Aluminum Co. | | 22,683 | 5,159,248 |
| Royal Gold, Inc. (b) | | 25,454 | 3,233,422 |
| SSR Mining, Inc. (b) | | 80,012 | 1,355,403 |
| Steel Dynamics, Inc. | | 64,671 | 7,801,909 |
| United States Steel Corp. | | 90,161 | 2,568,687 |
| | | | 29,089,332 |
| Paper & Forest Products - 0.1% | | | |
| Louisiana-Pacific Corp. | | 27,605 | 1,879,624 |
TOTAL MATERIALS | | | 87,993,613 |
| REAL ESTATE - 9.2% | | | |
| Equity Real Estate Investment Trusts (REITs) - 8.5% | | | |
| American Homes 4 Rent Class A | | 119,559 | 4,099,678 |
| Americold Realty Trust | | 104,401 | 3,279,235 |
| Apartment Income (REIT) Corp. | | 58,148 | 2,224,742 |
| Brixmor Property Group, Inc. | | 115,852 | 2,725,998 |
| Camden Property Trust (SBI) | | 40,269 | 4,961,543 |
| Cousins Properties, Inc. | | 58,660 | 1,608,457 |
| CubeSmart | | 86,823 | 3,975,625 |
| Douglas Emmett, Inc. | | 65,648 | 1,099,604 |
| EastGroup Properties, Inc. | | 15,977 | 2,688,130 |
| EPR Properties | | 28,755 | 1,221,512 |
| Equity Lifestyle Properties, Inc. | | 68,988 | 4,951,959 |
| Federal Realty Investment Trust (SBI) | | 31,176 | 3,477,059 |
| First Industrial Realty Trust, Inc. | | 51,167 | 2,729,759 |
| Gaming & Leisure Properties | | 94,841 | 5,079,684 |
| Healthcare Trust of America, Inc. | | 147,270 | 3,170,723 |
| Highwoods Properties, Inc. (SBI) | | 40,349 | 1,225,399 |
| Host Hotels & Resorts, Inc. | | 274,991 | 5,183,580 |
| Hudson Pacific Properties, Inc. | | 53,435 | 608,625 |
| Iron Mountain, Inc. | | 112,135 | 6,120,328 |
| JBG SMITH Properties | | 41,496 | 835,729 |
| Kilroy Realty Corp. | | 45,141 | 1,852,587 |
| Kimco Realty Corp. | | 234,620 | 5,269,565 |
| Lamar Advertising Co. Class A | | 33,585 | 3,578,146 |
| Life Storage, Inc. | | 32,676 | 3,530,315 |
| Medical Properties Trust, Inc. (b) | | 230,683 | 2,987,345 |
| National Retail Properties, Inc. | | 69,238 | 3,278,419 |
| National Storage Affiliates Trust | | 32,974 | 1,345,339 |
| Omega Healthcare Investors, Inc. | | 91,282 | 2,687,342 |
| Park Hotels & Resorts, Inc. | | 86,572 | 1,273,474 |
| Rayonier, Inc. | | 56,592 | 2,059,383 |
| Regency Centers Corp. | | 66,562 | 4,435,026 |
| Rexford Industrial Realty, Inc. | | 71,340 | 4,527,950 |
| SL Green Realty Corp. | | 24,862 | 1,023,071 |
| Spirit Realty Capital, Inc. | | 54,051 | 2,371,758 |
| Store Capital Corp. | | 98,682 | 3,178,547 |
| Vornado Realty Trust | | 68,532 | 1,671,495 |
| | | | 106,337,131 |
| Real Estate Management & Development - 0.7% | | | |
| Howard Hughes Corp. (a) | | 14,226 | 1,216,181 |
| Jones Lang LaSalle, Inc. (a) | | 18,541 | 3,427,675 |
| Opendoor Technologies, Inc. (a)(b) | | 181,534 | 397,559 |
| WeWork, Inc. (a)(b) | | 82,972 | 131,925 |
| Zillow Group, Inc.: | | | |
| Class A (a) | | 21,886 | 940,223 |
| Class C (a)(b) | | 61,312 | 2,710,604 |
| | | | 8,824,167 |
TOTAL REAL ESTATE | | | 115,161,298 |
| UTILITIES - 2.6% | | | |
| Electric Utilities - 1.1% | | | |
| Hawaiian Electric Industries, Inc. | | 42,252 | 1,785,992 |
| IDACORP, Inc. | | 19,547 | 2,068,268 |
| NRG Energy, Inc. | | 88,995 | 3,045,409 |
| OGE Energy Corp. | | 77,564 | 3,049,816 |
| Pinnacle West Capital Corp. | | 43,850 | 3,269,018 |
| | | | 13,218,503 |
| Gas Utilities - 0.4% | | | |
| National Fuel Gas Co. | | 34,044 | 1,976,595 |
| UGI Corp. | | 81,318 | 3,238,896 |
| | | | 5,215,491 |
| Independent Power and Renewable Electricity Producers - 0.4% | | | |
| Brookfield Renewable Corp. (b) | | 49,597 | 1,563,297 |
| Vistra Corp. | | 152,605 | 3,519,071 |
| | | | 5,082,368 |
| Multi-Utilities - 0.4% | | | |
| NiSource, Inc. | | 157,735 | 4,377,146 |
| Water Utilities - 0.3% | | | |
| Essential Utilities, Inc. | | 89,888 | 4,200,466 |
TOTAL UTILITIES | | | 32,093,974 |
| TOTAL COMMON STOCKS (Cost $1,083,970,424) | | | 1,246,567,256 |
| | | | |
| U.S. Treasury Obligations - 0.0% |
| | | Principal Amount (c) | Value ($) |
U.S. Treasury Bills, yield at date of purchase 4.65% 6/29/23 (d) (Cost $98,124) | | 100,000 | 98,123 |
| | | | |
| Money Market Funds - 6.4% |
| | | Shares | Value ($) |
| Fidelity Cash Central Fund 4.38% (e) | | 2,524,085 | 2,524,590 |
| Fidelity Securities Lending Cash Central Fund 4.38% (e)(f) | | 76,934,720 | 76,942,413 |
| TOTAL MONEY MARKET FUNDS (Cost $79,467,003) | | | 79,467,003 |
| | | | |
| TOTAL INVESTMENT IN SECURITIES - 106.1% (Cost $1,163,535,551) | 1,326,132,382 |
NET OTHER ASSETS (LIABILITIES) - (6.1)% | (76,370,205) |
| NET ASSETS - 100.0% | 1,249,762,177 |
| | |
| Futures Contracts |
| | Number of contracts | Expiration Date | Notional Amount ($) | Value ($) | Unrealized Appreciation/ (Depreciation) ($) |
| Purchased | | | | | |
| | | | | | |
| Equity Index Contracts | | | | | |
| CME E-mini S&P MidCap 400 Index Contracts (United States) | 12 | Mar 2023 | 3,195,480 | 240,333 | 240,333 |
| | | | | | |
| The notional amount of futures purchased as a percentage of Net Assets is 0.3% |
Legend
| (b) | Security or a portion of the security is on loan at period end. |
| (c) | Amount is stated in United States dollars unless otherwise noted. |
| (d) | Security or a portion of the security was pledged to cover margin requirements for futures contracts. At period end, the value of securities pledged amounted to $98,123. |
| (e) | Affiliated fund that is generally available only to investment companies and other accounts managed by Fidelity Investments. The rate quoted is the annualized seven-day yield of the fund at period end. A complete unaudited listing of the fund's holdings as of its most recent quarter end is available upon request. In addition, each Fidelity Central Fund's financial statements are available on the SEC's website or upon request. |
| (f) | Investment made with cash collateral received from securities on loan. |
Affiliated Central Funds
Fiscal year to date information regarding the Fund's investments in Fidelity Central Funds, including the ownership percentage, is presented below.
| Affiliate | Value, beginning of period ($) | Purchases ($) | Sales Proceeds ($) | Dividend Income ($) | Realized Gain (loss) ($) | Change in Unrealized appreciation (depreciation) ($) | Value, end of period ($) | % ownership, end of period |
| Fidelity Cash Central Fund 4.38% | 413,829 | 165,277,435 | 163,166,674 | 78,666 | - | - | 2,524,590 | 0.0% |
| Fidelity Securities Lending Cash Central Fund 4.38% | 12,727,695 | 112,961,414 | 48,746,696 | 217,699 | - | - | 76,942,413 | 0.3% |
| Total | 13,141,524 | 278,238,849 | 211,913,370 | 296,365 | - | - | 79,467,003 | |
| | | | | | | | | |
Amounts in the dividend income column in the above table include any capital gain distributions from underlying funds, which are presented in the corresponding line item in the Statement of Operations, if applicable.
Amount for Fidelity Securities Lending Cash Central Fund represents the income earned on investing cash collateral, less rebates paid to borrowers and any lending agent fees associated with the loan, plus any premium payments received for lending certain types of securities.
Amounts included in the purchases and sales proceeds columns may include in-kind transactions, if applicable.
Investment Valuation
The following is a summary of the inputs used, as of January 31, 2023, involving the Fund's assets and liabilities carried at fair value. The inputs or methodology used for valuing securities may not be an indication of the risk associated with investing in those securities. For more information on valuation inputs, and their aggregation into the levels used below, please refer to the Investment Valuation section in the accompanying Notes to Financial Statements.
| Valuation Inputs at Reporting Date: |
| Description | Total ($) | Level 1 ($) | Level 2 ($) | Level 3 ($) |
Investments in Securities: | | | | |
|
| Equities: | | | | |
Communication Services | 32,335,409 | 32,335,409 | - | - |
Consumer Discretionary | 161,279,840 | 161,279,840 | - | - |
Consumer Staples | 39,277,931 | 39,277,931 | - | - |
Energy | 45,301,652 | 45,301,652 | - | - |
Financials | 188,023,195 | 188,023,195 | - | - |
Health Care | 118,924,433 | 118,924,433 | - | - |
Industrials | 245,444,148 | 245,444,148 | - | - |
Information Technology | 180,731,763 | 180,731,763 | - | - |
Materials | 87,993,613 | 87,993,613 | - | - |
Real Estate | 115,161,298 | 115,161,298 | - | - |
Utilities | 32,093,974 | 32,093,974 | - | - |
|
| U.S. Government and Government Agency Obligations | 98,123 | - | 98,123 | - |
|
| Money Market Funds | 79,467,003 | 79,467,003 | - | - |
| Total Investments in Securities: | 1,326,132,382 | 1,326,034,259 | 98,123 | - |
Derivative Instruments: | | | | |
|
| Assets | | | | |
Futures Contracts | 240,333 | 240,333 | - | - |
| Total Assets | 240,333 | 240,333 | - | - |
| Total Derivative Instruments: | 240,333 | 240,333 | - | - |
Value of Derivative Instruments
The following table is a summary of the Fund's value of derivative instruments by primary risk exposure as of January 31, 2023. For additional information on derivative instruments, please refer to the Derivative Instruments section in the accompanying Notes to Financial Statements.
Primary Risk Exposure / Derivative Type | Value |
| Asset ($) | Liability ($) |
| Equity Risk | | |
Futures Contracts (a) | 240,333 | 0 |
| Total Equity Risk | 240,333 | 0 |
| Total Value of Derivatives | 240,333 | 0 |
(a)Reflects gross cumulative appreciation (depreciation) on futures contracts as presented in the Schedule of Investments. In the Statement of Assets and Liabilities, the period end daily variation margin is included in receivable or payable for daily variation margin on futures contracts, and the net cumulative appreciation (depreciation) is included in Total accumulated earnings (loss).
| Statement of Assets and Liabilities |
| | | | January 31, 2023 (Unaudited) |
| | | | | |
| Assets | | | | |
| Investment in securities, at value (including securities loaned of $77,376,761) - See accompanying schedule: | | | | |
Unaffiliated issuers (cost $1,084,068,548) | $ | 1,246,665,379 | | |
Fidelity Central Funds (cost $79,467,003) | | 79,467,003 | | |
| | | | | |
| | | | | |
| Total Investment in Securities (cost $1,163,535,551) | | | $ | 1,326,132,382 |
| Segregated cash with brokers for derivative instruments | | | | 56,379 |
| Cash | | | | 56,239 |
| Receivable for fund shares sold | | | | 150,420 |
| Dividends receivable | | | | 430,609 |
| Distributions receivable from Fidelity Central Funds | | | | 130,837 |
| Receivable for daily variation margin on futures contracts | | | | 68,131 |
| Prepaid expenses | | | | 212 |
| Receivable from investment adviser for expense reductions | | | | 93,728 |
Total assets | | | | 1,327,118,937 |
| Liabilities | | | | |
| Payable for investments purchased | $ | 214,918 | | |
| Payable for fund shares redeemed | | 3,756 | | |
| Accrued management fee | | 106,790 | | |
| Other payables and accrued expenses | | 98,212 | | |
| Collateral on securities loaned | | 76,933,084 | | |
| Total Liabilities | | | | 77,356,760 |
| Net Assets | | | $ | 1,249,762,177 |
| Net Assets consist of: | | | | |
| Paid in capital | | | $ | 1,103,389,356 |
| Total accumulated earnings (loss) | | | | 146,372,821 |
| Net Assets | | | $ | 1,249,762,177 |
Net Asset Value , offering price and redemption price per share ($1,249,762,177 ÷ 212,927,439 shares) | | | $ | 5.87 |
| Statement of Operations |
| | | | Six months ended January 31, 2023 (Unaudited) |
| Investment Income | | | | |
| Dividends | | | $ | 5,200,305 |
| Interest | | | | 1,311 |
| Income from Fidelity Central Funds (including $217,699 from security lending) | | | | 296,365 |
| Total Income | | | | 5,497,981 |
| Expenses | | | | |
| Management fee | $ | 347,106 | | |
| Custodian fees and expenses | | 76,824 | | |
| Independent trustees' fees and expenses | | 807 | | |
| Registration fees | | 7,064 | | |
| Audit | | 28,188 | | |
| Legal | | 2,095 | | |
| Interest | | 24,299 | | |
| Miscellaneous | | 1,570 | | |
| Total expenses before reductions | | 487,953 | | |
| Expense reductions | | (308,989) | | |
| Total expenses after reductions | | | | 178,964 |
| Net Investment income (loss) | | | | 5,319,017 |
| Realized and Unrealized Gain (Loss) | | | | |
| Net realized gain (loss) on: | | | | |
| Investment Securities: | | | | |
| Unaffiliated issuers | | (6,794,488) | | |
| Foreign currency transactions | | 111 | | |
| Futures contracts | | (10,625) | | |
| Total net realized gain (loss) | | | | (6,805,002) |
| Change in net unrealized appreciation (depreciation) on: | | | | |
| Investment Securities: | | | | |
| Unaffiliated issuers | | 85,152,444 | | |
| Assets and liabilities in foreign currencies | | (107) | | |
| Futures contracts | | 205,419 | | |
| Total change in net unrealized appreciation (depreciation) | | | | 85,357,756 |
| Net gain (loss) | | | | 78,552,754 |
| Net increase (decrease) in net assets resulting from operations | | | $ | 83,871,771 |
| Statement of Changes in Net Assets |
| |
| | Six months ended January 31, 2023 (Unaudited) | | Year ended July 31, 2022 |
| Increase (Decrease) in Net Assets | | | | |
| Operations | | | | |
| Net investment income (loss) | $ | 5,319,017 | $ | 9,379,452 |
| Net realized gain (loss) | | (6,805,002) | | 291,515,558 |
| Change in net unrealized appreciation (depreciation) | | 85,357,756 | | (300,936,029) |
| Net increase (decrease) in net assets resulting from operations | | 83,871,771 | | (41,019) |
| Distributions to shareholders | | (110,768,589) | | (379,158,551) |
| Share transactions | | | | |
| Proceeds from sales of shares | | 1,155,562,493 | | 681,080,180 |
| Reinvestment of distributions | | 110,367,799 | | 377,431,403 |
| Cost of shares redeemed | | (235,766,873) | | (1,520,231,280) |
Net increase (decrease) in net assets resulting from share transactions | | 1,030,163,419 | | (461,719,697) |
| Total increase (decrease) in net assets | | 1,003,266,601 | | (840,919,267) |
| | | | | |
| Net Assets | | | | |
| Beginning of period | | 246,495,576 | | 1,087,414,843 |
| End of period | $ | 1,249,762,177 | $ | 246,495,576 |
| | | | | |
| Other Information | | | | |
| Shares | | | | |
| Sold | | 211,398,721 | | 62,603,625 |
| Issued in reinvestment of distributions | | 19,549,412 | | 34,100,959 |
| Redeemed | | (43,060,681) | | (137,731,803) |
| Net increase (decrease) | | 187,887,452 | | (41,027,219) |
| | | | | |
Financial Highlights
| Fidelity® SAI Small-Mid Cap 500 Index Fund |
| |
| | Six months ended (Unaudited) January 31, 2023 | | Years ended July 31, 2022 | | 2021 | | 2020 | | 2019 | | 2018 |
Selected Per-Share Data | | | | | | | | | | | | |
| Net asset value, beginning of period | $ | 9.84 | $ | 16.46 | $ | 12.19 | $ | 12.80 | $ | 12.95 | $ | 11.37 |
| Income from Investment Operations | | | | | | | | | | | | |
Net investment income (loss) A,B | | .05 | | .16 | | .20 | | .20 | | .19 | | .17 |
| Net realized and unrealized gain (loss) | | .23 | | (1.07) | | 5.09 | | (.20) C | | .46 | | 1.62 |
| Total from investment operations | | .28 | | (.91) | | 5.29 | | - | | .65 | | 1.79 |
| Distributions from net investment income | | (.11) | | (.22) | | (.17) | | (.22) | | (.18) | | (.13) |
| Distributions from net realized gain | | (4.15) | | (5.48) | | (.85) | | (.39) | | (.63) | | (.08) |
| Total distributions | | (4.25) D | | (5.71) D | | (1.02) | | (.61) | | (.80) D | | (.21) |
| Net asset value, end of period | $ | 5.87 | $ | 9.84 | $ | 16.46 | $ | 12.19 | $ | 12.80 | $ | 12.95 |
Total Return E,F | | 4.75% | | (8.94)% | | 46.99% | | (.03)% C | | 5.26% | | 15.91% |
Ratios to Average Net Assets B,G,H | | | | | | | | | | | | |
| Expenses before reductions | | .16% I | | .14% | | .13% | | .13% | | .22% | | .23% |
| Expenses net of fee waivers, if any | | .06% I | | .05% | | .05% | | .05% | | .08% | | .13% |
| Expenses net of all reductions | | .06% I | | .05% | | .05% | | .05% | | .08% | | .13% |
| Net investment income (loss) | | 1.71% I | | 1.35% | | 1.37% | | 1.66% | | 1.53% | | 1.37% |
| Supplemental Data | | | | | | | | | | | | |
| Net assets, end of period (000 omitted) | $ | 1,249,762 | $ | 246,496 | $ | 1,087,415 | $ | 1,921,810 | $ | 1,862,285 | $ | 2,281,452 |
Portfolio turnover rate J | | 69% I | | 93% | | 69% | | 79% | | 41% | | 39% |
A Calculated based on average shares outstanding during the period.
B Net investment income (loss) is affected by the timing of the declaration of dividends by any underlying mutual funds or exchange-traded funds (ETFs). Net investment income (loss) of any mutual funds or ETFs is not included in the Fund's net investment income (loss) ratio.
C Amount includes a reimbursement from the investment adviser for an operational error which amounted to less than $.02 per share. Excluding this reimbursement, the total return would have been (.16)%.
D Total distributions per share do not sum due to rounding.
E Total returns for periods of less than one year are not annualized.
F Total returns would have been lower if certain expenses had not been reduced during the applicable periods shown.
G Fees and expenses of any underlying mutual funds or exchange-traded funds (ETFs) are not included in the Fund's expense ratio. The Fund indirectly bears its proportionate share of these expenses. For additional expense information related to investments in Fidelity Central Funds, please refer to the "Investments in Fidelity Central Funds" note found in the Notes to Financial Statements section of the most recent Annual or Semi-Annual report.
H Expense ratios reflect operating expenses of the class. Expenses before reductions do not reflect amounts reimbursed, waived, or reduced through arrangements with the investment adviser, brokerage services, or other offset arrangements, if applicable, and do not represent the amount paid by the class during periods when reimbursements, waivers or reductions occur.
I Annualized.
J Amount does not include the portfolio activity of any underlying mutual funds or exchange-traded funds (ETFs).
For the period ended January 31, 2023
1. Organization.
Fidelity SAI Small-Mid Cap 500 Index Fund (the Fund) is a fund of Fidelity Salem Street Trust (the Trust) and is authorized to issue an unlimited number of shares. Shares are offered exclusively to certain clients of Fidelity Management & Research Company LLC (FMR) or its affiliates. The Trust is registered under the Investment Company Act of 1940, as amended (the 1940 Act), as an open-end management investment company organized as a Massachusetts business trust.
2. Investments in Fidelity Central Funds.
Funds may invest in Fidelity Central Funds, which are open-end investment companies generally available only to other investment companies and accounts managed by the investment adviser and its affiliates. The Schedule of Investments lists any Fidelity Central Funds held as an investment as of period end, but does not include the underlying holdings of each Fidelity Central Fund. An investing fund indirectly bears its proportionate share of the expenses of the underlying Fidelity Central Funds.
Based on its investment objective, each Fidelity Central Fund may invest or participate in various investment vehicles or strategies that are similar to those of the investing fund. These strategies are consistent with the investment objectives of the investing fund and may involve certain economic risks which may cause a decline in value of each of the Fidelity Central Funds and thus a decline in the value of the investing fund.
| Fidelity Central Fund | Investment Manager | Investment Objective | Investment Practices | Expense Ratio A |
| Fidelity Money Market Central Funds | Fidelity Management & Research Company LLC (FMR) | Each fund seeks to obtain a high level of current income consistent with the preservation of capital and liquidity. | Short-term Investments | Less than .005% |
A Expenses expressed as a percentage of average net assets and are as of each underlying Central Fund's most recent annual or semi-annual shareholder report.
A complete unaudited list of holdings for each Fidelity Central Fund is available upon request or at the Securities and Exchange Commission website at www.sec.gov. In addition, the financial statements of the Fidelity Central Funds which contain the significant accounting policies (including investment valuation policies) of those funds, and are not covered by the Report of Independent Registered Public Accounting Firm, are available on the Securities and Exchange Commission website or upon request.
3. Significant Accounting Policies.
The Fund is an investment company and applies the accounting and reporting guidance of the Financial Accounting Standards Board (FASB) Accounting Standards Codification Topic 946 Financial Services - Investment Companies . The financial statements have been prepared in conformity with accounting principles generally accepted in the United States of America (GAAP), which require management to make certain estimates and assumptions at the date of the financial statements. Actual results could differ from those estimates. Subsequent events, if any, through the date that the financial statements were issued have been evaluated in the preparation of the financial statements. The Fund's Schedule of Investments lists any underlying mutual funds or exchange-traded funds (ETFs) but does not include the underlying holdings of these funds. The following summarizes the significant accounting policies of the Fund:
Investment Valuation. Investments are valued as of 4:00 p.m. Eastern time on the last calendar day of the period. The Board of Trustees (the Board) has designated the Fund's investment adviser as the valuation designee responsible for the fair valuation function and performing fair value determinations as needed. The investment adviser has established a Fair Value Committee (the Committee) to carry out the day-to-day fair valuation responsibilities and has adopted policies and procedures to govern the fair valuation process and the activities of the Committee. In accordance with these fair valuation policies and procedures, which have been approved by the Board, the Fund attempts to obtain prices from one or more third party pricing services or brokers to value its investments. When current market prices, quotations or currency exchange rates are not readily available or reliable, investments will be fair valued in good faith by the Committee, in accordance with the policies and procedures. Factors used in determining fair value vary by investment type and may include market or investment specific events, transaction data, estimated cash flows, and market observations of comparable investments. The frequency that the fair valuation procedures are used cannot be predicted and they may be utilized to a significant extent. The Committee manages the Fund's fair valuation practices and maintains the fair valuation policies and procedures. The Fund's investment adviser reports to the Board information regarding the fair valuation process and related material matters.
The Fund categorizes the inputs to valuation techniques used to value its investments into a disclosure hierarchy consisting of three levels as shown below:
Level 1 - unadjusted quoted prices in active markets for identical investments
Level 2 - other significant observable inputs (including quoted prices for similar investments, interest rates, prepayment speeds, etc.)
Level 3 - unobservable inputs (including the Fund's own assumptions based on the best information available)
Valuation techniques used to value the Fund's investments by major category are as follows:
Equity securities, including restricted securities, for which market quotations are readily available, are valued at the last reported sale price or official closing price as reported by a third party pricing service on the primary market or exchange on which they are traded and are categorized as Level 1 in the hierarchy. In the event there were no sales during the day or closing prices are not available, securities are valued at the last quoted bid price or may be valued using the last available price and are generally categorized as Level 2 in the hierarchy. For foreign equity securities, when market or security specific events arise, comparisons to the valuation of American Depositary Receipts (ADRs), futures contracts, ETFs and certain indexes as well as quoted prices for similar securities may be used and would be categorized as Level 2 in the hierarchy. For equity securities, including restricted securities, where observable inputs are limited, assumptions about market activity and risk are used and these securities may be categorized as Level 3 in the hierarchy.
Debt securities, including restricted securities, are valued based on evaluated prices received from third party pricing services or from brokers who make markets in such securities. U.S. government and government agency obligations are valued by pricing services who utilize matrix pricing which considers yield or price of bonds of comparable quality, coupon, maturity and type or by broker-supplied prices. When independent prices are unavailable or unreliable, debt securities may be valued utilizing pricing methodologies which consider similar factors that would be used by third party pricing services. Debt securities are generally categorized as Level 2 in the hierarchy but may be Level 3 depending on the circumstances.
Futures contracts are valued at the settlement price established each day by the board of trade or exchange on which they are traded and are categorized as Level 1 in the hierarchy. Investments in open-end mutual funds, including the Fidelity Central Funds, are valued at their closing net asset value (NAV) each business day and are categorized as Level 1 in the hierarchy.
Changes in valuation techniques may result in transfers in or out of an assigned level within the disclosure hierarchy. The aggregate value of investments by input level as of January 31, 2023 is included at the end of the Fund's Schedule of Investments.
Foreign Currency. Certain Funds may use foreign currency contracts to facilitate transactions in foreign-denominated securities. Gains and losses from these transactions may arise from changes in the value of the foreign currency or if the counterparties do not perform under the contracts' terms.
Foreign-denominated assets, including investment securities, and liabilities are translated into U.S. dollars at the exchange rates at period end. Purchases and sales of investment securities, income and dividends received, and expenses denominated in foreign currencies are translated into U.S. dollars at the exchange rate in effect on the transaction date.
The effects of exchange rate fluctuations on investments are included with the net realized and unrealized gain (loss) on investment securities. Other foreign currency transactions resulting in realized and unrealized gain (loss) are disclosed separately.
Investment Transactions and Income. For financial reporting purposes, the Fund's investment holdings and NAV include trades executed through the end of the last business day of the period. The NAV per share for processing shareholder transactions is calculated as of the close of business of the New York Stock Exchange (NYSE), normally 4:00 p.m. Eastern time and includes trades executed through the end of the prior business day. Gains and losses on securities sold are determined on the basis of identified cost and include proceeds received from litigation. Commissions paid to certain brokers with whom the investment adviser, or its affiliates, places trades on behalf of a fund include an amount in addition to trade execution, which may be rebated back to a fund. Any such rebates are included in net realized gain (loss) on investments in the Statement of Operations. Dividend income is recorded on the ex-dividend date, except for certain dividends from foreign securities where the ex-dividend date may have passed, which are recorded as soon as the Fund is informed of the ex-dividend date. Non-cash dividends included in dividend income, if any, are recorded at the fair market value of the securities received. Income and capital gain distributions from Fidelity Central Funds, if any, are recorded on the ex-dividend date. Certain distributions received by the Fund represent a return of capital or capital gain. The Fund determines the components of these distributions subsequent to the ex-dividend date, based upon receipt of tax filings or other correspondence relating to the underlying investment. These distributions are recorded as a reduction of cost of investments and/or as a realized gain. Interest income is accrued as earned and includes coupon interest and amortization of premium and accretion of discount on debt securities as applicable. Investment income is recorded net of foreign taxes withheld where recovery of such taxes is uncertain. Funds may file withholding tax reclaims in certain jurisdictions to recover a portion of amounts previously withheld. Any withholding tax reclaims income is included in the Statement of Operations in dividends. Any receivables for withholding tax reclaims are included in the Statement of Assets and Liabilities in dividends receivable.
Expenses. Expenses directly attributable to a fund are charged to that fund. Expenses attributable to more than one fund are allocated among the respective funds on the basis of relative net assets or other appropriate methods. Expenses included in the accompanying financial statements reflect the expenses of that fund and do not include any expenses associated with any underlying mutual funds or exchange-traded funds. Although not included in a fund's expenses, a fund indirectly bears its proportionate share of these expenses through the net asset value of each underlying mutual fund or exchange-traded fund. Expense estimates are accrued in the period to which they relate and adjustments are made when actual amounts are known.
Income Tax Information and Distributions to Shareholders. Each year, the Fund intends to qualify as a regulated investment company under Subchapter M of the Internal Revenue Code, including distributing substantially all of its taxable income and realized gains. As a result, no provision for U.S. Federal income taxes is required. The Fund files a U.S. federal tax return, in addition to state and local tax returns as required. The Fund's federal income tax returns are subject to examination by the Internal Revenue Service (IRS) for a period of three fiscal years after they are filed. State and local tax returns may be subject to examination for an additional fiscal year depending on the jurisdiction. Foreign taxes are provided for based on the Fund's understanding of the tax rules and rates that exist in the foreign markets in which it invests.
Distributions are declared and recorded on the ex-dividend date. Income and capital gain distributions are determined in accordance with income tax regulations, which may differ from GAAP.
Capital accounts within the financial statements are adjusted for permanent book-tax differences. These adjustments have no impact on net assets or the results of operations. Capital accounts are not adjusted for temporary book-tax differences which will reverse in a subsequent period.
Book-tax differences are primarily due to futures contracts, partnerships and losses deferred due to wash sales.
As of period end, the cost and unrealized appreciation (depreciation) in securities, and derivatives if applicable, for federal income tax purposes were as follows:
| Gross unrealized appreciation | $182,143,499 |
| Gross unrealized depreciation | (37,776,863) |
| Net unrealized appreciation (depreciation) | $144,366,636 |
| Tax cost | $1,182,006,079 |
4. Derivative Instruments.
Risk Exposures and the Use of Derivative Instruments. The Fund's investment objectives allow for various types of derivative instruments, including futures contracts. Derivatives are investments whose value is primarily derived from underlying assets, indices or reference rates and may be transacted on an exchange or over-the-counter (OTC). Derivatives may involve a future commitment to buy or sell a specified asset based on specified terms, to exchange future cash flows at periodic intervals based on a notional principal amount, or for one party to make one or more payments upon the occurrence of specified events in exchange for periodic payments from the other party.
Derivatives were used to increase returns and to manage exposure to certain risks as defined below. The success of any strategy involving derivatives depends on analysis of numerous economic factors, and if the strategies for investment do not work as intended, the objectives may not be achieved.
Derivatives were used to increase or decrease exposure to the following risk(s):
| | |
| Equity Risk | Equity risk relates to the fluctuations in the value of financial instruments as a result of changes in market prices (other than those arising from interest rate risk or foreign exchange risk), whether caused by factors specific to an individual investment, its issuer, or all factors affecting all instruments traded in a market or market segment. |
Funds are also exposed to additional risks from investing in derivatives, such as liquidity risk and counterparty credit risk. Liquidity risk is the risk that a fund will be unable to close out the derivative in the open market in a timely manner. Counterparty credit risk is the risk that the counterparty will not be able to fulfill its obligation to a fund. Counterparty credit risk related to exchange-traded contracts may be mitigated by the protection provided by the exchange on which they trade.
Investing in derivatives may involve greater risks than investing in the underlying assets directly and, to varying degrees, may involve risk of loss in excess of any initial investment and collateral received and amounts recognized in the Statement of Assets and Liabilities. In addition, there may be the risk that the change in value of the derivative contract does not correspond to the change in value of the underlying instrument.
Futures Contracts. A futures contract is an agreement between two parties to buy or sell a specified underlying instrument for a fixed price at a specified future date. Futures contracts were used to manage exposure to the stock market.
Upon entering into a futures contract, a fund is required to deposit either cash or securities (initial margin) with a clearing broker in an amount equal to a certain percentage of the face value of the contract. Futures contracts are marked-to-market daily and subsequent daily payments are made or received by a fund depending on the daily fluctuations in the value of the futures contracts and are recorded as unrealized appreciation or (depreciation). This receivable and/or payable, if any, is included in daily variation margin on futures contracts in the Statement of Assets and Liabilities. Realized gain or (loss) is recorded upon the expiration or closing of a futures contract. The net realized gain (loss) and change in net unrealized appreciation (depreciation) on futures contracts during the period is presented in the Statement of Operations.
Any open futures contracts at period end are presented in the Schedule of Investments under the caption "Futures Contracts". The notional amount at value reflects each contract's exposure to the underlying instrument or index at period end, and is representative of volume of activity during the period unless an average notional amount is presented. Any securities deposited to meet initial margin requirements are identified in the Schedule of Investments. Any cash deposited to meet initial margin requirements is presented as segregated cash with brokers for derivative instruments in the Statement of Assets and Liabilities.
5. Purchases and Sales of Investments.
Purchases and sales of securities, other than short-term securities, U.S. government securities and in-kind transactions, as applicable, are noted in the table below.
| | Purchases ($) | Sales ($) |
| Fidelity SAI Small-Mid Cap 500 Index Fund | 1,155,534,009 | 223,763,818 |
6. Fees and Other Transactions with Affiliates.
Management Fee. Fidelity Management & Research Company LLC (the investment adviser) and its affiliates provide the Fund with investment management related services for which the Fund pays a monthly management fee that is based on an annual rate of .11% of the Fund's average net assets.
Sub-Adviser. Geode Capital Management, LLC (Geode), serves as sub-adviser for the Fund. Geode provides discretionary investment advisory services to the Fund and is paid by the investment adviser for providing these services.
Interfund Lending Program. Pursuant to an Exemptive Order issued by the Securities and Exchange Commission (the SEC), the Fund, along with other registered investment companies having management contracts with Fidelity Management & Research Company LLC (FMR), or other affiliated entities of FMR, may participate in an interfund lending program. This program provides an alternative credit facility allowing the Fund to borrow from, or lend money to, other participating affiliated funds. At period end, there were no interfund loans outstanding. Activity in this program during the period for which loans were outstanding was as follows:
| | Borrower or Lender | Average Loan Balance | Weighted Average Interest Rate | Interest Expense |
| Fidelity SAI Small-Mid Cap 500 Index Fund | Borrower | $19,701,000 | 3.97% | $10,872 |
Interfund Trades. Funds may purchase from or sell securities to other Fidelity Funds under procedures adopted by the Board. The procedures have been designed to ensure these interfund trades are executed in accordance with Rule 17a-7 of the 1940 Act. Any interfund trades are included within the respective purchases and sales amounts shown in the Purchases and Sales of Investments note. During the period, there were no interfund trades.
7. Committed Line of Credit.
Certain Funds participate with other funds managed by the investment adviser or an affiliate in a $4.25 billion credit facility (the "line of credit") to be utilized for temporary or emergency purposes to fund shareholder redemptions or for other short-term liquidity purposes. The participating funds have agreed to pay commitment fees on their pro-rata portion of the line of credit, which are reflected in Miscellaneous expenses on the Statement of Operations, and are listed below. During the period, there were no borrowings on this line of credit.
| | Amount |
| Fidelity SAI Small-Mid Cap 500 Index Fund | $617 |
8. Security Lending.
Funds lend portfolio securities from time to time in order to earn additional income. Lending agents are used, including National Financial Services (NFS), an affiliate of the investment adviser. Pursuant to a securities lending agreement, NFS will receive a fee, which is capped at 9.9% of a fund's daily lending revenue, for its services as lending agent. A fund may lend securities to certain qualified borrowers, including NFS. On the settlement date of the loan, a fund receives collateral (in the form of U.S. Treasury obligations, letters of credit and/or cash) against the loaned securities and maintains collateral in an amount not less than 100% of the market value of the loaned securities during the period of the loan. The market value of the loaned securities is determined at the close of business of a fund and any additional required collateral is delivered to a fund on the next business day. A fund or borrower may terminate the loan at any time, and if the borrower defaults on its obligation to return the securities loaned because of insolvency or other reasons, a fund may apply collateral received from the borrower against the obligation. A fund may experience delays and costs in recovering the securities loaned. Any cash collateral received is invested in the Fidelity Securities Lending Cash Central Fund. Any loaned securities are identified as such in the Schedule of Investments, and the value of loaned securities and cash collateral at period end, as applicable, are presented in the Statement of Assets and Liabilities. Security lending income represents the income earned on investing cash collateral, less rebates paid to borrowers and any lending agent fees associated with the loan, plus any premium payments received for lending certain types of securities. Security lending income is presented in the Statement of Operations as a component of income from Fidelity Central Funds. Affiliated security lending activity, if any, was as follows:
| | Total Security Lending Fees Paid to NFS | Security Lending Income From Securities Loaned to NFS | Value of Securities Loaned to NFS at Period End |
| Fidelity SAI Small-Mid Cap 500 Index Fund | $23,806 | $6,150 | $549,230 |
9. Bank Borrowings.
The Fund is permitted to have bank borrowings for temporary or emergency purposes to fund shareholder redemptions or for other short-term liquidity requirements. The Fund has established borrowing arrangements with certain banks. The interest rate on the borrowings is the bank's base rate, as revised from time to time. Any open loans, including accrued interest, at period end are presented under the caption "Notes payable" in the Statement of Assets and Liabilities, if applicable. Activity in this program during the period for which loans were outstanding was as follows:
| | Average Loan Balance | Weighted Average Interest Rate | Interest Expense |
| Fidelity SAI Small-Mid Cap 500 Index Fund | $42,700,500 | 2.83% | $13,427 |
10. Expense Reductions.
The investment adviser contractually agreed to reimburse the Fund to the extent annual operating expenses exceeded .05% of average net assets. This reimbursement will remain in place through November 30, 2023. Some expenses, for example the compensation of the independent Trustees, and certain miscellaneous expenses such as proxy and shareholder meeting expenses, are excluded from this reimbursement. During the period this reimbursement reduced the Fund's expenses by $308,698.
Through arrangements with the Fund's custodian and transfer agent, credits realized as a result of certain uninvested cash balances were used to reduce the Fund's expenses by $222 and $69, respectively.
11. Other.
A fund's organizational documents provide former and current trustees and officers with a limited indemnification against liabilities arising in connection with the performance of their duties to the fund. In the normal course of business, a fund may also enter into contracts that provide general indemnifications. A fund's maximum exposure under these arrangements is unknown as this would be dependent on future claims that may be made against a fund. The risk of material loss from such claims is considered remote.
At the end of the period, the following mutual funds managed by the investment adviser or its affiliates were the owners of record of 10% or more of the total outstanding shares.
| | Strategic Advisers Fidelity U.S. Total Stock Fund | Strategic Advisers Small-Mid Cap Fund |
| Fidelity SAI Small-Mid Cap 500 Index Fund | 63% | 37% |
12. Risk and Uncertainties.
Many factors affect a fund's performance. Developments that disrupt global economies and financial markets, such as pandemics, epidemics, outbreaks of infectious diseases, war, terrorism, and environmental disasters, may significantly affect a fund's investment performance. The effects of these developments to a fund will be impacted by the types of securities in which a fund invests, the financial condition, industry, economic sector, and geographic location of an issuer, and a fund's level of investment in the securities of that issuer.
As a shareholder, you incur two types of costs: (1) transaction costs, which may include sales charges (loads) on purchase payments or redemption proceeds, as applicable and (2) ongoing costs, which generally include management fees, distribution and/or service (12b-1) fees and other Fund expenses. This Example is intended to help you understand your ongoing costs (in dollars) of investing in a fund and to compare these costs with the ongoing costs of investing in other mutual funds.
| The Example is based on an investment of $1,000 invested at the beginning of the period and held for the entire period (August 1, 2022 to January 31, 2023). |
Actual Expenses
The first line of the accompanying table provides information about actual account values and actual expenses. You may use the information in this line, together with the amount you invested, to estimate the expenses that you paid over the period. Simply divide your account value by $1,000.00 (for example, an $8,600 account value divided by $1,000.00 = 8.6), then multiply the result by the number in the first line for a class/Fund under the heading entitled "Expenses Paid During Period" to estimate the expenses you paid on your account during this period. If any fund is a shareholder of any underlying mutual funds or exchange-traded funds (ETFs) (the Underlying Funds), such fund indirectly bears its proportional share of the expenses of the Underlying Funds in addition to the direct expenses incurred presented in the table. These fees and expenses are not included in the annualized expense ratio used to calculate the expense estimate in the table below.
Hypothetical Example for Comparison Purposes
The second line of the accompanying table provides information about hypothetical account values and hypothetical expenses based on the actual expense ratio and an assumed rate of return of 5% per year before expenses, which is not the actual return. The hypothetical account values and expenses may not be used to estimate the actual ending account balance or expenses you paid for the period. You may use this information to compare the ongoing costs of investing in the Fund and other funds. To do so, compare this 5% hypothetical example with the 5% hypothetical examples that appear in the shareholder reports of the other funds. If any fund is a shareholder of any Underlying Funds, such fund indirectly bears its proportional share of the expenses of the Underlying Funds in addition to the direct expenses as presented in the table. These fees and expenses are not included in the annualized expense ratio used to calculate the expense estimate in the table below.
Please note that the expenses shown in the table are meant to highlight your ongoing costs only and do not reflect any transaction costs. Therefore, the second line of the table is useful in comparing ongoing costs only, and will not help you determine the relative total costs of owning different funds. In addition, if these transactional costs were included, your costs would have been higher.
| | | | | Annualized Expense Ratio- A | | Beginning Account Value August 1, 2022 | | Ending Account Value January 31, 2023 | | Expenses Paid During Period- C August 1, 2022 to January 31, 2023 |
| | | | | | | | | | |
| Fidelity® SAI Small-Mid Cap 500 Index Fund | | | | .06% | | | | | | |
| Actual | | | | | | $ 1,000 | | $ 1,047.50 | | $ .31 |
Hypothetical- B | | | | | | $ 1,000 | | $ 1,024.90 | | $ .31 |
| |
A Annualized expense ratio reflects expenses net of applicable fee waivers.
B 5% return per year before expenses
C Expenses are equal to the annualized expense ratio, multiplied by the average account value over the period, multiplied by 184/ 365 (to reflect the one-half year period). The fees and expenses of any Underlying Funds are not included in each annualized expense ratio.
Board Approval of Investment Advisory Contracts and Management Fees
Fidelity SAI Small-Mid Cap 500 Index Fund
Each year, the Board of Trustees, including the Independent Trustees (together, the Board), votes on the renewal of the management contract with Fidelity Management & Research Company LLC (FMR) and the sub-advisory agreement (Sub-Advisory Agreement) for the fund with Geode Capital Management, LLC (Geode) (together, the Advisory Contracts). FMR and Geode are referred to herein as the Investment Advisers. The Board, assisted by the advice of fund counsel and Independent Trustees' counsel, requests and considers a broad range of information relevant to the renewal of the Advisory Contracts throughout the year.
The Board meets regularly and, at each of its meetings, covers an extensive agenda of topics and materials and considers factors that are relevant to its annual consideration of the renewal of the fund's Advisory Contracts, including the services and support provided to the fund and its shareholders. The Board has established four standing committees (Committees) - Operations, Audit, Fair Valuation, and Governance and Nominating - each composed of and chaired by Independent Trustees with varying backgrounds, to which the Board has assigned specific subject matter responsibilities in order to enhance effective decision-making by the Board. The Operations Committee, of which all the Independent Trustees are members, meets regularly throughout the year and requests, receives and considers, among other matters, information related to the annual consideration of the renewal of the fund's Advisory Contracts before making its recommendation to the Board. The Board also meets as needed to review matters specifically related to the Board's annual consideration of the renewal of the Advisory Contracts. Members of the Board may also meet from time to time with trustees of other Fidelity funds through joint ad hoc committees to discuss certain matters relevant to all of the Fidelity funds.
At its September 2022 meeting, the Board unanimously determined to renew the fund's Advisory Contracts. In reaching its determination, the Board considered all factors it believed relevant, including (i) the nature, extent, and quality of the services provided to the fund and its shareholders (including the investment performance of the fund); (ii) the competitiveness relative to peer funds of the fund's management fee and total expense ratio; (iii) the total costs of the services provided by and the profits realized by Fidelity and Geode from their respective relationships with the fund; and (iv) the extent to which, if any, economies of scale exist and are realized as the fund grows, and whether any economies of scale are appropriately shared with fund shareholders.
In considering whether to renew the Advisory Contracts for the fund, the Board reached a determination, with the assistance of fund counsel and Independent Trustees' counsel and through the exercise of its business judgment, that the renewal of the Advisory Contracts was in the best interests of the fund and its shareholders and that the compensation payable under the Advisory Contracts was fair and reasonable. The Board's decision to renew the Advisory Contracts was not based on any single factor, but rather was based on a comprehensive consideration of all the information provided to the Board at its meetings throughout the year. The Board, in reaching its determination to renew the Advisory Contracts, was aware that shareholders of the fund have a broad range of investment choices available to them, including a wide choice among funds offered by Fidelity's competitors, and that the fund's shareholders, who have the opportunity to review and weigh the disclosure provided by the fund in its prospectus and other public disclosures, have chosen to invest in this fund, which is part of the Fidelity family of funds.
Nature, Extent, and Quality of Services Provided. The Board considered staffing as it relates to the fund, including the backgrounds of investment personnel of Fidelity and Geode, and also considered the fund's investment objective, strategies, and related investment philosophy. The Independent Trustees also had discussions with senior management of Fidelity's investment operations and investment groups and with senior management of Geode. The Board considered the structure of the investment personnel compensation programs and whether the structures provide appropriate incentives to act in the best interests of the fund. The Board also considered the steps Fidelity and Geode had taken to ensure the continued provision of high quality services to the Fidelity funds throughout the COVID-19 pandemic, including the expansion of staff in client facing positions to maintain service levels in periods of high volumes and volatility.
The Trustees also discussed with representatives of Fidelity, at meetings throughout the year, Fidelity's role in, among other things, overseeing compliance with federal securities laws and other applicable requirements by Geode with respect to the fund and monitoring and overseeing the performance and investment capabilities of Geode. The Trustees considered that the Board had received from Fidelity periodic reports about its oversight and due diligence processes, as well as periodic reports regarding the performance of Geode.
The Board also considered the nature, extent and quality of services provided by Geode. The Trustees noted that under the Sub-Advisory Agreement, subject to oversight by Fidelity, Geode is responsible for, among other things, identifying investments and arranging for execution of portfolio transactions to implement the fund's investment strategy. In addition, the Trustees noted that Geode is responsible for providing such reporting as may be requested by Fidelity to fulfill its oversight responsibilities discussed above.
Resources Dedicated to Investment Management and Support Services . The Board reviewed the general qualifications and capabilities of Fidelity's and Geode's investment staffs, including their size, education, experience, and resources, as well as Fidelity's and Geode's approach to recruiting, training, managing, and compensating investment personnel. The Board noted the resources devoted to Fidelity's global investment organization and that Fidelity's and Geode's analysts have extensive resources, tools and capabilities that allow them to conduct quantitative and fundamental analysis, as well as credit analysis of issuers, counterparties, and guarantors. Further, the Board considered that Fidelity's and Geode's investment professionals have sufficient access to information and data so as to provide competitive investment results over time, and that those professionals also have access to sophisticated tools that permit them to assess portfolio construction and risk and performance attribution characteristics continuously. Additionally, in its deliberations, the Board considered Fidelity's and Geode's trading, risk management, compliance, cybersecurity, and technology and operations capabilities and resources, which are integral parts of the investment management process.
Shareholder and Administrative Services . The Board considered (i) the nature, extent, quality, and cost of advisory, administrative, and shareholder services performed by the Investment Advisers and their affiliates under the Advisory Contracts and by FMR's affiliates under separate agreements covering transfer agency, pricing and bookkeeping, and securities lending services for the fund; (ii) the nature and extent of the supervision of third party service providers, principally custodians, subcustodians, and pricing vendors; and (iii) the resources devoted to, and the record of compliance with, the fund's compliance policies and procedures. The Board also reviewed the allocation of fund brokerage, including allocations to brokers affiliated with the Investment Advisers.
The Board noted that the growth of fund assets over time across the complex allows Fidelity to reinvest in the development of services designed to enhance the value and convenience of the Fidelity funds as investment vehicles. These services include 24-hour access to account information and market information over the Internet and through telephone representatives, investor education materials and asset allocation tools. The Board also considered that it reviews customer service metrics such as telephone response times, continuity of services on the website and metrics addressing services at Fidelity Investor Centers.
Investment in a Large Fund Family . The Board considered the benefits to shareholders of investing in a Fidelity fund, including the benefits of investing in a fund that is part of a large family of funds offering a variety of investment disciplines and providing a large variety of mutual fund investor services. The Board noted that Fidelity had taken, or had made recommendations to the Board that resulted in the Fidelity funds taking, a number of actions over the previous year that benefited particular funds, including: (i) continuing to dedicate additional resources to Fidelity's investment research process, which includes meetings with management of issuers of securities in which the funds invest; (ii) continuing efforts to enhance Fidelity's global research capabilities; (iii) launching new funds, ETFs, and share classes with innovative structures, strategies and pricing and making other enhancements to meet investor needs; (iv) broadening eligibility requirements for certain funds and share classes; (v) reducing management fees and total expenses for certain funds and classes; (vi) lowering expenses for certain existing funds and classes by implementing or lowering expense caps; (vii) rationalizing product lines and gaining increased efficiencies from fund mergers and liquidations; (viii) continuing to develop, acquire and implement systems and technology to improve services to the funds and shareholders, strengthen information security, and increase efficiency; and (ix) continuing to implement enhancements to further strengthen Fidelity's product line to increase investors' probability of success in achieving their investment goals, including their retirement income goals.
Investment Performance . The Board considered whether the fund has operated in accordance with its investment objective, as well as its record of compliance with its investment restrictions and its performance history.
The Board took into account discussions that occur at Board meetings throughout the year with representatives of the Investment Advisers about fund investment performance. In this regard the Board noted that as part of regularly scheduled fund reviews and other reports to the Board on fund performance, the Board considers annualized return information for the fund for different time periods, measured against the securities market index the fund seeks to track. The Board also periodically considers the fund's tracking error versus its benchmark index.
In addition to reviewing absolute and relative fund performance, the Independent Trustees periodically consider the appropriateness of fund performance metrics in evaluating the results achieved. In general, the Independent Trustees believe that an index fund's performance should be evaluated based on gross performance (before fees and expenses but after transaction costs) compared to the fund's benchmark index, over appropriate time periods, taking into account relevant factors including the following: general market conditions; the characteristics of the fund's benchmark index; the extent to which statistical sampling is employed; any securities lending revenues; and fund cash flows and other factors. The Independent Trustees generally give greater weight to fund performance over longer time periods than over shorter time periods. Depending on the circumstances, the Independent Trustees may be satisfied with a fund's performance notwithstanding that it lags its benchmark index for certain periods.
The Independent Trustees recognize that shareholders evaluate performance on a net basis (after fees and expenses) over their own holding periods, for which one-, three-, and five-year periods are often used as a proxy. For this reason, the performance information reviewed by the Board also included net cumulative calendar year total return information for the fund and its benchmark index for the most recent one-, three-, and five-year periods. No performance peer group information was considered by the Board as Fidelity advised the Board that the peer group, which is created by a third-party provider, includes a number of actively-managed funds. The Independent Trustees recognize that shareholders who are not investing through a tax-advantaged retirement account also consider tax consequences in evaluating performance.
Based on its review, the Board concluded that the nature, extent, and quality of services provided to the fund under the Advisory Contracts should continue to benefit the shareholders of the fund.
Competitiveness of Management Fee and Total Expense Ratio. The Board considered the fund's management fee and total expense ratio compared to selected groups of competitive funds and classes (referred to as "mapped groups" below) for the purpose of facilitating the Trustees' competitive analysis of management fees and total expenses. Fidelity creates "mapped groups" by combining similar investment objective categories (as classified by Lipper) that have comparable investment mandates. Combining funds with similar investment objective categories aids the Board's comparison of management fees and total expense ratios by broadening the competitive group used for such comparison.
Management Fee . The Board considered two proprietary management fee comparisons for the 12-month periods shown in basis points (BP) in the chart below. The group of Lipper funds used by the Board for management fee comparisons is referred to below as the "Total Mapped Group." The Total Mapped Group comparison focuses on a fund's standing in terms of gross management fees before expense reimbursements or caps relative to the total universe of funds with comparable investment mandates, regardless of whether their management fee structures also are comparable. Funds with comparable investment mandates offer exposure to similar types of securities. Funds with comparable management fee structures have similar management fee contractual arrangements (e.g., flat rate charged for advisory services, all-inclusive fee rate, etc.). "TMG %" represents the percentage of funds in the Total Mapped Group that had management fees that were lower than the fund's. For example, a hypothetical TMG % of 20% would mean that 80% of the funds in the Total Mapped Group had higher, and 20% had lower, management fees than the fund. The fund's actual TMG %s and the number of funds in the Total Mapped Group are in the chart below. The "Asset-Sized Peer Group" (ASPG) comparison focuses on a fund's standing relative to a subset of non-Fidelity funds within the Total Mapped Group that are similar in size and management fee structure. For example, if a fund is in the first quartile of the ASPG, the fund's management fee ranks in the least expensive or lowest 25% of funds in the ASPG. The ASPG represents at least 15% of the funds in the Total Mapped Group with comparable asset size and management fee structures, subject to a minimum of 50 funds (or all funds in the Total Mapped Group if fewer than 50). Additional information, such as the ASPG quartile in which the fund's management fee rate ranked, is also included in the chart and was considered by the Board.
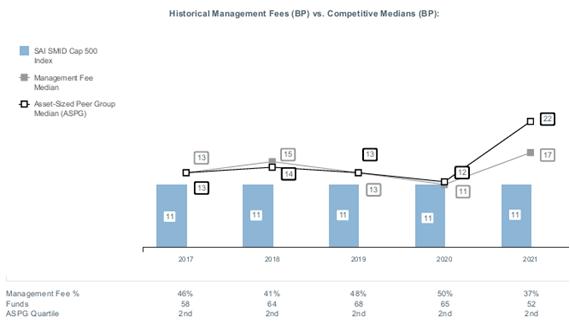
The Board noted that the fund's management fee rate ranked below the median of its Total Mapped Group and below the median of its ASPG for 2021.
Based on its review, the Board concluded that the fund's management fee is fair and reasonable in light of the services that the fund receives and the other factors considered.
Total Expense Ratio . In its review of the fund's total expense ratio, the Board considered the fund's management fee rate as well as other fund expenses, such as custodial, legal, and audit fees. The Board also noted that Fidelity may agree to waive fees or reimburse expenses from time to time, and the extent to which, if any, it has done so for the fund. The fund is compared to those funds and classes in the Total Mapped Group (used by the Board for management fee comparisons) that have a similar sales load structure. The Board also considered a total expense ASPG comparison, which focuses on the total expenses of the fund relative to a subset of non-Fidelity funds within the similar sales load structure group that are similar in size and management fee structure. The total expense ASPG is limited to 15 larger and 15 smaller classes of different funds, where possible. The total expense ASPG comparison excludes performance adjustments and fund-paid 12b-1 fees to eliminate variability in expenses relating to these items.
The Board noted that the fund's total net expense ratio ranked below the similar sales load structure group competitive median and below the ASPG competitive median for 2021.
The Board further considered that FMR has contractually agreed to reimburse the fund to the extent that total operating expenses, with certain exceptions, as a percentage of its average net assets, exceed 0.05% through November 30, 2023.
Fees Charged to Other Clients . The Board also considered fee structures and other information with respect to clients of Fidelity and Geode, such as other funds advised or subadvised by Fidelity or Geode, pension plan clients, and other institutional clients with similar mandates. The Board noted that a joint ad hoc committee created by it and the boards of other Fidelity funds periodically reviews and compares Fidelity's institutional investment advisory business with its business of providing services to the Fidelity funds and also noted the most recent findings of the committee. The Board noted that the committee's review included a consideration of the differences in services provided, fees charged, and costs incurred, as well as competition in the markets serving the different categories of clients.
Based on its review of total expense ratios and fees charged to other Fidelity clients, the Board concluded that the fund's total expense ratio was reasonable in light of the services that the fund and its shareholders receive and the other factors considered.
Costs of the Services and Profitability. The Board considered the revenues earned and the expenses incurred by Fidelity in conducting the business of developing, marketing, distributing, managing, administering and servicing the fund and servicing the fund's shareholders. The Board also considered the level of Fidelity's profits in respect of all the Fidelity funds.
On an annual basis, Fidelity presents to the Board information about the profitability of its relationships with the fund. Fidelity calculates profitability information for each fund, as well as aggregate profitability information for groups of Fidelity funds and all Fidelity funds, using a series of detailed revenue and cost allocation methodologies which originate with the books and records of Fidelity on which Fidelity's audited financial statements are based. The Audit Committee of the Board reviews any significant changes from the prior year's methodologies and the full Board approves such changes.
A public accounting firm has been engaged annually by the Board as part of the Board's assessment of Fidelity's profitability analysis. The engagement includes the review and assessment of the methodologies used by Fidelity in determining the revenues and expenses attributable to Fidelity's mutual fund business, and completion of agreed-upon procedures in respect of the mathematical accuracy of certain fund profitability information and its conformity to established allocation methodologies. After considering the reports issued under the engagement and information provided by Fidelity, the Board concluded that while other allocation methods may also be reasonable, Fidelity's profitability methodologies are reasonable in all material respects.
The Board also reviewed Fidelity's and Geode's non-fund businesses and potential indirect benefits such businesses may have received as a result of their association with Fidelity's mutual fund business (i.e., fall-out benefits) as well as cases where Fidelity's and Geode's affiliates may benefit from the funds' business. The Board considered areas where potential indirect benefits to the Fidelity funds from their relationships with Fidelity may exist. The Board's consideration of these matters was informed by the findings of a joint ad hoc committee created by it and the boards of other Fidelity funds to evaluate potential fall-out benefits.
The Board considered the costs of the services provided by and the profits realized by Fidelity in connection with the operation of the fund and was satisfied that the profitability was not excessive.
The Board also considered information regarding the profitability of Geode's relationship with the
fund.
Economies of Scale. The Board considered whether there have been economies of scale in respect of the management of the Fidelity funds, whether the Fidelity funds (including the fund) have appropriately benefited from any such economies of scale, and whether there is potential for realization of any further economies of scale. The Board considered the extent to which the fund will benefit from economies of scale as assets grow through increased services to the fund, through waivers or reimbursements, or through fee or expense ratio reductions. The Board also noted that a committee (the Economies of Scale Committee) created by it and the boards of other Fidelity funds periodically analyzes whether Fidelity attains economies of scale in respect of the management and servicing of the Fidelity funds, whether the Fidelity funds have appropriately benefited from such economies of scale, and whether there is potential for realization of any further economies of scale.
The Board concluded, taking into account the analysis of the Economies of Scale Committee, that economies of scale, if any, are being appropriately shared between fund shareholders and Fidelity.
Additional Information Requested by the Board. In order to develop fully the factual basis for consideration of the Fidelity funds' advisory contracts, the Board requested and received additional information on certain topics, including: (i) Fidelity's fund profitability methodology, profitability trends for certain funds, the allocation of various costs to different funds, and the impact of certain factors on fund profitability results; (ii) portfolio manager changes that have occurred during the past year and the amount of the investment that each portfolio manager has made in the Fidelity fund(s) that he or she manages; (iii) the extent to which current market conditions have affected retention and recruitment of personnel; (iv) the arrangements with and compensation paid to certain fund sub-advisers on behalf of the Fidelity funds and the treatment of such compensation within Fidelity's fund profitability methodology; (v) the terms of the funds' various management fee structures, including the basic group fee and the terms of Fidelity's voluntary expense limitation arrangements; (vi) Fidelity's transfer agent, pricing and bookkeeping fees, expense and service structures for different funds and classes relative to competitive trends; (vii) the impact on fund profitability of recent industry trends, such as the growth in passively managed funds and the changes in flows for different types of funds; (viii) the types of management fee and total expense comparisons provided, and the challenges and limitations associated with such information; and (ix) explanations regarding the relative total expense ratios and management fees of certain funds and classes, total expense and management fee competitive trends, and methodologies for total expense and management fee competitive comparisons. In addition, the Board considered its discussions with Fidelity regarding Fidelity's efforts to maintain the continuous investment and shareholder services necessary for the funds during the current pandemic and economic circumstances.
Based on its evaluation of all of the conclusions noted above, and after considering all factors it believed relevant, the Board concluded that the advisory and sub-advisory fee arrangements are fair and reasonable and that the fund's Advisory Contracts should be renewed.
The Securities and Exchange Commission adopted Rule 22e-4 under the Investment Company Act of 1940 (the Liquidity Rule) to promote effective liquidity risk management throughout the open-end investment company industry, thereby reducing the risk that funds will be unable to meet their redemption obligations and mitigating dilution of the interests of fund shareholders.
The Fund has adopted and implemented a liquidity risk management program (the Program) reasonably designed to assess and manage the Fund's liquidity risk and to comply with the requirements of the Liquidity Rule. The Fund's Board of Trustees (the Board) has designated the Fund's investment adviser as administrator of the Program. The Fidelity advisers have established a Liquidity Risk Management Committee (the LRM Committee) to manage the Program for each of the Fidelity Funds. The LRM Committee monitors the adequacy and effectiveness of implementation of the Program and on a periodic basis assesses each Fund's liquidity risk based on a variety of factors including (1) the Fund's investment strategy, (2) portfolio liquidity and cash flow projections during normal and reasonably foreseeable stressed conditions, (3) shareholder redemptions, (4) borrowings and other funding sources and (5) certain factors specific to ETFs including the effect of the Fund's prices and spreads, market participants, and basket compositions on the overall liquidity of the Fund's portfolio, as applicable.
In accordance with the Program, each of the Fund's portfolio investments is classified into one of four defined liquidity categories based on a determination of a reasonable expectation for how long it would take to convert the investment to cash (or sell or dispose of the investment) without significantly changing its market value.
- Highly liquid investments - cash or convertible to cash within three business days or less
- Moderately liquid investments - convertible to cash in three to seven calendar days
- Less liquid investments - can be sold or disposed of, but not settled, within seven calendar days
- Illiquid investments - cannot be sold or disposed of within seven calendar days
Liquidity classification determinations take into account a variety of factors including various market, trading and investment-specific considerations, as well as market depth, and generally utilize analysis from a third-party liquidity metrics service.
The Liquidity Rule places a 15% limit on a fund's illiquid investments and requires funds that do not primarily hold assets that are highly liquid investments to determine and maintain a minimum percentage of the fund's net assets to be invested in highly liquid investments (highly liquid investment minimum or HLIM). The Program includes provisions reasonably designed to comply with the 15% limit on illiquid investments and for determining, periodically reviewing and complying with the HLIM requirement as applicable.
At a recent meeting of the Fund's Board of Trustees, the LRM Committee provided a written report to the Board pertaining to the operation, adequacy, and effectiveness of the Program for the period December 1, 2021 through November 30, 2022. The report concluded that the Program is operating effectively and is reasonably designed to assess and manage the Fund's liquidity risk.
1.9868214.107
SV3-SANN-0423
Item 2.
Code of Ethics
Not applicable.
Item 3.
Audit Committee Financial Expert
Not applicable.
Item 4.
Principal Accountant Fees and Services
Not applicable.
Item 5.
Audit Committee of Listed Registrants
Not applicable.
Item 6.
Investments
(a)
Not applicable.
(b)
Not applicable
Item 7.
Disclosure of Proxy Voting Policies and Procedures for Closed-End Management Investment Companies
Not applicable.
Item 8.
Portfolio Managers of Closed-End Management Investment Companies
Not applicable.
Item 9.
Purchase of Equity Securities by Closed-End Management Investment Company and Affiliated Purchasers
Not applicable.
Item 10.
Submission of Matters to a Vote of Security Holders
There were no material changes to the procedures by which shareholders may recommend nominees to the Fidelity Salem Street Trust’s Board of Trustees.
Item 11.
Controls and Procedures
(a)(i) The President and Treasurer and the Chief Financial Officer have concluded that the Fidelity Salem Street Trust’s (the “Trust”) disclosure controls and procedures (as defined in Rule 30a-3(c) under the Investment Company Act) provide reasonable
assurances that material information relating to the Trust is made known to them by the appropriate persons, based on their evaluation of these controls and procedures as of a date within 90 days of the filing date of this report.
(a)(ii) There was no change in the Trust’s internal control over financial reporting (as defined in Rule 30a-3(d) under the Investment Company Act) that occurred during the period covered by this report that has materially affected, or is reasonably likely to materially affect, the Trust’s internal control over financial reporting.
Item 12.
Disclosure of Securities Lending Activities for Closed-End Management
Investment Companies
Not applicable.
Item 13.
Exhibits
SIGNATURES
Pursuant to the requirements of the Securities Exchange Act of 1934 and the Investment Company Act of 1940, the registrant has duly caused this report to be signed on its behalf by the undersigned, thereunto duly authorized.
Fidelity Salem Street Trust
| |
By: | /s/Laura M. Del Prato |
| Laura M. Del Prato |
| President and Treasurer |
|
|
Date: | March 23, 2023 |
Pursuant to the requirements of the Securities Exchange Act of 1934 and the Investment Company Act of 1940, this report has been signed below by the following persons on behalf of the registrant and in the capacities and on the dates indicated.
| |
By: | /s/Laura M. Del Prato |
| Laura M. Del Prato |
| President and Treasurer |
|
|
Date: | March 23, 2023 |
| |
By: | /s/John J. Burke III |
| John J. Burke III |
| Chief Financial Officer |
|
|
Date: | March 23, 2023 |